T. ROWE PRICE June 30, 2021 SEMIANNUAL REPORT TQMVX QM U.S. Value Equity Fund TQVAX QM U.S. Value Equity Fund– Advisor Class TQVIX QM U.S. Value Equity Fund– I Class For more insights from T. Rowe Price investment professionals, go to troweprice.com.
Transcript
T. ROWE PRICE
June 30, 2021SEMIANNUAL REPORT
TQMVX QM U.S. Value Equity Fund
TQVAX QM U.S. Value Equity Fund– Advisor Class
TQVIX QM U.S. Value Equity Fund– I Class
For more insights from T. Rowe Price investment professionals, go to troweprice.com.
srqmv_0621_P3Proof #
srqmv_0621_P3Proof #
Log in to your account at troweprice.com for more information.
* Certain mutual fund accounts that are assessed an annual account service fee can also save money by switching to e-delivery.
It’s fast—receive your statements and confirmations faster than U.S. mail.
It’s convenient—access your important account documents whenever you need them.
It’s secure—we protect your online accounts using “True Identity” to confirm new accounts and make verification faster and more secure.
It can save you money—where applicable, T. Rowe Price passes on the cost savings to fund holders.*
TO ENROLL:If you invest directly with T. Rowe Price, go to troweprice.com/paperless.
If you invest through an investment advisor, a bank, or a brokerage firm, please contact that organization and ask if it can provide electronic documentation.
Go PaperlessSign up for e-delivery of your statements, confirmations, and prospectuses or shareholder reports.
T. ROWE PRICE QM U.S. VAlUE EQUITy FUnd
HIGHLIGHTS
n Large- and mid-cap value stocks produced excellent returns in the first half of 2021, and your fund outperformed the Russell 1000 Value Index and the Lipper Multi-Cap Value Funds Index.
n The fund outperformed its Russell benchmark due to stock selection, particularly in the industrials and business services, financials, and consumer discretionary sectors.
n At midyear, we were overweight the industrials and business services, consumer discretionary, and utilities sectors, where we found a number of undervalued companies with good rankings. On the other hand, we underweighted communication services, health care, information technology, and real estate, where valuations were generally less attractive.
n As stock valuations in general are relatively full, future stock price appreciation could depend greatly on continued earnings growth, but a continued flattening of the Treasury yield curve might result in a shift away from value stocks and from those companies that could benefit from interest rate increases.
srqmv_0621_P3Proof #
1
T. ROWE PRICE QM U.S. VAlUE EQUITy FUnd
CIO Market Commentary
Global stock markets produced strong returns during the first half of 2021, while rising yields weighed on returns in some bond sectors. Investor sentiment was buoyed by the reopening of developed market economies, unprecedented fiscal and monetary stimulus, and expectations that the economy would benefit from a release of pent-up demand.
All major global and regional equity benchmarks recorded positive results during the period. Developed market stocks generally outperformed emerging markets, while in the U.S., small-cap equities outpaced large-caps and value performed better than growth. The large-cap S&P 500 Index returned 15% and finished the period at a record high. The energy sector, which was the worst performer in 2020, was the leader for the six-month period amid a sharp increase in oil prices. Financial stocks also produced strong results as banks benefited from an increase in long-term interest rates, while the real estate sector was helped by a rollback in many pandemic-related restrictions. Utilities underperformed with slight gains.
Fiscal and monetary support remained a key factor in providing a positive backdrop for markets. President Joe Biden signed the $1.9 trillion American Rescue Plan Act into law in March, and the Federal Reserve kept its short-term lending rates near zero. However, as a result of strong economic growth, central bank policymakers revised their outlook in a somewhat less dovish direction near the end of the period and indicated that rate hikes could commence in 2023, which was earlier than previously expected.
The economic recovery was evident in a variety of indicators. According to the latest estimate, U.S. gross domestic product grew at an annualized rate of 6.4% in the first quarter of 2021 following 4.3% growth in the fourth quarter of 2020. Weekly jobless claims declined throughout the period to new pandemic-era lows, although the monthly nonfarm payroll report disappointed at times as employers struggled to fill positions. Meanwhile, overall profits for companies in the S&P 500 rose by nearly 53% year over year in the first quarter, according to FactSet—the best showing since late 2009.
However, less favorably, inflation concerns led to some volatility in the equity market and caused a sharp rise in longer-term Treasury yields in the first quarter. (Bond prices and yields move in opposite directions.) While inflation measures were above the Fed’s 2% long-term inflation target toward the end of our reporting period—core consumer prices, for example, recorded their largest annual increase (3.8%) since 1992 in May—investors seemed to accept the Fed’s determination that rising price pressures were due to transitory factors arising from the reopening of the global economy.
srqmv_0621_P3Proof #
2
T. ROWE PRICE QM U.S. VAlUE EQUITy FUnd
Longer-term Treasury yields trended lower as inflation expectations began to wane later in the period, but they still finished significantly higher than they were at the end of 2020. Rising yields were a headwind for many fixed income investors; however, high yield bonds, which are less sensitive to interest rate changes, produced solid results, and investment-grade corporate bonds also performed well amid solid corporate fundamentals.
As we look ahead, the central question for investors—assuming the economy’s recovery from the pandemic continues apace—is whether the returns on financial assets will be as robust. Valuations are elevated in nearly all asset classes, and, in some areas, there are clear signs of speculation. That said, a transformed global economic landscape is generating potential opportunities as well as risks. Post-pandemic trends have the potential to create both winners and losers, giving active portfolio managers greater scope to seek excess returns. It is not an easy environment to invest in, but our investment teams remain rooted in company fundamentals and focused on the long term, and they will continue to apply strong fundamental analysis as they seek out the best investments for your portfolio.
Thank you for your continued confidence in T. Rowe Price.
Sincerely,
Robert SharpsGroup Chief Investment Officer
srqmv_0621_P3Proof #
3
T. ROWE PRICE QM U.S. VAlUE EQUITy FUnd
Management’s discussion of Fund Performance
INVESTMENT OBJECTIVE
The fund seeks long-term growth of capital.
FUND COMMENTARY
How did the fund perform in the past six months?
Large- and mid-cap value stocks produced excellent returns in the first half of 2021, extending a rally—and a period of outperformance versus their growth counterparts—that started in late 2020 as the economy rebounded from last year’s deep downturn. Your fund returned 20.95% and, as shown in the Performance Comparison table, outperformed the Russell 1000 Value Index by a solid margin. The fund also surpassed the Lipper Multi-Cap Value Funds
Index. (Performance for the fund’s Advisor and I Class shares will vary due to their different fee structures. Past performance cannot guarantee future results.)
What factors influenced the fund’s performance?
The fund outperformed its Russell benchmark in the last six months due to stock
selection, particularly in the industrials and business services, financials, and consumer discretionary sectors. Stock choices and an underweight in the real estate sector eroded our performance advantage.
In the industrials and business services sector, our investments in a number of attractively valued cyclical stocks produced very strong total returns amid expectations that economic growth would remain brisk as business activity returns to more normal levels. Some of our top contributors included Johnson Controls International, a global provider of HVAC, fire, and security services; United Rentals, which owns and maintains a fleet of equipment that it rents out to the construction and industrial maintenance industries; and Textron, an industrial conglomerate with Cessna private planes and Bell helicopters among its many brands. (Please refer to the portfolio of investments for a complete list of holdings and the amount each represents in the portfolio.)
Six-Month Period Ended 6/30/21 Total Return
QM U.S. Value Equity Fund 20.95%
QM U.S. Value Equity Fund–Advisor Class 20.81
QM U.S. Value Equity Fund–I Class 21.08
Russell 1000 Value Index 17.05
lipper Multi-Cap Value Funds Index 19.55
PERFORMANCE COMPARISON
srqmv_0621_P3Proof #
4
T. ROWE PRICE QM U.S. VAlUE EQUITy FUnd
Also, our financials sector holdings performed very well, and overweighting the sector contributed to relative results. Rising longer-term interest rates in the first quarter and expectations for the Federal Reserve to raise short-term interest rates sooner than previously expected augured well for banks and other providers of financial services. Money center banks Wells Fargo and Bank of America, consumer finance companies Capital One Financial and Ally Financial, and regional bank Fifth Third Bancorp were among our holdings that produced excellent total returns.
In addition, in the consumer discretionary sector, various companies benefited from a pickup in consumer spending that was supported by fiscal stimulus payments from the federal government. Automaker General Motors, online retailer and auction company eBay, and retailers Kohl’s and Target were among our largest contributors to performance.
Real estate investment trusts (REITs) often have above-average yields and behave like bonds in response to interest rate movements, so they benefited from a decline in intermediate- and long-term Treasury yields in the second quarter. Also, an increase in public social activities, such as shopping, travel, lodging, and dining out, bodes well for commercial real estate. However, our real estate stock choices trailed their peers in the benchmark. While several REITs in the benchmark produced outsized returns, some of our holdings—such as lumber producer Weyerhaeuser and health care REIT Omega Healthcare Investors—lagged with mild gains.
How is the fund positioned?
While many large- and mid-cap value stocks have risen sharply since late last year, we remain focused on quality companies with attractive valuations, as indicated by a comparison of various portfolio characteristics with those of the Russell 1000 Value Index. As of June 30, the historical earnings growth rate of the fund’s holdings (7.3%) was lower than that of the benchmark (9.0%). Similarly, the projected earnings growth rate for our holdings (9.2%) was lower than that of the index (10.1%). Also, the portfolio’s return on equity (ROE), which measures how effectively and efficiently a company and its management are using stockholder investments, was a little lower (14.2%) than that of the index (15.2%). ROE is one of several important metrics that we consider when ranking current and potential portfolio holdings. As for valuations, the portfolio’s 12-month forward price/earnings ratio (13.9) was materially lower than that of the index (19.2). (These statistics are based on the fund’s underlying holdings and are not a projection of future portfolio performance. Actual results may vary.)
srqmv_0621_P3Proof #
5
T. ROWE PRICE QM U.S. VAlUE EQUITy FUnd
At midyear, the fund owned stakes in almost 160 companies, many of which are well-known U.S. industry leaders. As shown in the Sector Diversification table on page 6, there were some notable differences between the fund’s and the benchmark’s sector exposures—which is not unusual. Unlike the other T. Rowe Price QM funds, we may take larger positions in sectors where we find stocks of quality companies that, according to our quantitative analysis and multifactor ranking process, appear inexpensive versus their respective industries and the overall equity universe.
Our largest sector allocations in absolute terms were financials, health care, industrials and business services, and information technology. However, some of our largest overweights versus the benchmark were industrials and business services, consumer discretionary, and utilities. These sectors, according to our quantitative analysis, feature a number of undervalued companies with good rankings. On the other hand, we had material underweights in several sectors—communication services, health care, information technology, and real estate—where valuations were generally less attractive, and our analysis generally resulted in lower rankings. We try to avoid companies with low ROEs and poor earnings quality, as well as value traps and distressed firms with high leverage that appear artificially cheap.
In the last six months, we made some portfolio adjustments based on changing rankings of businesses in our opportunity set. For example, we initiated new positions in aerospace and defense company General Dynamics, oil and gas producer EOG Resources, carmaker Ford Motor, and PerkinElmer, a provider of services and solutions to the life sciences and pharmaceutical industries and scientific organizations. We also added to existing stakes in several companies, including financials sector bellwethers JPMorgan Chase and Bank of America, energy giants ExxonMobil and Chevron, and pharmaceutical companies Johnson & Johnson and Pfizer. On the other hand, we eliminated Lear, which makes seating and electrical systems for automobiles, and Delta Air Lines. We also reduced our position in Steel Dynamics, a low-cost electric arc furnace producer of steel.
srqmv_0621_P3Proof #
6
T. ROWE PRICE QM U.S. VAlUE EQUITy FUnd
What is portfolio management’s outlook?
An acceleration in the pace of coronavirus vaccinations has led to almost a full U.S. economic reopening. The economy has benefited over the last few quarters from stimulus provided by the federal government and the Federal Reserve, particularly measures that were directed toward individuals. Many sectors that were beneficiaries of the stimulus have rallied in anticipation of stronger growth. We do not expect any more stimulus, and the enhanced unemployment benefits are likely to end during the third quarter. As stock valuations in general
are relatively full, future stock price appreciation could depend greatly on continued earnings growth. Also, a large infrastructure spending proposal is being negotiated in Washington, D.C. Its impact, if passed into law, may be felt over a decade.
In light of robust payroll growth and a pickup in inflation, the Fed has signaled that short-term interest rates could increase sooner than the previous target of 2024. However, policymakers probably want to see more economic improvement before reducing their stimulus efforts. We should get better signals about the Fed’s intentions by the end of the summer. While inflation is currently above the Fed’s long-term target of 2%, we have seen a significant and unexpected decline in intermediate- and long-term interest rates. This flattening of the Treasury yield curve might result in a shift away from value stocks and from those companies that could benefit from interest rate increases.
As of 6/30/21
QM U.S. Value Equity
FundRussell 1000
Value Index
Financials 21.8% 20.9%
Health Care 14.9 17.3
Industrials and Business Services 14.3 12.0
Information Technology 8.8 10.2
Consumer discretionary 7.1 5.7
Consumer Staples 7.0 7.2
Energy 5.9 5.1
Utilities 5.8 4.8
Communication Services 5.5 8.5
Materials 4.7 3.8
Real Estate 3.2 4.5
Other and Reserves 1.0 0.0
Total 100.0% 100.0%
SECTOR DIVERSIFICATION
srqmv_0621_P3Proof #
7
T. ROWE PRICE QM U.S. VAlUE EQUITy FUnd
The investment landscape has changed dramatically due to the pandemic, and volatility in the past 18 months has been extraordinary at times, but we can assure you that our investment strategy and disciplined stock selection process remain the same. We continue to seek and invest in large- and mid-cap value stocks with favorable attributes. We especially like companies that appear attractive based on cash flow metrics and are judicious in deploying capital. We are patient investors who believe that the market will eventually recognize what we find attractive about our portfolio holdings. We are grateful for your continued confidence in our investment management abilities.
The views expressed reflect the opinions of T. Rowe Price as of the date of this report and are subject to change based on changes in market, economic, or other conditions. These views are not intended to be a forecast of future events and are no guarantee of future results.
srqmv_0621_P3Proof #
8
T. ROWE PRICE QM U.S. VAlUE EQUITy FUnd
RISKS OF INVESTING IN THE FUND
Stocks generally fluctuate in value more than bonds and may decline significantly over short time periods. There is a chance that stock prices overall will decline because stock markets tend to move in cycles, with periods of rising and falling prices. The value of a stock in which the fund invests may decline due to general weakness in the U.S. stock market, such as when the U.S. financial markets decline, or because of factors that affect a particular company or industry.
Because the fund focuses on large and medium-sized companies, its share price could be more volatile than that of a fund that invests only in large companies. Medium-sized companies typically have less experienced management, narrower product lines, more limited financial resources, and less publicly available information than larger companies.
Different investment styles tend to shift in and out of favor depending on market conditions and investor sentiment. The fund’s value approach to investing carries the risk that the intrinsic value of a stock with value characteristics may not be fully recognized by the market for a long time or a stock judged to be undervalued may be appropriately priced at a low level. Value stocks may fail to appreciate for long periods and may never reach what the adviser believes are their full market values.
The fund’s strategy relies heavily on quantitative models and the analysis of specific metrics to construct the portfolio. The impact of these metrics on a stock’s performance can be difficult to predict, and stocks that previously possessed certain desirable quantitative characteristics may not continue to demonstrate those same characteristics in the future. In addition, relying on quantitative models entails the risk that the models themselves may be limited or incorrect, that the data on which the models rely may be incorrect or incomplete, and that the adviser may not be successful in selecting companies for investment or determining the weighting of particular stocks in the fund’s portfolio. Any of these factors could cause the fund to underperform funds with similar strategies that do not select stocks based on quantitative analysis.
srqmv_0621_P3Proof #
9
T. ROWE PRICE QM U.S. VAlUE EQUITy FUnd
BENCHMARK INFORMATION
Note: Frank Russell Company (Russell) is the source and owner of the Russell index data contained or reflected in these materials and all trademarks and copyrights related thereto. Russell® is a registered trademark of Russell. Russell is not responsible for the formatting or configuration of these materials or for any inaccuracy in T. Rowe Price Associates’ presentation thereof.
Note: The information shown does not reflect any exchange-traded funds (ETFs), cash reserves, or collateral for securities lending that may be held in the portfolio.
PORTFOLIO HIGHLIGHTS
srqmv_0621_P3Proof #
11
T. ROWE PRICE QM U.S. VAlUE EQUITy FUnd
This chart shows the value of a hypothetical $10,000 investment in the fund over the past 10 fiscal year periods or since inception (for funds lacking 10-year records). The result is compared with benchmarks, which include a broad-based market index and may also include a peer group average or index. Market indexes do not include expenses, which are deducted from fund returns as well as mutual fund averages and indexes.
GROWTH OF $10,000
As of 6/30/21
$19,20819,49519,088
QM U.S. Value Equity FundRussell 1000 Value Indexlipper Multi-Cap Value Funds Index*
6/216/206/196/186/176/162/26/16
10,000
13,000
16,000
19,000
22,000
$25,000
QM U.S. VALUE EQUITY FUND
Note: Performance for the Advisor and I Class shares will vary due to their differing fee structures. See the Average Annual Compound Total Return table on the next page.
*Lipper data as of 2/29/16.
srqmv_0621_P3Proof #
12
T. ROWE PRICE QM U.S. VAlUE EQUITy FUnd
AVERAGE ANNUAL COMPOUND TOTAL RETURN
Periods Ended 6/30/21One year
Five years
Since Inception 2/26/16
QM U.S. Value Equity Fund 48.85% 11.88% 13.00%
QM U.S. Value Equity Fund–Advisor Class 48.53 11.61 12.71
QM U.S. Value Equity Fund–I Class 49.26 12.10 13.21
The fund’s performance information represents only past performance and is not necessarily an indication of future results. Current performance may be lower or higher than the performance data cited. Share price, principal value, and return will vary, and you may have a gain or loss when you sell your shares. For the most recent month-end performance, please visit our website (troweprice.com) or contact a T. Rowe Price representative at 1-800-225-5132 or, for Advisor and I Class shares, 1-800-638-8790.
This table shows how the fund would have performed each year if its actual (or cumulative) returns for the periods shown had been earned at a constant rate. Average annual total return figures include changes in principal value, reinvested dividends, and capital gain distributions. Returns do not reflect taxes that the shareholder may pay on fund distributions or the redemption of fund shares. When assessing performance, investors should consider both short- and long-term returns. Investors should note that the fund’s short-term performance is highly unusual and unlikely to be sustained.
srqmv_0621_P3Proof #
13
T. ROWE PRICE QM U.S. VAlUE EQUITy FUnd
EXPENSE RATIO
QM U.S. Value Equity Fund 2.17%
QM U.S. Value Equity Fund–Advisor Class 2.32
QM U.S. Value Equity Fund–I Class 1.99
The expense ratio shown is as of the fund’s most recent prospectus. This number may vary from the expense ratio shown elsewhere in this report because it is based on a different time period and, if applicable, includes acquired fund fees and expenses but does not include fee or expense waivers.
FUND EXPENSE EXAMPLE
As a mutual fund shareholder, you may incur two types of costs: (1) transaction costs, such as redemption fees or sales loads, and (2) ongoing costs, including management fees, distribution and service (12b-1) fees, and other fund expenses. The following example is intended to help you understand your ongoing costs (in dollars) of investing in the fund and to compare these costs with the ongoing costs of investing in other mutual funds. The example is based on an investment of $1,000 invested at the beginning of the most recent six-month period and held for the entire period.
Please note that the fund has three share classes: The original share class (Investor Class) charges no distribution and service (12b-1) fee, the Advisor Class shares are offered only through unaffiliated brokers and other financial intermediaries and charge a 0.25% 12b-1 fee, and I Class shares are available to institutionally oriented clients and impose no 12b-1 or administrative fee payment. Each share class is presented separately in the table.
Actual ExpensesThe first line of the following table (Actual) provides information about actual account values and expenses based on the fund’s actual returns. You may use the information on this line, together with your account balance, to estimate the expenses that you paid over the period. Simply divide your account value by $1,000 (for example, an $8,600 account value divided by $1,000 = 8.6), then multiply the result by the number on the first line under the heading “Expenses Paid During Period” to estimate the expenses you paid on your account during this period.
Hypothetical Example for Comparison PurposesThe information on the second line of the table (Hypothetical) is based on hypothetical account values and expenses derived from the fund’s actual expense ratio and an assumed 5% per year rate of return before expenses (not the fund’s actual return). You may compare the ongoing costs of investing in the fund with other funds by contrasting this 5% hypothetical example and the 5% hypothetical examples that appear in the shareholder reports of the other funds. The hypothetical account values and expenses may not be used to estimate the actual ending account balance or expenses you paid for the period.
srqmv_0621_P3Proof #
14
T. ROWE PRICE QM U.S. VAlUE EQUITy FUnd
FUND EXPENSE EXAMPLE (CONTINUED)
Note: T. Rowe Price charges an annual account service fee of $20, generally for accounts with less than $10,000. The fee is waived for any investor whose T. Rowe Price mutual fund accounts total $50,000 or more; accounts electing to receive electronic delivery of account statements, transaction confirmations, prospectuses, and shareholder reports; or accounts of an investor who is a T. Rowe Price Personal Services or Enhanced Personal Services client (enrollment in these programs generally requires T. Rowe Price assets of at least $250,000). This fee is not included in the accompanying table. If you are subject to the fee, keep it in mind when you are estimating the ongoing expenses of investing in the fund and when comparing the expenses of this fund with other funds.
You should also be aware that the expenses shown in the table highlight only your ongoing costs and do not reflect any transaction costs, such as redemption fees or sales loads. Therefore, the second line of the table is useful in comparing ongoing costs only and will not help you determine the relative total costs of owning different funds. To the extent a fund charges transaction costs, however, the total cost of owning that fund is higher.
Beginning Account Value
1/1/21
Ending Account Value
6/30/21
Expenses Paid during Period*
1/1/21 to 6/30/21
Investor ClassActual $1,000.00 $1,209.50 $3.94
Hypothetical (assumes 5% return before expenses) 1,000.00 1,021.22 3.61
Advisor ClassActual 1,000.00 1,208.10 5.42
Hypothetical (assumes 5% return before expenses) 1,000.00 1,019.89 4.96
I ClassActual 1,000.00 1,210.80 2.91
Hypothetical (assumes 5% return before expenses) 1,000.00 1,022.17 2.66
* Expenses are equal to the fund’s annualized expense ratio for the 6-month period, multiplied by the average account value over the period, multiplied by the number of days in the most recent fiscal half year (181), and divided by the days in the year (365) to reflect the half-year period. The annualized expense ratio of the Investor Class was 0.72%, the Advisor Class was 0.99%, and the I Class was 0.53%.
QM U.S. VALUE EQUITY FUND
srqmv_0621_P3Proof #
15
T. ROWE PRICE QM U.S. VAlUE EQUITy FUnd
Unaudited
FINANCIAL HIGHLIGHTS
For a share outstanding throughout each period
Investor Class
6 Months . Ended 6/30/21
.. Year .. .. Ended .
2/26/16 (1) Through 12/31/16 12/31/20 12/31/19 12/31/18 12/31/17
NET ASSET VALUE Beginning of period $ 13.46 $ 13.84 $ 11.46 $ 13.55 $ 12.12 $ 10.00
Investment activities Net investment income (2)(3) 0.11 0.33 0.27 0.29 0.23 0.19 Net realized and unrealized gain/loss 2.71 (0.40 ) 2.63 (1.74 ) 1.69 2.14 Total from investment activities 2.82 (0.07 ) 2.90 (1.45 ) 1.92 2.33
Distributions Net investment income — (0.27 ) (0.30 ) (0.27 ) (0.23 ) (0.13 ) Net realized gain — (0.04 ) (0.22 ) (0.37 ) (0.26 ) (0.08 ) Total distributions — (0.31 ) (0.52 ) (0.64 ) (0.49 ) (0.21 )
NET ASSET VALUE End of period $ 16.28 $ 13.46 $ 13.84 $ 11.46 $ 13.55 $ 12.12
srqmv_0621_P3Proof #
16
The accompanying notes are an integral part of these financial statements.
T. ROWE PRICE QM U.S. VAlUE EQUITy FUnd
Unaudited
FINANCIAL HIGHLIGHTS
For a share outstanding throughout each period
Investor Class
6 Months . Ended 6/30/21
.. Year .. .. Ended .
2/26/16 (1) Through 12/31/16 12/31/20 12/31/19 12/31/18 12/31/17
Ratios to average net assets: (3) Gross expenses before waivers/payments by Price Associates 1.46 % (5) 2.17 % 1.94 % 1.95 % 2.46 % 3.65 % (5) Net expenses after waivers/payments by Price Associates 0.72 % (5) 0.72 % 0.72 % 0.71 % 0.74 % 0.71 % (5) Net investment income 1.36 % (5) 2.81 % 2.10 % 2.14 % 1.83 % 2.02 % (5)
Portfolio turnover rate 22.0 % 40.8 % 30.9 % 28.6 % 41.2 % 21.8 % Net assets, end of period (in thousands) $41,829 $19,557 $20,092 $17,575 $19,760 $16,265
0 % 0 % 0 % 0 % 0 % 0 %
(1) Inception date (2) Per share amounts calculated using average shares outstanding method. (3) See Note 5 for details of expense-related arrangements with Price Associates. (4) Total return refl ects the rate that an investor would have earned on an investment in the fund
during each period, assuming reinvestment of all distributions, and payment of no redemption or account fees, if applicable. Total return is not annualized for periods less than one year.
(5) Annualized
The accompanying notes are an integral part of these financial statements.
srqmv_0621_P3Proof #
17
T. ROWE PRICE QM U.S. VAlUE EQUITy FUnd
Unaudited
FINANCIAL HIGHLIGHTS
For a share outstanding throughout each period
Advisor Class
6 Months . Ended 6/30/21
.. Year .. .. Ended .
2/26/16 (1) Through 12/31/16 12/31/20 12/31/19 12/31/18 12/31/17
NET ASSET VALUE Beginning of period $ 13.41 $ 13.81 $ 11.46 $ 13.54 $ 12.12 $ 10.00
Investment activities Net investment income (2)(3) 0.08 0.29 0.24 0.25 0.20 0.16 Net realized and unrealized gain/loss 2.71 (0.38 ) 2.61 (1.73 ) 1.68 2.14 Total from investment activities 2.79 (0.09 ) 2.85 (1.48 ) 1.88 2.30
Distributions Net investment income — (0.27 ) (0.28 ) (0.23 ) (0.20 ) (0.10 ) Net realized gain — (0.04 ) (0.22 ) (0.37 ) (0.26 ) (0.08 ) Total distributions — (0.31 ) (0.50 ) (0.60 ) (0.46 ) (0.18 )
NET ASSET VALUE End of period $ 16.20 $ 13.41 $ 13.81 $ 11.46 $ 13.54 $ 12.12
srqmv_0621_P3Proof #
18
The accompanying notes are an integral part of these financial statements.
T. ROWE PRICE QM U.S. VAlUE EQUITy FUnd
Unaudited
FINANCIAL HIGHLIGHTS
For a share outstanding throughout each period
Advisor Class
6 Months . Ended 6/30/21
.. Year .. .. Ended .
2/26/16 (1) Through 12/31/16 12/31/20 12/31/19 12/31/18 12/31/17
Ratios to average net assets: (3) Gross expenses before waivers/payments by Price Associates 1.89 % (5) 2.32 % 2.29 % 2.64 % 3.55 % 5.06 % (5) Net expenses after waivers/payments by Price Associates 0.99 % (5) 0.99 % 0.99 % 0.99 % 0.99 % 1.01 % (5) Net investment income 1.11 % (5) 2.46 % 1.84 % 1.85 % 1.59 % 1.72 % (5)
Portfolio turnover rate 22.0 % 40.8 % 30.9 % 28.6 % 41.2 % 21.8 % Net assets, end of period (in thousands) $179 $148 $345 $395 $338 $303
0 % 0 % 0 % 0 % 0 % 0 %
(1) Inception date (2) Per share amounts calculated using average shares outstanding method. (3) See Note 5 for details of expense-related arrangements with Price Associates. (4) Total return refl ects the rate that an investor would have earned on an investment in the fund
during each period, assuming reinvestment of all distributions, and payment of no redemption or account fees, if applicable. Total return is not annualized for periods less than one year.
(5) Annualized
The accompanying notes are an integral part of these financial statements.
srqmv_0621_P3Proof #
19
T. ROWE PRICE QM U.S. VAlUE EQUITy FUnd
Unaudited
FINANCIAL HIGHLIGHTS
For a share outstanding throughout each period
I Class
6 Months . Ended 6/30/21
.. Year .. .. Ended .
2/26/16 (1) Through 12/31/16 12/31/20 12/31/19 12/31/18 12/31/17
NET ASSET VALUE Beginning of period $ 13.52 $ 13.86 $ 11.46 $ 13.55 $ 12.13 $ 10.00
Investment activities Net investment income (2)(3) 0.12 0.36 0.30 0.32 0.26 0.20 Net realized and unrealized gain/loss 2.73 (0.39 ) 2.62 (1.75 ) 1.68 2.15 Total from investment activities 2.85 (0.03 ) 2.92 (1.43 ) 1.94 2.35
Distributions Net investment income — (0.27 ) (0.30 ) (0.29 ) (0.26 ) (0.14 ) Net realized gain — (0.04 ) (0.22 ) (0.37 ) (0.26 ) (0.08 ) Total distributions — (0.31 ) (0.52 ) (0.66 ) (0.52 ) (0.22 )
NET ASSET VALUE End of period $ 16.37 $ 13.52 $ 13.86 $ 11.46 $ 13.55 $ 12.13
srqmv_0621_P3Proof #
20
The accompanying notes are an integral part of these financial statements.
T. ROWE PRICE QM U.S. VAlUE EQUITy FUnd
Unaudited
FINANCIAL HIGHLIGHTS
For a share outstanding throughout each period
I Class
6 Months . Ended 6/30/21
.. Year .. .. Ended .
2/26/16 (1) Through 12/31/16 12/31/20 12/31/19 12/31/18 12/31/17
Ratios to average net assets: (3) Gross expenses before waivers/payments by Price Associates 1.36 % (5) 1.99 % 1.78 % 1.87 % 2.41 % 4.33 % (5) Net expenses after waivers/payments by Price Associates 0.53 % (5) 0.54 % 0.54 % 0.54 % 0.54 % 0.56 % (5) Net investment income 1.51 % (5) 2.99 % 2.30 % 2.34 % 2.04 % 2.18 % (5)
Portfolio turnover rate 22.0 % 40.8 % 30.9 % 28.6 % 41.2 % 21.8 % Net assets, end of period (in thousands) $2,372 $1,224 $1,560 $744 $744 $352
0 % 0 % 0 % 0 % 0 % 0 %
(1) Inception date (2) Per share amounts calculated using average shares outstanding method. (3) See Note 5 for details of expense-related arrangements with Price Associates. (4) Total return refl ects the rate that an investor would have earned on an investment in the fund
during each period, assuming reinvestment of all distributions, and payment of no redemption or account fees, if applicable. Total return is not annualized for periods less than one year.
(5) Annualized
The accompanying notes are an integral part of these financial statements.
srqmv_0621_P3Proof #
21
T. ROWE PRICE QM U.S. VAlUE EQUITy FUnd
June 30, 2021 (Unaudited)
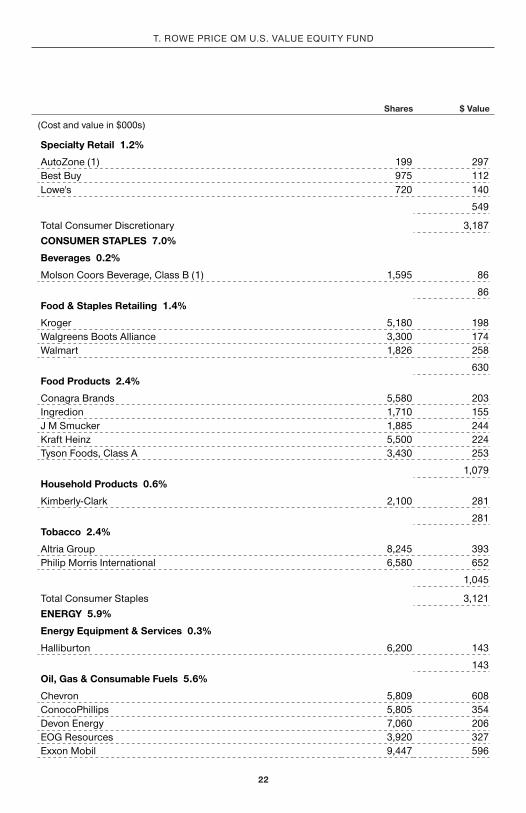
PORTFOLIO OF INVESTMENTS‡ Shares
$ Value
(Cost and value in $000s) ‡
COMMON STOCKS 99.0% COMMUNICATION SERVICES 5.5%
Diversifi ed Telecommunication Services 2.8%
AT&T 19,025 548 Verizon Communications 12,213 684
1,232 Media 2.7%
Comcast, Class A 12,980 740 Fox, Class B 5,240 184 Interpublic Group 6,390 208 ViacomCBS, Class B 1,002 45
1,177
Total Communication Services 2,409 CONSUMER DISCRETIONARY 7.1%
Auto Components 0.6%
Magna International 3,107 288
288 Automobiles 1.7%
Ford Motor (1) 22,220 330 General Motors (1) 7,160 424
Bank of America 25,300 1,043 Citigroup 7,430 526 Citizens Financial Group 6,445 296 Fifth Third Bancorp 8,358 319 JPMorgan Chase 8,218 1,278 KeyCorp 11,470 237 PNC Financial Services Group 1,592 304 Regions Financial 9,475 191 Wells Fargo 16,710 757
4,951 Capital Markets 3.3%
Ameriprise Financial 698 174 Goldman Sachs Group 1,354 514 Morgan Stanley 5,642 517 State Street 3,335 274
1,479 Consumer Finance 1.7%
Ally Financial 2,748 137 Capital One Financial 2,332 361 Discover Financial Services 2,068 244 Synchrony Financial 450 22
764 Diversifi ed Financial Services 0.6%
Equitable Holdings 8,120 247
247 Insurance 5.0%
Afl ac 3,580 192 Allstate 2,620 342 American International Group 6,456 307 Everest Re Group 870 219 Hartford Financial Services Group 3,620 224 Lincoln National 1,870 118 MetLife 5,584 334 Prudential Financial 1,750 179
Edison International 764 44 Entergy 2,959 295 Evergy 3,860 233 Exelon 8,673 385 NRG Energy 2,470 100 OGE Energy 6,070 204 Southern 6,430 389
1,650 Gas Utilities 0.5%
UGI 5,260 244
244 Independent Power & Renewable Electricity Producers 0.2%
Vistra 4,770 88
88 Multi-Utilities 1.4%
CenterPoint Energy 10,610 260
srqmv_0621_P3Proof #
28
T. ROWE PRICE QM U.S. VAlUE EQUITy FUnd
Shares
$ Value
(Cost and value in $000s) ‡
Public Service Enterprise Group 5,720 342
602
Total Utilities 2,584
Total Common Stocks (Cost $36,428) 43,933 SHORT-TERM INVESTMENTS 1.0%
Money Market Funds 1.0%
T. Rowe Price Government Reserve Fund, 0.03% (2)(3) 428,052 428
Total Short-Term Investments (Cost $428) 428
Total Investments in Securities 100.0% of Net Assets (Cost $36,856) $ 44,361
‡ Shares are denominated in U.S. dollars unless otherwise noted. (1) Non-income producing (2) Seven-day yield (3) Affi liated Companies
REIT A domestic Real Estate Investment Trust whose distributions pass-through with original tax character to the shareholder
srqmv_0621_P3Proof #
29
T. ROWE PRICE QM U.S. VAlUE EQUITy FUnd
The accompanying notes are an integral part of these financial statements.
AFFILIATED COMPANIES
($000s) The fund may invest in certain securities that are considered affi liated companies. As defi ned by the 1940 Act, an affi liated company is one in which the fund owns 5% or more of the outstanding voting securities, or a company that is under common ownership or control. The following securities were considered affi liated companies for all or some portion of the six months ended June 30, 2021. Net realized gain (loss), investment income, change in net unrealized gain/loss, and purchase and sales cost refl ect all activity for the period then ended.
Affi liate Net Realized
Gain (Loss)
Change in Net Unrealized Gain/Loss
Investment Income
T. Rowe Price Government Reserve Fund, 0.03% $ — $ — $ — T. Rowe Price Short-Term Fund, 0.08% — — — ++
Totals $ — # $ — $ — +
Supplementary Investment Schedule
Affi liate Value
12/31/20 Purchase
Cost Sales Cost
Value 06/30/21
T. Rowe Price Government Reserve Fund, 0.03% $ 123 ¤ ¤ $ 428 T. Rowe Price Short-Term Fund, 0.08% 52 ¤ ¤ —
Total $ 428 ̂
# Capital gain distributions from mutual funds represented $0 of the net realized gain (loss). ++ Excludes earnings on securities lending collateral, which are subject to rebates and fees as
described in Note 3. + Investment income comprised $0 of dividend income and $0 of interest income. ¤ Purchase and sale information not shown for cash management funds. ̂ The cost basis of investments in affi liated companies was $428.
The accompanying notes are an integral part of these financial statements.
srqmv_0621_P3Proof #
30
T. ROWE PRICE QM U.S. VAlUE EQUITy FUnd
June 30, 2021 (Unaudited)
STATEMENT OF ASSETS AND LIABILITIES
($000s, except shares and per share amounts)
Assets Investments in securities, at value (cost $36,856) $ 44,361 Receivable for shares sold 504 Receivable for investment securities sold 222 Dividends receivable 46 Due from affi liates 14 Other assets 46 Total assets 45,193
Liabilities Payable for shares redeemed 610 Payable for investment securities purchased 146 Investment management fees payable 19 Other liabilities 38 Total liabilities 813
NET ASSETS $ 44,380
srqmv_0621_P3Proof #
31
T. ROWE PRICE QM U.S. VAlUE EQUITy FUnd
June 30, 2021 (Unaudited)
The accompanying notes are an integral part of these financial statements.
STATEMENT OF ASSETS AND LIABILITIES
($000s, except shares and per share amounts)
Net Assets Consist of: Total distributable earnings (loss) $ 7,642 Paid-in capital applicable to 2,724,712 shares of $0.0001 par value capital stock outstanding; 1,000,000,000 shares authorized 36,738
NET ASSETS $ 44,380
NET ASSET VALUE PER SHARE
Investor Class ($41,829,713 / 2,568,735 shares outstanding) $ 16.28 Advisor Class ($178,966 / 11,050 shares outstanding) $ 16.20 I Class ($2,371,803 / 144,927 shares outstanding) $ 16.37
srqmv_0621_P3Proof #
32
T. ROWE PRICE QM U.S. VAlUE EQUITy FUnd
Unaudited
The accompanying notes are an integral part of these financial statements.
STATEMENT OF OPERATIONS
($000s)
6 Months Ended
6/30/21 Investment Income (Loss) Dividend income $ 341 Expenses
Investment management 79 Shareholder servicing
Investor Class 16 Prospectus and shareholder reports
Investor Class 8 Custody and accounting 77 Registration 36 Legal and audit 14 Miscellaneous 9 Waived / paid by Price Associates (122 ) Total expenses 117
Net investment income 224
Realized and Unrealized Gain / Loss – Net realized gain on securities 168 Change in net unrealized gain / loss on securities 4,239 Net realized and unrealized gain / loss 4,407
INCREASE IN NET ASSETS FROM OPERATIONS $ 4,631
srqmv_0621_P3Proof #
33
T. ROWE PRICE QM U.S. VAlUE EQUITy FUnd
Unaudited
STATEMENT OF CHANGES IN NET ASSETS
($000s)
6 Months Ended
6/30/21
Year Ended
12/31/20 Increase (Decrease) in Net Assets Operations
Net investment income $ 224 $ 515 Net realized gain (loss) 168 (219 ) Change in net unrealized gain / loss 4,239 (634 ) Increase (decrease) in net assets from operations 4,631 (338 )
Distributions to shareholders Net earnings
Investor Class – (445 ) Advisor Class – (3 ) I Class – (27 )
Decrease in net assets from distributions – (475 )
Capital share transactions * Shares sold
Investor Class 32,055 7,924 I Class 1,375 457
Distributions reinvested Investor Class – 236 I Class – 18
Shares redeemed Investor Class (14,125 ) (8,017 ) Advisor Class – (160 ) I Class (485 ) (713 )
Increase (decrease) in net assets from capital share transactions 18,820 (255 )
srqmv_0621_P3Proof #
34
T. ROWE PRICE QM U.S. VAlUE EQUITy FUnd
Unaudited
The accompanying notes are an integral part of these financial statements.
STATEMENT OF CHANGES IN NET ASSETS
($000s)
6 Months Ended
6/30/21
Year Ended
12/31/20 Net Assets Increase (decrease) during period 23,451 (1,068 ) Beginning of period 20,929 21,997 End of period $ 44,380 $ 20,929
*Share information Shares sold
Investor Class 2,007 676 I Class 86 38
Distributions reinvested Investor Class – 18 I Class – 1
Shares redeemed Investor Class (891 ) (693 ) Advisor Class – (14 ) I Class (32 ) (61 )
Increase (decrease) in shares outstanding 1,170 (35 )
srqmv_0621_P3Proof #
35
T. ROWE PRICE QM U.S. VAlUE EQUITy FUnd
Unaudited
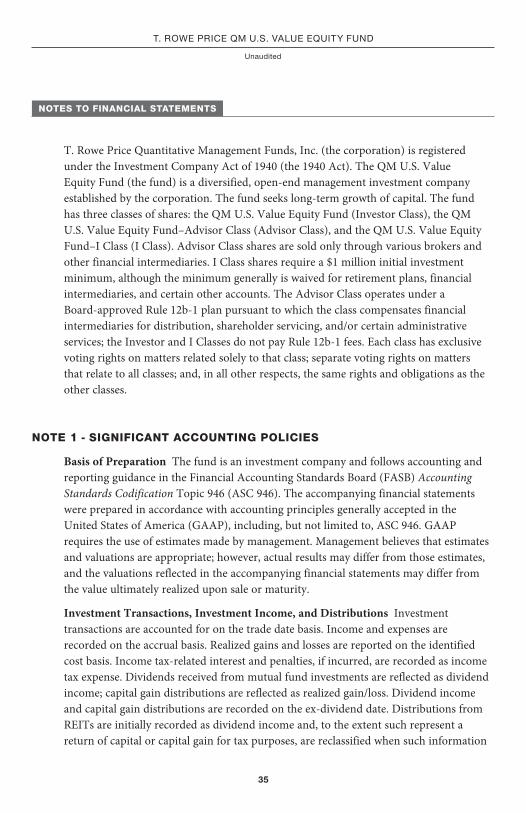
NOTES TO FINANCIAL STATEMENTS
T. Rowe Price Quantitative Management Funds, Inc. (the corporation) is registered under the Investment Company Act of 1940 (the 1940 Act). The QM U.S. Value Equity Fund (the fund) is a diversified , open-end management investment company established by the corporation. The fund seeks long-term growth of capital. The fund has three classes of shares: the QM U.S. Value Equity Fund (Investor Class), the QM U.S. Value Equity Fund–Advisor Class (Advisor Class), and the QM U.S. Value Equity Fund–I Class (I Class). Advisor Class shares are sold only through various brokers and other financial intermediaries. I Class shares require a $1 million initial investment minimum, although the minimum generally is waived for retirement plans, financial intermediaries, and certain other accounts. The Advisor Class operates under a Board-approved Rule 12b-1 plan pursuant to which the class compensates financial intermediaries for distribution, shareholder servicing, and/or certain administrative services; the Investor and I Classes do not pay Rule 12b-1 fees. Each class has exclusive voting rights on matters related solely to that class; separate voting rights on matters that relate to all classes; and, in all other respects, the same rights and obligations as the other classes.
NOTE 1 - SIGNIFICANT ACCOUNTING POLICIES
Basis of Preparation The fund is an investment company and follows accounting and reporting guidance in the Financial Accounting Standards Board (FASB) Accounting Standards Codification Topic 946 (ASC 946). The accompanying financial statements were prepared in accordance with accounting principles generally accepted in the United States of America (GAAP), including, but not limited to, ASC 946. GAAP requires the use of estimates made by management. Management believes that estimates and valuations are appropriate; however, actual results may differ from those estimates, and the valuations reflected in the accompanying financial statements may differ from the value ultimately realized upon sale or maturity.
Investment Transactions, Investment Income, and Distributions Investment transactions are accounted for on the trade date basis. Income and expenses are recorded on the accrual basis. Realized gains and losses are reported on the identified cost basis. Income tax-related interest and penalties, if incurred, are recorded as income tax expense. Dividends received from mutual fund investments are reflected as dividend income; capital gain distributions are reflected as realized gain/loss. Dividend income and capital gain distributions are recorded on the ex-dividend date. Distributions from REITs are initially recorded as dividend income and, to the extent such represent a return of capital or capital gain for tax purposes, are reclassified when such information
srqmv_0621_P3Proof #
36
T. ROWE PRICE QM U.S. VAlUE EQUITy FUnd
becomes available. Non-cash dividends, if any, are recorded at the fair market value of the asset received. Distributions to shareholders are recorded on the ex-dividend date. Income distributions, if any, are declared and paid by each class annually. A capital gain distribution may also be declared and paid by the fund annually.
Class Accounting Shareholder servicing, prospectus, and shareholder report expenses incurred by each class are charged directly to the class to which they relate. Expenses common to all classes, investment income, and realized and unrealized gains and losses are allocated to the classes based upon the relative daily net assets of each class. The Advisor Class pays Rule 12b-1 fees, in an amount not exceeding 0.25% of the class’s average daily net assets; during the six months ended June 30, 2021, the Advisor Class incurred less than $1,000 in these fees.
Capital Transactions Each investor’s interest in the net assets of the fund is represented by fund shares. The fund’s net asset value (NAV) per share is computed at the close of the New York Stock Exchange (NYSE), normally 4 p.m. ET, each day the NYSE is open for business. However, the NAV per share may be calculated at a time other than the normal close of the NYSE if trading on the NYSE is restricted, if the NYSE closes earlier, or as may be permitted by the SEC. Purchases and redemptions of fund shares are transacted at the next-computed NAV per share, after receipt of the transaction order by T. Rowe Price Associates, Inc., or its agents.
Indemnification In the normal course of business, the fund may provide indemnification in connection with its officers and directors, service providers, and/or private company investments. The fund’s maximum exposure under these arrangements is unknown; however, the risk of material loss is currently considered to be remote.
NOTE 2 - VALUATION
Fair Value The fund’s financial instruments are valued at the close of the NYSE and are reported at fair value, which GAAP defines as the price that would be received to sell an asset or paid to transfer a liability in an orderly transaction between market participants at the measurement date. The T. Rowe Price Valuation Committee (the Valuation Committee) is an internal committee that has been delegated certain responsibilities by the fund’s Board of Directors (the Board) to ensure that financial instruments are appropriately priced at fair value in accordance with GAAP and the 1940 Act. Subject to oversight by the Board, the Valuation Committee develops and oversees pricing-related policies and procedures and approves all fair value determinations. Specifically, the Valuation Committee establishes policies and procedures used in valuing financial instruments, including those which cannot be valued in accordance with normal procedures or using pricing vendors; determines pricing techniques,
srqmv_0621_P3Proof #
37
T. ROWE PRICE QM U.S. VAlUE EQUITy FUnd
sources, and persons eligible to effect fair value pricing actions; evaluates the services and performance of the pricing vendors; oversees the pricing process to ensure policies and procedures are being followed; and provides guidance on internal controls and valuation-related matters. The Valuation Committee provides periodic reporting to the Board on valuation matters.
Various valuation techniques and inputs are used to determine the fair value of financial instruments. GAAP establishes the following fair value hierarchy that categorizes the inputs used to measure fair value:
Level 1 – quoted prices (unadjusted) in active markets for identical financial instruments that the fund can access at the reporting date
Level 2 – inputs other than Level 1 quoted prices that are observable, either directly or indirectly (including, but not limited to, quoted prices for similar financial instruments in active markets, quoted prices for identical or similar financial instruments in inactive markets, interest rates and yield curves, implied volatilities, and credit spreads)
Level 3 – unobservable inputs (including the fund’s own assumptions in determining fair value)
Observable inputs are developed using market data, such as publicly available information about actual events or transactions, and reflect the assumptions that market participants would use to price the financial instrument. Unobservable inputs are those for which market data are not available and are developed using the best information available about the assumptions that market participants would use to price the financial instrument. GAAP requires valuation techniques to maximize the use of relevant observable inputs and minimize the use of unobservable inputs. When multiple inputs are used to derive fair value, the financial instrument is assigned to the level within the fair value hierarchy based on the lowest-level input that is significant to the fair value of the financial instrument. Input levels are not necessarily an indication of the risk or liquidity associated with financial instruments at that level but rather the degree of judgment used in determining those values.
Valuation Techniques Equity securities, including exchange-traded funds, listed or regularly traded on a securities exchange or in the over-the-counter (OTC) market are valued at the last quoted sale price or, for certain markets, the official closing price at the time the valuations are made. OTC Bulletin Board securities are valued at the mean of the closing bid and asked prices. A security that is listed or traded on more than one exchange is valued at the quotation on the exchange determined to be the primary market for such security. Listed securities not traded on a particular day are valued at the mean of the closing bid and asked prices for domestic securities.
srqmv_0621_P3Proof #
38
T. ROWE PRICE QM U.S. VAlUE EQUITy FUnd
Investments in mutual funds are valued at the mutual fund’s closing NAV per share on the day of valuation. Assets and liabilities other than financial instruments, including short-term receivables and payables, are carried at cost, or estimated realizable value, if less, which approximates fair value.
Investments for which market quotations or market-based valuations are not readily available or deemed unreliable are valued at fair value as determined in good faith by the Valuation Committee, in accordance with fair valuation policies and procedures. The objective of any fair value pricing determination is to arrive at a price that could reasonably be expected from a current sale. Financial instruments fair valued by the Valuation Committee are primarily private placements, restricted securities, warrants, rights, and other securities that are not publicly traded. Factors used in determining fair value vary by type of investment and may include market or investment specific considerations. The Valuation Committee typically will afford greatest weight to actual prices in arm’s length transactions, to the extent they represent orderly transactions between market participants, transaction information can be reliably obtained, and prices are deemed representative of fair value. However, the Valuation Committee may also consider other valuation methods such as market-based valuation multiples; a discount or premium from market value of a similar, freely traded security of the same issuer; discounted cash flows; yield to maturity; or some combination. Fair value determinations are reviewed on a regular basis and updated as information becomes available, including actual purchase and sale transactions of the investment. Because any fair value determination involves a significant amount of judgment, there is a degree of subjectivity inherent in such pricing decisions, and fair value prices determined by the Valuation Committee could differ from those of other market participants.
Valuation Inputs On June 30, 2021, all of the fund’s financial instruments were classified as Level 1, based on the inputs used to determine their fair values.
NOTE 3 - OTHER INVESTMENT TRANSACTIONS
Consistent with its investment objective, the fund engages in the following practices to manage exposure to certain risks and/or to enhance performance. The investment objective, policies, program, and risk factors of the fund are described more fully in the fund’s prospectus and Statement of Additional Information.
Securities Lending The fund may lend its securities to approved borrowers to earn additional income. Its securities lending activities are administered by a lending agent in accordance with a securities lending agreement. Security loans generally do not have stated maturity dates, and the fund may recall a security at any time. The fund receives collateral in the form of cash or U.S. government securities. Collateral is maintained
srqmv_0621_P3Proof #
39
T. ROWE PRICE QM U.S. VAlUE EQUITy FUnd
over the life of the loan in an amount not less than the value of loaned securities; any additional collateral required due to changes in security values is delivered to the fund the next business day. Cash collateral is invested in accordance with investment guidelines approved by fund management. Additionally, the lending agent indemnifies the fund against losses resulting from borrower default. Although risk is mitigated by the collateral and indemnification, the fund could experience a delay in recovering its securities and a possible loss of income or value if the borrower fails to return the securities, collateral investments decline in value, and the lending agent fails to perform. Securities lending revenue consists of earnings on invested collateral and borrowing fees, net of any rebates to the borrower, compensation to the lending agent, and other administrative costs. In accordance with GAAP, investments made with cash collateral are reflected in the accompanying financial statements, but collateral received in the form of securities is not. At June 30, 2021, there were no securities on loan.
Other Purchases and sales of portfolio securities other than short-term securities aggregated $25,759,000 and $6,950,000, respectively, for the six months ended June 30, 2021.
NOTE 4 - FEDERAL INCOME TAXES
No provision for federal income taxes is required since the fund intends to continue to qualify as a regulated investment company under Subchapter M of the Internal Revenue Code and distribute to shareholders all of its taxable income and gains. Distributions determined in accordance with federal income tax regulations may differ in amount or character from net investment income and realized gains for financial reporting purposes. Financial reporting records are adjusted for permanent book/tax differences to reflect tax character but are not adjusted for temporary differences. The amount and character of tax-basis distributions and composition of net assets are finalized at fiscal year-end; accordingly, tax-basis balances have not been determined as of the date of this report.
The fund intends to retain realized gains to the extent of available capital loss carryforwards. Net realized capital losses may be carried forward indefinitely to offset future realized capital gains. As of December 31, 2020, the fund had $178,000 of available capital loss carryforwards.
At June 30, 2021, the cost of investments for federal income tax purposes was $37,094,000. Net unrealized gain aggregated $7,267,000 at period-end, of which $7,766,000 related to appreciated investments and $499,000 related to depreciated investments.
srqmv_0621_P3Proof #
40
T. ROWE PRICE QM U.S. VAlUE EQUITy FUnd
NOTE 5 - RELATED PARTY TRANSACTIONS
The fund is managed by T. Rowe Price Associates, Inc. (Price Associates), a wholly owned subsidiary of T. Rowe Price Group, Inc. (Price Group). The investment management agreement between the fund and Price Associates provides for an annual investment management fee, which is computed daily and paid monthly. The fee consists of an individual fund fee, equal to 0.20% of the fund’s average daily net assets, and a group fee. The group fee rate is calculated based on the combined net assets of certain mutual funds sponsored by Price Associates (the group) applied to a graduated fee schedule, with rates ranging from 0.48% for the first $1 billion of assets to 0.260% for assets in excess of $845 billion. The fund’s group fee is determined by applying the group fee rate to the fund’s average daily net assets. The fee is computed daily and paid monthly. At June 30, 2021, the effective annual group fee rate was 0.28%.
The Investor Class and Advisor Class are each subject to a contractual expense limitation through the expense limitation date indicated in the table below. During the limitation period, Price Associates is required to waive its management fee or pay any expenses (excluding interest; expenses related to borrowings, taxes, and brokerage; and other non-recurring expenses permitted by the investment management agreement) that would otherwise cause the class’s ratio of annualized total expenses to average net assets (net expense ratio) to exceed its expense limitation. Each class is required to repay Price Associates for expenses previously waived/paid to the extent the class’s net assets grow or expenses decline sufficiently to allow repayment without causing the class’s net expense ratio (after the repayment is taken into account) to exceed the lesser of: (1) the expense limitation in place at the time such amounts were waived; or (2) the class’s current expense limitation. However, no repayment will be made more than three years after the date of a payment or waiver.
The I Class is also subject to an operating expense limitation (I Class Limit) pursuant to which Price Associates is contractually required to pay all operating expenses of the I Class, excluding management fees; interest; expenses related to borrowings, taxes, and brokerage; and other non-recurring expenses permitted by the investment management agreement, to the extent such operating expenses, on an annualized basis, exceed the I Class Limit. This agreement will continue through the expense limitation date indicated in the table below, and may be renewed, revised, or revoked only with approval of the fund’s Board. The I Class is required to repay Price Associates for expenses previously paid to the extent the class’s net assets grow or expenses decline sufficiently to allow repayment without causing the class’s operating expenses (after the repayment is taken into account) to exceed the lesser of: (1) the I Class Limit in place at the time such amounts were paid; or (2) the current I Class Limit. However, no repayment will be made more than three years after the date of a payment or waiver.
srqmv_0621_P3Proof #
41
T. ROWE PRICE QM U.S. VAlUE EQUITy FUnd
Pursuant to these agreements, expenses were waived/paid by and/or repaid to Price Associates during the six months ended June 30, 2021 as indicated in the table below. Including these amounts, expenses previously waived/paid by Price Associates in the amount of $450,000 remain subject to repayment by the fund at June 30, 2021. Any repayment of expenses previously waived/paid by Price Associates during the period would be included in the net investment income and expense ratios presented on the accompanying Financial Highlights.
Investor Class Advisor Class I Class
Expense limitation/I Class Limit 0.72% 0.99% 0.05%
Expense limitation date 04/30/22 04/30/22 04/30/22
(Waived)/repaid during the period ($000s) $(114) $(1) $(7)
In addition, the fund has entered into service agreements with Price Associates and a wholly owned subsidiary of Price Associates, each an affiliate of the fund (collectively, Price). Price Associates provides certain accounting and administrative services to the fund. T. Rowe Price Services, Inc. provides shareholder and administrative services in its capacity as the fund’s transfer and dividend-disbursing agent. For the six months ended June 30, 2021, expenses incurred pursuant to these service agreements were $35,000 for Price Associates and $13,000 for T. Rowe Price Services, Inc. All amounts due to and due from Price, exclusive of investment management fees payable, are presented net on the accompanying Statement of Assets and Liabilities.
The fund may invest its cash reserves in certain open-end management investment companies managed by Price Associates and considered affiliates of the fund: the T. Rowe Price Government Reserve Fund or the T. Rowe Price Treasury Reserve Fund, organized as money market funds, or the T. Rowe Price Short-Term Fund, a short-term bond fund (collectively, the Price Reserve Funds). The Price Reserve Funds are offered as short-term investment options to mutual funds, trusts, and other accounts managed by Price Associates or its affiliates and are not available for direct purchase by members of the public. Cash collateral from securities lending is invested in the T. Rowe Price Short-Term Fund. The Price Reserve Funds pay no investment management fees.
As of June 30, 2021, T. Rowe Price Group, Inc., or its wholly owned subsidiaries, owned 650,000 shares of the Investor Class, representing 25% of the Investor Class's net assets and 11,050 shares of the Advisor Class, representing 100% of the Advisor Class’s net assets and 25,000 shares of the I Class, representing 17% of the I Class’s net assets.
srqmv_0621_P3Proof #
42
T. ROWE PRICE QM U.S. VAlUE EQUITy FUnd
The fund may participate in securities purchase and sale transactions with other funds or accounts advised by Price Associates (cross trades), in accordance with procedures adopted by the fund’s Board and Securities and Exchange Commission rules, which require, among other things, that such purchase and sale cross trades be effected at the independent current market price of the security. During the six months ended June 30, 2021, had no purchases or sales cross trades with other funds or accounts advised by Price Associates.
Effective January 1, 2020, Price Associates has voluntarily agreed to reimburse the fund from its own resources on a monthly basis for the cost of investment research embedded in the cost of the fund’s securities trades. This agreement may be rescinded at any time. For the six months ended June 30, 2021, this reimbursement amounted to less than $1,000.
NOTE 6 - OTHER MATTERS
Unpredictable events such as environmental or natural disasters, war, terrorism, pandemics, outbreaks of infectious diseases, and similar public health threats may significantly affect the economy and the markets and issuers in which a fund invests. Certain events may cause instability across global markets, including reduced liquidity and disruptions in trading markets, while some events may affect certain geographic regions, countries, sectors, and industries more significantly than others, and exacerbate other pre-existing political, social, and economic risks. During 2020, a novel strain of coronavirus (COVID-19) resulted in disruptions to global business activity and caused significant volatility and declines in global financial markets.
These types of events, such as the global pandemic caused by COVID-19, may also cause widespread fear and uncertainty, and result in, among other things: enhanced health screenings, quarantines, cancellations, and travel restrictions, including border closings; disruptions to business operations and supply chains and customer activity; exchange trading suspensions and closures, and overall reduced liquidity of securities, derivatives, and commodities trading markets; reductions in consumer demand and economic output; and significant challenges in healthcare service preparation and delivery. The fund could be negatively impacted if the value of a portfolio holding were harmed by such political or economic conditions or events. In addition, the operations of the fund, its investment advisers, and the fund’s service providers may be significantly impacted, or even temporarily halted, as a result of any impairment to their information technology and other operation systems, extensive employee illnesses or unavailability, government quarantine measures, and restrictions on travel or meetings and other factors related to public emergencies.
srqmv_0621_P3Proof #
43
T. ROWE PRICE QM U.S. VAlUE EQUITy FUnd
Governmental and quasi-governmental authorities and regulators have in the past responded to major economic disruptions with a variety of significant fiscal and monetary policy changes, including but not limited to, direct capital infusions into companies, new monetary programs, and dramatically lower interest rates. An unexpected or quick reversal of these policies, or the ineffectiveness of these policies, could negatively impact overall investor sentiment and further increase volatility in securities markets.
srqmv_0621_P3Proof #
44
T. ROWE PRICE QM U.S. VAlUE EQUITy FUnd
INFORMATION ON PROXY VOTING POLICIES, PROCEDURES, AND RECORDS
A description of the policies and procedures used by T. Rowe Price funds to determine how to vote proxies relating to portfolio securities is available in each fund’s Statement of Additional Information. You may request this document by calling 1-800-225-5132 or by accessing the SEC’s website, sec.gov.
The description of our proxy voting policies and procedures is also available on our corporate website. To access it, please visit the following Web page:
Scroll down to the section near the bottom of the page that says, “Proxy Voting Policies.” Click on the Proxy Voting Policies link in the shaded box.
Each fund’s most recent annual proxy voting record is available on our website and through the SEC’s website. To access it through T. Rowe Price, visit the website location shown above, and scroll down to the section near the bottom of the page that says, “Proxy Voting Records.” Click on the Proxy Voting Records link in the shaded box.
HOW TO OBTAIN QUARTERLY PORTFOLIO HOLDINGS
The fund files a complete schedule of portfolio holdings with the Securities and Exchange Commission (SEC) for the first and third quarters of each fiscal year as an exhibit to its reports on Form N-PORT. The fund’s reports on Form N-PORT are available electronically on the SEC’s website (sec.gov). In addition, most T. Rowe Price funds disclose their first and third fiscal quarter-end holdings on troweprice.com.
srqmv_0621_P3Proof #
45
T. ROWE PRICE QM U.S. VAlUE EQUITy FUnd
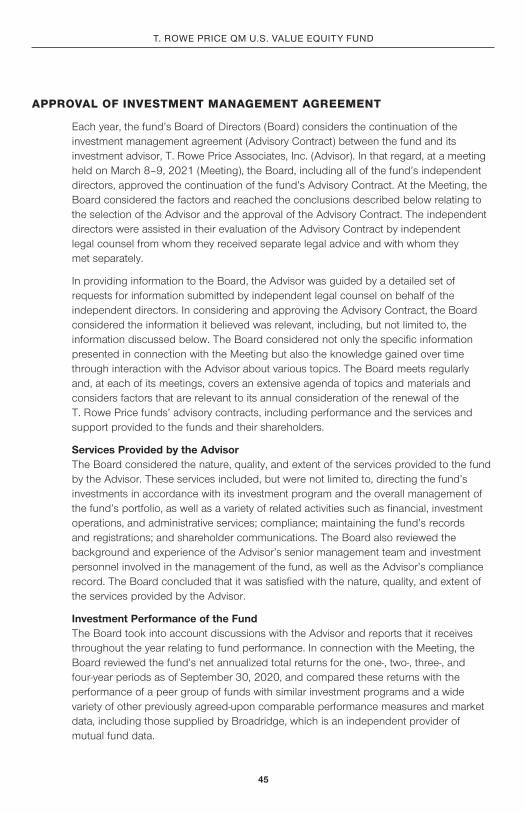
APPROVAL OF INVESTMENT MANAGEMENT AGREEMENT
Each year, the fund’s Board of Directors (Board) considers the continuation of the investment management agreement (Advisory Contract) between the fund and its investment advisor, T. Rowe Price Associates, Inc. (Advisor). In that regard, at a meeting held on March 8–9, 2021 (Meeting), the Board, including all of the fund’s independent directors, approved the continuation of the fund’s Advisory Contract. At the Meeting, the Board considered the factors and reached the conclusions described below relating to the selection of the Advisor and the approval of the Advisory Contract. The independent directors were assisted in their evaluation of the Advisory Contract by independent legal counsel from whom they received separate legal advice and with whom they met separately.
In providing information to the Board, the Advisor was guided by a detailed set of requests for information submitted by independent legal counsel on behalf of the independent directors. In considering and approving the Advisory Contract, the Board considered the information it believed was relevant, including, but not limited to, the information discussed below. The Board considered not only the specific information presented in connection with the Meeting but also the knowledge gained over time through interaction with the Advisor about various topics. The Board meets regularly and, at each of its meetings, covers an extensive agenda of topics and materials and considers factors that are relevant to its annual consideration of the renewal of the T. Rowe Price funds’ advisory contracts, including performance and the services and support provided to the funds and their shareholders.
Services Provided by the Advisor The Board considered the nature, quality, and extent of the services provided to the fund by the Advisor. These services included, but were not limited to, directing the fund’s investments in accordance with its investment program and the overall management of the fund’s portfolio, as well as a variety of related activities such as financial, investment operations, and administrative services; compliance; maintaining the fund’s records and registrations; and shareholder communications. The Board also reviewed the background and experience of the Advisor’s senior management team and investment personnel involved in the management of the fund, as well as the Advisor’s compliance record. The Board concluded that it was satisfied with the nature, quality, and extent of the services provided by the Advisor.
Investment Performance of the Fund The Board took into account discussions with the Advisor and reports that it receives throughout the year relating to fund performance. In connection with the Meeting, the Board reviewed the fund’s net annualized total returns for the one-, two-, three-, and four-year periods as of September 30, 2020, and compared these returns with the performance of a peer group of funds with similar investment programs and a wide variety of other previously agreed-upon comparable performance measures and market data, including those supplied by Broadridge, which is an independent provider of mutual fund data.
srqmv_0621_P3Proof #
46
T. ROWE PRICE QM U.S. VAlUE EQUITy FUnd
On the basis of this evaluation and the Board’s ongoing review of investment results, and factoring in the relative market conditions during certain of the performance periods, the Board concluded that the fund’s performance was satisfactory.
Costs, Benefits, Profits, and Economies of ScaleThe Board reviewed detailed information regarding the revenues received by the Advisor under the Advisory Contract and other direct and indirect benefits that the Advisor (and its affiliates) may have realized from its relationship with the fund. In considering soft-dollar arrangements pursuant to which research may be received from broker-dealers that execute the fund’s portfolio transactions, the Board noted that the Advisor bears the cost of research services for all client accounts that it advises, including the T. Rowe Price funds. The Board received information on the estimated costs incurred and profits realized by the Advisor from managing the T. Rowe Price funds. While the Board did not review information regarding profits realized from managing the fund in particular because the fund had either not achieved sufficient portfolio asset size or not recognized sufficient revenues to produce meaningful profit margin percentages, the Board concluded that the Advisor’s profits were reasonable in light of the services provided to the T. Rowe Price funds.
The Board also considered whether the fund benefits under the fee levels set forth in the Advisory Contract from any economies of scale realized by the Advisor. Under the Advisory Contract, the fund pays a fee to the Advisor for investment management services composed of two components—a group fee rate based on the combined average net assets of most of the T. Rowe Price funds (including the fund) that declines at certain asset levels and an individual fund fee rate based on the fund’s average daily net assets—and the fund pays its own expenses of operations (subject to contractual expense limitations with respect to each share class). The Board concluded that the advisory fee structure for the fund continued to provide for a reasonable sharing of benefits from any economies of scale with the fund’s investors.
Fees and ExpensesThe Board was provided with information regarding industry trends in management fees and expenses. Among other things, the Board reviewed data for peer groups that were compiled by Broadridge, which compared: (i) contractual management fees, total expenses, actual management fees, and nonmanagement expenses of the Investor Class of the fund with a group of competitor funds selected by Broadridge (Investor Class Expense Group); (ii) total expenses and actual management fees of the Advisor Class of the fund with a group of competitor funds selected by Broadridge (Advisor Class Expense Group); and (iii) total expenses, actual management fees, and nonmanagement expenses of the Investor Class of the fund with a broader set of funds within the Lipper investment classification (Expense Universe). The Board considered the fund’s contractual management fee rate, actual management fee rate (which reflects the management fees actually received from the fund by the Advisor after any applicable waivers, reductions, or reimbursements), operating expenses, and total expenses
APPROVAL OF INVESTMENT MANAGEMENT AGREEMENT (CONTINUED)
srqmv_0621_P3Proof #
47
T. ROWE PRICE QM U.S. VAlUE EQUITy FUnd
(which reflect the net total expense ratio of the fund after any waivers, reductions, or reimbursements) in comparison with the information for the Broadridge peer groups. Broadridge generally constructed the peer groups by seeking the most comparable funds based on similar investment classifications and objectives, expense structure, asset size, and operating components and attributes and ranked funds into quintiles, with the first quintile representing the funds with the lowest relative expenses and the fifth quintile representing the funds with the highest relative expenses. The information provided to the Board indicated that the fund’s contractual management fee ranked in the first quintile (Investor Class Expense Group), the fund’s actual management fee rate ranked in the first quintile (Investor Class Expense Group, Advisor Class Expense Group, and Expense Universe), and the fund’s total expenses ranked in the first quintile (Investor Class Expense Group and Advisor Class Expense Group) and first and second quintiles (Expense Universe).
The Board also reviewed the fee schedules for other investment portfolios with similar mandates that are advised or subadvised by the Advisor and its affiliates, including separately managed accounts for institutional and individual investors; subadvised funds; and other sponsored investment portfolios, including collective investment trusts and pooled vehicles organized and offered to investors outside the United States. Management provided the Board with information about the Advisor’s responsibilities and services provided to subadvisory and other institutional account clients, including information about how the requirements and economics of the institutional business are fundamentally different from those of the proprietary mutual fund business. The Board considered information showing that the Advisor’s mutual fund business is generally more complex from a business and compliance perspective than its institutional account business and considered various relevant factors, such as the broader scope of operations and oversight, more extensive shareholder communication infrastructure, greater asset flows, heightened business risks, and differences in applicable laws and regulations associated with the Advisor’s proprietary mutual fund business. In assessing the reasonableness of the fund’s management fee rate, the Board considered the differences in the nature of the services required for the Advisor to manage its mutual fund business versus managing a discrete pool of assets as a subadvisor to another institution’s mutual fund or for an institutional account and that the Advisor generally performs significant additional services and assumes greater risk in managing the fund and other T. Rowe Price funds than it does for institutional account clients, including subadvised funds.
APPROVAL OF INVESTMENT MANAGEMENT AGREEMENT (CONTINUED)
srqmv_0621_P3Proof #
48
T. ROWE PRICE QM U.S. VAlUE EQUITy FUnd
On the basis of the information provided and the factors considered, the Board concluded that the fees paid by the fund under the Advisory Contract are reasonable.
Approval of the Advisory Contract As noted, the Board approved the continuation of the Advisory Contract. No single factor was considered in isolation or to be determinative to the decision. Rather, the Board concluded, in light of a weighting and balancing of all factors considered, that it was in the best interests of the fund and its shareholders for the Board to approve the continuation of the Advisory Contract (including the fees to be charged for services thereunder).
APPROVAL OF INVESTMENT MANAGEMENT AGREEMENT (CONTINUED)
srqmv_0621_P3Proof #
This page intentionally left blank.
srqmv_0621_P3Proof #
This page intentionally left blank.
srqmv_0621_P3Proof #
This page intentionally left blank.
srqmv_0621_P3Proof #
This page intentionally left blank.
srqmv_0621_P3Proof #
This page intentionally left blank.
srqmv_0621_P3Proof #
202108-1676722F201-051 8/21
You have manyinvestment goals.
Explore products and services that can help you achieve them.Whether you want to put away more money for retirement, for a child’s education, or for other priorities, we have solutions for you. See how we can help you accomplish the investment goals that are important to you.
RETIREMENTn IRAs: Traditional, Roth,
Rollover/Transfer, or Brokerage
n Small Business Plans help minimize taxes, maximize savings
n T. Rowe Price® ActivePlus Portfolios1 for online investing powered by experts
GENERAL INVESTINGn Individual or Joint
Tenantn Brokerage2 offers
access to stocks, ETFs, bonds, and more
n Gifts and transfers to a child (UGMA/UTMAs)
n Trustn Transfer on Death
COLLEGE SAVINGSn T. Rowe Price-managed
529 plans offer tax-advantaged solutions for families saving money for college tuition and education-related expenses
Visit troweprice.com/broadrange
Call 1-800-225-5132 to request a prospectus or summary prospectus; each includes investment objectives, risks, fees, expenses, and other information that you should read and consider carefully before investing.
All mutual funds are subject to market risk, including possible loss of principal. Investing internationally involves special risks including economic and political uncertainty and currency fluctuation.
1 The T. Rowe Price® ActivePlus Portfolios is a discretionary investment management program provided by T. Rowe Price Advisory Services, Inc., a registered investment adviser under the Investment Advisers Act of 1940. Brokerage services are provided by T. Rowe Price Investment Services, Inc., member FINRA/SIPC. Brokerage accounts are carried by Pershing LLC, a BNY Mellon Company, member NYSE/FINRA/SIPC. T. Rowe Price Advisory Services, Inc., and T. Rowe Price Investment Services, Inc., are affiliated companies.
2 Brokerage services are provided by T. Rowe Price Investment Services, Inc., member FINRA/SIPC. Brokerage accounts are carried by Pershing LLC, a BNY Mellon Company, member NYSE/FINRA/SIPC.
T. Rowe Price Investment Services, Inc. | 100 East Pratt Street | Baltimore, MD 21202-1009