ETSI TR 102 775 V1.3.1 (2009-11) Technical Report Speech and multimedia Transmission Quality (STQ); Guidance on objectives for Quality related Parameters at VoIP Segment-Connection Points; A support to NGN transmission planners
Transcript
ETSI TR 102 775 V1.3.1 (2009-11)
Technical Report
Speech and multimedia Transmission Quality (STQ);Guidance on objectives for Quality related Parameters
at VoIP Segment-Connection Points; A support to NGN transmission planners
ETSI
ETSI TR 102 775 V1.3.1 (2009-11) 2
Reference RTR/STQ-00157
Keywords planning, quality, transmission, voice
ETSI
650 Route des Lucioles F-06921 Sophia Antipolis Cedex - FRANCE
Tel.: +33 4 92 94 42 00 Fax: +33 4 93 65 47 16
Siret N° 348 623 562 00017 - NAF 742 C
Association à but non lucratif enregistrée à la Sous-Préfecture de Grasse (06) N° 7803/88
Important notice
Individual copies of the present document can be downloaded from: http://www.etsi.org
The present document may be made available in more than one electronic version or in print. In any case of existing or perceived difference in contents between such versions, the reference version is the Portable Document Format (PDF).
In case of dispute, the reference shall be the printing on ETSI printers of the PDF version kept on a specific network drive within ETSI Secretariat.
Users of the present document should be aware that the document may be subject to revision or change of status. Information on the current status of this and other ETSI documents is available at
http://portal.etsi.org/tb/status/status.asp
If you find errors in the present document, please send your comment to one of the following services: http://portal.etsi.org/chaircor/ETSI_support.asp
Copyright Notification
No part may be reproduced except as authorized by written permission. The copyright and the foregoing restriction extend to reproduction in all media.
DECTTM, PLUGTESTSTM, UMTSTM, TIPHONTM, the TIPHON logo and the ETSI logo are Trade Marks of ETSI registered for the benefit of its Members.
3GPPTM is a Trade Mark of ETSI registered for the benefit of its Members and of the 3GPP Organizational Partners. LTE™ is a Trade Mark of ETSI currently being registered
for the benefit of its Members and of the 3GPP Organizational Partners. GSM® and the GSM logo are Trade Marks registered and owned by the GSM Association.
Intellectual Property Rights ................................................................................................................................ 5
4.4 Network parameters: End-to-End Delay, Talker Echo Loudness Rating, R Value .......................................... 15
4.4.1 Delay with regional propagation delay (1 400 km / 11 ms) ........................................................................ 15
4.4.2 Categories of User Satisfaction ........................................................................................................................ 17
5 Guidance on Segment-connection Voice Quality Objectives ................................................................ 18
5.1 Guidance on Access Segment Objectives ........................................................................................................ 19
5.2 Guidance on Total Transit Segment Objectives ............................................................................................... 19
6 Possible Implications due to other services ............................................................................................ 23
7 Synchronization of endpoints ................................................................................................................. 23
Annex A: Summary of Relevant Transmission Planning Data .......................................................... 24
A.1 Delay in VoIP Terminals ........................................................................................................................ 24
A.2 Impairment Factors of Codecs ............................................................................................................... 26
A.3 Network QoS Classes for Voice Applications ....................................................................................... 26
A.4 Comparison of Codecs, Link Speed and Capacity examples - Comparison of Codecs, Link Speed and Capacity ........................................................................................................................................... 27
A.6.2 Network and Access Parameters ...................................................................................................................... 28
A.6.3 Delay and Jitter Values ..................................................................................................................................... 30
A.6.3.1 Delay and Serialization time ....................................................................................................................... 30
A.6.3.2 Queuing and Buffering Delay ..................................................................................................................... 32
A.6.3.3 Delay and Jitter Values for PSTN/ISDN classic access .............................................................................. 34
ETSI
ETSI TR 102 775 V1.3.1 (2009-11) 4
A.6.3.4 Delay and Jitter Values for NGN PSTN/ISDN access ................................................................................ 34
A.6.3.5 Delay and Jitter Values for Symmetric Access DSL (128 kbit/s) ............................................................... 35
A.6.3.6 Delay and Jitter Values for Symmetric Access DSL (256 kbit/s) ............................................................... 36
History .............................................................................................................................................................. 41
ETSI
ETSI TR 102 775 V1.3.1 (2009-11) 5
Intellectual Property Rights IPRs essential or potentially essential to the present document may have been declared to ETSI. The information pertaining to these essential IPRs, if any, is publicly available for ETSI members and non-members, and can be found in ETSI SR 000 314: "Intellectual Property Rights (IPRs); Essential, or potentially Essential, IPRs notified to ETSI in respect of ETSI standards", which is available from the ETSI Secretariat. Latest updates are available on the ETSI Web server (http://webapp.etsi.org/IPR/home.asp).
Pursuant to the ETSI IPR Policy, no investigation, including IPR searches, has been carried out by ETSI. No guarantee can be given as to the existence of other IPRs not referenced in ETSI SR 000 314 (or the updates on the ETSI Web server) which are, or may be, or may become, essential to the present document.
Foreword This Technical Report (TR) has been produced by ETSI Technical Committee Speech and multimedia Transmission Quality (STQ).
Introduction The present document is intended to fill a gap in a field where the industry has expressed an urgent need for standardized objectives. Based on the assumption that voice over IP services with the goal of users being satisfied or even very satisfied with the overall voice communication quality, the present document provides initial guidance on voice quality related parameters and respective objectives for interconnected networks.
This revision adds more details of delay introduced by network elements, jitter caused by access bandwidth limitations and on reference connection scenarios. This is intended as support to NGN transmission planners.
For the time being the present document only covers fixed line IP access to the NGN core and simple Segment-connection scenarios.
Since further work is underway in this area, it is intended to update the present document in accordance with feedback from experience within the industry. The objective values given in the present document are provisional and may be revised.
The present document forms part of STQ's roadmap with respect to Quality aspects of NGN.
1 Scope The present document provides guidance on the quality parameters that need to be considered at the Segment-connection of Voice over IP (VoIP) services and provides guidance on objectives for these parameters.
Inside the TISPAN NGN overall architecture (see figure 1), the present document considers only the transport layer. U
ser
Eq
uip
men
t
Applications
NetworkAttachmentSubsystem Resource and
AdmissionCtrl Subsystem
Transport Processing Functions
PSTD/ISDNEmulationSubsystem
OtherSubsystems
Core IMS
Oth
er N
etw
ork
s
Service Layer
Transport Layer
UserProfiles
Figure 1: TISPAN NGN overall architecture (adapted from [i.14])
2 References References are either specific (identified by date of publication and/or edition number or version number) or non-specific.
• For a specific reference, subsequent revisions do not apply.
• Non-specific reference may be made only to a complete document or a part thereof and only in the following cases:
- if it is accepted that it will be possible to use all future changes of the referenced document for the purposes of the referring document;
- for informative references.
Referenced documents which are not found to be publicly available in the expected location might be found at http://docbox.etsi.org/Reference.
NOTE: While any hyperlinks included in this clause were valid at the time of publication ETSI cannot guarantee their long term validity.
2.1 Normative references The following referenced documents are indispensable for the application of the present document. For dated references, only the edition cited applies. For non-specific references, the latest edition of the referenced document (including any amendments) applies.
2.2 Informative references The following referenced documents are not essential to the use of the present document but they assist the user with regard to a particular subject area. For non-specific references, the latest version of the referenced document (including any amendments) applies.
[i.1] ITU-T Recommendation Y.1540 (2002): "Internet protocol data communication service - IP packet transfer and availability performance parameters".
[i.3] ITU-T Recommendation Y.1542 (2006): "Framework for achieving end-to-end IP performance objectives".
[i.4] ITU-T Recommendation G.107 (2008): "The E-model: a computational model for use in transmission planning".
[i.5] ITU-T Recommendation G.108 (1999): "Application of the E-model: A planning guide".
[i.6] ITU-T Recommendation G.109 (1999): "Definition of categories of speech transmission quality".
[i.7] ITU-T Recommendation G.113 (2007): "Transmission impairments due to speech processing".
[i.8] Void.
[i.9] ITU-T Recommendation G.1020 (2006): "Performance parameter definitions for quality of speech and other voiceband applications utilizing IP networks".
[i.10] ETSI ES 202 737: "Speech and multimedia Transmission Quality (STQ); Transmission requirements for narrowband VoIP terminals (handset and headset) from a QoS perspective as perceived by the user".
[i.11] ETSI ES 202 738: "Speech and multimedia Transmission Quality (STQ); Transmission requirements for narrowband VoIP loudspeaking and handsfree terminals from a QoS perspective as perceived by the user".
[i.12] ETSI ES 202 739: "Speech and multimedia Transmission Quality (STQ); Transmission requirements for wideband VoIP terminals (handset and headset) from a QoS perspective as perceived by the user".
[i.13] ETSI ES 202 740: "Speech and multimedia Transmission Quality (STQ); Transmission requirements for wideband VoIP loudspeaking and handsfree terminals from a QoS perspective as perceived by the user".
[i.14] ETSI ES 282 001: "Telecommunications and Internet converged Services and Protocols for Advanced Networking (TISPAN); NGN Functional Architecture".
[i.15] GSMA Document IR.3445: "Inter-Service Provider IP Backbone Guidelines".
[i.16] ITU-T Recommendation G.8261 (2008): "Timing and synchronization aspects in packet networks".
[i.18] ITU-T Recommendation G.8264 (2008): "Timing distribution through packet networks".
[i.19] IEEE 1588: "Standard for a Precision Clock Synchronization Protocol for Networked Measurement and Control System".
[i.20] ITU-T Recommendations of the P.862-series: "Perceptual evaluation of speech quality (PESQ): An objective method for end-to-end speech quality assessment of narrow-band telephone networks and speech codecs".
[i.21] ITU-T Recommendation P.834: "Methodology for the derivation of equipment impairment factors from instrumental models".
[i.28] ITU-T Recommendation G.826: "End-to-end error performance parameters and objectives for international, constant bit-rate digital paths and connections".
[i.29] ITU-T Recommendation Q.115.1: "Logic for the control of echo control devices and functions".
[i.30] ETSI EN 300 726: "Digital cellular telecommunications system (Phase 2+) (GSM); Enhanced Full Rate (EFR) speech transcoding (GSM 06.60 version 8.0.1 Release 1999)".
[i.31] IETF RFC 1483: "Multiprotocol Encapsulation over ATM Adaptation Layer".
3 Definitions and abbreviations
3.1 Definitions For the purposes of the present document, the following terms and definitions apply:
access segment: network segment from the customer interface (UNI) to the interface on the customer side of the first Gateway Router
Segment-connection point: point between two segments
NOTE: The terms "interconnection" or "interconnection point" has been used in the NGN standards, e.g. in [i.14], the same terms are generally used for NNIs, not for the connection between access segment and transit segment, they might be misinterpreted. Therefore, throughout the present document, the terms "Segment-connection" or "Segment-connection point" are used.
total transit segment: segment between Gateway routers, including the gateway routers themselves
NOTE: The network segment may include interior routers with various roles.
ETSI
ETSI TR 102 775 V1.3.1 (2009-11) 9
3.2 Abbreviations For the purposes of the present document, the following abbreviations apply:
ACELP Algebraic Code-Excited Linear Prediction ADM Add-Dropp-Multiplexer ADPCM Adaptive Differential Pulse Code Modulation ADSL Asymmetric Digital Subscriber Line AGW Access GateWay ATM Asynchronous Transfer Mode BRAS Broadband Remote Access Server BSC Base Station Controller BTS Base Transceiver Station CL Router Core Layer CS-ACELP Conjugate Structure Algebraic Code- Excited Linear Prediction DL Router Distribution Layer DSL Digital Subscriber Line DSLAM Digital Subscriber Line Access Multiplexer DV Delay Variation EC Echo Canceller ESR Errored Second Ratio ETH Ethernet GoB Good or Better GSM Global System for Mobile communications GSMA Global System for Mobile communications Association GW GateWay IAD Integrated Access Device Ie Equipment Impairment Factor IMS IP Multimedia Subsystem IP Internet Protocol IPDV IP packet Delay Variation IPER IP Packet Error Ratio IPLR IP Packet Loss Ratio IPTD IP Packet Transfer Delay ISDN Integrated Services Digital Network ITU International Telecommunication Union ITU-T ITU Telecommunication Standardization Sector JB De-jitter Buffer LAN Local Area Network MGW Media Gateway MOS Mean Opinion Score MP-ACELP Multipulse Algebraic code excited linear prediction MP-MLQ Multipulse Maximum Likelihood Quantization MSAN Multi Service Access Node MTU Maximum Transmission Unit NGN Next Generation Network NI Network Interface NNI Network to Network Interface NTP Network Termination Point PDH Plesiochronous Digital Hierarchy PL Packet Loss PoW Poor or Worse PSTN Public Switched Telephone Network PTP Point to Point QoS Quality of Service SBC Session Border Controller SoIx Service-oriented Interconnection STM 1 Synchronous Transport Module 1 SyncE Synchronous Ethernet TRAU Transcoder and Rate Adaption Unit UMSC UMTS Mobile Switching Center
ETSI
ETSI TR 102 775 V1.3.1 (2009-11) 10
UMTS Universal Mobile Telecommunications System UNI User Network Interface VoIP Voice over Internet Protocol WiMAX Worldwide Interoperability for Microwave Access xDSL x Digital Subscriber Line
4 Reference Configuration Compared to networks and systems that are circuit-based, those based on IP pose distinctly different challenges for planning and achieving the end-to-end performance levels necessary to adequately support the wide array of user applications (voice, data, fax, video, etc.). The fundamental quality objectives for these applications are well understood and have not changed as perceived by the user; what has changed is the technology (and associated impairments) in the layers below these applications. The very nature of IP-based routers and terminals, with their queuing methods and de-de-jitter buffers, respectively, makes realizing good end-to-end performance across multiple network operators a very major challenge for applications with stringent performance objectives. Fortunately ITU-T Recommendations Y.1540 [i.1] and Y.1541 [i.2] together provide the parameters needed to capture the performance of IP networks, and specify a set of "network QoS" classes with end-to-end objectives specified. It is widely accepted (i.e. beyond the ITU-T) that the network QoS classes of ITU-T Recommendation Y.1541 [i.2] should be supported by Next Generation Networks, and thus by networks evolving into NGNs. ITU-T Recommendation Y.1542 [i.3] considers various approaches toward achieving end-to-end (UNI-UNI) IP network performance objectives.
The general reference configuration for the present document follows the principles shown in figure 2; the number of concatenated transit providers may vary.
UNI
CPN CPN
NNI NNI
Total transit segment
UserSegment A
AccessSegment A
UserSegment C
AccessSegment C
NGNProvider A
NGNProvider C
NGN Provider B
TransitSegment
A1
TransitSegment
C1
TransitSegment
B1
UNI
Regional Metro
Regional
Figure 2: General Reference Configuration
Thus the end-to-end connection can be decomposed into the following elements:
• User segment A.
• UNIA (sending side).
• Access segment A.
• Segment-connection Point Ain.
• Total transit segment.
• Segment-connection Point Cout.
• Access segment C.
• UNIC (receiving side).
• User segment C.
ETSI
ETSI TR 102 775 V1.3.1 (2009-11) 11
The total transit segment can be further decomposed into:
• Transit segment A1.
• Segment-connection point Aout.
• Transit segment A2 (NNI).
• Segment-connection point Bin.
• Transit segment B1.
• Segment-connection point Bout.
• Transmit segment B2 (NNI).
• Segment-connection point Cin.
• Transit segment C1.
4.1 Generic Segment-connection Points Due to real-world constraints the simplified static divisor approach according to ITU-T Recommendation Y.1542 [i.3] has been chosen for the impairment apportionment between access and transit networks.
This approach "divides" the UNI-to-UNI path into three segments and budgets the impairments such that the total objective is met in principle.
As outlined in [i.15] the delay values for the total transit segment are in a fixed relation to the distances between different geographical regions (see table 2). Thus, for the near future dynamic allocation of delay budgets is not expected to be implemented between user segments, access segments and transit segments.
In figure 3, the upper part displays the division of the connection as seen from a QoS point of view whereas the lower part shows this division in terms of the NGN Functional Architecture [i.14].
NOTE: The reference points Ic, Iw, and Iz are defined in [i.14] in clause 7.2.2.
ETSI
ETSI TR 102 775 V1.3.1 (2009-11) 12
Service Layer
Transport Layer
UNI UNISBC SBC SBC SBC
IP Transit
Interconnection Serveror
Transit Network
Access Network Access NetworkNGN NGN
UNI-UNI
CPN CPN
QoS View
NGN Functional Archutecture View
RACS
I-BGF
Service ControlSubsystem
Non-compatibleControl domain
CompatibleControl domain
IWF
SoIx interconnection reference model
Iz/Ic Iz/Ic
Iz
Ic
Iz
Iw
Figure 3: Division of the connection
Hence, there should be objectives for the following portions of the connection:
• UNI (send side) �� Segment-connection Point A.
• Segment-connection Point A �� Segment-connection Point C.
• Segment-connection Point C �� UNI (receive side).
The guidance on respective objectives is given in clause 5.
As illustrated in figure 3, SoIx interconnection is typically characterized by the presence of two types of information exchanged between the two interconnected domains:
• Service-related signalling information, that allows to identify the end-to-end service that has been requested. For example, in case of IMS-to-IMS SoIx interconnection, this is mapped to SIP signalling on the Ic reference point.
• Transport information, that carries the bearer traffic.
The presence of the service-related signalling in SoIx interconnection enables the end-to-end service awareness.
An NGN interconnection could be a SoIx even if the transport information is not exchanged between the interconnected domains, as long as service-related signalling is exchanged.
An NGN transport layer interconnection is considered being part of an NGN SoIx interconnection if the transport layer is controlled from the service layer in both of the interconnected domains.
• SoIx Interconnection interface includes at least Ic and Iz reference points between two interconnected domains that have same or compatible service control sub systems/domains.
• SoIx Interconnection interface with Interworking includes at least the Iw and Iz reference points between two interconnected domains that have non- compatible service control sub systems/domains.
ETSI
ETSI TR 102 775 V1.3.1 (2009-11) 13
4.2 Transport Reference Parameters and Configurations At the Segment-connection Points (figure 3) different access networks can be connected. Following access networks can be considered:
• PSTN/ISDN classic access Configuration.
• NGN PSTN/ISDN access Configuration.
• Access DSL Configuration.
• WiMAX.
• GSM.
• UMTS.
The Access Points for WiMAX GSM and UMTS are for further study. In the following clauses are defined the end-to-end delay, and the Talker Echo Loudness Rating The detailed values of jitter and delay are for the access are described in clause 6.
4.2.1 Reference Configurations
The following clauses describes the Backbone and access reference configuration. In the calculation is at the Segment-connection point taken into account only one SBC.
4.2.1.1 Backbone Configuration
Figure 4 shows the backbone configuration. The number of elements used in the configuration and the delay values are is described in clause 6.
IP TransitSBC ADM DL CL SBC SBC SBCADMDLCL
Figure 4: Backbone
4.2.1.2 PSTN/ISDN classic access Configuration
Figure 5 shows the PSTN/ISDN classic access configuration. The number of elements used in the configuration and the delay values are is described in clause 6.
TE EC MGW SBC VoNGN
PSTNLocal exchange Transit exchange
Figure 5: Reference configuration for PSTN/ISDN with classical access
4.2.1.3 NGN PSTN/ISDN access Configuration
Figure 6 shows the NGN PSTN/ISDN classic access configuration. The number of elements used in the configuration and the delay values are is described in clause 6.
ETSI
ETSI TR 102 775 V1.3.1 (2009-11) 14
TE SBC VoNGN
PSTN
EC
Subscriber linedigital junction
MSAN(MGW)
Figure 6: Reference configuration for NGN with PSTN/ISDN access
4.2.1.4 Access DSL Configuration
Figure 7 shows the xDSL access configuration. The number of elements used in the configuration and the delay values are is described in clause 6.
SBC VoNGNTEPSTN
IAD ETH2x
ADM4x BRASDSLAM
Figure 7: Reference configuration for DSL access
4.3 Delay Values
4.3.1 Backbone Delay
Table 1 shows the long distance delay values for typical reference distances.
Table 1: Long Distance Delay
Distance Delay 1 400 km 11 ms
5 000 km (Intra Regional) 29 ms 10 000 km (Inter Regional) 54 ms 27 500 km (Inter Regional) 142 ms
NOTE: Delay values see also table 2.
Table 2 shows delay values between originating and terminating Service Provider premises. The End-to-End delay values are based on values contained in the GSMA document IR3445.
ETSI
ETSI TR 102 775 V1.3.1 (2009-11) 15
Table 2: End-to-End delay values between originating and terminating Service Provider premises
Central America 113 125 141 124 178 245 185 46 123 20 67 147
South America 165 168 175 168 230 240 235 240 150 67 60 140
Africa 121 135 131 109 192 125 144 163 209 147 90 90 NOTE: See [i.15].
4.4 Network parameters: End-to-End Delay, Talker Echo Loudness Rating, R Value
In this clause, end to end delay values (mouth to ear) for different access lines and the respective R-values (depending on the calculated delay) are shown.
The following clause describes the Network parameters: End-to-End Delay, Talker Echo Loudness Rating for a national network. The detailed values of End-to-End Delay, and Jitter values and the time values for the jitter buffers are described in clause 6.
4.4.1 Delay with regional propagation delay (1 400 km / 11 ms)
For the calculation of the Voice Quality parameters used network parameters are contained in clause 6. For the calculation is used the Packet size of 20 ms, the access of DSL line 128 kbit/s uplink; 128 kbit/s downlink, DSL line 256 kbit/s uplink; 256 kbit/s downlink, DSL line 384 kbit/s uplink; 1 024 kbit/s downlink. The codecs G.729A, G.711 and G.726/40/20.
The delay values of the used components are state of the art. The R values are based on ISDN Terminals with the Talker Echo Loudness Rating TELR = 65. For DECT terminals the Talker Echo Loudness Rating TELR = 65 is used under the condition that the echo cancellation is deployed in the gateway according ITU-T Recommendation Q.115.1 [i.29].
For other national networks which have different propagation delay, the Access parameters from clause 6 can be used and the propagation delay from table 1 and 2 can be added. The explanation of the calculation of the delay values will be included in a further revision of the present document. In case of interleaving on the DSL access line, the additional delay has to be added.
To enable an easy comparison of the user satisfaction the tables are coloured in the same colours as table 11: Relation between R-value and user satisfaction.
Table 3 shows End-to-End delay in ms and R value between DSL line 128 kbit/s uplink; 128 kbit/s downlink and PSTN/ISDN G.729. The R values are based on ISDN Terminals with the Talker Echo Loudness Rating TELR = 65.
ETSI
ETSI TR 102 775 V1.3.1 (2009-11) 16
Table 4 shows End-to-End delay in ms and R value between DSL line 256 kbit/s uplink; 256 kbit/s downlink and PSTN/ISDN for G.711; G.726/40/20. The R values are based on ISDN Terminals with the Talker Echo Loudness Rating TELR = 65.
Table 5 shows End-to-End delay in ms and R value between DSL line 256 kbit/s uplink; 256 kbit/s downlink and PSTN/ISDN for G.729A. The R values are based on ISDN Terminals with the Talker Echo Loudness Rating TELR = 65.
Table 6 shows End-to-End delay ms Delay between DSL line 384 kbit/s uplink; 1 024 kbit/s downlink and PSTN/ISDN for G.711. The R values are based on ISDN Terminals with the Talker Echo Loudness Rating TELR = 65.
Table 7 shows End-to-End delay in ms and R value between DSL line 128 kbit/s uplink; 128 kbit/s downlink and PSTN/ISDN G.729. The R values are based on DECT Terminals.
Table 8 shows End-to-End delay in ms and R value between DSL line 256 kbit/s uplink; 256 kbit/s downlink and PSTN/ISDN for G.711; G.726/40/20. The R values are based on DECT Terminals. (Q.115.1 [i.29])
Table 9 shows End-to-End delay in ms and R value between DSL line 256 kbit/s uplink; 256 kbit/s downlink and PSTN/ISDN for G.729A. The R values are based on DECT Terminals.
Table 10 shows End-to-End delay ms Delay between DSL line 384 kbit/s uplink; 1 024 kbit/s downlink and PSTN/ISDN for G.711. The R values are based on DECT Terminals.
Table 3: End-to-End delay in ms and R value between DSL line 128 kbit/s uplink; 128 kbit/s downlink and PSTN/ISDN G.729 with ISDN Terminals
Table 4: End-to-End delay in ms and R value between DSL line 256 kbit/s uplink; 256 kbit/s downlink and PSTN/ISDN for G.711 and G.726/40/20 with ISDN Terminals
Table 7: End-to-End delay in ms and R value between DSL line 128 kbit/s uplink; 128 kbit/s downlink and PSTN/ISDN G.729 with DECT Terminals TELR = 65 with the condition that the echo cancellation
is deployed in the gateway according ITU-T Recommendation Q.115.1 [i.29]
Table 8: End-to-End delay in ms and R value between DSL line 256 kbit/s uplink; 256 kbit/s downlink and PSTN/ISDN for G.711 and G.726/40/20 with DECT Terminals TELR = 65 with the condition that the
echo cancellation is deployed in the gateway according ITU-T Recommendation Q.115.1 [i.29]
Table 9: End-to-End delay between DSL line 256 kbit/s uplink; 256 kbit/s downlink for G.729A with DECT Terminals TELR = 65 with the condition that the echo cancellation is deployed in the gateway
Table 10: End-to-End delay ms Delay between DSL line 384 kbit/s uplink; 1 024 kbit/s downlink and PSTN/ISDN for G.711 with DECT Terminals TELR = 65 with the condition that the echo cancellation is
deployed in the gateway according ITU-T Recommendation Q.115.1 [i.29]
4.4.2 Categories of User Satisfaction The following information is an excerpt from ITU-T Recommendation G.109 [i.6].
While the single parameters describe the individual factors affecting speech transmission quality, it is the combined effect of all parameters together which leads to the overall level of speech transmission quality as perceived by the user. For transmission planning purposes, the E-model (G.107) is a useful tool for assessing the combined effect of all parameters and hence differentiating between categories of speech transmission quality.
The primary output of the E-model is the Transmission Rating Factor R. Table 11 gives the definitions of the categories of speech transmission quality in terms of ranges of Transmission Rating Factor R provided by ITU-T Recommendation G.107 [i.4]. Also provided are descriptions of "User satisfaction" for each category.
ETSI
ETSI TR 102 775 V1.3.1 (2009-11) 18
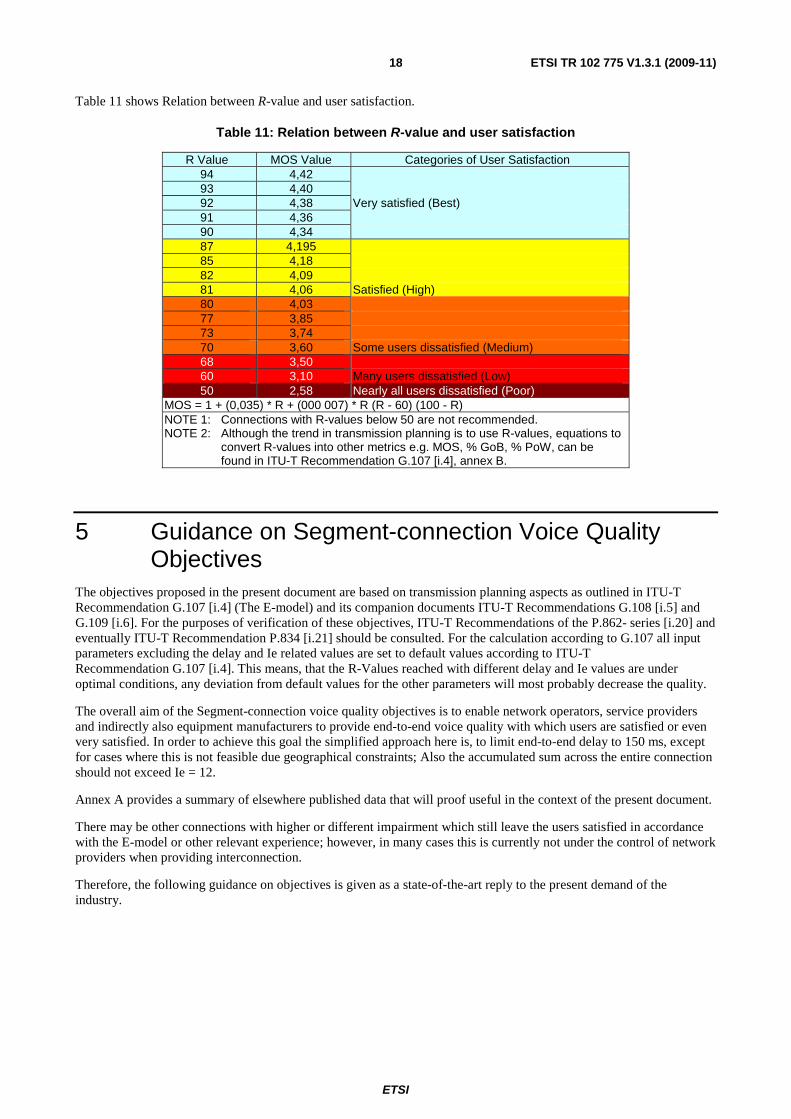
Table 11 shows Relation between R-value and user satisfaction.
Table 11: Relation between R-value and user satisfaction
R Value MOS Value Categories of User Satisfaction 94 4,42 93 4,40 92 4,38 Very satisfied (Best) 91 4,36 90 4,34 87 4,195 85 4,18 82 4,09 81 4,06 Satisfied (High) 80 4,03 77 3,85 73 3,74 70 3,60 Some users dissatisfied (Medium) 68 3,50 60 3,10 Many users dissatisfied (Low) 50 2,58 Nearly all users dissatisfied (Poor)
MOS = 1 + (0,035) * R + (000 007) * R (R - 60) (100 - R) NOTE 1: Connections with R-values below 50 are not recommended. NOTE 2: Although the trend in transmission planning is to use R-values, equations to
convert R-values into other metrics e.g. MOS, % GoB, % PoW, can be found in ITU-T Recommendation G.107 [i.4], annex B.
5 Guidance on Segment-connection Voice Quality Objectives
The objectives proposed in the present document are based on transmission planning aspects as outlined in ITU-T Recommendation G.107 [i.4] (The E-model) and its companion documents ITU-T Recommendations G.108 [i.5] and G.109 [i.6]. For the purposes of verification of these objectives, ITU-T Recommendations of the P.862- series [i.20] and eventually ITU-T Recommendation P.834 [i.21] should be consulted. For the calculation according to G.107 all input parameters excluding the delay and Ie related values are set to default values according to ITU-T Recommendation G.107 [i.4]. This means, that the R-Values reached with different delay and Ie values are under optimal conditions, any deviation from default values for the other parameters will most probably decrease the quality.
The overall aim of the Segment-connection voice quality objectives is to enable network operators, service providers and indirectly also equipment manufacturers to provide end-to-end voice quality with which users are satisfied or even very satisfied. In order to achieve this goal the simplified approach here is, to limit end-to-end delay to 150 ms, except for cases where this is not feasible due geographical constraints; Also the accumulated sum across the entire connection should not exceed Ie = 12.
Annex A provides a summary of elsewhere published data that will proof useful in the context of the present document.
There may be other connections with higher or different impairment which still leave the users satisfied in accordance with the E-model or other relevant experience; however, in many cases this is currently not under the control of network providers when providing interconnection.
Therefore, the following guidance on objectives is given as a state-of-the-art reply to the present demand of the industry.
ETSI
ETSI TR 102 775 V1.3.1 (2009-11) 19
5.1 Guidance on Access Segment Objectives The following objectives can be applied between the following points, it should be noted that these parameters may vary between both directions of transmission:
• UNIA (sending side) � Segment-connection point A (receiving side);
• Segment-connection point A (sending side) � UNIC (receiving side);
• UNIA (sending side) � Segment-connection point C (receiving side); and
• Segment-connection point C (sending side) � UNIC (receiving side).
See figure 2 for details. The categories in following tables refers to ITU-T Recommendation G.109 [i.6] with the following notations:
Table 12: Guidance on objectives for either Access Segment for R > 90
Parameter Value Jitter [ms] sending 50 ms Jitter [ms] receiving 20 ms
IPLR 3 × 10⁻⁴ IPER 3 × 10⁻⁵
5.2 Guidance on Total Transit Segment Objectives The following objectives can be applied between:
• Segment-connection point A �� Segment-connection point C.
See figure 1 for details. The objectives are based on the application of Class 0 of ITU-T Recommendation Y.1541 [i.2]. The determination of cases where Class 1 of ITU-T Recommendation Y.1541 [i.2] should be applied and the associated objectives are for further study.
Table 13: Guidance on Objectives for Total Transit Segments
Parameter Value Intra-continent Jitter Value - 5 ms per Provider (maximum of 2 involved in the service delivery chain) (see note)
10 ms
Inter-continent Jitter Value - 10 ms per Provider (maximum of 2 involved in the service delivery chain) (see note)
20 ms
IPLR 3,0 × 10⁻⁴ IPER 3 × 10⁻⁵
Ie 0 NOTE: The Jitter Values are based on values contained in
the GSMA document IR3445.
The proposed transit delay value applies to total transit segments which are intra-continental, only. For total transit segments which are intercontinental 140 ms may be appropriate, see table I.2 of ITU-T Recommendation Y.1542 [i.3], the proposed objectives for the present document is for further study.
It is assumed that transcoding in the total transit segment can be avoided at all.
Transit delay includes the core and distribution delay as well as the propagation delay defined in ITU-T Recommendation Y.1541 [i.2].
ETSI
ETSI TR 102 775 V1.3.1 (2009-11) 20
5.2.1 Availability
Values for availability are following:
• Availability of the IP Backbone Service Provider Core: 99,995 %.
• Service Providers connection to IP Backbone Service Provider core with single connection: 99,7 %.
• Service Providers connection to IP Backbone Service Provider core with dual connection: 99,9 %.
5.3 Voice Terminals In order to be able to achieve the goal of users being satisfied or even very satisfied with the overall voice communication quality it is assumed that the VoIP terminals used in this context comply with one or more of the following ETSI standards:
• ETSI ES 202 737 [i.10]: "Speech Processing, Transmission and Quality Aspects (STQ); Transmission requirements for narrowband VoIP terminals (handset and headset) from a QoS perspective as perceived by the user".
• ETSI ES 202 738 [i.11]: "Speech Processing, Transmission and Quality Aspects (STQ); Transmission requirements for narrowband VoIP loudspeaking and handsfree terminals from a QoS perspective as perceived by the user".
• ETSI ES 202 739 [i.12]: "Speech Processing, Transmission and Quality Aspects (STQ); Transmission requirements for wideband VoIP terminals (handset and headset) from a QoS perspective as perceived by the user".
• ETSI ES 202 740 [i.13]: "Speech Processing, Transmission and Quality Aspects (STQ); Transmission requirements for wideband VoIP loudspeaking and handsfree terminals from a QoS perspective as perceived by the user".
ETSI
ETSI TR 102 775 V1.3.1 (2009-11) 21
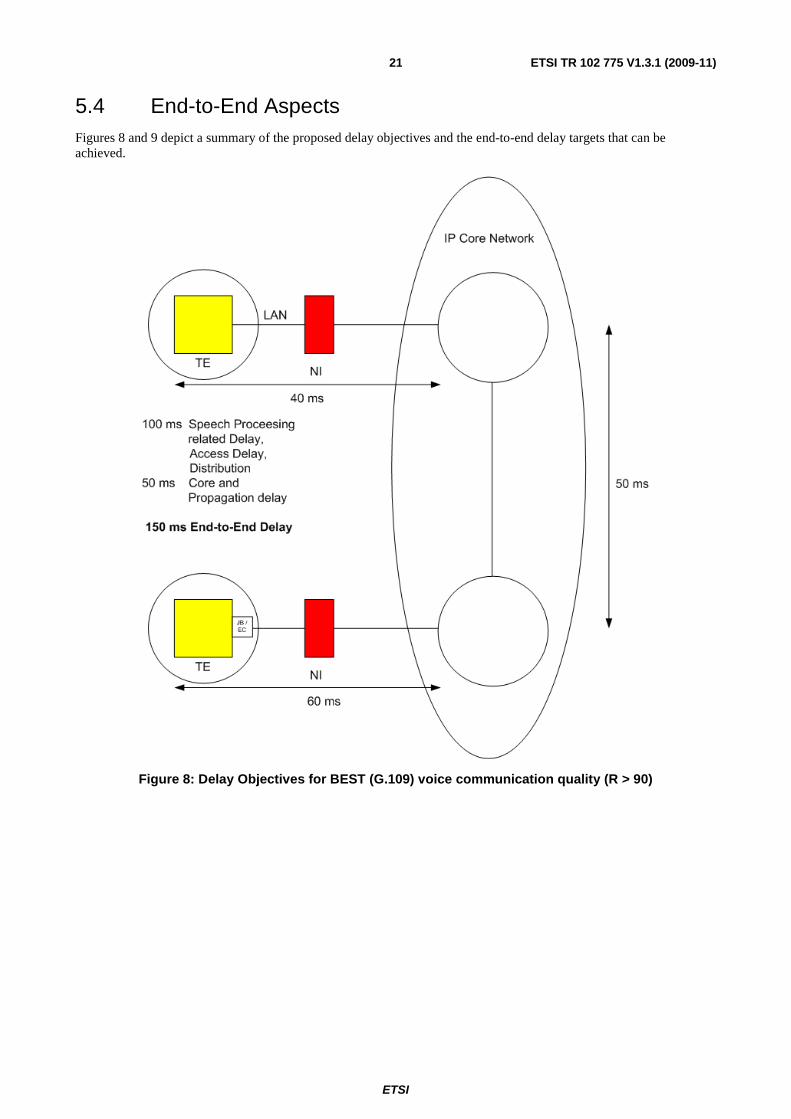
5.4 End-to-End Aspects Figures 8 and 9 depict a summary of the proposed delay objectives and the end-to-end delay targets that can be achieved.
Figure 8: Delay Objectives for BEST (G.109) voice communication quality (R > 90)
ETSI
ETSI TR 102 775 V1.3.1 (2009-11) 22
Figure 9: Delay Objectives for HIGH (G.109) voice communication quality (R > 80)
ETSI
ETSI TR 102 775 V1.3.1 (2009-11) 23
6 Possible Implications due to other services Even though the present document is focussed on VoIP, it may be worthwhile to consider - at the time of deployment - implications that may arise due to other services which are likely to be carried over the same infrastructure. The following may serve as one example, with its provisional objectives being derived from past and current implementations in traditional networks.
EXAMPLE: The IP-based network should also be capable to carry the 64 kbit/s transparent data service described in ITU-T Recommendation I.231.1 [i.27], also known as "64 k clear-mode". The basis of the objective here is use of ITU-T Recommendation G.826 [i.28], a standard for synchronous digital networks. While the IP core is a packet network and not a synchronous network, it is being used to emulate a service currently transported over a synchronous network. Hence the performance of the emulation should be no worse than the performance of the synchronous network as specified by ITU-T Recommendation G.826 [i.28]. The standard requires an Errored Second Ratio (ESR) of < 0,16 for an STM-1 link which can carry about 1 200 "clear-mode" channels. From this, the end-to-end probability of loss per packet can be shown to be about 1,5 × 10⁻⁶. ITU-T Recommendation G.826 [i.28] budgets 18,5 % of this to each national network, so the packet loss for a national connection should be no more than 2,75 × 10⁻⁷. Allocation of this ratio to individual operators' networks within the national network is yet to be agreed, but it is fairly unlikely that there will be more than three operators' switched networks between any customer and the international gateway, so an initial allocation could be 9,0 × 10⁻⁸ to each operator's network.
Table 14: Summary of provisional objectives
Parameter Provisional Objective IP packet loss ratio for national connections 2,75 × 10⁻⁷ IP packet loss ratio for each operator's network 9,0 × 10⁻⁸ end-to-end probability IP packet loss ratio 1,5 × 10⁻⁶ IP packet error ratio for each operator's network 1,0 × 10⁻⁸
7 Synchronization of endpoints To ensure the synchronization of the endpoints (e.g. MSAN, GW; AGW) the endpoints should be synchronized with Synchronous Ethernet (SyncE) based on the ITU-T Recommendations G.8261 [i.16], G.8262 [i.17] and G.8264 [i.18]. Additionally, PTP (IEEE 1588 v2 [i.19]) and NTPv4 may be used as mean for synchronization of endpoints. A distinction needs to be made between time and timing synchronisation. Legacy networks tend only to be interested in timing synch whereas in IP based NGN, both time and timing can be important. Synchronous Ethernet provides timing synch whereas PTP and NTP provide both if correctly implemented.
ETSI
ETSI TR 102 775 V1.3.1 (2009-11) 24
Annex A: Summary of Relevant Transmission Planning Data This annex provides condensed information on transmission planning data that may be considered useful in the context of the present document.
A.1 Delay in VoIP Terminals The following information is an excerpt from ES 202 737 [i.10], ES 202 738 [i.11], ES 202 739 [i.12] and ES 202 740 [i.13].
A.1.1 Send Delay For a VoIP terminal, send delay is defined as the one-way delay from the acoustical input (mouthpiece) of this VoIP terminal to its interface to the packet based network. The total send delay is the upper bound on the mean delay and takes into account the delay contributions of all of the elements shown in figures 2 and A.1 in ITU-T Recommendation G.1020 [i.9], respectively.
The sending delay T(s) is defined as follows:
T(s) = T(ps) + T(la) + T(aif) + T(asp).
Where:
T(ps) = packet size = N * T(fs).
N = number of frames (samples) per packet.
T(fs) = frame size of encoder.
T(la) = look-ahead of encoder.
T(aif) = air interface framing.
T(asp) = allowance for signal processing.
The additional delay required for IP packet assembly and presentation to the underlying link layer will depend on the link layer. When the link layer is a LAN (e.g. Ethernet), this additional time will usually be quite small. For the purposes of the present document it is assumed that in the test setup this delay can be neglected.
NOTE: With the knowledge of the codec specific values for T(fs) and T(la) the requirements for send delay for any type of coder and any packet size T(ps) can easily be calculated. Table A.1 provides examples for delay values calculated accordingly.
A.1.2 Receive delay For a VoIP terminal, receive delay is defined as the one-way delay from the interface to the packet based network of this VoIP terminal to its acoustical output (earpiece). The total receive delay is the upper bound on the mean delay and takes into account the delay contributions of all of the elements shown in figures 3 and A.2 of ITU-T Recommendation G.1020 [i.9], respectively.
The receiving delay T(r) is defined as follows:
T(r) = T(fs) + T(aif) +T(jb) + T(plc) + T(asp).
Where:
T(fs) = frame size of encoder.
T(aif) = air interface framing.
T(jb) = de-jitter buffer size.
T(plc) = PLC buffer size.
T(asp) = allowance for signal processing.
The additional delay required for IP packet disassembly and presentation from the underlying link layer will depend on the link layer. When the link layer is a LAN (e.g. Ethernet), this additional time will usually be quite small. For the purposes of the present document it is assumed that in the test setup this delay can be neglected.
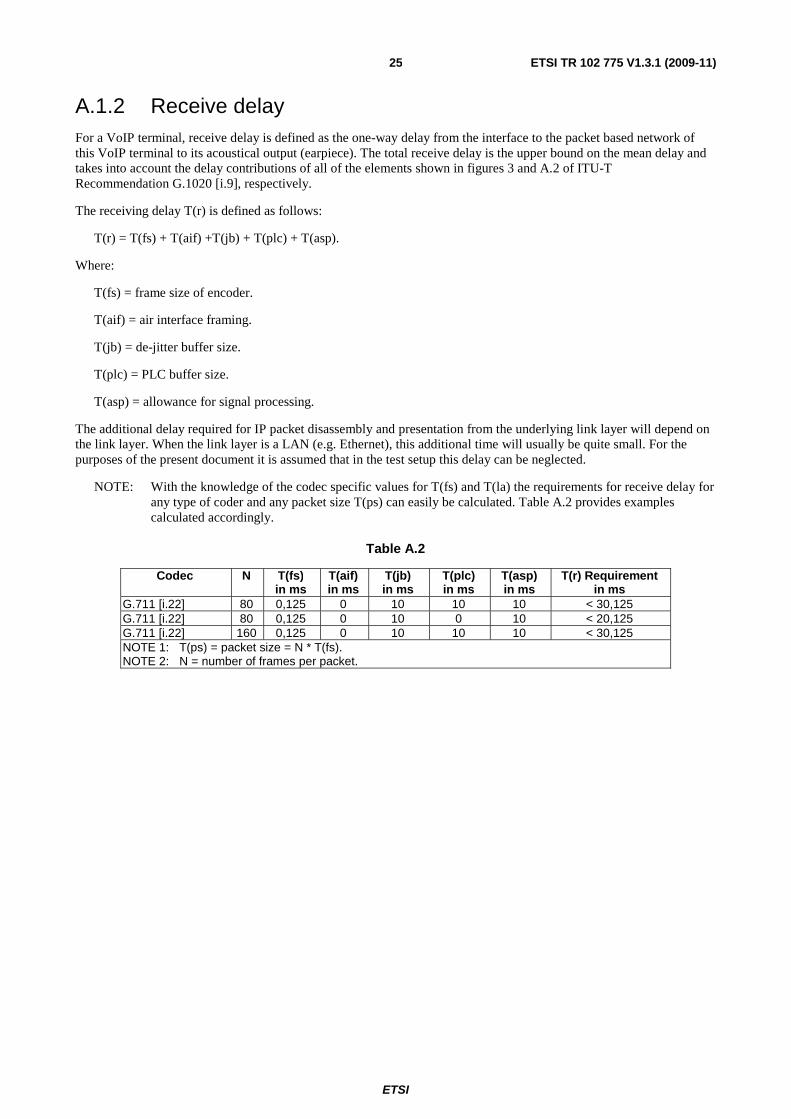
NOTE: With the knowledge of the codec specific values for T(fs) and T(la) the requirements for receive delay for any type of coder and any packet size T(ps) can easily be calculated. Table A.2 provides examples calculated accordingly.
Table A.2
Codec N T(fs) in ms
T(aif) in ms
T(jb) in ms
T(plc) in ms
T(asp) in ms
T(r) Requirement in ms
G.711 [i.22] 80 0,125 0 10 10 10 < 30,125 G.711 [i.22] 80 0,125 0 10 0 10 < 20,125 G.711 [i.22] 160 0,125 0 10 10 10 < 30,125 NOTE 1: T(ps) = packet size = N * T(fs). NOTE 2: N = number of frames per packet.
ETSI
ETSI TR 102 775 V1.3.1 (2009-11) 26
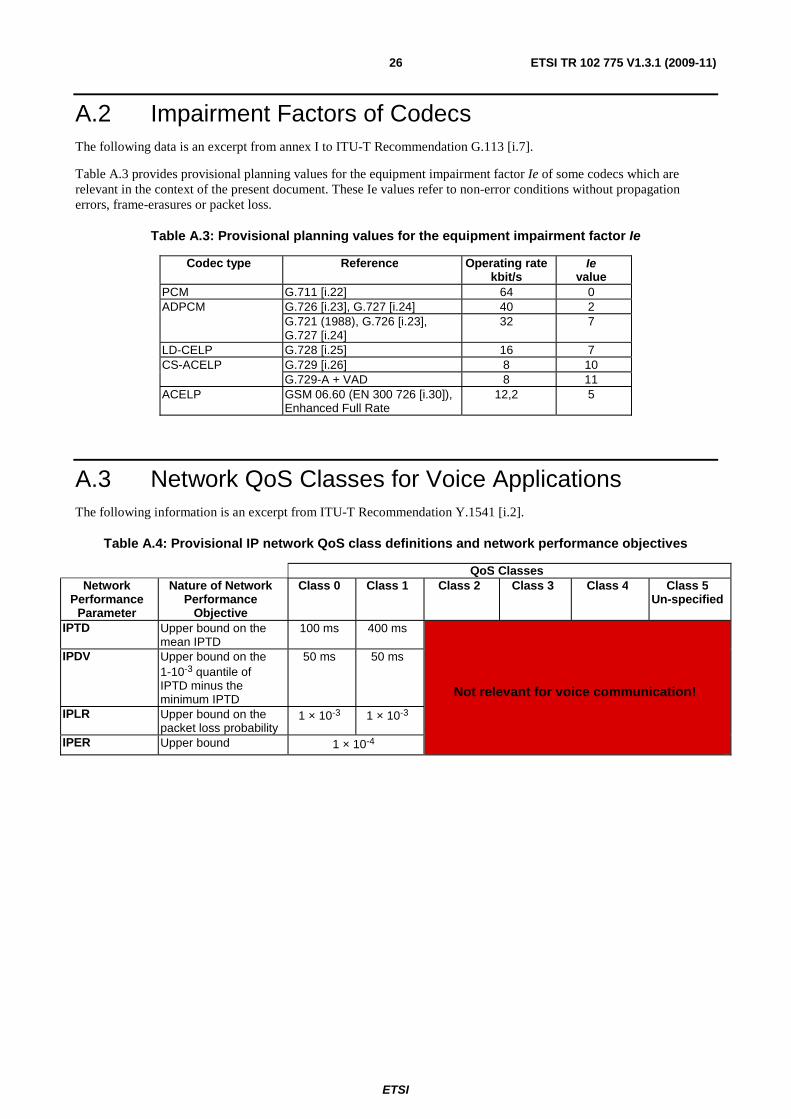
A.2 Impairment Factors of Codecs The following data is an excerpt from annex I to ITU-T Recommendation G.113 [i.7].
Table A.3 provides provisional planning values for the equipment impairment factor Ie of some codecs which are relevant in the context of the present document. These Ie values refer to non-error conditions without propagation errors, frame-erasures or packet loss.
Table A.3: Provisional planning values for the equipment impairment factor Ie
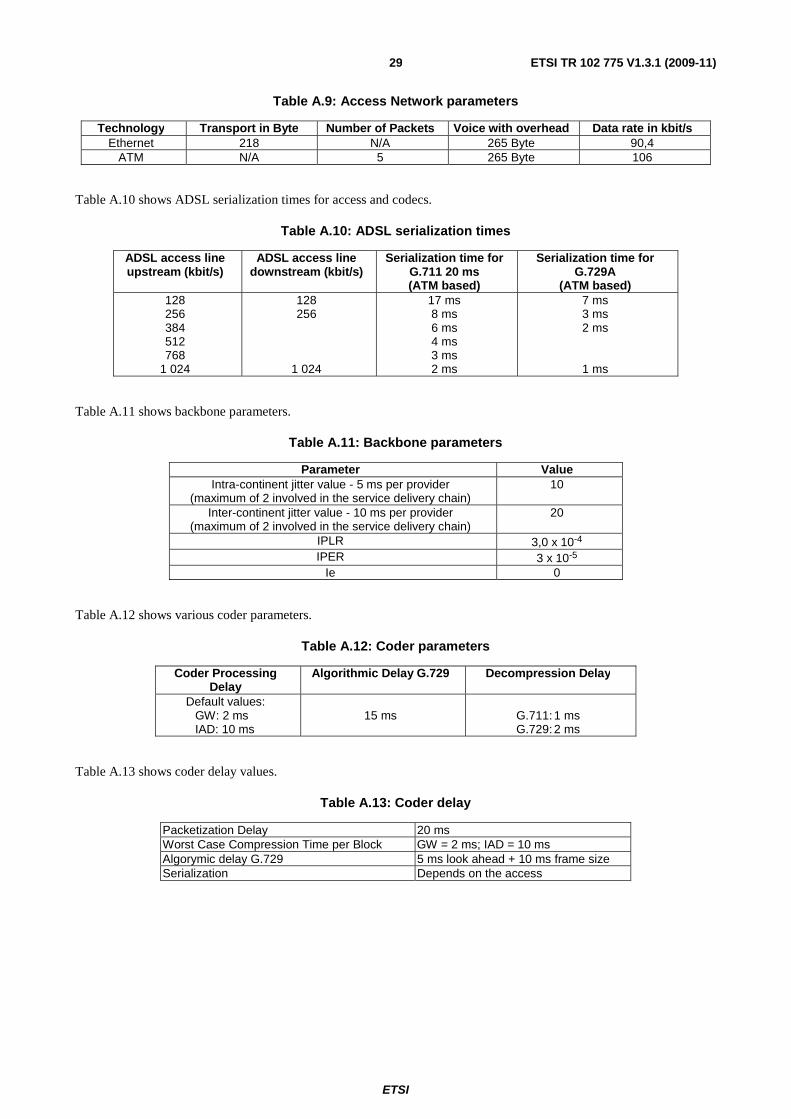
A.6.2 Network and Access Parameters Table A.8 shows the voice sample size for the transport network at the various instances in ms and bytes respectively.
Table A.9 shows access network parameters for different technologies.
NOTE: This values are examples, they can differ due to different settings of the DSL connections.
ETSI
ETSI TR 102 775 V1.3.1 (2009-11) 29
Table A.9: Access Network parameters
Technology Transport in Byte Number of Packets Voice with overhead Data rate in kbit/s Ethernet 218 N/A 265 Byte 90,4
ATM N/A 5 265 Byte 106
Table A.10 shows ADSL serialization times for access and codecs.
Table A.10: ADSL serialization times
ADSL access line upstream (kbit/s)
ADSL access line downstream (kbit/s)
Serialization time for G.711 20 ms (ATM based)
Serialization time for G.729A
(ATM based) 128 256 384 512 768
1 024
128 256
1 024
17 ms 8 ms 6 ms 4 ms 3 ms 2 ms
7 ms 3 ms 2 ms
1 ms
Table A.11 shows backbone parameters.
Table A.11: Backbone parameters
Parameter Value Intra-continent jitter value - 5 ms per provider
(maximum of 2 involved in the service delivery chain) 10
Inter-continent jitter value - 10 ms per provider (maximum of 2 involved in the service delivery chain)
20
IPLR 3,0 x 10⁻⁴ IPER 3 x 10⁻⁵
Ie 0
Table A.12 shows various coder parameters.
Table A.12: Coder parameters
Coder Processing Delay
Algorithmic Delay G.729 Decompression Delay
Default values: GW: 2 ms IAD: 10 ms
15 ms
G.711: 1 ms G.729: 2 ms
Table A.13 shows coder delay values.
Table A.13: Coder delay
Packetization Delay 20 ms Worst Case Compression Time per Block GW = 2 ms; IAD = 10 ms Algorymic delay G.729 5 ms look ahead + 10 ms frame size Serialization Depends on the access
ETSI
ETSI TR 102 775 V1.3.1 (2009-11) 30
Table A.14 shows decoder delay values.
Table A.14: Decoder delay
Decompression time per block 1 ms G.711, 2 ms G.729 Serialization time Depends on the access De-jitter Buffer Size Min Buffering delay caused due to download
1 x Serial. time data packet (1 500 Byte)
De-jitter Buffer Size Max Buffering delay caused due to download 1 x Serial. time data packet (1 500 Byte)
Play out buffer Size Min 1 time data packet (1 500 Byte) Play out buffer Size Max 1,5 time data packet (1 500 Byte) + voice serial
time De-jitter buffer delay 0,5 time de-jitter buffer size
A.6.3 Delay and Jitter Values
A.6.3.1 Delay and Serialization time
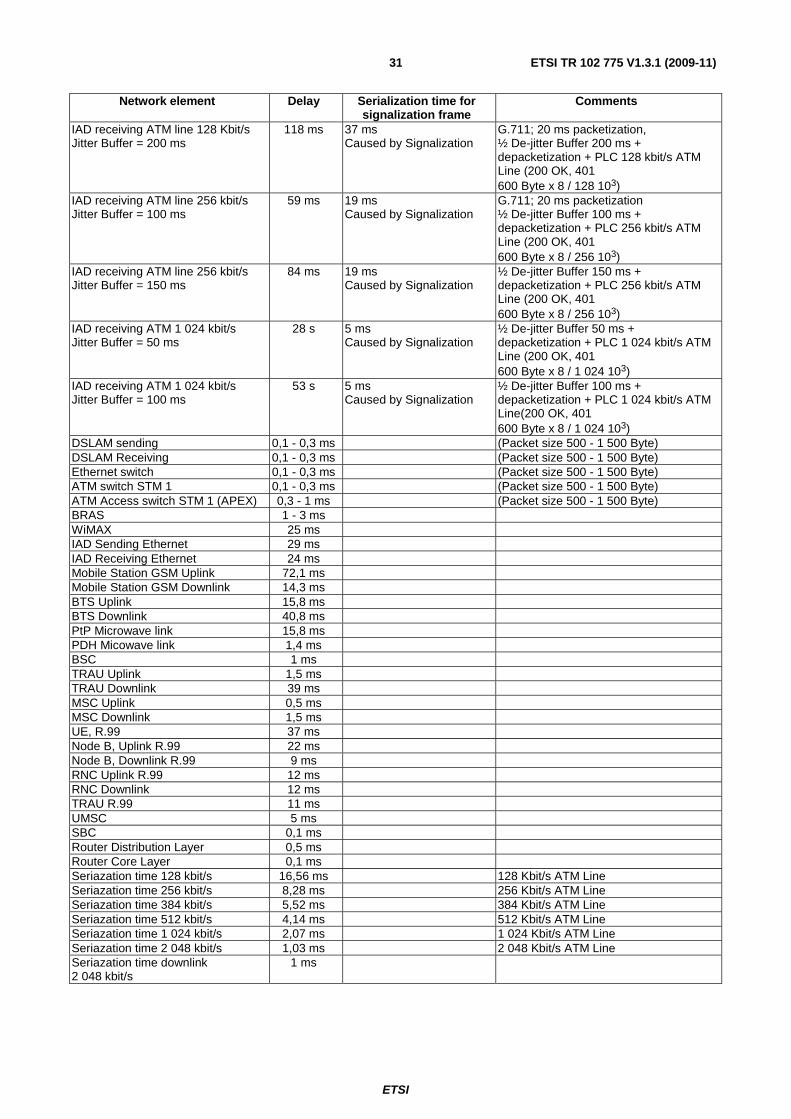
Table A.15 shows delay values or respective ranges for various network elements and signalization frames.
The serialization times of signalling packets produce delay variation for media packets, even if no other traffic (e.g. data traffic is present).
Table A.15: Network element delay and Serialization time for signalization frame
Network element Delay Serialization time for signalization frame
Comments
Legacy network switch 0,45 s 0 MGW Sending 22 ms 0 G.711; 20 ms packetization; STM 1 MGW Receiving 26 ms 0 ½ De-jitter Buffer 50 ms +
Depacketization + PLC; STM 1 ADM 0,1 ms 0 Transmission fiber optic 5 μs/km 0 IAD Sending ATM line 128 kbit/s 47 ms 50 - 94 ms
Caused by Signalization G.711; 20 ms packetization, 128 kbit/s ATM Line (reInvite 1 500 Byte x 8 / 128 103 = 94 ms; Registration 800 Byte 50 ms)
IAD Sending ATM line 256 kbit/s 38 ms 25 - 46 ms Caused by Signalization
G.711; 20 ms packetization, 256 kbit/s ATM Line (reInvite 1 500 Byte x 8 / 256 103 = 46 ms; Registration 800 Byte 25 ms)
IAD Sending ATM line 384 kbit/s 36 ms 17 - 31 ms Caused by Signalization
G.711; 20 ms packetization, 384 kbit/s ATM Line (reInvite, 1 500 Byte x 8 / 384 103 = 31 ms; Registration 800 Byte)
IAD Sending ATM line 512 kbit/s 34 ms 13 - 23 ms Caused by Signalization
G.711; 20 ms packetization, 512 Kbit/s ATM Line (reInvite 1 500 Byte x 8 / 512 103 = 23 ms; Registration 800 Byte = 13 ms)
IAD Sending ATM line 768 kbit/s 33 ms 8 - 15 ms Caused by Signalization
G.711; 20 ms packetization, 768 Kbit/s ATM Line (reInvite 1 500 Byte x 8 / 768 103 = 15 ms; Registration 800 Byte = 8 ms)
IAD receiving ATM line 128 Kbit/s Jitter Buffer = 150 ms
93 ms 37 ms Caused by Signalization
G.711; 20 ms packetization, ½ De-jitter Buffer 150 ms + depacketization + PLC 128 kbit/s ATM Line (200 OK, 401 600 Byte x 8 / 128 103)
ETSI
ETSI TR 102 775 V1.3.1 (2009-11) 31
Network element Delay Serialization time for signalization frame
Comments
IAD receiving ATM line 128 Kbit/s Jitter Buffer = 200 ms
118 ms 37 ms Caused by Signalization
G.711; 20 ms packetization, ½ De-jitter Buffer 200 ms + depacketization + PLC 128 kbit/s ATM Line (200 OK, 401 600 Byte x 8 / 128 103)
IAD receiving ATM line 256 kbit/s Jitter Buffer = 100 ms
59 ms 19 ms Caused by Signalization
G.711; 20 ms packetization ½ De-jitter Buffer 100 ms + depacketization + PLC 256 kbit/s ATM Line (200 OK, 401 600 Byte x 8 / 256 103)
IAD receiving ATM line 256 kbit/s Jitter Buffer = 150 ms
84 ms 19 ms Caused by Signalization
½ De-jitter Buffer 150 ms + depacketization + PLC 256 kbit/s ATM Line (200 OK, 401 600 Byte x 8 / 256 103)
IAD receiving ATM 1 024 kbit/s Jitter Buffer = 50 ms
28 s 5 ms Caused by Signalization
½ De-jitter Buffer 50 ms + depacketization + PLC 1 024 kbit/s ATM Line (200 OK, 401 600 Byte x 8 / 1 024 103)
IAD receiving ATM 1 024 kbit/s Jitter Buffer = 100 ms
53 s 5 ms Caused by Signalization
½ De-jitter Buffer 100 ms + depacketization + PLC 1 024 kbit/s ATM Line(200 OK, 401 600 Byte x 8 / 1 024 103)
DSLAM sending 0,1 - 0,3 ms (Packet size 500 - 1 500 Byte) DSLAM Receiving 0,1 - 0,3 ms (Packet size 500 - 1 500 Byte) Ethernet switch 0,1 - 0,3 ms (Packet size 500 - 1 500 Byte) ATM switch STM 1 0,1 - 0,3 ms (Packet size 500 - 1 500 Byte) ATM Access switch STM 1 (APEX) 0,3 - 1 ms (Packet size 500 - 1 500 Byte) BRAS 1 - 3 ms WiMAX 25 ms IAD Sending Ethernet 29 ms IAD Receiving Ethernet 24 ms Mobile Station GSM Uplink 72,1 ms Mobile Station GSM Downlink 14,3 ms BTS Uplink 15,8 ms BTS Downlink 40,8 ms PtP Microwave link 15,8 ms PDH Micowave link 1,4 ms BSC 1 ms TRAU Uplink 1,5 ms TRAU Downlink 39 ms MSC Uplink 0,5 ms MSC Downlink 1,5 ms UE, R.99 37 ms Node B, Uplink R.99 22 ms Node B, Downlink R.99 9 ms RNC Uplink R.99 12 ms RNC Downlink 12 ms TRAU R.99 11 ms UMSC 5 ms SBC 0,1 ms Router Distribution Layer 0,5 ms Router Core Layer 0,1 ms Seriazation time 128 kbit/s 16,56 ms 128 Kbit/s ATM Line Seriazation time 256 kbit/s 8,28 ms 256 Kbit/s ATM Line Seriazation time 384 kbit/s 5,52 ms 384 Kbit/s ATM Line Seriazation time 512 kbit/s 4,14 ms 512 Kbit/s ATM Line Seriazation time 1 024 kbit/s 2,07 ms 1 024 Kbit/s ATM Line Seriazation time 2 048 kbit/s 1,03 ms 2 048 Kbit/s ATM Line Seriazation time downlink 2 048 kbit/s
1 ms
ETSI
ETSI TR 102 775 V1.3.1 (2009-11) 32
Network element Delay Serialization time for signalization frame
Comments
Digital transit exchange digital-digital 0,45 ms Digital local exchange analogue-analogue 1,5 ms Digital local exchange, analogue subscriber line-digital junction
0,975 ms
Digital local exchange, digital subscriber line-digital junction
0,825 ms
Echo cancellers 0,5 ms
A.6.3.2 Queuing and Buffering Delay
After the compressed voice payload is built, a header is added and the frame is queued for transmission on the network connection. Voice needs to have strict priority in the router/gateway. Therefore, a voice frame should only wait for either one or several data frames that already plays out (depending on the implementation of the prioritization algorithm, or for other voice frames ahead of it. Essentially the voice frame waits for the serialization delay of any preceding frames in the output queue. Queuing delay (ßn) is a variable delay and is dependent on the trunk speed and
the state of the queue. There are random elements associated with the queuing delay.
tD-max = (Maximum # Data MTU bytes + 48 overhead) / (link speed kbps / 8).
Total core network maximum data MTU queuing time is: = tQ-wo * (number of hops -1).
Table A.16 shows queuing and buffering delay values caused by different configurations based on the "worst case" assumption that either several voice terminals are connected or that voice and video services are operated at the same time.
Table A.16: Queuing and Buffering Delay
Network element Max Queuing/ Buffering
Delay tD max
Queuing / Buffering delay caused due to interaction
with data traffic (see note 1)
IAD sending ATM G.711; 128 Kbit/s ATM Line
94 ms
158 ms
IAD sending ATM G.729; 128 Kbit/s ATM Line
94 ms
148 ms
IAD sending ATM G.711; 256 Kbit/s ATM Line
47 ms
79 ms
IAD sending ATM G.729A; 256 Kbit/s ATM Line
48 ms
79 ms
IAD sending ATM G.711; 384 Kbit/s ATM Line
31 ms
53 ms
IAD receiving ATM G.711; 128 Kbit/s ATM Line
37 ms
IAD receiving ATM G.711; 256 Kbit/s ATM Line
19 ms
IAD receiving ATM G.711; 1 024 Kbit/s ATM Line
5 ms
NOTE 1: 1,5 x Serial. time data packet (1 500 Byte) + voice serial time. NOTE 2: Serialization time for data frame caused by Signalization in regularly
time distance (e.g. every 60 s).
ETSI
ETSI TR 102 775 V1.3.1 (2009-11) 33
TE TEIAD IAD
variable outputqueuing delay
variable de-jitterbuffer delay
Legend
Core-Router
DL-Router
STM 1 STM 1 STM 1 STM 1
variable outputqueuing delay
variable outputqueuing delay
variable outputqueuing delay
variable outputqueuing delay
variable outputqueuing delay
Figure A.1: Variable Delay and the De-Jitter Buffer Reference Diagram
From a de-jitter buffer point of view, it has to adapt to the maximum end-to-end delay variation (green curve in figure A.2 shows possible end-to-end audio delay variation, the steps are due to de-jitter buffer adaption to delay variation).
a) Playout buffer:
In the playout buffer are usually 1, 2 or more packets. In the playout buffer, no prioritisation exists. A packet in the playout buffer has to be sent first, even if it is a low priority packet and a strict priority packet is waiting.
NOTE: The de-jitter buffer should compensate the time which is needed that the packets lives the playout buffer.
Figure A.2: Maximum Delay Variation
Realtime Traffic
Class 1 Traffic
Class 2 Traffic
Class 3 Traffic
Output Buffers
Playout Buffer
strict priority
different priorities
Line
Figure A.3: Playout Buffer
ETSI
ETSI TR 102 775 V1.3.1 (2009-11) 34
Media Output
Service #1
De-jitter Buffer
different services
Line
Realtime Traffic
Service #2
Service #3
Figure A.4: De-jitter Buffer
b) De-jitter buffer:
The initial playout delay of the de-jitter buffer is configurable in most implementations. The maximum depth of the buffer before it overflows is normally set to 1,5 or 2,0 times this value.
A.6.3.3 Delay and Jitter Values for PSTN/ISDN classic access
Table A.17 shows end-to-end delay values between service provider premises.
Table A.17: One way delay values between originating and terminating Service Provider premises
Digital local exchange, analogue subscriber line-digital junction
Transit Exchange
MGW Echo cancellers Summ
Sending 0,975 ms 0,45 ms 22 ms 0. 5 ms 24 ms (39 ms G.729)
Receiving 50 ms De-jitter Buffer
0,975 ms 0,45 ms 26 ms 0,5 ms 28 ms
Receiving 80 ms De-Jitter Buffer
0,975 ms 0,45 ms 36 ms 0,5 ms 38 ms
Receiving 100 ms De-Jitter Buffer
0,975 ms 0,45 51 ms 0,5 ms 53 ms
Receiving 150 ms De-Jitter Buffer
0,975 ms 0,45 76 ms 0,5 ms 78 ms
A.6.3.4 Delay and Jitter Values for NGN PSTN/ISDN access
Table A.18 shows end-to-end delay values between service provider premises with NGN PSTN/ISDN access.
Table A.19 shows the End-to-End delay values between PSTN/ISDN users for different De-jitter Buffer values.
Table A.18: One way delay values between originating and terminating Service Provider premises with NGN PSTN/ISDN access
Digital local exchange, analogue subscriber line-digital junction
MGW Echo cancellers Summ
Sending 0,975 ms 22 ms 0. 5 ms 23 ms
(38 ms G.729) Receiving 50 ms De- Jitter Buffer 0,975 ms 26 ms 0,5 ms 27 ms
Receiving 100 ms De-Jitter Buffer 0,975 ms 51 ms 0,5 ms 52 ms
Receiving 150 ms De-Jitter Buffer 0,975 ms 76 ms 0,5 ms 77 ms
ETSI
ETSI TR 102 775 V1.3.1 (2009-11) 35
Table A.19: End-to-End delay values between PSTN/ISDN users for different De-jitter Buffer values
PSTN/ISDN PSTN/ISDN- NGN De-jitter Buffer 50 ms PSTN/ISDN 52 51
A.6.3.5 Delay and Jitter Values for Symmetric Access DSL (128 kbit/s)
Table A.20 shows the one way delay between originating and terminating Service Provider premises for ADSL line 128 kbit/s uplink; 128 kbit/s downlink G.729A.
Table A.21 shows the one way delay between originating and terminating Service Provider premises for ADSL line 128 kbit/s uplink; 128 kbit/s downlink G.711.
Table A.22 shows the De-jitter buffer values for DSL line 128 kbit/s uplink; 128 kbit/s downlink, for more registered terminals without additional data traffic.
Table A.23 shows the End-to-End Delay between DSL line 128 kbit/s uplink; 128 kbit/s downlink and POTS/ISDN for G.729A without regional propagation delay.
Table A.20: Delay for DSL line 128 kbit/s uplink; 128 kbit/s downlink G.711 for more registrated terminals
IAD DSLAM ETH ADM BRAS Sum
Sending 47 ms 0,3 ms
(see note) 0,6 ms 0,4 ms 3 ms 51 ms
Receiving
68 ms (100 ms JB)
0,3 ms
0,6 ms
0,4 ms
3 ms
72 ms
Receiving
93 ms (150 ms JB)
0,3 ms
0,6 ms
0,4 ms
3 ms
97 ms
Receiving 118 ms
(200 ms JB)
0,3 ms
0,6 ms
0,4 ms
3 ms
122 ms NOTE: In case of interleaving, the additional delay should be added.
Table A.21: Delay for DSL line 128 kbit/s uplink; 128 kbit/s downlink G.729A for more registrated terminals
IAD DSLAM ETH ADM BRAS Sum
Sending 52 ms 0,3 ms
(see note) 0,6 ms 0,4 ms 3 ms 56 ms
Receiving 59 ms
(100 ms JB) 0,3 ms 0,6 ms 0,4 ms 3 ms 63 ms
Receiving 84 ms
(150 ms JB) 0,3 ms 0,6 ms 0,4 ms 3 ms 88 ms
Receiving 109 ms (200 ms JB) 0,3 ms 0,6 ms 0,4 ms 3 ms 113 ms
NOTE: In case of interleaving, the additional delay should be added.
ETSI
ETSI TR 102 775 V1.3.1 (2009-11) 36
Table A.22: De-jitter buffer values for DSL line 128 kbit/s uplink; 128 kbit/s downlink, for more registrated terminals without additional data traffic
Access Sending 94 ms (149 ms - G.729) Receiving 37 ms De-jitter buffer
POTS- DSL: 94 ms DSL-> DSL: 131 ms De-jitter buffer Max: POTS- DSL: 149 ms DSL-> DSL: 186 ms
Table A.23: End-to-End delay for DSL line 128 kbit/s uplink; 128 kbit/s downlink G.729 - worst case scenario (JB POTS/ DSL 150 ms, DSL-DSL 200 ms) and best case scenario
A.6.3.6 Delay and Jitter Values for Symmetric Access DSL (256 kbit/s)
Table A.24 shows the one way delay between originating and terminating Service Provider premises for ADSL line 256 kbit/s uplink; 256 kbit/s downlink G.711.
Table A.25 shows the one way delay between originating and terminating Service Provider premises for ADSL line 256 kbit/s uplink; 256 kbit/s downlink G.726/40/20.
Table A.26 shows the one way delay between originating and terminating Service Provider premises for ADSL line 256 kbit/s uplink; 256 kbit/s downlink G.729A.
Table A.27 shows the De-jitter buffer values for DSL line 256 kbit/s uplink; 256 kbit/s downlink.
Table A.28 shows the End-to-End delay ms Delay between DSL line 256 kbit/s uplink; 256 kbit/s downlink and PSTN/ISDN for G.711 without regional propagation delay.
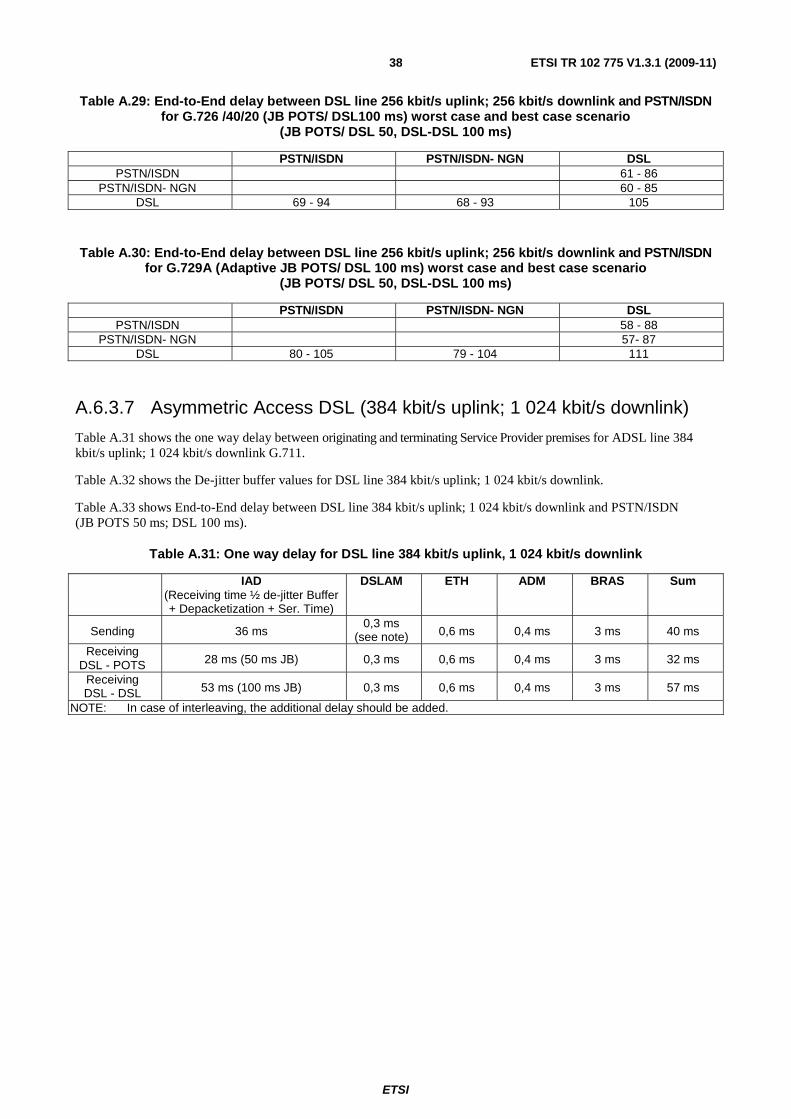
Table A.29 shows the End-to-End delay ms Delay between DSL line 256 kbit/s uplink; 256 kbit/s downlink and PSTN/ISDN for G.726/40/20 without regional propagation delay.
Table A.30 shows the End-to-End delay between DSL line 256 kbit/s uplink; 256 kbit/s downlink and PSTN/ISDN for G.729A (Adaptive JB POTS/ DSL 100 ms) without regional propagation delay.
Table A.31 shows the End-to-End delay between DSL line 256 kbit/s uplink; 256 kbit/s downlink and PSTN/ISDN for G.729A (Adaptive JB POTS 80 ms / DSL 100 ms) without regional propagation delay.
Table A.24: One way delay for DSL line 256 kbit/s uplink; 256 kbit/s downlink G.711
IAD DSLAM ETH ADM BRAS Sum
Sending 38 ms 0,3 ms
(see note 2) 0,6 ms 0,4 ms 3 ms 42 ms
Receiving 34 ms
(50 ms JB) 0,3 ms 0,6 ms 0,4 ms 3 ms 38 ms
Receiving 59 ms
(100 ms JB) 0,3 ms 0,6 ms 0,4 ms 3 ms 63 ms
NOTE 1: In the playout buffer 1, 2 or more packets. In the playout buffer, no prioritisation exists. A packet in the playout buffer has to be sent first, even if it is a low priority packet and a strict priority packet is waiting.
NOTE 2: In case of interleaving, the additional delay should be added.
ETSI
ETSI TR 102 775 V1.3.1 (2009-11) 37
Table A.25: One way delay for DSL line 256 kbit/s uplink; 256 downlink; G.726 /40/20
IAD DSLAM ETH ADM BRAS Sum
Sending 37 ms 0,3 ms
(see note 2) 0,6 ms 0,4 ms 3 ms 41 ms
Receiving 33 ms
(50 ms JB) 0,3 ms 0,6 ms 0,4 ms 3 ms 37 ms
Receiving 59 ms
(100 ms JB) 0,3 ms 0,6 ms 0,4 ms 3 ms 62 ms
NOTE 1: In the playout buffer 1, 2 or more packets. In the playout buffer, no prioritisation exists. A packet in the playout buffer has to be sent first, even if it is a low priority packet and a strict priority packet is waiting.
NOTE 2: In case of interleaving, the additional delay should be added.
Table A.26: One way delay for DSL line 256 kbit/s uplink; 256 downlink; G.729A
IAD DSLAM ETH ADM BRAS Sum
Sending 48 ms 0,3 ms
(see note 2) 0,6 ms 0,4 ms 3 ms 52 ms
Receiving 30 ms
(50 ms JB) 0,3 ms 0,6 ms 0,4 ms 3 ms 34 ms
Receiving DSL - DSL
55 ms (100 ms JB) 0,3 ms 0,6 ms 0,4 ms 3 ms 59 ms
Receiving DSL - DSL
85 ms (150 ms JB) 0,3 ms 0,6 ms 0,4 ms 3 ms 89 ms
NOTE 1: In the playout buffer 1, 2 or more packets. In the playout buffer, no prioritisation exists. A packet in the playout buffer has to be sent first, even if it is a low priority packet and a strict priority packet is waiting.
NOTE 2: In case of interleaving, the additional delay should be added.
Table A.27: De-jitter buffer values for DSL line 256 kbit/s uplink; 256 kbit/s downlink
Access Sending 47 ms (79 ms) Receiving 19 ms De-jitter buffer
DSL->POTS: 47 ms DSL->DSL: 62 ms De-jitter buffer Max: DSL->POTS: 79 ms DSL->DSL: 98 ms
Table A.28: End -to - End delay between DSL line 256 kbit/s uplink; 256 kbit/s downlink and PSTN/ISDN for G.711 (JB POTS/DSL 100 ms) worst case and best case scenario
(JB POTS/ DSL 50, DSL-DSL 100 ms)
PSTN/ISDN PSTN/ISDN- NGN DSL PSTN/ISDN 62 - 87
PSTN/ISDN- NGN 61 - 86 DSL 70 - 95 69 - 94 111
ETSI
ETSI TR 102 775 V1.3.1 (2009-11) 38
Table A.29: End-to-End delay between DSL line 256 kbit/s uplink; 256 kbit/s downlink and PSTN/ISDN for G.726 /40/20 (JB POTS/ DSL100 ms) worst case and best case scenario
(JB POTS/ DSL 50, DSL-DSL 100 ms)
PSTN/ISDN PSTN/ISDN- NGN DSL PSTN/ISDN 61 - 86
PSTN/ISDN- NGN 60 - 85 DSL 69 - 94 68 - 93 105
Table A.30: End-to-End delay between DSL line 256 kbit/s uplink; 256 kbit/s downlink and PSTN/ISDN for G.729A (Adaptive JB POTS/ DSL 100 ms) worst case and best case scenario
Table A.31 shows the one way delay between originating and terminating Service Provider premises for ADSL line 384 kbit/s uplink; 1 024 kbit/s downlink G.711.
Table A.32 shows the De-jitter buffer values for DSL line 384 kbit/s uplink; 1 024 kbit/s downlink.
Table A.33 shows End-to-End delay between DSL line 384 kbit/s uplink; 1 024 kbit/s downlink and PSTN/ISDN (JB POTS 50 ms; DSL 100 ms).
Table A.31: One way delay for DSL line 384 kbit/s uplink, 1 024 kbit/s downlink
IAD DSLAM ETH ADM BRAS Sum (Receiving time ½ de-jitter Buffer
+ Depacketization + Ser. Time)
Sending 36 ms 0,3 ms
(see note) 0,6 ms 0,4 ms 3 ms 40 ms
Receiving DSL - POTS 28 ms (50 ms JB) 0,3 ms 0,6 ms 0,4 ms 3 ms 32 ms
Receiving DSL - DSL 53 ms (100 ms JB) 0,3 ms 0,6 ms 0,4 ms 3 ms 57 ms
NOTE: In case of interleaving, the additional delay should be added.
ETSI
ETSI TR 102 775 V1.3.1 (2009-11) 39
Table A.32: De-jitter buffer value for DSL line 384 kbit/s uplink, 1 024 kbit/s downlink
Access Sending 31 ms (53 ms) Receiving 5 ms De-jitter:
DSL - > POTS: 31 ms DSL-> DSL: 36 ms De-jitter Max.: DSL - > POTS: 53 ms DSL-> DSL: 58 ms
Table A.33: End-to-End delay between DSL line 384 kbit/s uplink; 1 024 kbit/s downlink and PSTN/ISDN (JB POTS 50 ms; DSL 100 ms) worst case and best case scenario


![CTIA Speech Performance Recommendations...[2] ETSI TS 103 106, v1.3.1 (2014-04) Speech and multimedia Transmission Quality (STQ): Speech quality performance in the presence of background](https://static.documents.pub/doc/80x56/5e89ff273514a836a875440b/ctia-speech-performance-recommendations-2-etsi-ts-103-106-v131-2014-04.jpg)
