University of Vermont ScholarWorks @ UVM Graduate College Dissertations and eses Dissertations and eses 2009 Trace Metals in Peabody Pond and Jordon Pond: a Case Study of New England’s Historic Landscape Change in the Former Mill Ponds of the Scituate Reservoir Watershed, Rhode Island Emily Harrison University of Vermont Follow this and additional works at: hps://scholarworks.uvm.edu/graddis is esis is brought to you for free and open access by the Dissertations and eses at ScholarWorks @ UVM. It has been accepted for inclusion in Graduate College Dissertations and eses by an authorized administrator of ScholarWorks @ UVM. For more information, please contact [email protected]. Recommended Citation Harrison, Emily, "Trace Metals in Peabody Pond and Jordon Pond: a Case Study of New England’s Historic Landscape Change in the Former Mill Ponds of the Scituate Reservoir Watershed, Rhode Island" (2009). Graduate College Dissertations and eses. 103. hps://scholarworks.uvm.edu/graddis/103
Transcript
University of VermontScholarWorks @ UVM
Graduate College Dissertations and Theses Dissertations and Theses
2009
Trace Metals in Peabody Pond and Jordon Pond: aCase Study of New England’s Historic LandscapeChange in the Former Mill Ponds of the ScituateReservoir Watershed, Rhode IslandEmily HarrisonUniversity of Vermont
Follow this and additional works at: https://scholarworks.uvm.edu/graddis
This Thesis is brought to you for free and open access by the Dissertations and Theses at ScholarWorks @ UVM. It has been accepted for inclusion inGraduate College Dissertations and Theses by an authorized administrator of ScholarWorks @ UVM. For more information, please [email protected].
Recommended CitationHarrison, Emily, "Trace Metals in Peabody Pond and Jordon Pond: a Case Study of New England’s Historic Landscape Change in theFormer Mill Ponds of the Scituate Reservoir Watershed, Rhode Island" (2009). Graduate College Dissertations and Theses. 103.https://scholarworks.uvm.edu/graddis/103
TRACE METALS IN PEABODY POND AND JORDON POND: A CASE STUDY OF NEW ENGLAND’S HISTORIC LANDSCAPE CHANGE IN THE FORMER MILL
PONDS OF THE SCITUATE RESERVOIR WATERSHED, RHODE ISLAND
A Thesis Presented
by
Emily Harrison
to
The Faculty of the Graduate College
of
The University of Vermont
In Partial Fulfillment of the Requirements for the Degree of Master of Arts
Specializing in Geography
August, 2008
Accepted by the Faculty of the Graduate College, The University of Vermont, in partial hlfillment of the requirements for the degree of Master of Arts, specializing in Geography.
Thesis Examination Committee: . .
Advisor ~esley-Ann ~ u ~ i g h $ ~ f t o e x , Ph.D.
[,[,,,, -&, C
Cheryl ~orsehunkley , Ph.D. 9
/ j'$/~[ /!/ Chairperson Robert McCullough, Ph.D.
i 0
Vice President for Research and Dean of Graduate Studies
Date: August 1 1,2008
ABSTRACT
The North American landscape changed tremendously following the arrival of European settlers. Before European arrival, New England’s landscape was primarily forested. As Europeans moved inland from the eastern seaboard, they cleared the forest for settlement and agricultural use. Eventually the Industrial Revolution made a different kind of mark on the landscape. Starting in the late 1790s, the textile mill industry developed throughout the region. Mills were located along swift moving rivers, which later produced power when dams were created along them. Following the early 1900s mill production decreased, leading to the abandonment of many mills and their adjacent dammed mill ponds. However, the environmental changes wrought by the mill ponds still exist in New England’s landscape. Large volumes of fine sediment have since built up in some of these former mill ponds and concerns about the sediment and water quality have become widespread. Today many former textile mill rivers throughout the U.S and Europe have been tested in an attempt to determine current contamination levels and to apply appropriate strategies if necessary to reduce pollutants to acceptable levels. Little is known about water and sediment quality of the former mill ponds in Scituate, Rhode Island. This research sought to address this problem by conducting trace metal testing of two mill ponds in the Scituate River Watershed: Peabody Pond and Jordon Pond. Results revealed that both ponds contain pollutants from present and past sources, but that contemporary land use practices may be the most harmful to water and sediment quality. Existing mill metal piping left on the landscape and present-day motorways and urban runoff contain large quantities of suspended solids such as copper, lead and zinc with lead showing the highest concentration levels of all metals tested. This research demonstrates that our past landscape activities, specifically New England’s historic textile production, still influences present environmental conditions, and that as human activities on the landscape change, so do threats to environmental quality.
B
ACKNOWLEDGEMENTS
I am deeply appreciative to the University of Vermont, the Graduate College and
the Department of Geography for giving me the opportunity to complete this thesis
through a Graduate Teaching Fellowship. This thesis would not have been possible
without support and guidance from my advisor Lesley-Ann Dupigny-Giroux. Special
thanks is given to Richard Blodgett of the Providence Water Board for suggesting this
topic and allowing me the opportunity to research these ponds and allowing me access
within the watershed for an up close and personal view of the area. I would also like to
thank the Scituate Town Hall and Library for allowing me to use their facilities for
countless hours to access priceless historical data not found anywhere else. Additional
appreciation is given to Rob and Lenny from TG&B, an Environmental Consulting Firm
from Falmouth, Mass. Without their help I would not have been able to receive the
sediment results that were so critically needed for this paper. Lastly and most
importantly, I would like to thank my family and friends for their endless support and
encouragement over the past few years.
ii
TABLE OF CONTENTS
ACKNOWLEDGEMENTS ...…………………………………………………………….ii
LIST OF TABLES ...……………………………………………………………………...v
LIST OF FIGURES ...……………………………………………………………………vi
LITERATURE REVIEW ………………………………………………...………….…...1
North American Landscape Pre Europeans to Early European Arrival ……1
Landscape Change ………………………………………….…………………...3
Industrialization ...……………………………………………………………….4
Rhode Island History ……………………………………………………………6
Scituate, Rhode Island ……………………………………………………7
Clayville Village: Scituate, Rhode Island ………………………………...8
Mills and Mill Pond History …………...……………………………………...10
Dams …………………………………………………………………………….11 Contemporary Landscape Population Change in Southern New England ...14
Research on Non-Point Sources of Trace Metals ……...……………………..16
“Trace Metals in Peabody Pond and Jordon Pond: A Case Study of New England’s
Historic Landscape Change in the Former Mill Ponds of the Scituate Reservoir Watershed, Rhode Island”
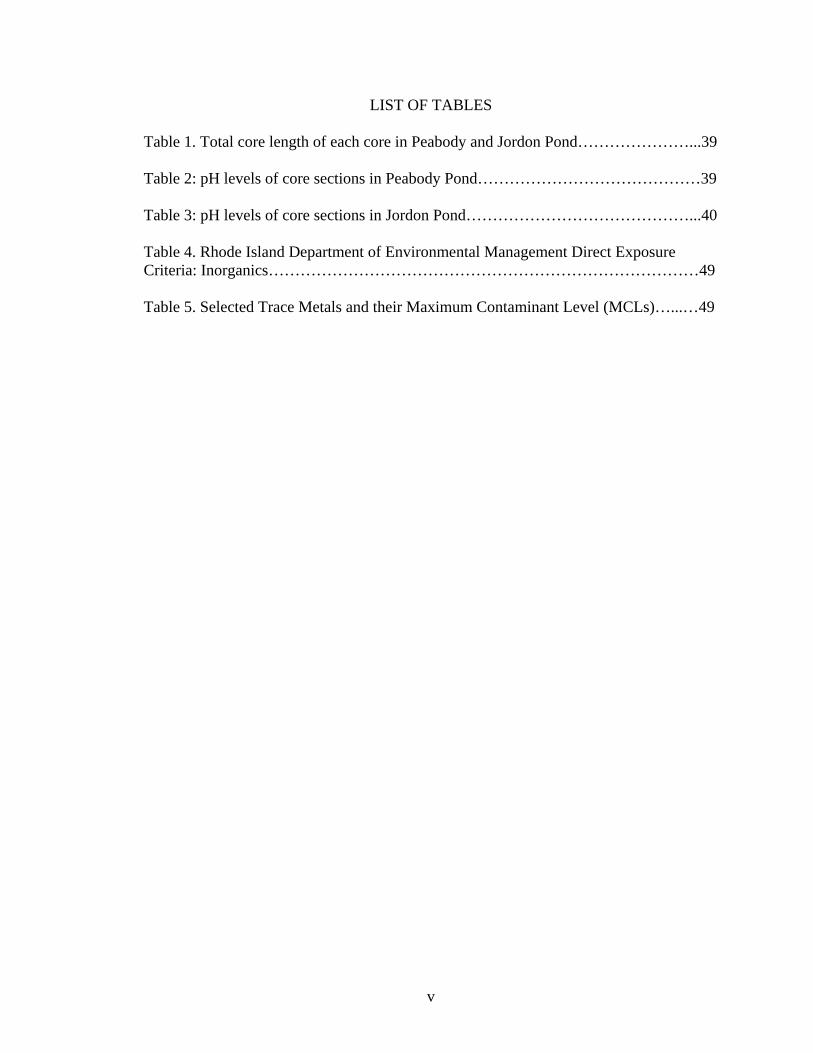
Table 1. Total core length of each core in Peabody and Jordon Pond…………………...39 Table 2: pH levels of core sections in Peabody Pond……………………………………39 Table 3: pH levels of core sections in Jordon Pond……………………………………...40
Table 4. Rhode Island Department of Environmental Management Direct Exposure Criteria: Inorganics………………………………………………………………………49 Table 5. Selected Trace Metals and their Maximum Contaminant Level (MCLs)…...…49
v
LIST OF FIGURES Figure 1. Map of Scituate, Rhode Island and the surrounding areas…………………….25 Figure 2. Ponaganset and Moswaniscut Rivers flowing through Scituate, Rhode
Island into Reservoir…………………………………………………………...26 Figure 3. Locations of mills and bodies of water in Scituate, 1870……………………...27 Figure 4. Survey map of Peabody Pond, 1917……………………………..………….....28 Figure 5. Annual summary of forest (a), housing (b), and water (c) square acreage and
square mileage (d) of total road coverage within Peabody Pond………………...34 Figure 6. Annual summary of forest (a), housing (b), and water (c) square acreage and
square mileage (d) of total road coverage within Jordon Pond………………….35 Figure 7. Black and white aerial composites of Jordon and Peabody Ponds from 1939 to
2004………………………………………….…………………………………...36 Figure 8. Black and white composites from 2003 showing the location of the cores taken
in Peabody Pond (a) and Jordon Pond (b)…….………………..………………..38 Figure 9. Analysis of trace metal counts (in ppm) of four cores extracted from Peabody
Pond……………………………………………………………………………...43 Figure 10. Analysis of trace metal counts (in ppm) of four cores extracted from Jordon
Pond..……………………………………………………...…………..…………44
vi
LITERATURE REVIEW
New England’s landscape has changed considerably over the past 500 years. Not
only has its forest cover shifted in both extent and composition over time, but activities
now long gone such as textile production, still influence current conditions such as water
quality. A review of the literature on historic landscape change in New England,
specifically on the built environment, as well as the release of polluting trace metals helps
to piece together the picture of past practices and contemporary water quality in the
Scituate River Watershed of Rhode Island. The first section of this literature review
discusses how New England’s landscape as a region changed over time through human
interference and then focuses in on the area of study of Scituate, Rhode Island. Secondly,
the literature review considers the different reasons for runoff trace metal pollutants and
why higher metal levels can be found in the environment today.
North American Landscape Pre Europeans to Early Arrival
Before embarking upon any type of research it is important to understand the
background context of the area of interest. The landscape of the Americas underwent
tremendous change when European settlers landed in what is now the United States.
Before European arrival, the landscape was modified by Native Americans who
selectively burned some forests which then became grasslands for hunting grounds
(Denevan, 1992). The pre-colonial landscape of New England was a patchwork of salt
1
marshes along the shore, dense forests, cleared areas in the forest, several vegetation
zones and a wide variety of mammals that were not seen in Europe (Cronon, 1983). Most
of the forestland in North America was located in the moist East and Northwest regions,
and at the time of European arrival had already been altered by Native American land-use
practices (Mann, 2002). Since natural and human disturbance was infrequent and local,
the pre-European landscapes including the coastal areas were predominantly forested and
open land habitats were uncommon (Foster and Motzkin, 2003).
At the contact period, native peoples lived in small villages throughout the
Northeast and especially along river valleys and the seacoast – some seasonally and some
year round (Braun and Braun, 1994). Each village was home to a group of related
families. They usually built their settlements in places favorable for farming and fishing.
Early European visitors remarked that the land was cleared for settlement all along the
southern coast, on the offshore islands and inland along the river valleys, ponds and lakes
(Braun and Braun, 1994). Unlike the Native Americans who used fire to clear the land of
underbrush in the forest, Europeans used fire for deforestation (Cronon, 1983). Although
European settlement began along the coast where the land was cleared, over time the
Europeans started moving inland, changing the landscape even further. Eventually the
predominant forest in the area disappeared due to clearing for land and vegetation use
developed by the Europeans (Foster and Motzkin, 2003). However, true historical data
are fragmentary and often times uncertain (Foster et. al., 2002) which makes an accurate
representation of the land (pre and early European settlement) hard to obtain. Land use
practices in the United States for pre-European settlements have been sparsely reported in
2
the literature. Much of the research on land-use history in New England comes from
David R. Foster (1999, 2002, 2003) at Harvard University. His work provides better
insight into vegetation and landscape change dating back to the 1700s.
houses, post offices and an electric railway system (Town of Scituate, 2004; Janis, 1985).
With the construction of the Scituate Reservoir and the subsequent closing and
demolition of Clayville mills, the village’s economy died and significant emigration
occurred. Between the years 1920 and 1930 a population decline of close to 1000 people
occurred (R.I. Census, 2000). In 1980 the R.I Historical Preservation Commission
recommended that the Clayville Historic District be placed on the National Registrar of
Historic Places, (Sarkesian, 1987) and by 1988 Clayville was added. Today Clayville
contains physical evidence of demolished mills and abandoned water systems, which are
important in understanding the former industrial economy of the village. The tranquility
of modern Clayville means it would be missed on the landscape by many passers-by
(Sabetta, 1989).
9
Mills and Mill Pond History
Although Scituate Reservoir is one of the most closely monitored bodies of clean
water in the state, the water and sediment quality of many tributaries of major rivers
along which mills had operated, has to date been neglected. The Providence Water Board
has begun to examine these old abandoned millponds located in the area to determine
whether any contamination persists in these locations. Peabody Pond, which is located
downstream of the Clayville Mills, is believed to have possible sediment contamination
built up behind the dam from the mill era, and in order to understand analytical findings,
one must take into account the types of the former mills in Clayville, prior to the region’s
condemnation for constructing the Scituate Reservoir.
The small water-powered cotton mill located at present day Jordon Pond gave
way to the comb-making factory of Joseph Whitaker and Moses Richardson in 1826. This
mill was then converted to rubber footwear production in 1847 and changed again to
cotton production in 1853 (R.I. Historic Preservation Commission, 1980). The mill
burned down that very year and was rebuilt in 1857 as a cotton mill. A second mill, the
Lower Clayville Mill, located downstream, was also built in 1857.
By 1863 the mills were bought by Lindsay Jordon, a manufacturer of printed
cloth. During the 1870s the Clayville Mills were sold to a Mr. Stephen Weeden who
manufactured cotton yarn, but by this time production had fallen sharply due to
insufficient water. The mills were then sold to the Joslin Manufacturing Company in
1906, which produced corset string and laces. However, by 1924 the mills of Clayville
10
were demolished. All that is left today of these mills are their foundations. These
historical transformations set the stage for quantifying present-day sediment contents.
Mill production grew steadily in the 1800s with the production of many different
textiles. However, following the early 1900s mill production decreased, leading to the
abandonment of many mills and their adjacent millponds. At present, many of these dams
along the mill ponds are eroding, which if not tended to quickly, will cause increasing
instability. In this scenario, a rainstorm with high enough intensity or volume could
potentially cause a given dam to fail, releasing its contents downstream.
Over time, large volumes of fine sediment have built up in some of these former
mill ponds, reducing water depths (Wood and Barker, 2000). Today, many former textile
mill rivers and mill ponds throughout the U.S. and Europe have been tested in an attempt
to determine current contamination levels, so that if necessary, appropriate strategies can
be implemented to reduce pollutants back to acceptable levels. The Providence Water
Board is beginning to analyze ponds within its purview to determine whether specific
ones display contaminated water and/or sediment.
Dams
Given that the primary use of the millponds has long since ended, a new concern
arises about the current water quality and long-term dependability of these ponds. This
new concern has sparked a debate about whether to remove these dams or try to repair
11
them. Many dams around existing millponds are past their designed lifespan and need to
either be taken down or repaired to acceptable safety standards.
Dam removal has been an issue throughout the United States for the past few
decades. Over 76,000 dams have been constructed on American rivers to provide services
such as flood protection, water storage, hydroelectric power and navigation (Pohl, 2002;
Graf, 1999; Born and Genskow, 1998). With an expected lifespan of only about 50 years
(Wade, 1999), many of these structures are deteriorating and expensive repairs are often
needed to ensure that the dams remain safe (Pollard and Reed, 2004). Governments and
dam owners face tough decisions regarding the repair or removal of these structures on a
regular basis (Born and Genskow, 1998).
Among the water quality problems associated with dams are the accumulation of
contaminants and shallowing due to rapid sedimentation (Born and Genskow, 1998).
Dam removal can potentially affect physical, chemical and biological components of the
ecosystem by releasing large volumes of sediment that have accumulated upstream of
many old dams. Following dam removal, downstream export of this sediment can affect
biogeochemical cycles as well as habitat use by various species (Bushaw et. al, 2002). An
example of this is the removal of the Fort Edwards Dam in New York, which released
several tons of contaminated sediment. At present, contaminated sediment has settled
over a 300km length of the Hudson River and the commercial fishing of striped bass and
other species is still banned due to the risk of bioaccumulation. Clean up effects continue
today (Pohl, 2002; Economist, 2000). As of 2008 the clean-up is still moving forward.
12
Wastes from pulp and paper mills that used bleach to whiten paper before being
dumped into the rivers and ponds were problematic not just in Rhode Island, but
throughout New England and the U.K. as well (Wigilius, 1988, Huber, 1988). During the
early to mid 20th century, rivers in New England were among the most polluted rivers in
the United States. Outbreaks of typhoid fever and other infectious diseases were common
in urban areas that used polluted rivers as a source of drinking water (Robinson, 2003).
As late as the 1960s more than 120 million gallons per day of wastewater were dumped
into the Merrimack River (in New Hampshire), and in the 1970s the Connecticut River
was so polluted it was referred to as a “landscape sewer” (Robinson, 2003).
Phosphorous levels were very high in these waters and sediment due to the use of
certain detergents containing chloride and nitrate. Arsenic levels at high concentrations
can be hazardous to human health. High arsenic levels caused by mill dumping and also
privately owned wells lined with bedrock have also been found throughout the United
States (Ayotte, 2003). Recently there has been an attempt to clean up contamination in
the ponds and the soil left from mills decades or even centuries ago. In June 2003, in
Twisp, Washington, the EPA removed 1,000 cubic yards of contaminated materials from
Alder millpond (Rees, 2003). This ore concentrating mill for copper and gold left high
contamination levels of arsenic, lead and other metals. EPA members for the Merrimack
River in New England have also made attempts at lowering the level of contamination by
banning the use of detergents used in these mills (Robinson, 2003).
There are many complex issues involved in determining whether dams should
remain on the landscape or be taken down. Dams interrupt connectivity between
13
upstream and downstream segments of streams creating barriers to fish migration,
inundating stream habitat and altering flow, temperature and sediment regimes (Pollard
and Reed, 2004; Smith et. al, 2000). The state of New Hampshire is institutionalizing the
option of dam removal for dams that are no longer serving their purpose and rapidly
deteriorating. For example, Lindloff (2003) studied the removal of the McGoldrick dam
that was built in 1828, around the same time as the Peabody Pond dam. The dam was
used to provide water for a canal and power generation for eight manufacturing facilities.
By 1950 McGoldrick dam was no longer needed to serve this particular service.
Testing of the low sediment accumulations showed that it was free of contamination. It
should be noted that the results for the McGoldrick dam should not be extrapolated to the
case of Peabody Pond due to the potential differences in the type and duration of mill
activity. McGoldrick might not have had any other type of mill upstream. Even though
many mill ponds in New England can be classified as contaminated due to mill and local
runoff, it is important to mention that not all water bodies on sediment associated with
mill activity are contaminated, as shown in the McGoldrick example.
Contemporary Landscape Population Change in Southern New England
The region classified as New England consists of 6 states: Maine, New
Hampshire, Vermont, Massachusetts, Rhode Island and Connecticut. As of 2000, the
census population of New England stood at 13,922,517. Southern New England contains
the states of Connecticut, Rhode Island and Massachusetts. As of the year 2000 the
population of the area comprised of 10,802,981 people, averaging just over 77.5% of the
14
total population of the area (U.S. Census Bureau & Statewide Planning, 2000). Over the
past century (1900-2000) the population of Southern New England has grown to
6,660,659, an increase of 181.9%.
In 1790, Rhode Island’s population was listed at 68,825 people with Scituate
having 2,315 people (U.S. Bureau of the Census, 2000). Throughout the next two
centuries, Scituate’s population rose steadily, reaching over 4500 people in 1850 before
declining during and after the Civil War to 3100 people by 1890. Over the next few
decades, however, during Scituate’s industrial boom, the population rose to almost 3500
people. By the 1930s, after the condemnation of all the mills, Scituate’s population
dropped to 2300 and has been rising slowly ever since. By the 1960s, Scituate’s
population reached 5200, and had jumped to over 8400 by the 1980s. In 2000, the U.S.
Bureau of the Census listed the population of Scituate as 10,324 people. This jump in one
town’s population can have effects on the contemporary environment due to
urban/suburban dumping and runoff of pollutants into nearby water bodies.
Over the past 50 years (1950-2000) the landscape of Rhode Island has been home
to the creation of new factories for goods and large buildings both for commercial and
residential use. Scituate on the other hand has taken a slightly different approach to the
change in its landscape. Residential growth has been noted, but few large or new
industrial or commercial buildings have been built. Growth has flourished in high
population centers. Though less industrial and commercial growth has occurred in the
center of Scituate, residential areas have grown. Population growth is a potential
contributor to the trace metals observed in pond sediment today.
15
Research on Non-Point Sources of Trace Metals
While dams create an issue of possible contamination due to sedimentation,
runoff is also a major contributor to water quality. Different types of runoff in an area can
create large problems depending on the source and content. Traffic, road construction and
road maintenance all combine to act as contributors to environmental pollutions (Legret
and Pagatto, 1999). Non-point sources that include runoff from agricultural, urban and
highway surfaces, and lawns and natural areas, account for 80 percent of the
contamination of waters in the United States. These eventually settle into the soil or
sediment (Infrastructure, 1999). Temporary pulses of pollution usually accompany road
work, while seasonal contaminants can be the result of road salt, and runoff contaminants
associated with vehicular exhaust, pavement and tire wear (Legret and Pagatto, 1999).
Storm water runoff mobilizes large quantities of contaminants from the urban
environment (Charlatchka and Cambier, 1997).
Motorway pavement runoff water contains a large quantity of suspended solids,
some of which are heavy metals. A previous study by Legret and Pagotto (1999)
discusses pollutant loadings in the runoff waters from a major rural highway. Although
road traffic and maintenance are not of the same magnitude in the Scituate study area as
in Legret and Pagotto’s study area, copper, lead and zinc were found in both.
This thesis focused on the ways in which copper, lead and zinc entered the
environment as a consequence of both historical mill activities and present day uses. In
16
order to understand the significance of these trace metals better, a short analysis of how
they are found in the environment is discussed below.
Copper (Cu) is a reddish metal that occurs naturally in rock, soil, sediment, water
and air. The average concentration in the earth’s crust is about 50 parts copper per million
parts soil (Environmental Bureau of Investigation - Copper, 2007). Copper can be
released into the environment by both natural sources and human activities. It can
become airborne through the burning of fossil fuels, along with windblown dust,
decaying vegetation, forest fires and sea spray (Lenntech, 2007). Once airborne, copper
can remain in suspension until it precipitates out onto soil and into water.
Zinc (Zn) is one of the most common elements in the earth’s crust and one of the
most commonly used metals in the world. Zinc can enter the air both from natural and
human occurrences. Most zinc enters the environment as the result of human activities
such as mining, purifying of zinc, lead and cadmium ores, steel production, coal burning
and burning of wastes (Environmental Bureau of Investigation - Zinc, 2007). Airborne
zinc is present mostly as fine dust particles that settle slowly by dry deposition (Eco-
USA, 1994) but much more quickly by wet processes (rain, snow).
Lead (Pb) is the most common contaminant in the soil, averaging between 15-50
parts lead per million parts soil. Contamination occurs at levels above 500 ppm. Lead
contamination results from scrap metal (lead pipes or old roofing pieces), auto exhaust
from leaded gas, fallout on roadsides and even old orchards due to lead arsenates that
were heavily used until World War II (Maine Soil Testing Service, 1998). Lead levels are
usually higher in cities, near roadways and industries that use lead as well as in the soil
17
near homes where lead paint flakes have fallen off (Yeager, 2007). The study area is
located near a moderately traveled roadway and is downstream from an abandoned mill
site with lots of metal piping left throughout the landscape.
These three trace metals are of importance to the current study, making it
imperative to outline their pathways through the environment including sediment. Over
50% of the total pollutant inputs for suspended solids, Polycyclic aromatic hydrocarbon
(PAH’s), Pb and Zn, in water bodies come from the highway (Hoffman, Latimer et. al,
1985). Wear and tear of vehicles, dropping of oil, grease, rust, hydrocarbons, rubber
particles and other solid materials on the highway surface are often washed off the
highways during rain and snow events (Infrastructure, 1999). Leaded gasoline was
banned in 1986, but lead is still being deposited on highway surfaces through paints used
on right of ways and atmospheric deposition in the environment (Charlatchka and
Cambier, 1997). Copper comes from brake linings, (Legret and Pagatto, 1999) and street
dust also often contain elevated concentrations of a range of toxic metals (Pb, Cd, Cu and
Zn) (Harrison et. al , 1981), which can wash into bodies of water and eventually settle to
the bottom.
A previous study by Koivo and Oravainen (1983) is concerned with the impacts
of industrial and municipal waste discharge within lakes. This study looks at how human
impact on the land affects the lakes. Although these were water samples and not
sediment, findings showed that zinc levels were consistently low throughout the study.
This literature review is intended to help set the stage for my thesis, which deals
with the analysis of sediment trace metals in an abandoned historic mill pond, as well as
18
understanding the nature of past and ongoing environmental damage to the area.
19
Trace Metals in Peabody Pond and Jordon Pond: A Case Study of New England’s Historic Landscape Change in the Former Mill Ponds of the Scituate Reservoir
Watershed, Rhode Island
Emily R. Harrison The University of Vermont, Burlington, VT
In preparation for submission to Applied Geography
20
ABSTRACT
Peabody and Jordon Ponds, abandoned industrial mill ponds within the Scituate Reservoir Watershed in Rhode Island were analyzed using sediment core analysis to determine whether the sediments within the ponds were contaminated with trace metals as a result of historic mill activities. Although high levels of lead were discovered in Jordon Pond, the source appears to be from contemporary road and development activities, rather than historic mill activities or other previous land use activities. This paper contributes to the limited literature on historic mill pond analysis, and to research on contemporary development-related environmental changes in New England.
21
INTRODUCTION
The landscape of New England is always changing. Soil and sediment analysis
can tell us a little about the pollution, if any, of a particular area over time. With the
arrival of Europeans, North America was transformed from being primarily forested
(1600s) to agriculture fields for crops and pasture (1700s), and to a landscape of textiles
production (1800s). Over time, the textile industry diminished and people moved away
abandoning the land. In the 20th century, people moved back and resettled the land,
turning it into a residential landscape. Landscape change over time has influenced the
quality of the contemporary environment. Both past and present lifestyles affect the
current landscape.
Historic mill pond analysis is a topic with few existing studies from which to
extract an understanding of the nature of past and ongoing environmental damage. Much
of the available literature is more focused on the residual effects of pulp and paper mills
on aquatic life in these bodies of water (Wood, et. al., 2001; Sepulveda, et. al, 2004;
Greenfield and Bart Jr., 2005), and less so on the textile mills of a century ago. Across
New England, the landscape is dotted with numerous mill ponds that have been
abandoned and no longer serve their original purpose (Wood and Barker, 2000). This
abandonment stems from changes in the landscape that have occurred over the past
several hundred years.
Mill ponds were typically constructed either by digging a small depression and
building retaining walls around it, or by building walls in an existing depression to hold
22
the water needed to run the mills (Wood and Barker, 2000). Depending on the function of
the mill water, either for cleaning raw materials, supplying steam for spinning processes
or for dying yarn or finished textiles, the water within the pond was normally clean
(Rees, 1997; Giles and Goodall, 1992). However, after running through the mills, the
water could be largely contaminated when released back into the environment (Giles and
Goodall, 1992; Wood and Barker, 2000).
In virtually all early industrial processes, water was critically important (Rees,
1997). The issue today is that no in-depth investigations have been performed on possible
sediment contamination in the existing millponds. Since the primary use of the mill ponds
is now obsolete, a new concern arises about the quality and dependability of these ponds.
Dams currently hold back sediment in these ponds, and with an expected lifespan of only
roughly 50 years (Wade, 1999), many of these structures are deteriorating and expensive
repairs are often needed to ensure dam integrity (Pollard and Reed, 2004). Among the
water quality problems associated with dams are the accumulation of contaminants and
shallowing due to rapid sedimentation (Born and Genskow, 1998). Downstream export of
this sediment following dam removal can affect biogeochemical cycles as well as habitat
use by various species (Bushaw et. al, 2002).
In the town of Scituate, Rhode Island, potential dam removal along existing mill
ponds has sparked a debate over a series of sediment and water quality issues should the
water and sediment be released downstream into the Scituate Reservoir. This is of
particular interest because half the state of Rhode Island depends on the reservoir for
clean water. The Providence Water Board, which oversees the construction and
23
preservation of the Scituate Reservoir, has expressed strong sentiments about dam
preservation in the Scituate watershed. Watersheds serve as migratory stops, pathways
and permanent residences for wildlife (Economist, 2000). The Providence Water Board is
also very concerned about the potential effects that dam removal and the subsequent
releasing of the sediment could have on the reservoir over time.
Thus, the primary goal of this research is to analyze sediment cores in two mill
ponds in Scituate, Rhode Island (Jordon Pond and Peabody Pond) to better understand the
relationship between the present day content and the wastes that were dumped there over
a century ago. The three research questions posed were:
• What are the present-day sediment contents within Peabody and Jordon Ponds?
• Does historic mill activity pose more of an environmental threat today than we
might think?
• What implications does Peabody and Jordon Pond’s sediment content have for the
future of the dams, mill ponds and the quality of the Scituate Reservoir?
Study Area
This paper focuses on the town of Scituate, Rhode Island, which is located in
Providence County and the Scituate Reservoir which it encompasses. The adjacent town
of Foster, also located in Providence County has been included for completeness as
shown in Figure 1.
24
Figure 1: Map of Scituate, Rhode Island and the surrounding areas
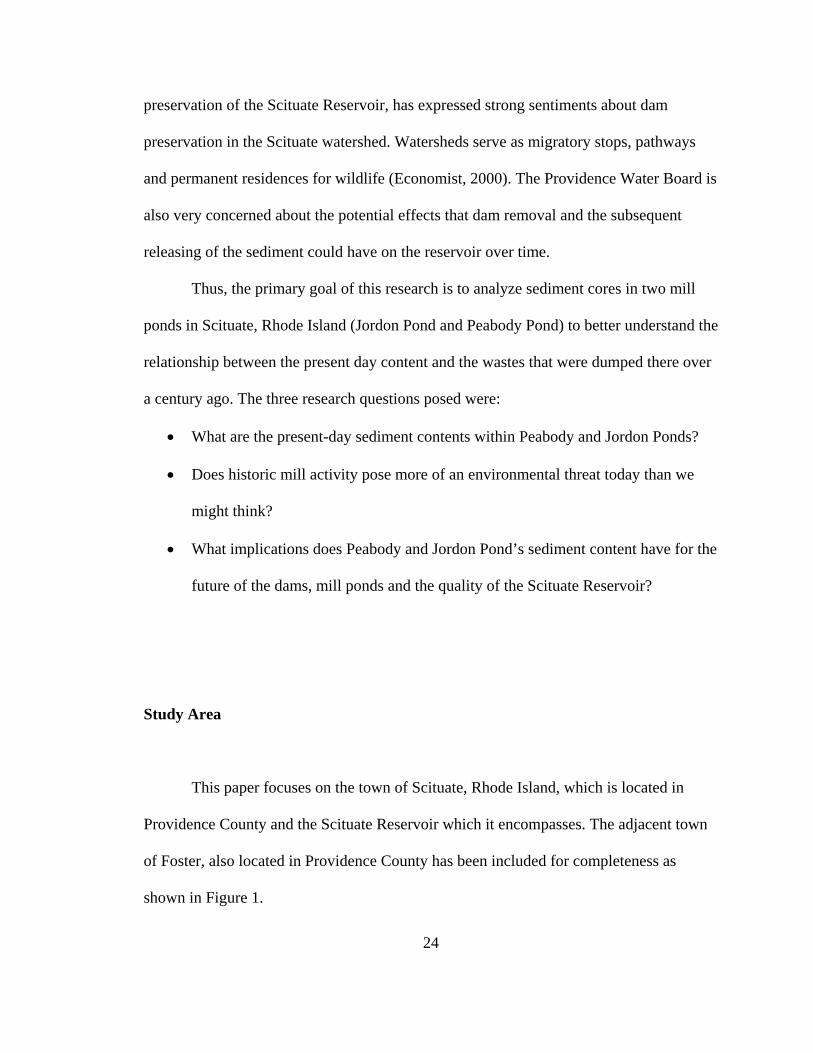
The town of Scituate covers an area of 52 square miles centered at 41.79ºN,
71.65ºW and is located approximately ten miles west of Providence, the capital of Rhode
Island. Two main rivers, the Ponagansett, and Moswansciut, flow southeast and
southwest respectively through the town until they reach the Scituate Reservoir (Figure
2).
25
Figure 2: Ponaganset and Moswaniscut Rivers flowing through Scituate, Rhode Island into the Scituate Reservoir
Textile mills began growing on the landscape within Scituate during the early
1800s. Given that the contamination of present day millponds is contingent on past use,
the historical context of the study area needs to be highlighted.
There are 10 millponds in the Scituate watershed owned by the Providence Water
Board. Peabody Pond (Figure 3), located in the southwest corner of Scituate, was one of
two ponds selected for this study for a number of reasons. It is one of the only mill ponds
left with residual mill foundations on the land within the Scituate Watershed. The
Peabody dam has not been tampered with or breached in any way. In addition, the pond
was easily accessible with water shallow enough for extracting sediment cores, that
26
otherwise would have involved the use of a crane for drilling. As the Scituate Beers Maps
show (Figure 4), during the 1870s Peabody Pond was actually made up of three ponds not
the two shown on the 20th century map.
Figure 3: Locations of mills and bodies of water in Scituate, 1870
27
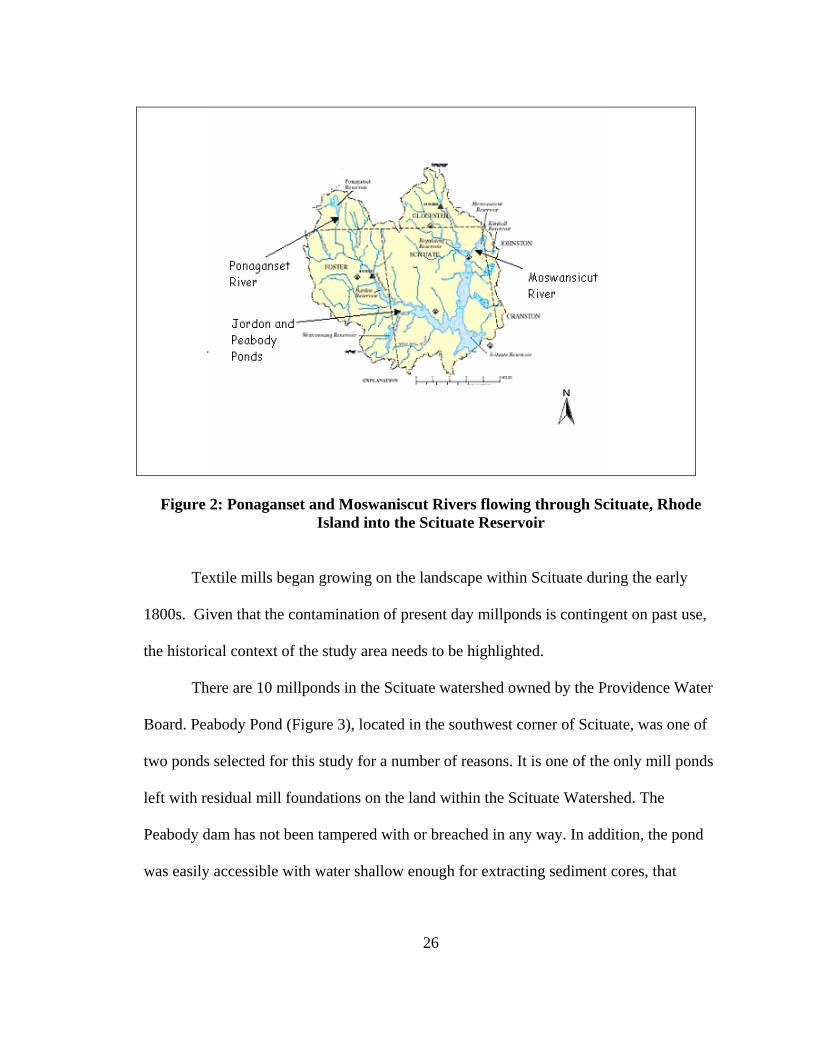
Figure 4: Survey map of Scituate Reservoir in 1917, highlights the Peabody Pond
(which was called Rockland Pond at the time) Data courtesy of Water Supply Board Scituate Reservoir
Two dams in Peabody Pond were breached during construction of the Scituate
Reservoir in the 1920s. Today these two pond areas are reverting to a marshy
environment, leaving one dam to contain the remnants of the Clayville Mills. This lone
remaining dam is leaky and has been so documented since 1917 by surveyors during a
land survey by the Water Supply Board prior to creating the Scituate Reservoir.
The selected study areas cover 1.5 sq. miles around Peabody Pond and
approximately 1 sq. mile around Jordon Pond. Jordon Pond is located upstream of
Peabody Pond in the heart of Clayville, a populated residential area. Jordon Pond was
used to power the Clayville Mills during the mill era. Following the condemnation of the
28
mills, this pond was left on the landscape with no real purpose or use. With the possibility
of present day runoff into the pond, any potential contamination found in Jordon Pond
would eventually make its way downstream to Peabody Pond, making the coring for
Jordon Pond critical for our long-term understanding.
Data gathered from Rhode Island Geographic Information System Data (RIGIS)
show the land cover in 1995 to be primarily forest (of different types) with limited
residential growth near the outskirts of the study area. The elevation of Rhode Island is
relatively low, with the maximum elevation in the study area only reaching just over 400
feet. The Peabody Pond is located in a valley with partially steep slopes on either side
which can provide rapid runoff into the pond.
Methodology
Both qualitative and quantitative research methods were employed. Sediment coring and
analysis was funded by and performed in collaboration with the Providence Water Board.
Textual Analysis
Textual analysis of historical Foster and Scituate books, deeds and videotapes
were used to identify and quantify settlement patterns and historical mill use in Scituate.
Of interest were mill sites, their production types and length of operation, as well as
possible runoff from the mills and the residential growth of the area. This type of data
analysis yielded information about the operating timeline and products from each mill,
and provided insight into soil core contents (e.g. trace metals from bleaching and printing
29
buildings). Videotapes were used to analyze the area in a different fashion, and over 1000
photographs were used to analyze the area of the pre-flooded reservoir. One video
documented a conversation between two women about their lives there in the early
1900s, while another was of Scituate Historian Frank Spenser, showing the lost villages
of Scituate between the years of 1906-1926, before the reservoir was built. This visual
media provided crucial details about the landscape not available from looking at maps.
While there is a paucity of studies on mill ponds in the existing literature, there is
a larger body of work on dams, their removal and ecological consequences (Born and
Genskow, 1998; Graf, 1999; Pohl, 2002; Wade, 1999). This body of work provides
insight into a dam’s lifespan, the problem with shallowing, the possible occurrence of
contaminated sediments and issues of dam removal.
Mapping Analysis
The working hypothesis of this study is that, given the mill activity upstream of
Peabody Pond, any contamination released by the mills should be found in this
undisturbed millpond. Hard-copy aerial photos from the 1930s to the early 1990s taken
approximately every ten years were acquired from the Rhode Island Geographic
Information System (RIGIS) website to determine how the mill ponds and the area
around them have changed over time. The un-rectified photos of Peabody Pond and
Jordon Pond were georeferenced to the most recent photo (2004) prior to digitizing and
computing total areas of farmland, forests, ponds and residential areas using ESRI’s
ArcMap. The coordinates of the 1.5 sq. mile area around Peabody Pond from the 2004
30
map were applied to the other maps used for digitizing each feature aforementioned. The
use of these coordinates ensured spatial consistency across all photos. Similar
georectification was applied to Jordon Pond.
Historical maps were used to extract landscape features from over 100 years ago.
Hopkins, Beers and Wallings Maps from the 1800s were also used to show human-made
changes on the landscape with property ownership and the approximate locations of
houses and mills. During field visits to the study area, these maps were helpful in
recreating the landscape from the 1800s to the early 1900s. A 1917 Water Supply Board
Map of properties condemned for the construction of the Scituate Reservoir also shows
the three ponds on the landscape, and how the land was morphing its current land use.
USGS topographic maps of Clayville (scale 1:24,000) were also used to extract key
landscape characteristics as well as transportation infrastructure around the study area.
Population density maps and federal census data were used to further explore
residential land use change as a contributor to millpond usage. Analyzing the growth rate
in the town could determine whether housing had contributed to the millponds via
dumping or runoff.
Field Work Sediment Estimates
In order to compute the required length of core sampling and to identify/locate
the best depth of sediment, estimates were taken in both Peabody and Jordon Ponds.
From a canoe, four-foot metal rods (that can be twisted together for added length) were
driven into the sediment to determine the depth from the surface layer to the bottom or
31
peat layer. Roughly 15 to 20 sediment estimates were taken and these ranged in depth
from 20 inches to 4 feet. In comparison, the 10 sediment estimates taken in Jordon Pond
ranged in depths from 12 inches to a little over 3 feet. The total area of Peabody Pond is
approximately two-tenths of a square mile. The actual area that could be used for coring
in the early spring 2006 season was under one-tenth of a square mile reflecting by dam
leaks and drought conditions.
Core Samples
Sediment coring of both Peabody and Jordon mill ponds was performed by two
members of TG&B Environmental Consulting Firm from Falmouth, Massachusetts hired
by the Providence Water Board. This firm was selected out of three companies in an open
competitive bidding process due to their previous sampling services on environmental
assessment projects, including many EPA super fund sites (Reynolds and Avakian,
2008). Four cores were taken from each pond. The coring sites were reached in an
Achilles inflatable ten foot rubber boat, where cores were extracted using a push/hammer
corer with a piston and a 2 and 5/8 inch diameter polycarbonate liner. Once in the tube,
the internal suction was then removed to release any extra water present. The core was
then placed on a wooden cradle mounted on two sawhorses for proper manipulation.
The cores were then sliced open using an electric shear, and measured with a tape
measure in order to divide them into four equal parts. Once divided, a sample taken by
scraping the outside of each of the four sections in the core with plastic spoons and the
contents were placed into individually tagged jars. Before new sample were taken from
32
the core, the spoons were washed thoroughly with alkanox solution provided by the
laboratory for this particular kind of testing to remove any type of residual contaminant.
The jars were then sent for laboratory analysis at Premier Laboratory in Dayville, CT in
order to determine changes in sediment characteristics over time.
RESULTS
Digitized Findings
In order to understand the change of land use over the 20th century, digital aerial
photographs were analyzed for both the Peabody Pond and Jordon Pond areas. Four
different land use/land cover types were selected and digitized for quantifying growth or
decline over time in the area of study. The four selected feature types were forest,
water/pond, housing and roads. As shown in Figure 5 for Peabody Pond and Figure 6 for
Jordon Pond, results indicate the expected regression from cleared land to forest over
time.
33
5a:
Forest
0
500
1000
1939 1951 1962 1972 1981 1992 2004
Years
Sq.
Acr
es
5b:
Housing
02
46
1939 1951 1962 1972 1981 1992 2004
Years
Sq.
Acr
es
5c 5d:
Water/Pond
0
5
10
15
20
25
30
1939 ^1951 ^1962 1972 ^1981 1992 2004
Years
Sq. A
cres
Roads
0.0310.0320.0330.0340.035
^1939
1951
1962
1972
1981
1992
2004
Years
Sq.
Mile
s
(* denotes drought) (^ denotes roads were dirt)
Data courtesy of http://www.wrb.state.ru.us/lawsreds/droughtplan.pdf
Figure 5: Annual summary of forest (a), housing (b), and water (c) square acreage and square mileage (d) of total road coverage within Peabody Pond
34
6a:
Forest
050
100150
1939 1951 1962 1972 1981 1992 2004
Years
Sq.
Acr
es
6b:
Housing
01
23
1939 1951 1962 1972 1981 1992 2004
Years
Sq. A
cres
6c:
Water/Pond
05
1015
1939 *1951 *1962 1972 *1981 1992 2004
Years
Sq. A
cres
6d:
Roads
00.0020.0040.0060.008
1̂939 1951 1962 1972 1981 1992 2004
YearsS
q. M
iles
(* denotes drought) (^ denotes roads were dirt)
Data courtesy of http://www.wrb.state.ru.us/lawsreds/droughtplan.pdf
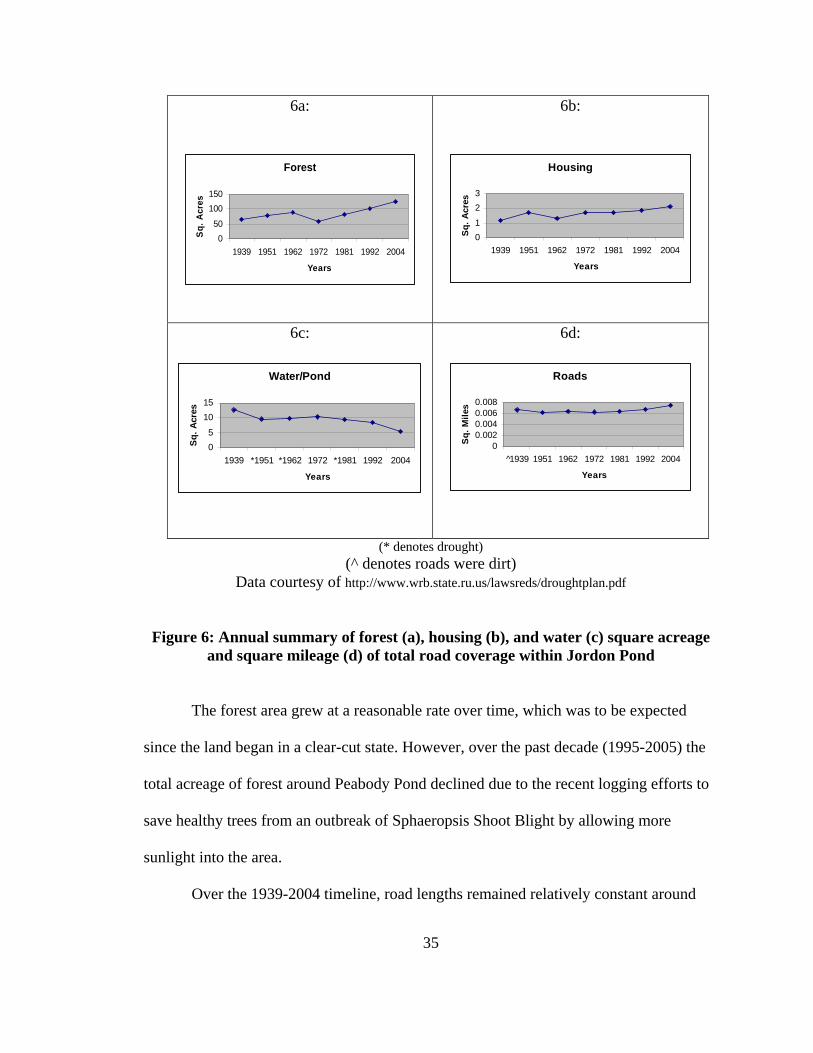
Figure 6: Annual summary of forest (a), housing (b), and water (c) square acreage and square mileage (d) of total road coverage within Jordon Pond
The forest area grew at a reasonable rate over time, which was to be expected
since the land began in a clear-cut state. However, over the past decade (1995-2005) the
total acreage of forest around Peabody Pond declined due to the recent logging efforts to
save healthy trees from an outbreak of Sphaeropsis Shoot Blight by allowing more
sunlight into the area.
Over the 1939-2004 timeline, road lengths remained relatively constant around
35
the Peabody Pond but increased around Jordon Pond due to a lack of and increase in new
housing developments respectively in the area. Aerial analysis shows dirt surfaces on
major roadways around both ponds in the late 1930s. By the 1950s roadways in both
areas appeared to be paved with the exception of small dirt driveways in Jordon Pond’s
residential area. Peabody Pond’s housing development showed a slight increase over time
due to the limited amount of new housing that can be built near the reservoir every year.
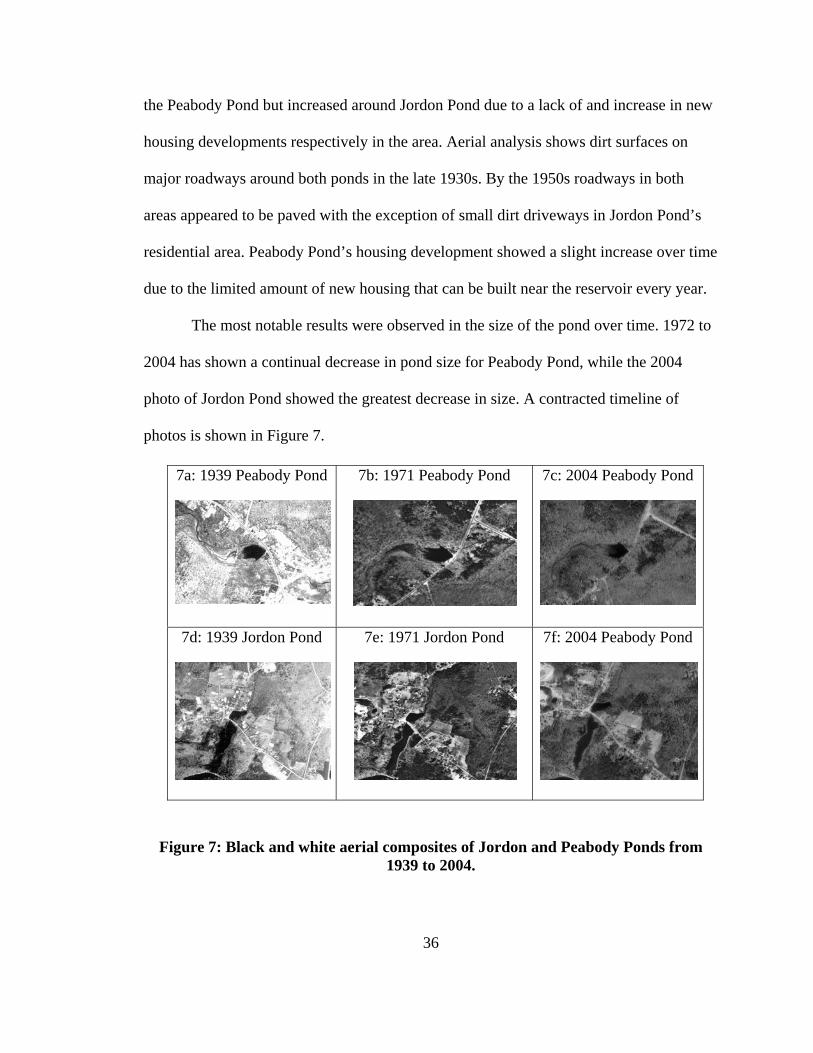
The most notable results were observed in the size of the pond over time. 1972 to
2004 has shown a continual decrease in pond size for Peabody Pond, while the 2004
photo of Jordon Pond showed the greatest decrease in size. A contracted timeline of
Table 5: Selected Trace Metals and their Maximum Contaminant Level (MCLs)
Substance Parts Per Million (ppm) Copper 1.3 Lead 0.015 Zinc 5 **
*Data acquired from http://www.epa.gov/safewater/contaminants/index.html
** Zinc was not listed with inorganic list with copper and lead (National secondary drinking water regulations)
One possible contributor during the mill era was runoff from the railway tracks
once located along the Peabody Pond. Some railway operations involved the use of lead
arsenates for weed control along railways, grease and oil lubricants dripping from
49
locomotive parts and the burning of coal from the engines (Fichter, 2007). Lead
contamination also results from corroding scrap metal (lead pipes or old roofing pieces),
auto exhaust from leaded gas, fallout on roadsides and even old orchards due to lead
arsenates that were heavily used until World War II (Dixon, 1998). Lead levels are
usually higher in cities, near roadways, industries that use lead and in the soil near homes
where lead paint flakes have fallen off (Yeager, 2007). The study areas are located near a
moderately traveled roadway which has implications of runoff while Peabody Pond is
located downstream from an abandoned mill site with lots of iron piping left throughout
the landscape from which metal traces can be leached.
Bisschops and Spanjers (2003) discuss metals entering the wastewaters from mills
through metal parts such as pipes, pumps and valves as possible contributors. Oxidizing
and maintenance chemicals are two other possible providers of metal traces. Although
lead is not used in great quantities as previously, once present in the soil it can move very
slowly and high concentrations can remain for a long period of time, causing
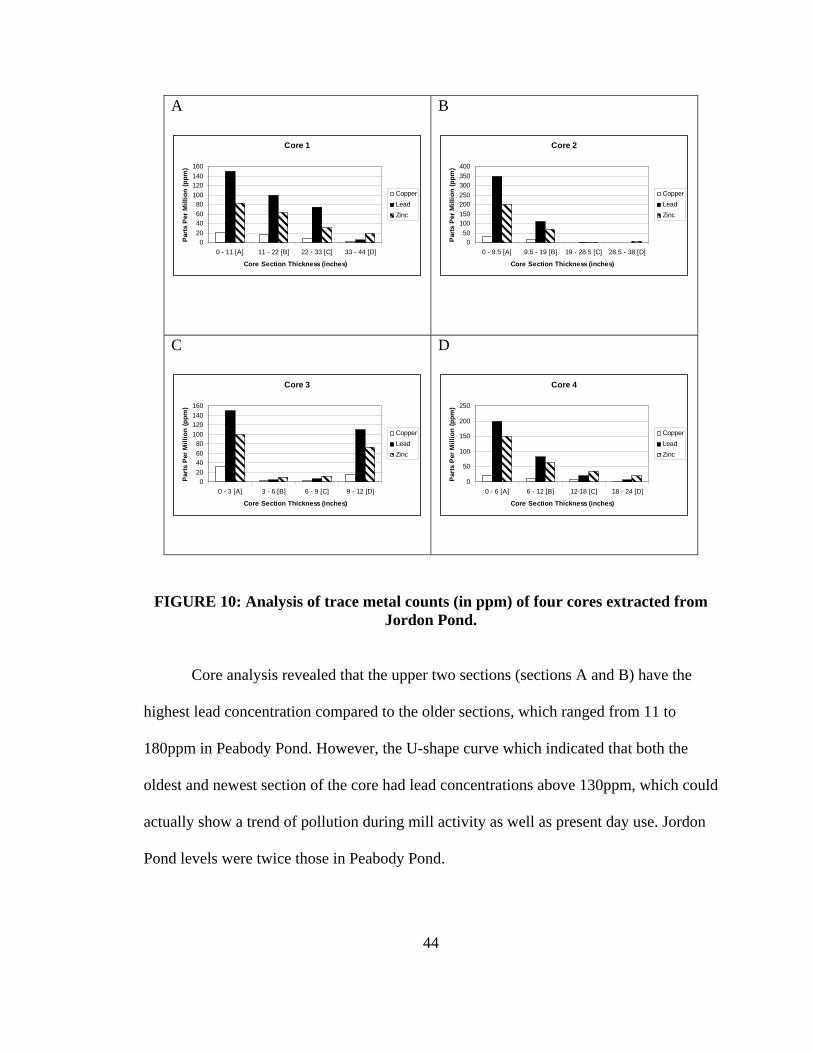
ongoing/lasting problems in some areas (Rosen, 2002). The highest trace level of lead
found in the Peabody Pond was 180ppm, and Jordon Pond had the highest trace lead level
overall of 350 ppm. These are above the direct exposure criteria limit by the RIDEM.
With the increased incidence of automobiles and housing near the water bodies, these
concentrations need to be monitored, given that above 500ppm denotes contamination, a
situation best avoided and that level should not be reached.
It is interesting to note that the observed increases of copper, zinc and lead in
Jordon Pond are higher than those in the Peabody Pond. Spikes in trace metals in
50
Peabody Pond correspond to similar spikes in Jordon Pond, although the latter were as
large as twice those observed in the Peabody Pond. This suggests a very important
possible downstream migration of contaminants from the Jordon Pond to the Peabody
Pond.
As aforementioned, Peabody Pond sediment pH levels were 5.1-5.9 while those of
the Jordon Pond were 4.4-5.8. Although the majority of the core sections exhibited a pH
between 5.5 to 5.9, there is little cause for concern from an environmental standpoint
since rainwater has a pH of 5.6. However, a few of the pH outliers were below 5.5, which
is important from an ecosystem health standpoint given that pH 5.5 or under can result in
frog eggs and tadpoles dying (USEPA, 2008). In Jordon Pond, section A (the newest) of
core 2 had a pH of 4.4, which can potentially can cause problems for fish reproduction or
even fish mortality (Government of Canada, 2004). This current level of acidity in one
core in Jordon Pond may not cause immediate alarm, but certainly warrants ongoing
monitoring in the future. Acidity can be 100 times greater with a pH level of only 2 units
difference (Government of Canada, 2004). If the sediment were to be disrupted, it could
cause environmental problems to the aquatic life in both ponds.
Zoning laws within the Scituate Watershed prohibit lots from extending more
than twenty-five feet within the area classified as the Water Resources Protection District
(Town of Scituate, 2005). However, buffer zones within the area allow lots to be 150 feet
from the edge of the reservoir with the stipulations of no activities that create earth
disturbance, removal or cutting of vegetation and construction on the land. Although
special permits can be acquired for building within the watershed, creating land use
51
regulations for the disposal of waste and drainage, and many guidelines for preventing
soil and sediment erosion, high lead levels are still making their way into the ponds
sediment contaminating the landscape even further. Even though many guidelines are still
in place, more attention needs should be paid to lead and avoiding their exceeding
industrial levels.
Results from both ponds have far-reaching consequences. The amount of trace
metals built up in the sediment behind the Peabody Dam is not currently high enough for
contamination in the local environment, but the dam is a leaky one that is slowly
continuing to deteriorate. This continuous leak (1900s to present) could also have caused
trace metals to be washed downstream instead of settling. The levels of trace metals
within the sediment of the Peabody Pond are considered safe as of now, however, should
the Jordon Pond dam break the dramatic increases in trace metal levels to values in the
past 44 years would become a cause for concern. Should these trends continue, it could
cause ecological challenges for the plants and animals of the region. If trace metal
contaminants from the Jordon Pond were released into the Peabody Pond at a much faster
rate than at present, the suggestion to remove the Peabody Dam would be revisited, and
the option of preserving it would be of much greater concern.
Conclusion
This is an ambitious study that draws on many different methodologies.
Landscape change often leads to unwanted pollution of the environment. Contemporary
human activities on the landscape such as residential development, lawn runoff and
52
motorway runoff cause stresses to the environment, while during the 1800s and early
1900s rivers functioned as waste dumps. The dams and mill ponds that were created over
the last two centuries influence the environment both historically and presently. In the
Scituate Reservoir these dams hold back trace metals that otherwise would flow into the
reservoir. However, the source of pollution appears to be largely contemporary activities,
and not historical ones.
Sediment analysis of lead, zinc and copper concentrations revealed that lead is the
most significant pollutant in both ponds. This is contrary to the original study expectation
that both trace metals and pesticide levels would be high. Pesticide levels fell below any
detection limits. Secondly the trace metal level concentrations found in Jordon Pond from
the mill era are classified as of moderate concern by other studies, although their
detection may have been due to insufficient sample volumes provided to the laboratory
for sample reanalysis. These results suggest that while trace metals from historic mill
activity do not pose a contamination threat to the current environment, the organic
pollution that was associated with printing and the dyeing of textiles could be an
important contributor. However, lead levels have been increasing greatly especially in the
newest sediment sections in both ponds and that is causing concern. The eroding metal
within the landscape will need to be closely monitored over the next few years with the
recommendation of possible further coring of soils and pond sediments to ensure that the
Rhode Island soil safety level value is not exceeded.
The relationship between levels of trace metals in pond sediment and human
activity around Jordon Pond is of great concern in terms of metal levels in the
53
environment. Jordon Pond, located near residential areas displayed twice the trace metal
levels observed in Peabody Pond, which is located in the forested area. Forests are known
to filter contaminants in runoff. Trace metal counts in the oldest sediment sections were
2-10 times lower than present day findings in the Peabody Pond, while the Jordon Pond
was even more remarkable with 350 times higher concentrations today (section A) than
in the older section (D). Both ponds had cores with elevated lead levels within the
sediment. These results can be used to determine whether other ponds within the
watershed in similar locations might be identified with high trace metal counts as well. At
present, study results suggest that given the amount of trace metals found in the Jordon
Pond and further downstream, the dam on Peabody Pond should be repaired. Since 1917,
surveyors have classified Peabody dam as leaky, and it is slowly continuing to
deteriorate. Due to the high lead concentrations in both ponds exceeding residential soil
criteria limits, if the ponds were dredged it could affect the drinking water in the Scituate
Reservoir. Action needs to be taken to repair Peabody’s dam before it is too late to avoid
potential environmental problems.
This thesis contributes to geography in the realm of environmental geography. It
serves as a baseline for the Providence Water Supply Board in calculating areas within
their watershed, especially those near residential areas, from which to limit runoff into
their ponds. Along with the georeferenced-digitized data, the Water Board can use the
aerial photos to show the change in the landscape from 1939 to 2004 and prepare for the
future. The Rhode Island EPA can use concentration levels of trace metals found in both
54
ponds to determine how much road maintenance and deicing agents are stressing the
environment due to runoff and whether restrictions are necessary.
This study’s data provide a fundamental basis for the analysis of the other mill
ponds in Rhode Island with existing mill remnants. They will help to establish criteria for
future testing. There needs to be continuous testing of trace metals in both the Peabody
and Jordon Ponds. There is a clear trend between the amount of proximate housing and
increased amounts of copper, lead and zinc in the sediment at the Jordon Pond, probably
due to runoff. Even though the area around the Scituate reservoir is primarily forested
with no major construction within the watershed, the Providence Water Board should
assess land use change as it influences surface runoff and the accumulative of
contaminates in both water bodies and sediment. This is primarily a case study of the
textile industry. It does not attempt to address the wide range of manufacturing process
that existed at the time. However, it does suggest a new area of much needed future
study.
Limitations and Future Study
This study draws on many different methodologies, and because of this no one
area can be researched more in-depth. One limitation to this project was not having a
timeline associated with the cores. An independent dating technique such as carbon 14 or
isotope analysis should be applied to future research of sediment cores analysis of these
mill ponds. With no timeline to base these findings on, one can not assume a certain
depth of soil is linked to a particular time frame.
55
Another limitation of this study was the need for more in-depth analysis of the
manufacturing process in New England. Few studies to data have compared the
relationship between mill factories. Manufacturing processes differed from mill to mill,
along with water power practices. With these differences, depending on the mills, each
mill pond could contain very different sediment concentrations. Once information is
gathered about the New England manufacturing process, it can open the door to a new
field of study.
A major limitation of this project was the lack of funding for the coring. Four
cores did not provide sufficient data to accurately determine whether the Peabody Pond
contains highly contaminated sediment, and whether the major source of that
contamination were the former mills. The existing cores have shown that there is a
gradually increasing trend over time in the level of trace metals, but improved results
may have been obtained by having more cores spatially distributed out throughout the
pond as well as up the river to the mills themselves. The uneven spatial distribution of
contamination in the sediment is another reason for further coring. This would mitigate
against the occasional spikes of trace metals and pH levels observed in the existing cores
from both ponds. Expanded coring would provide a more comprehensive overview of
trace metals presence in the sediment, prior to taking action. Including flora/fauna testing
to view a possible contaminated ecosystem and coring of soil around residential areas
will help encompass more of the area instead of just the sediment that was analyzed.
Given the paucity of studies focusing on Historical Mill Pond analysis, this
present study can provide much needed information for future research, by establishing
56
baselines for comparing sediment findings to direct exposure criteria, trace metal levels
and pH values.
57
LITERATURE CITED A barrage of criticism. (2000). The Economist, November 18, pp. 94-96 American Zinc Association. (2007). Zinc - A natural element. Retrieved September 2, 2007, from http://www.zinc.org/zinc_natural.html Bisschops, I., & Spanjers, H. (2003). Literature review of textile wastewater characterization. Environmental Technology, 24, pp. 1399-1411. Born, S., & Genskow, K. (1998). Socioeconomic and institutional dimensions of dam removals: The Wisconsin experience. Environmental Management, 22 (3), pp. 359-370. Bushaw-Newton, K. L., Hart, D., Pizzuto, J., Thomason, J., Egan, J., Ashley, J. et al. (2002). An integrative approach towards understanding ecological responses to dam removal: The manatawny creek study. Journal of the American Water Resources Association , 38 (6), pp. 1581-1599. Dixon, G. (1998). Lead in soil. The university of Maine analytical lab, maine soil testing
service. Retrieved August 31, 2007, from http://anlab.umesci.maine.edu/handout/lead01.htm. EBI: Environmental Bureau of Investigation. (2007). Copper. Retrieved August 31, 2007, from http://www.eprf.ca/ebi/contaminants/copper.html EBI: Environmental Bureau of Investigation. (2007). Zinc. Retrieved August 31, 2007, from http://www.eprf.ca/ebi/contaminants/zinc.html Fichter, J. (2007). Tear down of coachman motor inn may expose old pollution.
OpenCubeInc. Retrieved February 24, 2008, from http://www.geiconsults.com/contents835.html.
Foster, D. (1992). Land-use history (1730-1990) and vegetation dynamics in central New England, USA. Journal of Ecology , 80, pp. 1337-1357. Foster, D., & Motzkin, G. (2003). Interpreting and conserving the openland habitats of coastal New England: Insights from landscape history. Forest Ecology and Management , 185, pp. 127-150. Foster, D., Motzkin, G., Bernardos, D., & Cardoza, J. (2002). Wildlife dynamics in the changing New England landscape. Journal of Biogeography , 29, pp. 1337-1357.
58
Giles, C., & Goodall, I. H. (1992). Yorkshire textile mills: The buildings of the yorkshire textile industry, 1770-1930. London: H.M.S.O. Government of Canada, E. S. (2004). Freshwater website: water quality (the pH
scale). Retrieved February 1, 2008, from http://www.ec.gc.ca/water/en/manage/qual/e_ph.htm Graf, W. L. (1999). Dam Nation: A geographic census of American dams and their large- scale hydrologic impacts. Water Resources Research , 35 (4), pp. 1305-1311. Greenfield, D. I., & Bart Jr., H. L. (2005). Long-term fish community dynamics from a blackwater stream receiving kraft mill effluent between 1973 and 1988. Hydrobiologia, 534 (1-3), pp. 81-90. Haybeck, M. (1994). Zinc. Eco-USA.Net. Agency for toxic substances and disease registry. Retrieved August 31, 2007, from http://www.eco- usa.net/toxics/zinc.shtml. Legret, M., & Pagotto, C. (1999). Evaluation of pollutant loadings in the runoff waters from a major rural highway. The Science of the Total Environment , 235, pp.
143-150. Lenntech. (2000). Copper (Cu) - Chemical properties, health and environmental effects. Retrieved August 31, 2007, from http://www.lenntech.com/periodic-chart-elements/Cu-en.htm Michels, H. T., Boulanger, B., & Nikolaidis, N. P. (2000). Copper & the environment: Copper roof stormwater runoff. Copper Development Association. Retrieved February 1, 2008, from http://www.copper.org/environment/NACE02225/homepage.html Pohl, M. M. (2002). Brining Down the Dams: Trends in American dam removal rationales. Journal of American Resources Association , 36 (6), pp. 1511-1519. Pollard, A., & Reed, T. (2004). Benethic invertebrate assemblage change following dam removal in a Wisconsin stream. Hydrobiologia, 513, pp. 51-58. Rees, S. (1997). The historical and cultural importance of ponds and small lakes in Wales, UK. Aquatic Conservation: Marine and Freshwater Ecosystems, 7, pp. 133-139.
Rhode Island Water Resources Board and Rhode Island Statewide Planning Program. (2002). Rhode Island drought management plan, state guide plan element 724.
Rhode Island Statewide Planning Program. Retrieved October 14, 2007, from http://www.wrb.state.ru.us/lawsreds/droughtplan.pdf. Rosen, C. J. (2002). Lead in the home garden and urban soil environment: Sources of lead in the environment. College of Agricultural Food and Environmental Services, University of Minnesota Extension Service. Retrieved September 1, 2007, from http://www.extension.umn.edu/distribution/horticulture/DG2543.html. Sepulveda, M. S., Gallagher, E. P., & Gross, T. S. (2004). Physiological changes in largemouth bass exposed to paper mill effluents under laboratory and field conditions. Ecotoxicology , 13 (4), pp. 291-301. State of Rhode Island and Providence Plantations Department of Environmental
Management Office of Waste Management. (2004). Rules and regulations for the investigation and remediation of hazardous material releases. (DEM-DSR-01-93).
Steinberg, T. (1961). Nature incorporated : industrialization and the waters of
New England . New York, NY: Cambridge University. Town of Scituate. (2005). Zoning bylaws. Retrieved Aug 30, 2008, from
http://www.town.scituate.ma.us/documents/zoningbylaws0305.pdf. U.S. Environmental Protection Agency. (2008). Drinking water contaminants. Retrieved
August 20, 2008 from http://www.epa.gov/safewater/contaminants/index.html. United States Environmental Protection Agency. (2008). Acid rain students site: pH scale. Retrieved February 1, 2008, from http://www.epa.gov/acidrain/education/site_students/phscale.html University of Massachusetts Amherst. (2004). Soil lead levels. Department of Plant and Soil Sciences, Amherst, Massachusetts. Retrieved September 2, 2007, from http://www.umass.edu/plsoils/soiltest/lead1.htm. Wade, B. (1999). Bringing down the dams. American City and Country, June, pp. 20-32. Wood, P. J., & Barker, S. (2000). Old industrial mill ponds: A Neglected Ecological Resource. Applied Geography , 20, pp. 65-81.
60
Wood, P. J., Gunn, J., Greenwood, M. T., & Barker, S. A. (2001). The effects of amenity management for aging on the conservation value of aquatic invertebrate communities in old industrial ponds. Biological Conservation , 102 (1), pp. 17-29. Yeager, F. (2007). Lead in soil. California Department of Education. Retrieved September 1, 2007, from http://www.cde.ca.gov/ls/fa/hs/leadsoil.asp.
61
COMPREHENSIVE BIBLIOGRAPHY A barrage of criticism. (2000). The Economist, November 18, pp. 94-96 American Zinc Association. (2007). Zinc - A natural element. Retrieved September
2, 2007, from http://www.zinc.org/zinc_natural.html Ayotte, J. D., Montgomery, D., Flannagan, S., & Robinson, K. (2003). Arsenic in
groundwater in eastern New England: Occurrence, controls and human health implications. Environmental Science and Technology, 37, pp. 2075-2083.
Bisschops, I., & Spanjers, H. (2003). Literature review of textile wastewater characterization. Environmental Technology, 24, pp. 1399-1411. Born, S., & Genskow, K. (1998). Socioeconomic and institutional dimensions of
dam removals: The Wisconsin experience. Environmental Management, 22 (3), pp. 359-370.
Braun, E. K., & Braun, D. P. (1994). The first peoples of the northeast. Lincoln, Massachusetts: Moccasin Hill Press. Bushaw-Newton, K. L., Hart, D., Pizzuto, J., Thomason, J., Egan, J., Ashley, J. et al. (2002). An integrative approach towards understanding ecological
responses to dam removal: The manatawny creek study. Journal of the American Water Resources Association , 38 (6), pp. 1581-1599.
Chafee, J. H. (2005). History & culture. National Park Service. Retrieved March 20, 2004, from http://www.nps.gov/blac/historyculture/index.htm Charlatchka, R., & Cambier, P. (2000). Influence of reducing conditions on
solubility of trace metals in contaminated soils. Water, Air and Soil Pollution, 118, pp. 143-167.
Conley, P. (1986). An album of Rhode Island history, 1636-1986. Virginia Beach:
The Donning Company. Cronon, W. (1983). Changes in the land, colonists and the ecology of New England. Canada: Harper Collins. Denevan, W. (1992). The pristine myth: The landscape of the Americas in 1492. Association of American Geographers , 82 (3), pp. 369-385.
62
Dixon, G. (1998). Lead in soil. The university of Maine analytical lab, Maine soil testing service. Retrieved August 31, 2007, from
http://anlab.umesci.maine.edu/handout/lead01.htm. EBI: Environmental Bureau of Investigation. (2007). Copper. Retrieved August 31,
2007, from http://www.eprf.ca/ebi/contaminants/copper.html EBI: Environmental Bureau of Investigation. (2007). Zinc. Retrieved August 31,
2007, from http://www.eprf.ca/ebi/contaminants/zinc.html FHWA Environmental Technology Brief. (1999). Is highway runoff a serious
problem? Office of Infrastructure R&D in cooperation with Office of Environmental Planning.
Fichter, J. (2007). Tear down of coachman motor inn may expose old
pollution. OpenCubeInc. Retrieved February 24, 2008, from http://www.geiconsults.com/contents835.html.
Foster, D. (1992). Land-use history (1730-1990) and vegetation dynamics in central
New England, USA. Journal of Ecology , 80, pp. 1337-1357. Foster, D., & Motzkin, G. (2003). Interpreting and conserving the openland habitats
of coastal New England: insights from landscape history. Forest Ecology and Management , 185, pp. 127-150. Foster, D., Motzkin, G., Bernardos, D., & Cardoza, J. (2002). Wildlife dynamics in
the changing New England landscape. Journal of Biogeography , 29, pp. 1337-1357.
Giles, C., & Goodall, I. H. (1992). Yorkshire textile mills: The buildings of the yorkshire textile industry, 1770-1930. London: H.M.S.O. Government of Canada, E. S. (2004). Freshwater website: Water quality (the pH
scale). Retrieved February 1, 2008, from http://www.ec.gc.ca/water/en/manage/qual/e_ph.htm Graf, W. L. (1999). Dam Nation: A geographic census of American dams and their
large-scale hydrologic impacts. Water Resources Research , 35 (4), pp. 1305-1311.
Greenfield, D. I., & Bart Jr., H. L. (2005). Long-term fish community dynamics
from a blackwater stream receiving kraft mill effluent between 1973 and 1988. Hydrobiologia, 534 (1-3), pp. 81-90.
63
Hamilton, E. (1964). Village mill in early New England. Connecticut: Meriden Gravure Company.
Harrison, R. M., Laxen, D. H., & Wilson, S. J. (1981). Chemical associations of
lead, cadmium, copper, and zinc in street dusts and roadside soils. Environmental Science & Technology, 15 (11), pp. 1378-1383.
Haybeck, M. (1994). Zinc. Eco-USA.Net. Agency for Toxic Substances and Disease Registry. Retrieved August 31, 2007, from http://www.eco- usa.net/toxics/zinc.shtml. Hoffman, E. J., Latimer, J. S., Carlton, D., Hunt, D., Mills, G. L., & Quinn, J. Q.
(1985). Stormwater runoff from highways. Water, Air and Soil Pollution , 25, pp. 349-364.
Huber, L., & Baumung, H. (1988). Requirements for the treatment of effluents from chemical pulp mills in the FRG. Water and Science Technology , 1, pp. 19-
24. Janis, P. (Producer). (1985). Scituate remembered [Documentary]. Rhode Island
College. Koivo, L., & Oravainen, R. (1983). Zn, P and ATP in the sediments of two lakes in
South Finland. Hydrobiologia, 103, pp. 177-179. Legret, M., & Pagotto, C. (1999). Evaluation of pollutant loadings in the runoff
waters from a major rural highway. The Science of the Total Environment, 235, pp. 143-150.
Lenntech. (2000). Copper (Cu) - chemical properties, health and environmental
effects. Retrieved August 31, 2007, from http://www.lenntech.com/Periodic-chart-elements/Cu-en.htm Lindoff, S. D. (2003). Institutionalizing the option of dam removal; the New
Hampshire initiative. Water Science and Technology , 48 (7), pp. 9-16. Macaulay, D. (1983). Mill. Boston: Houghton Mifflin. Mann, C. (2000). 1491. The Atlantic Monthly Group. Retrieved March 2, 2002, from http://www.theatlantic.com/doc/prem/200203/mann McLoughlin, W. G. (1978). Rhode Island, a history (pp. 3-20, 109-148). New York: W.W. Norton & Company Inc.
Michels, H. T., Boulanger, B., & Nikolaidis, N. P. (2000). Copper & the environment: Copper roof stormwater runoff. Copper Development Association. Retrieved February 1, 2008, from http://www.copper.org/environment/NACE02225/homepage.html
National Park Service. (2005). History & culture. Retrieved September 1, 2007, from http://www.nps.gov/blac/historyculture/index.htm. Norton, M. (1987). Mills and ponds of rochester. Rochester: Rochester Historical Commission. Pohl, M. M. (2002). Brining down the dams: Trends in American dam removal rationales. Journal of American Resources Association , 36 (6), pp. 1511-
1519. Pollard, A., & Reed, T. (2004). Benethic invertebrate assemblage change following
dam removal in a Wisconsin stream. Hydrobiologia, 513, pp. 51-58. Rees, S. (1997). The historical and cultural importance of ponds and small lakes in Wales, UK. Aquatic Conservation: Marine and Freshwater Ecosystems, 7, pp. 133-139. Robinson, K., Campbell, J., & Jaworski, N. (2003). Water quality trends in New England rivers during the 20th century. Pembroke, N.H.: USGS National Water-
Quality Assessment Program, Water Resource Investigation Report. Rhode Island Historical Preservation Commission. (1980). Historic and architectural resources of Scituate, Rhode Island: A preliminary report. Providence, RI:
State of Rhode Island and Providence Plantations Preliminary Survey Report Town of Scituate.
Rhode Island Water Resources Board and Rhode Island Statewide Planning Program. (2002). Rhode Island drought management plan, state guide plan element
724. Rhode Island Statewide Planning Program. Retrieved October 14, 2007, from http://www.wrb.state.ru.us/lawsreds/droughtplan.pdf.
Rosen, C. J. (2002). Lead in the home garden and urban soil environment: Sources
of lead in the environment. College of Agricultural Food and Environmental Services, University of Minnesota Extension Service. Retrieved September 1, 2007, from http://www.extension.umn.edu/distribution/horticulture/DG2543.html.
Sabetta, G. (1989, January 19). Preserving the pastoral village of clayville. The Observer, pp. 1A and 22A.
65
Sarkesian, B. (1987). Scituate, R.I. – An informal history. S.I.: Sarkesian. Sepulveda, M. S., Gallagher, E. P., & Gross, T. S. (2004). Physiological changes in largemouth bass exposed to paper mill effluents under laboratory and
field conditions. Ecotoxicology , 13 (4), pp. 291-301. Slater Mill Historic Site. (2000). Welcome to slater mill. Retrieved January 12, 2006, from http://www.slatermill.org/museum/about Smith, H. (1976). The history of Scituate, R.I. Connecticut: Racine Printing. Smith, L., Dittmer, E., Prevost, M., & Burt, D. (2000). Breaching of a small
irrigation dam in Oregon: A case history. Journal of Fisheries Management, 20, pp. 205-219.
State of Rhode Island and Providence Plantations Department of Environmental
Management Office of Waste Management. (2004). Rules and regulations for the investigation and remediation of hazardous material releases. (DEM-DSR-01-93).
Steinberg, T. (2002). Down to earth, nature’s role in American history. Oxford: University Press. Steinberg, T. (1961). Nature Incorporated : Industrialization and the waters of
New England . New York, NY: Cambridge University. Town of Scituate, Rhode Island. (2004). History of scituate. Retrieved April 12,
2004, from http://www.scituateri.org/ Town of Scituate. (2005). Zoning bylaws. Retrieved Aug 30, 2008, from
http://www.town.scituate.ma.us/documents/zoningbylaws0305.pdf. U.S. Environmental Protection Agency. (2008). Drinking water contaminants. Retrieved
August 20, 2008 from http://www.epa.gov/safewater/contaminants/index.html. United States Bureau of the Census. (2000). Rhode Island population by city and town
1790-2000. Retrieved May 2, 2008, from http://www.planning.state.ri.us/census/pdf%20files/pdf/City1790-2000.PDF
United States Census Bureau & RI Statewide Planning. (2000). New England population
66
by state 1800-2000. Retrieved May 2, 2008, from http://www.planning.state.ri.us/census/census/pdf%20files/pdf/NE1800-2000.PDF
United States Environmental Protection Agency. (2008). Acid rain students site: pH scale. Retrieved February 1, 2008, from http://www.epa.gov/acidrain/education/site_students/phscale.html University of Massachusetts Amherst. (2004). Soil lead levels. Department of Plant
and Soil Sciences, Amherst, Massachusetts. Retrieved September 2, 2007, from http://www.umass.edu/plsoils/soiltest/lead1.htm.
Wade, B. (1999, June). Bringing down the dams. American City and Country , pp.
20-32. Warren, E. (1988, November 22). Clayville historic district. National Register of Historic Places Registration Form. White, G. (1967). Memoir of Samuel Slater, The father of American manufactures
connected with a history of the rise and progress of the cotton manufacture in England and America. New York: Kelley.
Wigilius, B., Hagen, I., Brogger, A., Borenm, H., Grimvall, A., & Carlberg, G. E.
(1988). Impact of bleach kraft effluents on drinking water quality. Science of the Total Environment, 74, pp. 75-96.
Williams, M. (1989). America and their forests: A historical geography. New
York: Cambridge University Press. Wood, P. J., & Barker, S. (2000). Old industrial mill ponds: A neglected ecological resource. Applied Geography , 20, pp. 65-81. Wood, P. J., Gunn, J., Greenwood, M. T., & Barker, S. A. (2001). The effects of amenity management for aging on the conservation value of aquatic invertebrate communities in old industrial ponds. Biological Conservation , 102 (1), pp. 17-29. Yeager, F. (2007). Lead in soil. California Department of Education. Retrieved September 1, 2007, from http://www.cde.ca.gov/ls/fa/hs/leadsoil.asp.