Traceability Visualization in Metamodel Change Impact Detection Juri Di Rocco University of L’Aquila I-67100 L’Aquila, Italy [email protected]Davide Di Ruscio University of L’Aquila I-67100 L’Aquila, Italy [email protected]Ludovico Iovino University of L’Aquila I-67100 L’Aquila, Italy [email protected]Alfonso Pierantonio University of L’Aquila I-67100 L’Aquila, Italy [email protected]ABSTRACT In Model-Driven Engineering metamodels are typically at the core of an ecosystem of artifacts assembled for a shared purpose. Therefore, modifying a metamodel requires care and skill as it might compromise the integrity of the ecosys- tem. Any change in the metamodel cannot prescind from recovering the ecosystem validity. However this has been proven to be intrinsically difficult, error-prone, and labour- intensive. This paper discusses how to generate and visual- ize traceability information about the dependencies between artifacts in a ecosystem and their related metamodel. Be- ing able to understand how and where changes affect the ecosystem by means of intuitive and straightforward visual- ization techniques can help the modeler in deciding whether the changes are sustainable or not at an early stage of the modification process. 1. INTRODUCTION Model-Driven Engineering [1] (MDE) aims at capturing problems in terms of concepts that are much closer to the application domain rather than to the underlying techno- logical assets. Problems are then consistently mapped to solutions by means of model operations generally defined by model transformations. Both problems and solutions are described with the help of models expressed in terms of con- cepts and relationships among them given in metamodels. Additionally metamodels characterize also a wide range of further artifacts, including model transformations, textual and diagrammatic editors, and code generators which are typed 1 after them. Therefore, metamodels are at the core of 1 For instance, a transformation usually have a source and a target metamodel. Permission to make digital or hard copies of all or part of this work for personal or classroom use is granted without fee provided that copies are not made or distributed for profit or commercial advantage and that copies bear this notice and the full citation on the first page. To copy otherwise, to republish, to post on servers or to redistribute to lists, requires prior specific permission and/or a fee. GMLD ’13, July 01 2013, Montpellier, France Copyright 2013 ACM 978-1-4503-2044-3/13/07 ...$15.00. http://dx.doi.org/10.1145/2489820.2489824. an aggregation of artifacts assembled for a shared purpose, called metamodeling ecosystem [2, 3]. Similarly to software, metamodels can be subject to inter- nal or external evolutionary pressures [4]. However, because of the dependencies among the artifacts, changing a meta- model requires the rest of the ecosystem to be adapted in order to remain valid or consistent. As a consequence, be- fore changing a metamodel it is of crucial relevance to mea- sure the impact of the changes among the artifacts in order to understand whether the evolution is sustainable or not. In a previous work [5] we have already presented techniques based on simple cost functions which may help in understand how much changing a metamodel is affordable. Nonetheless, quantitatively analyzing the impact can be misleading as it does not convey any particular about where and how the adaptations have to be applied. In this paper, we present a change impact visualization which complements the aforementioned work. In particular, traceability information about the dependencies between the metamodel and the specific artifact under study is generated and visualized. This permits the modeler to assess the signif- icance of the change by using an adaptation density concept which visualizes and gives an intuition about how localized and how many adaptations are required within a given arti- fact fragment. The approach is generic and can be used for different kinds of artifacts. The paper is structured as follows. Section 2 presents the background. Section 3 outlines a methodology to deal with the co-evolution problem. In Section 4 the visualization of the traceability is explained. Section 5 analyses differ- ent results obtained with our approach presenting possible visualizations and their meaning. In Section 6 we discuss alternative approaches and application using TraceVis and analize other approaches to change impact detection and traceability. Section 7 concludes the paper outlining future works. 2. BACKGROUND: COUPLED EVOLUTION PROBLEM As already mentioned, metamodels rarely exist in isolation since they are the cornerstone upon which many modeling artifacts are built. The problem of how to let the metamodel
ABSTRACTIn Model-Driven Engineering metamodels are typically atthe core of an ecosystem of artifacts assembled for a sharedpurpose. Therefore, modifying a metamodel requires careand skill as it might compromise the integrity of the ecosys-tem. Any change in the metamodel cannot prescind fromrecovering the ecosystem validity. However this has beenproven to be intrinsically difficult, error-prone, and labour-intensive. This paper discusses how to generate and visual-ize traceability information about the dependencies betweenartifacts in a ecosystem and their related metamodel. Be-ing able to understand how and where changes affect theecosystem by means of intuitive and straightforward visual-ization techniques can help the modeler in deciding whetherthe changes are sustainable or not at an early stage of themodification process.
1. INTRODUCTION
Model-Driven Engineering [1] (MDE) aims at capturingproblems in terms of concepts that are much closer to theapplication domain rather than to the underlying techno-logical assets. Problems are then consistently mapped tosolutions by means of model operations generally definedby model transformations. Both problems and solutions aredescribed with the help of models expressed in terms of con-cepts and relationships among them given in metamodels.Additionally metamodels characterize also a wide range offurther artifacts, including model transformations, textualand diagrammatic editors, and code generators which aretyped1 after them. Therefore, metamodels are at the core of
1For instance, a transformation usually have a source and atarget metamodel.
Permission to make digital or hard copies of all or part of this work forpersonal or classroom use is granted without fee provided that copies arenot made or distributed for profit or commercial advantage and that copiesbear this notice and the full citation on the first page. To copy otherwise, torepublish, to post on servers or to redistribute to lists, requires prior specificpermission and/or a fee.GMLD ’13, July 01 2013, Montpellier, FranceCopyright 2013 ACM 978-1-4503-2044-3/13/07 ...$15.00.http://dx.doi.org/10.1145/2489820.2489824.
an aggregation of artifacts assembled for a shared purpose,called metamodeling ecosystem [2, 3].
Similarly to software, metamodels can be subject to inter-nal or external evolutionary pressures [4]. However, becauseof the dependencies among the artifacts, changing a meta-model requires the rest of the ecosystem to be adapted inorder to remain valid or consistent. As a consequence, be-fore changing a metamodel it is of crucial relevance to mea-sure the impact of the changes among the artifacts in orderto understand whether the evolution is sustainable or not.In a previous work [5] we have already presented techniquesbased on simple cost functions which may help in understandhow much changing a metamodel is affordable. Nonetheless,quantitatively analyzing the impact can be misleading as itdoes not convey any particular about where and how theadaptations have to be applied.
In this paper, we present a change impact visualizationwhich complements the aforementioned work. In particular,traceability information about the dependencies between themetamodel and the specific artifact under study is generatedand visualized. This permits the modeler to assess the signif-icance of the change by using an adaptation density conceptwhich visualizes and gives an intuition about how localizedand how many adaptations are required within a given arti-fact fragment. The approach is generic and can be used fordifferent kinds of artifacts.
The paper is structured as follows. Section 2 presentsthe background. Section 3 outlines a methodology to dealwith the co-evolution problem. In Section 4 the visualizationof the traceability is explained. Section 5 analyses differ-ent results obtained with our approach presenting possiblevisualizations and their meaning. In Section 6 we discussalternative approaches and application using TraceVis andanalize other approaches to change impact detection andtraceability. Section 7 concludes the paper outlining futureworks.
2. BACKGROUND: COUPLED EVOLUTIONPROBLEM
As already mentioned, metamodels rarely exist in isolationsince they are the cornerstone upon which many modelingartifacts are built. The problem of how to let the metamodel
Figure 1: MDE ecosystems
evolve together with the ecosystem has been partially ad-dressed and discussed in [3], while most of the approacheswere dealing with the metamodel/model co-evolution (e.g. [4,6, 7] ) and only few work with metamodel/transformationand other artifact co-evolution (e.g., [8, 9]). To better un-derstand the complexity of the problem let us consider theecosystem represented in Figure 1. The PetriNetMM meta-model is given in the middle, PetriNet models can be trans-lated by means of transformations, and finally different kindsof editors permit to enter and manipulate the models.
The metamodel changes can be classified according to theimpact on the artifacts. In particular, there are changesthat a) do not affect the artifacts at all and no adaptationis required; b) affect the artifact which can be automaticallyadapted; and finally c) affect the artifacts which cannot beautomatically adapted. Furthermore, the adaptations whichare required to recover modeling artifacts with respect tothe changes executed on the corresponding metamodel, de-pend on the relation which couple the modeling artifact andthe metamodel [2]. An example of metamodel evolution isshown in Figure 2, where the initial version of the PetriNetmetamodel in Figure 2 (top) is modified by leading to theversion shown at Figure 2 (bottom). Clearly, the validityand consistency of the ecosystem might be compromised be-cause of the corruption of the relations between artifacts andthe metamodel [10].
Therefore, it is of paramount importance to be able totrace and visualize the dependencies within the ecosystemin order to enable the modeler to detect those modificationsthat compromise existing artifacts and especially those thatrequire more labour to be repaired. In the next section, amethodology is discussed to support the adaptation of those
Figure 2: PetriNet metamodel evolution
artifacts which have been affected by metamodel changes.
52
3. COUPLED EVOLUTION MANAGEMENTPROCESS
If the adaptation is applied with spontaneous or individ-ual skills can give place to inconsistencies between the meta-model and the related artifacts [4]. Therefore, a methodol-ogy which prevents the consequent information erosion andprovides the modeler with a consistent guidance in the adap-tation process can be significant. In Figure 3, a process con-sisting of a number of activities is presented. It encompassesthe specification of the metamodel changes, the evaluationof their impact on the existing artifacts, the sustainability ofthe induced adaptations, and finally the actual migrationsof the affected artifacts. This represents an enhancement ofthe methodology presented in [5], which did not consider thechange impact visualization activity. In the remaining of thesection, all the activities shown in the figure are discussedseparately.
1. Relation Definition: this activity is performed onlyonce per each kind of artifact to be adapted. For in-stance, in the case of ATL transformations [11], theATL and the ECore metamodels are considered in or-der to establish correspondences between them. Suchcorrespondences are used later in the process to auto-matically derive the dependencies between an evolvingmetamodel and the existing transformations. This ac-tivity can be done by using the work in [2] that exploitsweaving models and megamodels to specify and ma-nipulate correspondences among related and evolvingartifacts. The upper side of Figure 4 shows a sampleweaving model (as defined in [2]), which specifies therelation between the ECore metaclass EClass and theATL metaclass OclModelElement.
2. Dependencies Elicitation: after the previous activity,the definition of the relations can be used to automat-ically derive the dependencies between the evolvingmetamodel and the linked artifacts. Such dependen-cies can be expressed as a weaving model like the oneshown in the lower side of Figure 4. It shows the depen-dencies between the metaclasses of the PetriNet meta-model and the elements of a given ATL transformationhaving it as source metamodel. For instance, the firstrule of the transformation shown on the right-handside of Figure 4 contains an OclModelElement namedNet, thus it is connected with the EClass element sim-ilarly named on the left-hand side of the figure. Sucha dependency link specifies that changing the name ofthe Net metaclass in the PetriNet metamodel impliesto propagate such a change to each OclModelElement
linked to it.
3. Metamodel Changes Specification: the changes thatthe modeler wants to apply on a given metamodelshould be properly represented in order to enable auto-matic manipulations and automate subsequent phasesof the process. For instance, in this phase it is possi-ble to adopt the metamodel independent approach todifference representation proposed in [12] already usedto deal with other coupled evolution problems (e.g.,adaptation of models [7], and GMF editors [9]), butother approaches can be used as well.
4. Change Impact Visualization: in this phase the ele-ments of the artifact, which has been affected by thespecified metamodel changes are graphically shown. Inthis way, modelers can have a preliminary assessmentof the impact that the metamodel changes being ap-plied, will have on the existing artifacts. They candecide to amend such changes, or to go ahead in theprocess with a more accurate evaluation of the requiredadaptation cost [5].
5. Change Impact Analysis / Evaluation Cost : in this ac-tivity the evaluation performed in the previous step isenhanced by considering an appropriate cost functionrelated to the actions, which are required to adapt theaffected artifacts [5]. In the specific case of ATL modeltransformations, according to the dependencies previ-ously elicited, all the transformation elements whichare in relation with the changed metamodel elementsare identified and used as input for evaluating theadaptation cost. In particular, by considering the af-fected elements modelers evaluate the cost for adapt-ing the affected transformations. In this respect, ifthe adaptation is too expensive (according to an es-tablished threshold) modelers can decide to refine themetamodel changes to reduce the corresponding costs,otherwise they can accept the applied metamodel changes.The evaluation is based on an adaptation cost functiondefined separately [5].
6. Metamodel Changes Commit : once the metamodel chan-ges have been evaluated, modelers can commit themin order to concretely apply the previously evaluatedartifact adaptations.
7. Artifact Adaptation: in this activity the existing arti-facts which have been affected by the committed meta-model changes are adapted. Proper tools are requiredto support this step. Over the last years differentapproaches have been proposed to support the cou-pled evolution of metamodels and related artifacts.EMFMigrate [13] is one of those tools that presentsthe advantage of dealing with the diversity of artifactswith a unique notation.
In the next section we focus on the Change Impact Visu-alization activity, since the detection phase [2] and the mi-gration activity [5] have been already treated. We propose atool chain able to generate a graphical representation of thechange impact out of a model representing the differencesbetween two subsequent versions of the same metamodel.
4. CHANGE IMPACT VISUALIZATION
Over the last years, different attempts have been proposedto deal with the problem of supporting the graphical repre-sentation of inter-model relations. For instance, in somecases there is the need for representing different viewpointsof a system, or multiple views of it, each capturing a concernof interest for a particular stakeholder. In this direction, theTraceVis tool [14] has been proposed to graphically representtraceability information between structured data. Interest-ingly, TraceVis has been adopted to visualize traceabilitylinks between the source and target models of an executedmodel transformation [15].
53
Figure 3: Methodology activities
In this section, we propose a tool chain that aims at us-ing the TraceVis tool to graphically represent the impactthat the changes being addressed on a given metamodel canhave on existing artifacts. Figure 5 depicts a screenshotof the TraceVis tool at work while representing the depen-dencies (generated by the tool chain explained later in thesection) among three different models. In particular, thepart of the figure labelled 2 represents the initial versionof the PetriNet metamodel shown in Figure 2.a. The partlabelled 1 represents the difference model (also called deltamodel hereafter) encoding the differences to be applied onthe initial version of the metamodel in order to obtain thatin Figure 2.b. The part labelled 3 represents an existing
ATL transformation, which has 2 as source metamodel,
and is affected by the metamodel changes specified in 1 .
The lines between 1 and 2 represents the relations be-
tween the differences represented in 1 and the metamodel
elements in 2 that are changed. For instance, the Changed-
Class modification represented in 1 is related to the classNet because of the renaming operation that has to be per-formed in order to obtain the new version of the mataclassnamed as PetriNet. The links between 2 and 3 rep-resent the impact that changing the Net metaclass has onthe existing ATL transformation PetriNet2PNML2. For in-stance, the OCLModelElement Net in the source input pat-tern of the transformation is linked to the evolving metaclassand indicates a possible issue in case of changing that meta-class Net. Of course the package containing the changedclass is involved too (see the connection between the pack-age PetriNet and the OCLModel PetrinetMM0 in the trans-formation). To better understand the connection between2 and 3 , inexpert ATL developers can consider Figure 6
that explicitly represents the considered ATL transforma-tion (see the left-hand side of the figure) and its represen-tation in the TraceVis tool (see the right-hand side of thefigure). For instance, the input and output models of thetransformation header (see OUT and IN of the second line ofthe transformation) are the last two elements in the Trace-Vis representation.
In the remaining of the section we present the proposedtool chain (see Section 4.1) able to generate TraceVis spec-ifications like the one in Figure 5, starting from a depen-
2This transformation is available from http://www.eclipse.org/atl/atlTransformations/Grafcet2PetriNet/ExampleGrafcet2PetriNet\[v00.01\].pdf
dency model like the one in the lower-hand side of Figure 4,and a difference model representing the metamodel changesbeing applied. The realization of the tool chain requiredthe implementation of model-to-model, and model-to-codetransformations, which are detailed in Section 4.2, and Sec-tion 4.3, respectively.
4.1 Proposed tool chainIn order to support the TraceVis visualization of change
impacts, we have implemented a tool chain able to gener-ate artefacts that TraceVis is able to open. In particular,TraceVis is able to manage XML documents like the one inListing 1, which is a fragment of the XML specification ofthe visualization depicted in Figure 5. Essentially, the doc-ument consists of stages, each represent one of the relatedmodels. For instance, Listing 1 contains 3 stages (see lines 4,23, 34) corresponding to the difference model, the PetriNetmetamodel, and the affected ATL transformation shown inFigure 5, respectively. Each stage contains the specifica-tion of nodes, each representing one of the elements relatedto one or more elements contained in another model. Forinstance, the node 75 in line 5 of Listing 1 represents theelement of the difference model encoding the metaclass re-naming. The attributes that can be specified for each nodeinclude the name, the parent node, and additional customattributes that might be useful for automatic manipulations.After the specification of stages, and consequently the con-tained nodes, inter-model relations are given (see lines 54-72in Listing 1).
Listing 1: Fragment of the TraceVis XML file ofvisualization in Figure 5
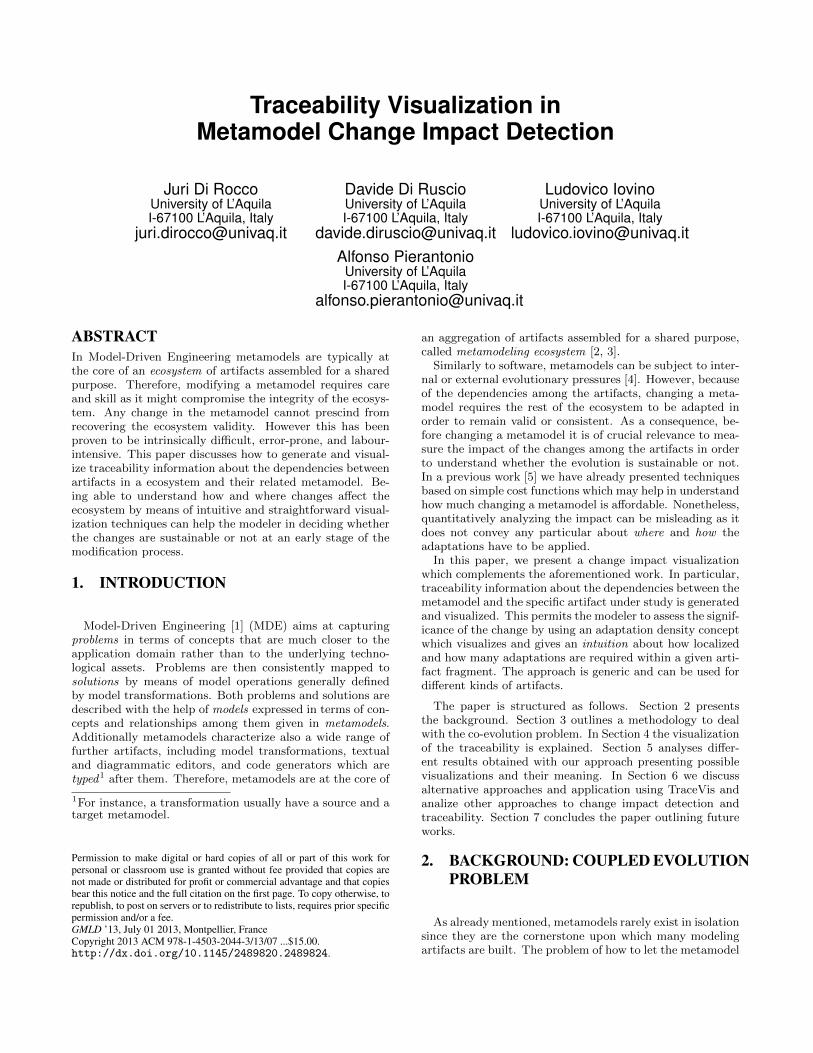
As shown in Figure 7 the generation of TraceVis XMLspecifications is performed in different steps. In particu-lar, given two subsequent versions of the same metamodelMM, and MM’, their differences are calculated by means of theEMFCompare [16]. The outcome of the comparison is the in-put of the model transformation EMFCompare2EcoreDiff [17]able to generate a difference model according to the dif-ference representation approach proposed in [12]. Such adifference model, together with the initial metamodel MM,the existing Artifact which depends on it, and the Depen-
dencyModel (defined in the Dependencies Elicitation step inFigure 3), are taken as input by the model-to-model trans-formation TraceVisGen. The generated TraceVisModel istransformed by means of the model-to-code transformationTraceVisMM2XML able to generate a corresponding XML doc-ument like the one in Listing 1.
In the next section the TraceVisGen transformation is pre-sented, whereas the model-to-code transformation Trace-
VisMM2XML is discussed in Section 4.3.
55
Figure 5: Metaclass renaming visualization
Figure 6: ATL transformation and its representation in TraceVis
56
MM’
MM
EMFCompare DifferenceModel.emfdiff
DifferenceModel.ecorediff
EMFCompare2EcoreDiff
TraceVisGenArtefact
DependencyModel
TraceVisModel TraceVisMM2XML
TraceVisXML
Figure 7: Generation of TraceVis XML specifications
4.2 From dependency models to TraceVis spec-ifications
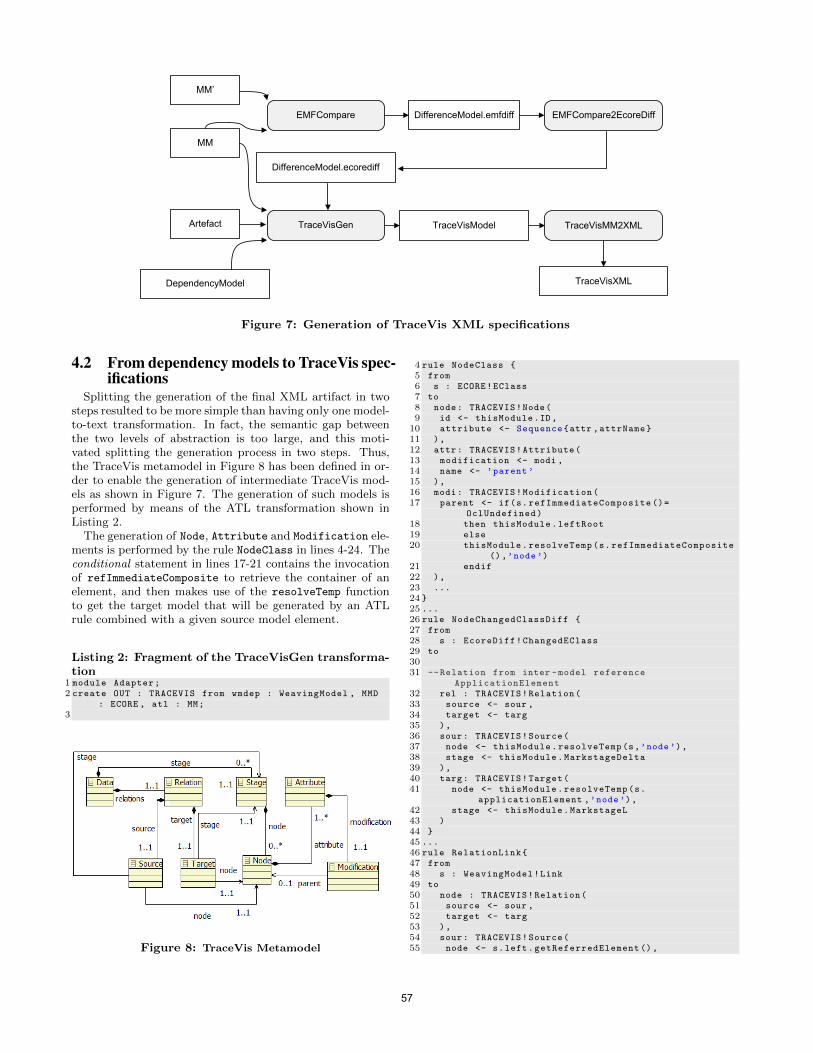
Splitting the generation of the final XML artifact in twosteps resulted to be more simple than having only one model-to-text transformation. In fact, the semantic gap betweenthe two levels of abstraction is too large, and this moti-vated splitting the generation process in two steps. Thus,the TraceVis metamodel in Figure 8 has been defined in or-der to enable the generation of intermediate TraceVis mod-els as shown in Figure 7. The generation of such models isperformed by means of the ATL transformation shown inListing 2.
The generation of Node, Attribute and Modification ele-ments is performed by the rule NodeClass in lines 4-24. Theconditional statement in lines 17-21 contains the invocationof refImmediateComposite to retrieve the container of anelement, and then makes use of the resolveTemp functionto get the target model that will be generated by an ATLrule combined with a given source model element.
Listing 2: Fragment of the TraceVisGen transforma-tion
1 module Adapter;2 create OUT : TRACEVIS from wmdep : WeavingModel , MMD
: ECORE , atl : MM;3
Figure 8: TraceVis Metamodel
4 rule NodeClass {5 from6 s : ECORE!EClass7 to8 node: TRACEVIS!Node(9 id <- thisModule.ID,
Target Relation elements are generated by the rules Node-ChangedClassDiff and RelationLink. In particular, theformer generates the link between the source difference modeland the evolving metamodel. The latter generates the linkbetween the evolving metamodel and the affected artefacts.
It is important to note that our approach is generic andcan be used for supporting the Change Impact Visualiza-tion of any affected artefacts involved in the ecosystem. Infact, by observing the structure of TraceVisGen it is possi-ble to identify a recurring pattern (shown in Listing 3) foreach metaclass MC of the artefact metamodel MM. Thus, itis possible to generate the TraceVisGen transformation foreach artefact using a higher-order transformation (HOT3)which takes the artifacts metamodel and generates the ap-propriate TraceVisGen transformation.
Listing 3: Recurring pattern in the artifact elementnode
4.3 Generation of the TraceVis XML specifi-cations
According to Figure 7, the TraceVisModel generated bymeans of the ATL transformation presented in the previoussection is the input of the TraceVisMM2XML model-to-texttransformation. Such a transformation is implemented bymeans of the Acceleo4 code generator. Acceleo is a template-based approach for generating text from models. Acceleotemplates identify repetitive and static parts of text, andembody specific queries on the source models to fill the dy-namic parts.
This Acceleo template in Listing 4 generates an XML filecalled export.xml. In particular, (i) for each stage in thesource TraceVisModel it generates a <stage> tag, (ii) for eachsource instance of the metaclass Node it creates a <node> tag,and (iii) for each source instance of the metaclass Relation
a target <relation> tag is generated.
5. DISCUSSION
By using the change impact visualization presented above,different recurrent patterns have been identified. In particu-lar, the required changes in the affected artifacts are not al-ways directly proportional to the changes in the metamodelas discussed in the following.Uniform impact The example in Figure 9 is a small setof evolution steps where the delta model contains few con-nections with the evolving metamodel and there is a directcorrespondence with the impact between metamodel and ar-tifact. This situation is recurrent when a metamodel evolvesby means of few atomic changes. In this case the map-
Figure 9: Uniform impact
ping denotes one change in the metamodel correspondes toone change in the artifact, that is not strictly a 1-1 relationbut the number of connections is similar in the two stages.This situation is strongly related to the artifact nature: e.g.,changing a metaclass in the metamodel corresponds to a cor-ruption point in a transformation, in particular in the rulewhere the metaclass in matched as input or output. On thecontrary, considering a model as artifact the correspondenceis different because likely the instances of the metaclass willbe frequently instantiated in the model (see Figure 11).Heavy metamodel evolution - Light impact on theartifact The situation shown in Figure 10 contains a lot ofchanges in the metamodel and less impact on the artifact.This situation is not very frequent but also not rare, accord-ing to our experience. This case implies that the involvedelements in the metamodel are not referred in the artifact.For instance, in case of an extract superclass change5 in the
5http://www.metamodelrefactoring.org/
58
Figure 10: Heavy metamodel evolution - Light impact
on the artifact
metamodel, all the attributes in the subclasses have to beremoved, and a new one in the added super class has to beadded. If the existing artefact is a model transformation,then we will have a light impact because the constructs re-lating to the extracted attribute will not be corrupted andstill matched. Same situation in case of models where thethe class instances continue to be valid because of the inher-itance relation.Light metamodel evolution - Heavy impact on theartifact The example in Figure 11 depicts a strong impacton the metamodel coming from a light metamodel evolution.A typical application of this category can be found in chang-ing or renaming an attribute in a superclass. In case of ATL
Figure 11: Light metamodel evolution - Heavy impact
on the artifact
transformations, the renamed attribute can be duplicatedin all the rules involving the subclasses and this leads to astrong impact for the duplicated information that has to befixed. Removing an attribute from a metaclass can fall inthe same category when this attribute is used many timesin the artifact (e.g., in the case of helpers and rules in ATLtransformations).Heavy metamodel evolution - Heavy impact on theartifact The example in Figure 12 represents a very heavyimpact on the metamodel coming from a heavy metamodelevolution. Such a situation is not common in literature, andrepresents that the metamodel has been heavily changedand consequently the existing artifact has been strongly cor-rupted. This example would be diffused if the metamodelevolution activity was not a step by step evolution.
For example this case would be produced if OMG werepassing from UML 1.0 directly to UML 2.0 avoiding theintermediate versions. Since the metamodel definition is acyclical activity where the metamodeler starts by definingconcepts and refining the corresponding metamodel defini-tion, this case is related to a well defined metamodel thatundergoes strong changes coming from a turn upside down
Figure 12: Heavy metamodel evolution - Heavy impact
on the artifact
of the concepts in the application domain.Non breaking changes with no impact The examplein Figure 13 represents a set of non breaking metamodelchanges that do not impact the existing artifact. We canimagine to transform an abstract metaclass into a real one.In this case, existing transformation rules are not affected.Of course this case can be considered as the best case that
Figure 13: Metamodel non-breaking changes and no
impact on the artifact
a metamodeler can see during the evolution phase, howeverthis is a very rare case.
6. RELATED WORKS
Much research has been conducted on traceability, typi-cally focused on software engineering. However the vast ma-jority of the research is focused on either trace retrieval [18]or trace management [19] and usually neglects the visual-ization part. Trace retrieval is an activity that uses datamining techniques to generate the relations between arti-facts created during the software engineering process. Byanalyzing keywords, relations can be defined between dif-ferent parts of the artifact. Trace management focuses onmaintaining traces during the software development process.In general, this is done by the authors or the maintainers ofthe artifacts. Results of trace retrieval or trace managementare typically visualized using common visualization meth-ods. According to Wieringa [20], visualization approachescan be categorized in matrices, cross-references and graph-based representations. Beyond these three types of visual-ization, there are only a few approaches to visualize tracesin a different way.
The commercial application TBreq is focused on softwareengineering. The artifacts are listed horizontally and if arelation is defined between items of two artifacts an edge is
59
drawn. TBreq does not use the hierarchical structure of ar-tifacts to reduce the size of the model visualization nor doesit use any edge aggregation techniques or edge bundling toreduce cluttering. Although this works for small examples,large examples quickly give visual clutter. Moreover, due tothe fact that individual items of an artifact are displayed asa list, only a limited number of items per artifact can bedisplayed. Nevertheless TBreq does convey traceability in-formation since it gives a (partial) overview and can be usedto quickly follow traces within the data. This tool can alsoshow relations between two non-consecutive artifacts.
Pilgrim et. al. [21] use a three dimensional approach togain insight in transformation chains containing differentUML diagrams. Artifacts are all UML diagrams and areprojected on a plane. Relations are visualized using edgesbetween consecutive planes. Using a three-dimensional ap-proach has little benefits over a two dimensional approachand still gives visual clutter when models become too largeand too many relations are defined between planes. More-over, using the third dimension will lead to occlusion prob-lems when projecting the image to screen.
Marcus et al. [22] propose a visualization method thatonly shows information considered to be important to de-velopers working on a part of a software project. The visu-alization method is similar to cross reference based methodsand shows the various parts of an artefact as a rectangle,and related parts are assigned a similar colour. It is usedto show relations of multiple artefacts, however it can onlyvisualize a small number of dependencies and therefore can-not provide a global overview. Moreover, traces can onlyrecursively be followed.
Briand et al. in [23] propose an approach to analyze theimpact of the changes on the design model before apply-ing the changes to the implementation model. The authorsprovided a classification of change types for three UML dia-grams: class, sequence diagram and state machine diagrams.For each change type, an impact analysis rule is specified, de-scribing how to extract the list of elements that are impactedby that particular change type. The definitions of changetypes and impact analysis rules are expressed in the ObjectConstraint Language (OCL). The propagation of changes toindirectly related entities is controlled by a distance mea-sure, which is used to either stop the change propagationor to prioritize impact paths according to their depth. Aprototype tool (iACMTool) was developed to automate andevaluate the feasibility of such an approach.
Fourneret and Bouquet [24] present an approach to per-form model-based impact analysis for UML Statechart dia-grams using dependence algorithms. The rationale of thistype of analysis is to consider dependencies between transi-tions instead of states. In such context, two transitions aresaid to be data dependent if one transition defines a value ofa variable that can be potentially used by the other transi-tion and they are said to be control dependent if one transi-tion may affect the traversal of the other transition. Basedon this concept, the authors identified the data and controldependencies for UML statecharts and formulated the cor-responding algorithms to be used in computing the depen-dence graphs of the statecharts elements. Accordingly, theyidentified and classified the possible changes to UML state-charts such as adding new transitions, deleting, and modi-fying existing transitions. It is worth to note that adding ordeleting a transition can impact both the data and control
dependence graphs while modifying a transition can impactonly the data dependence graph. By having the two versionsof statecharts (the original and the modified one) and theircomputed dependence graphs, the authors illustrated howtheir proposed dependence algorithms are used to extractthe impacted elements. Our approach is different startingfrom the fact that is artifact-independent; in the cited worksall those approaches are related to specific artifacts or par-ticular set of models. The editor is a two dimensions editorthat offers an advanced set of features like zooming and se-lection. Moreover the important characteristic is that forthe first time we apply those features to the impact visual-ization in MDE ecosystems. Indeed given the independencecharacteristic of the tool chain, it is possible to replace thefinal transformation in order to provide the compatibilitywith other visualization tools.
This work is in part related also to coupled evolution pro-cess and the techniques and methodology for coupled evo-lution have been previously investigated in [25]. Coupledevolution is related to adapt models in response to meta-model changes [4, 26, 7, 6] and only recently, the problemof metamodel evolution/transformation co-adaptation hasstarted to be investigated. Few attempts have been pro-vided to deal with it in a dedicated way [8, 27, 28]. Themethodology proposed in [5] has been extended and in partcompleted in this work adding the visualization activity asa new feature available in the methodology.
Evolution of modelling languages is also treated in [29],where the authors provide a taxonomy for evolution and dis-cuss the various evolution cases for different kinds of mod-eling artifacts. The methodology discussed in this paperproposes to decompose the migration actions into primitivescenarios that can be resolved by the framework.
7. CONCLUSIONS
The problem of adapting the diversity of artifacts compos-ing a metamodeling ecosystem when the metamodel under-goes modifications is intrinsically difficult. Trying to repairmodels, transformations, and editors without the guidanceof a methodology can introduce inconsistencies and lead theecosystem into an ungovernable status. This paper pre-sented a generic approach to change impact visualizationintended as a technique for visualizing the dependencies be-tween Ecore metamodels and related artifacts in terms oftraceability information. The modifications in a metamodelsometimes are not sustainable and being able to assess thisaspect in advance can spare the modeler with unmanage-able difficulties because of the intricacy of the adaptations.Compared with the work in [5] where a cost function is pro-posed, the presented technique conveys to the modeler amore intuitive notion of intensity and locality (see Sect. 5):the visualization permits to informally estimate how manyadaptations are required in a restricted portion of an ar-tifacts and especially the multiplicity of the impact on anartifact of a given metamodel change. Another contributionof the paper is the formalization of the TraceVis metamodelwhich permits to bridge Ecore models with this specific vi-sualization tool.
In the near future, we are interested in the live monitor-ing of the change impact, i.e., as soon as a change is madeon the metamodel information about the impact on related
60
artifacts in the ecosystem are automatically displayed in acontext view. Despite the simplicity of the idea, its realiza-tion requires an operation recorder for registering the modeldifferences in the metamodel, the incremental generation ofthe dependencies between the elements of the metamodeland of the related artifacts, and finally a proper presenta-tion of impact analysis. The visualization can be enrichedwith the categorization of the refactorings in order to pro-vide a more complete idea of the impact on the artifact.Representing this categorization with different colors can beuseful to distinguish different forms of impact.
[2] Iovino, L., Pierantonio, A., Malavolta, I.: On theimpact significance of metamodel evolution in mde.Journal of Object Technology 11(3) (October 2012)3:1–33
[3] Di Ruscio, D., Iovino, L., Pierantonio, A.:Evolutionary togetherness: How to manage coupledevolution in metamodeling ecosystems. In Ehrig, H.,Engels, G., Kreowski, H.J., Rozenberg, G., eds.:ICGT. Volume 7562 of Lecture Notes in ComputerScience., Springer (2012) 20–37
[4] Wachsmuth, G.: Metamodel Adaptation and ModelCo-adaptation. In Ernst, E., ed.: Proceedings of the21st ECOOP. Volume 4069 of LNCS., Springer-Verlag(July 2007)
[5] Di Ruscio, D., Iovino, L., Pierantonio, A.: Amethodological approach for the coupled evolution ofmetamodels and ATL transformation. In: Proc. 6thInternational Conference on Model Transformation(ICMT’13). (2013)
[6] Herrmannsdoerfer, M., Benz, S., Juergens, E.: COPE- Automating Coupled Evolution of Metamodels andModels. (2009) 52–76
[7] Cicchetti, A., Di Ruscio, D., Eramo, R., Pierantonio,A.: Automating Co-evolution in Model-DrivenEngineering. In: 12th IEEE International EDOCConference (EDOC 2008), Munich, Germany, IEEEComputer Society (2008) 222–231
[8] Levendovszky, T., Balasubramanian, D., Narayanan,A., Karsai, G.: A Novel Approach to Semi-AutomatedEvolution of DSML Model Transformation. In: SecondInternational Conference on Software LanguageEngineering, SLE 2009, LNCS. Volume 5969., Denver,CO, Springer, Springer (05/2010 2010)
[9] Di Ruscio, D., Laemmel, R., Pierantonio, A.:Automated co-evolution of GMF editor models. InMalloy, B., Staab, S., van den Brand, M., eds.: 3rdInternational Conference on Software LanguageEngineering (SLE 2010). Number 6563 in LNCS,Springer, Heidelberg (October 2010) 143–162
[10] Di Ruscio, D., Iovino, L., Pierantonio, A.: What isneeded for managing co-evolution in MDE? In:
Proceedings of the 2nd International Workshop onModel Comparison in Practice, ACM (2011) 30–38
[11] Jouault, F., Allilaire, F., Bezivin, J., Kurtev, I.: Atl:A model transformation tool. Science of ComputerProgramming 72(1-2) (2008) 31–39
[12] Cicchetti, A., Di Ruscio, D., Pierantonio, A.: AMetamodel Independent Approach to DifferenceRepresentation. Journal of Object Technology 6(9)(October 2007) 165–185
[13] Di Ruscio, D., Iovino, L., Pierantonio, A.:Evolutionary togetherness: how to manage coupledevolution in metamodeling ecosystems. In: Intl. Conf.on Graph Transformations (ICGT 2012). Volume 7562of LNCS., Springer (2012)
[14] van Ravensteijn, W.: Visual traceability acrossdynamic ordered hierarchies. Master’s thesis,Eindhoven Univ. of Technology, The Netherlands(2011)
[15] Amstel, M., Brand, M., Serebrenik, A.: Traceabilityvisualization in model transformations with tracevis.In Hu, Z., Lara, J., eds.: Theory and Practice ofModel Transformations. Volume 7307 of Lecture Notesin Computer Science. Springer Berlin Heidelberg(2012) 152–159
[16] Brun, C., Pierantonio, A.: Model Differences in theEclipse Modeling Framework. UPGRADE, TheEuropean Journal for the Informatics Professional9(2) (April 2008)
[17] Pierantonio, A., Iovino, L., Di Rocco, J.: Bridgingstate-based differencing and co-evolution. In: Modelsand Evolution Workshop - 15th InternationalConference on Model Driven Engineering Languagesand Systems. (September 2012)
[18] Lucia, A.D., Fasano, F., Oliveto, R., Tortora, G.:Recovering traceability links in software artifactmanagement systems using information retrievalmethods. ACM Trans. Softw. Eng. Methodol. 16(4)(September 2007)
[19] Lozano, A., Pinter, R.Y., Rokhlenko, O., Valiente, G.,Ziv-ukelson, M.: Seeded tree alignment and planartanglegram layout
[20] Wieringa, R.: An introduction to requirementstraceability (September 1995) Acknowledgements:This report benefited from input given by EricDubois, Anthony Finkelstein and Hanna Luden.
[21] Pilgrim, J., Vanhooff, B., Schulz-Gerlach, I., Berbers,Y.: Constructing and visualizing transformationchains. In Schieferdecker, I., Hartman, A., eds.: ModelDriven Architecture aAS Foundations andApplications. Volume 5095 of Lecture Notes inComputer Science. Springer Berlin Heidelberg (2008)17–32
[22] Marcus, A., Xie, X., Poshyvanyk, D.: When and howto visualize traceability links? In: Proceedings of the3rd international workshop on Traceability inemerging forms of software engineering. TEFSE ’05,New York, NY, USA, ACM (2005) 56–61
[24] Fourneret, E., Bouquet, F.: Impact analysis foruml/ocl statechart diagrams based on dependence
61
algorithms for evolving critical software. LaboratoiredaAZInformatique de Franche-Comte, Besancon,France, Tech. Rep. RT2010-06 (2010)
[25] Favre, J.M.: Meta-Model and Model Co-evolutionwithin the 3D Software Space. In: Procs. of the Int.Workshop ELISA at ICSM. (September 2003)
[26] Rose, L.M., Kolovos, D.S., Paige, R.F., Polack,F.A.C.: Model Migration with Epsilon Flock. In:ICMT. (2010) 184–198
[27] Garcıa, J., Dıaz, O., Azanza, M.: Model
transformation co-evolution: A semi-automaticapproach. In: SLE. (2012) 144–163
[28] Mendez, D., Etien, A., Muller, A., Casallas, R.:Transformation migration after metamodel evolution.In: International Workshop on Models and Evolution(Me’10) - ACM/IEEE MODELS’2010. (2010)
[29] Meyers, B., Vangheluwe, H.: A framework forevolution of modelling languages. Science of ComputerProgramming 76(12) (2011) 1223 – 1246