Tracer Study of Science & Technology (S&T) Graduates passed out from Universities in Sri Lanka (2000/2001) R.P. Pathirage P.R.M.P. Dilrukshi A.P. Hettiarachchi Management Information System (MIS) Unit Science Policy Research Division National Science Foundation Sri Lanka September 2003 1
Transcript
Tracer Study of Science & Technology (S&T) Graduates
passed out from Universities in Sri Lanka (2000/2001)
R.P. Pathirage
P.R.M.P. Dilrukshi
A.P. Hettiarachchi
Management Information System (MIS) Unit
Science Policy Research Division
National Science Foundation
Sri Lanka
September 2003
1
Tracer Study of Science & Technology ( S & T ) Graduates
passed out from Universities in Sri Lanka (2000/2001)
R.P. Pathirage
P.R.M.P. Dilrukshi
A.P. Hettiarachchi
Management Information System (MIS) Unit
Science Policy Research Division
National Science Foundation
Sri Lanka
September 2003
Tracer Study of Science & Technology (S&T) Graduates passed out from Universities in Sri Lanka (2000/2001)
No part of this report may be reproduced, photocopied, or distributed in any form or by any means with out prior permission of the Science Policy Research Division of the
National Science Foundation
Management Information System (MIS) Unit Science Policy Research Division National Science Foundation No. 47/5, Maitland Place Colombo 07 Sri Lanka.
The Management Information System (MIS) Unit of the National Science Foundation (NSF) wishes to express its gratitude to Prof. Ranjan Ramasamy, Chairman and Mr. M. Watson, Director of the NSF for the encouragement and co-operation extended to the Unit to carry out this study.
The Unit wishes to express its profound gratitude to Mr. R.M.W. Amaradasa, Director -Scientific Affairs and the former IPCU Coordinator of the NSF, Mrs. D. Talagala, the former Director - Information and the former IPCU Coordinator of the NSF, Mr. B. Balakumar, the former Project Manager of the MIS Unit and Mrs. S. Wickremasinghe, the present Project Manager of the MIS Unit for their invaluable guidance, suggestions and advices.
This study would not have been a success, if not for the financial assistance provided by the ADB Science & Technology Personnel Development (STPD) Project of the Ministry for Economic Reform, Science and Technology. Therefore, the gratitude of the Unit goes to Mr. D.B. Sumithraarachichi, Director of STPD Project and Ms. S. Weerapperuma, Manager, Benefit Monitoring Evaluation of the STPD Project for their encouragement and suggestions and also for the funds provided through the Project.
The Unit wishes to thank all the Deans, Registrars, Assistant Registrars, in all the relevant faculties of Universities and all the IPCU Coordinators of universities benefiting from the STPD Project for their assistance in obtaining the addresses of the graduates, which was a prerequisite for this study.
The thanks of the Unit goes to Mr. G.D. Sanath Ratnasekera, Mr. R.T.S. Nagahawatta, Mr. K. H. Ramanayake, Mr. A.C.A. Jayasundera, Mr. R.M.L.K. Ratnayake, Mr. D.M.M.S. Dissanayake and Ms. M.U. Gayani, who worked as Research Assistants in collecting addresses from the universities.
The special thanks of the Unit goes to all graduates who have responded to the questionnaire of this tracer study as their valuable contributions resulted in the core findings of this study.
The Unit is indebted to Ms. Chandima Samerasinghe, Mr. Prabash Wickremasinghe and Ms. Manoja Jayasekera, the staff at the MIS Unit for their untiring efforts in mailing questionnaires, data entry, word processing and finalizing the contents for publishing this report. The Unit also wishes to thank Mrs. P.M.D.D. Dahanayaka and Ms. M.D.V.N. Yasapalitha of the NSF for assistance given in data entry.
i
Preface
This report was compiled by the Management Information System (MIS) Unit, which comes under the Science Policy Research Division of the National Science Foundation.
The report is based on the data collected in a questionnaire-based survey of graduates who have passed out during the period of 2000 and 2001 from faculties of agriculture, science and engineering of all 13 universities in Sri Lanka.
Being the third in a series of such surveys, the aim of this study was to gain in-depth understanding of the current employment status of the above graduates and the related issues such as sector of employment, absorption patterns and rates into the labour market, obstacles faced by graduates in finding suitable employment, etc.
It is expected that the findings of this study will be useful to facilitate in the policy changes in relation to effective utilization of young science & technology (S&T) graduates who have been deployed to the labour force.
Since, the MIS Unit is currently dealing with the next tracer study (graduates who have passed out in 2002), the Unit would welcome constructive comments and criticisms on this study/report in order to refine and streamline the proposed study as well as the subsequent studies.
ii
Contents
Acknowledgement Preface Contents List of Tables List of Figures
1. Introduction 1.1. Previous related studies 1.2. Current study
2. Overall aim and specific objectives
3. Scope of the study
4. Methodology
4.1. Data analysis
5. Status of responses
6. Assumptions
7. Limitations
8. Basic characteristics of graduates who responded 8.1. Distribution of graduates by gender 8.2. Distribution of graduates by degree course 8.3. Distribution of graduates by achievement at the final examination
9. Current employment status of the graduates 9.1. Current employment status and gender 9.2. Current employment status and degree courses 9.3. Current employment status and field of study
9.4. Current employment status and achievements at the final examination 9.5. Current employment status and university attended
10. Employed graduates 10.1. Sector of employment 10.2. Sector of employment and degree course 10.3. Sector of employment and achievements at the final examination 10.4. Waiting time
10.4.1. Waiting time and degree course 10.4.2. Waiting time and achievements at the final examination 10.4.3. Waiting time and sector of employment
10.5. Employment categories of graduates 10.6. Views of employed graduates regarding the effectiveness of degree courses
in relation to current employment
11. Unemployed graduates
12. Self employed graduates
13. Professional programmes followed by the graduates
14. Obstacles faced by graduates when finding a suitable employment
15. Summary
15.1. Key indicators
16. Discussion
17. References
18. Annex 1 (Questionnaire)
iii
List of Tables
Page Table 1 : Status of responses 6 Table 2 : Employment status of graduates (1997-2001) 12 Table 3 : Employment status of graduates by degree course (1997 -2001) 15 Table 4 : Employment status by achievements at the final examination (1997 - 2001) 21 Table 5 : Employment rates by degree course / achievements at the final examination 23 Table 6 : Employment rates / Unemployment rates by universities 22 Table 7 : Sector of employment of employed graduates (1997 - 2001) 26 Table 8 : Sector of employment by degree course 26 Table 9 : Sector of employment by achievements at the final examination 27 Table 10 : Waiting time of graduates according to gender 28 Table 11 : Waiting time of graduates (1997 -2001) 29 Table 12 : Waiting time of graduates according to degree course 30 Table 13 : Waiting time of graduates according to achievements at the final examination 32 Table 14 : Waiting time of graduates by sector of employment 33 Table 15 : Designations of employed graduates 34 Table 16 : Views of graduates on the effectiveness of degree course 35 Table 17: Views of graduates on the relevance of degree course to current employment 36 Table 18 : Reasons for being engaged in fields not related to degree course 37 Table 19 : Unemployment rates by degree course / achievements at the final examination 37 Table 20 : Reasons for being self-employed 39 Table 21 : Areas of professional qualifications followed by the graduates 39 Table 22: Obstacles faced by graduates when finding employment 40 Table 23 : Key indicators 42
iv
List of Figures
Page Figure 1 : Responses according to universities 7 Figure 2 : Distribution of graduates by gender and degree course 9 Figure 3 : Current employment status of graduates 11 Figure 4 : Current employment status by gender 13 Figure 5 : Current employment status by degree course 14 Figure 6 : Current employment status by field of study (Agriculture) 16 Figure 7 : Current employment status by field of study (Engineering) 18 Figure 8 : Current employment status by field of study (Science) 20 Figure 9 : Current employment status by achievements at the final examination 21 Figure 10 : Current employment status according to universities 23 Figure 11 : Sector of employment of employed graduates 25 Figure 12 : Waiting time of graduates 29 Figure 13 : Waiting time of graduates according to degree course 31 Figure 14 : Waiting time of graduates according to achievements at the final examination 32 Figure 15 : Waiting time of graduates by sector of employment 33
Tracer Study of Science & Technology (S&T) Graduates passed out from
Universities in Sri Lanka (2000/2001)
1. Introduction:
It is a well-known fact that the contribution by science and technology (S&T) manpower plays a vital role in the economic growth and development of the country. Universities are one of the major institutes that supply S&T manpower in Sri Lanka. According to the University Grants Commission (UGC) statistics, 4131 graduates in the fields of S&T (such as science, agriculture and engineering) have been deployed to the labour force during the period of 2000 and 2001. Further, the Government has spent around Rs. 5111m and Rs. 6105m on university education (recurrent and capital expenditure of the whole university sector) in 2000 and 2001 respectively (about 0.5% of the Gross National Product - GNP). (University Grants Commission, 2002). It is obvious that, the production of such a number of graduates by spending a considerable amount of Government finances should be effectively utilized towards the economic development of the country.
Although, the shortage of qualified personnel with higher education in S&T will cause an adverse impact on the country's economic development, the over production of manpower in these areas without giving any consideration to the absorption capacity of the labour market will result in unemployment among the S&T graduates. Therefore, regular assessments (quantitative and qualitative) of the demand and supply of manpower in various areas of S&T are essential issues. This would definitely help the relevant authorities to identify the gaps between demand and supply of graduates to the labour market and to take suitable action/policy initiatives or alternative decisions in advance to avoid the surplus or shortage of graduates in different disciplines accordingly. This in turn facilitates the policy changes in relation to the improvement of the quality of the graduates by changing the existing curricular, to suit the prevailing requirements of the labour market.
Labour force surveys, graduate follow-up studies, case studies on employment & unemployment etc., are some of the tools that can be used to assess the above issues.
1
1.1. Previous related studies : There were several studies, which have been recently undertaken by local institutes in relation to employability of manpower and related issues.
The Department of Census and Statistics, Sri Lanka conducts surveys on labour force on a quarterly basis, to measure the levels and trends of employment, unemployment and labour force in Sri Lanka. The labour force survey in the fourth quarter of 2002 indicates that the unemployment rate among all age groups was 7.5% where as it was 29.2% and 10.1% among the age groups 20-24 and 25-29 respectively (most of the recently passed out graduates may belong to these two groups). Further, the unemployment rate among persons who have passed G.C.E. (A/L) and above was 26.4%. (Department of Census and Statistics, 2002).
The Ministry of Tertiary Education and Training has conducted a survey of unemployed graduates in Sri Lanka in mid 2002. According to this, about 26,000 graduates, who had passed out from over 13 universities and 13 higher education institutes claimed that they were unemployed or under employed or partly employed. There were also some useful statistics given in relation to unemployment of graduates in various disciplines. (The Island, 21/06/2003).
Apart from the above surveys, certain public and private sector institutes conduct studies/surveys by addressing different issues in relation to employment and unemployment [eg. Institute of Policy Studies (IPS), conducts various case studies in relation to the above areas; Tertiary and Vocational Education Commission (TVEC), publishes information bulletins on labour market on a quarterly basis, etc). However, most of the above studies generally address all sectors and but no special reference given to S&T graduates.
The Project Implementation Unit (PIU) of the ADB funded Science & Technology Personnel Development (STPD) Project of the Ministry of Economic Reform, Science & Technology has conducted a tracer study on S&T graduates in the year 1999, as a part of the baseline information documentation, under Benefit Monitoring Evaluation (BME) activities of the Project. The aim of this study was to analyse the first destination, employment status and income level of the graduates who have passed out in 1997 from the seven universities (University of Colombo, University of Peradeniya, University of Kelaniya, University of Sri Jawawardenepura, University of Moratuwa, University of Ruhuna and the Open University) benefiting from the Project. According to the results, the overall employment rate of the S&T graduates who have
2
passed out in 1997 was 71.9% and the unemployment rate was 5.7%. The rest of the graduates (21.7%) were involved in temporary employments, further education etc. According to the degree course, the employment rate was highest (77.8%) among the B.Sc. science-general degree (bio-science) graduates and lowest among both the B.Sc. science-special degree and B.Sc. agriculture graduates (65.3% and 64.5% respectively). Further, the unemployment rate was highest (11.8%) among the B.Sc. science-general degree (physical-science) graduates. There were also some useful statistics presented in the report of this survey in relation to graduates who have passed out in 1997. (Science & Technology Personnel Development Project, 2000).
Subsequently, another study was carried out by the Management Information System (MIS) Unit of the NSF for graduates (in different S&T disciplines) who have passed out in 1998 and 1999 from all the Universities in Sri Lanka except the University of Jaffna and the South-Eastern University. The results indicated that, the out of the total respondents, 78.0% were employed while 14.6 % were unemployed. The employment rate was highest among the B.Sc. engineering graduates (96.1%), followed by B.Sc. science-special degree graduates (89.5 %), B.Sc. science-general degree (physical-science) graduates (76.3%), B.Sc. agriculture graduates (75.5%) and B.Sc. science-general degree (bio-science) graduates (64.8%). The unemployment rate was highest among graduates with B.Sc. science-general degree (bio-science) (i.e. 24.1%) followed by B.Sc. science general degree (physical-science) (i.e. 18.6%), B.Sc. agriculture degree (15.1%), B.Sc. science-special degree (3.0%) and B.Sc. engineering degree (0.7%) graduates. This study also provided statistics on sector of employment, salary structure of graduates, absorption rates of graduates, etc. Apart from that, an attempt was made to project the demand and supply of S&T graduates in years 2002,2003, and 2004. The main setback of this study was the low number of responses received (36%) and it was felt that further improvement was needed in the methodology used to gather data. (National Science Foundation, 2002).
1.2. Current study: It was noted that, to investigate the actual absorption pattern of S&T graduates in the labour market, and to make recommendation accordingly for policy initiatives, a series of data were needed. Having noted this, the next tracer study was commenced on January 2003 by the MIS Unit of the NSF. This survey was conducted on S&T graduates who have passed out in 2000 and 2001 from all the Universities in Sri Lanka, utilizing the funds from the STPD Project.
3
Again, the analysis of this study was focussed on gaining an insight of the current employment status of graduates, absorption patterns and rates for various sectors of the labour market, the demand in different fields of study, etc.
2. Overall aim and specific objectives : The overall aim of this study was to gain an in-depth understanding of the labour market of the recently passed out graduates in different disciplines in the field of S&T. Other specific objectives were to;
1. Analyse the current employment status of S&T graduates in different disciplines. 2. Analyse the absorption patterns of graduates in different sectors of employment. 3. Analyse the patterns and the rate of absorption of graduates into the labour market. 4. Analyse the obstacles faced by graduates in the process of securing jobs in the labour
market.
3. Scope of the study : The study was carried out for the graduates who have passed out in the years 2000 and 2001 from the faculties of science, agriculture, and engineering in all the Universities of Sri Lanka namely University of Colombo, University of Peradeniya, University of Kelaniya, University of Moratuwa, University of Ruhuna, University of Sri Jayawardenepura, the Open University of Sri Lanka, University of Jaffna, Rajarata University of Sri Lanka, Sabaragamuwa University of Sri Lanka, South-Eastern University of Sri Lanka, Eastern University of Sri Lanka, and Wayamba University of Sri Lanka. In some faculties of certain universities, no graduates had passed out during the above period owing to several reasons (the first batch following the B.Sc. engineering degree program at the Faculty of Engineering, University of Ruhuna are still in the university. No graduates have passed out from the Faculty of Science, University of Kelaniya in 2001).
4. Methodology: It was noted that data collection was totally dependent on the addresses of the graduates, given by the respective universities. The addresses of the graduates available at the universities may not be accurate, since they were given by the University Grants Commission, to each University during the intake of graduates. Therefore, certain steps were taken, to find out the accuracy of the addresses. A paper advertisement was published in three languages (Sinhala, Tamil & English), informing the graduates (specially those who were unemployed) that their present
4
addresses were required for the tracer study and were requested to update the addresses available with the Registrars and the Deans of the respective faculties.
Research Assistants (RAs) were recruited for each university benefiting from the STPD Project (such as University of Colombo, University of Moratuwa, University of Peradeniya, University of Kelaniya, University of Sri Jayawardenepura, University of Ruhuna and Open University) for a period of three months. They were assigned to collect the addresses as well as certain basic information (such as achievements, effective date of the degree, etc, which were available at universities) of graduates who have passed out from these universities and to feed the data in to databases prepared by the MIS Unit. Further, they were requested to function in collaboration with the respective Deans of Universities, Directors of related Postgraduate Institutes, Assistant Registrars of the Faculties, IPCU Coordinators and the respective Alumni Associations in collecting information. Guidelines and the TOR for data collection were developed and the Project Manager of the MIS Unit regularly monitored the progress of data collection. Accordingly, addresses of graduates who have passed out from the above seven universities were compiled. The lists of names and addresses of the graduates who have passed out from other five universities were obtained directly from the respective Deans, Assistant Registrars of relevant faculties or Examination Branches of each university.
A structured questionnaire (annex 1) was prepared to gather detailed information from the graduates and it was posted according to the address lists available in the above databases. The questionnaire was prepared in English & Sinhala and English & Tamil. The covering letter that gave the introduction and the aims of this study, prepared by the NSF, was annexed to the questionnaire to give a basic idea to the respondents about the requirements of this study. The questionnaire was accompanied with a stamped, addressed envelope to enable the respondents to return the duly filled questionnaire to the NSF. A separate sheet was annexed to the questionnaire, which had to be filled and returned by the occupants at the respective address, if the relevant person was no longer living at that address. Thus, the occupant was requested to give the present address of the graduate.
4.1. Data analysis:
The collected data were entered using visual basic (VB) interface into the database prepared by MS Access. Data analysis was conducted using Statistical Software Package for Social Sciences (SPSS).
5
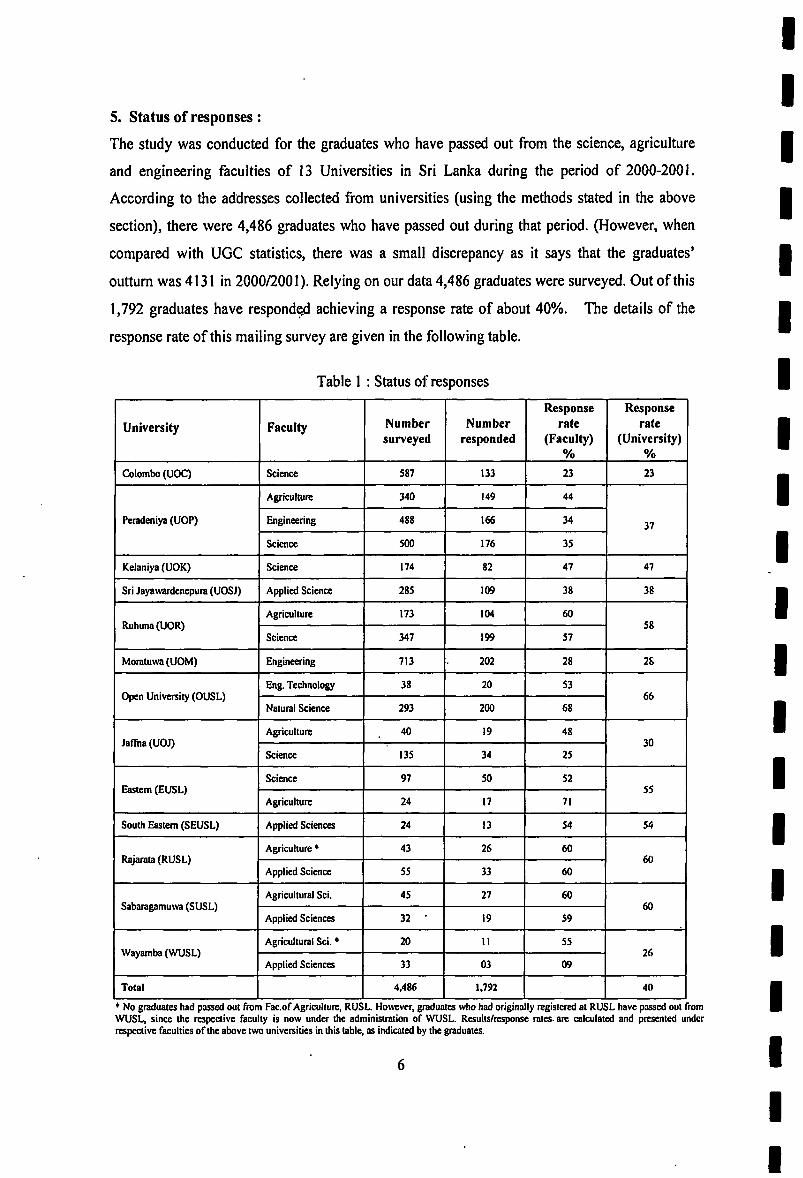
5. Status of responses : The study was conducted for the graduates who have passed out from the science, agriculture and engineering faculties of 13 Universities in Sri Lanka during the period of 2000-2001. According to the addresses collected from universities (using the methods stated in the above section), there were 4,486 graduates who have passed out during that period. (However, when compared with UGC statistics, there was a small discrepancy as it says that the graduates' outturn was 4131 in 2000/2001). Relying on our data 4,486 graduates were surveyed. Out of this 1,792 graduates have responded achieving a response rate of about 40%. The details of the response rate of this mailing survey are given in the following table.
* No graduates had passed out from Facof Agriculture, RUSL. However, graduates who had originally registered at RUSL have passed out from WUSL, since the respective faculty is now under the administration of WUSL. Results/response rates, are calculated and presented under respective faculties of the above two universities in this table, as indicated by the graduates.
6
Figure 1 : Responses according to universities
According to the response rates, graduates who have passed out from the Open University
(66%), showed the highest response rate followed by Rajarata University (60%), Sabaragamuwa
University (60%), University of Ruhuna (58%), Eastern University (55%), South Castcrn
University (54%), University of Kelaniya (47%), University of Sri Jayawardenepura (38%).
University of Peradeniya (37%), University of Jaffna (30%), University of Morauwa (28%) and
Wayamba University (26%). The lowest response rate was indicated by the graduates who have
passed out from the University of Colombo (23%). According to the degree courses, the
agriculture graduates showed the highest response rate (52%). which was followed by science
graduates (41%) and engineering graduates (31%).
6. Assumptions :
1. The lists of graduates with their addresses collected from universities were assumed as
accurate.
2. The information furnished by the responded graduates was assumed as correct.
3. Only a 40% response rate has been achieved, though it was expected to gather information
from all the graduates (4,486) who had passed out during the period of 2000 and 2001.
Therefore, the number of responses was taken as the sample, assuming that the said sample
adequately represents the total population of S&T graduates, who had passed out in
2000/2001.
7
7. Limitations : As in the previous study (tracer study of graduates who passed out in 1998/99), it was expected that, a sample survey should be conducted among non-respondents as well as respondents (by personal interviews), in order to test whether there was a bias towards any direction (employed graduates or unemployed graduates) under this study as well. However, it was realized that the MIS Unit was not in a position to carry out this kind of survey due to limitation of manpower, funds and also due to other dealings with very tight schedules.
Further, the questionnaire was reduced into two pages assuming that the responses from graduates would increase when a lesser number of questions were asked from them (in the previous survey, a number of pages in the questionnaire was five). When reducing the pages, certain important questions in relation to first paid employment (other than their current employment) and certain questions in relation to current employment such as the main function of occupation, management level, income level, etc, were omitted.
8. Basic characteristics of graduates who responded :
8.1. Distribution of graduates by gender: From the sample of responded graduates (1792), 57.6% were males. The gender distribution among the science and agriculture graduates was around 50%. However, it is significant that about 87.4% of the engineering graduates were males, which reveals that males are still dominating the field of engineering.
8.2. Distribution of graduates by degree course : From the total of 1792 graduates who have responded, the highest percentage consisted of the science graduates (59.1%), followed by engineering and agriculture graduates with a percentage of 21.7% and 19.3% respectively. The 59.1% of science graduates consisted of graduates who have followed B.Sc. general degree courses (51.3%) and of graduates who have followed B.Sc. special degree courses (7.8%) in the science stream. Further, the 51.3% of those who have followed the B.Sc. science-general degrees consisted of those who have followed the degree in bio-science stream (27.6%) and physical-science stream (23.7%). This distribution only shows how the sample consists of graduates in different disciplines and the distribution may depend on the number of graduates who have passed out as well as number of graduates who have responded from different disciplines/universities.
8
2 z
2 0 0 0
1800
1600
1400
1200
1000
8 0 0
6 0 0
4 0 0
2 0 0
0
( 1 0 0 % )
(21 .7%)
( 5 1 . 3 % )
Engineering Agriculture Science-general
• Female I Male
Science special
• Total
Figure 2 : Distribution of graduates by gender and degree course
8.3. Distr ibution o f graduates by achievement at the final examinat ion :
When considering the level of achievement at the final examination of the graduates, only 3.9
percent of those who responded have obtained first classes, while 14.1%, 24.3% and 57.6% have
obtained second-class upper divisions, second-class lower divisions and ordinary passes
respectively. The distribution of female and male graduates according to their achievements at
the final examinations showed a similar type of pattern, to that of level of achievements in the
total number of graduates. However, higher proportions of males (60.6%, 57.3% and 52.9%)
have achieved ordinary passes, second-class lower divisions and first classes respectively. The
level of performance was slightly better among female graduates (52.6%) than that of males in
achieving second-class upper divisions.
9. Cur ren t employmen t status o f the graduates :
Under this study, the graduates were given the opportunity to mention their present status
according to five given choices. Accordingly, they were classified under categories such as
'engaged in employment', 'engaged in employment as well as higher education', 'engaged in only
further education', 'self-employed' and 'unemployed'.
Employed graduates were considered as graduates who worked as paid employees or employers
at the time the survey was conducted. They may be engaged in full-time or part-time work on
permanent or temporary basis. The sectors of employment of the employed graduates were formal employment sectors such as 'government', 'semi-government', 'private' and 'other sectors [non-governmental organizations (NGOs), foreign funded projects, etc]. For the analysis, it was considered that those 'engaged in only employment' and those 'engaged in employment as well as higher education', as 'employed graduates'.
Those engaged in only full-time postgraduate studies (PG Diplomas, MScs, MPhils and PhDs) were considered as 'graduates pursuing only further studies'. Graduates engaged in 'employment as well as higher education' were not included under this category, since they may not be involved in full-time postgraduate studies.
The graduates engaged in their own business/employment (own account workers) were considered as 'self-employed graduates'. Since it is worth to identify the details of self-employed graduates in the field of S&T, they were considered separately from the employed graduates for the analysis.
The graduates who were available and looking for employment, and who were unemployed at the time the survey was conducted were considered as 'unemployed graduates'. However, as indicated above, those 'engaged in only further studies' were not included under unemployed graduates as they were involved in studies.
In addition to the above categories, there were a certain percentage who has mentioned none of the above choices and those were considered as 'not specified'.
Accordingly, the following inferences were made.
The present employment status of the graduates who have responded were such that 61.0% were employed graduates, 30.5% were unemployed graduates, 3.6% were engaged in further education only (in full-time postgraduate studies), and 2.3% of were self employed. In addition, 2.6% of the graduates have not mentioned their present status was considered as not specified.
The 61.0% of employed graduates consisted of permanently employed graduates (35.9%), temporary employed graduates (23.9%) and a small portion of those who have not mentioned the nature of employment (1.2%).
10
Unemployed graduates z Not specified
2 6%
Self-employed graduates
2.3%
30.5%
Employed graduates
61 0% Further
education only 3.6%
Figure 3 : Current employment status of graduates
A 7.2% of graduates were engaged in employment as well as in postgraduate studies. It was
not clear whether they were engaged in postgraduate studies on a full-time basis or on a part-
time basis. This percentage was included under the category of 'employed graduates' of the
above five categories. However, the total percentage of graduates engaged in postgraduate
studies (full-time/part-time) in spite of being employed, would be 10.8% (i.e. the total of those
'engaged in full-time further studies' - 3.6%, and 'engaged in employment as well as further
education' - 7.2%). [It is worthwhile to note that the total number of S&T graduates enrolled in
universities for postgraduate studies (at faculties of science, agriculture and engineering of the
respective universities and related postgraduate institutes/other institutes such as Postgraduate
Institute of Agriculture, Postgraduate Institute of Science, Institute of Computer Technology,
etc) at the time this survey was conducted (beginning of 2003) was 1681. These students may
enrolled for in PG Diplomas, M.Scs, M.Phils or PhDs. But, the total number (1681) may have
consisted not only the graduates who have passed out from Sri Lankan universities during the
period of 2000 and 2001, but also the graduates who have passed out even before 2000.
(University Grants Commission, 2002)].
When comparing the employment status of graduates who have passed out in subsequent years
(i.e. years 1997, 1998/1999 and 2000/2001), the following useful results can be observed.
I 1
The employment rates of S&T graduates has declined marginally from 89.1% in 1997 to 61.8% in 2000/01 (78.0% in 1998/99), while the unemployment rates of the graduates showed a rapid increase. The unemployment rate of graduates has doubled from 1997 (5.7%) to 1998/99 (14.6%) and it shows a similar shift from 1998/99 to 2000/01 (30.5%). Therefore, it is tragic that, the unemployment rate has increased in more than five times within a period of four years (1997-2001).
Table 2 : Employment status of graduates (1997 - 2001) Employment status 1997 1998/99 2000/01 Employed graduates 89.1(,) 78.0(2) 61.0(3)
Further education only 4.5 3.0 3.6 Self-employed graduates C) 1.0 2.3 Unemployed graduates 5.7 14.6 30.5 Not specified 0.7 3.4 2.6 Total 100% 100% 100%
Note: (,)This percentage (89.1) consists of permanently employed graduates (71.9%) and temporary employed graduates (17.2%).
(2) This percentage (78.0) consists of permanently employed graduates (54.8%) and temporary employed graduates (23.2%).
(3)This percentage (61.0) consists of permanently employed graduates (35.9%) and temporary employed graduates (23.9%).
(t) Percentage of self-employed graduates was included under 'employed/temporary employed' graduates. 1.9% of the 'employed/temporary employed' graduates were self-employed.
9.1. Current employment status and gender: It can be seen that, among the employed graduates 63.1% were males, while 36.9% were females. Further, among the sample of male graduates, 66.8% were employed whereas in the female sample only 53.0% were employed. The proportion of male graduates engaged in only further education was slightly higher than that of female graduates. It is significant that among the unemployed graduates, the percentage of females was higher (55.3%) than that of males. Further, in the sample of male graduates, 23.6% were unemployed whereas in the female sample, 39.8% were unemployed. In addition, 83.3% of the self-employed graduates were males.
12
• Not specified
• Unemployed graduates
• Self-employed graduates
• Further education only
• Employed graduates
Female Male
Gender
Figure 4 : Current employment status by gender
9.2. Current employment status and degree courses :
When considering the degree courses, the employment rate was highest (79.9%) among
engineering graduates, followed by B.Sc. science-special graduates (67.9%), B.Sc. science-
general graduates (57.0%) and B.Sc. agriculture graduates (47.6%). According to the sample of
employed graduates, those who have followed B.Sc. science-general degrees were dominant
(47.9%), followed by 28.3%, 15.1% and 8.7% from graduates who have followed B.Sc.
engineering, B.Sc. agriculture and B.Sc. science-special degrees respectively.
Furthermore, unemployment rate was highest among the agriculture graduates (43.2%) followed
by B.Sc. science-general degree graduates (36.3%) and B.Sc. science-special degree graduates
(22.9%). The unemployment rate was lowest among engineering graduates (8.0%).
Graduates who have followed B.Sc. science-special degrees tend to be engaged more in higher
education (7.9%) than the other graduates who have followed other degrees (agriculture - 4.3%,
B.Sc. science-general - 3.0% and B.Sc. engineering - 2.3%).
13
• Not specified
• Unemployed graduates
• Self-employed graduates
• Further education only
• Employed graduates
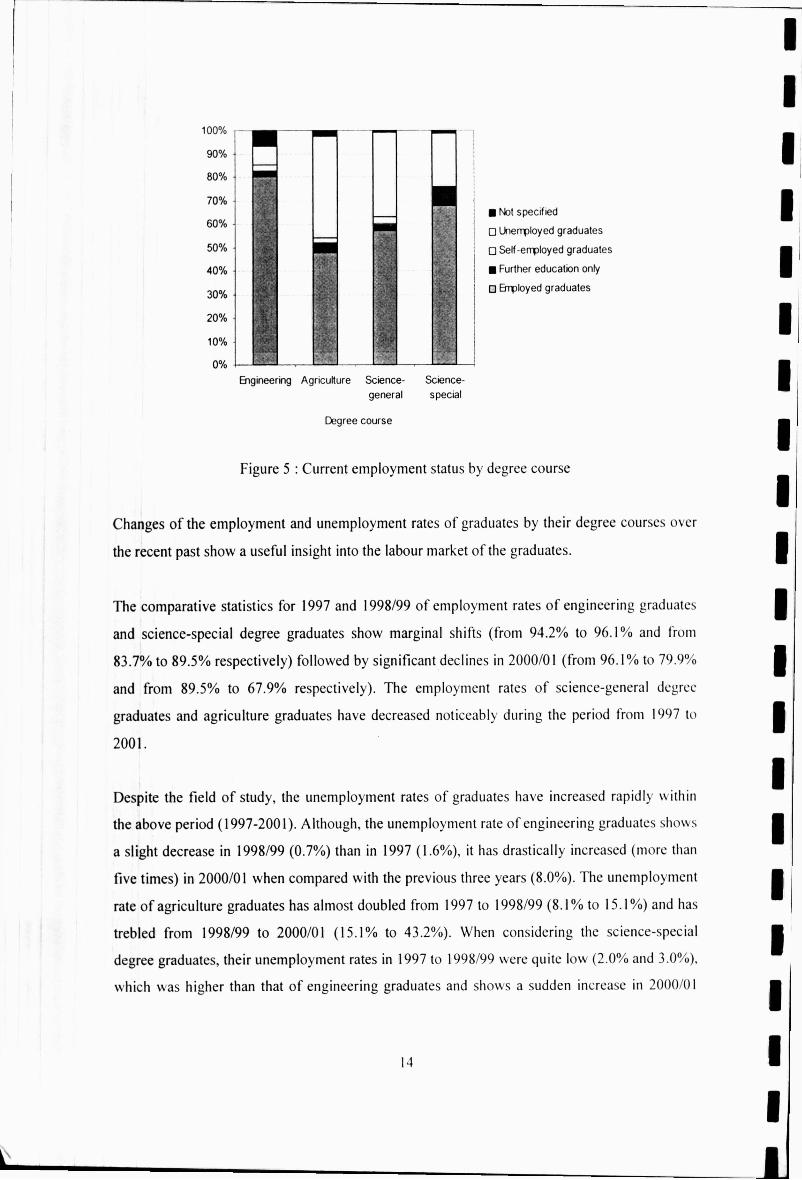
Figure 5 : Current employment status by degree course
Changes of the employment and unemployment rates of graduates by their degree courses over
the recent past show a useful insight into the labour market of the graduates.
The comparative statistics for 1997 and 1998/99 of employment rates of engineering graduates
and science-special degree graduates show marginal shifts (from 94.2% to 96.1% and from
83.7% to 89.5% respectively) followed by significant declines in 2000/01 (from 96.1% to 79.9%
and from 89.5% to 67.9% respectively). The employment rates of science-general degree
graduates and agriculture graduates have decreased noticeably during the period from 1997 to
2001.
Despite the field of study, the unemployment rates of graduates have increased rapidly within
the above period (1997-2001). Although, the unemployment rate of engineering graduates shows
a slight decrease in 1998/99 (0.7%) than in 1997 (1.6%), it has drastically increased (more than
five times) in 2000/01 when compared with the previous three years (8.0%). The unemployment
rate of agriculture graduates has almost doubled from 1997 to 1998/99 (8.1% to 15.1%) and has
trebled from 1998/99 to 2000/01 (15.1% to 43.2%). When considering the science-special
degree graduates, their unemployment rates in 1997 to 1998/99 were quite low (2.0% and 3.0%).
which was higher than that of engineering graduates and shows a sudden increase in 2000/01
Engineering Agriculture Science- Science-general special
Degree course
14
(22.9%). The unemployed rate of science-general degree graduates has increased marginally over the period of four years (1997-2001).
Table 3 : Employment status of graduates by degree course (1997 -2001)
Employment status
1997 (%) 1998/99 (%) 2000/01 (%) Employment status E A SG SS E A SG SS E A SG SS
Employed graduates 94.2 87.9
85.4
(Phy)
83.7 96.1 75.5
76.3
(Phy)
89.5 79.9 47.6
57.0
(Phy +
Bio)
67.9 Employed graduates 94.2 87.9
88.1
(Bio)
83.7 96.1 75.5 64.8
(Bio)
89.5 79.9 47.6
57.0
(Phy +
Bio)
67.9
Unemployed graduates 1.6 8.1
11.8
(Phy)
2.0 0.7 15.1
18.6
(Phy)
3.0 8.0 43.2
36.3 (Phy
+ Bio)
22.9 Unemployed graduates 1.6 8.1
5.1
(Bio)
2.0 0.7 15.1 24.1
(Bio)
3.0 8.0 43.2
36.3 (Phy
+ Bio)
22.9
Note : E - Engineering, A - Agriculture, SG - Science (General) and SS - Science (Special)
9.3. Current employment status and field of study : Current employment status of the graduates of different fields in science, agriculture and engineering was analyzed in detail to understand the employability of graduates within specialized fields. [It should be noted that the specialized fields (mentioned here after in this section) followed by graduates were identified from the main subjects/subsidiary subjects mentioned in the questionnaire by the respective graduates. The above identification may not be 100% accurate since difficulties arose when categorizing graduates into different fields by considering their main subjects, and due to the complexity of the subjects offered under each fields. However, the fields of studies identified by the above mechanism were used to form inferences under this section]. Here, three areas (science, agriculture and engineering) were considered/analyzed separately and the results were presented accordingly.
9.3.1. Agriculture: When considering the area of agriculture, there were several fields, for a graduate to follow a B.Sc. agriculture degree to specialize in. (These specialized fields may differ from university to university. In some universities, a certain field may be an addition to the different fields offered in the other universities).
15
Among the different fields, the graduates specialized in "agriculture extension* showed the
highest employment rate (66.7%). Graduate specialized in 'export agriculture', 'animal
sciences', 'agricultural engineering', 'agriculture economies', food science & technology' and
'agronomy' showed moderate employment rates, the percentages being 62.5%, 57.9%, 57.6%,
52.8%, 49.0%, and 46.2% respectively. Graduates specialized in 'crop science' (41.3%), 'soil
science' (40.1%), 'lives stock production' (37.5%) and 'agriculture biology' (34.2%) was
showed lower employment rates.
The unemployment rates showed slightly different patterns to the employment rates. The
unemployment rate was lowest among those specialized in 'agriculture extension' (almost zero).
This percentage was followed by those specialized in 'agriculture economics' (33.3%),
sciences' (60.0%) and 'lives stock production' (62.5%).
100% 90% 80% 70% 60% 50% 40% 30% 20% 10% 0%
5 o in CD <
8 01 c c o 1 '£ 1 § g £ o £? uj ui £ , = C ._: O) O ±, < < J?
o u o 3 •c CO <
O) o o c £: 8
c o (0
o t5 E
8
c <D U OT 5 if)
• Not specified
• Unemployed graduates
• Self-employed graduates
• Further education only
• Employed graduates
Field of study
Figure 6 : Current employment status by field of study (Agriculture)
16
9.3.2. Engineering: Among the universities that offer engineering degrees (University of Peradeniya - B.Sc., University of Moratuwa - B.Sc. and Open University - B.Tech.), there were several common fields such as 'civil engineering' and 'mechanical engineering'. 'Mineral & mining engineering', 'textile & clothing technology', 'material science' and 'computer science & engineering' were offered only at the University of Moratuwa while 'production engineering' was offered only at the University of Peradeniya. Further, 'chemical & process engineering' was offered by both these universities. Subjects related to the field of 'electrical and electronics engineering' were offered in quite different ways in the above three universities such that the University of Peradeniya offers specialization in 'electrical & electronic engineering' - (ie. electrical power, communication, and electronic & communication systems) where as the University of Moratuwa offers specialization in 'electronic & telecommunication engineering'. Furthermore, the University of Moratuwa offers another separate specialization in 'electrical engineering' only. Accordingly, the responded graduates were categorized into different fields, which existed under the area of engineering.
The employment rate was highest among those specialized in 'textile & clothing technology' (93.8%). This higher employment rate may be due to the development and expansion of the garment industry over the recent past. They are followed by graduates specialized in 'chemical & process engineering' (85.7%), 'electrical & electronic engineering' (85.4%), 'material science' (84.6%), 'civil engineering' (82.3%), 'electrical engineering' (81.5%) and 'production engineering' (81.3%) and can be considered as a moderate employment rates. 'Computer science' (76.2%), 'mechanical engineering' (73.1%) and 'electronic & telecommunication engineering' (67.7%) showed quite a low employment rate than the other specializations. The employment rate was lowest among those specialized in 'mineral & mining engineering' (60.0%). (It should be noted that, among the graduates who have followed 'electrical engineering', 'computer science' and 'electronics & telecommunication engineering', 14.8%, 19.0% and 22.6% respectively have not mentioned their current employment status. This may be one of the reasons for such low employment rates in these emerging fields; specially 'computer science' and 'electronic & telecommunication engineering'. There may be a certain percentage already employed among those who have not indicated their current position. Therefore, it can be suspected that the employment rates of graduates specialized in 'computer science' and 'electronic & telecommunication engineering' would be quite moderate with the addition of that uninvestigated percentage. This may also be evidenced by the recent increase in the private
17
sector organizations, which deals with software development, information technology,
telecommunication, etc].
The unemployed rates of graduates specialized in different fields in engineering were as follows.
'material science' (15.4%), 'mechanical engineering' (13.5%) and 'production engineering'
(18.8%). The unemployment rate was highest among those specialized in 'mineral & mining
engineering' (20.0%) and the reason for such a high unemployment rate may be due to limited
employment opportunities in this particular field as well as the reluctance by employers to
engage these graduates in other fields.
• Not specified
• Unemployed graduates
• Self-employed graduates
• Further education only
• Employed graduates
Field of study
Figure 7 : Current employment status by field of study (Engineering)
9.3.3. Science :
The graduates who followed B.Sc. science-general degrees have offered subjects either related
to the 'physical science' stream or the 'biological science' stream and this depended on the
subjects they have followed at the G.C.E. ( A / L ) examination. However, in recent past, such
restrictions have been reduced by certain universities allowing the graduates to follow certain
subjects in opposite fields. However, according to the major subjects/minor subjects followed by
graduates, they were categorized into the fields of 'b io- science' and 'physical-science'.
IS
Accordingly, employment rate among 'physical-science' graduates (58.9%) was slightly higher than that of 'bio-science' graduates (55.5%). The unemployment rate also showed a similar pattern ('physical-science': 33.9% and 'bio-science': 38.5%).
Those who have followed B.Sc. science-special degrees have been able to specialize in 'botany', 'zoology', 'chemistry', 'mathematics', 'physics', 'computer science', 'statistics', 'geology', etc. The responses from graduates specialized in 'microbiology & biochemistry' and 'molecular biology' were low and were excluded from the analysis (these courses were recently introduced by certain universities as special degrees).
The employment rate was highest among the graduates specialized in 'statistics' (almost 100%), closely followed by 'computer science' (93.3%), 'Mathematics' (85.7%), and 'physics' (83.4%). It is significant that those specialized in 'computer science' under the science stream show considerably higher employment rate than those specialized in 'computer science' under the area of engineering. The first category be mainly involved in software development, computer programming, etc, while the second category may be mainly involved in computer hardware, computer networking, etc. However, regardless of their functions, both categories show comparably higher employment rates than the other fields and this may be due to rapid development in the sector of information technology in the country. Graduates specialized in 'chemistry' (62.2%), and 'botany' (52.3%) show quite moderate employment rates whereas those specialized in 'geology' and 'zoology' show lower employment rates (42.9% and 41.6% respectively).
The unemployment rate was highest among those specialized in 'zoology' (58.5%) and lowest among those specialized in 'computer science' as well as 'statistics' (almost zero). In relation to the other specializations the unemployment rates were as follows; 'Mathematics' (14.3%), 'physics' (16.7%), 'chemistry' (21.6%), 'botany' (38.1%), 'geology' (42.9%) and 'zoology' (58.3%). As indicated, the higher unemployment rates among those specialized in 'zoology' and 'geology' may be due to the limited employment opportunities in these particular areas.
19
z
o a
n
» o o N
• Not specified
• Unemployed graduates
• Self-employed graduates
• Further education only
• Employed graduates
8 6 o
o u
Field of study
Figure 8 : Current employment status by field of study (Science)
9.4. Current employment status and achievements at the final examination :
When taking into account the level of achievement at the final examination, as predicted, the
employment rate was highest (75.8%) among those who obtained first classes. The employment
rate was 66.9% and 57.2% among those who achieved second-class lower divisions and ordinary
passes respectively. However, it was significant that the employment rate among those who
achieved second-class upper divisions was 62.1%, which was lower than that of those with
second lower passes and it was difficult to trace the reason for this issue. However, it seems that
graduates who achieved second-class upper divisions were engaged in full-time further
education (8.3%) than those who achieved other grades (first class - 7.1%, second-lower - 3.2%
and general pass - 2.4%).
Among respondents, unemployment rates of the graduates show a similar pattern, to that of the
employed graduates. Accordingly, the unemployment rate was lowest among those with first
classes (7.1%), followed by those with second-class lower divisions, second-class upper
divisions and ordinary passes with the percentages being 24.8%, 25.7% and 35.6% respectively.
20
• Not specified
• Unemployed graduates
• Self-employed graduates
• Further education only
• Employed graduates
First class Second- Second- Pass upper low er
Achievements
Figure 9 : Current employment status by achievements at the Final examination
By comparing statistics of employment rates of graduates over the period from 1997 to 2001, it
can be observed that there was a marginal decrease despite of the level of achievements at the
final examination, (only the employment rate of graduates with first classes have slightly
increased in 1998/99). Further, unemployment rates of graduates with first classes, second class-
upper divisions and second class-lower divisions have increased marginally. However, the
unemployment rates of those with general passes has drastically increased over the period
reflecting that despite the respective fields, poor achievements at the final examination was a
cause in increasing unemployment rates.
Table 4 : Employment status by achievements at the final examination (1997 - 2001)
Employment status
1997 (%) 1998/99 (%) 2000/01 (%) Employment status F su SL P F SU SL P F SU SL P
F - First class, SU - Second upper, SL - Second lower and P - Pass
21
9.5. Current employment status and university attended : The results of the analysis of employment rates/unemployment rates of graduates by universities
are given in the following table:
Table 5 : Employment rates / Unemployment rates by universities
University / Faculty Employment rate Unemployment rate
The reasons for such employment and unemployment rates of different universities/faculties
were not interpreted. However, these results would have changed significantly from that of the
above if there had been a higher percentage of responses, especially from universities around
Colombo.
22
• Not specified
• Unemployed graduates
• Self-employed graduates
• Further education only
• Employed graduates
Universities
Figure 10 : Current employment status according to universities
Further details under each employment status were discussed in the following paragraphs.
10. Employed graduates :
Under this category, only those employed (53.8% of the total sample) and those employed as
well as engaged in further education (7.2% of the total sample) were considered together and it
was assumed that they were employed (total - 61.0%) with regular wages being paid by their
employers. Self-employed graduates were considered separately for the analysis.
Since it is useful to mention the employment rates at the beginning of this section, with respect
to degree courses and achievements at the final examinations, the figures/rates presented in
previous section are tabulated below.
Table 6 : Employment rates by degree course / achievements at the final examination
D e g r e e c o u r s e E m p l o y m e n t ra te
Engineering 79.9
Science - special 67.9
Science - general 57.0
Agriculture 47.6
A c h i e v e m e n t s E m p l o y m e n t ra te
First class 75.8
Second - upper 62.1 Second - lower 66.9
Pass 57.2
23
Although these employment rates were observed under degree courses and achievements at the final examinations, the sample of employed graduates consists of the followings. According to degree course wise : 47.9% of the sample were B.Sc. science-general degree graduates followed by B.Sc. engineering graduates (28.4%), B.Sc. agriculture graduates (15.0%) and B.Sc. science-special graduates (8.7%). According to achievements at the final examinations : 54.1% of the sample consisted of graduates with general passes followed by graduates with second-lowers (26.7%), second-uppers (14.4%) and first classes (4.8%).
Among, the employed graduates 63.1% were males whereas the female percentage was 36.9%. 58.8% of the employed graduates have secured permanent employment while 39.2% of employed graduates were engaged in temporary employments (2.0% of employed graduates have not mentioned any of the categories). Further, over 96.0% of employed graduates were full-time employees.
10.1. Sector of employment: The employed graduates can be categorized according to their sector of employment such as government sector, semi-government sector, private sector, and other organizations, which do not belong to the above categories.
All government Ministries, Departments and Schools were considered as 'government sector' institutions. Corporations, Authorities, Bodies, Foundations, Institutions, Councils, etc, which were under the purview of the above government Ministries/Departments were considered as 'semi-government sector' organizations. Also, all Universities and Research & Development institutes and other institutes in which more that 50% of its shares were owned by the government were considered as 'semi-government sector' institutes. However, all government sector institutes and semi-government sector institutes can be considered under a single sector, i.e., 'public sector' institutes. All private companies and other establishments in which less than 50% of its shares were owned by the government were considered as 'private sector' organizations. NGOs, foreign funded projects and other institutes, which do not belong to the above categories, were considered as 'other sector' organizations.
Accordingly, the highest proportion of graduates (53.2%) was absorbed into the public sector institutions. This percentage consists of graduates absorbed into government sector institutes (23.2%) and of graduates absorbed into the semi-government sector institutes (30.0%). It reveals
24
that still the public sector institutes absorb a slightly higher percentage of graduates than the
other sectors. But, it is significant that a considerable percentage of employed graduates (43.8%)
were in the private sector institutions. When considering the four sectors separately (without
adding government and semi-government sectors together), the graduates' absorption to the
private sector institutions was the highest. Those who were employed in other sectors such as
NGOs, foreign funded projects, etc, were around 3.0%.
Government 23 2%
Serri-government
30 0%
Figure 11 : Sector of employment of employed graduates
In the private sector, other sector and semi-government sector institutes, the percentage of male
graduates was higher (i.e. 71.4%, 69.7% and 64.0% respectively) than that of the female
graduates. In contrast to the government sector institutes, the percentage of male graduates was
slightly lower (45.5%) than that of female graduates.
Further, the higher percentage of graduates absorbed into the permanent cardres was in the
privet sector organizations (49.8%) whereas semi-government organizations have absorbed more
graduates (49.3%) as temporary employees than the other sectors. One reason for such
absorption may be that more than 1/3 of the temporary staff in semi-government organizations
were working as temporary demonstrators/instructors at universities.
As indicated in the beginning of this section, 11.8% of employed graduates were involved in
postgraduate studies. A higher percentage (43.4%) of such graduates (those employed and
engaged in employment) was in semi-government organizations such as universities and R&D
institutes.
Other
Private 43.8%
25
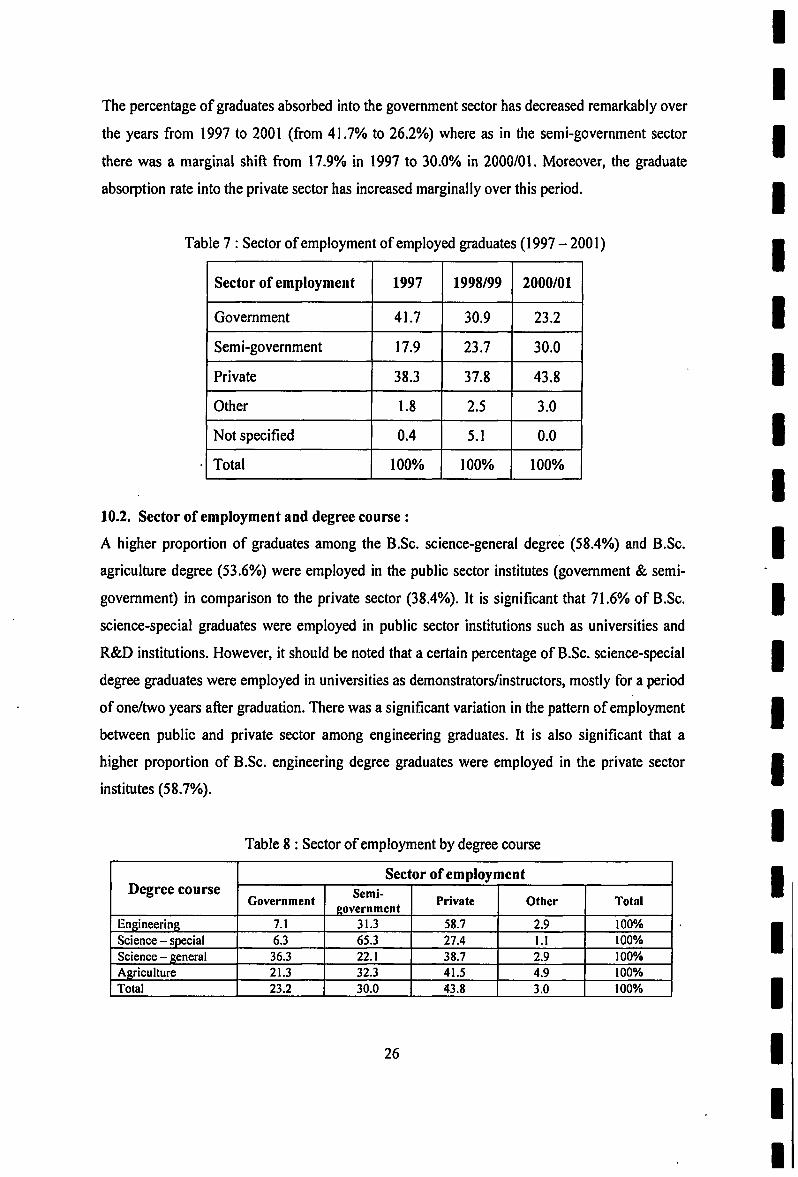
The percentage of graduates absorbed into the government sector has decreased remarkably over the years from 1997 to 2001 (from 41.7% to 26.2%) where as in the semi-government sector there was a marginal shift from 17.9% in 1997 to 30.0% in 2000/01. Moreover, the graduate absorption rate into the private sector has increased marginally over this period.
Table 7 : Sector of employment of employed graduates (1997 - 2001) Sector of employment 1997 1998/99 2000/01 Government 41.7 30.9 23.2 Semi-government 17.9 23.7 30.0 Private 38.3 37.8 43.8 Other 1.8 2.5 3.0 Not specified 0.4 5.1 0.0 Total 100% 100% 100%
10.2. Sector of employment and degree course : A higher proportion of graduates among the B.Sc. science-general degree (58.4%) and B.Sc. agriculture degree (53.6%) were employed in the public sector institutes (government & semi-government) in comparison to the private sector (38.4%). It is significant that 71.6% of B.Sc. science-special graduates were employed in public sector institutions such as universities and R&D institutions. However, it should be noted that a certain percentage of B.Sc. science-special degree graduates were employed in universities as demonstrators/instructors, mostly for a period of one/two years after graduation. There was a significant variation in the pattern of employment between public and private sector among engineering graduates. It is also significant that a higher proportion of B.Sc. engineering degree graduates were employed in the private sector institutes (58.7%).
Table 8 : Sector of employment by degree course
Degree course Sector of employment Degree course Government
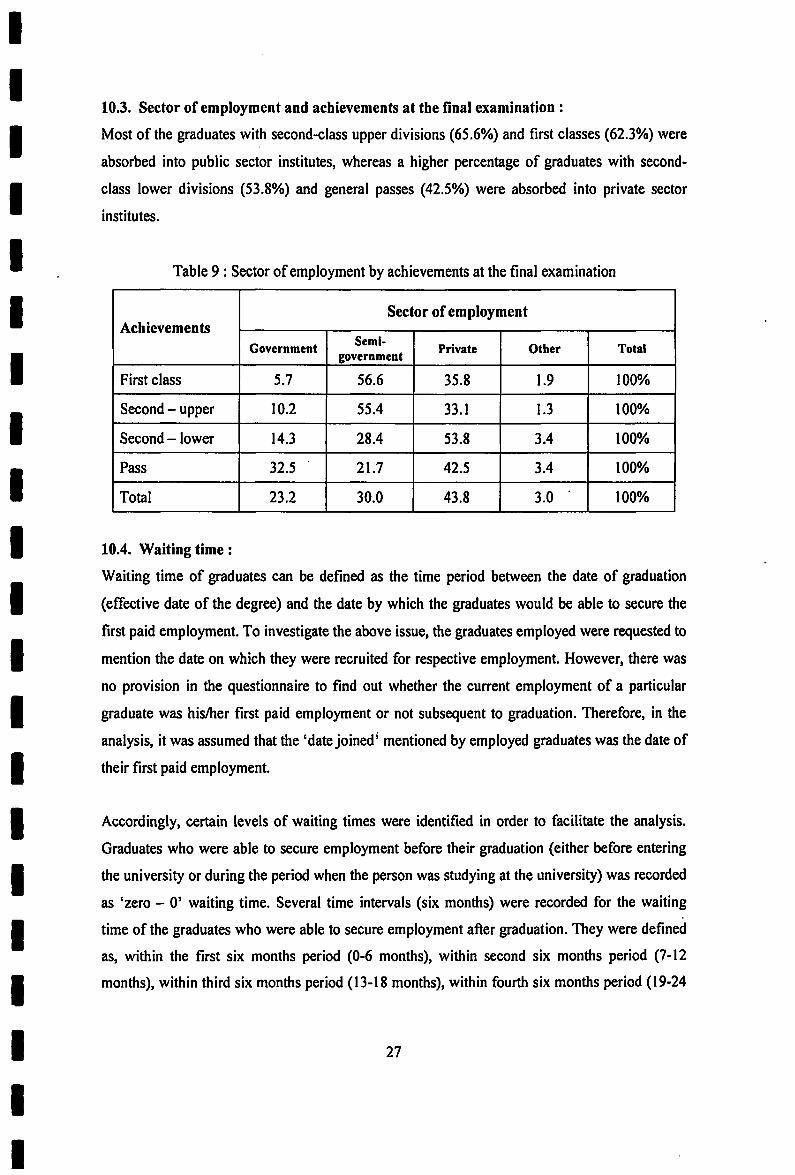
10.3. Sector of employment and achievements at the final examination : Most of the graduates with second-class upper divisions (65.6%) and first classes (62.3%) were absorbed into public sector institutes, whereas a higher percentage of graduates with second-class lower divisions (53.8%) and general passes (42.5%) were absorbed into private sector institutes.
Table 9 : Sector of employment by achievements at the final examination
Achievements Sector of employment
Achievements Government
Semi-government
Private Other Total
First class 5.7 56.6 35.8 1.9 100% Second - upper 10.2 55.4 33.1 1.3 100% Second - lower 14.3 28.4 53.8 3.4 100% Pass 32.5 21.7 42.5 3.4 100% Total 23.2 30.0 43.8 3.0 100%
10.4. Waiting time: Waiting time of graduates can be defined as the time period between the date of graduation (effective date of the degree) and the date by which the graduates would be able to secure the first paid employment. To investigate the above issue, the graduates employed were requested to mention the date on which they were recruited for respective employment. However, there was no provision in the questionnaire to find out whether the current employment of a particular graduate was his/her first paid employment or not subsequent to graduation. Therefore, in the analysis, it was assumed that the 'date joined9 mentioned by employed graduates was the date of their first paid employment.
Accordingly, certain levels of waiting times were identified in order to facilitate the analysis. Graduates who were able to secure employment before their graduation (either before entering the university or during the period when the person was studying at the university) was recorded as 'zero - 0' waiting time. Several time intervals (six months) were recorded for the waiting time of the graduates who were able to secure employment after graduation. They were defined as, within the first six months period (0-6 months), within second six months period (7-12 months), within third six months period (13-18 months), within fourth six months period (19-24
27
months) and after the fourth six months period (>24 months). Accordingly, following inferences were made.
The percentage of graduates who have secured their first paid employment before graduation was estimated as 27.7% (*). 47.1% of graduates have secured their first paid employment within the first six months of graduation (this includes the graduates with '0' waiting time). 63.4%, 79.8% and 90.2% of graduates have been able to find their first paid employment within the first year, the first one and half years and the first two years respectively from their graduation. The percentage of graduates who have been able to find employment after the first two year's time from graduation was 6.9%.
Further, accordingly gender, 51.6% of the female employed graduates have been able to find employment within the first six months from their graduations whereas the percentage was 44.5%, among male graduates.
[* Note : This percentage includes the graduates who have secured employment just before graduation (within one or two months before graduation), during the period when they were studying at the university and, before they were enrolled into the university. It is significant that more than 1/3 of the graduates employed before graduation had became employed even before entering into universities. It reveals that due to the uncertainty of getting a new employment or other reasons they may had to follow the degree courses while being employed. Further, more than 1/3 of the graduates employed before graduation were from the Open University (most of them followed B.Sc. science-general degree courses). One of the reasons for such a percentage studying at the Open University may be that most of the employed persons get enrolled at the Open University where there are provisions/facilities available to obtain distance education for adults].
Table 10 : Waiting time of graduates according to gender Waiting time (months)
Absorption (%) Cumulative absorption (%)
Waiting time (months) Female Male Total
Cumulative absorption (%)
0 35.0 23.5 27.7 27.7
0 -6 16.6 21.0 19.4 47.1
7-12 12.7 18.4 16.3 63.4
13-18 17.4 15.8 16.4 79.8
19-24 10.4 10.4 10.4 90.2
>24 5.0 8.0 6.9 97.1 Not specified 3.0 2.9 2.9 -
Total 100% 100% 100% -
28
Before (0-6) (7-12) (13-18) (19-24) (>24) graduation
Waiting time (months)
• Absorption • Cumulative absorption
Figure 12 : Waiting time of graduates The patterns of graduates who have been able to secure their first employment in subsequent years (1997, 1998/99 and 2000/01) are given in the following table. It can be seen that the absorption rates of graduates into the labour market within the first six months of their graduation has marginally decreased over the years (1997-2001).
Table 11 : Waiting time of graduates (1997 -2001) Waiting time (months)
Absorption (%) Waiting time (months) 1997 1998/99 2000/01
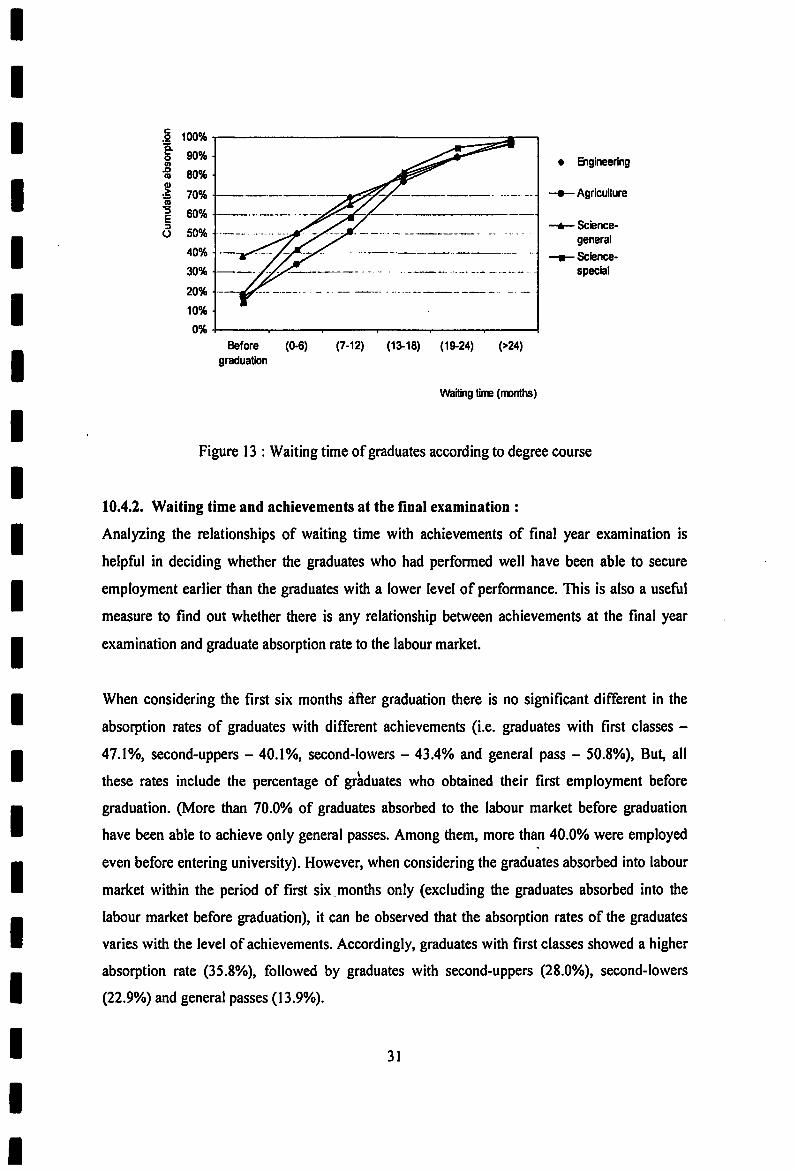
10.4.1. Waiting time and degree course: Analyzing the waiting time according to degree course is a useful measure to investigate how fast the graduates from different disciplines were absorbed into labour market.
B.Sc. science-general degree graduates showed the highest absorption rate (50.5%) within the first six months of graduation, followed by graduates with B.Sc. engineering degrees (49.6%), B.Sc. science-special degrees (42.1%), and B.Sc. agriculture degrees (34.2%). It is important to note mat these rates include the percentages of graduates who secured their first employment before graduation, under different disciplines. (Further, it should also be noted that more that 2/3 of graduates who secured employment before graduation were those who have followed B.Sc. science-general degree courses. Among them, more than 40.0% were employed even before entering university). However, when considering the graduates who have only secured employment after graduation (between first six months), B.Sc. engineering graduates showed a higher absorption rate (30.6%) followed by B.Sc. science-special degree graduates (27.4%), B.Sc. agriculture graduates (17.1%) and B.Sc. science-general degree graduates (12.0%).
It is significant to note that among employed graduates, 9.1% of the B.Sc. agriculture graduates, 7.4% of the B.Sc. engineering graduates, 6.5% of the B.Sc. science-general degree graduates, and 3.2% of the B.Sc. science-special degree graduates have failed to secure employment before the period of two years after graduation.
Table 12 : Waiting time of graduates according to degree course
Waiting time (months)
Absorption (%) Waiting time (months) Engineering
Science -general
Science -special
Agriculture Total
0 19.0 38.5 14.7 17.1 27.7
0 - 6 30.6 12.0 27.4 17.1 19.4
7 - 1 2 19.0 14.3 16.8 17.1 16.3
1 3 - 1 8 10.6 15.6 23.2 25.6 16.4
1 9 - 2 4 10.3 9.4 12.6 12.8 10.4
> 2 4 7.4 6.5 3.2 9.1 6.9
Not specified 2.9 3.6 2.1 1.2 2.9
Total 100% 100% 100% 100% 100%
30
Before (0-6) (7-12) (13-18) (19-24) (>24) graduation
Waiting time (months)
Figure 13 : Waiting time of graduates according to degree course
10.4.2. Waiting time and achievements at the final examination : Analyzing the relationships of waiting time with achievements of final year examination is helpful in deciding whether the graduates who had performed well have been able to secure employment earlier than the graduates with a lower level of performance. This is also a useful measure to find out whether there is any relationship between achievements at the final year examination and graduate absorption rate to the labour market.
When considering the first six months after graduation there is no significant different in the absorption rates of graduates with different achievements (i.e. graduates with first classes -47.1%, second-uppers - 40.1%, second-lowers - 43.4% and general pass - 50.8%), But, all these rates include the percentage of graduates who obtained their first employment before graduation. (More than 70.0% of graduates absorbed to the labour market before graduation have been able to achieve only general passes. Among them, more than 40.0% were employed even before entering university). However, when considering the graduates absorbed into labour market within the period of first six.months only (excluding the graduates absorbed into the labour market before graduation), it can be observed that the absorption rates of the graduates varies with the level of achievements. Accordingly, graduates with first classes showed a higher absorption rate (35.8%), followed by graduates with second-uppers (28.0%), second-lowers (22.9%) and general passes (13.9%).
31
Among the employed graduates, 6.4% of those who have achieved general passes, 7.0% of those who have achieved second-uppers, 9.4% of those who have achieved first classes, and 7.2% of those who have achieved second-lowers have not been able to find employment within the first two years after graduation.
Table 13 : Waiting time of graduates according to achievements at the final examination
Not specified 1.9 3.2 1.7 3.6 2.9 Total 100% 100% 100% i 100% 100%
Before (0-6) (7-12) (13-18) (19-24) (>24) graduation
Waiting time (months)
Figure 14 : Waiting time of graduates according to achievements at the final examination
32
10.4.3. Waiting time and sector of employment: When considering the first six months duration after the graduation only, the absorption rate was high in the 'other sector' organizations such as NGOs and foreign funded projects, etc, being 30.3%. Semi-government and private sector organizations showed equal absorption rates (24.1% and 23.0% respectively) while the government sector organizations showed the lowest absorption rate (5.1%). It can also be seen that more than half the graduates (51.5%) employed before graduation were in the government sector organizations. (Among them, more than 40.0% were employed before entering university).
Table 14 : Waiting time of graduates by sector of employment
Not specified 1.6 2.4 4.2 - 2.9 Total 100% 100% 100% 100% 100%
Before (0-6) (7-12) (13-18) (19-24) (>24) graduation
Waiting time (months)
Figure 15 : Waiting time of graduates by sector of employment
33
10.5. Employment categories of graduates : Employed graduates were requested to mention the designations of their current employments. Designation of an employee is not a very good measurement, used to understand either the level of employment or the relevant functions of the occupation. Similar kinds of occupations are designated under different names in different institutes. Since, there was no provision to find out the functions or level of employment of the employed graduates in the questionnaire, an attempt was made to understand the employment categories by their designation. Accordingly, related designations were categorized and the following estimates were obtained.
Table 15 : Designations of employed graduates Designation (%)
Accountant / Account Clerks / Other related designations (o.r.d) 1.4
10.6. Views of employed graduates regarding the effectiveness of degree courses in relation to current employment:
Several questions were asked from the employed graduated in order to find out certain issues regarding their current employment and degree programmes. Some of these questions were focused on considering as to what extent their degree programmes had prepared them for current employment, and the relationships between current employment and degree programmes followed, etc.
Most of the graduates, employed have mentioned that the academic programs which they have followed have prepared them well for their current positions (very well - 27.4% and well -34.3%). 23.1% of the employed graduates have mentioned that their academic programs have only slightly prepared them for their current employment whereas 14.3% mentioned that they were not prepared at all for their current employment. (1.0% of graduates have not mentioned their views under this issue). A higher percentage of employed B.Sc. engineering graduates (83.6%) and B.Sc. science-special degree graduates have indicated that their academic programmes have prepared them well for their current positions (both well and very well). The percentages among B.Sc. agriculture and B.Sc. science-general degree graduate who had the same views were fairly low (62.8% and 44.6% respectively) when compared with B.Sc. engineering and B.Sc. science-special degree graduates.' Significant among the graduates who have mentioned that their academic programmes have not prepared them at all for their current employment were the B.Sc. science-general degree graduates who showed the highest percentage (23.7%). One of the reasons for this issue may be that, under B.Sc. science-general degree courses, the graduates were not trained/specialized for a particular area of study and were deployed to the labour market with a only general scope of the subjects in order to get them employed in any kind of discipline such as science, management, administration, education, production, etc.
Table 16: Views of graduates on the effectiveness of degree course
Views Degree course
Views Engineering
Science-general
Science-special Agriculture Total
Very well 36.5 16.0 50.5 32.9 27.4
Well 47.1 28.6 31.6 29.9 34.3
Slightly 13.2 30.5 13.7 23.2 23.1
Not at all 1.9 23.7 4.2 13.4 14.3
Not specified 1.3 1.1 - 0.6 1.0
Total 100% 100% 100% 100% 100%
35
Furthermore, 41.4% of the employed graduates were engaged in employments in the same fields relevant to their field of studies in universities. 33.2% were employed in fields somewhat related to their fields of studies whereas 24.4% were employed in jobs directly out of their particular fields of studies. (0.9% of graduates have not mentioned their views under this issue). In contrast, most of the employed graduates (57.1%) were not employed in jobs directly in their field of studies. A higher percentage of employed B.Sc. engineering graduates (66.0%) and B.Sc. science-special degree graduates were engaged in employments in the same fields as their undergraduate training programmes. However, 74.6% of employed B.Sc. science-general degree graduates and 53.0% of B.Sc. agriculture graduates were not employed directly in their particular field of studies. Generally, those who followed B.Sc. science-general degree courses were engaged in employments of different areas such as management, administration, production, etc, and may have less opportunity to be engaged in an employment in the same fields as their undergraduate education other than in teaching. For the agriculture graduates, lack of employment opportunities in relation to their specializations may have caused involvements in jobs that are not relevant to their particular field of studies.
Table 17 : Views of graduates on the relevance of degree course to current employment
Views Degree course
Views Engineering
Science-general
Science-special
Agriculture Total
Directly 60.0 24.4 67.4 45.7 41.4 Somewhat 32.6 37.6 20.0 28.0 33.2 Not related at all 6.5 37.0 12.6 25.0 24.4 Not specified 1.0 1.0 - 1.2 0.9 Total 100% 100% 100% 100% 100%
Graduates who mentioned that the tasks they were engaged in, were not related (both 'some what' and 'not related at all': 57.6%) to their undergraduate programmes were further requested to indicate what reasons made them to take the respective employment. They were given five choices to answer and were allowed to mention more than one answer. Accordingly, 44.3% of such graduates mentioned the lack of available jobs related to their field of studies as one of reasons. 8.7% of them mentioned that promotions, salary and other perks/benefits of the current employment made them get engaged in an employment, which differed from their undergraduate
36
fields of studies. The other answers were, 'family reasons' - 6.7%, 'shift in interest' - 6.2% and 'other reasons' - 13.8%. It should be noted that these percentages do not add up to 100 as the graduates were allowed to mention more than one comment (multiple responses).
Table 18 : Reasons for being engaged in fields not related to degree course Reasons (%) *
As a result of promotion and salary in the job 8.7 Lack of available jobs related to degree course 44.3 Shift in interest 6.2 Family reasons 6.7 Other reasons 13.8
(* Percentages do not add up to 100 due to multiple responses)
11. Unemployed graduates: 30.5% of responded graduates were unemployed when this survey was conducted. Among the unemployed graduates, a majority of them were females (55.3%) whereas the male percentage was 44.7%.
The unemployment rates of these graduates under the degree course and achievement of final examination, also presented in the previous section, are tabulated below.
Table 19 : Unemployment rates by degree course / achievements at the final examination Degree course Unemployment rate
Engineering 8.0 Science - special 22.9 Science - general 36.3 Agriculture 43.2
Achievements Unemployment rate
First class 7.1
Second - upper 25.7
Second - lower 24.8
Pass 35.6
37
Although, these unemployment rates were shown under the above two issues, the sample of unemployed graduates consist of the followings.
Among the sample of unemployed graduates, the highest proportion was those who have followed the B.Sc science-general degree courses (61.2%), followed by the graduates in B.Sc. agriculture (27.3%), B.Sc. science-special degree graduates (5.9%) and B.Sc. engineering graduates (5.7%). As expected, the highest proportion (67.4%) of unemployed graduates was those who have achieved ordinary passes at their final year examinations. Among the sample of unemployed graduates, there were only 1.0% of graduates who had obtained first classes. The percentages of second-class upper divisions and second-class lower divisions, obtained by the unemployed graduates were 11.9% and 19.8% respectively.
12. Self employed graduates : 2.3% of the graduates who have responded were engaged in self-employment. Most of these graduates were engaged in their own business/employment. These employment activities include private teaching, trade, computer type setting and other computer related activities, fruit and vegetable processing, farming, etc. Among self-employed graduates, 83.3% were males and a majority of them has followed B.Sc. science-general degree courses. Most of the self-employed graduates (about 78.6%) were those who achieved ordinary passes at their final examinations.
To start any self-employment, the person engaged should have to utilize some capital at the initial stage of that employment. These self-employed graduates were requested to mention their major source of capital as well as the number of employees working under the respective self-employed graduate, to understand the level of self-employment. Accordingly, most of them (33.3%) mentioned that the major source of capital was from his/her family. Further, 21.4%, 16.7% and 4.8% indicated that their major source of capital was from bank loans/other kinds of loans, from private assets, and from personal income from previous jobs respectively. About 9.5% of self-employed graduates indicated other sources and 14.3% of self-employed graduates were reluctant to mention their major source of capital.
More than 2/3 of the self-employed graduates (i.e. 66.7%) were involved in their particular employment on their own and no other workers were working under them. However, 14.4%, 9.6%, and another 9.6% of self-employed graduates supervised 2-5, 6-10, and more than 10 workers respectively working under them.
38
The reasons for self-employment are useful measures to find out what actually induced graduates to select their own business/employment. Several reasons were listed in the questionnaire and the graduates were requested to select their choices. Accordingly, 42.9% have mentioned that lack of employment opportunities related to their particular fields of studies caused them to be self-employed. Other reasons mentioned by the self-employed graduates were listed below with relevant percentages.
Table 20 : Reasons for being self-employed Reasons (%) *
Because of high income 21.4
Lack of employment opportunities related to field of study 42.9
Relatedness to the field of study 31.0
Preference to be independent 40.5
Other reasons 31.0
(* Percentages do not add up to 100 due to multiple responses)
13. Professional programmes followed by the graduates : The graduates were requested to mention whether they have followed any professional courses/programmes other than their undergraduate degree course, in order to understand areas in which the graduates tend to be professionally qualified in the competitive environment of the job market. There is a provision in the questionnaire to state whether they have followed any professional courses and accordingly to indicate the area/s of their professional qualification/s. However, it was difficult to find out the level and recognition of the professional qualifications (such as whether it was a certificate, diploma, higher diploma, or membership in a professional body) from the above details. Therefore, detailed inferences as to whether there is any relationship between the professionally qualified graduates (with the basic degrees) and their current employment status, were not conducted/interpreted as the results obtained using the above limited information may be misleading. However, the percentages of graduates who have mentioned their area/s of professional qualification/s were tabulated below.
Table 21 : Areas of professional qualifications followed by the graduates
(* Percentages do not add up to 100 due to multiple responses) 39
14. Obstacles faced by graduates when finding a suitable employment: Views of the graduates regarding the obstacles faced by them when finding a suitable employment were tabulated as follows.
Table 22: Obstacles faced by graduates when finding employment
Obstacles Employed graduates
( % ) *
Temporary employed graduates
( % ) *
Employed as well as
engaged in further
education t%>*
Further education
only ( % ) *
Self-employed graduates
( % ) *
Unemployed graduates
( % ) •
Total sample of graduate]
( % ) »
Lack of knowledge in English 10.9 11.0 10.9 1.5 28.6 15.2 12.0
Lack of knowledge in Information Technology 8.7 9.3 12.4 4.6 16.7 14.8 10.4
Lack of knowledge in Management 8.5 11.0 11.6 7.7 4.8 13.0 9.5
Absence of required work experiences 28.8 35.0 38.0 35.4 k 31.0 55.1 36.4
Absence of employment opportunities in the area of undergraduate studies
26.8 32.2 34.9 33.8 33.3 49.3 33.4
Absence of employment opportunities in the area of interest
14.7 15.9 22.5 23.1 14.3 23.4 17.3
Other reasons 7.7 7.7 7.8 7.7 7.1 13.6 9.3
(* Percentages do not add up to 100 due to multiple responses)
[Note : It should be noted that, although the percentages are given in one table, each employment status (columns in the table) were considered separately for the analysis. Further, the percentages given in the last column 'total graduates' is not the average of the respective percentages given in the other columns].
According to these views, it can be seen that regardless of their current employment status, lack of required experience was the main reason in finding suitable employment. The other two main reasons were the absence of employment opportunities in the field of their specializations and their area of interest. It can also be observed that lack of knowledge in English and information technology also had a substantial effect when finding suitable employments.
40
15. Summary: This tracer study was conducted in order to analyze the employability and its related issues of the graduates who have passed out from 13 universities of Sri Lanka. The analysis was mainly focussed on gaining insight into the current employment status, sector of employment, absorption patterns and rates into the labour market and other useful issues.
The target group constituted of a total of 4,486 graduates who have passed out during the period of 2000 and 2001 from the S&T faculties of Sri Lankan universities. Contact details of these graduates were obtained from the respective universities. The mail questionnaire method was used to gather detailed information on the above particulars of the graduates. In the analysis, the number of responses (1,792 : response rate - 40%) were taken as the sample to represent the above population.
Some useful findings of this study are given below; • 61.0% of the sample was employed while 30.5% was unemployed. • The employment rate was significantly higher among male graduates (66.8%) than female
gradates (53.0%). The unemployment rate was higher among female graduates (39.8%) while it was 23.6% among male graduates.
• The employment rate was highest (79.9%) among engineering graduates where as agriculture graduates showed the lowest employment rate (47.6%).
• Unemployment rate was highest among the agriculture graduates (43.2%) and lowest among engineering graduates (8.0%).
• In the area of engineering, the employment rate was highest among those specialized in 'textile and clothing technology' (93.8%) where as in the science stream, those specialized in 'statistics' and 'computer science' showed higher employment rates (almost 100% and 93.3% respectively). In the area of agriculture, the highest employment rate (66.7%) was among those specialized in 'agriculture extension'.
• The respective highest unemployed rates in the areas of engineering, science and agriculture were among those specialized in 'mineral & mining engineering' (20.0%), those specialized in 'zoology' (58.5%), and those specialized in 'lives stock production' (62.5%).
• Despite the fields of study, the highest employment rate (75.8%) was observed in graduates who have obtained first classes at their final year examination of the degree course.
• 53.2% of graduates were absorbed into public sector institutes (government sector - 23.2% and semi-government sector - 30.2%) where as the absorption rate into the private sector
41
organizations was 43.8%. Absorption into the private sector was highest among engineering o
graduates (58.7%). • B.Sc. science-general degree graduates showed the highest absorption rate (50.5%) within
the first six-months of graduation. • A higher percentage of graduates have pointed out that lack of required experience was the
main reason in trying to find a suitable employment.
15.1. Key indicators: The findings of the tracer study can be summarized in terms of a list of key indicators as given in the following table :
16. Discussion: As the interpretations/discussions on most of the issues were discussed in the previous sections themselves, some limitations, problems, drawbacks, etc., which occurred when conducting this study and some suggestions/recommendations to overcome these in future studies are the only issues discussed in this section.
At the beginning of this study, a paper advertisement was published in newspapers, informing graduates that their addresses were required for the tracer study and requesting them to update their addresses available at the respective Universities. One purpose was to encourage/persuade graduates to respond promptly and to ensure that they contribute to this timely and important study, which would have resulted in a higher response rate from them. However, there was only a slight increase in the response rate than that of the previous year resulting in this costly attempt being unsuccessful, (a response rate of 40% was achieved in this tracer study whereas it was 36% in the previous tracer study of graduates who had passed out in 1998/99).
The number of responses was taken as the sample, assuming that this sample adequately represents the total population of S&T graduates, who had passed out in 2000/2001. Since, the sample was not taken in a systematic way, one can suspect that the sample may be biased towards unemployed graduates or employed graduates, an accordingly the summary measures calculated and inferences drawn from this study cannot be applied to the population of S&T graduates in this particular case. Although, a sample survey to establish whether there was such a bias towards unemployed graduates or employed graduates under this study was expected to have been carried out among non-responded as well as responded graduates (by personnel interviews), such an attempt did not materialize due to various reasons such as limited manpower, funds, time, etc. However, by looking at the statistics obtained on unemployed graduates, employed graduates, etc., one may conclude that the inferences may have not differed drastically from the reality. Further, no follow up action (sending reminders, etc) with regard to the non-respondents were taken, due to some of the above reasons and it can be concluded that there may have been a slight increase of the response rate, had such steps been taken.
As indicated in a previous section, the questionnaire was limited to two pages, assuming that the responses from graduates would increase when a lesser number of questions were asked from them. Reducing the questions did not show a positive increase in the response rate, but caused in the omission of certain questions in relation to current employment such as income level,
43
management level, functions of the employment, etc., by which would otherwise have given certain important information on various issues that could have been addressed.
There were some mistakes, discrepancies, etc., in the completed questionnaires sent by the graduates. It was not clear that these mistakes/discrepancies occurred due to carelessness of the graduates or due to limited definitions/directions given for certain questions in the questionnaire. It was realized that such questions should be asked with proper definitions/directions in order to avoid such unnecessary mistakes. Further, there were some questions, in which the graduates could give more than one answers (multiple response questions). Since, some difficulties arose when analyzing these questions, it was realized that this would have been avoided by adopting some remedial techniques such as ranking the answers, having certain levels of choices under one answer, etc.
The next tracer study of graduates (graduates who have passed out in 2002 from Sri Lankan universities) has commenced recently and is in its initial stage by now. The MIS Unit wishes to improve the methodology adopted in this study by incorporating some modifications in the questionnaire, addressing all possible issues of graduates, introducing techniques in order to increase the response rate and other related issues discussed in this section. Further, as in the previous tracer studies (tracer study 1997 and tracer study 1998/99), percentage analyses were conducted/presented in this study as well. In addition, it is expected that some advanced statistical analysis be conducted on the findings to check whether certain relationships are statistically significant or not, etc., with the help of a statistical consultant who has expertise in social research survey.
Finally, the MIS Unit also wishes to produce an integrated report, combining all four tracer studies (tracer studies of graduates who had passed out in 1997, 1998/99, 2000/01 and 2002), which will definitely be useful to understand the status of the recently passed out graduates over the years.
44
17. References: Department of Census and Statistics (2002). Quarterly Report of the Sri Lanka Labour
Force Survey : Fourth Quarter - 2002. Department of Census and Statistics, Ministry of Finance and Planning, Colombo. National Science Foundation (2002). Tracer Study of S&T Graduates passed out from
Universities in Sri Lanka (1998/1999). Management Information System Unit, National Science Foundation, Colombo. Science and Technology Personnel Development Project (2000). Report of a Tracer Study of
University S&T Graduates. Science & Technology Personnel Development Project, Ministry of Science & Technology, Colombo. The Island (21 June 2003, page 8). The article on 'Graduates Unemployment : current
initiatives'. Prepared by Dr. Wickrema Weerasooriya based on the Survey of Unemployed Graduate in Sri Lanka, conducted by Ministry of Tertiary Education and Training in September 2002. University Grants Commission (2002). Sri Lanka University Statistics 2002. University Grants Commission of Sri Lanka, Colombo.