Background information Tracking events with dynamic network statistics Conclusion Tracking Events Diffusion on Social Media: A Dynamic Study of Twitter Rewteet Network Hechao Sun Joint work with Shawn Mankad, Bill Rand Robert H. Smith School of Business University of Maryland, College Park [email protected]Oct. 31st,2014 1 / 24
Transcript
Background informationTracking events with dynamic network statistics
Conclusion
Tracking Events Diffusion on Social Media: ADynamic Study of Twitter Rewteet Network
Hechao SunJoint work with Shawn Mankad, Bill Rand
Robert H. Smith School of BusinessUniversity of Maryland, College Park
Background informationTracking events with dynamic network statistics
Conclusion
Overview
Background informationMotivationData description
Tracking events with dynamic network statisticsNetwork generationDynamic analysis
Conclusion
2 / 24
Background informationTracking events with dynamic network statistics
Conclusion
MotivationData description
Why Twitter
Social media can have profound implications for marketingstrategies and online service operations[Evans. 2010]. Being amicroblogging social media, Twitter shares great popularity forvarious people exchanging thoughts and information (by July 11th,2014):
I Total number of active registered Twitter users 645,750,000
I Average number of tweets per day 58 million
I Number of active Twitter users every month 115 million
Background informationTracking events with dynamic network statistics
Conclusion
MotivationData description
Trends and events on Twitter
Source: http://trendsmap.com/
4 / 24
Background informationTracking events with dynamic network statistics
Conclusion
MotivationData description
Networks on Twitter
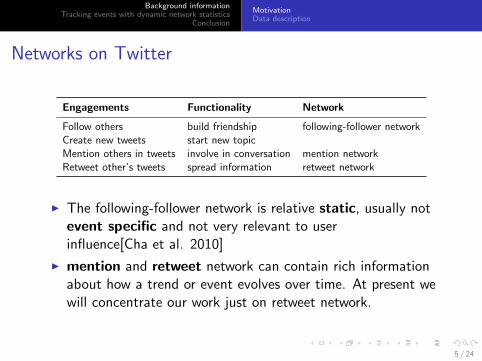
Engagements Functionality Network
Follow others build friendship following-follower networkCreate new tweets start new topicMention others in tweets involve in conversation mention networkRetweet other’s tweets spread information retweet network
I The following-follower network is relative static, usually notevent specific and not very relevant to userinfluence[Cha et al. 2010]
I mention and retweet network can contain rich informationabout how a trend or event evolves over time. At present wewill concentrate our work just on retweet network.
5 / 24
Background informationTracking events with dynamic network statistics
Conclusion
MotivationData description
15k-user panel data
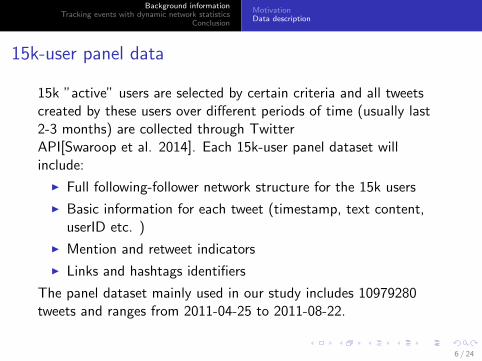
15k ”active” users are selected by certain criteria and all tweetscreated by these users over different periods of time (usually last2-3 months) are collected through TwitterAPI[Swaroop et al. 2014]. Each 15k-user panel dataset willinclude:
I Full following-follower network structure for the 15k users
I Basic information for each tweet (timestamp, text content,userID etc. )
I Mention and retweet indicators
I Links and hashtags identifiers
The panel dataset mainly used in our study includes 10979280tweets and ranges from 2011-04-25 to 2011-08-22.
6 / 24
Background informationTracking events with dynamic network statistics
Conclusion
MotivationData description
Event datasets
Different event datasets, are generated with specific tweets contentand time frames as subsets of the 15-k user panel datasets usingMySQL query.
One event dataset we have studied in depth is the datasetconcerning death of Osama BinLaden (OBL dataset in short),which will be used as the representative.
7 / 24
Background informationTracking events with dynamic network statistics
Conclusion
Network generationDynamic analysis
Network formation
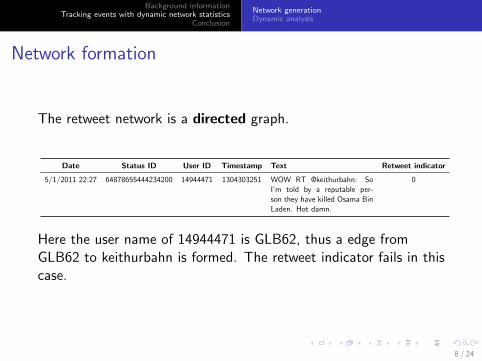
The retweet network is a directed graph.
Date Status ID User ID Timestamp Text Retweet indicator
5/1/2011 22:27 64878655444234200 14944471 1304303251 WOW RT @keithurbahn: SoI’m told by a reputable per-son they have killed Osama BinLaden. Hot damn.
0
Here the user name of 14944471 is GLB62, thus a edge fromGLB62 to keithurbahn is formed. The retweet indicator fails in thiscase.
8 / 24
Background informationTracking events with dynamic network statistics
Conclusion
Network generationDynamic analysis
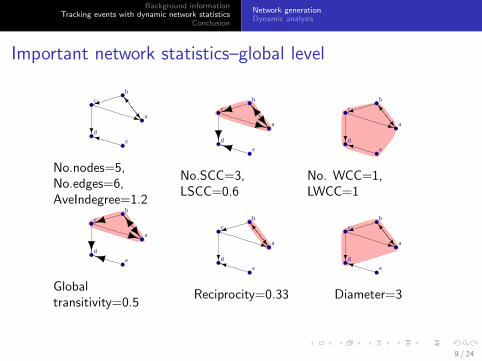
Important network statistics–global level
a
b
c
d
e
No.nodes=5,No.edges=6,AveIndegree=1.2
a
b
c
d
e
No.SCC=3,LSCC=0.6
a
b
c
d
e
No. WCC=1,LWCC=1
a
b
c
d
e
Globaltransitivity=0.5
a
b
c
d
e
Reciprocity=0.33
a
b
c
d
e
Diameter=3
9 / 24
Background informationTracking events with dynamic network statistics
Conclusion
Network generationDynamic analysis
Important network statistics–node level
a
b
c
d
e
Indegree=1, outdegree=2, local transitivity=0.33 ,eigenvectorcentrality=0.83, betweenness centrality=2 , closeness centrality=0.11
For these node level statistics, we are usually only interested inhigh rank nodes: top 10 etc.
10 / 24
Background informationTracking events with dynamic network statistics
Conclusion
Network generationDynamic analysis
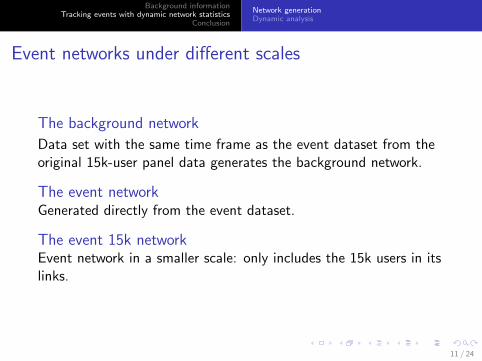
Event networks under different scales
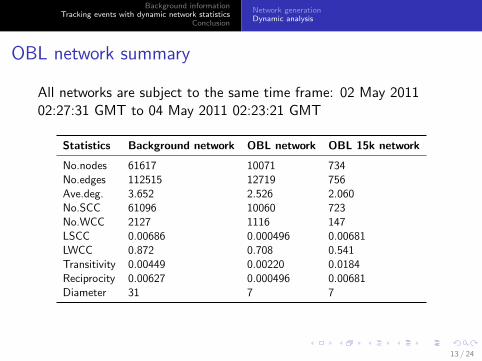
The background network
Data set with the same time frame as the event dataset from theoriginal 15k-user panel data generates the background network.
The event networkGenerated directly from the event dataset.
The event 15k networkEvent network in a smaller scale: only includes the 15k users in itslinks.
11 / 24
Background informationTracking events with dynamic network statistics
Background informationTracking events with dynamic network statistics
Conclusion
Network generationDynamic analysis
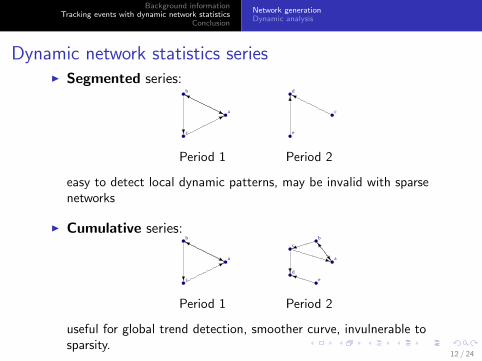
Segmented multi-resolution analysis
The network is segmented into sub-networks within certain timeintervals.
For OBL dataset, we adopt four interval lengths:
I 15min
I 30min
I 60min
I 120min
Because the data only spans two days. For a longer time network,a higher time window size is preferred.
14 / 24
Background informationTracking events with dynamic network statistics
Conclusion
Network generationDynamic analysis
LSCC and No.nodes0.
000.
100.
20
15_min
LSC
C
05−
02 0
405
−02
06
05−
02 0
805
−02
10
05−
02 1
205
−02
14
05−
02 1
605
−02
18
05−
02 2
005
−02
22
05−
03 0
005
−03
02
05−
03 0
405
−03
06
05−
03 0
805
−03
10
05−
03 1
205
−03
14
05−
03 1
605
−03
18
05−
03 2
005
−03
22
05−
04 0
0
020
0040
00
#Nod
es
LSCC
#Nodes
0.00
0.10
0.20
30_min
LSC
C
05−
02 0
405
−02
06
05−
02 0
805
−02
10
05−
02 1
205
−02
14
05−
02 1
605
−02
18
05−
02 2
005
−02
22
05−
03 0
005
−03
02
05−
03 0
405
−03
06
05−
03 0
805
−03
10
05−
03 1
205
−03
14
05−
03 1
605
−03
18
05−
03 2
005
−03
22
05−
04 0
0
020
0040
00
#Nod
es
LSCC
#Nodes
0.00
0.10
0.20
60_min
LSC
C
05−
02 0
405
−02
06
05−
02 0
805
−02
10
05−
02 1
205
−02
14
05−
02 1
605
−02
18
05−
02 2
005
−02
22
05−
03 0
005
−03
02
05−
03 0
405
−03
06
05−
03 0
805
−03
10
05−
03 1
205
−03
14
05−
03 1
605
−03
18
05−
03 2
005
−03
22
05−
04 0
0
020
0040
00
#Nod
es
LSCC
#Nodes
0.00
0.10
0.20
120_min
LSC
C
05−
02 0
405
−02
06
05−
02 0
805
−02
10
05−
02 1
205
−02
14
05−
02 1
605
−02
18
05−
02 2
005
−02
22
05−
03 0
005
−03
02
05−
03 0
405
−03
06
05−
03 0
805
−03
10
05−
03 1
205
−03
14
05−
03 1
605
−03
18
05−
03 2
005
−03
22
05−
04 0
0
020
0040
00
#Nod
es
LSCC
#Nodes
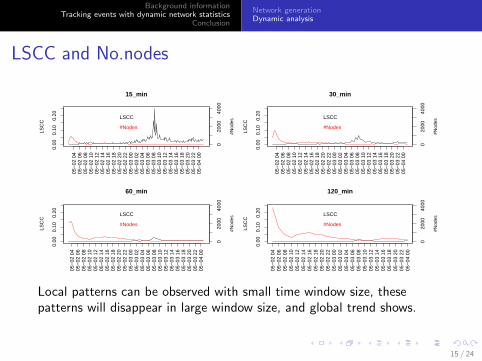
Local patterns can be observed with small time window size, thesepatterns will disappear in large window size, and global trend shows.
15 / 24
Background informationTracking events with dynamic network statistics
Conclusion
Network generationDynamic analysis
Reciprocity and No.edges0.
000.
040.
08
15_min
Rec
ipro
city
05−
02 0
405
−02
06
05−
02 0
805
−02
10
05−
02 1
205
−02
14
05−
02 1
605
−02
18
05−
02 2
005
−02
22
05−
03 0
005
−03
02
05−
03 0
405
−03
06
05−
03 0
805
−03
10
05−
03 1
205
−03
14
05−
03 1
605
−03
18
05−
03 2
005
−03
22
05−
04 0
0
020
0040
00
#Edg
es
Reciprocity
#Edges
0.00
0.04
0.08
30_min
Rec
ipro
city
05−
02 0
405
−02
06
05−
02 0
805
−02
10
05−
02 1
205
−02
14
05−
02 1
605
−02
18
05−
02 2
005
−02
22
05−
03 0
005
−03
02
05−
03 0
405
−03
06
05−
03 0
805
−03
10
05−
03 1
205
−03
14
05−
03 1
605
−03
18
05−
03 2
005
−03
22
05−
04 0
0
020
0040
00
#Edg
es
Reciprocity
#Edges
0.00
0.04
0.08
60_min
Rec
ipro
city
05−
02 0
405
−02
06
05−
02 0
805
−02
10
05−
02 1
205
−02
14
05−
02 1
605
−02
18
05−
02 2
005
−02
22
05−
03 0
005
−03
02
05−
03 0
405
−03
06
05−
03 0
805
−03
10
05−
03 1
205
−03
14
05−
03 1
605
−03
18
05−
03 2
005
−03
22
05−
04 0
0
020
0040
00
#Edg
es
Reciprocity
#Edges
0.00
0.04
0.08
120_min
Rec
ipro
city
05−
02 0
405
−02
06
05−
02 0
805
−02
10
05−
02 1
205
−02
14
05−
02 1
605
−02
18
05−
02 2
005
−02
22
05−
03 0
005
−03
02
05−
03 0
405
−03
06
05−
03 0
805
−03
10
05−
03 1
205
−03
14
05−
03 1
605
−03
18
05−
03 2
005
−03
22
05−
04 0
0
020
0040
00
#Edg
es
Reciprocity
#Edges
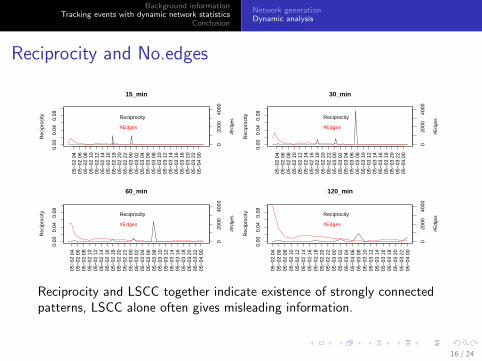
Reciprocity and LSCC together indicate existence of strongly connectedpatterns, LSCC alone often gives misleading information.
16 / 24
Background informationTracking events with dynamic network statistics
Conclusion
Network generationDynamic analysis
LWCC and No.nodes0.
00.
30.
6
15_min
LWC
C
05−
02 0
405
−02
06
05−
02 0
805
−02
10
05−
02 1
205
−02
14
05−
02 1
605
−02
18
05−
02 2
005
−02
22
05−
03 0
005
−03
02
05−
03 0
405
−03
06
05−
03 0
805
−03
10
05−
03 1
205
−03
14
05−
03 1
605
−03
18
05−
03 2
005
−03
22
05−
04 0
0
020
0040
00
#Nod
es
LWCC
#Nodes
0.0
0.3
0.6
30_min
LWC
C
05−
02 0
405
−02
06
05−
02 0
805
−02
10
05−
02 1
205
−02
14
05−
02 1
605
−02
18
05−
02 2
005
−02
22
05−
03 0
005
−03
02
05−
03 0
405
−03
06
05−
03 0
805
−03
10
05−
03 1
205
−03
14
05−
03 1
605
−03
18
05−
03 2
005
−03
22
05−
04 0
0
020
0040
00
#Nod
es
LWCC
#Nodes
0.0
0.3
0.6
60_min
LWC
C
05−
02 0
405
−02
06
05−
02 0
805
−02
10
05−
02 1
205
−02
14
05−
02 1
605
−02
18
05−
02 2
005
−02
22
05−
03 0
005
−03
02
05−
03 0
405
−03
06
05−
03 0
805
−03
10
05−
03 1
205
−03
14
05−
03 1
605
−03
18
05−
03 2
005
−03
22
05−
04 0
0
020
0040
00
#Nod
es
LWCC
#Nodes
0.0
0.3
0.6
120_min
LWC
C
05−
02 0
405
−02
06
05−
02 0
805
−02
10
05−
02 1
205
−02
14
05−
02 1
605
−02
18
05−
02 2
005
−02
22
05−
03 0
005
−03
02
05−
03 0
405
−03
06
05−
03 0
805
−03
10
05−
03 1
205
−03
14
05−
03 1
605
−03
18
05−
03 2
005
−03
22
05−
04 0
0
020
0040
00
#Nod
es
LWCC
#Nodes
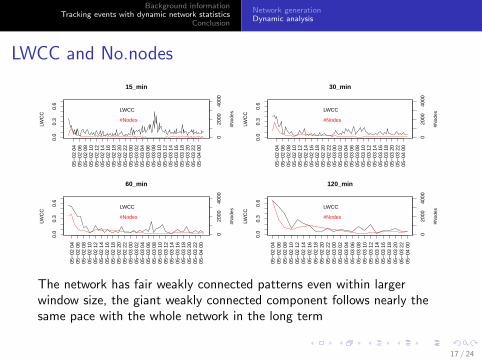
The network has fair weakly connected patterns even within largerwindow size, the giant weakly connected component follows nearly thesame pace with the whole network in the long term
17 / 24
Background informationTracking events with dynamic network statistics
Conclusion
Network generationDynamic analysis
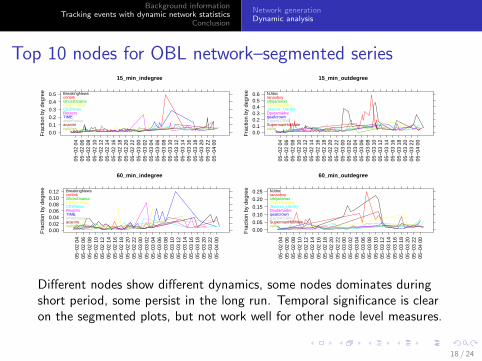
Top 10 nodes for OBL network–segmented series15_min_indegree
Different nodes show different dynamics, some nodes dominates duringshort period, some persist in the long run. Temporal significance is clearon the segmented plots, but not work well for other node level measures.
18 / 24
Background informationTracking events with dynamic network statistics
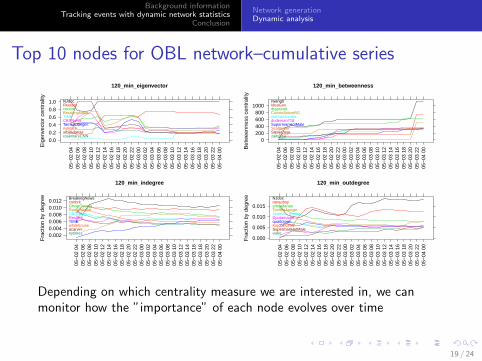
Depending on which centrality measure we are interested in, we canmonitor how the ”importance” of each node evolves over time
19 / 24
Background informationTracking events with dynamic network statistics
Conclusion
Network generationDynamic analysis
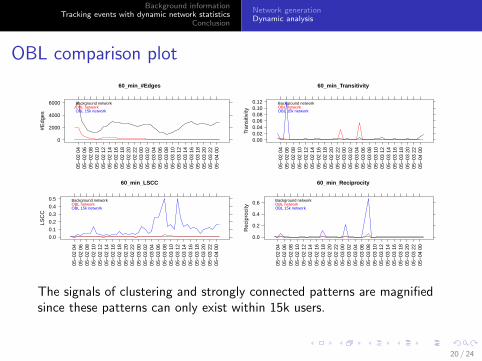
OBL comparison plot
60_min_#Edges
#Edg
es
0
2000
4000
6000
05−
02 0
405
−02
06
05−
02 0
805
−02
10
05−
02 1
205
−02
14
05−
02 1
605
−02
18
05−
02 2
005
−02
22
05−
03 0
005
−03
02
05−
03 0
405
−03
06
05−
03 0
805
−03
10
05−
03 1
205
−03
14
05−
03 1
605
−03
18
05−
03 2
005
−03
22
05−
04 0
0
Background networkOBL networkOBL 15k network
60_min_LSCC
LSC
C
0.0
0.1
0.2
0.3
0.4
0.5
05−
02 0
405
−02
06
05−
02 0
805
−02
10
05−
02 1
205
−02
14
05−
02 1
605
−02
18
05−
02 2
005
−02
22
05−
03 0
005
−03
02
05−
03 0
405
−03
06
05−
03 0
805
−03
10
05−
03 1
205
−03
14
05−
03 1
605
−03
18
05−
03 2
005
−03
22
05−
04 0
0
Background networkOBL networkOBL 15k network
60_min_Transitivity
Tran
sitiv
ity
0.000.020.040.060.080.100.12
05−
02 0
405
−02
06
05−
02 0
805
−02
10
05−
02 1
205
−02
14
05−
02 1
605
−02
18
05−
02 2
005
−02
22
05−
03 0
005
−03
02
05−
03 0
405
−03
06
05−
03 0
805
−03
10
05−
03 1
205
−03
14
05−
03 1
605
−03
18
05−
03 2
005
−03
22
05−
04 0
0
Background networkOBL networkOBL 15k network
60_min_Reciprocity
Rec
ipro
city
0.0
0.2
0.4
0.6
05−
02 0
405
−02
06
05−
02 0
805
−02
10
05−
02 1
205
−02
14
05−
02 1
605
−02
18
05−
02 2
005
−02
22
05−
03 0
005
−03
02
05−
03 0
405
−03
06
05−
03 0
805
−03
10
05−
03 1
205
−03
14
05−
03 1
605
−03
18
05−
03 2
005
−03
22
05−
04 0
0
Background networkOBL networkOBL 15k network
The signals of clustering and strongly connected patterns are magnifiedsince these patterns can only exist within 15k users.
20 / 24
Background informationTracking events with dynamic network statistics
Conclusion
Summary
I Overall the retweet network is poorly connected in the strongsense and fairly well in the weak sense.
I Both short term and long term dynamics are observed.
I Various contributions from ”important” nodes can beidentified
I Spread of event information starts with a large number ofusers and a high speed, and quickly dies out, but smallgroups of discussion remain persistent.
21 / 24
Background informationTracking events with dynamic network statistics
Conclusion
Future work
So far we have developed a multi-resolution method which canshed light on fine structures of information diffusion patterns ofevents on Twitter. But there are several issues need to beaddressed:
I The 15k user panel data only includes tweets from the 15kusers, leading to biased network formation, we have to findsome way to characterize the bias.
I Though we can distinguish two networks visually, we still needa quantitative way to formulate an effective hypothesis test.
I Proper time window size selection.
I Comparison with results of mention network.
22 / 24
Background informationTracking events with dynamic network statistics
Conclusion
References
Dave, Evans
Social Media Marketing: The Next Generation of Business Engagement
John Wiley and Sons
Swaroop, Prem and Joshi, Yogesh V. and Rand, William M. and Raschid,Louiqa
Influence in Microblogs: Impact of User Behavior on Diffusion andEngagement
Robert H. Smith School Research Paper
Cha, M., Haddadi, H., Benevenuto, F., and Gummadi, P. K.
Measuring User Influence in Twitter: The Million Follower Fallacy
ICWSM
23 / 24
Background informationTracking events with dynamic network statistics


![Dynamic Programming - Princeton University Computer Science · 3 Dynamic Programming History Bellman. [1950s] Pioneered the systematic study of dynamic programming. Etymology. Dynamic](https://static.documents.pub/doc/80x56/6046dbfc71b5767bc03138ec/dynamic-programming-princeton-university-computer-3-dynamic-programming-history.jpg)
