1Anhui Province Key Laboratory of Big Data Analysis and Application, School of Computer Science andTechnology, University of Science and Technology of China
{cyy33222,huangzhy,wurz1990}@mail.ustc.edu.cn,{qiliuql,cheneh}@ustc.edu.cn2Hefei University of Technology, Hefei, Anhui 230009, China, [email protected]
Diagnosing students’ knowledge proficiency, i.e., the mas-tery degrees of a particular knowledge point in exercises, isa crucial issue for numerous educational applications, e.g.,targeted knowledge training and exercise recommendation.Educational theories have converged that students learn andforget knowledge from time to time. Thus, it is necessary totrack their mastery of knowledge over time. However, tradi-tional methods in this area either ignored the explanatorypower of the diagnosis results on knowledge points or reliedon a static assumption. To this end, in this paper, we devisean explanatory probabilistic approach to track the knowledgeproficiency of students over time by leveraging educationalpriors. Specifically, we first associate each exercise with aknowledge vector in which each element represents an ex-plicit knowledge point by leveraging educational priors (i.e.,Q-matrix). Correspondingly, each student is represented asa knowledge vector at each time in a same knowledge space.Second, given the student knowledge vector over time, weborrow two classical educational theories (i.e., Learning curveand Forgetting curve) as priors to capture the change of eachstudent’s proficiency over time. After that, we design a proba-bilistic matrix factorization framework by combining studentand exercise priors for tracking student knowledge proficiency.Extensive experiments on three real-world datasets demon-strate both the effectiveness and explanatory power of ourproposed model.
KEYWORDS
Knowledge Diagnosis; Dynamic Modeling; Educational Priors;Explanatory Power
*Corresponding author.
Permission to make digital or hard copies of all or part of this workfor personal or classroom use is granted without fee provided thatcopies are not made or distributed for profit or commercial advantageand that copies bear this notice and the full citation on the firstpage. Copyrights for components of this work owned by others thanACM must be honored. Abstracting with credit is permitted. To copyotherwise, or republish, to post on servers or to redistribute to lists,requires prior specific permission and/or a fee. Request permissionsfrom [email protected].
CIKM’17 , November 6–10, 2017, Singapore, Singapore
Real-world education service systems, such as intelligenttutoring systems, allow students to learn and do exercisesindividually. Their conveniences and rapid developments havecaused an increasing attention of educators and publics [1, 5].
A key issue in such systems is the Knowledge Proficien-cy Diagnosis (KPD) of students, i.e., to discover the latentmastery degrees of students on each knowledge point [32].Figure 1 shows a toy example for this KPD task. From thefigure, there are two students (𝑢1 and 𝑢2) doing differen-t mathematical exercises from March to May 2016. Eachexercise contains different knowledge points, which can berepresented as a Q-matrix provided by educational expert-s [8]. Specifically, the number 1 in Q-matrix denotes thatthe corresponding exercise contains the knowledge point and0 otherwise. As shown in this figure, exercise 𝑒1 containsa knowledge point Function, and exercise 𝑒9 is related toknowledge points Function and Inequality. The KPD taskin educational area asks that: Given students’ historical ex-ercise records and the provided Q-matrix, how to diagnosethe mastery degrees of students to the knowledge points (i.e.,Function and Inequality in Figure 1)? In fact, as these diag-nosis results are beneficial to numerous applications, such astargeted knowledge training [12] and personalized exerciserecommendation [26], many efforts have been devoted to thisKPD task. On one hand, cognitive diagnosis models from theeducational psychology area usually characterize students’knowledge proficiency by a latent trait value [11] or a binaryskill mastery vector [8]. On the other hand, by treating theKPD task as a data mining problem (i.e., student score pre-diction), matrix factorization techniques project each studentin a latent space that depicts students’ implicit knowledgestates [16]. In summary, these two research directions usuallymodel users’ historical records without any temporal informa-tion, thus, they are good at predicting student’s proficiencyfrom a static perspective.
However, educational psychologists have long convergedthat the learning process of students is not static but evolvesover time [29]. They claims that students learn and forgetthe knowledge from time to time. Two classical educationaltheories can well explain this dynamic change: the Learningcurve theory argues that students can enhance their knowl-edge proficiency with constant trails or exercises [2] and the
Session 5B: Application Driven Mining CIKM’17, November 6-10, 2017, Singapore
Figure 1: A showcase of KPD task on mathematical exercises related to the knowledge points of Function and Inequalityfrom March to May, 2016. The left area contains two parts: the top part shows the student learning process with different
exercises, and a related Q-matrix that depicts the knowledge points of the exercises. Specifically, each row of the Q-matrix denotes an exercise and each column stands for a knowledge point. The bottom part shows the corresponding
diagnosis results of the two students to these two knowledge points over time.
Ebbinghaus forgetting curve theory indicates that students’knowledge proficiency may decline due to the forgetting fac-tor [10]. Let us take the two students in Figure 1 as anexample. As time goes on, student 𝑢2 improved her profi-ciency on both two knowledge points with some exercisesshe took and learned. Therefore, she should focus on someexercises about new knowledge points. In contrast, student𝑢1’s knowledge proficiency decreased with the possible reasonof the forgetting factor. Thus, a timely review is necessary toreinforce these two knowledge points for 𝑢1. Therefore, it isnecessary to leverage these two educational theories to trackstudents’ knowledge proficiency over time.
In fact, several research works from both the cognitivediagnosis area [6, 7, 20, 21, 34] and the data mining commu-nity [27, 33, 35] have already attempted to solve KPD taskfrom a dynamic perspective. And the experimental resultsempirically showed the superiority of adding the temporalinformation for this task. However, there are still some ques-tions to answer. Specifically, the data mining based methods,such as the TF model [33], only capture the latent factorsof students over time, thus are hard to explain in practice.We argue that the explicit knowledge point explanation isespecially important in the KPD task. With explicit knowl-edge point meaning, students can quantitatively measure thestrengthes and weaknesses of themselves for self-improvement(e.g., targeted exercise training [12]). In addition, in thecognitive models, such as Baysian Knowlege Tracing basedmodels [7, 20, 34], the learning and forgetting factors areviewed as additional parameters, which neglects that thesetwo factors are closely related to the exercises they do ateach time as suggested by educational experts. Thus, thesecognitive models could not answer the question of how theseeducational theory could help to explain the evolution ofstudents’ knowledge proficiency over time. Therefore, few ofthe existing approaches can address the following challenge:how to embed the educational priors in the KPD modelingtask to better explain and predict the KPD task of studentsto knowledge points?
To solve the challenge mentioned above, in this paper, wepropose an explanatory probabilistic Knowledge ProficiencyTracing (KPT) model to track the KPD task of students overtime by leveraging educational priors. Specifically, we firstassociate each exercise with a knowledge vector, in whicheach element represents an explicit knowledge point. TheQ-matrix that is marked by educational experts to depictthe relationship between knowledge points and exercises, isexploited as priors to generate exercise representations. Totrack students’ knowledge proficiency, each student is rep-resented as a knowledge vector at each time in the sameknowledge space. Then we embed the classical educationaltheories (i.e., Learning curve and Forgetting curve) as pri-ors to capture the change of each student’s proficiency overtime. After that, we design a probabilistic matrix factoriza-tion framework by combining student and exercise priors.Thus, the proposed model can track and explain students’knowledge proficiency over time. Finally, the experimentalresults clearly validate both the effectiveness and explanatorypower of our proposed KPT model. To best of our knowledge,this is the first comprehensive attempt to incorporate threeeducational priors (Q-matrix, Learning curve and Forgettingcurve) into a probabilistic matrix factorization framework fortracking KPD task with both precise and explanatory power.
2 RELATED WORK
Generally, we summarize the related work of our research asthe following three categories.
The first category is student modeling [31, 35] in datamining area, with the goal to learn students’ latent repre-sentations from their exercise. These learned representationscould be applied to applications, such as score prediction [30].Usually, we also regard the obtained representations of stu-dents as their implicit knowledge proficiency. There are twotypes of representative techniques: factorization models [16]and neural networks [22]. For instance, Thai-Nghe et al. [27]leveraged matrix factorization models to map each studentinto a latent vector that depicts students’ implicit knowledge
Session 5B: Application Driven Mining CIKM’17, November 6-10, 2017, Singapore
990
Table 1: A toy example of exercise logs.
StudentId ExerciseId UpdateTime Score
𝑆1 𝐸1 𝑇1 1
𝑆1 𝐸2 𝑇2 0.25
𝑆2 𝐸2 𝑇3 0𝑆2 𝐸3 𝑇4 1
𝑆2 𝐸3 𝑇5 0.75
𝑆5 𝐸2 𝑇6 1. . . . . . . . . . . .
states. In order to track changes of student learning process,Thai-Nghe et al. [27] and Xiong et al. [33] proposed tensorfactorization approaches by incorporating additional timedimensions for KPD over time. Recently, through establishinga bridge between knowledge points and neurons, Piech etal. [22] developed a recurrent neural network based approachto model student learning process, which improved the per-formance of score prediction task. Nevertheless, a commonlimitation of these works is that these models operate likea black box, thus the output of the student representationsare hard to explain. That is to say, neither the latent vec-tors from factorization models nor the hidden layers fromneural networks can correspond to any explicit knowledgepoint. In contrast, our model improves the traditional matrixfactorization by leveraging educational priors (i.e., Q-matrix,Learning curve and Forgetting curve), which guarantees theexplanatory power.
The second direction is KPD research in educational cogni-tive area, which aims at discovering the proficiency of studentson defined knowledge points [9, 14]. Widely-used approachescould be divided into two aspects: one-dimensional modelsand multi-dimensional models. Among them, Item ResponseTheory (IRT), as a typical one-dimensional model, consid-ered each student as a single proficiency variable (i.e., latenttrait) [11]. Comparatively, multi-dimensional models, such asDeterministic Inputs, Noisy-And gate model, characterizedstudents by a binary latent vector which described whetheror not she mastered the knowledge points with the givenQ-matrix prior [8]. Furthermore, Wu et al. [32] proposedFuzzyCDM to quantitatively diagnose student knowledgeproficiency. However, to the best of our knowledge, all thesemethods rely on static assumption and ignore temporal factorfor KPD task. In this work, we focus on the dynamic learningprocess of students and capture the change of each student’sknowledge proficiency over time.
In order to explain the dynamic changes of students’ knowl-edge proficiency during their learning process, educationalpsychologists have converged two classical theories: Learningcurve theory argues that students can enhance their knowl-edge proficiency with constant trails or exercises [2] andEbbinghaus forgetting curve theory indicates that students’knowledge proficiency may decline as time goes on [10]. Basedon these two prior theories, researchers have attempted todevelop a series of models for solving KPD task from anevolving perspective. For example, some IRT based models,such as Learning Factors Analysis [6] and Performance Fac-tors Analysis [21], were proposed to improve traditional IRT,which assumed that students shared the same parameters of
Table 2: Some important notations.
Notation Description𝑁 the total number of students𝑀 the total number of exercises𝑇 the total number of time windows𝐾 the total number of knowledge points𝑅𝑡
𝑖𝑗 the response of Student 𝑖 on Exercise 𝑗 in time window 𝑡
𝑈𝑡𝑖 the knowledge proficiency of Student 𝑖 in time window 𝑡
𝑉𝑗 the correlation level of Exercise 𝑗 on each knowledge point𝑏𝑗 the difficulty of Exercise 𝑗𝛼𝑖 the balance parameter of Student 𝑖
learning rate when exercising. Furthermore, Wang et al. [29]proposed a time-series IRT model to estimate a dynamiclatent trait of each student. In addition, researchers proposedvariations of Bayesian Knowledge Tracing (BKT) based mod-els [7, 15, 20, 34] to capture the change of students’ knowledgeproficiency over time. Despite the importance of these efforts,there are still some limitations in practice: First, IRT basedmodels only estimate a variable (e.g., latent trait) for eachstudent so that they cannot discover students proficiency onmultiple knowledge points simultaneously (i.e., KPD taskfor two knowledge points in Figure 1). Second, BKT basedmodels focus on a simplified learning scenario where studentsare allowed to keep doing the same exercise while overlookinga more practical one in Figure 1 where students just do eachexercise only once. In most cases, students seldom repeatdoing the same exercises but seek more different exercisesfor learning. Last but not least, both IRT and BKT basedmodels neglect the influence of exercises for the learning andforgetting factors directly, thus is hard to explain students’knowledge evolution over time.
Based on the learning scenario that most students do eachexercise only once, in this paper, we aim to track and explainstudents knowledge proficiency on multiple knowledge pointsleveraging by underlying theories (i.e., Q-matrix, Learningcurve and Forgetting curve).
3 KNOWLEDGE PROFICIENCYTRACKING MODEL
In this section, we first formally introduce the KPD task andour study overview. Then we introduce the technical detailsof our proposed model KPT. At last, we specify parameterlearning and prediction of KPT.
3.1 Problem and Study Overview
Suppose there are 𝑁 students, 𝑀 exercises and 𝐾 knowledgepoints in a learning system where students do exercises atdifferent times recorded by students’ exercise logs (as shownin Table 1). Specifically, the students’ response logs can berepresented as a response tensor 𝑅 ∈ R𝑁×𝑀×𝑇 . If student 𝑖does exercise 𝑗 at time 𝑡, 𝑅𝑡
𝑖𝑗 denotes 𝑖’s score of exercise 𝑗.In addition, we also have a Q-matrix provided by educationalexperts, which can be represented as a binary knowledgematrix 𝑄 ∈ R𝑀×𝐾 . If exercise 𝑗 relates to knowledge point𝑘, 𝑄𝑗𝑘 = 1 and vice versa. It is worth mentioning that atdifferent time, most students do the same exercises only oncebecause they usually choose different exercises to learn a
Session 5B: Application Driven Mining CIKM’17, November 6-10, 2017, Singapore
991
Q-matrix
LearnForget
2 2 1
2 3 1
, ,
, ,
e k k
e k k
Partial order
Knowledge pointsV
Predicting
KPTOutputing
1TR 1TU
1 1 2
1 1 3
, ,
, ,
e k k
e k k
Reponses records
12
T...
Modeling
U
Knowledge points
0.8 0.6 0.20.5 0.3 0.1
? ?? ?
0.9 0.2 0.10.1 0.8 0.9 0.5 0.4 0.2
0.7 0.5 0.6
1 0 00 1 1
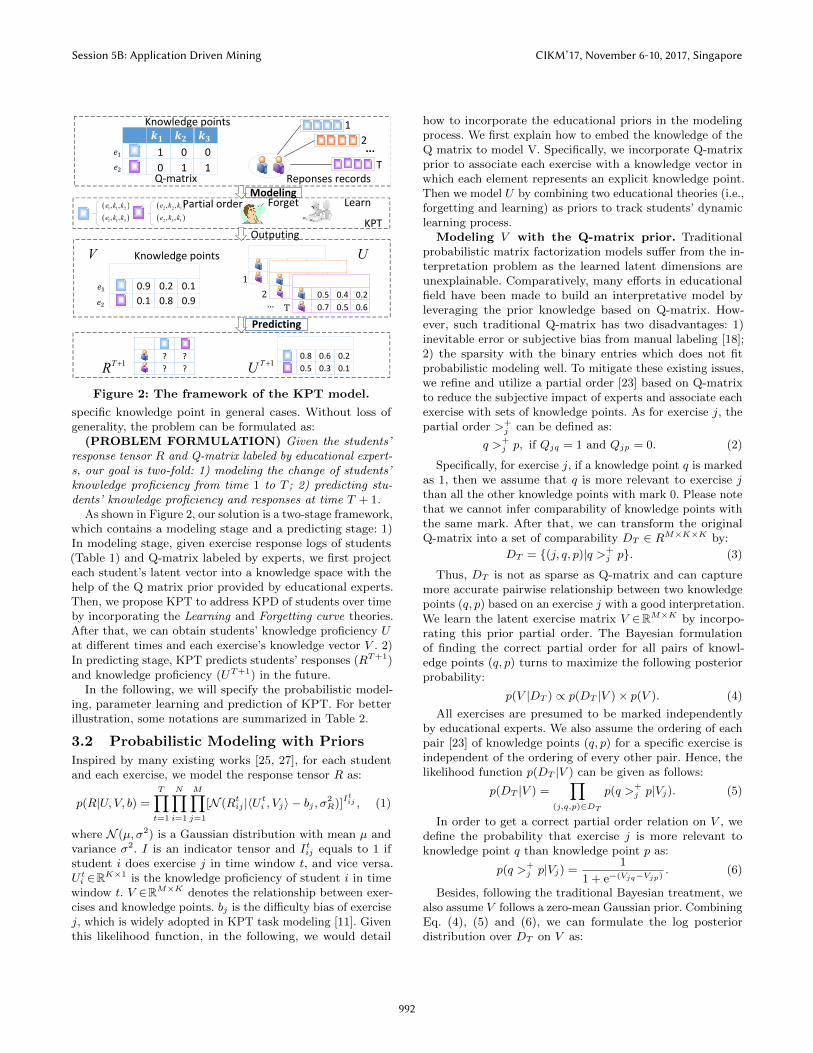
Figure 2: The framework of the KPT model.
specific knowledge point in general cases. Without loss ofgenerality, the problem can be formulated as:
(PROBLEM FORMULATION) Given the students’response tensor 𝑅 and Q-matrix labeled by educational expert-s, our goal is two-fold: 1) modeling the change of students’knowledge proficiency from time 1 to 𝑇 ; 2) predicting stu-dents’ knowledge proficiency and responses at time 𝑇 + 1.
As shown in Figure 2, our solution is a two-stage framework,which contains a modeling stage and a predicting stage: 1)In modeling stage, given exercise response logs of students(Table 1) and Q-matrix labeled by experts, we first projecteach student’s latent vector into a knowledge space with thehelp of the Q matrix prior provided by educational experts.Then, we propose KPT to address KPD of students over timeby incorporating the Learning and Forgetting curve theories.After that, we can obtain students’ knowledge proficiency 𝑈at different times and each exercise’s knowledge vector 𝑉 . 2)In predicting stage, KPT predicts students’ responses (𝑅𝑇+1)and knowledge proficiency (𝑈𝑇+1) in the future.
In the following, we will specify the probabilistic model-ing, parameter learning and prediction of KPT. For betterillustration, some notations are summarized in Table 2.
3.2 Probabilistic Modeling with Priors
Inspired by many existing works [25, 27], for each studentand each exercise, we model the response tensor 𝑅 as:
𝑝(𝑅|𝑈, 𝑉, 𝑏) =𝑇∏
𝑡=1
𝑁∏𝑖=1
𝑀∏𝑗=1
[𝒩 (𝑅𝑡𝑖𝑗 |⟨𝑈 𝑡
𝑖 , 𝑉𝑗⟩ − 𝑏𝑗 , 𝜎2𝑅)]
𝐼𝑡𝑖𝑗 , (1)
where 𝒩 (𝜇, 𝜎2) is a Gaussian distribution with mean 𝜇 andvariance 𝜎2. 𝐼 is an indicator tensor and 𝐼𝑡𝑖𝑗 equals to 1 ifstudent 𝑖 does exercise 𝑗 in time window 𝑡, and vice versa.𝑈 𝑡
𝑖 ∈R𝐾×1 is the knowledge proficiency of student 𝑖 in timewindow 𝑡. 𝑉 ∈R𝑀×𝐾 denotes the relationship between exer-cises and knowledge points. 𝑏𝑗 is the difficulty bias of exercise𝑗, which is widely adopted in KPT task modeling [11]. Giventhis likelihood function, in the following, we would detail
how to incorporate the educational priors in the modelingprocess. We first explain how to embed the knowledge of theQ matrix to model V. Specifically, we incorporate Q-matrixprior to associate each exercise with a knowledge vector inwhich each element represents an explicit knowledge point.Then we model 𝑈 by combining two educational theories (i.e.,forgetting and learning) as priors to track students’ dynamiclearning process.
Modeling 𝑉 with the Q-matrix prior. Traditionalprobabilistic matrix factorization models suffer from the in-terpretation problem as the learned latent dimensions areunexplainable. Comparatively, many efforts in educationalfield have been made to build an interpretative model byleveraging the prior knowledge based on Q-matrix. How-ever, such traditional Q-matrix has two disadvantages: 1)inevitable error or subjective bias from manual labeling [18];2) the sparsity with the binary entries which does not fitprobabilistic modeling well. To mitigate these existing issues,we refine and utilize a partial order [23] based on Q-matrixto reduce the subjective impact of experts and associate eachexercise with sets of knowledge points. As for exercise 𝑗, thepartial order >+
𝑗 can be defined as:
𝑞 >+𝑗 𝑝, if 𝑄𝑗𝑞 = 1 and 𝑄𝑗𝑝 = 0. (2)
Specifically, for exercise 𝑗, if a knowledge point 𝑞 is markedas 1, then we assume that 𝑞 is more relevant to exercise 𝑗than all the other knowledge points with mark 0. Please notethat we cannot infer comparability of knowledge points withthe same mark. After that, we can transform the originalQ-matrix into a set of comparability 𝐷𝑇 ∈ 𝑅𝑀×𝐾×𝐾 by:
𝐷𝑇 = {(𝑗, 𝑞, 𝑝)|𝑞 >+𝑗 𝑝}. (3)
Thus, 𝐷𝑇 is not as sparse as Q-matrix and can capturemore accurate pairwise relationship between two knowledgepoints (𝑞, 𝑝) based on an exercise 𝑗 with a good interpretation.We learn the latent exercise matrix 𝑉 ∈R𝑀×𝐾 by incorpo-rating this prior partial order. The Bayesian formulationof finding the correct partial order for all pairs of knowl-edge points (𝑞, 𝑝) turns to maximize the following posteriorprobability:
𝑝(𝑉 |𝐷𝑇 ) ∝ 𝑝(𝐷𝑇 |𝑉 )× 𝑝(𝑉 ). (4)
All exercises are presumed to be marked independentlyby educational experts. We also assume the ordering of eachpair [23] of knowledge points (𝑞, 𝑝) for a specific exercise isindependent of the ordering of every other pair. Hence, thelikelihood function 𝑝(𝐷𝑇 |𝑉 ) can be given as follows:
𝑝(𝐷𝑇 |𝑉 ) =∏
(𝑗,𝑞,𝑝)∈𝐷𝑇
𝑝(𝑞 >+𝑗 𝑝|𝑉𝑗). (5)
In order to get a correct partial order relation on 𝑉 , wedefine the probability that exercise 𝑗 is more relevant toknowledge point 𝑞 than knowledge point 𝑝 as:
𝑝(𝑞 >+𝑗 𝑝|𝑉𝑗) =
1
1 + e−(𝑉𝑗𝑞−𝑉𝑗𝑝). (6)
Besides, following the traditional Bayesian treatment, wealso assume 𝑉 follows a zero-mean Gaussian prior. CombiningEq. (4), (5) and (6), we can formulate the log posteriordistribution over 𝐷𝑇 on 𝑉 as:
Session 5B: Application Driven Mining CIKM’17, November 6-10, 2017, Singapore
992
ln 𝑝(𝑉 |𝐷𝑇 ) = ln∏
(𝑗,𝑞,𝑝)∈𝐷𝑇
𝑝(>+𝑗 |𝑉 )𝑝(𝑉 )
=
𝑀∑𝑗=1
𝐾∑𝑞=1
𝐾∑𝑝=1
𝐼(𝑞 >+
𝑗 𝑝)ln
1
1 + e−(𝑉𝑗𝑞−𝑉𝑗𝑝)
− 1
2𝜎2𝑉
||𝑉 ||2𝐹 .
(7)Modeling 𝑈 with two dynamic learning theories.
Now we specify the modeling of students’ latent tensor 𝑈 .As mentioned before, during students’ dynamic learning pro-cess, there are two widely accepted theories in educationalpsychology that could guide us in the modeling process: 1)Learning curve. [2] depicts the knowledge we learned canbe enhanced with several exercises. 2)Ebbinghaus forgettingcurve [28] hypothesizes the knowledge we learned will begradually forgotten over time.
Combining the two theories as priors, we assume a studen-t’s current knowledge proficiency is mainly influenced by twounderlying reasons: 1) The more exercises she does, the high-er level of related knowledge proficiency she will get. 2) Thelonger the time passes, the more knowledge she will forget.Formally, we model two effects of each student’s knowledgeproficiency at time window 𝑡 = 2, 3, ..., 𝑇 as:
𝑝(𝑈 𝑡𝑖 ) = 𝒩 (𝑈 𝑡
𝑖 |𝑈 𝑡𝑖 , 𝜎
2𝑈I),where 𝑈 𝑡
𝑖={𝑈 𝑡
𝑖1, 𝑈𝑡𝑖2...
¯𝑈 𝑡𝑖𝐾
}𝑈 𝑡
𝑖𝑘=𝛼𝑖𝑙𝑡(*) +(1− 𝛼𝑖) 𝑓
𝑡(*), s.t. 0 ≤ 𝛼𝑖 ≤ 1, (8)
where 𝑈 𝑡𝑖 ∈ R𝐾×1, the knowledge proficiency of student 𝑖 in
time window 𝑡, follows a Gaussian distribution with mean 𝑈 𝑡𝑖
and variance 𝜎2𝑈I. 𝑈
𝑡𝑖𝑘 is student 𝑖’s knowledge proficiency
on knowledge point 𝑘 at time 𝑡. 𝑙𝑡(*) is the learning factorwhich means the learned knowledge at time 𝑡 after severalexercises and 𝑓 𝑡(*) is the forgetting factor which indicates theremaining knowledge at time 𝑡. 𝛼𝑖 balances the two factorsto capture the students’ learning characteristics. Intuitively,if student 𝑖 has a large 𝑎𝑖, she may be diligent. Thus 𝑙𝑡(*),instead of 𝑓 𝑡(*), affects her future knowledge proficiency moresignificantly, and vice versa. In the following, we formallydefine 𝑙𝑡(*) and 𝑓 𝑡(*).
𝑙𝑡(*) captures the growth of knowledge with exercises:
𝑙𝑡(*) = 𝑈 𝑡−1𝑖𝑘
𝐷 * 𝑓 𝑡𝑘
𝑓 𝑡𝑘 + 𝑟
, (9)
where 𝑓 𝑡𝑘 denotes the frequency of knowledge 𝑘 examined in
time window 𝑡. 𝑟 and 𝐷 are two hyper-parameters, whichcontrol the magnitude and multiplier of growth respectively.
𝑓 𝑡(*) depicts the decline of knowledge over time:
𝑓 𝑡(*) = 𝑈 𝑡−1𝑖𝑘 e−
Δ𝑡𝑆 , (10)
where ∆𝑡 is the time interval between time window 𝑡 − 1and time window 𝑡, 𝑆 is a hyper-parameter that denotes thestrength of memory.
At the initial time 𝑡 = 1, we do not know the initial levelof each student. Therefore, we assume a zero-mean Gaussian
…N*M
N
…N…
N
N…
N N…
M
… …
N
N N
N*M N*M N*M N*M
N N…
…
Figure 3: Graphical representation of KPT.
distribution of student’s knowledge proficiency at that time.Then we summarize the prior over user latent tensor as:
𝑝(𝑈 |𝜎2𝑈 , 𝜎
2𝑈1) =
𝑁∏𝑖=1
𝒩 (𝑈1𝑖 |0, 𝜎2
𝑈1I)
𝑇∏𝑡=2
𝒩 (𝑈 𝑡𝑖 |𝑈 𝑡
𝑖 , 𝜎2𝑈I). (11)
3.3 Model Learning and Prediction
We summarize the graphical representation of the proposedlatent model in Figure 3, where the shaded and unshadedvariables indicate the observed and latent variables. Givenstudents’ response tensor 𝑅 and partial order >+
𝑗 based on
Q-matrix, our goal is to learn the parameters Φ = [𝑈, 𝑉, 𝛼, 𝑏],𝛼 = [𝛼𝑖]
𝑁𝑖=1. Particularly, combining Eq. (1), (4) and(11), the
(12)Maximizing the log posterior of the above equation is
equivalent to minimizing the following objective:
minΦ
ℰ(Φ) = 1
2
𝑇∑𝑡=1
𝑁∑𝑖=1
𝑀∑𝑗=1
𝐼𝑡𝑖𝑗 [��𝑡𝑖𝑗 −𝑅𝑡
𝑖𝑗 ]2
− 𝜆𝑃
𝑀∑𝑗=1
𝐾∑𝑞=1
𝐾∑𝑝=1
𝐼(𝑞 >+
𝑗 𝑝)ln
1
1 + e−(𝑉𝑗𝑞−𝑉𝑗𝑝)+
𝜆𝑉
2
𝑀∑𝑖=1
||𝑉𝑖||2𝐹
+𝜆𝑈
2
𝑇∑𝑡=2
𝑁∑𝑖=1
||𝑈 𝑡𝑖 − 𝑈 𝑡
𝑖 ||2𝐹 +𝜆𝑈1
2
𝑁∑𝑖=1
||𝑈1𝑖 ||2𝐹 , (13)
where 𝜆𝑃 =𝜎2𝑅, 𝜆𝑈 =
𝜎2𝑅
𝜎2𝑈, 𝜆𝑈1 =
𝜎2𝑅
𝜎2𝑈1
and 𝜆𝑉 =𝜎2𝑅
𝜎2𝑉. Among
them, 𝜆𝑃 is a tradeoff coefficient between the responses pre-diction loss and partial order loss, and 𝜆𝑈 is a coefficient thatmeasures how student’s knowledge proficiency changes overtime. 𝜆𝑈1 and 𝜆𝑉 are regularization parameters for students’knowledge proficiency at time 1 and the exercise-knowledgecorrelation matrix.
Specifically, the derivative of each parameter are:
∇𝑈𝑡𝑖𝑘
=
𝑀∑𝑗=1
𝐼𝑡𝑖𝑗(��𝑡𝑖𝑗 −𝑅𝑡
𝑖𝑗)𝑉𝑗𝑘 + ℐ[𝑡 = 1]𝜆𝑈1𝑈1𝑖𝑘
+ ℐ[𝑡 ≥ 2]𝜆𝑈 (𝑈 𝑡𝑖𝑘 − 𝑈 𝑡
𝑖𝑘) (14)
+ 𝜆𝑈 (𝑈(𝑡+1)𝑖𝑘 − 𝑈
(𝑡+1)𝑖𝑘 )((1− 𝛼𝑖)e
−Δ𝑡𝑆 + 𝛼𝑖
𝐷𝑓 𝑡𝑘
𝑓 𝑡𝑘 + 𝑟
),
Session 5B: Application Driven Mining CIKM’17, November 6-10, 2017, Singapore
993
∇𝑉𝑗𝑘 =∑𝑇
𝑡=1
∑𝑁
𝑖=1𝐼𝑡𝑖𝑗(��
𝑡𝑖𝑗 −𝑅𝑡
𝑖𝑗)𝑈𝑡𝑖𝑘 + 𝜆𝑉 𝑉𝑗𝑘
− 𝜆𝑃
∑𝐾
𝑝=1𝐼(𝑘 >+
𝑗 𝑝) e−(𝑉𝑗𝑘−𝑉𝑗𝑝)
1 + e−(𝑉𝑗𝑘−𝑉𝑗𝑝)
− 𝜆𝑃
∑𝐾
𝑞=1𝐼(𝑞 >+
𝑗 𝑘) −e−(𝑉𝑗𝑞−𝑉𝑗𝑘)
1 + e−(𝑉𝑗𝑞−𝑉𝑗𝑘), (15)
∇𝛼𝑖 = 𝜆𝑈
𝑇∑𝑡=2
𝐾∑𝑘=1
(𝑈 𝑡𝑖𝑘 − 𝑈 𝑡
𝑖𝑘)(𝑈𝑡𝑖𝑘(
𝐷𝑓 𝑡𝑘
𝑓 𝑡𝑘 + 𝑟
− e−Δ𝑡𝑆 )), (16)
∇𝑏𝑗 =
𝑀∑𝑖=1
𝐼𝑡𝑖𝑗(��𝑡𝑖𝑗 −𝑅𝑡
𝑖𝑗), (17)
here ℐ[𝑥] is an indicator function that equals to 1 if 𝑥 is true.We can update 𝑈 , 𝑉 and 𝑏 directly by using Stochastic
Gradient Descent (SGD) method [4]. With the bound con-straints of 𝛼𝑖, a local minimum can be found by the ProjectedGradient (PG) method [17]. Specifically, for each 𝛼𝑖 ∈ [0, 1]the PG method updates the current solution 𝛼𝑘
𝑖 in 𝑘-thiteration to 𝛼𝑘+1
𝑖 by the following rule:
𝛼𝑘+1𝑖 = 𝑃 [𝛼𝑘
𝑖 − 𝜂∇𝛼𝑖 ], 𝑃 (𝛼𝑖) =
⎧⎪⎨⎪⎩𝛼𝑖 if 0 ≤ 𝛼𝑖 ≤ 1,
0 if 𝛼𝑖 < 0,
1 if 𝛼𝑖 > 1.
(18)
With students’ knowledge proficiency 𝑈1, 𝑈2, ..., 𝑈𝑇 andrelated parameters, students’ responses and knowledge profi-ciency at time T+1 can be predicted as:
𝑈(𝑇+1)𝑖 =
{𝑈
(𝑇+1)𝑖1 , 𝑈
(𝑇+1)𝑖2 , ..., 𝑈
(𝑇+1)𝑖𝐾
},
𝑈(𝑇+1)𝑖𝑘 ≈ (1− 𝛼𝑖)𝑈
𝑇𝑖𝑘e
−Δ(𝑇+1)𝑆 + 𝛼𝑖𝑈
𝑇𝑖𝑘
𝑀𝑓𝑇+1𝑘
𝑓𝑇+1𝑘 + 𝑟
,
��(𝑇+1)𝑖𝑗 ≈ ⟨𝑈 (𝑇+1)
𝑖 , 𝑉𝑗⟩ − 𝑏𝑗 . (19)
After obtaining ��(𝑇+1) and 𝑈 (𝑇+1) at time T+1, we canrecommend relevant exercises with high probability to getwrong response or forget for student 𝑖. In summary, we givethe training algorithm of KPT in Algorithm 1.
Algorithm 1: Parameter Learning of the KPT Model
Initialize 𝑈 , 𝑉 , 𝛼 and 𝑏 ;while not converged do
for 𝑖 = 1, 2, ...𝑁 dofor 𝑡 = 1, 2, ..., 𝑇 do
for 𝑘 = 1, 2, ...,𝐾 doFix 𝑉, 𝛼, 𝑏, update 𝑈𝑡
𝑖𝑘 using SGD;
Fix 𝑈, 𝑉, 𝑏, update 𝛼𝑖 using PG ;
for 𝑖 = 1, 2, ...,𝑀 dofor 𝑘 = 1, 2, ...,𝐾 do
Fix 𝑈,𝛼, 𝑏, update 𝑉𝑗𝑘 using SGD;
Fix 𝑈, 𝑉, 𝛼, update 𝑏 using SGD;
Return 𝑈 , 𝑉 , 𝛼 and 𝑏 ;
Time Complexity. KPT costs most of time in computingthe knowledge proficiency of each student and balancing pa-rameters. Suppose there are 𝑟 non-empty entries in responsetensor 𝑅, then the average response records of each studentin each time window are 𝑡𝑟 = 𝑟
𝑁×𝑇. In each iteration, the
time complexity is 𝑂(𝑁 × 𝑇 × 𝐾 × 𝑡𝑟 = 𝑂(𝐾 × 𝑟)) for 𝑈 ,𝑂(𝐾 × 𝑟) for 𝑉 , and 𝑂(𝑟) for the balance parameters. Thusthe total complexity of parameter learning in each iteration is𝑂(𝐾× 𝑟), which is linear with the records and time windows.
4 EXPERIMENTS
In this section, we first introduce our experimental datasetsand setups. Then, we report experimental results from thefollowing four aspects: (1) the predictive performance ofour KPT model; (2) the effectiveness on KPD task; (3) theinfluence of parameter settings in KPT; (4) the explanatorypower of the diagnosis results of KPT by a case study.
4.1 Datasets
In the experiments, we use three real-world datasets, i.e.,Math1, Math2 and ASSIST, respectively. Among them, Math1and Math2 are two private datasets which are collected fromdaily exercise records of high school students (Table 1) formathematics problems. ASSIST is a public dataset Assist-ments1 2009-2010 “Non-skill builder” [20], which records thestudent mathematics exercise logs in an on-line tutor.
In Math1 and Math2, each dataset contains responses ofstudents with time record and a given Q-matrix (an exampleis shown in Table 3) by educational experts. We treat eachmonth as a time window, and thus there are 4 (10) timepoints in dataset Math1 (Math2). In data splitting process,we use the data till time 𝑇 for model training, i.e., T=3(T=9) in Math1 (Math2), and the records of the last timewindow are for testing.
As for ASSIST, we preprocess the original dataset for ourKPD task as follows: (1) we select 71 exercises with 7 frequentknowledge points from ASSIST in the experiments becausethe knowledge points at different time require a high coverage.(2) Since the system allows students to repeat doing the sameexercises, we just take the first-attempt responses of them toeach exercise as records for fairness. (3) ASSIST only recordsthe order (no explicit time information) of student exercisehistory, we divided each student logs into four parts accordingto their sequencial order, thus we have 4 time windows inASSIST. Specifically, we use the first 3 order logs of studentfor model training, and the remain one is for testing.
In summary, Figure 4 shows the preview of three Q-matrices (we only show subsets of 28 exercises for betterillustration), where each row of each subfigure denotes anexercise and each column stands for a knowledge point. Thewhite one means the exercise is related to the knowledgepoint, while the black one indicates the exercise does notcontain the knowledge point. Moreover, a better explanationabout Q-matrix is shown in Table 3, which contains 5 exer-cises and the related knowledge points in Math1. From theFigure 4 and Table 3, we can see that most of the exercisesare less than two knowledge points, which indicates that Q-matrix is very sparse. Table 4 summarizes the basic statisticsof three datasets.
4.2 Experimental Setup
KPT Setting. We first introduce the parameter settings of𝑙𝑡(*) and 𝑓 𝑡(*) , i.e., Learning curve and Ebbinghaus forget-ting curve, respectively. Specifically, for 𝑙𝑡(*), we set 𝐷 = 2to control the multiplier of growth and the average frequency
Session 5B: Application Driven Mining CIKM’17, November 6-10, 2017, Singapore
994
Table 3: A practical example of Q-matrix in Math1.
ExerciseId Knowledge Points
E1 Function
E2 Function, Set
E3 Function, Derivative, Inequality
E4 Solid geometry, Trigonometric function
E5 Propositional logic
Figure 4: Q-matrix of two DataSets.
among all knowledge points 𝑟 as 4, 9, 6 in Math1, Math2, AS-SIST respectively; For 𝑓 𝑡(*), we set ∆𝑡 as 1 for all time inter-vals between time window 𝑡− 1 and 𝑡. And memory strength𝑆 as 5 to fit forgetting curve. Then, as for several regulariza-tion parameters in KPT model, we set 𝜆𝑈1=𝜆𝑉 = 0.01. 𝜆𝑈
is set to be 3, 1 and 2 in Math1, Math2 and ASSIST, and𝜆𝑃 is set to be 1.5, 1 and 2 in Math1, Math2 and ASSISTrespectively(we will discuss the sensitivity of parameters inthe next subsection).
Baseline Approaches. To compare the performance ofour proposed KPT model, we borrow some baselines fromvarious perspectives. The details of them are as follows:
∙ IRT : a cognitive diagnosis method modeling students’ la-tent trait and exercises’ parameters by a logistic-like func-tion [3] .
∙ DINA: a cognitive diagnosis method modeling each stu-dent’s knowledge proficiency by a binary vector with Q-matrix [8].
∙ PMF : a probabilistic matrix factorization method thatprojects students and exercises into low-rank latent fac-tors [24].
∙ BKT : a kind of Hidden Markov Model (HMM) whichmodels students’ latent knowledge state as a set of binaryvariables and determines when a knowledge point has beenlearned [7].
∙ LFA: an improved IRT model that assumes students sharethe same parameters of learning rate during their learningprocess [6].
∙ QMIRT : QMIRT is a variant of basic IRT model, wherewe extend the latent trait value of each student in IRT toa multi-dimension knowledge proficiency vector with ourproposed partial order prior of Q-matrix.
∙ QPMF : QPMF is a variant of basic PMF model, where weincorporate our proposed partial order prior of Q-matrixinto PMF to improve the explanatory power. Particularly,QPMF is also a simplified model of KPT that does notconsider priors of forgetting and learning.
Average knowledge points 1.15 1.3215 1.02of each exercise
Concretely, the chosen baselines are all widely-used in theeducational psychology area (IRT, DINA, BKT, LFA) and da-ta mining community (PMF), and the two variants (QMIRT,QPMF) are adopted to highlight the effectiveness of our pro-posed partial order Q-matrix prior. Also, all these baselinescan be categorized into static diagnostic models (IRT, DINA,PMF, QMIRT, QPMF) and the dynamic ones (LFA, BKT).For better illustration, we summarize the characteristics ofthese models in Table 5.
In the following experiments, both KPT and baselines areimplemented by Python and all experiments are run on aLinux server with four 2.0GHz Intel Xeon E5-2620 CPUs and100G memory. For fairness, all parameters in these baselinesare tuned to have the best performances.
4.3 Experimental Results
Students’ Responses Prediction. To demonstrate thepredictive performance of KPT model, we first conduct ex-periments on the task of predicting the responses of students(i.e., whether or not a student get the correct answer to aspecific exercise) at time window 𝑇 + 1 (the first task inpredicting stage of our framework in Figure 2). In this task,we adopt all the baselines mentioned above for comparison,and use the widely-used mean absolute error (MAE) and rootmean square error (RMSE) as the evaluation metrics [24].
Figure 5 shows the overall results of all models in students’score prediction task. There are several observations: First,our proposed model KPT performs best on all three datasets.Second, QMIRT and QPMF outperform traditional IRT andPMF, which indicates the effectiveness of incorporating thepartial order based Q-matrix prior. Third, KPT and LFA,as dynamic models, perform better than those with staticassumption (IRT, DINA, PMF), which demonstrates that itis more effective to diagnose students’ knowledge proficiencyfrom an evolving perspective. However, BKT does not perfor-m well on this task. We guess a possible reason is that BKTfocuses on the scenario that students keep doing the sameexercises. But in our data, most students just do a specificexercise only once, thus the exercise sequence lengths of stu-dents are not enough for BKT. In summary, these evidencesdemonstrate the rationality of three priors (i.e., Q-matrix,learning curve and forgetting curve).
Knowledge Proficiency Diagnosis. As mentioned be-fore, the second task in predicting stage of our framework inFigure 2 is predicting students’ knowledge proficiency in thefuture. In order to validate the effectiveness of this prediction
Session 5B: Application Driven Mining CIKM’17, November 6-10, 2017, Singapore
995
Table 5: Characteristics of the Baselines and KPT.
(i.e., whether or not the diagnosis results of students aregood), we also conduct several experiments.
Intuitively, if student 𝑎 masters better than student 𝑏 on aspecific knowledge point at time 𝑇 +1 (calculated by Eq. 19),she will have a higher probability to get correct answers tothe related exercises than student 𝑏 at time 𝑇 + 1. We adoptDegree of Agreement (DOA) [13, 19] metric to evaluate thisranking performance. Particularly, for a specific knowledge𝑘, the DOA result on 𝑘 is defined as:
𝐷𝑂𝐴(𝑘) =𝑀∑𝑗=1
𝐼𝑗𝑘
𝑁∑𝑎=1
𝑁∑𝑏=1
𝛿(𝑈𝑇+1
𝑎𝑘, 𝑈𝑇+1
𝑏𝑘
)∩ 𝛿
(𝑅𝑇+1
𝑎𝑗 , 𝑅𝑇+1𝑏𝑗
)𝛿(𝑈𝑇+1
𝑎𝑘, 𝑈𝑇+1
𝑏𝑘
) (20)
where 𝑈𝑇+1𝑎𝑘 is knowledge proficiency of student a on knowl-
edge point k at time 𝑇 + 1. 𝑅𝑇+1𝑎𝑗 ( denoted in Table 2) is
student 𝑎’s response on exercise 𝑗 at time 𝑇 +1. 𝛿(𝑥, 𝑦) is anindicator function, where 𝛿(𝑥, 𝑦) = 1 if 𝑥 > 𝑦. 𝐼𝑗𝑘 is an an-other indicator function, where 𝐼𝑗𝑘 = 1 if exercise 𝑗 containsknowledge point 𝑘. Then DOA value ranges from 0 to 1 andthe larger the better. Furthermore, we also average DOA(k)of all knowledge points for measuring the whole effectivenesson KPD task, which is denoted as DOA-Avg.
For model comparisons, we choose DINA, QMIRT, QPMFand BKT for this KPD task as baselines because all otherlatent factor models mentioned before are unexplainable forthe diagnosis, i.e., each dimension of student latent vectorscannot correspond to any explicit knowledge point.
Figure 6 illustrates the whole effectiveness results of allmodels on KPD task and Table 6 shows the results of eachspecific knowledge point in all three datasets. Specifically,for all datasets, KPT performs best on KPD task for all
knowledge points, followed by QPMF and QIRT, which indi-cates that the educational prior of Q-matrix does effectively.Besides, we also observe that traditional cognitive diagnosismodel DINA does not perform well, indicating that the staticmodel is unsuitable for solving the KPD task over time. Lastbut not least, we can see that BKT, as a dynamic model, doesnot perform as well as KPT. This observation demonstratesthe effectiveness of incorporating both priors of Learningcurve and Forgetting curve.
Sensitivity of Parameters. In our KPT model, thereare four parameters playing crucial roles: 𝜆𝑈1, 𝜆𝑉 , 𝜆𝑈 and 𝜆𝑃 .Among them, 𝜆𝑈1 and 𝜆𝑉 are the regularization parametersof students’ vectors of knowledge proficiency at time 𝑇 = 1and exercises’ vectors of knowledge related, respectively. Since𝜆𝑈1 and 𝜆𝑉 have a similar form to PMF model, we tunethem on PMF and set them under the setting of the bestperformance on PMF. In the following, we report the settingparameters 𝜆𝑈 and 𝜆𝑃 with the evaluation metrics of RMSEand DOA-Avg on both two tasks mentioned above.
𝜆𝑈 regularizes that students learn and forget knowledgesfrom time to time, Figure 7(a), Figure 7(c) and Figure 7(e)visualizes the performance with the increasing values of 𝜆𝑈
from 1, 0.1, 1 to 10, 5, 5 in datasets Math1, Math2, ASSISTrespectively. As we can see from the figure, as 𝜆𝑈 increases,the performances of KPT firstly increase but decrease when𝜆𝑈 surpasses 3, 1, 2 in datasets Math1 ,Math2, ASSIST.Therefore, we set 𝜆𝑈 = 3, 1, 2 in Math1, Math2, ASSIST forobtaining the best results.
Also, as shown in Figure 7(b), Figure 7(d) and Figure 7(f),parameter 𝜆𝑃 , which controls how much the KPT model isrestricted by the partial order Q-matrix prior, has the similarproperty to 𝜆𝑈 . As a result, we set 𝜆𝑃 = 1.5, 1, 2 in Math1,Math2, ASSIST respectively because the performance of KPTachieves the best when it reaches the corresponding value.
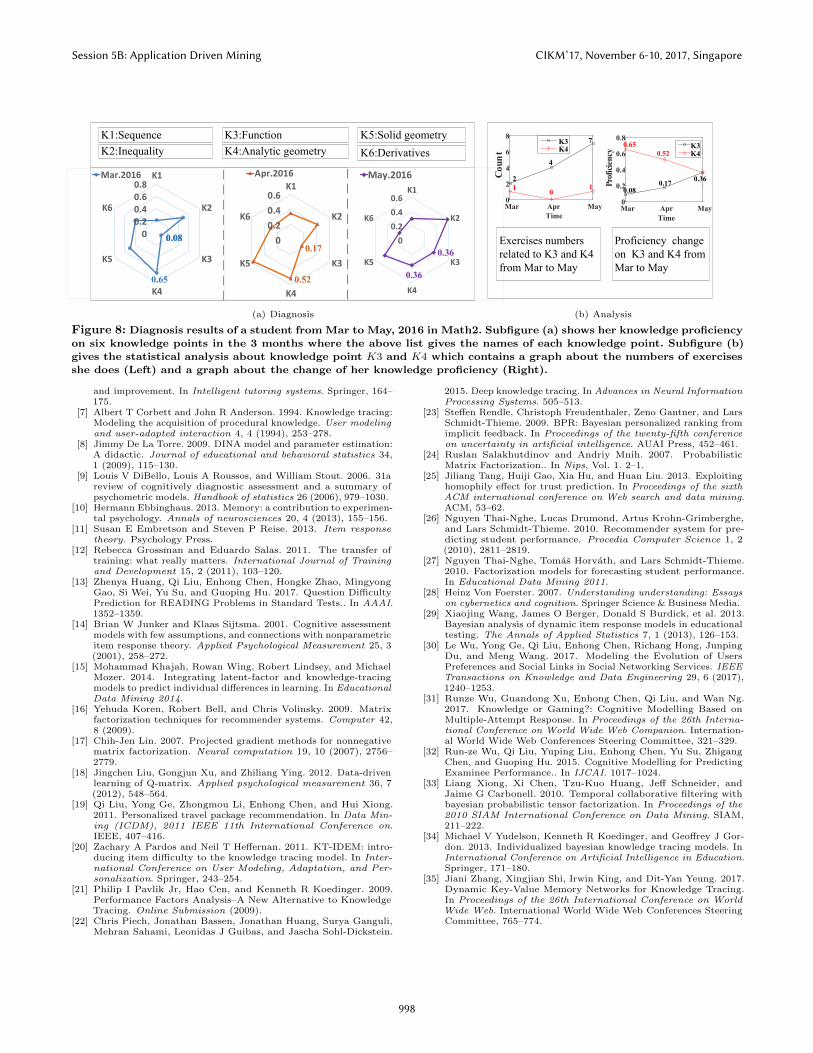
Case Study. We argue that KPT can track KPD ofstudents in an interpretable way. Figure 8 visualizes thediagnosis results of a student on six knowledge points atthree particular time in Math2 (we only show six knowledgepoints for better illustration). From the figure, she makesprogress on knowledge point “Function” from Mar (0.08)to May (0.36), 2016 with possible learning factor (she doesfrom 2 to 7 exercises about Function from March to May).In contrast, her proficiency on knowledge point Analyticgeometry declines (from 0.65 to 0.36) over time with possibleforgetting factor because she practices less than 2 relevantexercises at each time. These observations imply that she
Session 5B: Application Driven Mining CIKM’17, November 6-10, 2017, Singapore
996
Table 6: KPD task performance for each knowledge point.
Figure 6: KPD task performance for all knowledgepoints.
needs a timely review on Analytic geometry. Therefore, theseevidences could lead to more personalized training for her.
5 CONCLUSIONS AND FUTUREWORK
In this paper, we designed an explanatory probabilistic KPTmodel for solving the KPD task of students over time byleveraging educational priors. Specifically, we associated eachexercise with a knowledge vector with the Q-matrix prior.And each student was also represented as a knowledge vectorat each time in the same knowledge space. Then we embeddedthe classical educational theories (i.e., Learning curve andForgetting curve) as priors to capture the change of eachstudent’s proficiency over time. After that, we designed aprobabilistic matrix factorization framework by combiningstudent and exercise priors. Extensive experiments on threereal-world datasets clearly demonstrated the effectivenessand explanatory power of our proposed model.
In the future, there are some directions for further studies.First, we will consider to combine more kinds’ of users’ be-haviors (e.g., reading records) for the KPD task. Second, asstudents may learn difficult knowledge points (e.g., Function)after some basic ones (e.g., Set), it is interesting to take thiskind of knowledge relationship into account for KPD task.
6 ACKNOWLEDGEMENT
The authors thank Defu Lian for the valuable suggestions.This research was partially funded by the National High Tech-nology Research and Development Program (863 Program)of China (No. 2015AA015409), the National Natural Sci-ence Foundation of China (Grants No. 61672483, U1605251,
1 2 3 6 100.31
0.32
0.33
0.74
0.76
0.78RMSEDOA-Avg
RMSE
DOA-Avg
(a) Math1
0.5 1 1.5 2 3
RMSE
0.3
0.32
0.34
DOA-Avg
0.73
0.74
0.75RMSEDOA-Avg
(b) Math1
0.1 0.5 1 3 50.25
0.3
0.35
0.65
0.7
0.75
RMSEDOA-Avg
RMSE
DOA-Avg
(c) Math2
0.5 1 1.5 2 3
0.28
0.32
0.72
0.727
0.734
RMSEDOA-Avg
RMSE
DOA-Avg
0.24
(d) Math2
RMSE
DOA-Avg
1 1.5 2 3 50.25
0.255
0.26
0.265
0.83
0.84
0.85
0.86
RMSEDOA-Avg
(e) ASSIST
1 1.5 2 3 50.25
0.26
0.27
0.82
0.84
0.86
RMSEDOA-Avg
RMSE
DOA-Avg
(f) ASSIST
Figure 7: The impact of 𝜆𝑈 and 𝜆𝑃 .
61325010, 61602147), the Youth Innovation Promotion As-sociation of CAS (No. 2014299), and the Anhui ProvincialNatural Science Foundataion(Grant No. 1708085QF155).
REFERENCES[1] Ashton Anderson, Daniel Huttenlocher, Jon Kleinberg, and Jure
Leskovec. 2014. Engaging with massive online courses. In Pro-ceedings of the 23rd international conference on World wideweb. ACM, 687–698.
[2] Michel Jose Anzanello and Flavio Sanson Fogliatto. 2011. Learningcurve models and applications: Literature review and researchdirections. International Journal of Industrial Ergonomics 41,5 (2011), 573–583.
[3] Allan Birnbaum. 1968. Some latent trait models and their use ininferring an examinee’s ability. Statistical theories of mental testscores (1968).
[4] Leon Bottou. 2010. Large-scale machine learning with stochasticgradient descent. In Proceedings of COMPSTAT’2010. Springer,177–186.
[5] Hugh Burns, Carol A Luckhardt, James W Parlett, and Carol LRedfield. 2014. Intelligent tutoring systems: Evolutions in design.Psychology Press.
[6] Hao Cen, Kenneth Koedinger, and Brian Junker. 2006. Learningfactors analysis–a general method for cognitive model evaluation
Session 5B: Application Driven Mining CIKM’17, November 6-10, 2017, Singapore
997
K1:Sequence
K2:Inequality
K3:Function
K6:DerivativesK4:Analytic geometry
K5:Solid geometry
00.20.40.60.8
K1
K2
K3
K4
K5
K6
Mar.2016
00.20.40.6
K1
K2
K3
K4
K5
K6
Apr.2016
0.65
0.080.080.17
0.52
0
0.2
0.4
0.6K1
K2
K3
K4
K5
K6
May.2016
0.36
0.36
(a) Diagnosis
TimeMar Apr May
Proficiency
0
0.2
0.4
0.6
0.8K3K4
TimeMar Apr May
Count
0
2
4
6
8K3K4
Exercises numbers related to K3 and K4 from Mar to May
Proficiency change on K3 and K4 from Mar to May
0.080.17
0.36
0.650.52
10
12
4
7
(b) Analysis
Figure 8: Diagnosis results of a student from Mar to May, 2016 in Math2. Subfigure (a) shows her knowledge proficiency
on six knowledge points in the 3 months where the above list gives the names of each knowledge point. Subfigure (b)
gives the statistical analysis about knowledge point 𝐾3 and 𝐾4 which contains a graph about the numbers of exercisesshe does (Left) and a graph about the change of her knowledge proficiency (Right).
and improvement. In Intelligent tutoring systems. Springer, 164–175.
[7] Albert T Corbett and John R Anderson. 1994. Knowledge tracing:Modeling the acquisition of procedural knowledge. User modelingand user-adapted interaction 4, 4 (1994), 253–278.
[8] Jimmy De La Torre. 2009. DINA model and parameter estimation:A didactic. Journal of educational and behavioral statistics 34,1 (2009), 115–130.
[9] Louis V DiBello, Louis A Roussos, and William Stout. 2006. 31areview of cognitively diagnostic assessment and a summary ofpsychometric models. Handbook of statistics 26 (2006), 979–1030.
[10] Hermann Ebbinghaus. 2013. Memory: a contribution to experimen-tal psychology. Annals of neurosciences 20, 4 (2013), 155–156.
[11] Susan E Embretson and Steven P Reise. 2013. Item responsetheory. Psychology Press.
[12] Rebecca Grossman and Eduardo Salas. 2011. The transfer oftraining: what really matters. International Journal of Trainingand Development 15, 2 (2011), 103–120.
[13] Zhenya Huang, Qi Liu, Enhong Chen, Hongke Zhao, MingyongGao, Si Wei, Yu Su, and Guoping Hu. 2017. Question DifficultyPrediction for READING Problems in Standard Tests.. In AAAI.1352–1359.
[14] Brian W Junker and Klaas Sijtsma. 2001. Cognitive assessmentmodels with few assumptions, and connections with nonparametricitem response theory. Applied Psychological Measurement 25, 3(2001), 258–272.
[15] Mohammad Khajah, Rowan Wing, Robert Lindsey, and MichaelMozer. 2014. Integrating latent-factor and knowledge-tracingmodels to predict individual differences in learning. In EducationalData Mining 2014.
[16] Yehuda Koren, Robert Bell, and Chris Volinsky. 2009. Matrixfactorization techniques for recommender systems. Computer 42,8 (2009).
[18] Jingchen Liu, Gongjun Xu, and Zhiliang Ying. 2012. Data-drivenlearning of Q-matrix. Applied psychological measurement 36, 7(2012), 548–564.
[19] Qi Liu, Yong Ge, Zhongmou Li, Enhong Chen, and Hui Xiong.2011. Personalized travel package recommendation. In Data Min-ing (ICDM), 2011 IEEE 11th International Conference on.IEEE, 407–416.
[20] Zachary A Pardos and Neil T Heffernan. 2011. KT-IDEM: intro-ducing item difficulty to the knowledge tracing model. In Inter-national Conference on User Modeling, Adaptation, and Per-sonalization. Springer, 243–254.
[21] Philip I Pavlik Jr, Hao Cen, and Kenneth R Koedinger. 2009.Performance Factors Analysis–A New Alternative to KnowledgeTracing. Online Submission (2009).
[22] Chris Piech, Jonathan Bassen, Jonathan Huang, Surya Ganguli,Mehran Sahami, Leonidas J Guibas, and Jascha Sohl-Dickstein.
2015. Deep knowledge tracing. In Advances in Neural InformationProcessing Systems. 505–513.
[23] Steffen Rendle, Christoph Freudenthaler, Zeno Gantner, and LarsSchmidt-Thieme. 2009. BPR: Bayesian personalized ranking fromimplicit feedback. In Proceedings of the twenty-fifth conferenceon uncertainty in artificial intelligence. AUAI Press, 452–461.
[24] Ruslan Salakhutdinov and Andriy Mnih. 2007. ProbabilisticMatrix Factorization.. In Nips, Vol. 1. 2–1.
[25] Jiliang Tang, Huiji Gao, Xia Hu, and Huan Liu. 2013. Exploitinghomophily effect for trust prediction. In Proceedings of the sixthACM international conference on Web search and data mining.ACM, 53–62.
[26] Nguyen Thai-Nghe, Lucas Drumond, Artus Krohn-Grimberghe,and Lars Schmidt-Thieme. 2010. Recommender system for pre-dicting student performance. Procedia Computer Science 1, 2(2010), 2811–2819.
[27] Nguyen Thai-Nghe, Tomas Horvath, and Lars Schmidt-Thieme.2010. Factorization models for forecasting student performance.In Educational Data Mining 2011.
[28] Heinz Von Foerster. 2007. Understanding understanding: Essayson cybernetics and cognition. Springer Science & Business Media.
[29] Xiaojing Wang, James O Berger, Donald S Burdick, et al. 2013.Bayesian analysis of dynamic item response models in educationaltesting. The Annals of Applied Statistics 7, 1 (2013), 126–153.
[30] Le Wu, Yong Ge, Qi Liu, Enhong Chen, Richang Hong, JunpingDu, and Meng Wang. 2017. Modeling the Evolution of UsersPreferences and Social Links in Social Networking Services. IEEETransactions on Knowledge and Data Engineering 29, 6 (2017),1240–1253.
[31] Runze Wu, Guandong Xu, Enhong Chen, Qi Liu, and Wan Ng.2017. Knowledge or Gaming?: Cognitive Modelling Based onMultiple-Attempt Response. In Proceedings of the 26th Interna-tional Conference on World Wide Web Companion. Internation-al World Wide Web Conferences Steering Committee, 321–329.
[32] Run-ze Wu, Qi Liu, Yuping Liu, Enhong Chen, Yu Su, ZhigangChen, and Guoping Hu. 2015. Cognitive Modelling for PredictingExaminee Performance.. In IJCAI. 1017–1024.
[33] Liang Xiong, Xi Chen, Tzu-Kuo Huang, Jeff Schneider, andJaime G Carbonell. 2010. Temporal collaborative filtering withbayesian probabilistic tensor factorization. In Proceedings of the2010 SIAM International Conference on Data Mining. SIAM,211–222.
[34] Michael V Yudelson, Kenneth R Koedinger, and Geoffrey J Gor-don. 2013. Individualized bayesian knowledge tracing models. InInternational Conference on Artificial Intelligence in Education.Springer, 171–180.
[35] Jiani Zhang, Xingjian Shi, Irwin King, and Dit-Yan Yeung. 2017.Dynamic Key-Value Memory Networks for Knowledge Tracing.In Proceedings of the 26th International Conference on WorldWide Web. International World Wide Web Conferences SteeringCommittee, 765–774.
Session 5B: Application Driven Mining CIKM’17, November 6-10, 2017, Singapore