54
1

1

Tracking Sound and Vibration Levels Using RFID
Dr. Ravi N. Margasahayam
Safety and Mission Assurance Engineer
NASA Kennedy Space Center
Florida, USA 2

Active RFID Application Highlights
• Goal: Record launch-induced Sound and Vibration
• Existing: Extensive Wired systems/ no Wireless
• Microstrain: Embedded sensors showed promise
• RFID type: Active - signals over extended range
• Wireless : Monitors large area/complex situations
• Issues: RFI affecting People, Systems, Mission
• Deployment: Battery, Line-of-Sight, Large Data
• Environmental: Weather, Power, Far-field
• Inception to data: 3-6 months; Shuttle launch
• Phase II: Near-field data, High Sample Rate
3
NASA
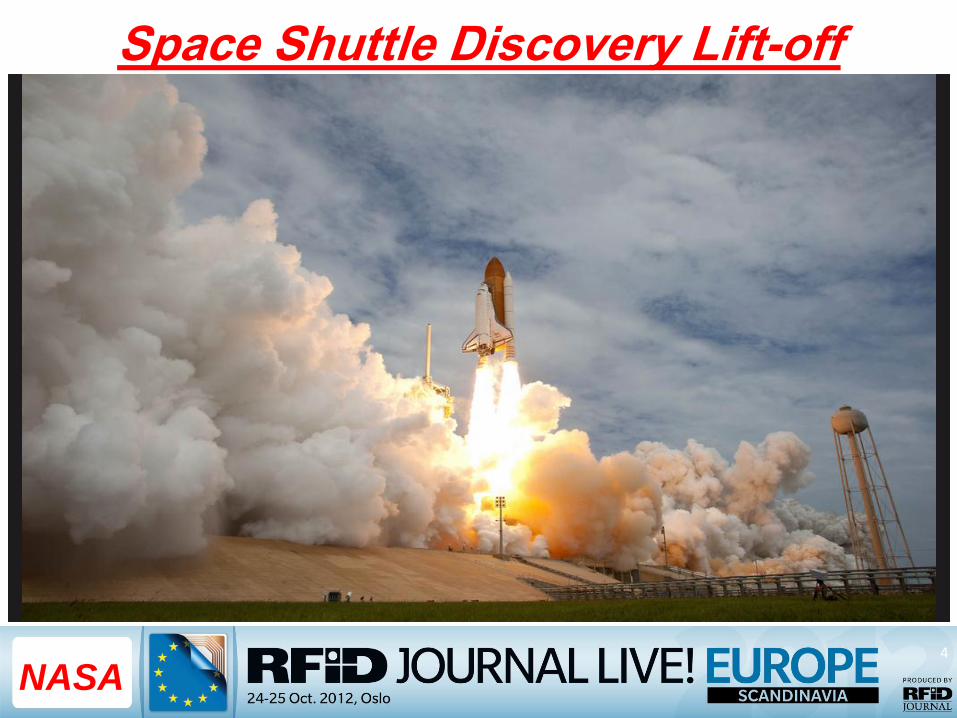
Space Shuttle Discovery Lift-off
•
4
NASA

Why measure Rocket Noise?
• KSC’s role as a premier rocket launch site, dictates reliability of ground equipment and structures
• Structural vibration is a consequence of launch-induced acoustics, both air- and structure-borne
• Launch of Shuttle generates in excess of 188 decibels, largest man-made continuous sound
• Sound affects Astronauts, payload, wildlife, community, and helps define explosive blast zones
• Resonance primarily attributable to the generated sound; study of sound and vibration is vital to structural design, safety and mission assurance
• Sound or unwanted Noise - leads to Structural Vibration, which results in partial or full Resonance
5 NASA

Natural Frequencies & Modes
•
6
NASA

Structures : Natural Frequencies
•
7
NASA
Eyeball, Intraocular Structure (20-90 Hz) Head (axial mode) (20-30 Hz) Shoulder Girdle (4-5 Hz) Chest wall (50-100 Hz) Arm (5-10 Hz) Hand (30-50 Hz) Abdominal Mass (4-8 Hz) Spinal column (axial mode) (10-12 Hz) Abdominal mass mode (around 5 Hz) Space Shuttle Astronauts – 3-4 G’s

Astronauts: Natural Frequencies
•
8
NASA
Eyeball, Intraocular Structure (20-90 Hz) Head (axial mode) (20-30 Hz) Shoulder Girdle (4-5 Hz) Chest wall (50-100 Hz) Arm (5-10 Hz) Hand (30-50 Hz) Abdominal Mass (4-8 Hz) Spinal column (axial mode) (10-12 Hz) Abdominal mass mode (around 5 Hz) Space Shuttle Astronauts – 3-4 G’s

Resonance: Due To High Pitch Noise
•
9
NASA

Resonance: Due to Gear Vibration
•
10
NASA

Resonance: Caused By Wind Loads
•
11
NASA

Resonance: Due to Ocean Waves
•
12
NASA

Noise: Deforms Rocket Structures
•
13
NASA
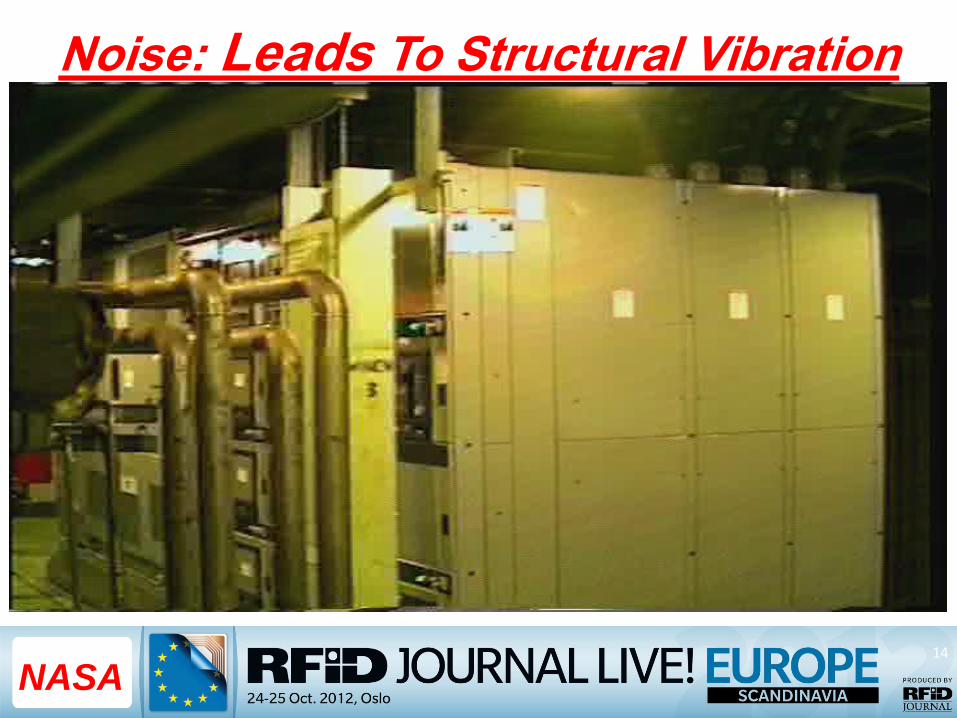
Noise: Leads To Structural Vibration
•
14
NASA

Noise: Affects KSC Wild Life
•
15
NASA

Noise +Vibration =Vibroacoustics
16
NASA
Input Forces
+ System
Response (Mobility)
= Vibration
Forces caused by Imbalance Shock Friction Noise
Structural Parameters: Mass Stiffness Damping
Vibration Parameters: Acceleration Velocity Displacement
Frequency
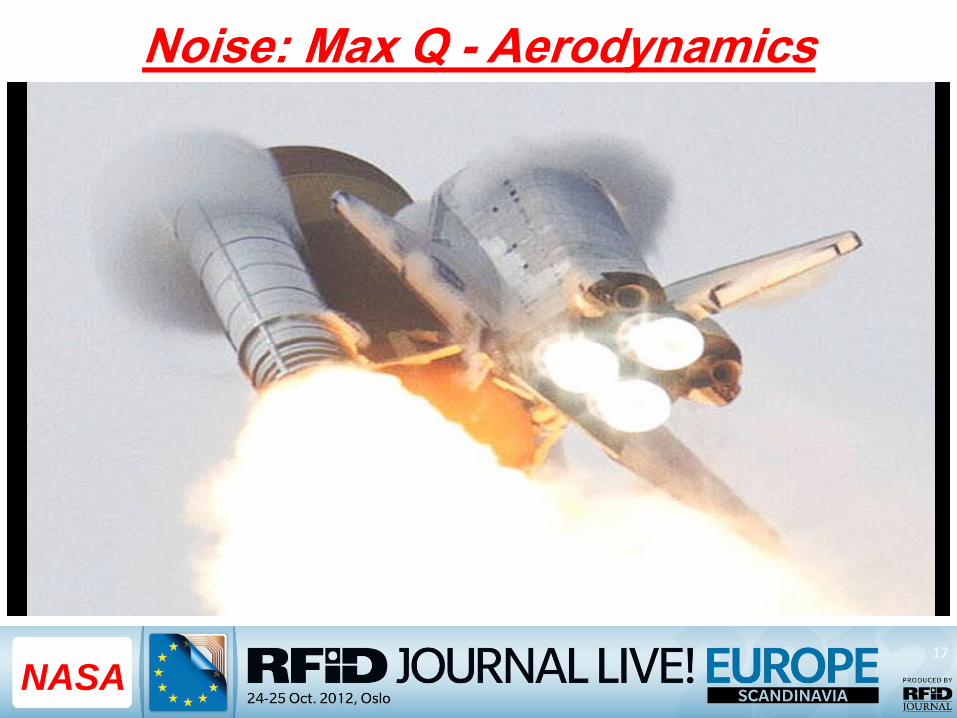
Noise: Max Q - Aerodynamics
•
17
NASA

Noise: Measurement Challenges
• Sensors affected by noise levels – over 180 dB
• Excessive Vibration – over 100 g’s for 6-8 seconds
• Thermal environment in excess of 4000 degree F and plume heat rate of over 5000 BTU/Ft2-sec
• Total Shuttle Thrust - 6.5 Million pounds
• Daily environment - moist salt air, UV radiation
• System Dynamics – sensors must be designed to withstand resonant effects
• Near-field Sensors typically cooled, shielded, wires have thermal tape, terminated inside Pad
• Traditionally – sensors – are limited by cabling, cannot measure all locations, cannot instrument critical locations due to access issues
18
NASA

RF Controls: Manned Space Flight
• The Radio Frequency (RF) environment is managed to avoid RFI issues that could harm People, Systems or the expensive and critical Mission.
• RF emitter evaluation is based on device frequency, power and distance relative to RF sensitive systems –pyrotechnics, communications and control systems.
• Direct and harmonic frequencies as well as the potential to swamp the receive circuits of existing devices using a close frequency.
• NASA frequency manager reviews frequency utilization for license requirements from the FCC
19
NASA

900 MHz: Wing Leading Edge
20
NASA

21
NASA
900 MHz: Orbiter Stinger Issue
NASA

2400 MHz: Holding Pond Water Level
22
NASA

Microstrain – Active RFID Sensors • Founded in 1987 in Vermont ; wireless sensors since 1996
• Has COTS systems for strain, pressure, load, displacement,
acceleration, tilt, etc
• Developing the next generation of cutting-edge wireless systems
for Navy and Army helicopters and fixed wing aircraft
• Used in automotive, aerospace, industrial manufacturing,
semiconductor, alternative energy, environmental monitoring, oil
& gas, power generation, civil structures and defense markets.
• Customers: Bell Helicopter, Sikorsky, Boeing, Caterpillar,
Motorola, Johnson & Johnson, general Electric, Pratt & Whitney,
Rolls Royce, Lockheed Martin, Ford, Intel, IBM, NASA, US Navy,
US Army
• These are Active RFID sensors, with internal battery power and ability to transmit data during rocket launches
23
NASA

What is a Wireless Node?
24
NASA
low power,
microcontroller
Radio Frequency
(RF) transceiver
Flash EEPROM for
sensor logging
12, 16 or 24 bit
A/D converter
Lithium thionyl
chloride battery
Sensor Inputs
Sensor signal
conditioning
multiplexer, PG
instrumentation
amplifier

25
NASA
Microstrain -Wireless System
Sensor Nodes
Base Station
Node Commander - GUI
Cloud Computing

Deployed Wireless Technology
• 2.4 GHz active RFID tags with built-in sensors and signal conditioning for external sensors
• Easy to configure/deploy using Node Commander GUI
• Scalable network support hundreds of synchronized wireless nodes
• Comprised of G-Link accelerometer nodes, a SG-Link strain node, a Wireless Sensor Data Aggregator base Station(WSDA-Base), and SensorCloud, a web data management platform
• SensorCloud -Tool to remotely visualize and manage data and to isolate and interpret launch event data - key for test analysis correlation.
• Qualifies and meets requirements for use at NASA
26
NASA

Active RFID: Health Monitoring
27
NASA
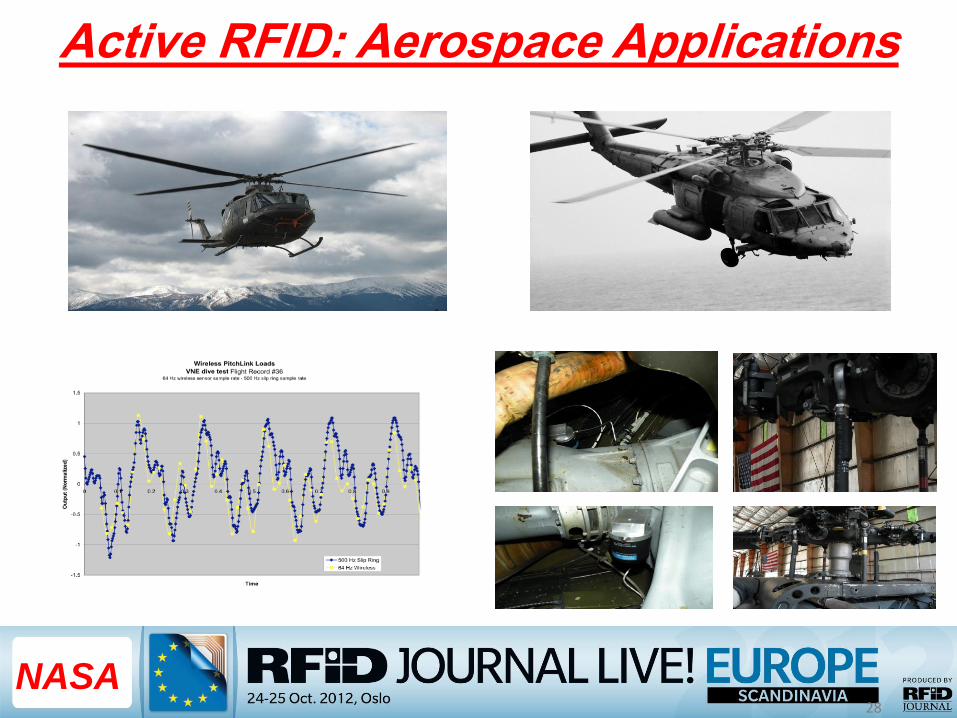
Active RFID: Aerospace Applications
28
NASA

Plume-induced Vibroacoustics
29
NASA
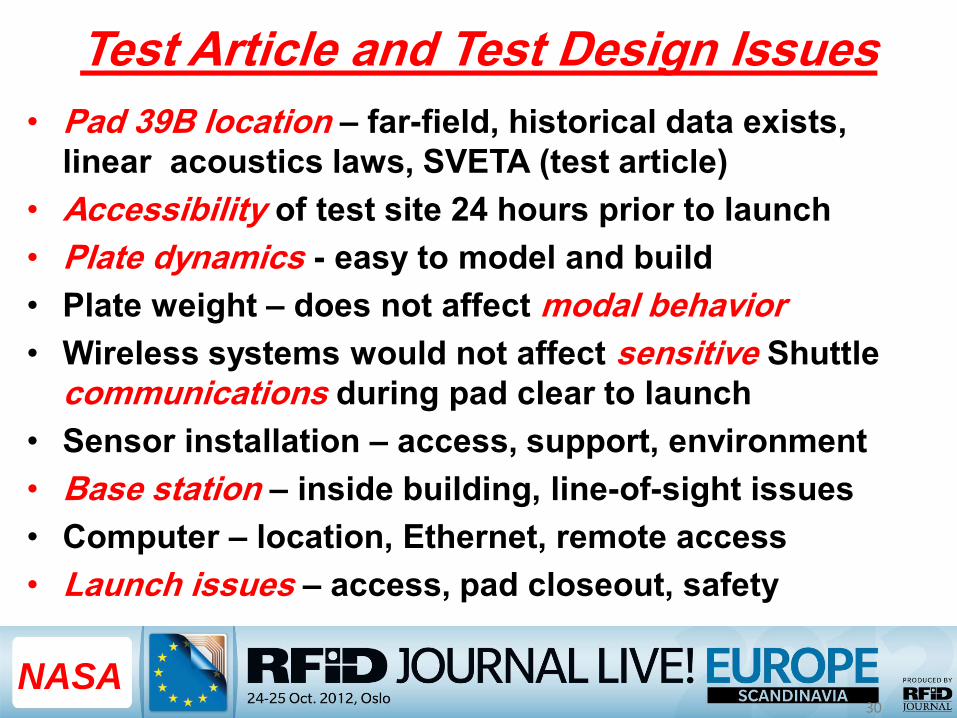
Test Article and Test Design Issues
• Pad 39B location – far-field, historical data exists,
linear acoustics laws, SVETA (test article)
• Accessibility of test site 24 hours prior to launch
• Plate dynamics - easy to model and build
• Plate weight – does not affect modal behavior
• Wireless systems would not affect sensitive Shuttle
communications during pad clear to launch
• Sensor installation – access, support, environment
• Base station – inside building, line-of-sight issues
• Computer – location, Ethernet, remote access
• Launch issues – access, pad closeout, safety
30
NASA

FE, Modal for Launch Validation
•
31
NASA

32
NASA
KSC
SVETA: Laboratory Calibration

33
NASA
SVETA: Pad 39B Camera Mount

34
NASA
Space Shuttles on Pads 39 A & B

35
NASA
SVETA on Pad B (Launch from A)

SVETA– Line of Sight - WSDA
36
NASA

SVETA- Field Setup -WSDA
37
NASA

Endeavour Final and Historic Lift-off
38
NASA

Space Shuttle Lift-off Sequence
39
NASA

Test Analysis Correlation Method
• TOA, Shape, Frequency, Magnitude (PSI Load)
• Time of Arrival (TOA) – tells us when the Rocket lifted off at Pad 39A; how and when SVETA experiences the sound load (magnitude and speed of sound)
• Shape – Acoustics and Vibration signature be similar in shape (less in magnitude – distance effect)
• Frequency– Modal (Static test), FE computer Analysis, Shuttle Lift-off – should be same from all 3 methods
• Magnitude of Vibration – actually measured g’s and then backtracked PSI and dB load (it would have been easier to measure acoustics)
• Pressure load (PSI) is converted to dB and compared with historical data from NASA Master Planning
40
NASA

Shuttle Acoustic and Vibration
NASA
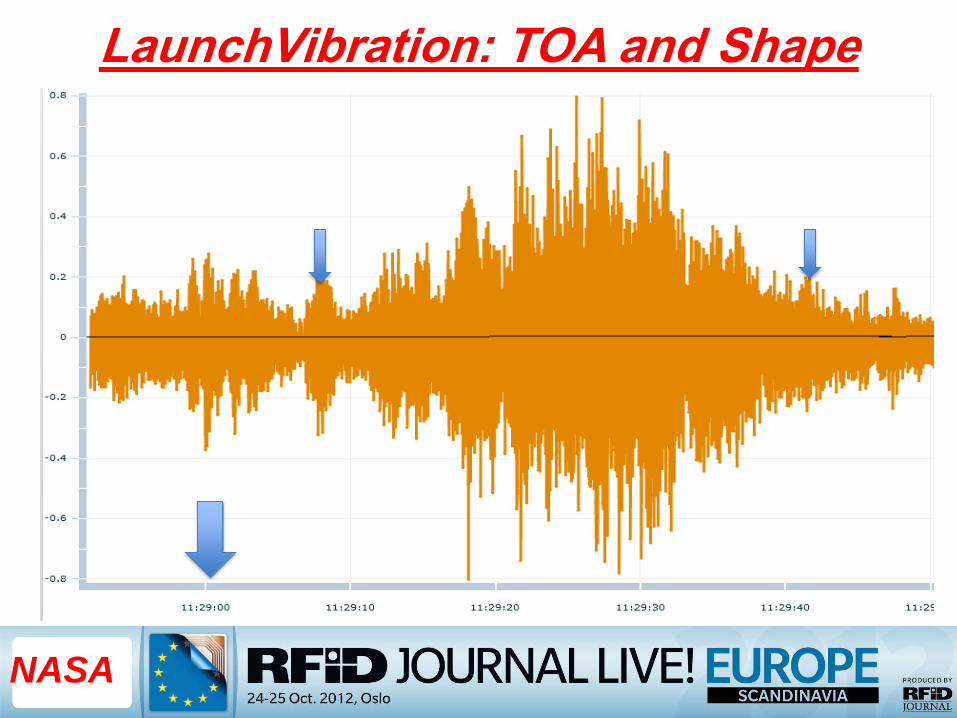
LaunchVibration: TOA and Shape
NASA

SVETA :Modal Test Frequencies
NASA
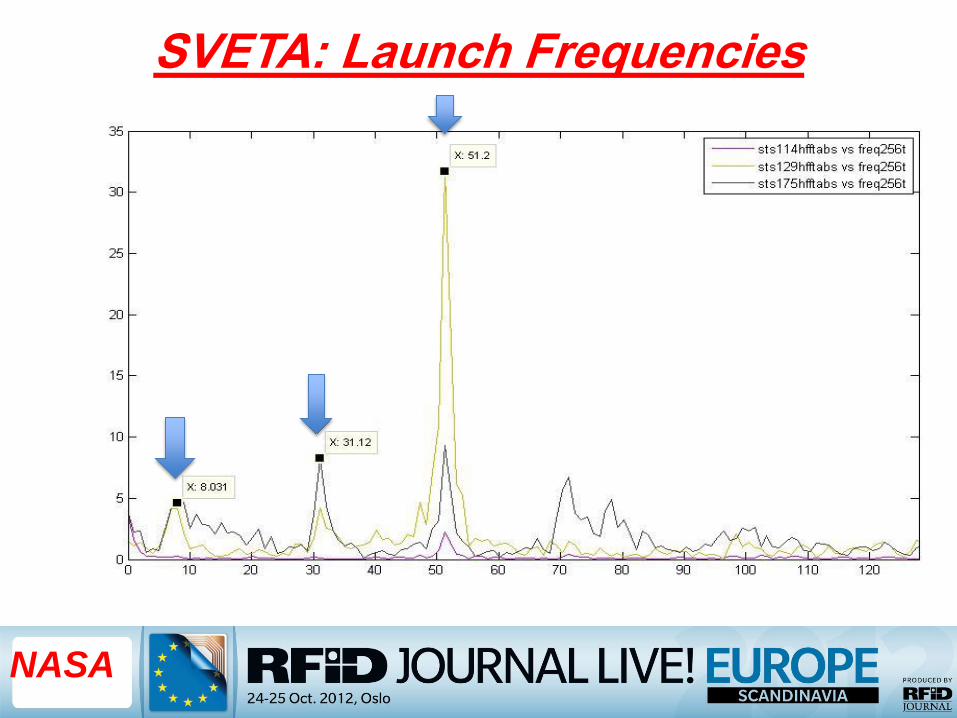
SVETA: Launch Frequencies
NASA
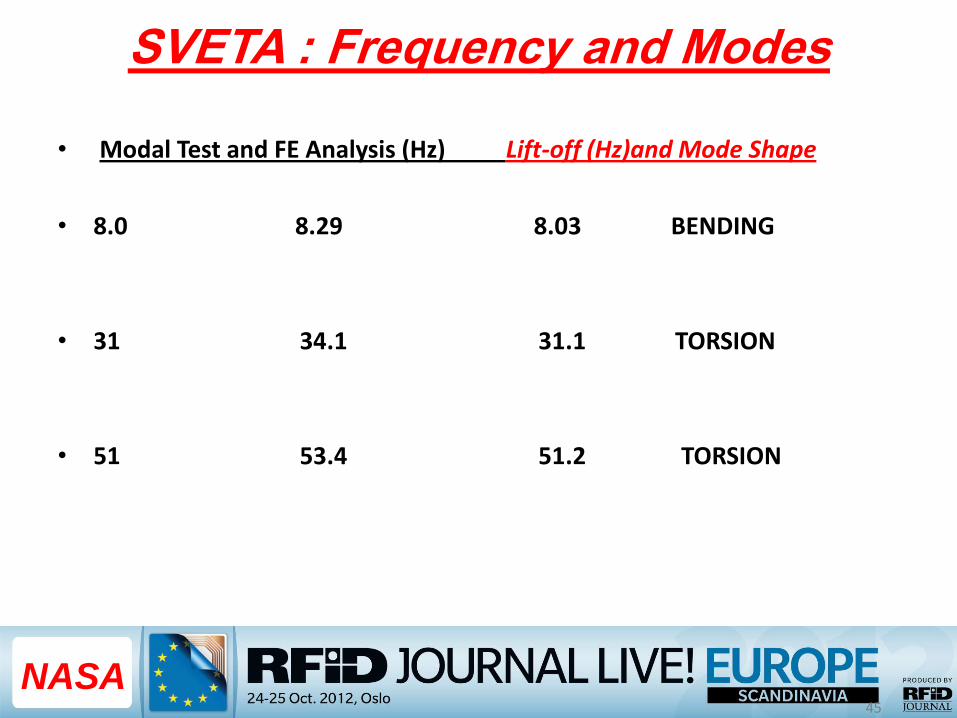
SVETA : Frequency and Modes
• Modal Test and FE Analysis (Hz) Lift-off (Hz)and Mode Shape
• 8.0 8.29 8.03 BENDING
• 31 34.1 31.1 TORSION
• 51 53.4 51.2 TORSION
45
NASA

SVETA : Lift-off G’s and dB Levels
• G loads on lift-off at SVETA Equivalent PSI and dB level
• 0.5 g’s ………………………………….. 0.0075 psi (128.2 dB)
• 0.6 g’s ………………………………….. 0.0090 psi (129.5 dB)
• 0.7 g’s ………………………………….. 0.0108 psi (130.8 dB)
• 0.8 g’s ………………………………….. 0.0120 psi (132.2 dB)
46
NASA

Shuttle Acoustics- Analysis & Test
NASA

Acoustic Levels – Historical Data
NASA

Future Wireless Application- Hypers
49
NASA
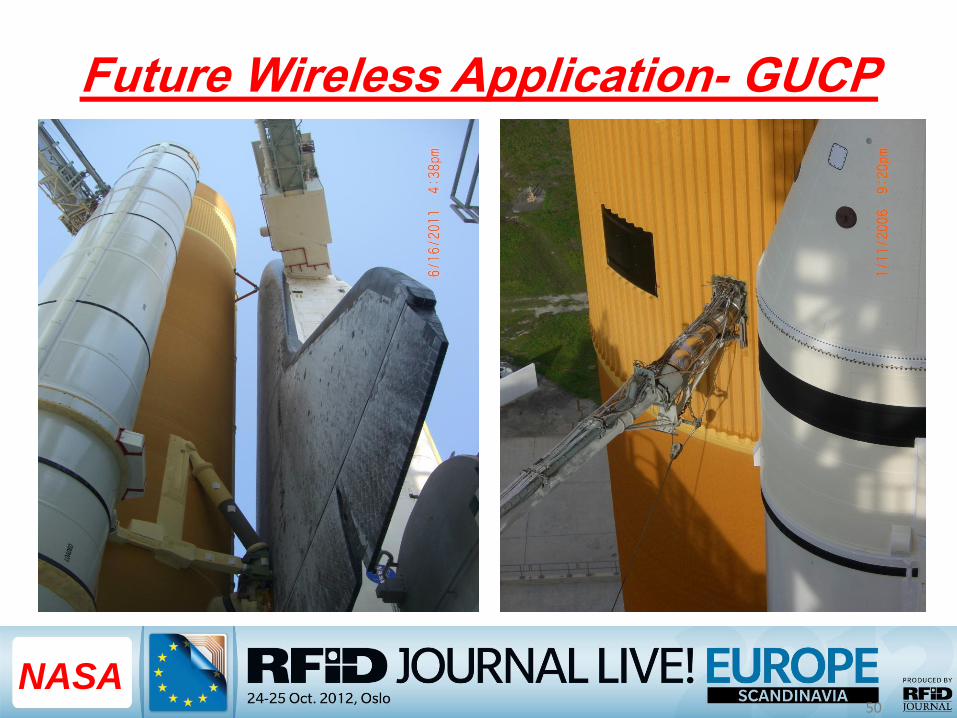
Future Wireless Application- GUCP
50
NASA

Future Wireless Application - COPV
NASA

Conclusions & Observations
• 2.4 GHz RFID tags with built-in sensors from Microstrain were used to measure launch vibrations – First use of ACTIVE RFID in the Space Shuttle program and rocket launches
• Verified time of arrival of rocket noise data and Vibroacoustics implications of a rocket launch
• Launch Vibration data is used to assess loads/stresses imposed by rocket noise on structures/useful life
• Test data is vital to study safety and operational readiness and to predict impending failures of GSE
• Helps monitor pressurized, hazardous systems operating at high temperatures with access issues
• Developed a tool to evaluate Safety, Reliability, and Maintainability of structures via condition/health monitoring
52
NASA

Time for Questions?
53
NASA

54


