December 2017
TRACKING TALENT: Newly Certified in Rhode Island A report on the individuals certified for the first time during the 2014-15, 2015-16 and 2016-17 school years.
What is this report about?
This report paints an annual picture of the individuals entering the education profession for the first time. The report
focuses on the influx of newly certified individuals by sharing data that shows the roles these educators may play in RI
schools. Data is broken down by specific certificate areas within the report. Certificate areas determine the student
populations and content areas in which an educator may serve.
What data is included?
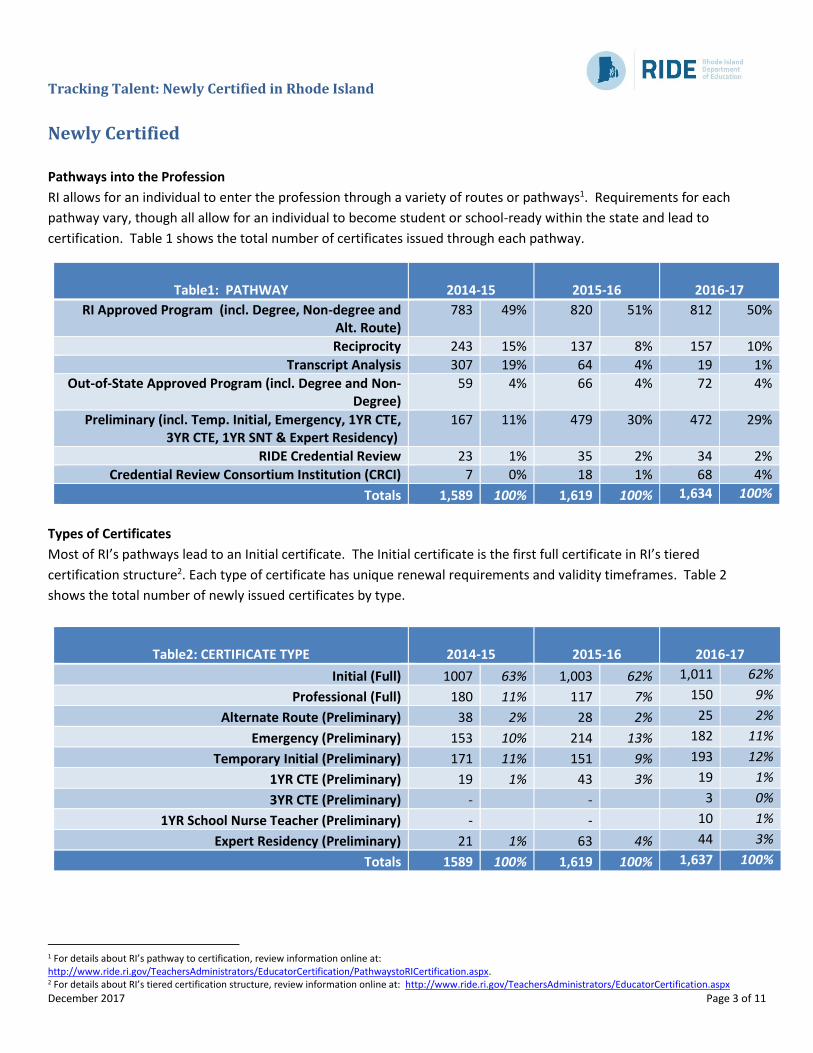
The report includes information about pathways to certification, popular certificate areas, and the RI employment status
of those individuals newly certified in RI. Examples of individuals counted within this data include those who completed
a preparation program, held an out-of-state certificate, and/or completed coursework outlined by RIDE through
transcript analysis.
What should be done with this data?
The data within this report should be used by districts, educator preparation providers, and educators to better
understand patterns and trends within the state regarding the supply of educators ready for employment in RI schools.
By understanding the talent entering the profession alongside the needs of RI districts, future educators, hiring
managers, and educator preparation providers can more easily plan ahead to meet the needs of RI students. When
reviewing the information take note of whether or not the data point is representing certificates, individual people, or
positions. The discussion protocol on page 2 is designed to encourage a careful read and conversation about this data.
Tracking Talent: Newly Certified in Rhode Island
December 2017 Page 2 of 11
Discussion Protocol
This data should be used by districts, educator preparation providers, and educators to better understand patterns and trends
within the state regarding the supply of educators ready for employment in RI schools. Data should allow and facilitate reflection to
inform short and long-term planning and actions.
STEP 1: REVIEW THE REPORT. Read and mark up the text. Consider if there are other highlights that would add or if any
information is surprising to you. Analysis is intentionally limited.
STEP 2: MEET WITH A COLLEAGUE TO DISCUSS KEY QUESTIONS AND YOUR REACTION. Key questions are listed below
and should support inquiry, reflection, and action.
Did this information match your prior understanding of the newly certified educators in RI?
What highlights would you add?
What additional questions do you still have about this information?
How does this data impact your current work?
STEP 3: CREATE A PLAN ON HOW YOU MAY INCORPORATE THIS INFORMATION INTO YOUR WORK. Consider how this
information could improve your current hiring, training, or strategic planning. Incorporate appropriate information into your
actions.
STEP 4: PROVIDE FEEDBACK. Let RIDE know what was helpful within this data and what you want to learn more about. Email
the Office of Educator Quality at [email protected] with your reactions.
Tracking Talent: Newly Certified in Rhode Island
December 2017 Page 3 of 11
Newly Certified
Pathways into the Profession
RI allows for an individual to enter the profession through a variety of routes or pathways1. Requirements for each
pathway vary, though all allow for an individual to become student or school-ready within the state and lead to
certification. Table 1 shows the total number of certificates issued through each pathway.
Table1: PATHWAY 2014-15 2015-16
2016-17
RI Approved Program (incl. Degree, Non-degree and Alt. Route)
783 49% 820 51% 812 50%
Reciprocity 243 15% 137 8% 157 10%
Transcript Analysis 307 19% 64 4% 19 1%
Out-of-State Approved Program (incl. Degree and Non-Degree)
59 4% 66 4% 72 4%
Preliminary (incl. Temp. Initial, Emergency, 1YR CTE, 3YR CTE, 1YR SNT & Expert Residency)
167 11% 479 30% 472 29%
RIDE Credential Review 23 1% 35 2% 34 2%
Credential Review Consortium Institution (CRCI) 7 0% 18 1% 68 4%
Totals 1,589 100% 1,619 100% 1,634 100%
Types of Certificates
Most of RI’s pathways lead to an Initial certificate. The Initial certificate is the first full certificate in RI’s tiered
certification structure2. Each type of certificate has unique renewal requirements and validity timeframes. Table 2
shows the total number of newly issued certificates by type.
Table2: CERTIFICATE TYPE 2014-15 2015-16 2016-17
Initial (Full) 1007 63% 1,003 62% 1,011 62%
Professional (Full) 180 11% 117 7% 150 9%
Alternate Route (Preliminary) 38 2% 28 2% 25 2%
Emergency (Preliminary) 153 10% 214 13% 182 11%
Temporary Initial (Preliminary) 171 11% 151 9% 193 12%
1YR CTE (Preliminary) 19 1% 43 3% 19 1%
3YR CTE (Preliminary) - - 3 0%
1YR School Nurse Teacher (Preliminary) - - 10 1%
Expert Residency (Preliminary) 21 1% 63 4% 44 3%
Totals 1589 100% 1,619 100% 1,637 100%
1 For details about RI’s pathway to certification, review information online at: http://www.ride.ri.gov/TeachersAdministrators/EducatorCertification/PathwaystoRICertification.aspx. 2 For details about RI’s tiered certification structure, review information online at: http://www.ride.ri.gov/TeachersAdministrators/EducatorCertification.aspx
Tracking Talent: Newly Certified in Rhode Island
December 2017 Page 4 of 11
Educating in RI Each certificate allows for an educator to serve in a specific role (based on the area of their certificate(s)). The certificate
area outlines the content, student population, and grade range in which an educator may serve. Each area also has
specific and unique requirements for issuance.
Tables 3 through 10 drill down to the certificate area. Tables include the number of certificates issued to individuals, the
number of educators employed within 12 months, and a calculated percentage3. The numbers include all certificate
types listed in Table 2. Certificate areas with an asterisk denote dependent certificates. For that reason, educators may
seek independent certificates even though their employment requires only the dependent certificate.
Table 3: EARLY CHILDHOOD CERTIFICATE
AREAS (Grades PK-2)
New
ly C
erti
fied
in
20
14
-15
Emp
loye
d in
2
01
5-1
6
% E
mp
loye
d in
2
01
5-1
6
New
ly C
erti
fied
in
20
15
-16
Emp
loye
d in
2
01
6-1
7
% E
mp
loye
d in
2
01
6-1
7
New
ly C
erti
fied
in
20
16
-17
Emp
loye
d in
2
01
7-1
8
% E
mp
loye
d in
2
01
7-1
8
Early Childhood Bilingual And Dual Language Education Teacher *
1 0 0% 4 2 50% 1 1 100%
Early Childhood Bilingual And Dual Language Education Teacher *
0 0 0% 0 0 0% 1 0 0%
Early Childhood Bilingual And Dual Language Education Teacher *
3 3 100% 5 6 60% 1 1 100%
Early Childhood Education Teacher 136 17 13% 107 16 15% 105 7 7%
Early Childhood English As A Second Language Education Teacher*
5 1 20% 9 6 67% 17 1 6%
Early Childhood Special Education Teacher, Birth Through Grade 2*
26 12 46% 27 16 59% 14 2 14%
Total 171 33 19% 152 46 30% 139 12 9%
3 Data included regarding 2017-18 employment is as of November 2017.
Highlight from Tables 1 and 2:
RI approved programs account for one out every two certificates issues; one out every three certificates
are preliminary certificates.
The numbers of Preliminary CTE certificates have doubled and the numbers of Expert Residency
certificates have increased three-fold in the first two years under this review, but have dropped
somewhat in the third year.
Tracking Talent: Newly Certified in Rhode Island
December 2017 Page 5 of 11
Table 4: ELEMENTARY CERTIFICATE AREAS
(Grades 1-6) New
ly C
erti
fied
in
20
14
-15
Emp
loye
d in
2
01
5-1
6
% E
mp
loye
d in
2
01
5-1
6
New
ly C
erti
fied
in
20
15
-16
Emp
loye
d in
2
01
6-1
7
% E
mp
loye
d in
2
01
6-1
7
New
ly C
erti
fied
in
20
16
-17
Emp
loye
d in
2
01
7-1
8
% E
mp
loye
d in
2
01
7-1
8
Elementary Bilingual And Dual Language Education Teacher, Grades
1-6 – English* NA NA NA 5 4 0% 2 2 100%
Elementary Bilingual And Dual Language Education Teacher *
0 0 0% 3 2 67% 1 0 0%
Elementary Bilingual And Dual Language Education Teacher *
5 3 60% 9 7 78% 7 3 43%
Elementary Education Teacher 287 56 20% 296 46 16% 339 39 12%
Elementary English As A Second Language Education Teacher*
35 13 37% 37 25 68% 68 18 26%
Elementary Grades Special Education Teacher*
74 12 16% 112 19 17% 121 8 6%
401 84 21% 462 103 22% 538 70 13%
Highlight from Tables 3 and 4:
The employment rate across all the Early Childhood certificate areas has dropped sharply from 30% to
9%. The main contributor to the drop is the employment rates for Early Childhood English as a Second
Language Education Teacher and Early Childhood Special Education Teacher certificates.
Employment percentages for Elementary Education certificates have also dropped. The certificate areas
contributing to this drop are English as a Second Language Education Teacher and Special Education
Teacher. Bilingual and Dual language teachers also contributing to the downward slide.
Tracking Talent: Newly Certified in Rhode Island
December 2017 Page 6 of 11
Table 5: MIDDLE GRADES CERTIFICATE AREAS
(Grades 5-8) New
ly C
erti
fied
in
20
14
-15
Emp
loye
d in
2
01
5-1
6
% E
mp
loye
d in
2
01
5-1
6
New
ly C
erti
fied
in
20
15
-16
Emp
loye
d in
2
01
6-1
7
% E
mp
loye
d in
2
01
6-1
7
New
ly C
erti
fied
in
20
16
-17
Emp
loye
d in
2
01
7-1
8
% E
mp
loye
d in
2
01
7-1
8
Middle Grades English As A Second Language Education Teacher*
12 6 50% 20 13 65%
11 5 45%
Middle Grades English Teacher 4 0 0% 2 2 100% 9 2 22%
Middle Grades English Teacher - Elementary Extension*
7 2 29% 6 0 0%
8 0 0%
Middle Grades English Teacher - Secondary Extension*
22 7 32% 22 4 18%
8 2 25%
Middle Grades Mathematics Teacher 5 2 40% 5 2 40% 7 0 0%
Middle Grades Mathematics Teacher - Elementary Extension*
8 5 63% 23 12 52%
19 5 26%
Middle Grades Mathematics Teacher - Secondary Extension*
6 5 83% 6 3 50%
15 3 20%
Middle Grades Science Teacher 5 0 0% 5 2 40% 3 1 33%
Middle Grades Science Teacher - Elementary Extension*
6 4 67% 3 2 67%
5 2 40%
Middle Grades Science Teacher - Secondary Extension*
7 3 43% 14 7 50%
12 3 25%
Middle Grades Social Studies Teacher 3 1 33% 2 0 0% 6 1 17%
Middle Grades Social Studies Teacher - Elementary Extension*
2 0 0% 7 3 43%
3 0 0%
Middle Grades Social Studies Teacher - Secondary Extension*
15 3 20% 16 2 13%
18 2 11%
Middle Grades Special Education Teacher*
NA NA NA 1 0 0%
6 0 0%
Total 102 38 37% 132 52 39% 130 26 20%
Highlight from Table 5:
After a stellar year of employment levels in 2016-17, the subject areas of Mathematics and Science show a
significant decline in employment levels.
Tracking Talent: Newly Certified in Rhode Island
December 2017 Page 7 of 11
Table 6: SECONDARY GRADES CERTIFICATE
AREAS (Grades 7-12) N
ewly
Cer
tifi
ed
in 2
01
4-1
5
Emp
loye
d in
2
01
5-1
6
% E
mp
loye
d in
2
01
5-1
6
New
ly C
erti
fied
in
20
15
-16
Emp
loye
d in
2
01
6-1
7
% E
mp
loye
d in
2
01
6-1
7
New
ly C
erti
fied
in
20
16
-17
Emp
loye
d in
2
01
7-1
8
% E
mp
loye
d in
2
01
7-1
8
Secondary Grades Agriculture Teacher
1 1 100% 0 0 0% 1 1 100%
Secondary Grades Biology Teacher 35 15 43% 36 4 11% 35 10 29%
Secondary Grades Business Education Teacher
7 1 14% 2 0 0% 2 0 0%
Secondary Grades Chemistry Teacher 19 5 26% 15 4 27% 11 3 27%
Secondary Grades English As A Second Language Teacher*
12 7 58% 23 10 43% 23 7 30%
Secondary Grades English Teacher 80 20 25% 95 23 24% 75 17 23%
Secondary Grades General Science Teacher
25 12 48% 34 8 24% 17 3 18%
Secondary Grades Mathematics Teacher
42 17 40% 47 20 43% 38 16 42%
Secondary Grades Physics Teacher 9 2 22% 8 3 38% 6 2 33%
Secondary Grades Social Studies Teacher
63 14 22% 63 10 16% 52 5 10%
Secondary Grades Special Education Teacher*
15 12 80% 30 11 37% 23 12 52%
308 106 34% 353 93 26% 283 76 27%
Highlight from Table 6:
Although employment percentages are trending in the downward direction, the certificate areas of Special
Education, Mathematics, Physics, and English as a Second Language have the best employment rates.
Tracking Talent: Newly Certified in Rhode Island
December 2017 Page 8 of 11
Table 7: SECONDARY GRADES CTE
CERTIFICATE AREAS (Grades 7-12) N
ewly
Cer
tifi
ed
in 2
01
4-1
5
Emp
loye
d in
2
01
5-1
6
% E
mp
loye
d in
2
01
5-1
6
New
ly C
erti
fied
in
20
15
-16
Emp
loye
d in
2
01
6-1
7
% E
mp
loye
d in
2
01
6-1
7
New
ly C
erti
fied
in
20
16
-17
Emp
loye
d in
2
01
7-1
8
% E
mp
loye
d in
2
01
7-1
8
Agriculture 0 0 0% 1 1 100% 0 0 0%
Air Conditioning And Refrigeration 1 1 100% 3 1 33% 2 0 0%
Audiovisual Communications Technologies/Technicians
1 1 100% 0 0 0% 0 0 0%
Auto Body Repair 0 0 0% 2 1 50% 0 0 0%
Auto Mechanics 3 1 33% 2 1 50% 0 0 0%
Biotechnology 0 0 0% 1 1 100% 0 0 0%
Building Construction Trades 0 0 0% 1 1 100% 0 0 0%
Carpentry 0 0 0% 3 2 67% 0 0 0%
Computer Technology 1 1 100% 2 2 100% 3 1 33%
Cosmetology 1 0 0% 4 1 25% 1 0 0%
Criminal Justice 0 0 0 0 3 0 0%
Drafting Occupations 0 0 0% 2 0 0% 0 0 0%
Electrical Installation 1 1 100% 0 0 0% 2 2 100%
Electronics Technology 0 0 0% 2 2 100% 0 0 0%
Graphic Arts 2 2 100% 3 3 100% 1 1 100%
Health Occupations 1 1 100% 4 3 75% 2 1 50%
Hotel/Hospitality Management 0 0 0 0 1 0 0%
Marine Maintenance / Ship Technology / Technician
1 1 100% 0 0 0% 2 2 100%
Marketing 1 1 100% 0 0 0% 0 0 0%
Plumbing And Heating 0 0 0% 2 0 0% 2 2 100%
Quantity Food Preparation 1 1 100% 3 1 33% 5 2 40%
Web Page, Digital/Multimedia and Information Resources Design
0 0 0% 1 0 0% 0 0 0%
Welding 0 0 0% 1 1 100% 0 0 0%
Total 14 11 79% 37 21 57% 24 11 46%
Tracking Talent: Newly Certified in Rhode Island
December 2017 Page 9 of 11
Table 8: ALL GRADES CERTIFICATE AREAS
(Grades PK-12) New
ly C
erti
fied
in
20
14
-15
Emp
loye
d in
2
01
5-1
6
% E
mp
loye
d in
2
01
5-1
6
New
ly C
erti
fied
in
20
15
-16
Emp
loye
d in
2
01
6-1
7
% E
mp
loye
d in
2
01
6-1
7
New
ly C
erti
fied
in
20
16
-17
Emp
loye
d in
2
01
7-1
8
% E
mp
loye
d in
2
01
7-1
8
All Grades Adapted Physical Education Teacher
9 1 11% 23 1 4% 28 0 0%
All Grades Art Teacher 19 8 42% 27 9 33% 24 9 38%
All Grades Dance Teacher 0 0 0% 0 0 0% 2 2 100%
All Grades English As A Second Language Education Teacher*
0 0 0% 2 2 100% 5 1 20%
All Grades Family And Consumer Science Teacher
8 1 13% 0 0 0% 0 0 0%
All Grades Health Teacher 1 0 0% 2 1 50% 27 2 7%
All Grades Library Media Teacher 22 3 14% 28 5 18% 17 10 59%
All Grades Music Teacher 16 10 63% 10 7 70% 26 7 27%
All Grades Physical Education Teacher 25 12 48% 24 10 42% 34 4 12%
All Grades School Nurse Teacher 23 6 26% 32 12 38% 27 15 56%
All Grades Special Education - Deaf And Hard Of Hearing Teacher*
22 3 14% 17 1 6% 1 1 100%
All Grades Special Education - Severe Intellectual Disability Teacher*
19 15 79% 28 17 61% 26 3 12%
All Grades Special Education - Visually Impaired Teacher*
1 0 0% 2 1 50% 0 0 0%
All Grades Technology Education Teacher
43 4 9% 20 9 45% 7 5 71%
All Grades Theatre Teacher 1 0 0% 0 0 0% 5 1 20%
All Grades World Language Teacher - Chinese
5 4 80% 9 5 56% 7 1 14%
All Grades World Language Teacher - French
2 0 0% 3 2 67% 8 2 25%
All Grades World Language Teacher - German
3 2 67% 4 4 100% 1 0 0%
All Grades World Language Teacher - Italian
7 3 43% 7 3 43% 5 1 20%
All Grades World Language Teacher - Latin
3 0 0% 0 0 0% 1 0 0%
Highlight from Table 7:
Career and Technical Education (CTE) certificate holders have the best employment rates compared to
any other certificate area groups. However, the number of certificates issued as well as employment
rates are lower than last year.
Tracking Talent: Newly Certified in Rhode Island
December 2017 Page 10 of 11
Table 8: ALL GRADES CERTIFICATE AREAS
(Grades PK-12) New
ly C
erti
fied
in
20
14
-15
Emp
loye
d in
2
01
5-1
6
% E
mp
loye
d in
2
01
5-1
6
New
ly C
erti
fied
in
20
15
-16
Emp
loye
d in
2
01
6-1
7
% E
mp
loye
d in
2
01
6-1
7
New
ly C
erti
fied
in
20
16
-17
Emp
loye
d in
2
01
7-1
8
% E
mp
loye
d in
2
01
7-1
8
All Grades World Language Teacher - Portuguese
4 2 50% 0 0 0% 1 0 0%
All Grades World Language Teacher - Spanish
3 1 33% 3 1 33% 28 7 25%
Total 235 66 32% 241 80 42% 280 71 25%
Highlight from Table 8:
The All Grades Technology Education certificate has the best employment rate among the All Grades
certificates. Library Media and School Nurse Teacher certificates also posted strong employment
numbers.
Tracking Talent: Newly Certified in Rhode Island
December 2017 Page 11 of 11
Table 9:
SUPPORT PROFESSIONAL CERTIFICATE AREAS N
ewly
Cer
tifi
ed
in 2
01
4-1
5
Emp
loye
d in
2
01
5-1
6
% E
mp
loye
d in
2
01
5-1
6
New
ly C
erti
fied
in
20
15
-16
Emp
loye
d in
2
01
6-1
7
% E
mp
loye
d in
2
01
6-1
7
New
ly C
erti
fied
in
20
16
-17
Emp
loye
d in
2
01
7-1
8
% E
mp
loye
d in
2
01
7-1
8
ESL Specialist/Consultant, Grades PK-12*
12 3 50% 6 3 50% 1 0 0%
Reading Specialist/Consultant* 32 10 31% 18 7 39% 22 6 27%
School Counselor 32 5 16% 34 1 3% 26 2 8%
School Psychologist 13 4 31% 14 5 36% 20 6 30%
School Social Worker 36 20 56% 39 16 41% 45 14 31%
Speech And Language Pathologist 26 13 50% 25 13 52% 22 5 23%
Total 151 55 36% 136 45 33% 136 33 24%
Table 10:
ADMINISTRATIVE CERTIFICATE AREAS N
ewly
Cer
tifi
ed
in 2
01
4-1
5
Emp
loye
d in
2
01
5-1
6
% E
mp
loye
d in
2
01
5-1
6
New
ly C
erti
fied
in
20
15
-16
Emp
loye
d in
2
01
6-1
7
% E
mp
loye
d in
2
01
6-1
7
New
ly C
erti
fied
in
20
16
-17
Emp
loye
d in
2
01
7-1
8
% E
mp
loye
d in
2
01
7-1
8
Administrator Of Curriculum And Instruction
8 0 0% 0 0 0% 0 0 0%
Administrator Of Special Education 34 8 24% 0 0 0% 0 0 0%
Building Level Administrator PK-12 70 22 31% 60 24 40% 79 13 17%
District Level Administrator - Special Education*
7 0 0% 8 1 13% 8 2 25%
District Level Administrator- Curriculum, Instruction And
Assessment* 9 1 11% 6 3 50% 4 1 25%
School Business Administrator 16 10 63% 9 7 78% 5 2 40%
Superintendent Of Schools 17 0 0% 14 1 7% 11 3 27%
Total 161 41 25% 97 36 37% 107 21 20%
Highlight from Tables 9 and 10:
School Psychologists and School Social Worker certificates show strong employment numbers.
Sharp declines were noted in the employment rates of School Business Administrator and District Level
Administrator- Curriculum, Instruction And Assessment certificate areas.