Page 1
Tracking the Overdose Epidemic in
Montgomery County, PA
2017
Montgomery County
Board of Commissioners
Valerie A. Arkoosh, MD, MPH, Chair
Kenneth E. Lawrence, Jr., Vice Chair
Joseph C. Gale, Commissioner
Lee A. Soltysiak, Chief Operating Officer
Thomas M. Sullivan, Director, Department of Public Safety
Page 2
2
Memorandum To: Valerie A. Arkoosh, MD, MPH, Chair Kenneth E. Lawrence, Jr., Vice Chair Joseph C. Gale, Commissioner
Kevin R. Steele, District Attorney Michael Milbourne, MD, Coroner Lee A. Soltysiak, COO
Barbara O’Malley, Deputy COO
From: Thomas M. Sullivan, Director, Department of Public Safety
Subject: 2017 Drug-Related Public Safety Incident Analysis
Under your leadership, Montgomery County has waged a war on preventable death due to drug-related
overdoses since the emergence of the opioid epidemic in 2015. This region alone experienced a 40%
increase in drug-related deaths from 2015 - 2017. In 2017 alone, more than 2500 drug-related incidents
occurred in our region, resulting in 245 drug-related deaths. Hiding in the shadows of addiction,
thousands more are affected by the consequences and sequelae associated with substance abuse, with
many afraid to reach out due to fear of stigma. Unless these victims are seen and engaged in proper
long-term therapy, the tide of preventable death will remain. This project represents one of the most
novel approaches to providing visibility through the use of data analytics and geospatial information
systems (GIS) graphic presentations.
The following report is presented by the Montgomery County Department of Public Safety (MCDPS) Real
Time Information Center (RTIC), in partnership with the Montgomery County District Attorney Kevin
Steele, the Montgomery County Detective’s Chief Sam Gallen, the Montgomery County Coroner, Dr.
Michael Milbourne, and under the direction of the County Commissioners. It is intended to inform all
stakeholders in the County of Montgomery, the Southeastern PA planning region and the
Commonwealth of PA about information concerning overdose incidents in Montgomery County, PA.
The Department has strong confidence in the information presented however the reliability of the
information is challenged by timely, consistent and accurate reporting from the field. The deliberate
planning, collection, and dissemination of drug-related incident data facilitates better situational
awareness across the domains of law enforcement, emergency medical services, health & human
services, public policy and the regional healthcare infrastructure, enabling a natural synergy amongst
them.
The analysis of drug-related incident data by the Department of Public Safety, Real Time Information
Center underscores a multi-disciplinary effort to identify and respond to victims in need, while providing
valuable intelligence to law enforcement partners to identify and address the nexus of drugs and local
crime. The current epidemic represents a situation which forces atypical partners to share information
and plan a coordinated response long-term. Analysis of drug-related incident data identifies people and
Page 3
3
neighborhoods particularly at-risk, geographic and temporal patterns of emergence as well as those
public safety and healthcare resources shouldering the heaviest burdens for emergency response.
Disseminating the results of this report provides an opportunity for additional multi-disciplinary
discussions and planning sessions, as well as the development of data-supported initiatives to serve the
hardest-hit communities. This report represents an emerging spirit of interdisciplinary information
sharing and cooperation amongst law enforcement, public health & safety, health & human services and
public administration which shows value in addressing future novel emerging incidents.
The Montgomery County Coroner’s Office is a critical partner in providing detailed and accurate
information regarding actual causes of death in drug-related incidents. The full picture provided in this
report could not be achieved without their cooperation and data.
Brian Pasquale, PhD, from our Division of EMS, worked with the Arcadia University Public Health
Program in the data collation and analysis phases of this project. Through the collaboration of all
agencies involved in this project, the Montgomery County Department of Public Safety, Real Time
Information Center is able to provide the County stakeholders a realistic and accurate depiction of drug-
related incidents as developed by public safety, health and law enforcement experts.
Page 4
4
Contributors
Brian P. Pasquale, PhD, MPH, NRP Project Developer / Author
Department of Public Safety, EMS Division
Lt. Paul Bradbury Det. Nicholas Devine Alexander Balacki
Lieutenant Detective SIA Supervisor 1st Deputy Coroner Mont. Co. Detectives Mont. Co. Detectives Mont. Co. Coroner’s Ofc.
Montgomery County Regional Emergency Medical Services
308 – Plymouth 313 – Narberth 317 Lafayette Community Ambulance Emergency Medical Services Ambulance & Rescue 318 – Whitemarsh 322 – Lower Providence 324 – Trappe Fire Co. Ambulance Community Center Ambulance No. 1 Ambulance 325 – Friendship HLH 329 – Goodwill Steam Fire Co. #1 332 – Gilbertsville Area Ambulance of Royersford Ambulance - Pottstown Comm. Ambulance Svc. 336 – Skippack Emergency 339 – Souderton Community 344 – Harleysville Area Medical Services Ambulance Association Emerg. Medical Svc. 345 – Volunteer Medical 351 – Community Ambulance 352 – Horsham Fire Co. Services Corps - Lansdale Association – Ambler Ambulance 355 – Bryn Athyn Fire 358 – Cheltenham Township 369 Upper Perkiomen Company Ambulance Emergency Medical Services Valley Ambulance 380 – Second Alarmers Assoc. & Rescue Squad
Page 5
5
Project Office
All official inquiries regarding information presented in this report should be directed to:
Mr. David P. Brown, Deputy Director Montgomery County Department of Public Safety Division of EMS 50 Eagleville Road Eagleville, PA 19403 (610) 631-6500 Email: [email protected]
Page 6
6
Executive Summary
The Montgomery County, PA region has seen an increase in the number of suspected opioid
overdoses since 2013. As a result of the state-wide overdose epidemic, the PA Dept. of Health enacted
the PA Act 139 – Naloxone for First Responders. Beginning in 2015, the Montgomery County
Department of Public Safety (MCDPS) initiated tracking of incidents where Naloxone was being
administered during overdose resuscitation cases in the field by law enforcement through the use of a
regional data form. To get a better understanding of the impact of PA Act 139, MCDPS EMS Division
initiated a novel approach to surveillance by using EMS patient care report (PCR) data to establish a
baseline burden of overdose resuscitations in the field. These two initiatives matured in the current
data project.
Electronic PCR data is available as far back as 1999 for most agencies operating in the
Montgomery County region. Consistent patient care data capture using the National Emergency
Medical Services Information Standard (NEMSIS) dataset, version 2.1 began in 2006 and ended on
December 31, 2017. This data standard used state-wide was upgraded to NEMSIS 3.4 beginning January
1, 2018. Reliable baseline data has been established using EMS PCR data showing EMS Naloxone
administration in the field.
Unfortunately, both of these data collection efforts are threatened by competing reporting
requirements being send from various state and Federal agencies directly to municipal agencies.
Furthermore, the Pennsylvania Department of Health, Bureau of EMS Office (BEMS) has eliminated the
collection of most pertinent data points which support this program in their state data bridge. At the
same time, BEMS has taken data collection responsibilities away from the regional EMS offices through
the implementation of their direct reporting requirements to the state bridge. The loss of data access
by the regional EMS councils represents a great disservice to the local and regional public safety, law
enforcement, as well as health and human services organizations who might benefit from the
information gleaned from within.
Beginning in 2014, PA Act 139 allowed law enforcement agencies to administer Naloxone in the
field. The first Montgomery County law enforcement agencies began participating in March of 2015.
Since that time, all municipal police departments have joined the program, and the increase in their field
administrations is well documented, however remains dependent on voluntary manual submission of
paper forms for recording.
The law enforcement Naloxone data collection initiative has been challenged as well. The
Pennsylvania State Police Criminal Intelligence Center (PaCIC) and the High Intensity Drug Trafficking
Agency (HIDTA) have contacted local police departments instructing them to report into their
consolidated database, the Overdose Incident Network (ODIN). This database, hidden within a law-
enforcement restricted framework prevents collaboration outside of law enforcement, and does not
meet the level of detail that this project offers to its stakeholders. Findings from this project are offered
to all vertical agencies to satisfy their reporting requirements.
Page 7
7
Key Findings
• In 2017, there were 88,666 requests for emergency medical services (EMS) response through the
9-1-1 system. Although there were more than 2500 incidents qualifying as drug-or-medication
related, this report focuses only on substance-abuse incidents. Therefore, only 1710 were reported
from the field as being substance-abuse incidents.
• The Montgomery County Coroner’s Office identified 245 drug-related deaths in 2017. This is down
1.6% from 249 deaths in 2016.
• Although the “MOD – overdose” code remains the most prevalent dispatch complaint (42%) in
emergency responses to drug-related incidents. However, “MCA – cardiac arrest” and “MUR –
unresponsive subject” complaints make up nearly 1/3 of dispatch complaints associated with drug-
related incidents.
• Heroin was the most-common field-identified substance of abuse in drug-related incidents (41%).
• The most frequent method of field determination of drug overdose was patient or family member
admission (39%) of victim drug use. In nearly 15% of all drug-related incidents, visual identification
of drug paraphernalia or product was used to identify an overdose scenario.
• In 2017, the majority of victims were male (64%), consistent with state and national demographic
trends.
• The 26-33 year age group remains the most at-risk population for drug-related incidents.
• White males remain the most prevalent victims encountered in the field, however inconsistent
demographic reporting at all levels offers challenges to measuring the exact distribution.
• Fair weather months show the highest incidence of drug-related events beginning around April, with
a decline in frequency occurring in October.
• Drug-related incidents occur more frequently on weekends with a rise in occurrence on Friday
evenings, with a sharp decline after 1:00 a.m. on Monday morning. The busiest hourly time period
remains 8:00 p.m. until midnight.
• Pottstown and Norristown boroughs experience the highest incident occurrence rates per square
mile. GIS mapping shows the highest consolidations within specific census tracts within each
municipality.
Page 8
8
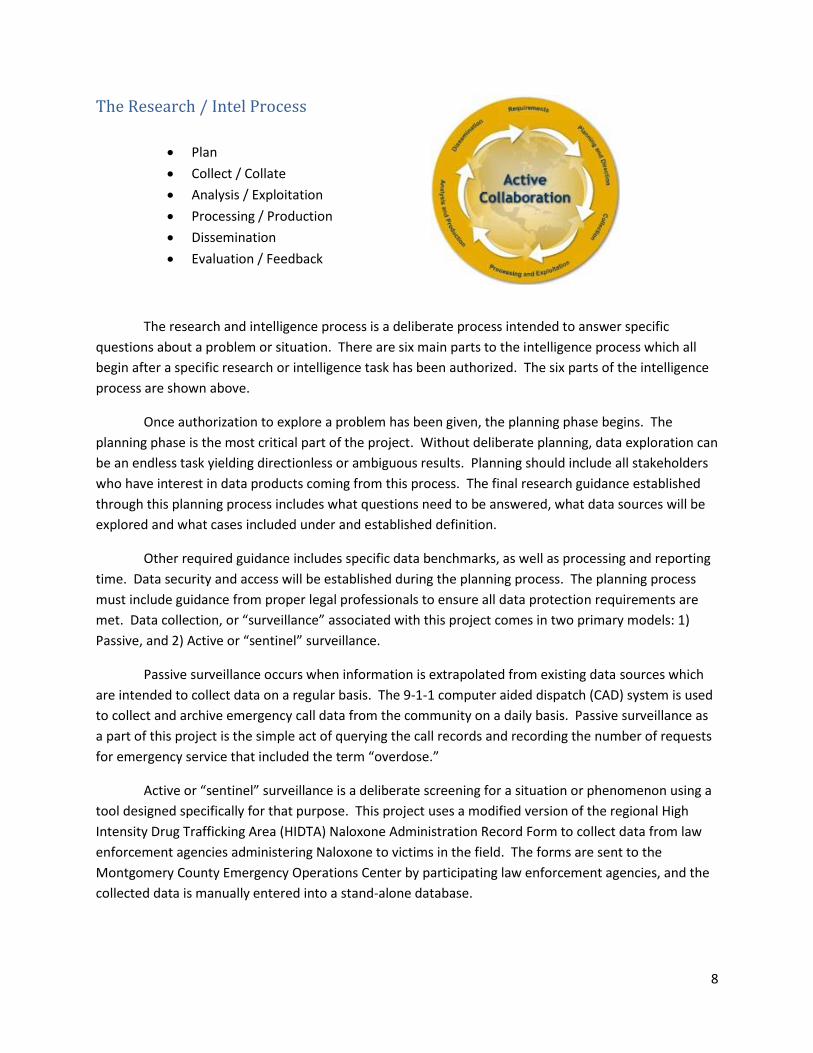
The Research / Intel Process
• Plan
• Collect / Collate
• Analysis / Exploitation
• Processing / Production
• Dissemination
• Evaluation / Feedback
The research and intelligence process is a deliberate process intended to answer specific
questions about a problem or situation. There are six main parts to the intelligence process which all
begin after a specific research or intelligence task has been authorized. The six parts of the intelligence
process are shown above.
Once authorization to explore a problem has been given, the planning phase begins. The
planning phase is the most critical part of the project. Without deliberate planning, data exploration can
be an endless task yielding directionless or ambiguous results. Planning should include all stakeholders
who have interest in data products coming from this process. The final research guidance established
through this planning process includes what questions need to be answered, what data sources will be
explored and what cases included under and established definition.
Other required guidance includes specific data benchmarks, as well as processing and reporting
time. Data security and access will be established during the planning process. The planning process
must include guidance from proper legal professionals to ensure all data protection requirements are
met. Data collection, or “surveillance” associated with this project comes in two primary models: 1)
Passive, and 2) Active or “sentinel” surveillance.
Passive surveillance occurs when information is extrapolated from existing data sources which
are intended to collect data on a regular basis. The 9-1-1 computer aided dispatch (CAD) system is used
to collect and archive emergency call data from the community on a daily basis. Passive surveillance as
a part of this project is the simple act of querying the call records and recording the number of requests
for emergency service that included the term “overdose.”
Active or “sentinel” surveillance is a deliberate screening for a situation or phenomenon using a
tool designed specifically for that purpose. This project uses a modified version of the regional High
Intensity Drug Trafficking Area (HIDTA) Naloxone Administration Record Form to collect data from law
enforcement agencies administering Naloxone to victims in the field. The forms are sent to the
Montgomery County Emergency Operations Center by participating law enforcement agencies, and the
collected data is manually entered into a stand-alone database.
Page 9
9
Project Data Sources
The research/intel data collection and collation process follows a similar timeline as an actual
emergency. The first step in the linear timeline is the emergent request for service. 9-1-1 CAD calls are
reviewed for specific requests for service coded as “MOD” or overdoses. The resulting list of overdose
incidents is compared with EMS PCR data, and then HIDTA form submissions to ensure accountability for
all requests for service, police and EMS alike. The EMS incident number and the Police incident numbers
are documented in the database to ensure that incidents are not duplicated, again being linked in a
timeline continuum model.
Dispatch data offers unique insight into the comparison of 9-1-1 – to - resuscitation times from
the point of illness or injury. Reducing “down-time” or the total time where a victim is not breathing is a
primary goal of delivering telephone instructions to the emergency caller. Pre-arrival instructions for
Naloxone and/or CPR are delivered by telecommunication professionals to reduce critical “down-time”
for the victim. Data comparisons have been done showing the benefits of law enforcement Naloxone
delivery in reducing time to delivery of Naloxone in the field. In both years (2016 – 2017) of the
Montgomery County law enforcement Naloxone administrations project, police delivery of Naloxone
was an average of 4 minutes earlier than EMS arrival on-scene.
Emergency Medical Service (EMS) PCRs are required to be submitted within 72 hours of the
patient contact, in accordance with PA Act 35 of 2009. Aggregate data is collected from EMS patient
care reports as a part of the passive surveillance process. PA Act 35 provides standard regulatory
guidance to field providers and establishes timeliness of data processed for this project. Data integrity is
ensured through the use of a National Emergency Medical Service Information System (NEMSIS) data
structure. Data is viewed at the regional level, incorporating input from 20 EMS agencies which provide
service to Montgomery County. Scenario data is reviewed, including the nature of dispatch, as well as
call details including the number of Naloxone doses administered to a subject in the field. Drug-use
indicators used in the standard NEMSIS structure are queried to assist in determining if an incident had
suspected drug use. No personally-identifying information (PII) is used as a part of this project.
Although there are another 24 non-emergency private ambulance services in the area, data is
only collected from the 9-1-1 emergency services. The use of EMS data ensures 100% geographic
coverage for data collection. The use of EMS data is considered advantageous over hospital data due to
several factors:
• Timeliness – hospital data is manually submitted and is often delayed weeks-to-months
before it is received by appropriate officials. EMS data is collected within 72 hours of the
actual patient contact.
• Proximity – hospital data is considered less reliable regarding incident location. Overdose
victims may also opt to refuse transport to, or care/evaluation at a hospital, whereas EMS
providers collect and report on the patient contact based on seeing the patient at the
point/place of injury or illness. The paramedic also reports on other, non-medical factors
Page 10
10
including bystanders, presence of paraphernalia as well as testimony of incident witnesses
which offers a distinct advantage when determining cause of illness or injury.
• Passive Collection – previously mentioned, EMS reporting is a regular part of the job cycle.
Patient care reports are required to be submitted within 72 hours of patient contact. This
process enhances accountability for incident reporting, while avoiding reporting fatigue
which may be encountered when introducing multiple sentinel reporting processes.
Law Enforcement Submissions (HIDTA Forms) – Montgomery County Department of Public
Safety has been collecting the data using an internally-modified HIDTA Naloxone Use Reporting Form
since March 2015. Participating law enforcement agencies that receive grant-funded Naloxone doses
are required to submit via fax or email a form for each Naloxone field administration. The original forms
are scanned and archived, and the aggregate data manually entered into an internal database. The
aggregate data is collated with EMS data to ensure that incidents are not double reported.
County Detectives Data (Supplemental) – As a part of expanded surveillance and reporting, a
recent initiative by Montgomery County Detectives initiated a look at all pharmaceutical substances
involved in overdose emergencies, whether or not Naloxone was administered. As a part of this
initiative, the County Detectives provided an aggregate list of cases which they were following. This
data was compared with EMS run data as well as aforementioned 9-1-1 data to eliminate reporting
repetition and give an overall picture of drug overdoses in the region. The County Detective’s aggregate
data list included limited coroner’s mortality data which was also compared against both 9-1-1 and EMS
PCR data.
Improving Visibility - Comparing Records Count
One of the greatest challenges for community leaders is forming an accurate picture of what’s
happening around you. Collating data from multiple resources improves this picture giving clarity where
ambiguity exists and enabling leaders to begin to look forward (predictive modeling) rather than looking
back at what has already transpired. However, analysts must remain cautious not to count cases more
than once when compiling their data analysis. The following comparison of record counts reveals the
visibility limitations that using single-source data imposes upon agencies involved in the project.
CAD Data EMS PCR Data HIDTA Forms County Detectives
• 88,666 Total Dispatch Records 2645 PCR Records 367 Records 607 Reports
Reviewing nearly 89,000 records was not considered feasible, nor effective. Therefore, after
careful review, records review was reduced to the four primary dispatch reasons associated with drug-
related events. This reduced the number of records reviewed to 7876 dispatch records as seen below:
o 1818 “Overdose” Dispatches
o 1584 “Cardiac Arrest Dispatches
o 2201 “Unresponsive” Dispatches
o 2273 “Behavioral Emergency Dispatches
Page 11
11
Requests for emergency service include multi-disciplinary responses. Therefore, collating these
dispatch, EMS, and police records is crucial in developing a clear picture of incidents in the region. The
next step was to define which incidents were included. The initial review of the 7876 records revealed
more than 2600 drug-related incidents. However, during the next level of review, only cases where
drug-use was determined in the field by either police or EMS were included in the final report. Incidents
such as intentional ingestion of sleeping pills, Benadryl or Tylenol were excluded in adults. The focus of
this report remains on identifying addiction trends and illicit substances, including precursor events.
Therefore, the incidents kept (inclusion criteria) in the database include:
• all involving any illicit substance,
• any incidents where Opiates were identified,
• any incident where an unknown substance responded positively to Naloxone administration,
• all incident involving Naloxone administration in the field,
• all incidents where patients and or intimate persons (family, friends, etc.) admitted to substance
abuse and
• possible precursor events such as school-aged children substance use (regardless of substance).
Realistically, the actual number of drug-related 9-1-1 incidents in Montgomery County is closer to
2200 - 2500 per year, however better data quality (better reporting and participation) is needed to
further develop this picture. Although more time is needed to identify many of the “unknown”
substances of abuse, once the records were collated, 1710 incidents were identified in Montgomery
County during 2017.
During the reporting period, there were 736 Naloxone administrations by EMS in the field, and 367
Naloxone administrations by Law Enforcement professionals. Interestingly, although tracking
community Naloxone administration is inherently challenged by layperson fear, there were 30 cases
successfully documented in EMS PCR records. Future initiatives should include simple, anonymized
tracking capabilities in partnership with health and human services agencies.
Tools for Analysis
Timely and accurate data analysis has been achieved at low cost by using proven and supported
open source data analysis tools. This project started with the use of CDC Epi Info 7 desktop reading data
collected in a standard Excel spreadsheet. Data was exported from each of the record systems directly
into spreadsheet forms. Furthermore, all participating agencies were encouraged to download and
install CDC Epi Info 7 as a part of this project. Platform training was provided by the Montgomery
County Department of Public Safety staff to interested stakeholders. The following data analysis
platforms were used:
• CDC Epi Info 7
• Microsoft Power BI Desktop
• BI Direct for CAD
Page 12
12
All public health and safety incidents possess temporal and geospatial characteristics which
should be displayed for visual reference. Visual display of these characteristics offers the reader a better
understanding of human or social characteristics of the situation at hand. One of the greatest
challenges with getting or providing mapping is the cost factor. Professional GIS software is often cost-
prohibitive and requires a lot of training for users to become proficient in processing GIS displays.
However, use of the CDC Epi Info 7 platform allows for basic GIS display of the incident data studied.
The following GIS platforms were used as a part of this project:
• CDC Epi-Info 7
• Quantum GIS (QGIS)
The use of more complex GIS systems provided greater detail regarding geographic
characteristics of the incidents studied. The Commonwealth of PA, Criminal Intelligence Center (PACIC)
in partnership with HIDTA have developed a GIS data collection system to track OD incidents in the
Commonwealth. Unfortunately, the level of visibility only goes to the municipality level and does not
offer neighborhood or community-level visibility of the problem.
OD Map, a phone application developed by HIDTA and used by the Philadelphia Police and
Delaware Valley Intelligence Center (DVIC) provide simple identification of incidents in the city, however
do not offer supporting data surrounding the incident. Simply, the app “puts a pin on the location.” No
other relevant data is collected.
The Montgomery County project explored several characteristics of the overdose incidents. This
included victim gender, race, age, and home of record (city only). It also collected incident-specific data
such as Naloxone administration by number of doses, total administered, perceived reversals as well as
post-resuscitation cognitive responses (combative, sedated, alert, etc.). By collecting this information in
such a detailed manner, this project allows for the identification of repeat victim trends, “hot spot”
locations, as well as morbidity vs. mortality comparison as well as time and location information. The
intent of the Montgomery County project is to become a passive process that addresses specific
questions, while reducing “reporting fatigue” imposed by multiple agencies (HIDTA, PaCIC, PA DOH, etc.)
requesting separate, and often redundant, reporting forms for each incident. Competing reporting
priorities degrade the integrity of reporting across the board. This project is specifically designed to
facilitate accurate transfer of information horizontally and vertically across reporting domains, satisfying
requirements set forth by State and Federal agencies.
Page 13
13
Field Indications of Death vs. Coroner’s Reporting – Data Variability
The Montgomery County Coroner’s Office (MCCO) reported 245 drug-related deaths in 2017. However,
not all records reflected in the following report matches the same 245 n-value that is presented by the
MCCO in their annual report. One of the primary reasons for this variability is that not all deaths
investigated by the MCCO involved emergency medical services (EMS) response. Police and EMS
personnel use visual and basic clinical cues for field-determination of death. Field-identified death data
associated with suspected drug-related incidents are highlighted in *red and marked with an asterisk.
Page 14
14
Findings and Results
Page 15
15
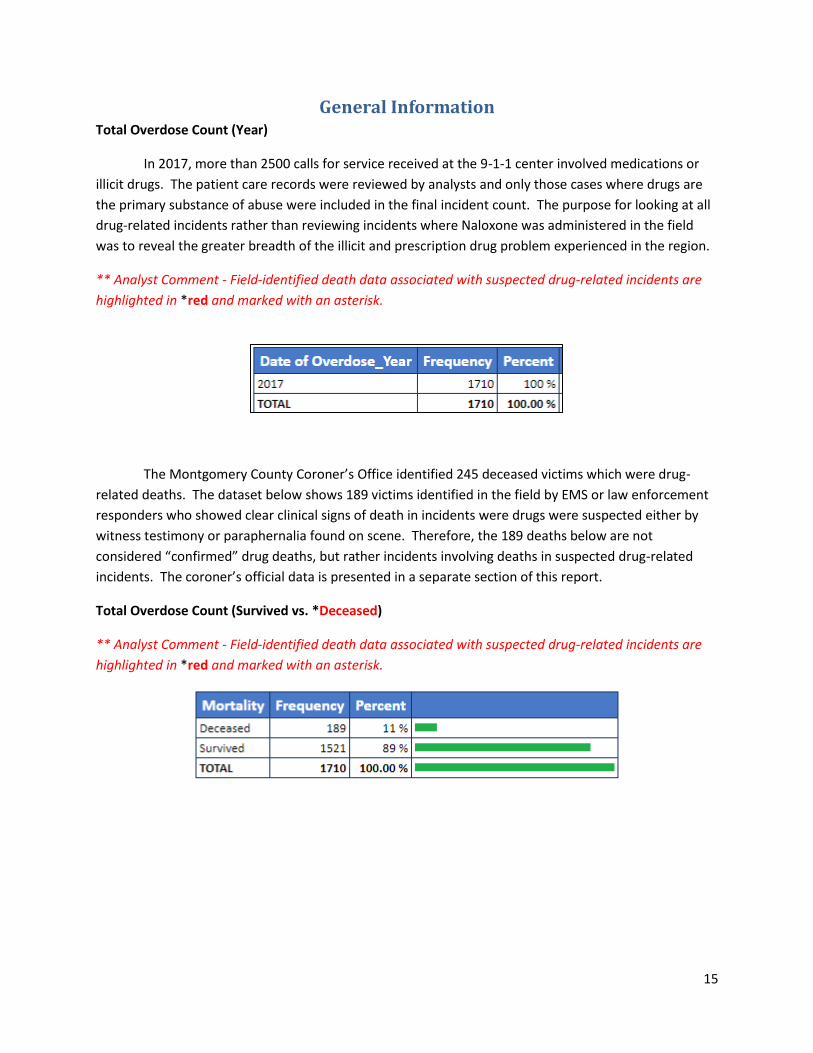
General Information Total Overdose Count (Year)
In 2017, more than 2500 calls for service received at the 9-1-1 center involved medications or
illicit drugs. The patient care records were reviewed by analysts and only those cases where drugs are
the primary substance of abuse were included in the final incident count. The purpose for looking at all
drug-related incidents rather than reviewing incidents where Naloxone was administered in the field
was to reveal the greater breadth of the illicit and prescription drug problem experienced in the region.
** Analyst Comment - Field-identified death data associated with suspected drug-related incidents are
highlighted in *red and marked with an asterisk.
The Montgomery County Coroner’s Office identified 245 deceased victims which were drug-
related deaths. The dataset below shows 189 victims identified in the field by EMS or law enforcement
responders who showed clear clinical signs of death in incidents were drugs were suspected either by
witness testimony or paraphernalia found on scene. Therefore, the 189 deaths below are not
considered “confirmed” drug deaths, but rather incidents involving deaths in suspected drug-related
incidents. The coroner’s official data is presented in a separate section of this report.
Total Overdose Count (Survived vs. *Deceased)
** Analyst Comment - Field-identified death data associated with suspected drug-related incidents are
highlighted in *red and marked with an asterisk.
Page 16
16
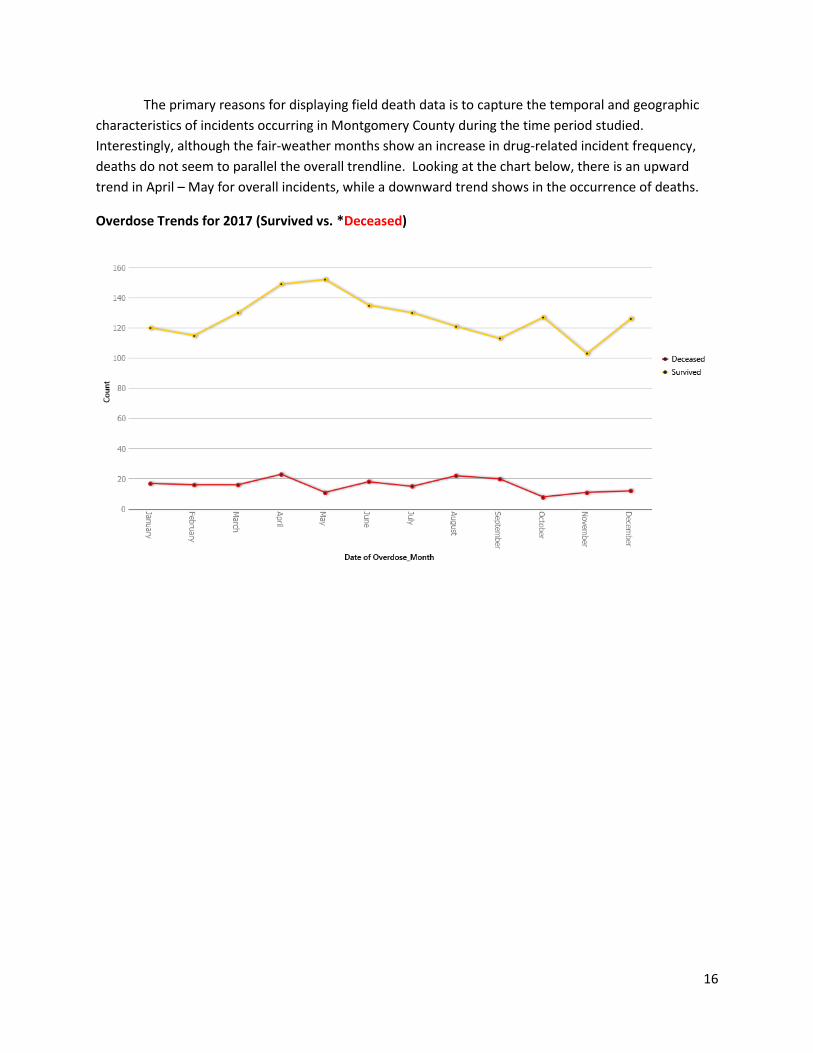
The primary reasons for displaying field death data is to capture the temporal and geographic
characteristics of incidents occurring in Montgomery County during the time period studied.
Interestingly, although the fair-weather months show an increase in drug-related incident frequency,
deaths do not seem to parallel the overall trendline. Looking at the chart below, there is an upward
trend in April – May for overall incidents, while a downward trend shows in the occurrence of deaths.
Overdose Trends for 2017 (Survived vs. *Deceased)
Page 17
17
Victim Profile
Understanding victim profiles is important in developing an overall situational awareness.
Several factors including age, race, gender and socio-economic status influences the substances of abuse
used by victims. The following section explores some of the victim profile information found in the
dataset.
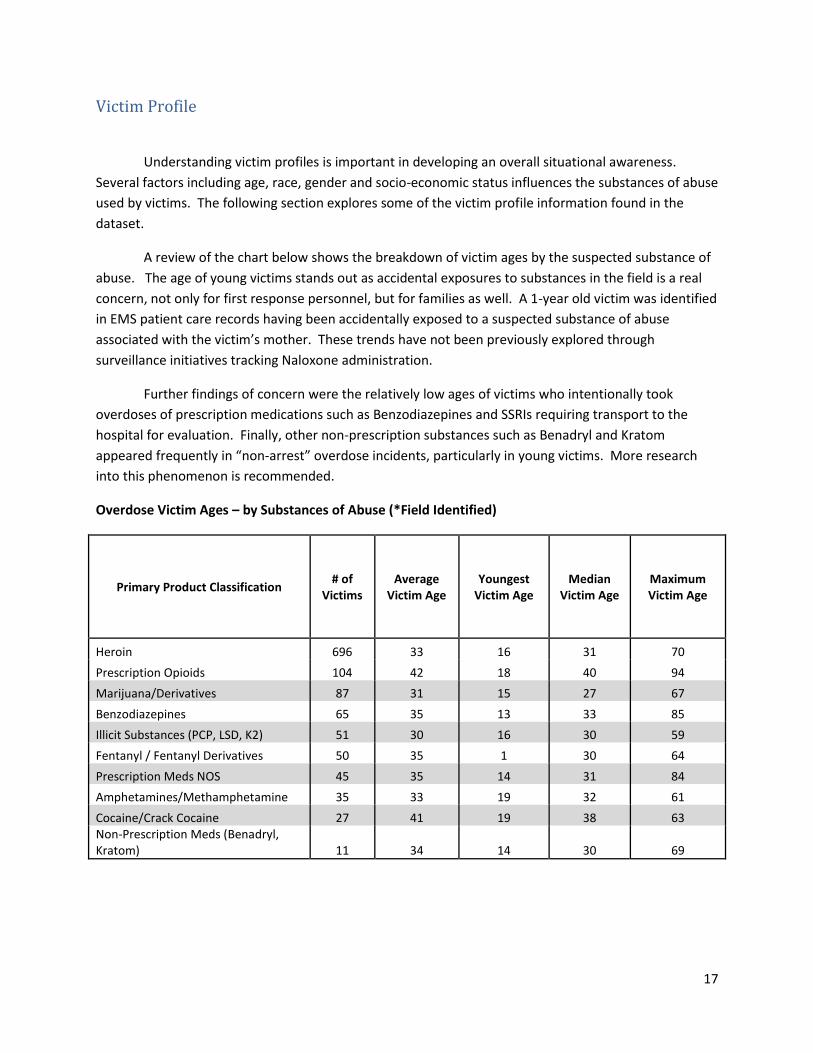
A review of the chart below shows the breakdown of victim ages by the suspected substance of
abuse. The age of young victims stands out as accidental exposures to substances in the field is a real
concern, not only for first response personnel, but for families as well. A 1-year old victim was identified
in EMS patient care records having been accidentally exposed to a suspected substance of abuse
associated with the victim’s mother. These trends have not been previously explored through
surveillance initiatives tracking Naloxone administration.
Further findings of concern were the relatively low ages of victims who intentionally took
overdoses of prescription medications such as Benzodiazepines and SSRIs requiring transport to the
hospital for evaluation. Finally, other non-prescription substances such as Benadryl and Kratom
appeared frequently in “non-arrest” overdose incidents, particularly in young victims. More research
into this phenomenon is recommended.
Overdose Victim Ages – by Substances of Abuse (*Field Identified)
Primary Product Classification # of
Victims Average
Victim Age Youngest
Victim Age Median
Victim Age Maximum Victim Age
Heroin 696 33 16 31 70
Prescription Opioids 104 42 18 40 94
Marijuana/Derivatives 87 31 15 27 67
Benzodiazepines 65 35 13 33 85
Illicit Substances (PCP, LSD, K2) 51 30 16 30 59
Fentanyl / Fentanyl Derivatives 50 35 1 30 64
Prescription Meds NOS 45 35 14 31 84
Amphetamines/Methamphetamine 35 33 19 32 61
Cocaine/Crack Cocaine 27 41 19 38 63 Non-Prescription Meds (Benadryl, Kratom) 11 34 14 30 69
Page 18
18
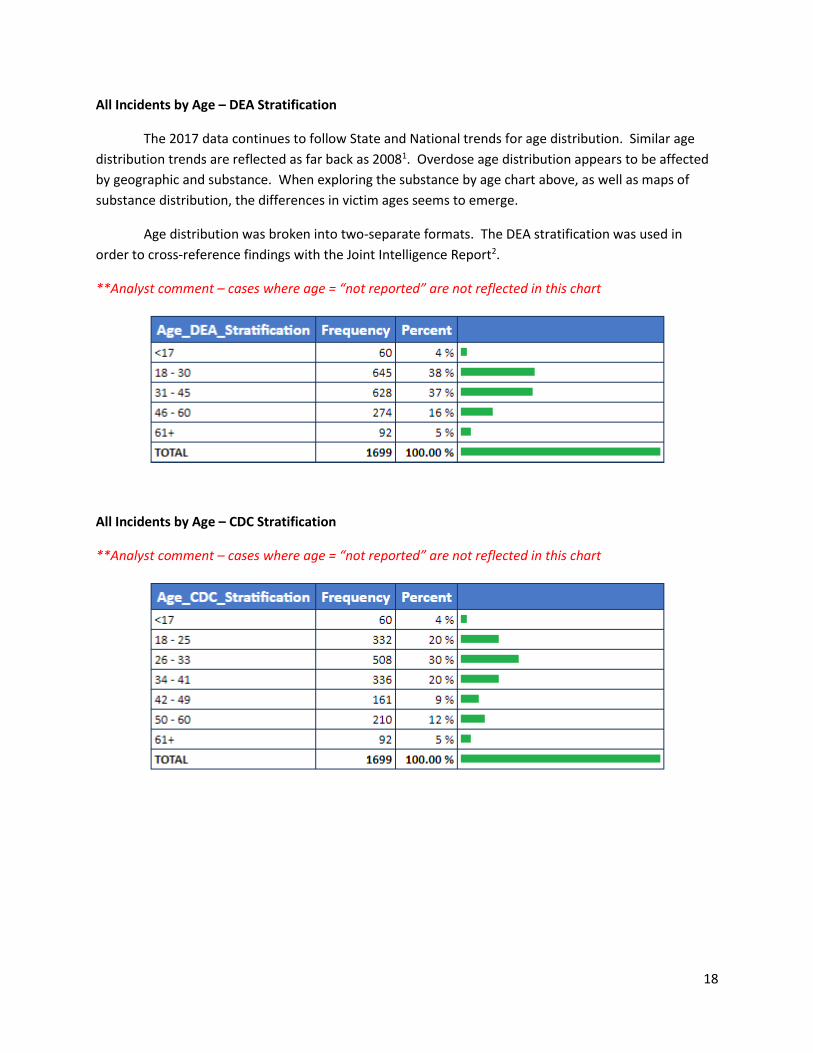
All Incidents by Age – DEA Stratification
The 2017 data continues to follow State and National trends for age distribution. Similar age
distribution trends are reflected as far back as 20081. Overdose age distribution appears to be affected
by geographic and substance. When exploring the substance by age chart above, as well as maps of
substance distribution, the differences in victim ages seems to emerge.
Age distribution was broken into two-separate formats. The DEA stratification was used in
order to cross-reference findings with the Joint Intelligence Report2.
**Analyst comment – cases where age = “not reported” are not reflected in this chart
All Incidents by Age – CDC Stratification
**Analyst comment – cases where age = “not reported” are not reflected in this chart
Page 19
19
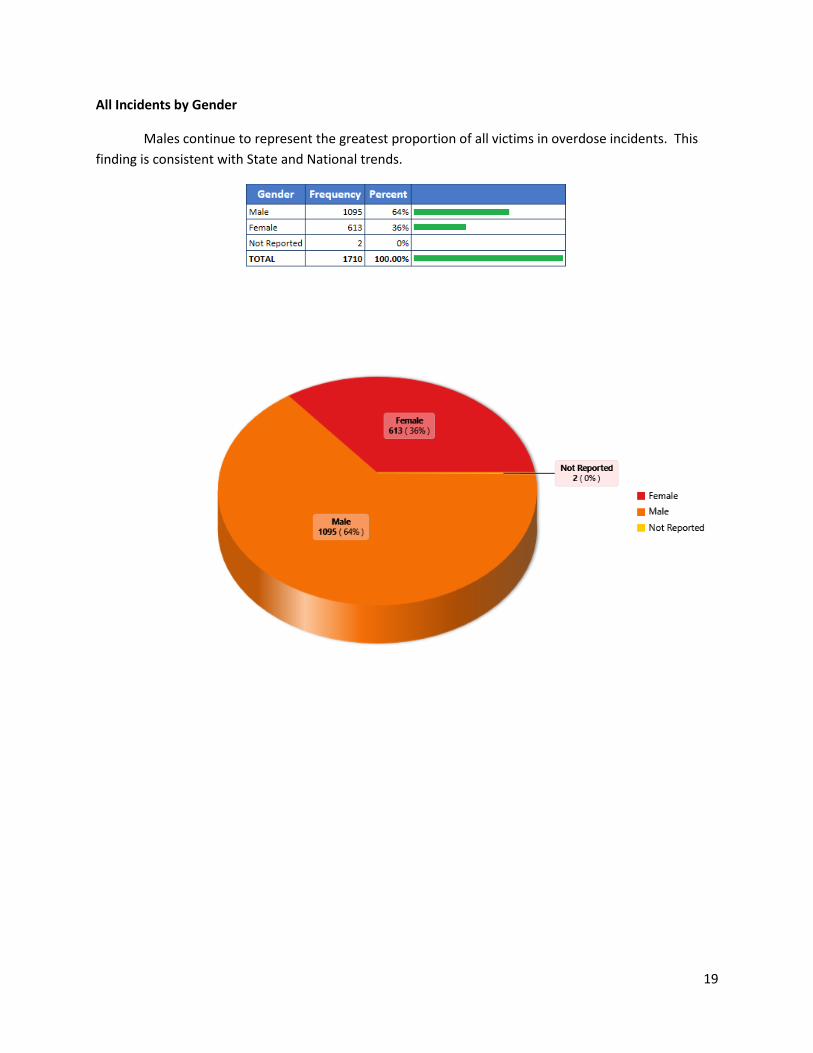
All Incidents by Gender
Males continue to represent the greatest proportion of all victims in overdose incidents. This
finding is consistent with State and National trends.
Page 20
20
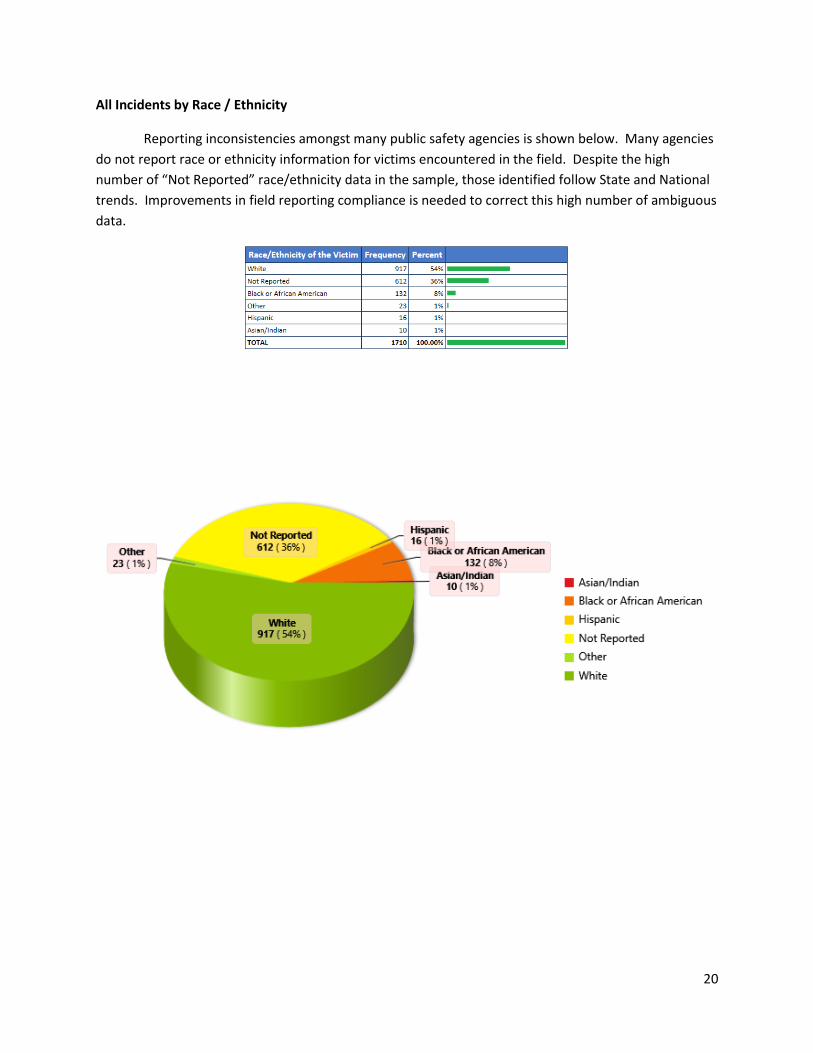
All Incidents by Race / Ethnicity
Reporting inconsistencies amongst many public safety agencies is shown below. Many agencies
do not report race or ethnicity information for victims encountered in the field. Despite the high
number of “Not Reported” race/ethnicity data in the sample, those identified follow State and National
trends. Improvements in field reporting compliance is needed to correct this high number of ambiguous
data.
Page 21
21
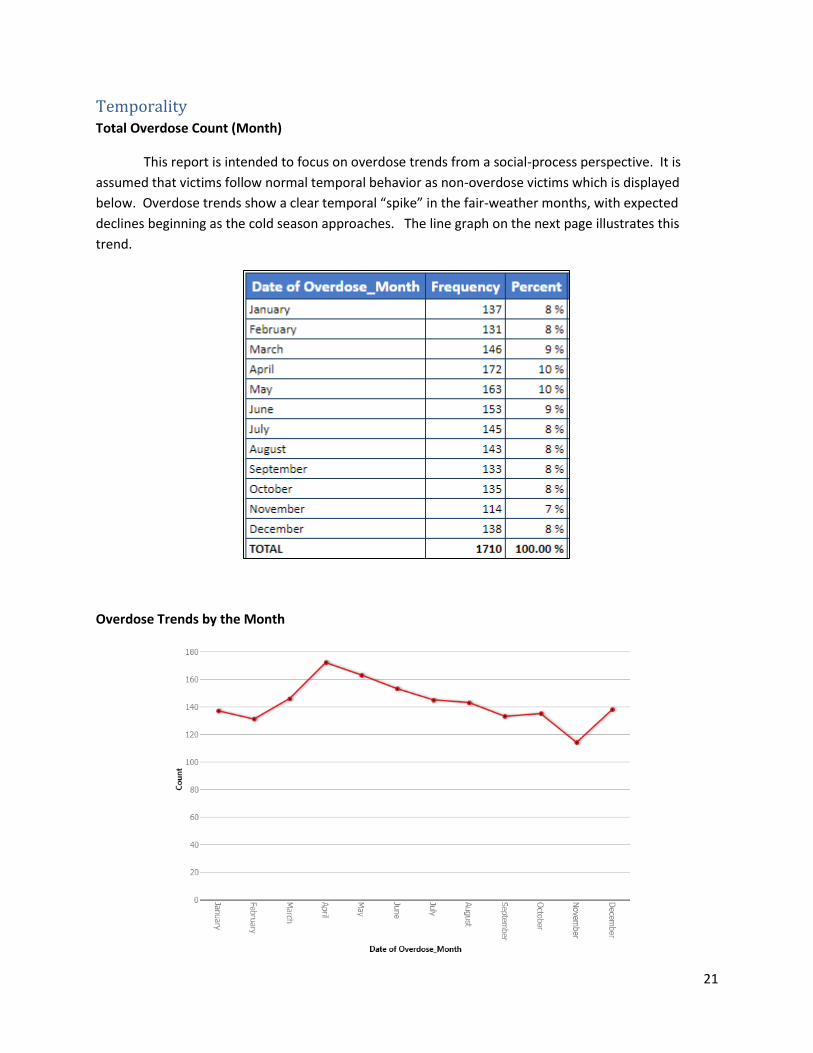
Temporality Total Overdose Count (Month)
This report is intended to focus on overdose trends from a social-process perspective. It is
assumed that victims follow normal temporal behavior as non-overdose victims which is displayed
below. Overdose trends show a clear temporal “spike” in the fair-weather months, with expected
declines beginning as the cold season approaches. The line graph on the next page illustrates this
trend.
Overdose Trends by the Month
Page 22
22
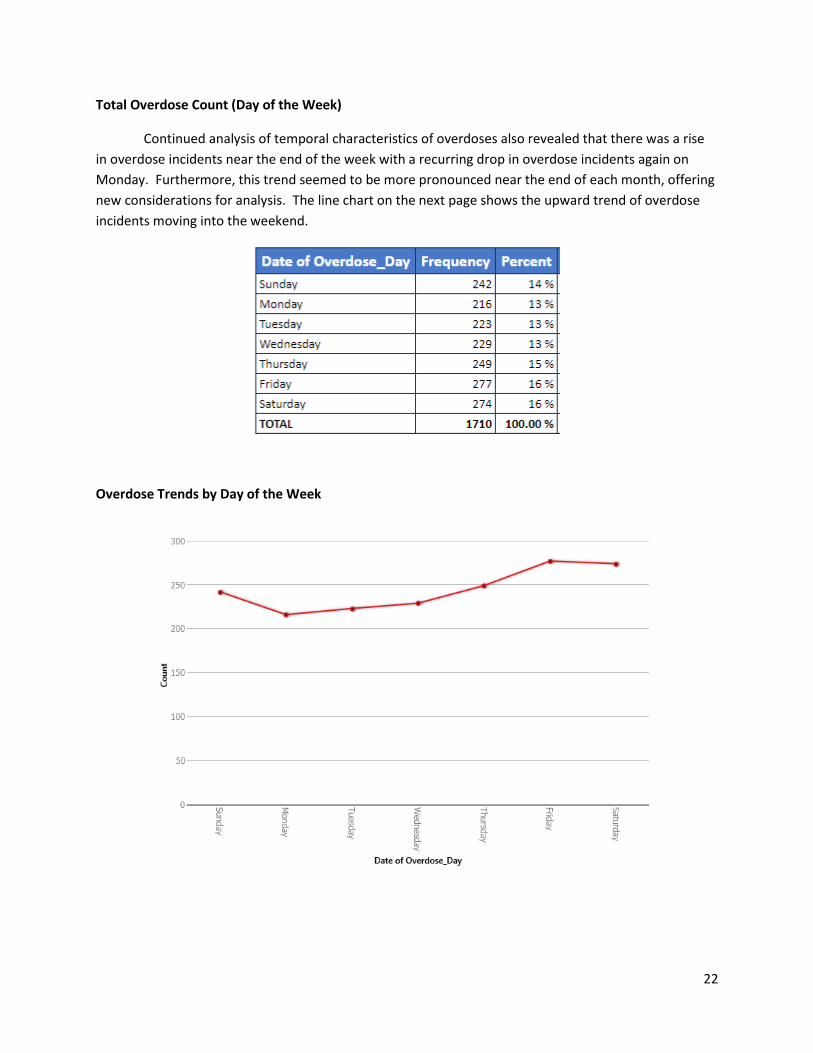
Total Overdose Count (Day of the Week)
Continued analysis of temporal characteristics of overdoses also revealed that there was a rise
in overdose incidents near the end of the week with a recurring drop in overdose incidents again on
Monday. Furthermore, this trend seemed to be more pronounced near the end of each month, offering
new considerations for analysis. The line chart on the next page shows the upward trend of overdose
incidents moving into the weekend.
Overdose Trends by Day of the Week
Page 23
23
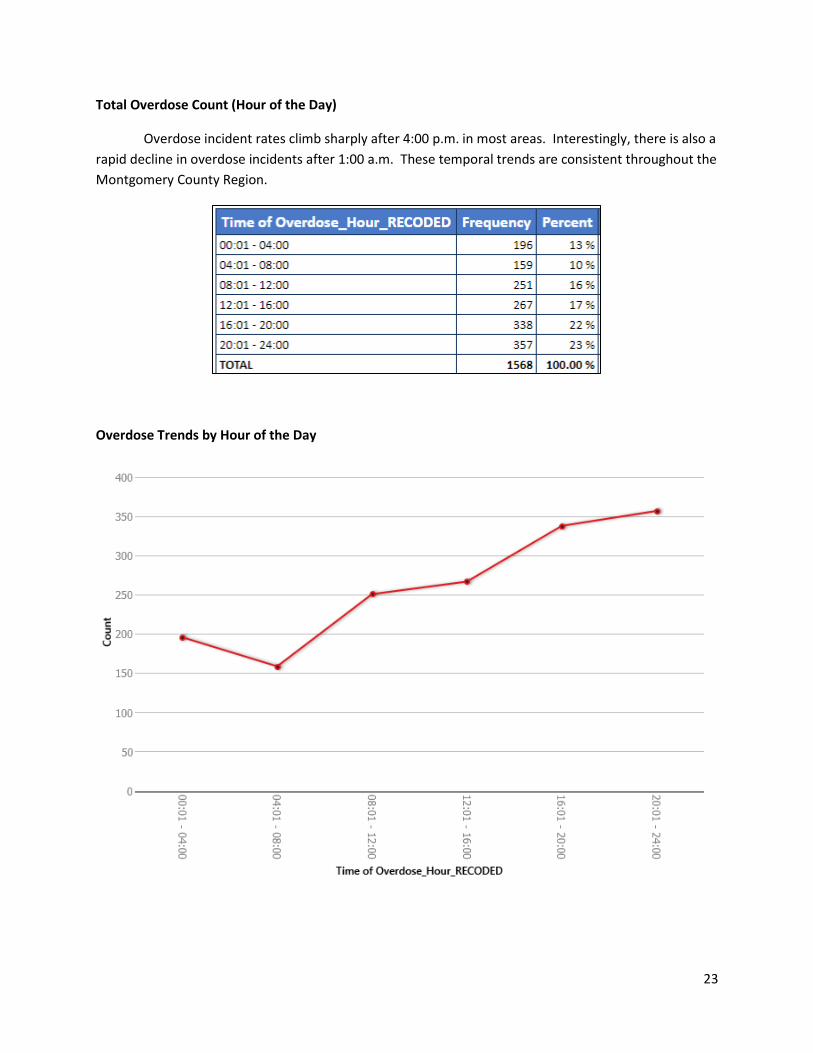
Total Overdose Count (Hour of the Day)
Overdose incident rates climb sharply after 4:00 p.m. in most areas. Interestingly, there is also a
rapid decline in overdose incidents after 1:00 a.m. These temporal trends are consistent throughout the
Montgomery County Region.
Overdose Trends by Hour of the Day
Page 24
24
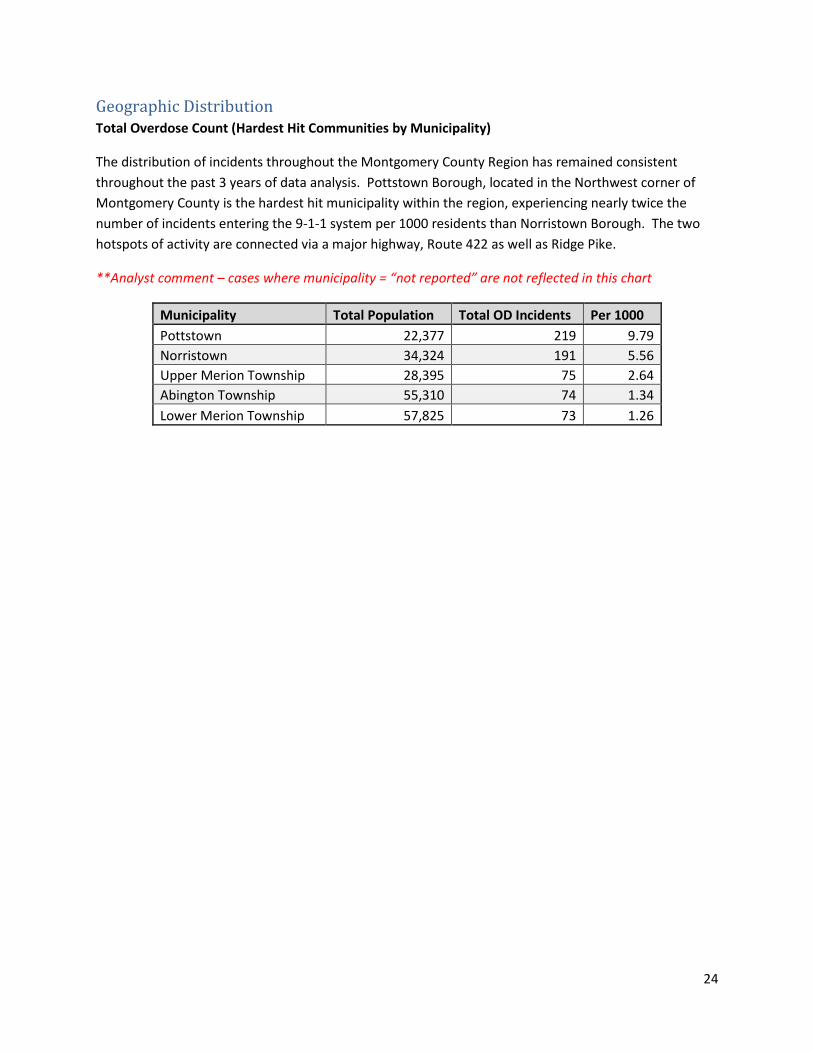
Geographic Distribution Total Overdose Count (Hardest Hit Communities by Municipality)
The distribution of incidents throughout the Montgomery County Region has remained consistent
throughout the past 3 years of data analysis. Pottstown Borough, located in the Northwest corner of
Montgomery County is the hardest hit municipality within the region, experiencing nearly twice the
number of incidents entering the 9-1-1 system per 1000 residents than Norristown Borough. The two
hotspots of activity are connected via a major highway, Route 422 as well as Ridge Pike.
**Analyst comment – cases where municipality = “not reported” are not reflected in this chart
Municipality Total Population Total OD Incidents Per 1000
Pottstown 22,377 219 9.79
Norristown 34,324 191 5.56
Upper Merion Township 28,395 75 2.64
Abington Township 55,310 74 1.34
Lower Merion Township 57,825 73 1.26
Page 25
25
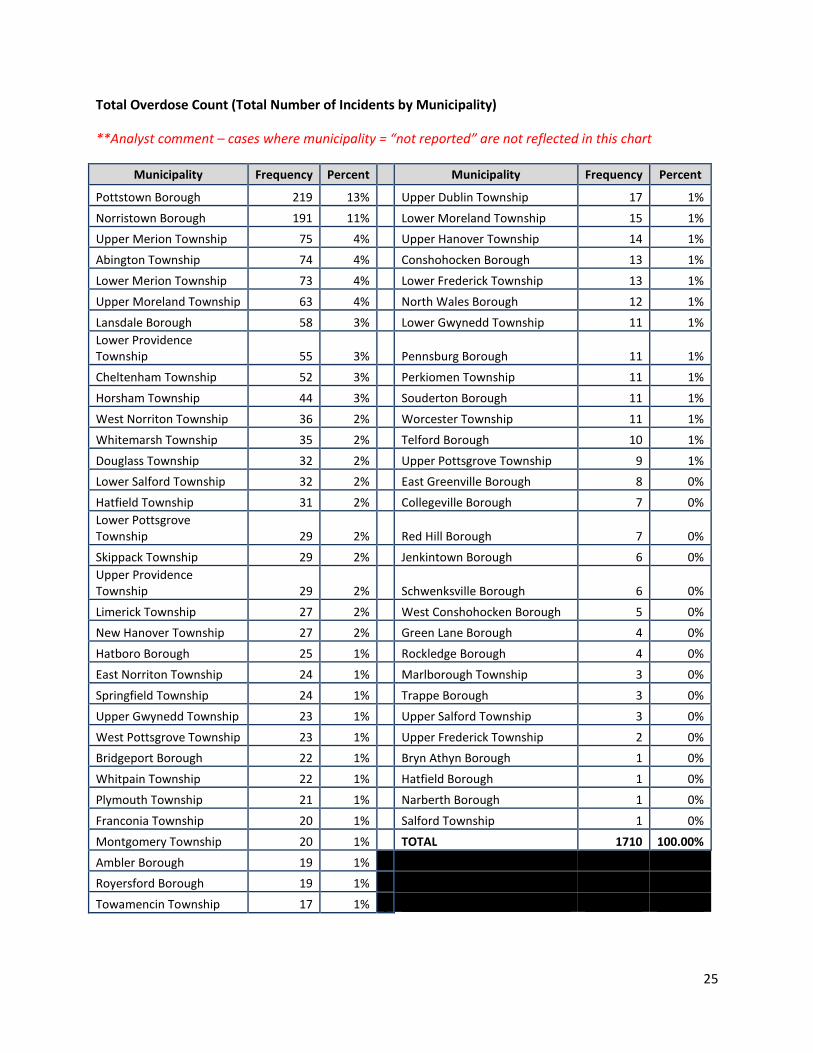
Total Overdose Count (Total Number of Incidents by Municipality)
**Analyst comment – cases where municipality = “not reported” are not reflected in this chart
Municipality Frequency Percent Municipality Frequency Percent
Pottstown Borough 219 13% Upper Dublin Township 17 1%
Norristown Borough 191 11% Lower Moreland Township 15 1%
Upper Merion Township 75 4% Upper Hanover Township 14 1%
Abington Township 74 4% Conshohocken Borough 13 1%
Lower Merion Township 73 4% Lower Frederick Township 13 1%
Upper Moreland Township 63 4% North Wales Borough 12 1%
Lansdale Borough 58 3% Lower Gwynedd Township 11 1%
Lower Providence Township 55 3% Pennsburg Borough 11 1%
Cheltenham Township 52 3% Perkiomen Township 11 1%
Horsham Township 44 3% Souderton Borough 11 1%
West Norriton Township 36 2% Worcester Township 11 1%
Whitemarsh Township 35 2% Telford Borough 10 1%
Douglass Township 32 2% Upper Pottsgrove Township 9 1%
Lower Salford Township 32 2% East Greenville Borough 8 0%
Hatfield Township 31 2% Collegeville Borough 7 0%
Lower Pottsgrove Township 29 2% Red Hill Borough 7 0%
Skippack Township 29 2% Jenkintown Borough 6 0%
Upper Providence Township 29 2% Schwenksville Borough 6 0%
Limerick Township 27 2% West Conshohocken Borough 5 0%
New Hanover Township 27 2% Green Lane Borough 4 0%
Hatboro Borough 25 1% Rockledge Borough 4 0%
East Norriton Township 24 1% Marlborough Township 3 0%
Springfield Township 24 1% Trappe Borough 3 0%
Upper Gwynedd Township 23 1% Upper Salford Township 3 0%
West Pottsgrove Township 23 1% Upper Frederick Township 2 0%
Bridgeport Borough 22 1% Bryn Athyn Borough 1 0%
Whitpain Township 22 1% Hatfield Borough 1 0%
Plymouth Township 21 1% Narberth Borough 1 0%
Franconia Township 20 1% Salford Township 1 0%
Montgomery Township 20 1% TOTAL 1710 100.00%
Ambler Borough 19 1%
Royersford Borough 19 1%
Towamencin Township 17 1%
Page 26
26
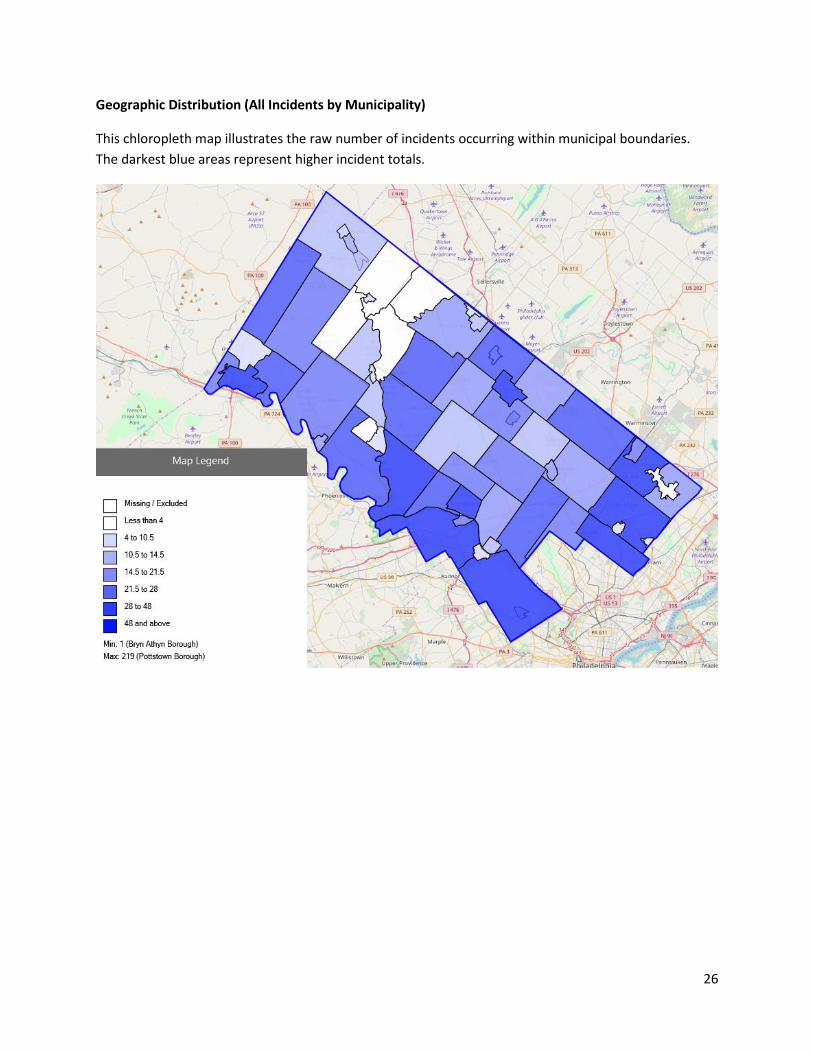
Geographic Distribution (All Incidents by Municipality)
This chloropleth map illustrates the raw number of incidents occurring within municipal boundaries.
The darkest blue areas represent higher incident totals.
Page 27
27
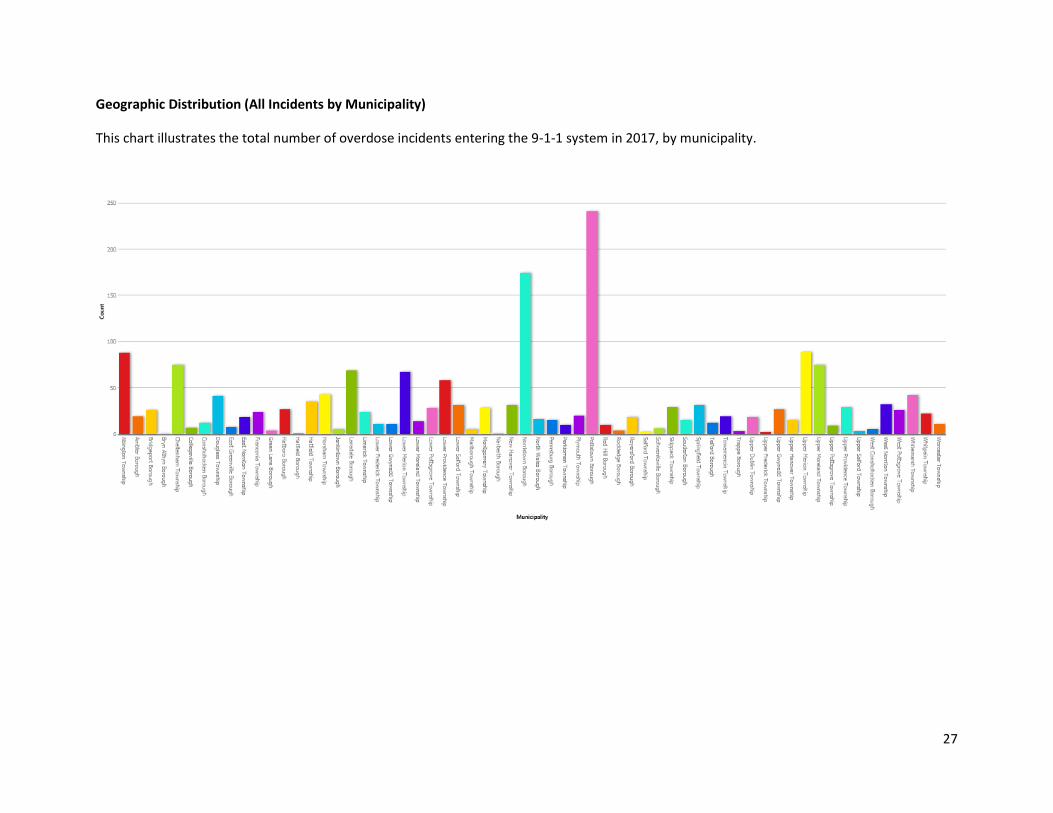
Geographic Distribution (All Incidents by Municipality)
This chart illustrates the total number of overdose incidents entering the 9-1-1 system in 2017, by municipality.
Page 28
28
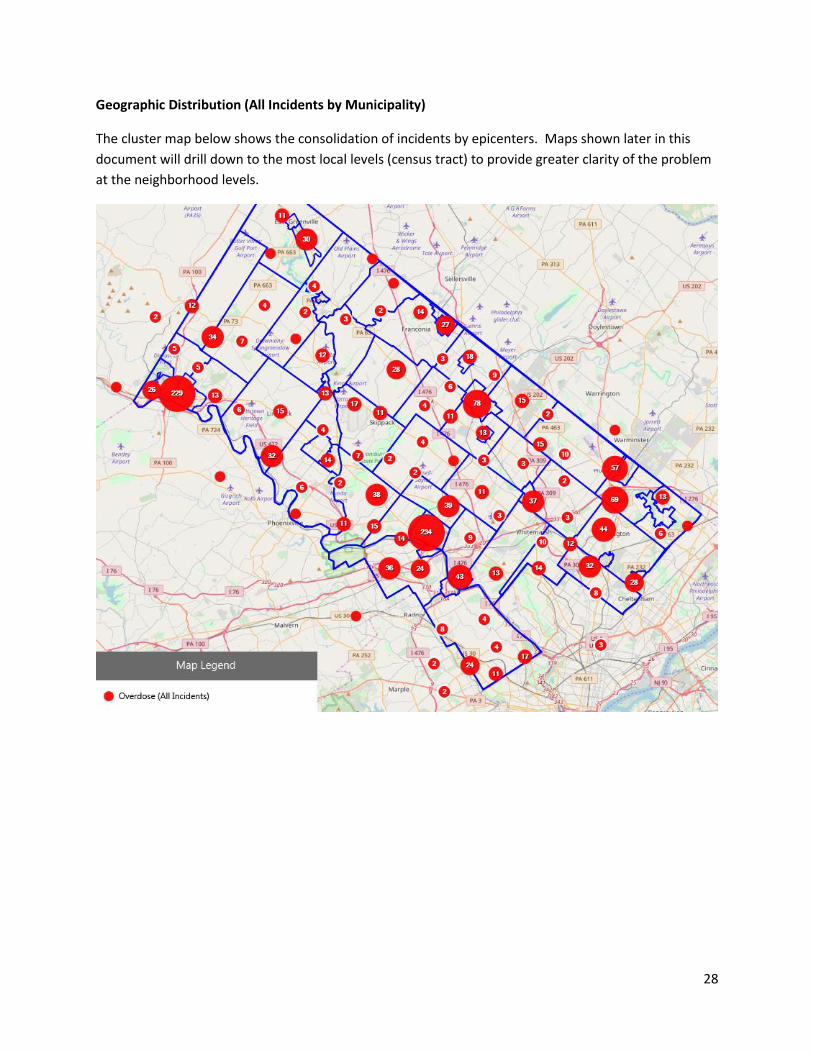
Geographic Distribution (All Incidents by Municipality)
The cluster map below shows the consolidation of incidents by epicenters. Maps shown later in this
document will drill down to the most local levels (census tract) to provide greater clarity of the problem
at the neighborhood levels.
Page 29
29
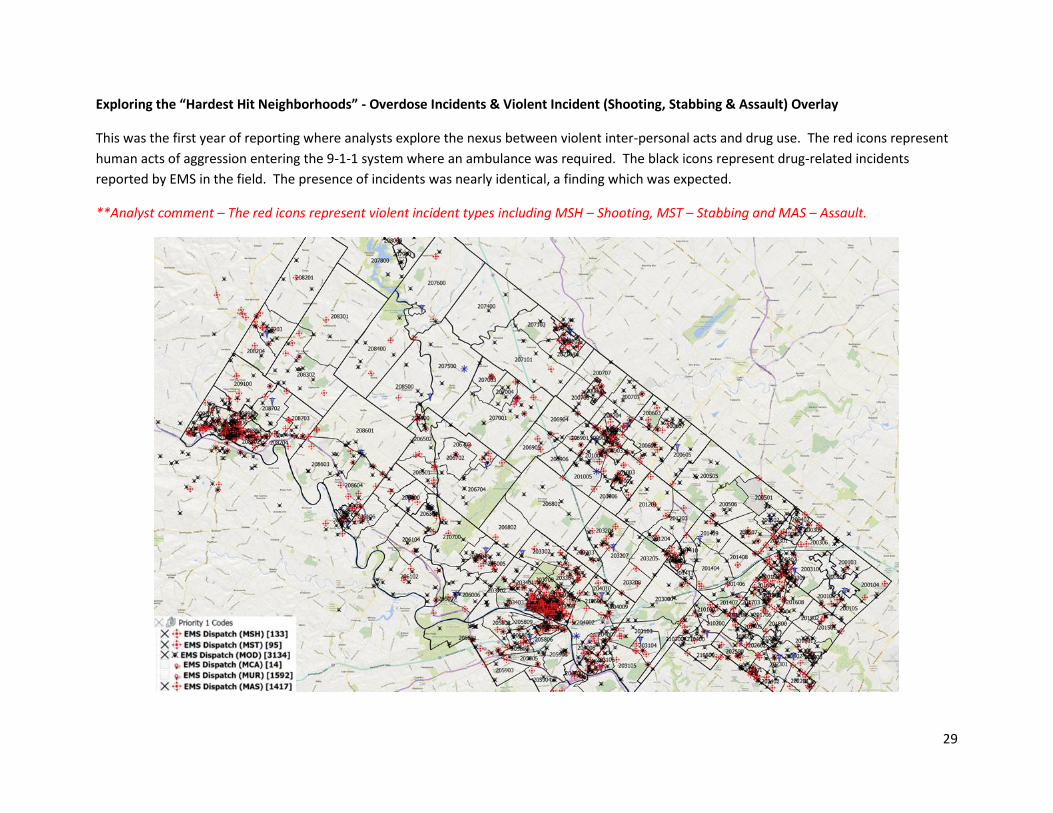
Exploring the “Hardest Hit Neighborhoods” - Overdose Incidents & Violent Incident (Shooting, Stabbing & Assault) Overlay
This was the first year of reporting where analysts explore the nexus between violent inter-personal acts and drug use. The red icons represent
human acts of aggression entering the 9-1-1 system where an ambulance was required. The black icons represent drug-related incidents
reported by EMS in the field. The presence of incidents was nearly identical, a finding which was expected.
**Analyst comment – The red icons represent violent incident types including MSH – Shooting, MST – Stabbing and MAS – Assault.
Page 30
30
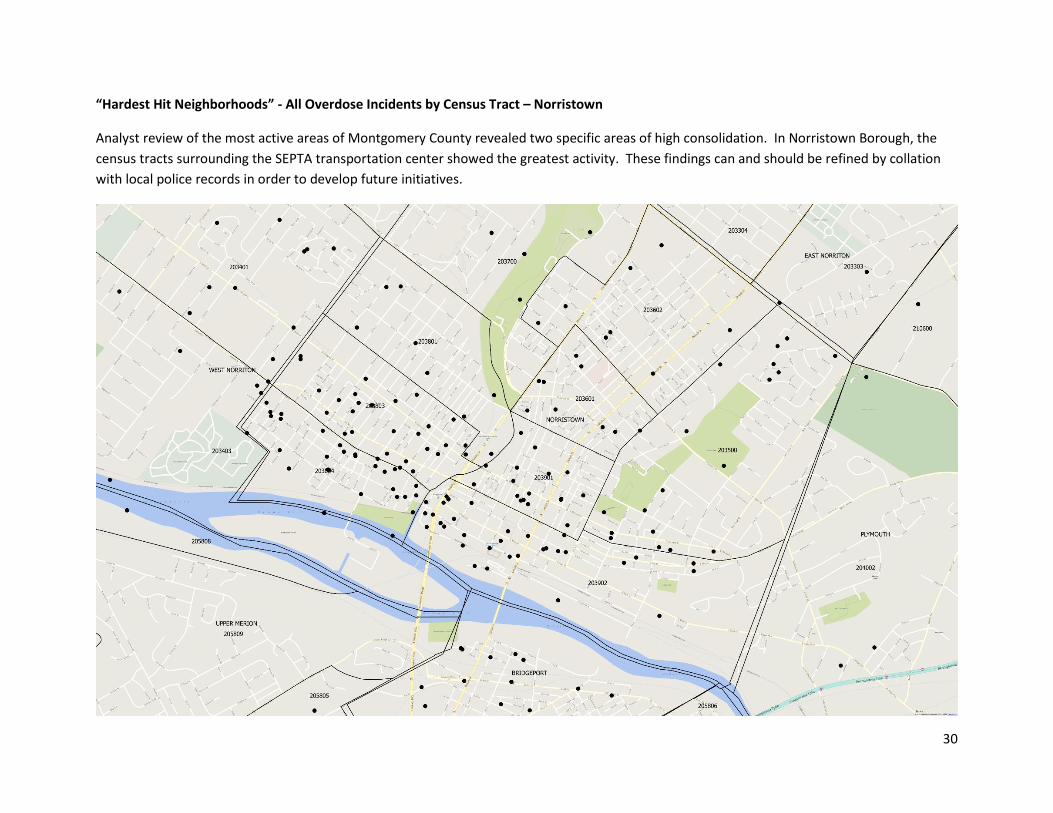
“Hardest Hit Neighborhoods” - All Overdose Incidents by Census Tract – Norristown
Analyst review of the most active areas of Montgomery County revealed two specific areas of high consolidation. In Norristown Borough, the
census tracts surrounding the SEPTA transportation center showed the greatest activity. These findings can and should be refined by collation
with local police records in order to develop future initiatives.
Page 31
31
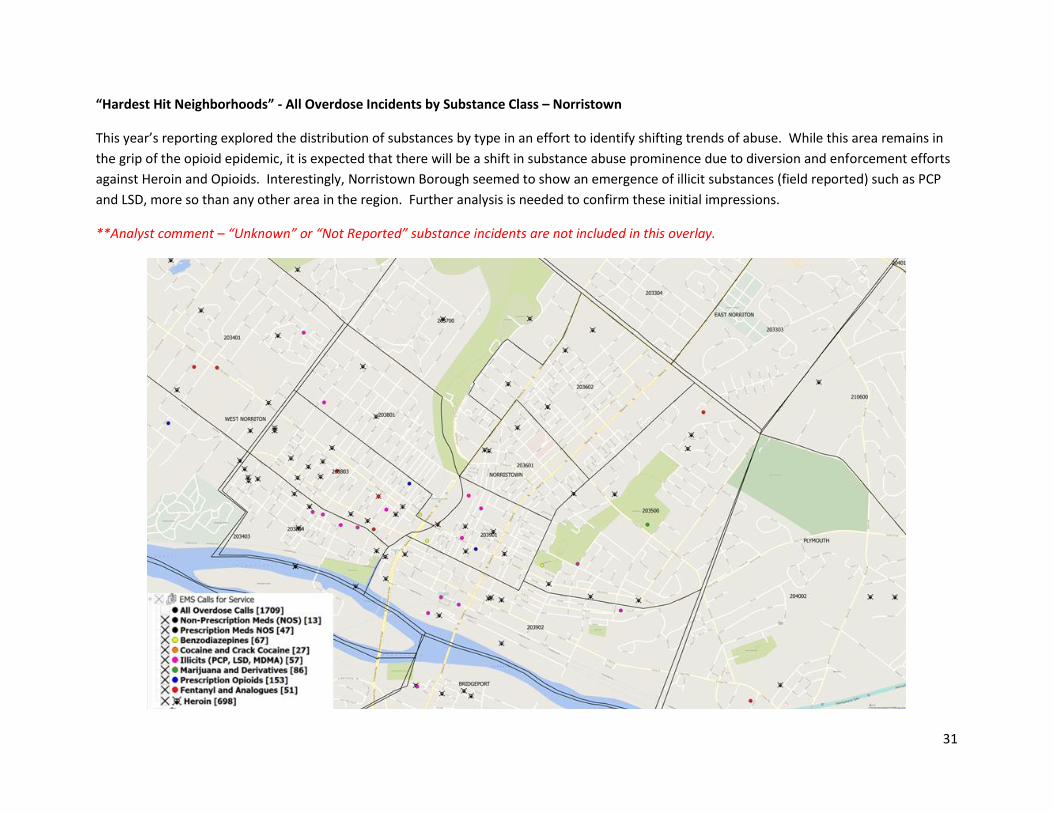
“Hardest Hit Neighborhoods” - All Overdose Incidents by Substance Class – Norristown
This year’s reporting explored the distribution of substances by type in an effort to identify shifting trends of abuse. While this area remains in
the grip of the opioid epidemic, it is expected that there will be a shift in substance abuse prominence due to diversion and enforcement efforts
against Heroin and Opioids. Interestingly, Norristown Borough seemed to show an emergence of illicit substances (field reported) such as PCP
and LSD, more so than any other area in the region. Further analysis is needed to confirm these initial impressions.
**Analyst comment – “Unknown” or “Not Reported” substance incidents are not included in this overlay.
Page 32
32
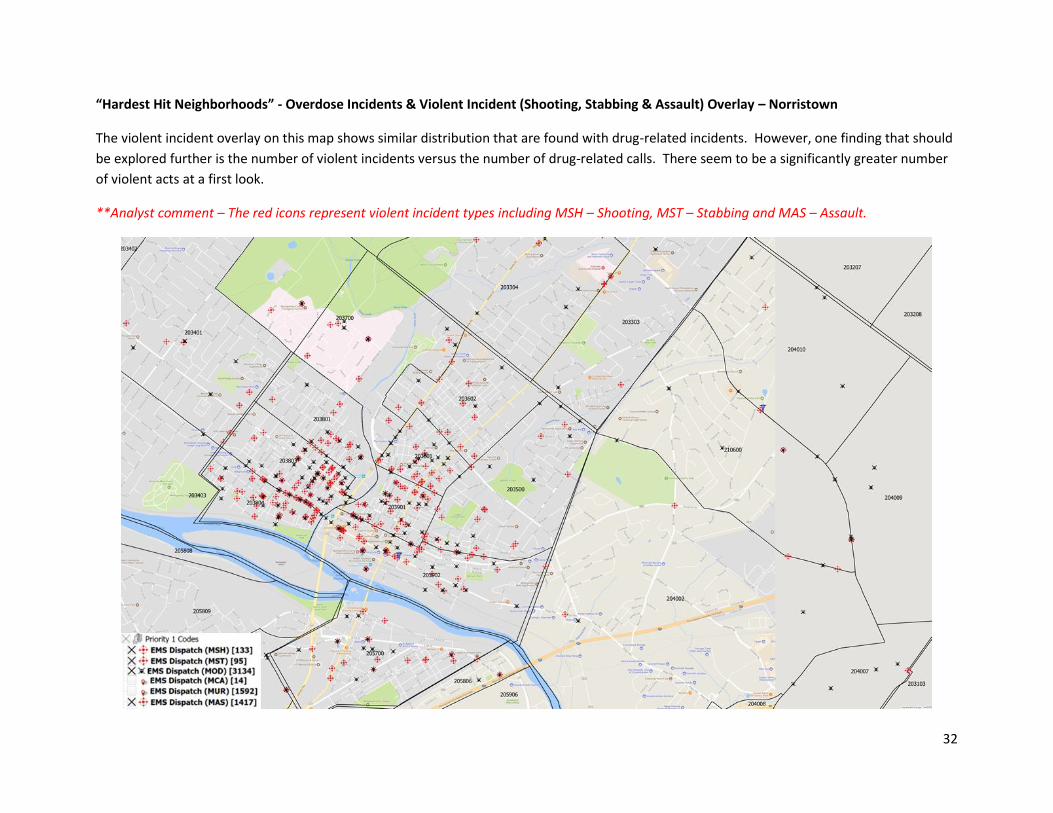
“Hardest Hit Neighborhoods” - Overdose Incidents & Violent Incident (Shooting, Stabbing & Assault) Overlay – Norristown
The violent incident overlay on this map shows similar distribution that are found with drug-related incidents. However, one finding that should
be explored further is the number of violent incidents versus the number of drug-related calls. There seem to be a significantly greater number
of violent acts at a first look.
**Analyst comment – The red icons represent violent incident types including MSH – Shooting, MST – Stabbing and MAS – Assault.
Page 33
33
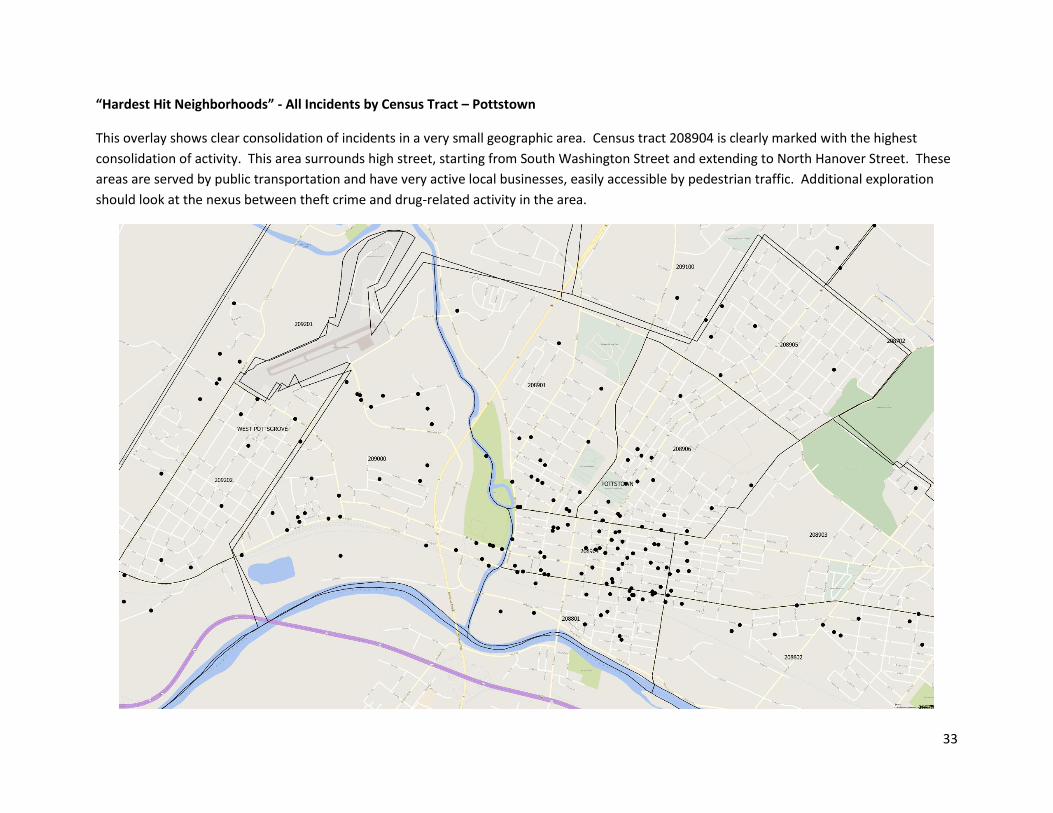
“Hardest Hit Neighborhoods” - All Incidents by Census Tract – Pottstown
This overlay shows clear consolidation of incidents in a very small geographic area. Census tract 208904 is clearly marked with the highest
consolidation of activity. This area surrounds high street, starting from South Washington Street and extending to North Hanover Street. These
areas are served by public transportation and have very active local businesses, easily accessible by pedestrian traffic. Additional exploration
should look at the nexus between theft crime and drug-related activity in the area.
Page 34
34
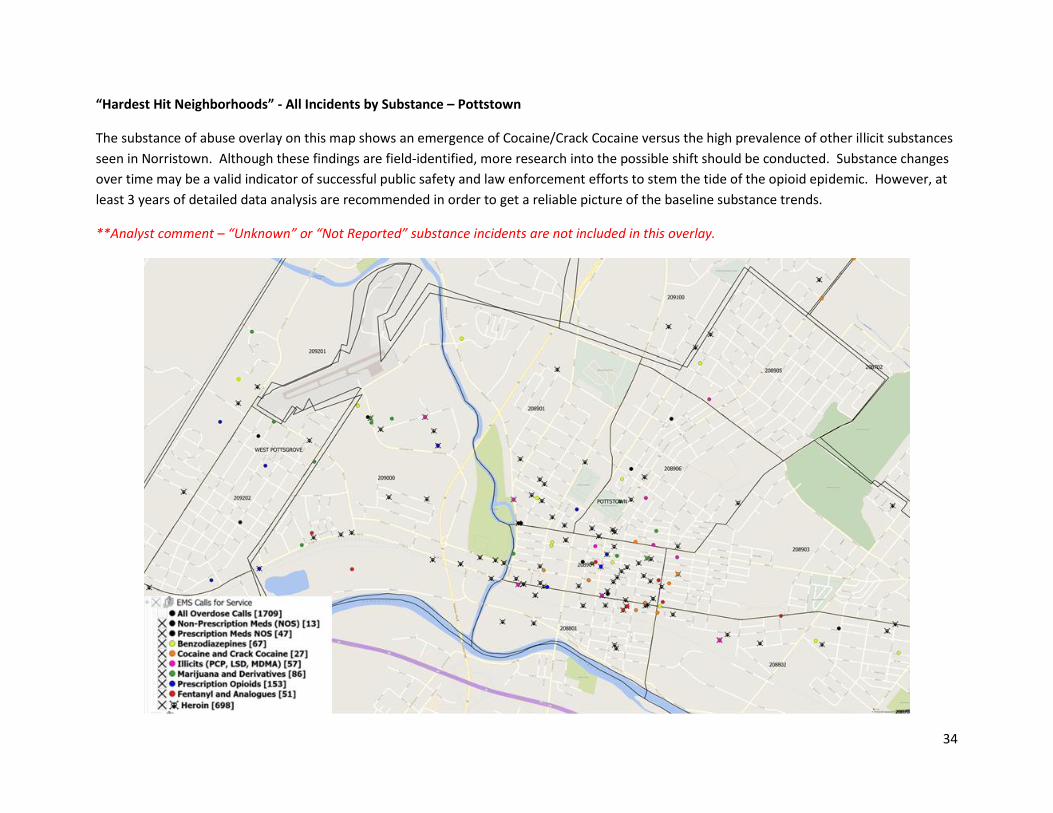
“Hardest Hit Neighborhoods” - All Incidents by Substance – Pottstown
The substance of abuse overlay on this map shows an emergence of Cocaine/Crack Cocaine versus the high prevalence of other illicit substances
seen in Norristown. Although these findings are field-identified, more research into the possible shift should be conducted. Substance changes
over time may be a valid indicator of successful public safety and law enforcement efforts to stem the tide of the opioid epidemic. However, at
least 3 years of detailed data analysis are recommended in order to get a reliable picture of the baseline substance trends.
**Analyst comment – “Unknown” or “Not Reported” substance incidents are not included in this overlay.
Page 35
35
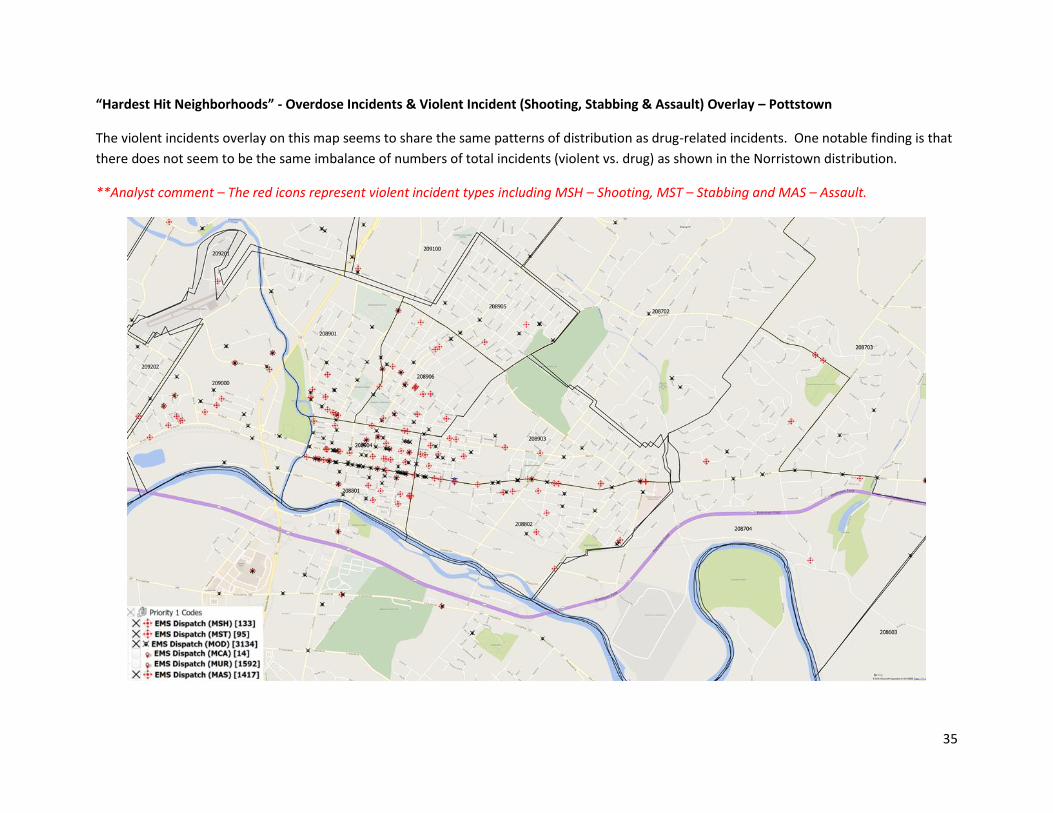
“Hardest Hit Neighborhoods” - Overdose Incidents & Violent Incident (Shooting, Stabbing & Assault) Overlay – Pottstown
The violent incidents overlay on this map seems to share the same patterns of distribution as drug-related incidents. One notable finding is that
there does not seem to be the same imbalance of numbers of total incidents (violent vs. drug) as shown in the Norristown distribution.
**Analyst comment – The red icons represent violent incident types including MSH – Shooting, MST – Stabbing and MAS – Assault.
Page 36
36
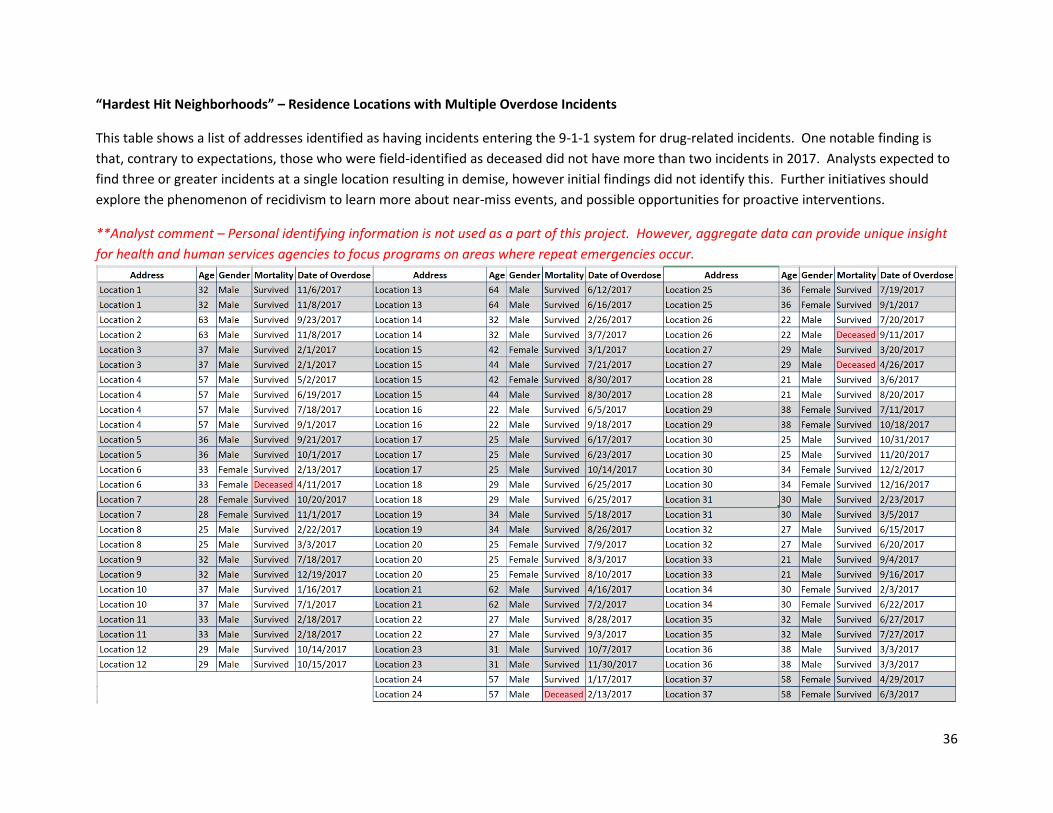
“Hardest Hit Neighborhoods” – Residence Locations with Multiple Overdose Incidents
This table shows a list of addresses identified as having incidents entering the 9-1-1 system for drug-related incidents. One notable finding is
that, contrary to expectations, those who were field-identified as deceased did not have more than two incidents in 2017. Analysts expected to
find three or greater incidents at a single location resulting in demise, however initial findings did not identify this. Further initiatives should
explore the phenomenon of recidivism to learn more about near-miss events, and possible opportunities for proactive interventions.
**Analyst comment – Personal identifying information is not used as a part of this project. However, aggregate data can provide unique insight
for health and human services agencies to focus programs on areas where repeat emergencies occur.
Page 37
37
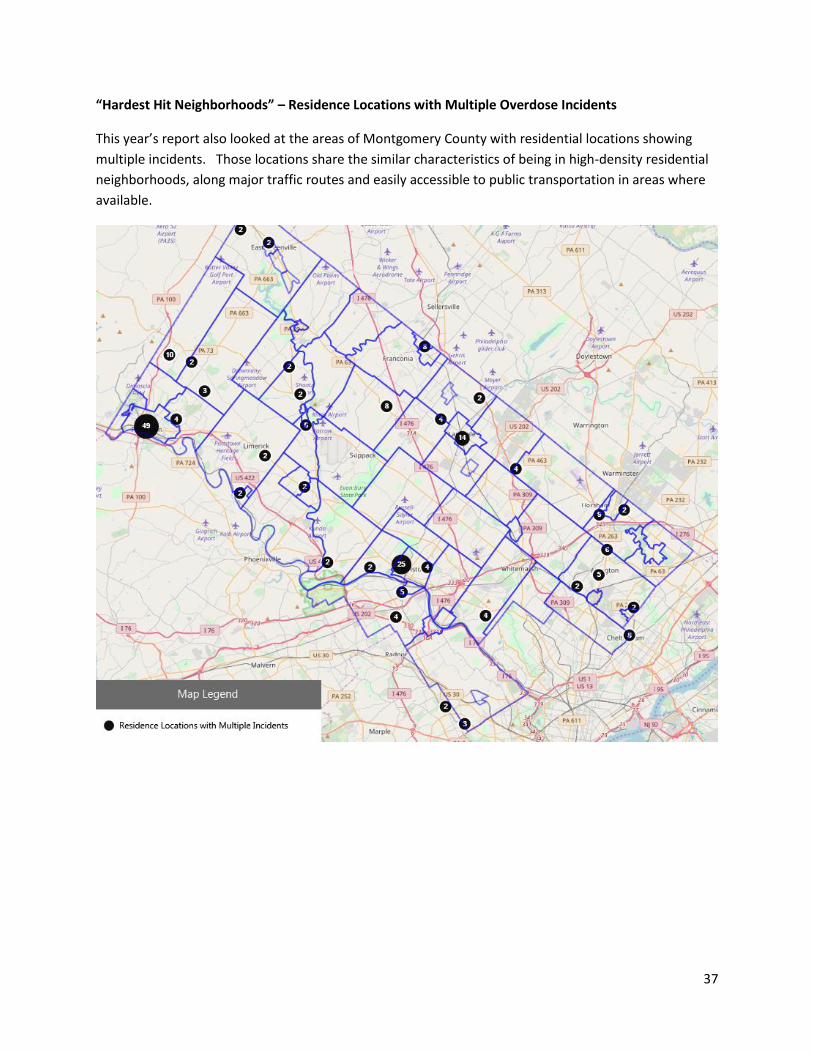
“Hardest Hit Neighborhoods” – Residence Locations with Multiple Overdose Incidents
This year’s report also looked at the areas of Montgomery County with residential locations showing
multiple incidents. Those locations share the similar characteristics of being in high-density residential
neighborhoods, along major traffic routes and easily accessible to public transportation in areas where
available.
Page 38
38
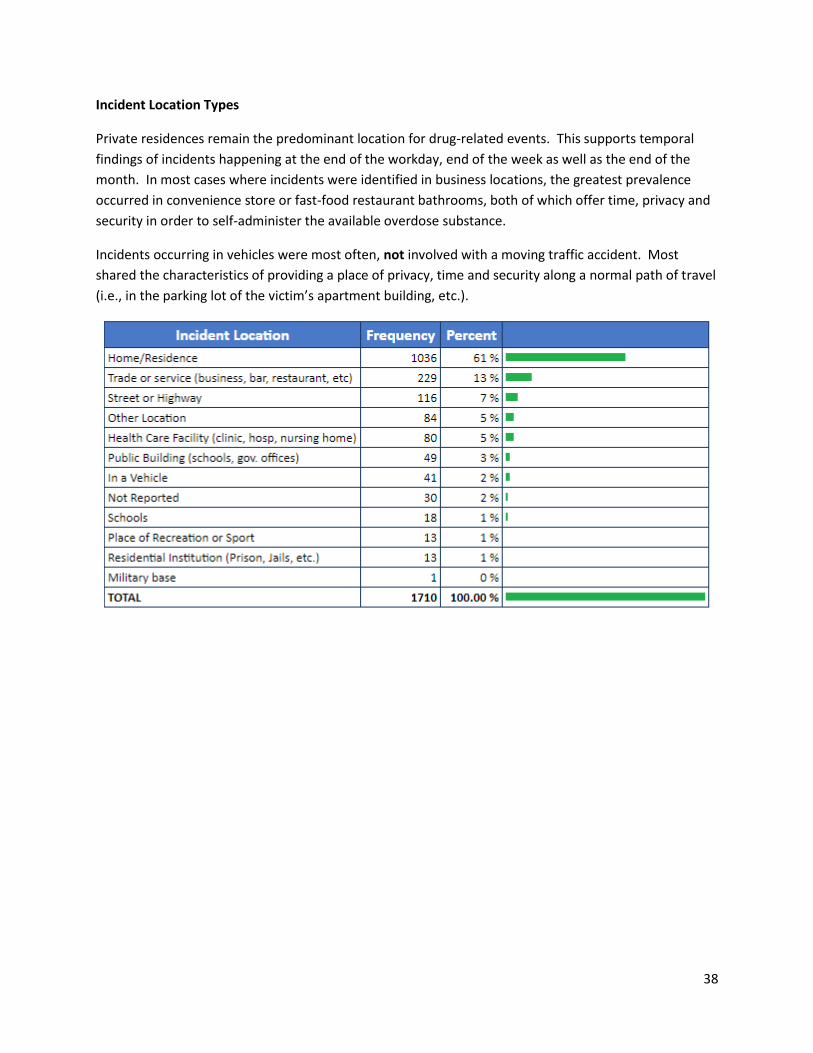
Incident Location Types
Private residences remain the predominant location for drug-related events. This supports temporal
findings of incidents happening at the end of the workday, end of the week as well as the end of the
month. In most cases where incidents were identified in business locations, the greatest prevalence
occurred in convenience store or fast-food restaurant bathrooms, both of which offer time, privacy and
security in order to self-administer the available overdose substance.
Incidents occurring in vehicles were most often, not involved with a moving traffic accident. Most
shared the characteristics of providing a place of privacy, time and security along a normal path of travel
(i.e., in the parking lot of the victim’s apartment building, etc.).
Page 39
39
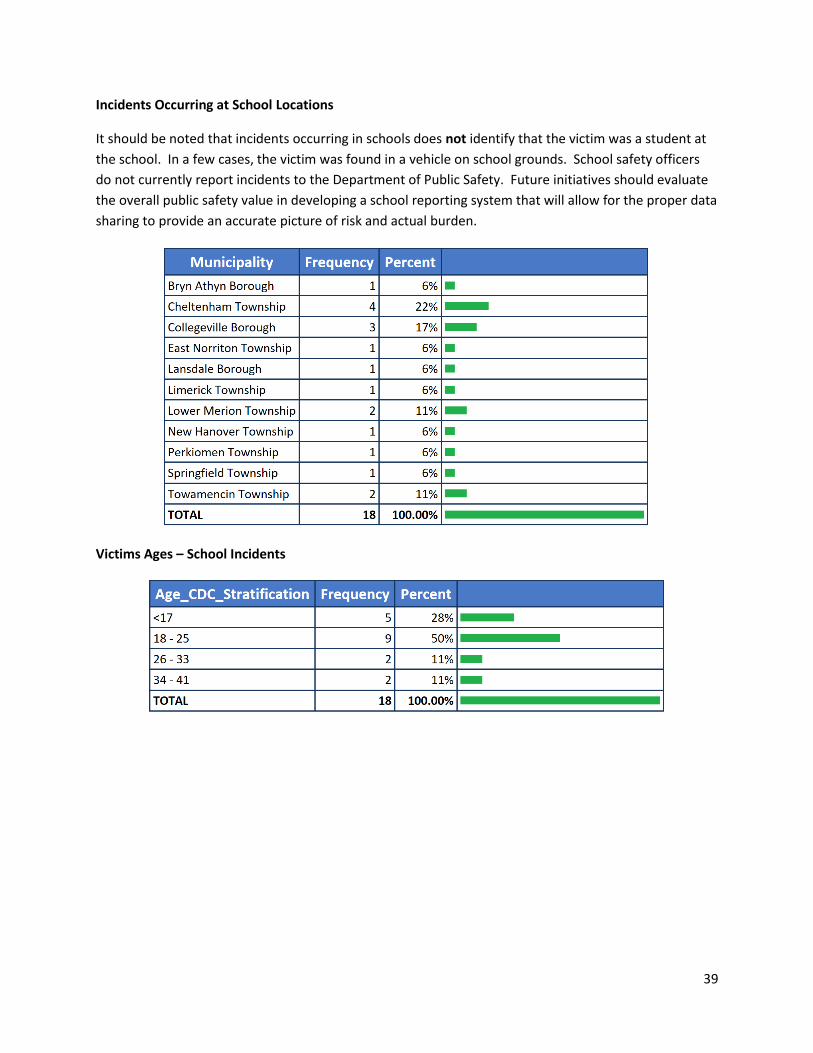
Incidents Occurring at School Locations
It should be noted that incidents occurring in schools does not identify that the victim was a student at
the school. In a few cases, the victim was found in a vehicle on school grounds. School safety officers
do not currently report incidents to the Department of Public Safety. Future initiatives should evaluate
the overall public safety value in developing a school reporting system that will allow for the proper data
sharing to provide an accurate picture of risk and actual burden.
Victims Ages – School Incidents
Page 40
40
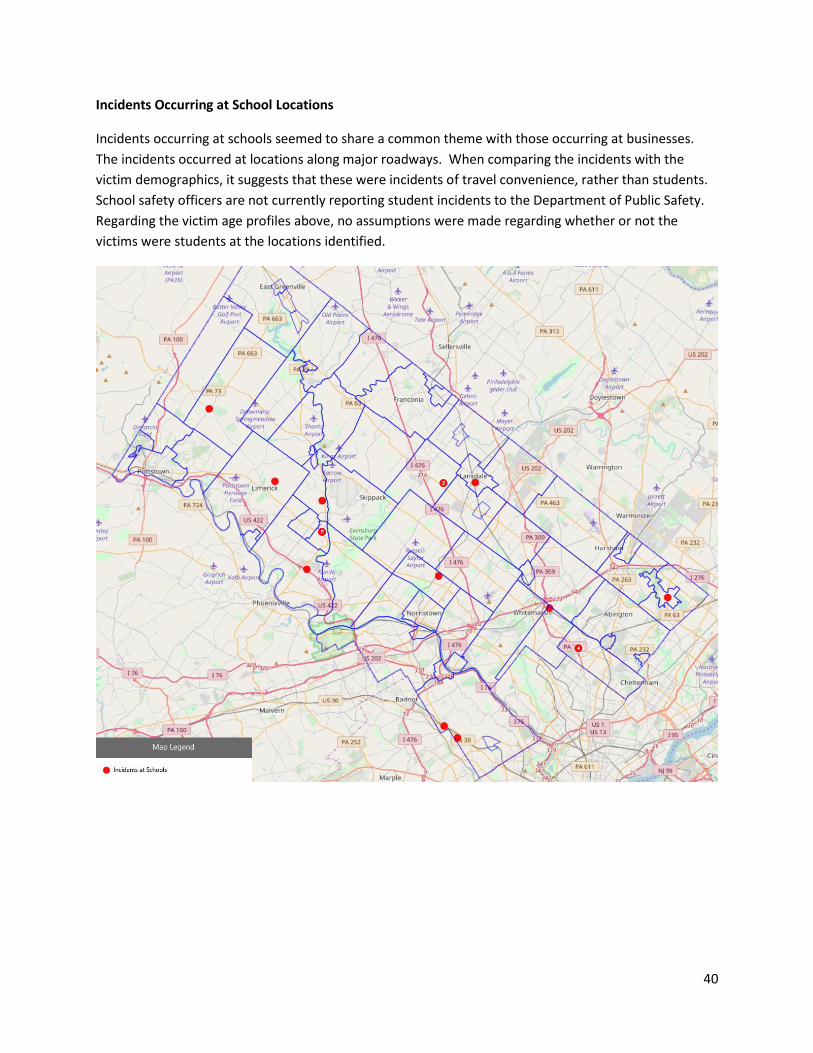
Incidents Occurring at School Locations
Incidents occurring at schools seemed to share a common theme with those occurring at businesses.
The incidents occurred at locations along major roadways. When comparing the incidents with the
victim demographics, it suggests that these were incidents of travel convenience, rather than students.
School safety officers are not currently reporting student incidents to the Department of Public Safety.
Regarding the victim age profiles above, no assumptions were made regarding whether or not the
victims were students at the locations identified.
Page 41
41
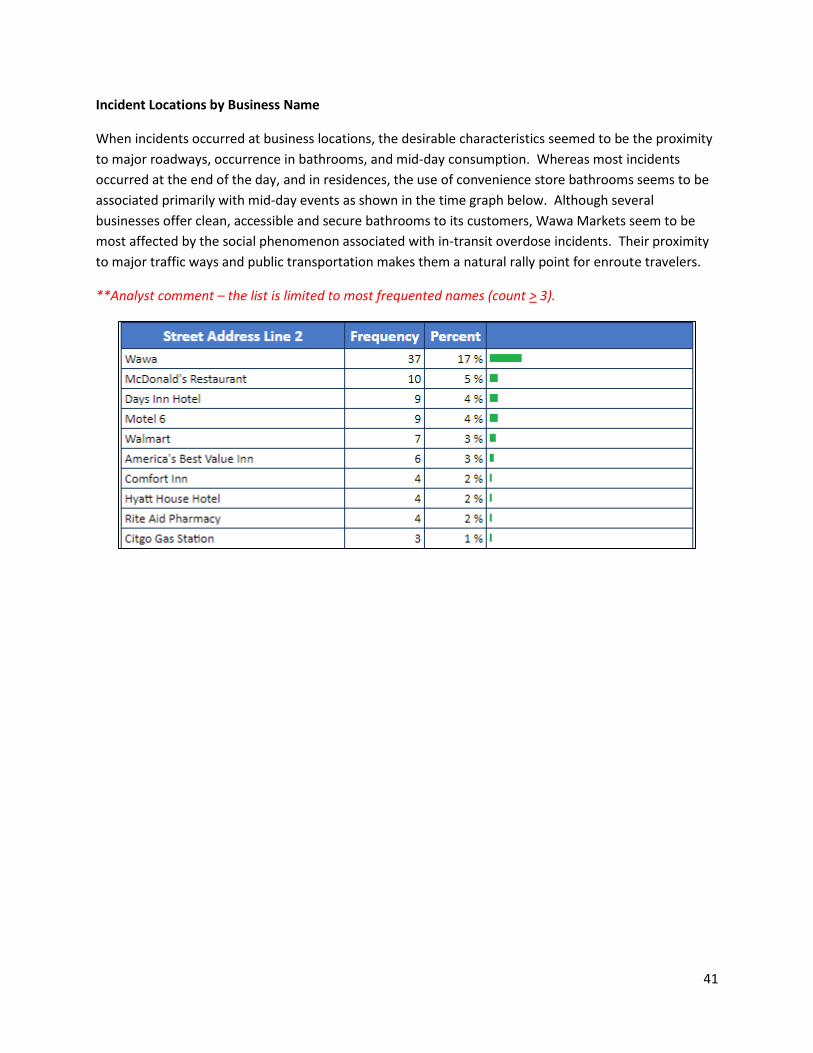
Incident Locations by Business Name
When incidents occurred at business locations, the desirable characteristics seemed to be the proximity
to major roadways, occurrence in bathrooms, and mid-day consumption. Whereas most incidents
occurred at the end of the day, and in residences, the use of convenience store bathrooms seems to be
associated primarily with mid-day events as shown in the time graph below. Although several
businesses offer clean, accessible and secure bathrooms to its customers, Wawa Markets seem to be
most affected by the social phenomenon associated with in-transit overdose incidents. Their proximity
to major traffic ways and public transportation makes them a natural rally point for enroute travelers.
**Analyst comment – the list is limited to most frequented names (count > 3).
Page 42
42
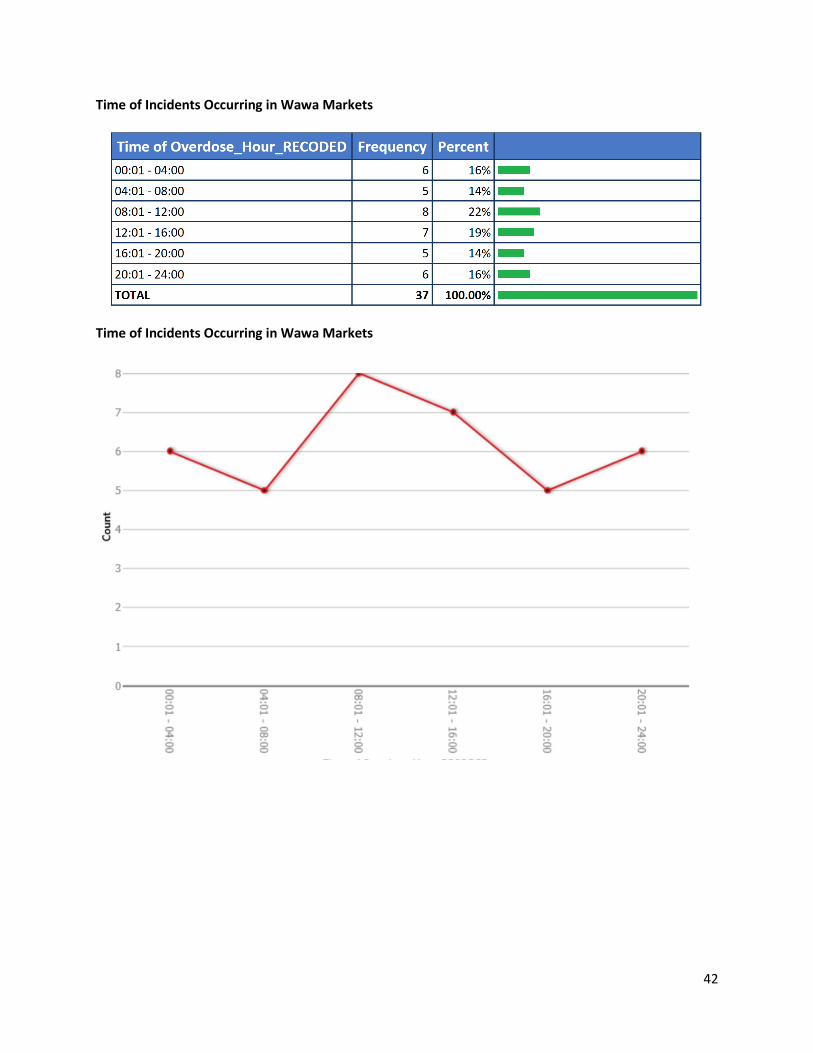
Time of Incidents Occurring in Wawa Markets
Time of Incidents Occurring in Wawa Markets
Page 43
43
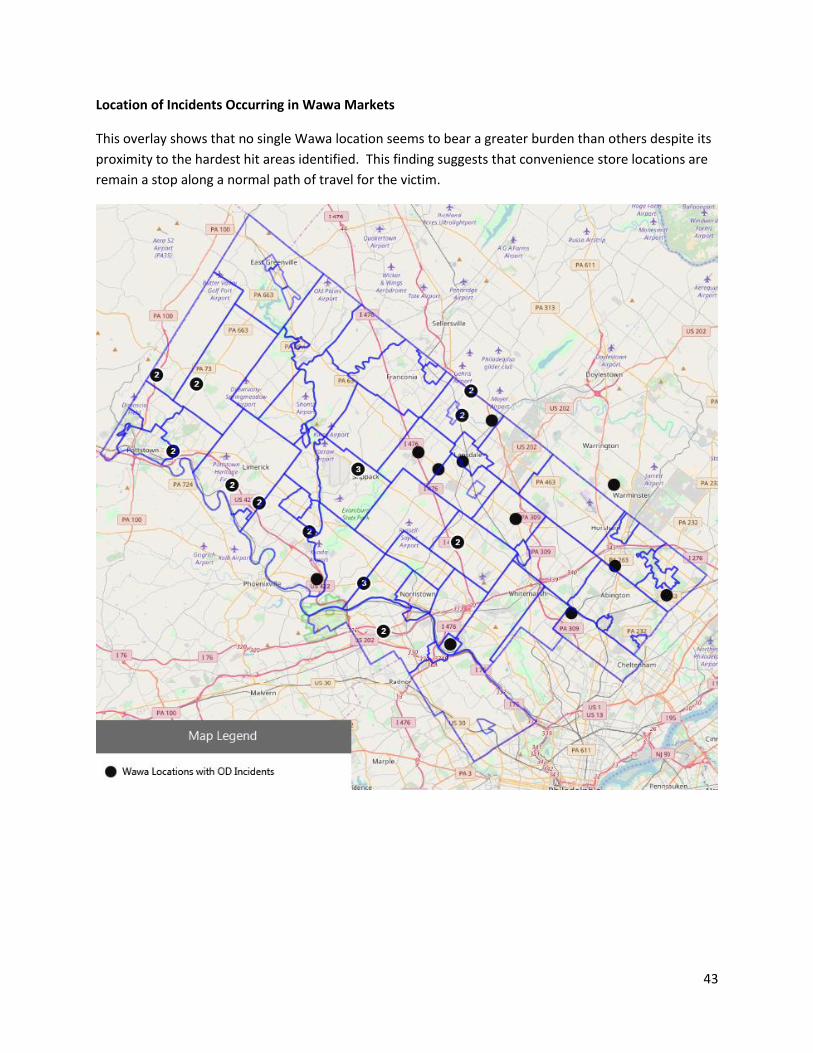
Location of Incidents Occurring in Wawa Markets
This overlay shows that no single Wawa location seems to bear a greater burden than others despite its
proximity to the hardest hit areas identified. This finding suggests that convenience store locations are
remain a stop along a normal path of travel for the victim.
Page 44
44
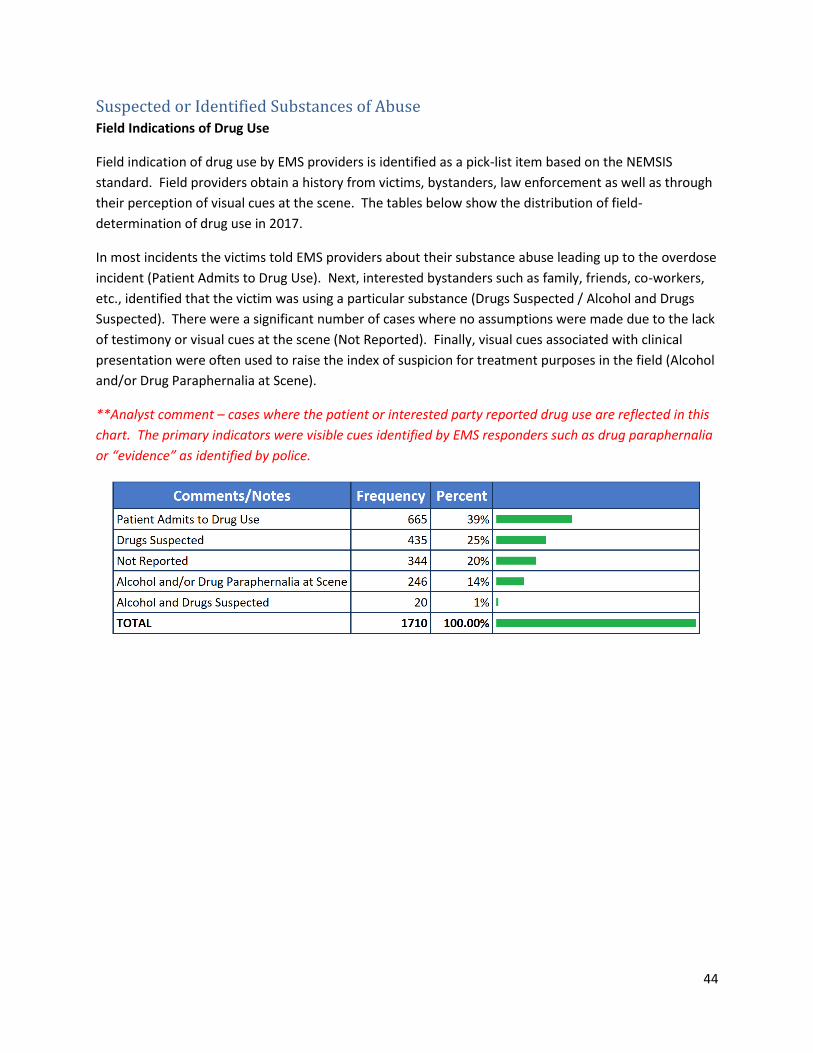
Suspected or Identified Substances of Abuse Field Indications of Drug Use
Field indication of drug use by EMS providers is identified as a pick-list item based on the NEMSIS
standard. Field providers obtain a history from victims, bystanders, law enforcement as well as through
their perception of visual cues at the scene. The tables below show the distribution of field-
determination of drug use in 2017.
In most incidents the victims told EMS providers about their substance abuse leading up to the overdose
incident (Patient Admits to Drug Use). Next, interested bystanders such as family, friends, co-workers,
etc., identified that the victim was using a particular substance (Drugs Suspected / Alcohol and Drugs
Suspected). There were a significant number of cases where no assumptions were made due to the lack
of testimony or visual cues at the scene (Not Reported). Finally, visual cues associated with clinical
presentation were often used to raise the index of suspicion for treatment purposes in the field (Alcohol
and/or Drug Paraphernalia at Scene).
**Analyst comment – cases where the patient or interested party reported drug use are reflected in this
chart. The primary indicators were visible cues identified by EMS responders such as drug paraphernalia
or “evidence” as identified by police.
Page 45
45
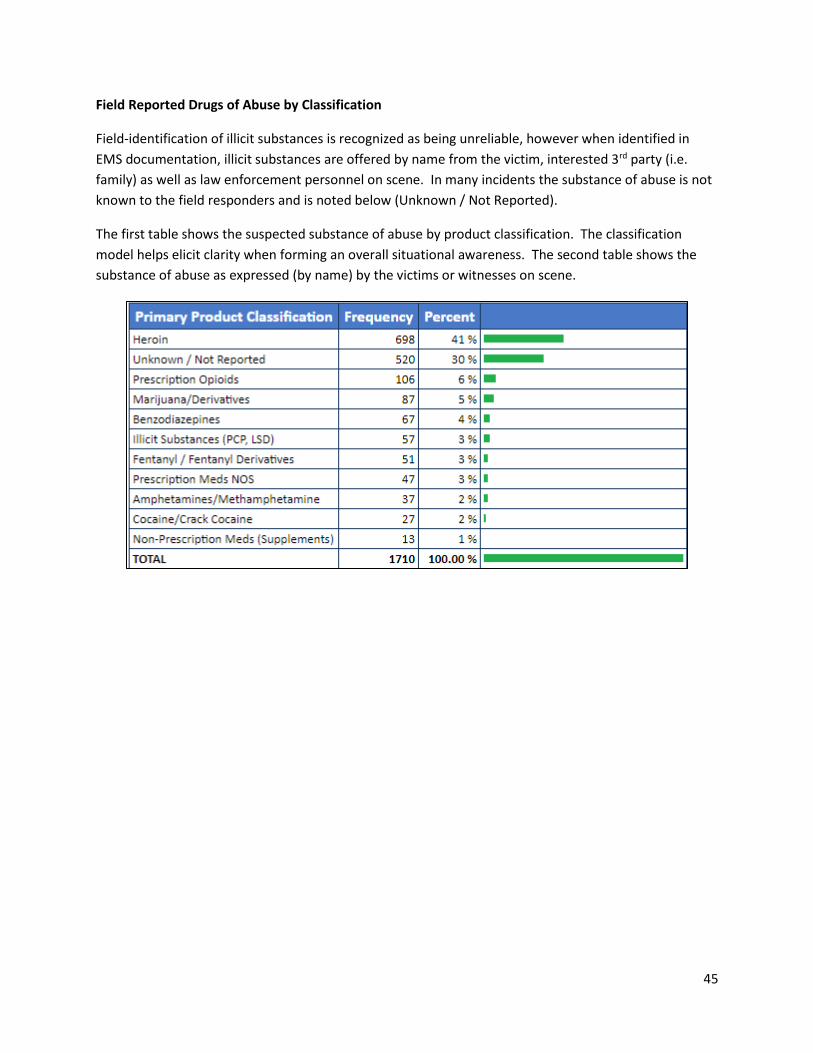
Field Reported Drugs of Abuse by Classification
Field-identification of illicit substances is recognized as being unreliable, however when identified in
EMS documentation, illicit substances are offered by name from the victim, interested 3rd party (i.e.
family) as well as law enforcement personnel on scene. In many incidents the substance of abuse is not
known to the field responders and is noted below (Unknown / Not Reported).
The first table shows the suspected substance of abuse by product classification. The classification
model helps elicit clarity when forming an overall situational awareness. The second table shows the
substance of abuse as expressed (by name) by the victims or witnesses on scene.
Page 46
46
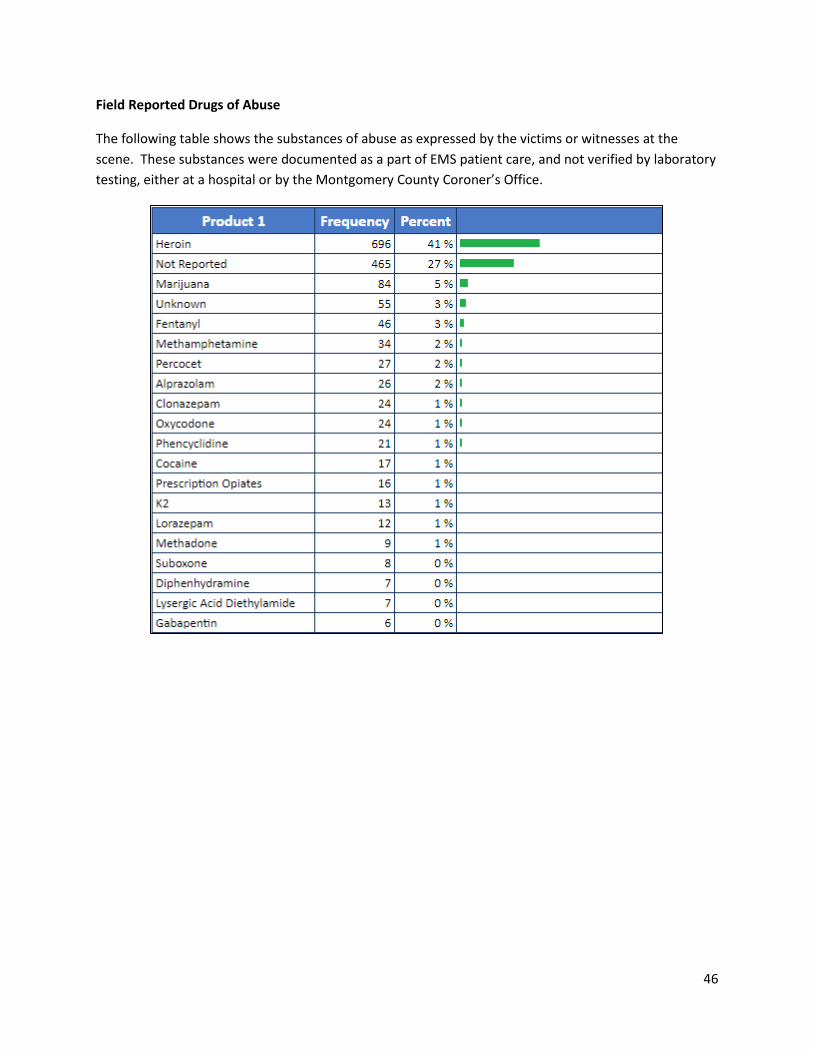
Field Reported Drugs of Abuse
The following table shows the substances of abuse as expressed by the victims or witnesses at the
scene. These substances were documented as a part of EMS patient care, and not verified by laboratory
testing, either at a hospital or by the Montgomery County Coroner’s Office.
Page 47
47
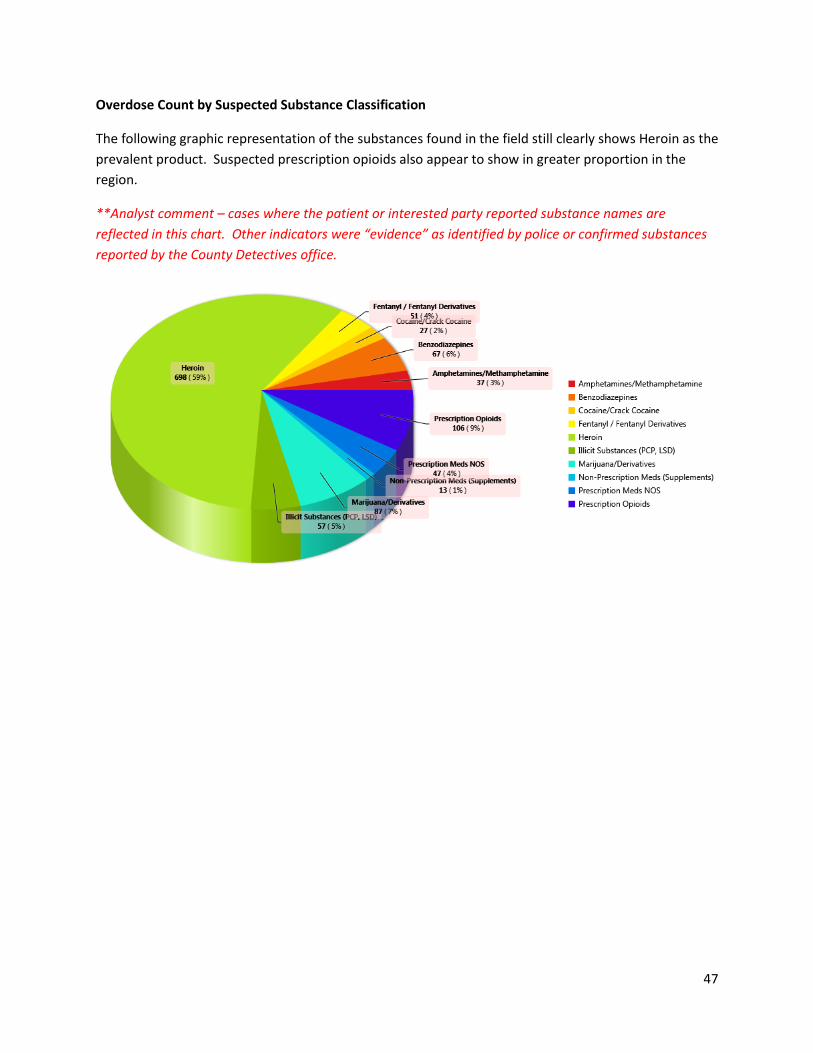
Overdose Count by Suspected Substance Classification
The following graphic representation of the substances found in the field still clearly shows Heroin as the
prevalent product. Suspected prescription opioids also appear to show in greater proportion in the
region.
**Analyst comment – cases where the patient or interested party reported substance names are
reflected in this chart. Other indicators were “evidence” as identified by police or confirmed substances
reported by the County Detectives office.
Page 48
48
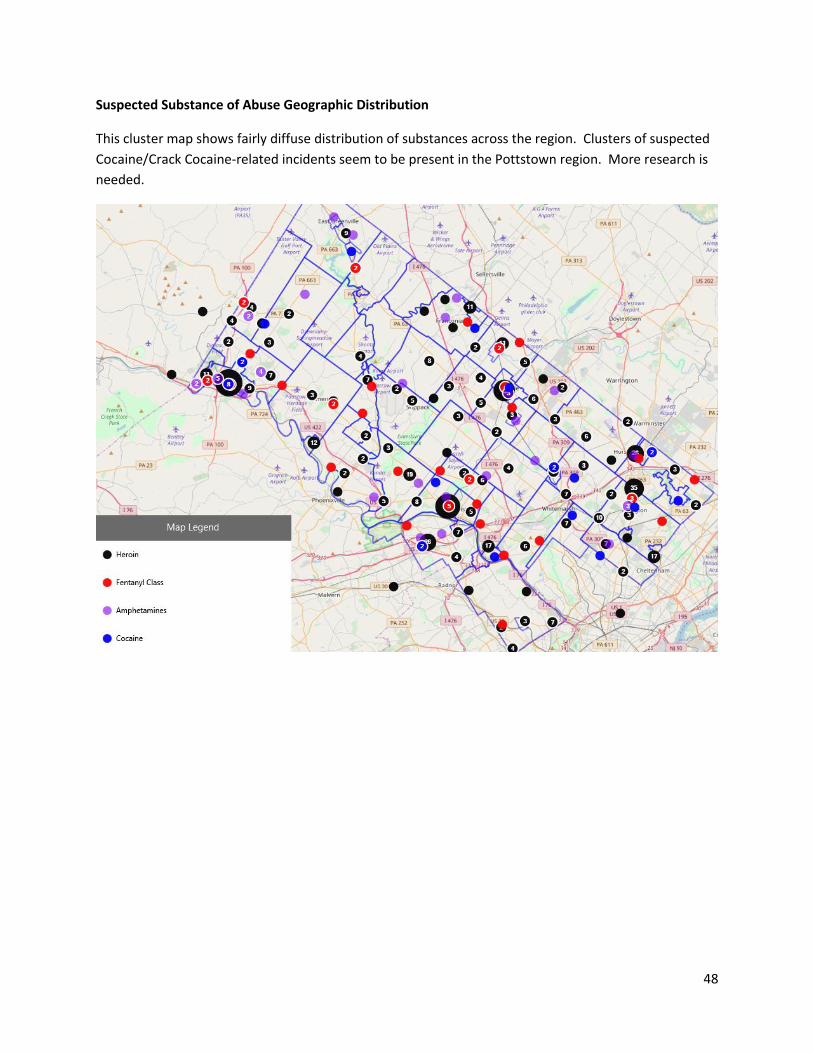
Suspected Substance of Abuse Geographic Distribution
This cluster map shows fairly diffuse distribution of substances across the region. Clusters of suspected
Cocaine/Crack Cocaine-related incidents seem to be present in the Pottstown region. More research is
needed.
Page 49
49
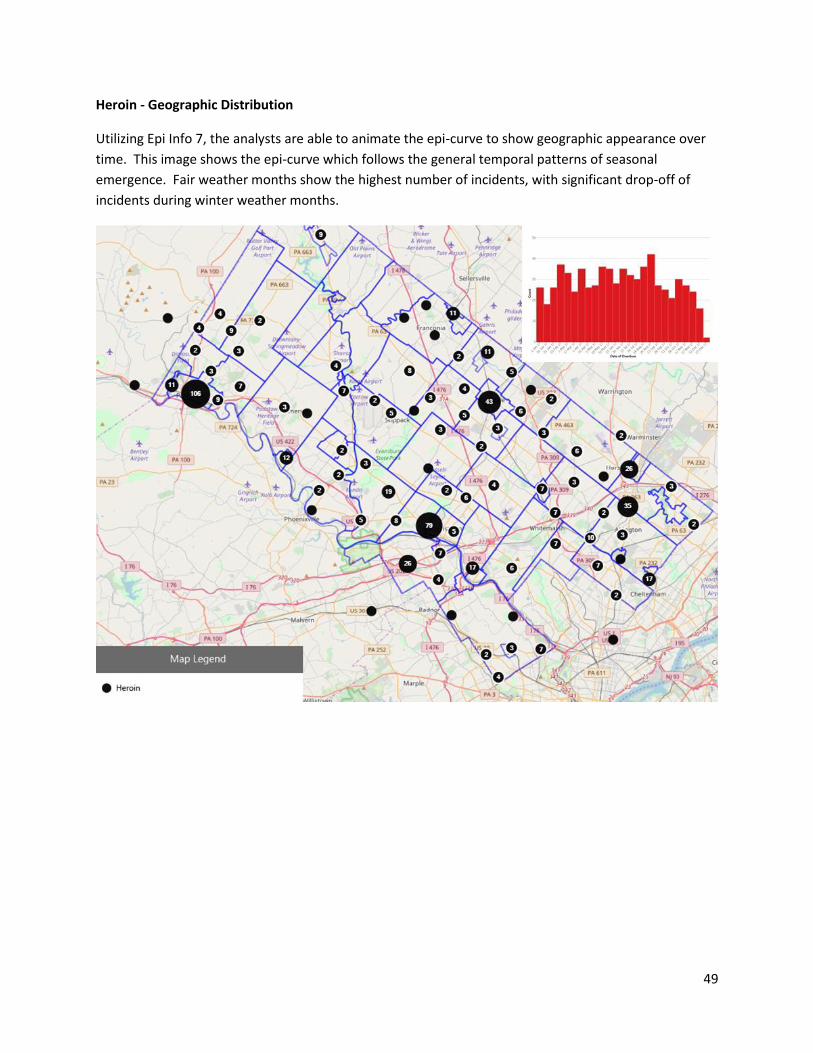
Heroin - Geographic Distribution
Utilizing Epi Info 7, the analysts are able to animate the epi-curve to show geographic appearance over
time. This image shows the epi-curve which follows the general temporal patterns of seasonal
emergence. Fair weather months show the highest number of incidents, with significant drop-off of
incidents during winter weather months.
Page 50
50
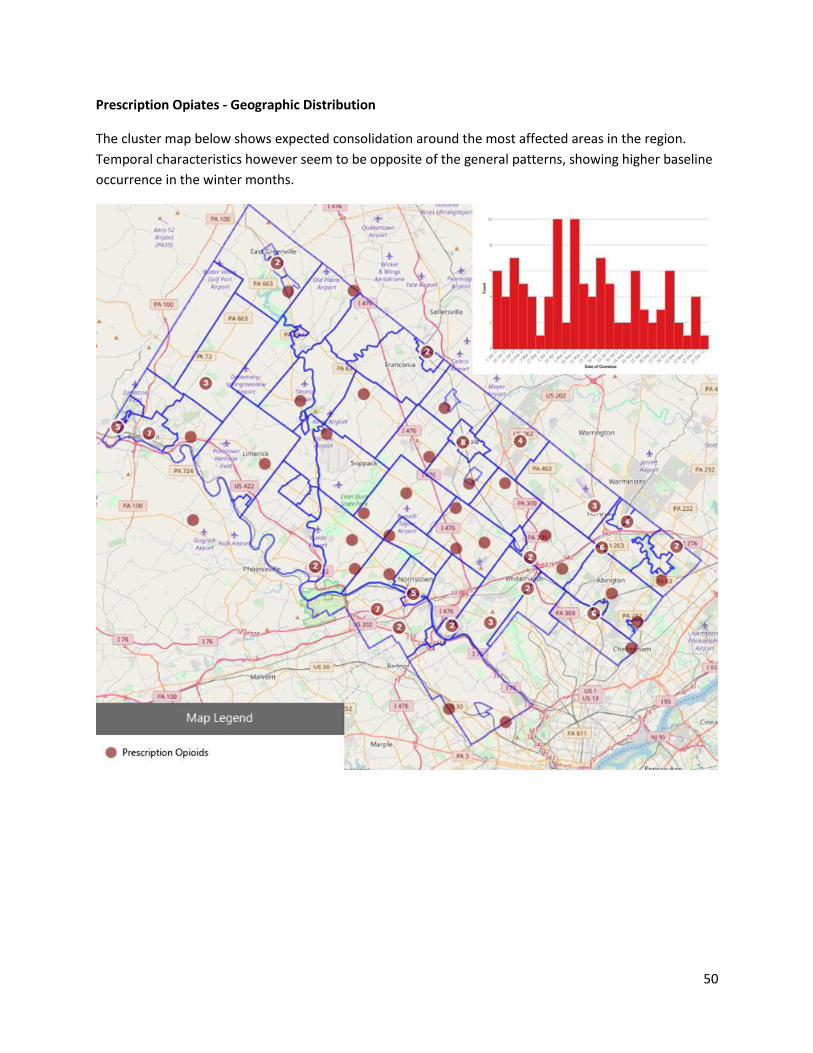
Prescription Opiates - Geographic Distribution
The cluster map below shows expected consolidation around the most affected areas in the region.
Temporal characteristics however seem to be opposite of the general patterns, showing higher baseline
occurrence in the winter months.
Page 51
51
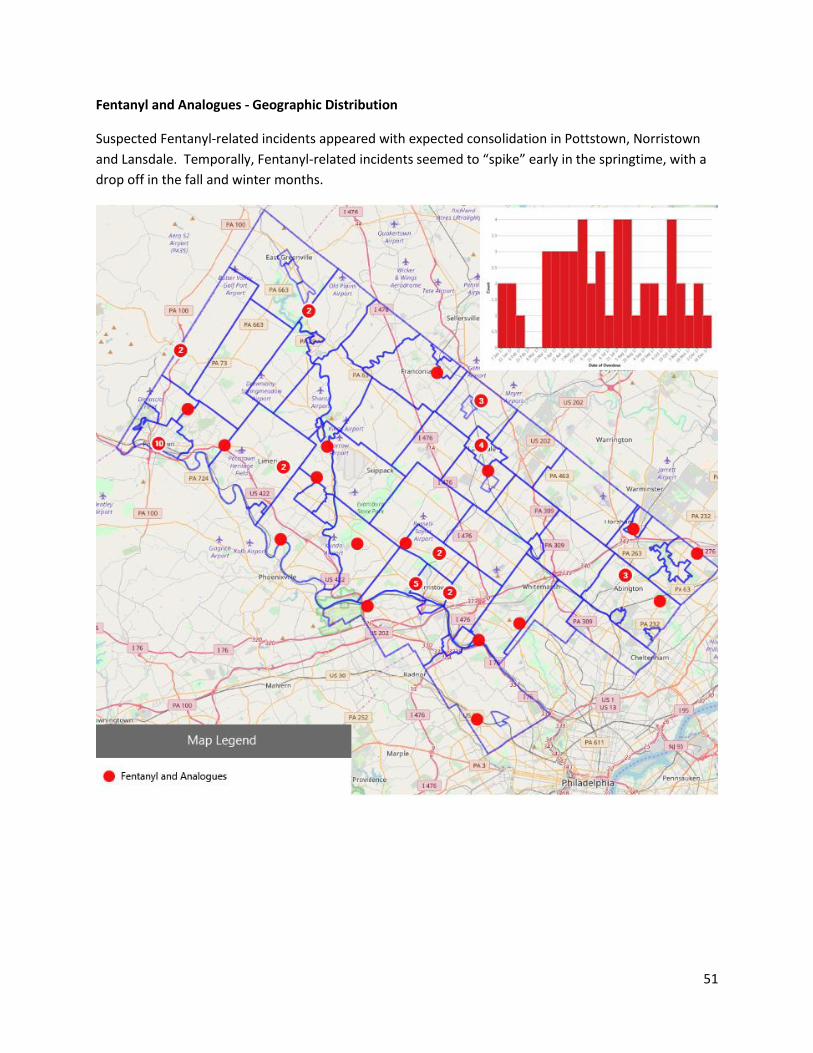
Fentanyl and Analogues - Geographic Distribution
Suspected Fentanyl-related incidents appeared with expected consolidation in Pottstown, Norristown
and Lansdale. Temporally, Fentanyl-related incidents seemed to “spike” early in the springtime, with a
drop off in the fall and winter months.
Page 52
52
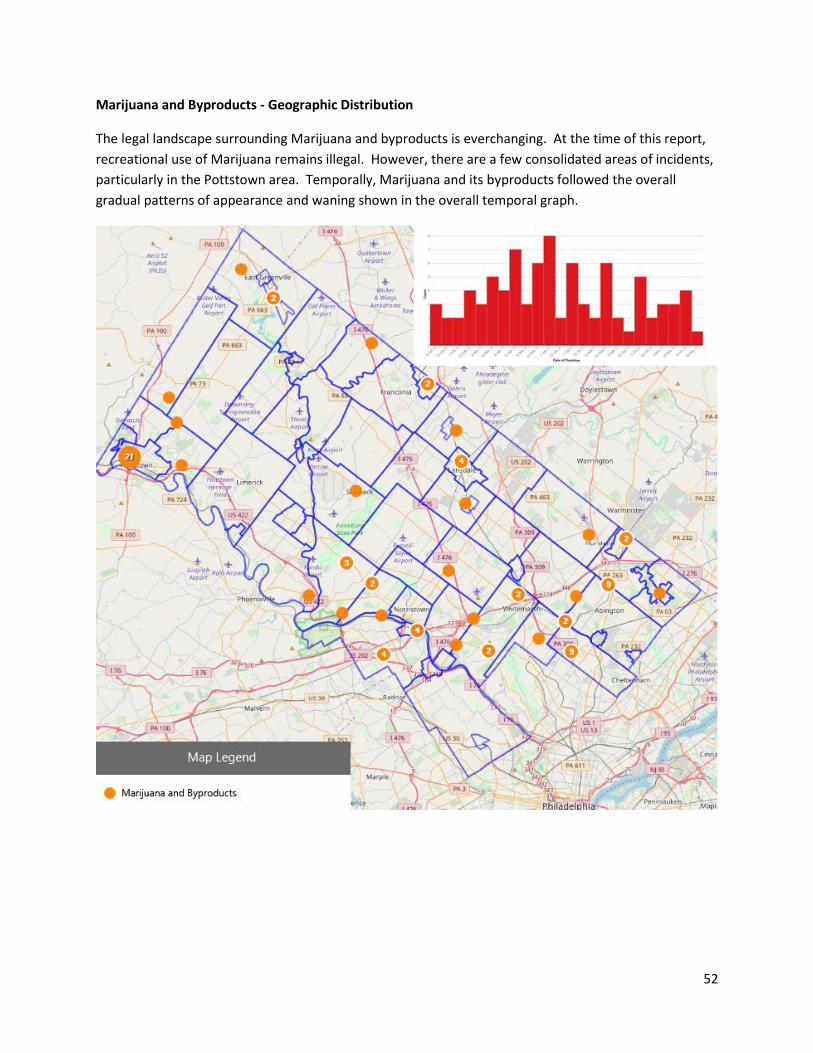
Marijuana and Byproducts - Geographic Distribution
The legal landscape surrounding Marijuana and byproducts is everchanging. At the time of this report,
recreational use of Marijuana remains illegal. However, there are a few consolidated areas of incidents,
particularly in the Pottstown area. Temporally, Marijuana and its byproducts followed the overall
gradual patterns of appearance and waning shown in the overall temporal graph.
Page 53
53
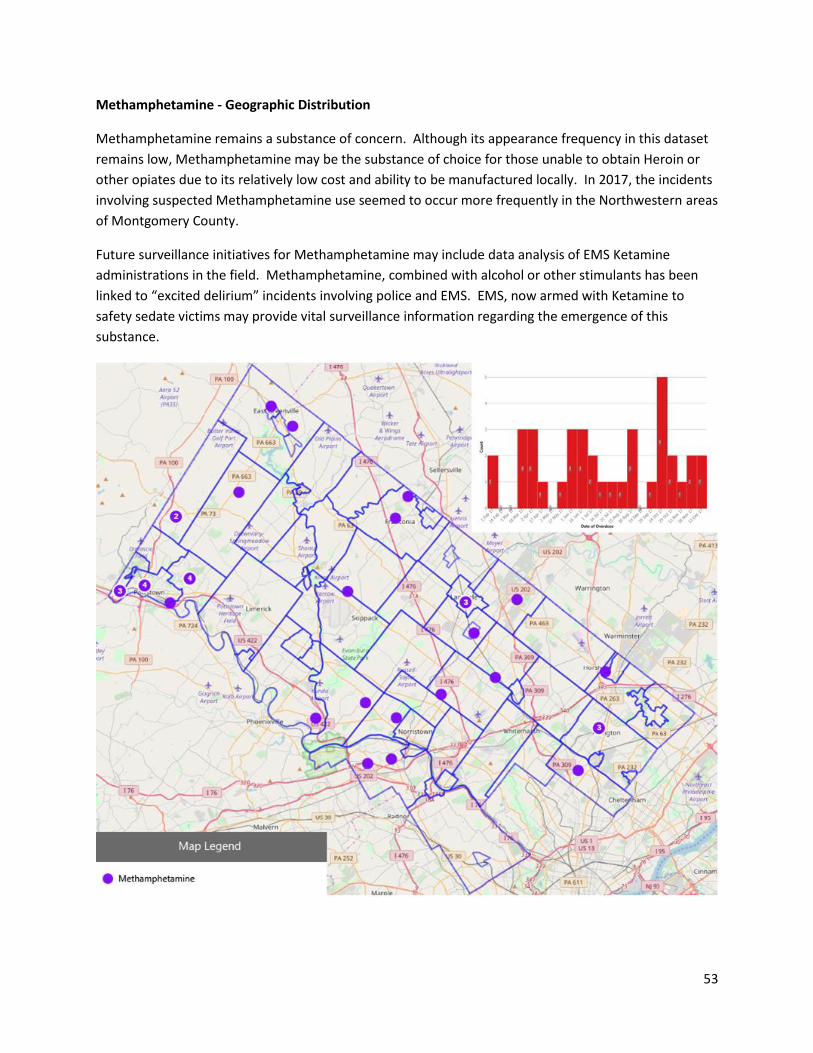
Methamphetamine - Geographic Distribution
Methamphetamine remains a substance of concern. Although its appearance frequency in this dataset
remains low, Methamphetamine may be the substance of choice for those unable to obtain Heroin or
other opiates due to its relatively low cost and ability to be manufactured locally. In 2017, the incidents
involving suspected Methamphetamine use seemed to occur more frequently in the Northwestern areas
of Montgomery County.
Future surveillance initiatives for Methamphetamine may include data analysis of EMS Ketamine
administrations in the field. Methamphetamine, combined with alcohol or other stimulants has been
linked to “excited delirium” incidents involving police and EMS. EMS, now armed with Ketamine to
safety sedate victims may provide vital surveillance information regarding the emergence of this
substance.
Page 54
54
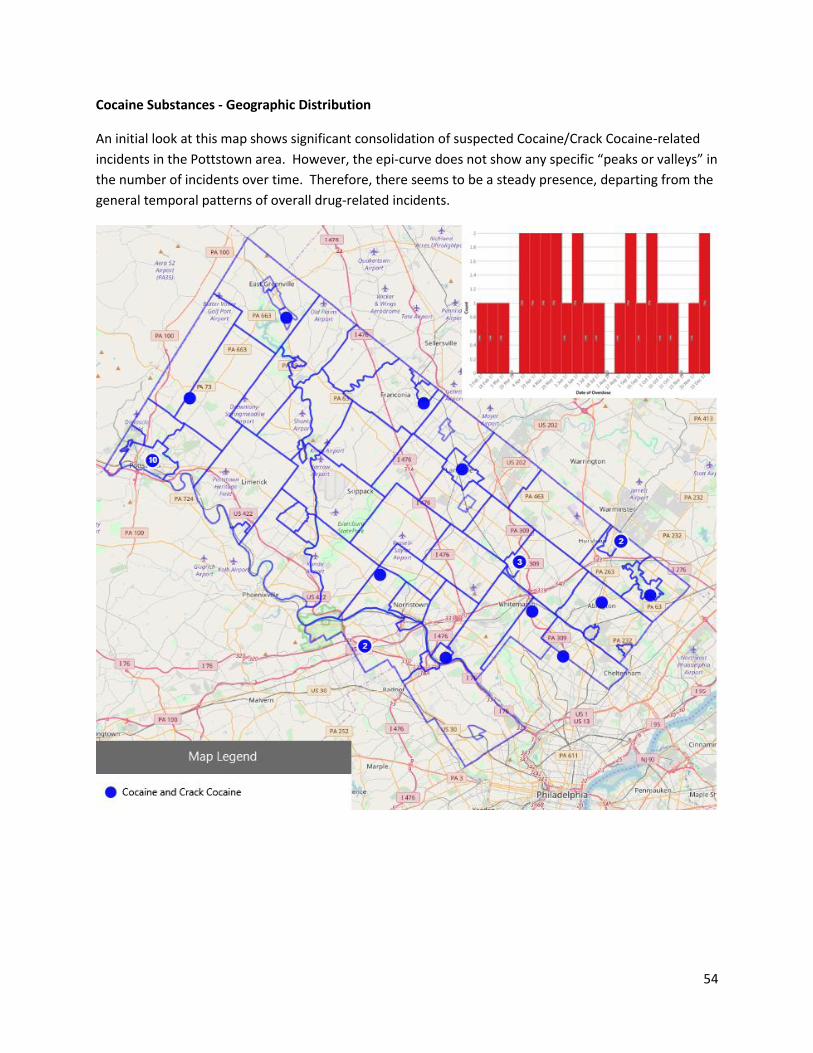
Cocaine Substances - Geographic Distribution
An initial look at this map shows significant consolidation of suspected Cocaine/Crack Cocaine-related
incidents in the Pottstown area. However, the epi-curve does not show any specific “peaks or valleys” in
the number of incidents over time. Therefore, there seems to be a steady presence, departing from the
general temporal patterns of overall drug-related incidents.
Page 55
55
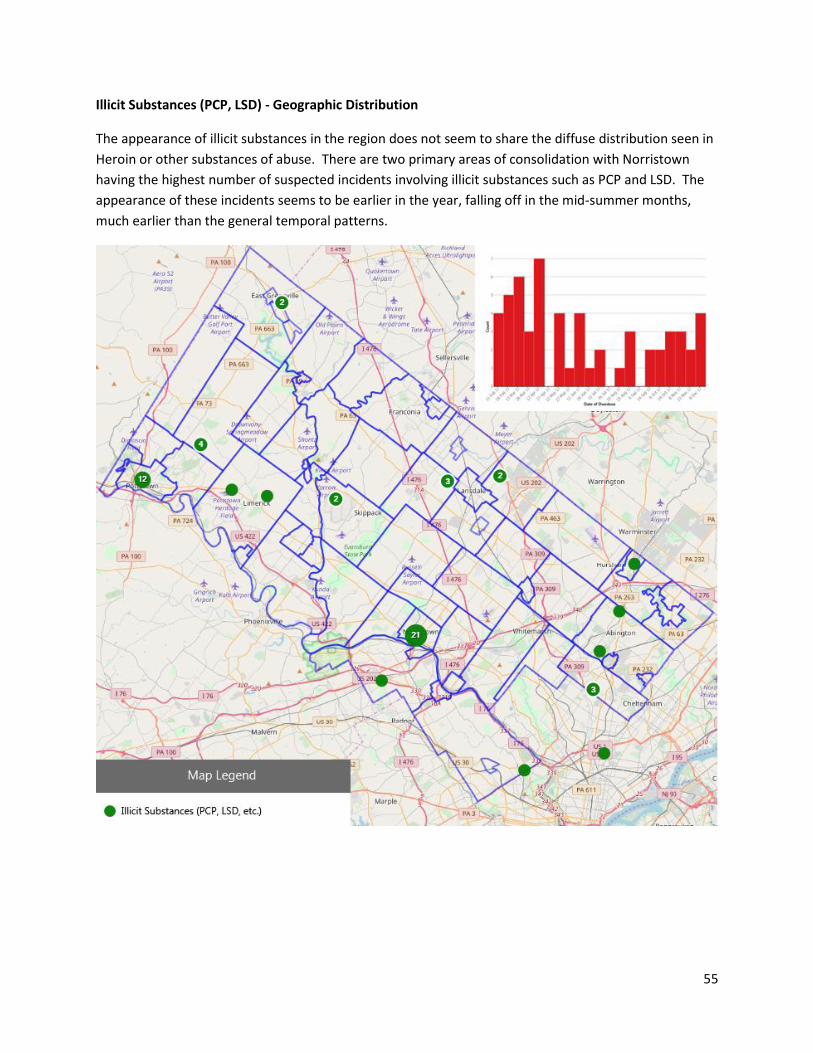
Illicit Substances (PCP, LSD) - Geographic Distribution
The appearance of illicit substances in the region does not seem to share the diffuse distribution seen in
Heroin or other substances of abuse. There are two primary areas of consolidation with Norristown
having the highest number of suspected incidents involving illicit substances such as PCP and LSD. The
appearance of these incidents seems to be earlier in the year, falling off in the mid-summer months,
much earlier than the general temporal patterns.
Page 56
56
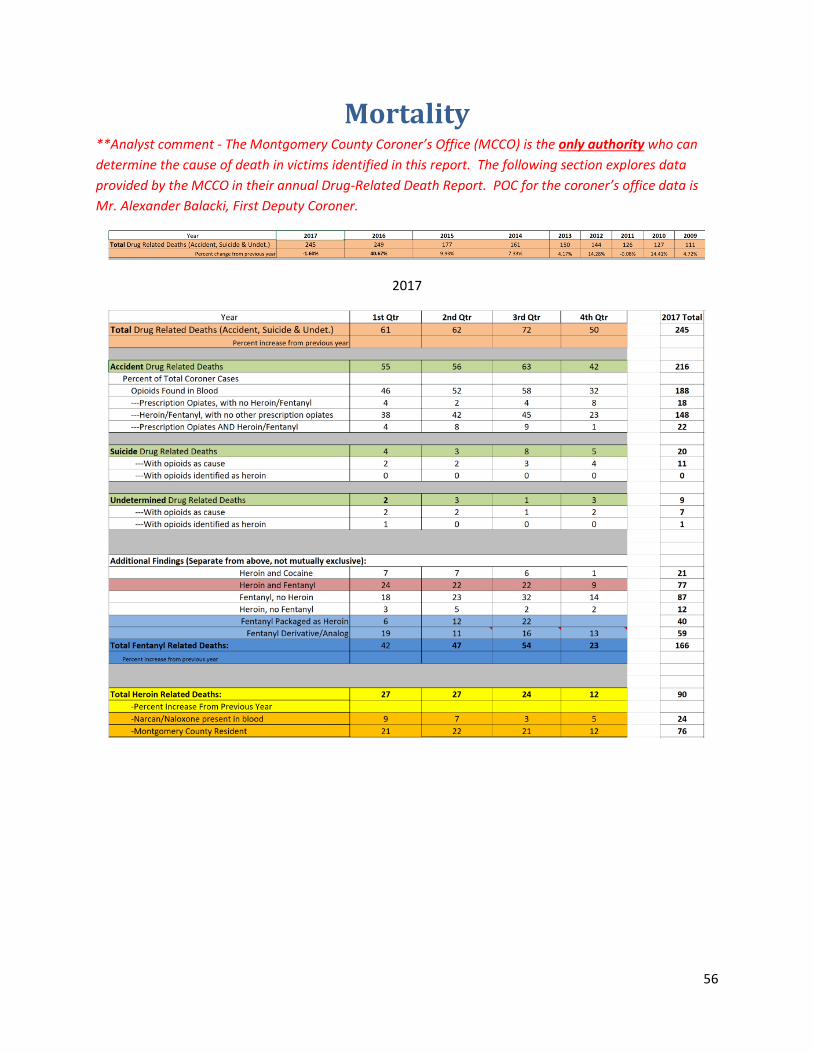
Mortality **Analyst comment - The Montgomery County Coroner’s Office (MCCO) is the only authority who can
determine the cause of death in victims identified in this report. The following section explores data
provided by the MCCO in their annual Drug-Related Death Report. POC for the coroner’s office data is
Mr. Alexander Balacki, First Deputy Coroner.
2017
Page 58
58
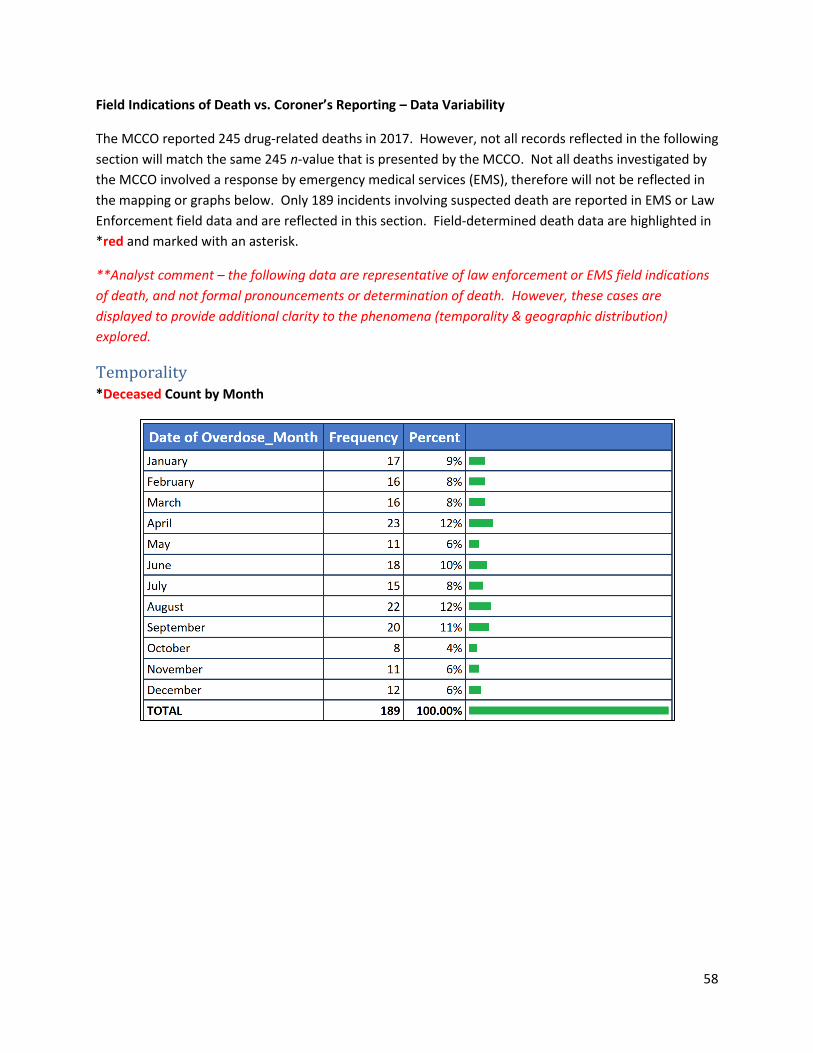
Field Indications of Death vs. Coroner’s Reporting – Data Variability
The MCCO reported 245 drug-related deaths in 2017. However, not all records reflected in the following
section will match the same 245 n-value that is presented by the MCCO. Not all deaths investigated by
the MCCO involved a response by emergency medical services (EMS), therefore will not be reflected in
the mapping or graphs below. Only 189 incidents involving suspected death are reported in EMS or Law
Enforcement field data and are reflected in this section. Field-determined death data are highlighted in
*red and marked with an asterisk.
**Analyst comment – the following data are representative of law enforcement or EMS field indications
of death, and not formal pronouncements or determination of death. However, these cases are
displayed to provide additional clarity to the phenomena (temporality & geographic distribution)
explored.
Temporality *Deceased Count by Month
Page 59
59
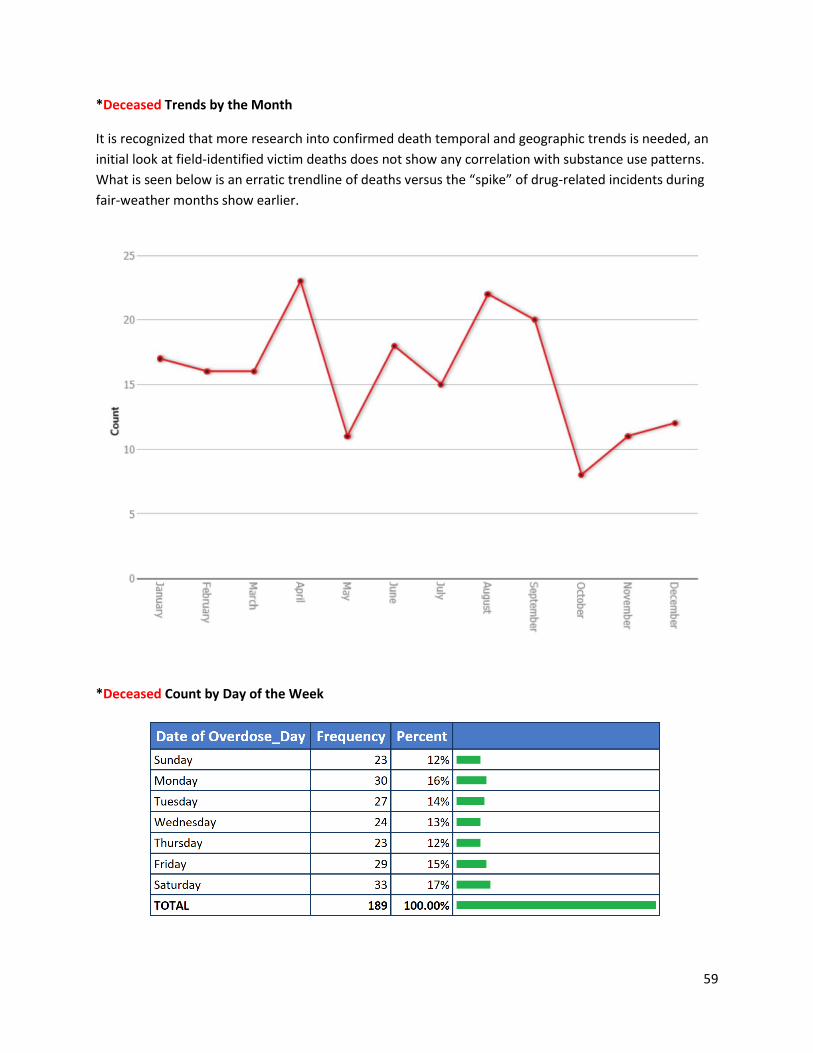
*Deceased Trends by the Month
It is recognized that more research into confirmed death temporal and geographic trends is needed, an
initial look at field-identified victim deaths does not show any correlation with substance use patterns.
What is seen below is an erratic trendline of deaths versus the “spike” of drug-related incidents during
fair-weather months show earlier.
*Deceased Count by Day of the Week
Page 60
60
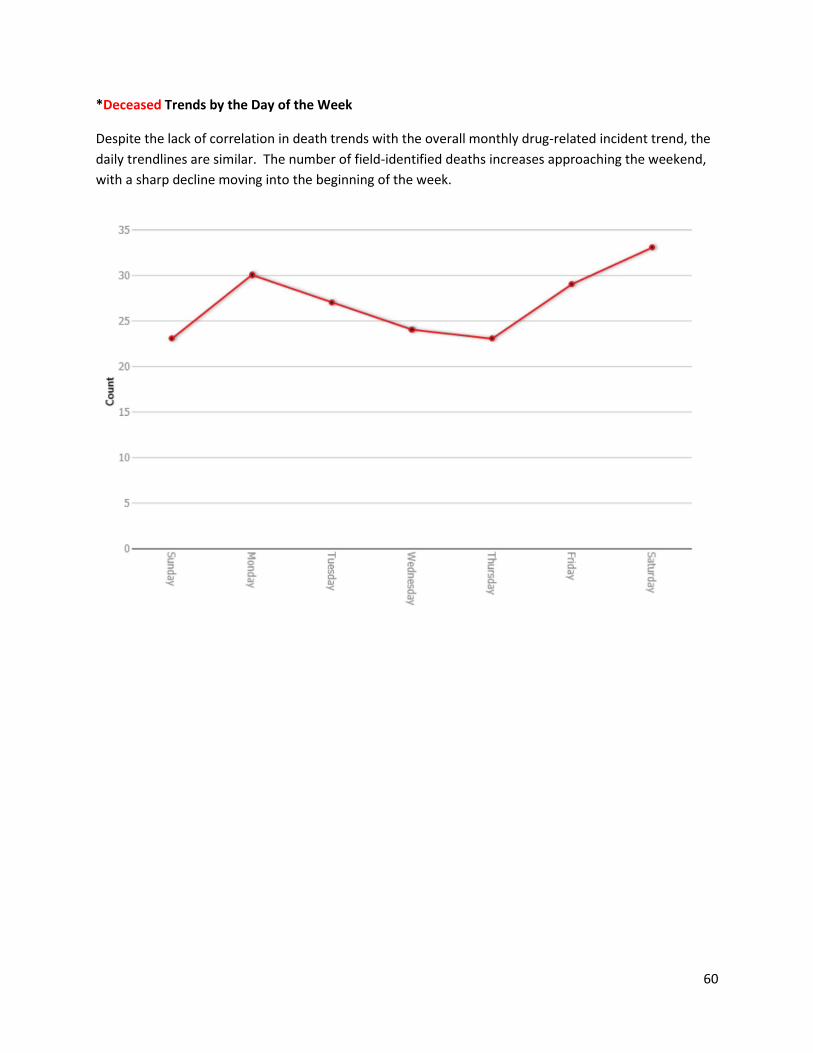
*Deceased Trends by the Day of the Week
Despite the lack of correlation in death trends with the overall monthly drug-related incident trend, the
daily trendlines are similar. The number of field-identified deaths increases approaching the weekend,
with a sharp decline moving into the beginning of the week.
Page 61
61
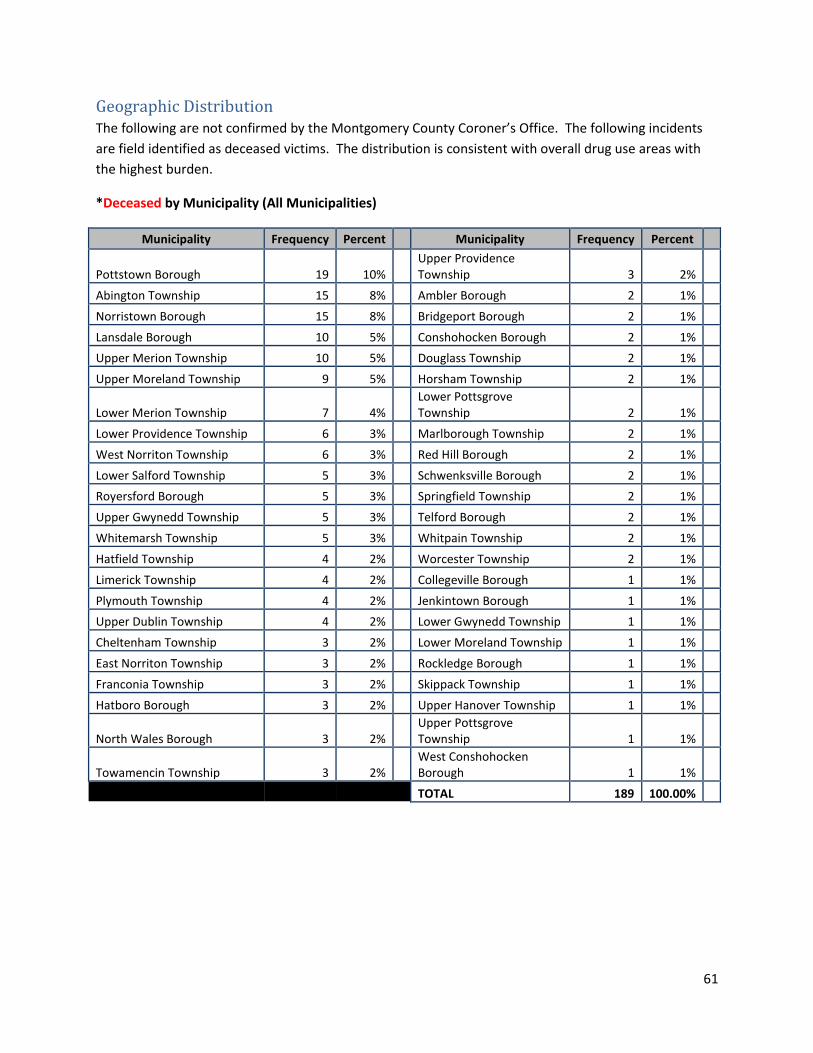
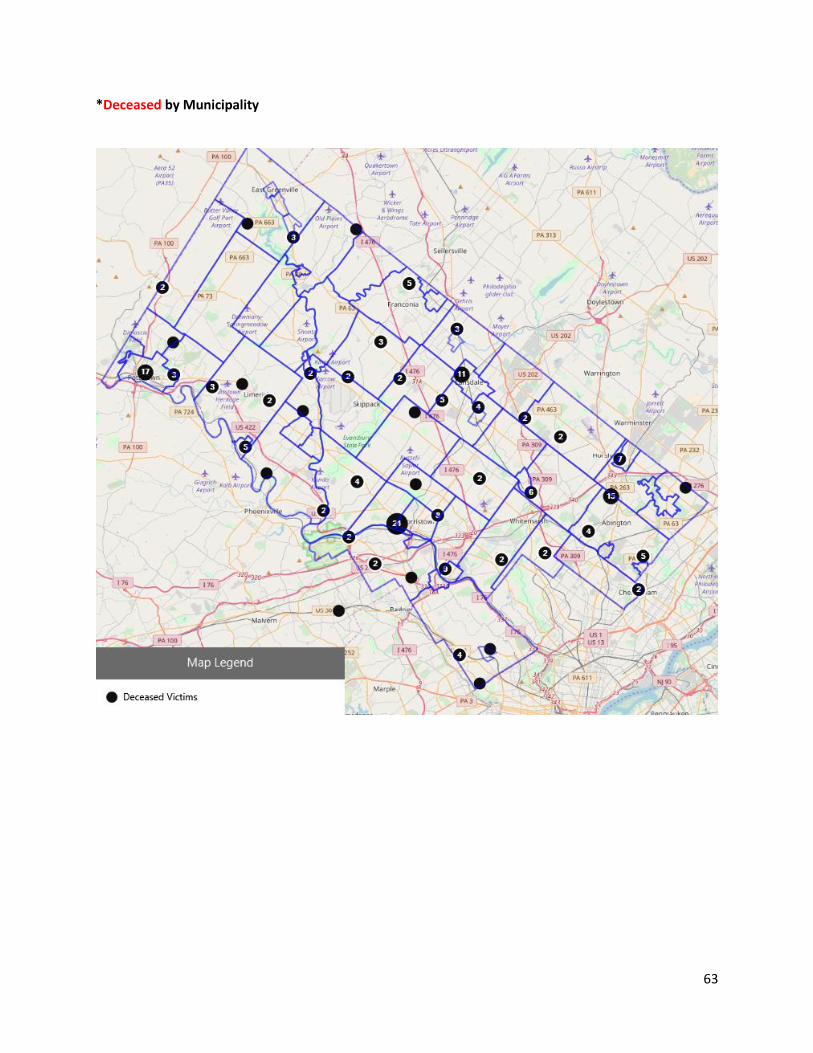
Geographic Distribution The following are not confirmed by the Montgomery County Coroner’s Office. The following incidents
are field identified as deceased victims. The distribution is consistent with overall drug use areas with
the highest burden.
*Deceased by Municipality (All Municipalities)
Municipality Frequency Percent Municipality Frequency Percent
Pottstown Borough 19 10% Upper Providence Township 3 2%
Abington Township 15 8% Ambler Borough 2 1%
Norristown Borough 15 8% Bridgeport Borough 2 1%
Lansdale Borough 10 5% Conshohocken Borough 2 1%
Upper Merion Township 10 5% Douglass Township 2 1%
Upper Moreland Township 9 5% Horsham Township 2 1%
Lower Merion Township 7 4% Lower Pottsgrove Township 2 1%
Lower Providence Township 6 3% Marlborough Township 2 1%
West Norriton Township 6 3% Red Hill Borough 2 1%
Lower Salford Township 5 3% Schwenksville Borough 2 1%
Royersford Borough 5 3% Springfield Township 2 1%
Upper Gwynedd Township 5 3% Telford Borough 2 1%
Whitemarsh Township 5 3% Whitpain Township 2 1%
Hatfield Township 4 2% Worcester Township 2 1%
Limerick Township 4 2% Collegeville Borough 1 1%
Plymouth Township 4 2% Jenkintown Borough 1 1%
Upper Dublin Township 4 2% Lower Gwynedd Township 1 1%
Cheltenham Township 3 2% Lower Moreland Township 1 1%
East Norriton Township 3 2% Rockledge Borough 1 1%
Franconia Township 3 2% Skippack Township 1 1%
Hatboro Borough 3 2% Upper Hanover Township 1 1%
North Wales Borough 3 2% Upper Pottsgrove Township 1 1%
Towamencin Township 3 2% West Conshohocken Borough 1 1%
TOTAL 189 100.00%
Page 62
62
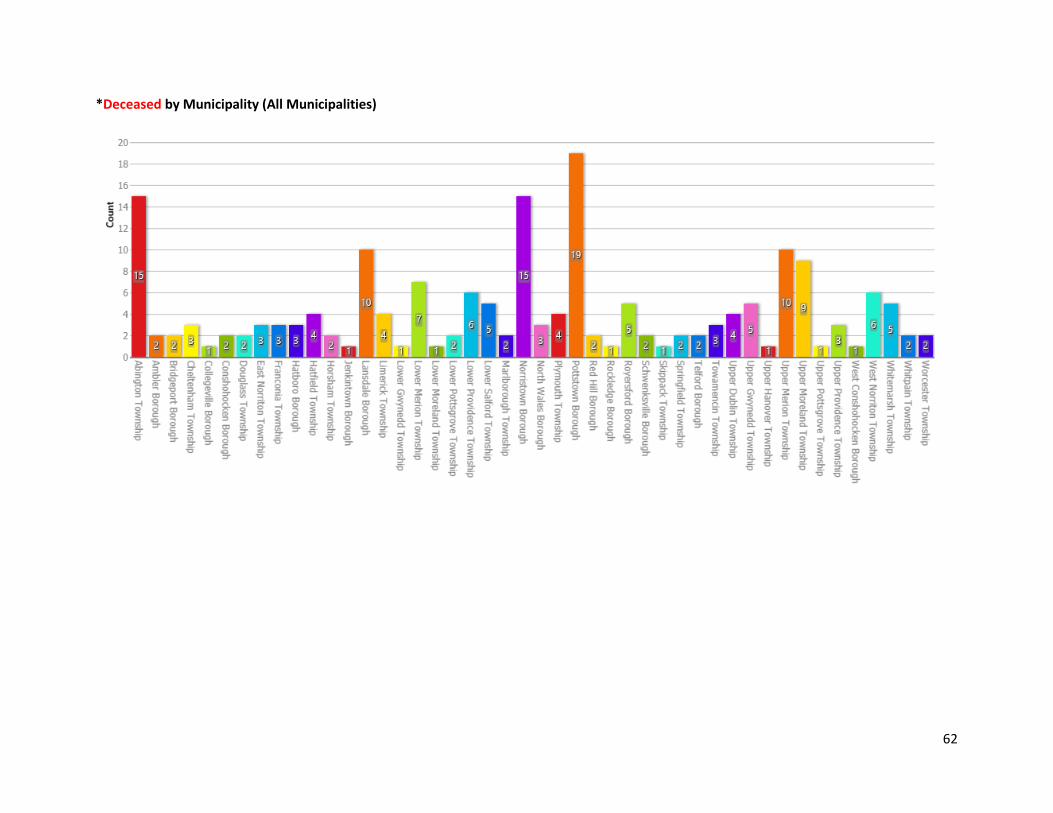
*Deceased by Municipality (All Municipalities)
Page 63
63
*Deceased by Municipality
Page 64
64
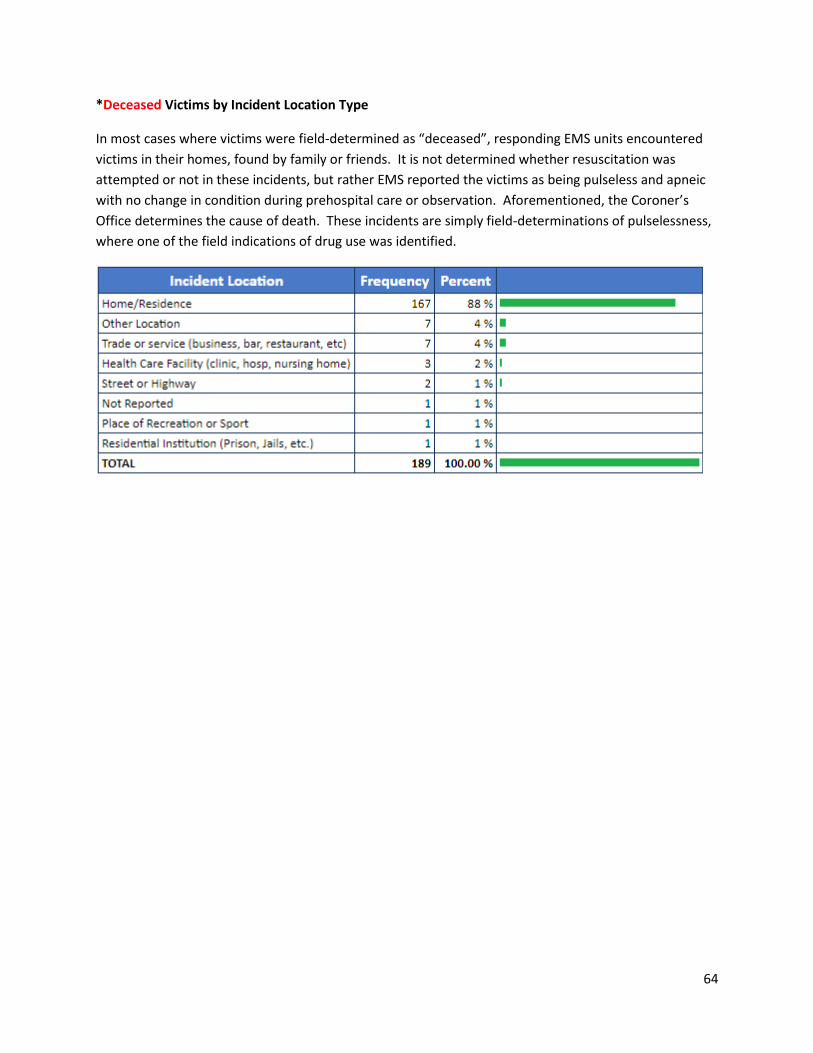
*Deceased Victims by Incident Location Type
In most cases where victims were field-determined as “deceased”, responding EMS units encountered
victims in their homes, found by family or friends. It is not determined whether resuscitation was
attempted or not in these incidents, but rather EMS reported the victims as being pulseless and apneic
with no change in condition during prehospital care or observation. Aforementioned, the Coroner’s
Office determines the cause of death. These incidents are simply field-determinations of pulselessness,
where one of the field indications of drug use was identified.
Page 65
65
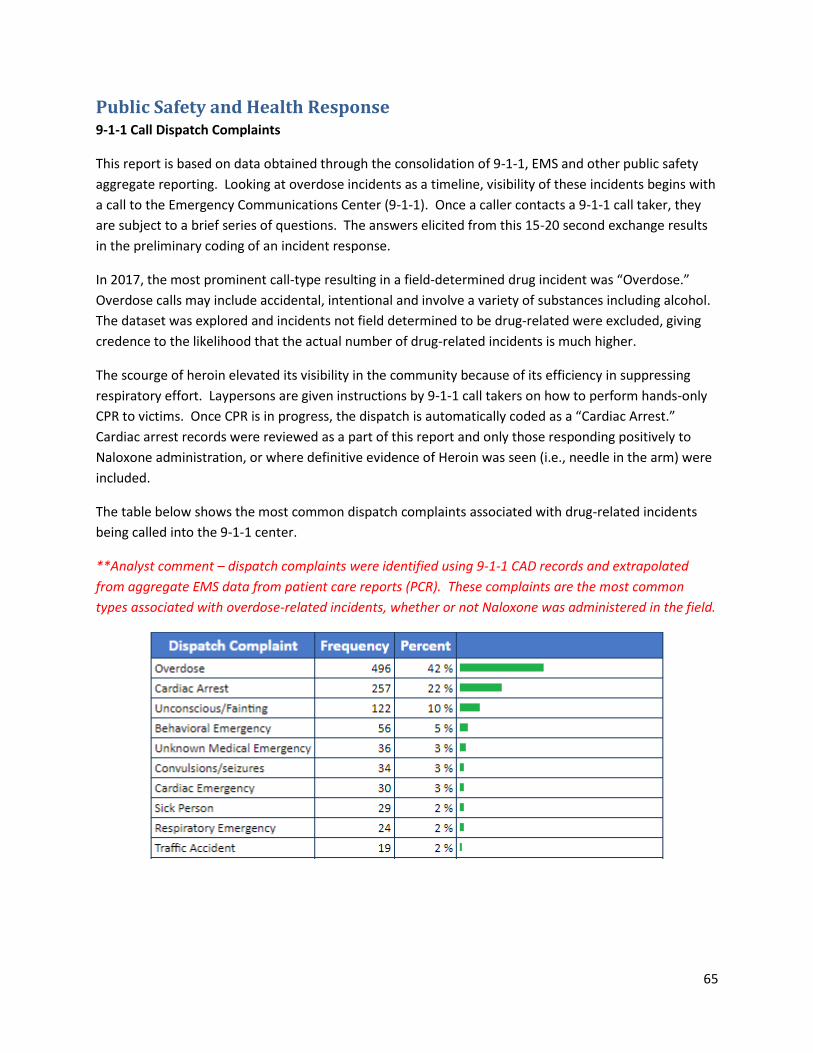
Public Safety and Health Response 9-1-1 Call Dispatch Complaints
This report is based on data obtained through the consolidation of 9-1-1, EMS and other public safety
aggregate reporting. Looking at overdose incidents as a timeline, visibility of these incidents begins with
a call to the Emergency Communications Center (9-1-1). Once a caller contacts a 9-1-1 call taker, they
are subject to a brief series of questions. The answers elicited from this 15-20 second exchange results
in the preliminary coding of an incident response.
In 2017, the most prominent call-type resulting in a field-determined drug incident was “Overdose.”
Overdose calls may include accidental, intentional and involve a variety of substances including alcohol.
The dataset was explored and incidents not field determined to be drug-related were excluded, giving
credence to the likelihood that the actual number of drug-related incidents is much higher.
The scourge of heroin elevated its visibility in the community because of its efficiency in suppressing
respiratory effort. Laypersons are given instructions by 9-1-1 call takers on how to perform hands-only
CPR to victims. Once CPR is in progress, the dispatch is automatically coded as a “Cardiac Arrest.”
Cardiac arrest records were reviewed as a part of this report and only those responding positively to
Naloxone administration, or where definitive evidence of Heroin was seen (i.e., needle in the arm) were
included.
The table below shows the most common dispatch complaints associated with drug-related incidents
being called into the 9-1-1 center.
**Analyst comment – dispatch complaints were identified using 9-1-1 CAD records and extrapolated
from aggregate EMS data from patient care reports (PCR). These complaints are the most common
types associated with overdose-related incidents, whether or not Naloxone was administered in the field.
Page 66
66
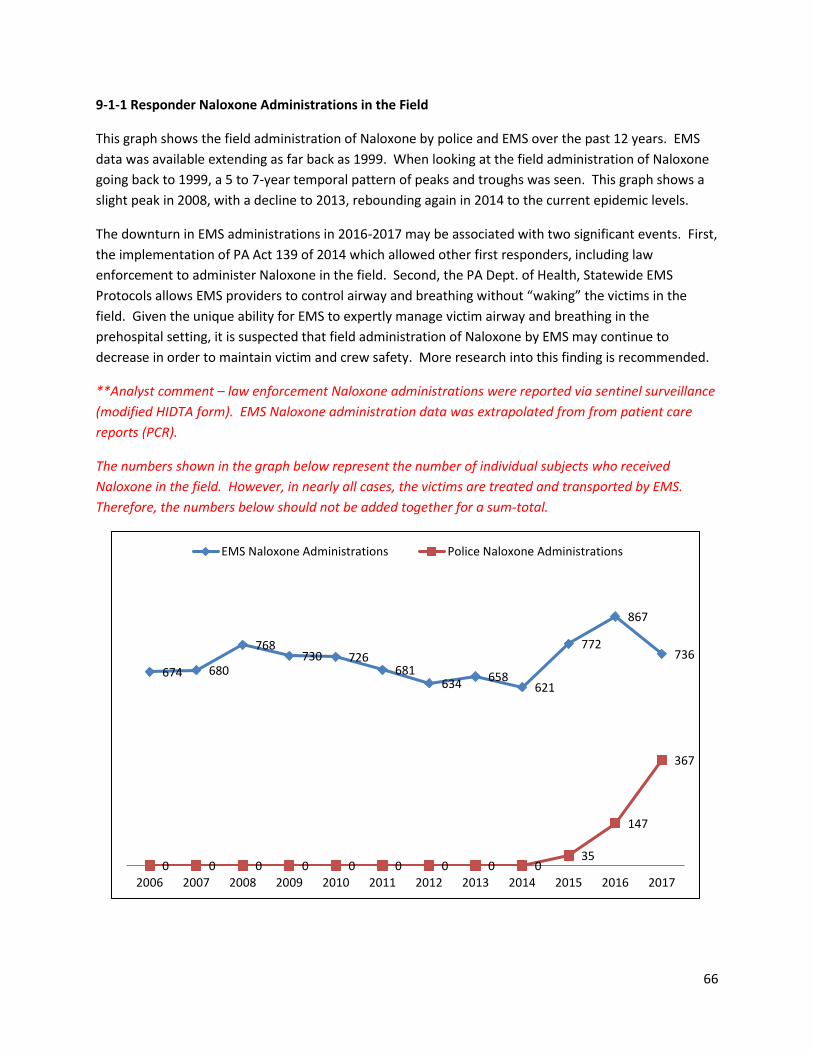
9-1-1 Responder Naloxone Administrations in the Field
This graph shows the field administration of Naloxone by police and EMS over the past 12 years. EMS
data was available extending as far back as 1999. When looking at the field administration of Naloxone
going back to 1999, a 5 to 7-year temporal pattern of peaks and troughs was seen. This graph shows a
slight peak in 2008, with a decline to 2013, rebounding again in 2014 to the current epidemic levels.
The downturn in EMS administrations in 2016-2017 may be associated with two significant events. First,
the implementation of PA Act 139 of 2014 which allowed other first responders, including law
enforcement to administer Naloxone in the field. Second, the PA Dept. of Health, Statewide EMS
Protocols allows EMS providers to control airway and breathing without “waking” the victims in the
field. Given the unique ability for EMS to expertly manage victim airway and breathing in the
prehospital setting, it is suspected that field administration of Naloxone by EMS may continue to
decrease in order to maintain victim and crew safety. More research into this finding is recommended.
**Analyst comment – law enforcement Naloxone administrations were reported via sentinel surveillance
(modified HIDTA form). EMS Naloxone administration data was extrapolated from from patient care
reports (PCR).
The numbers shown in the graph below represent the number of individual subjects who received
Naloxone in the field. However, in nearly all cases, the victims are treated and transported by EMS.
Therefore, the numbers below should not be added together for a sum-total.
674 680
768730 726
681634
658621
772
867
736
0 0 0 0 0 0 0 0 035
147
367
2006 2007 2008 2009 2010 2011 2012 2013 2014 2015 2016 2017
EMS Naloxone Administrations Police Naloxone Administrations
Page 67
67
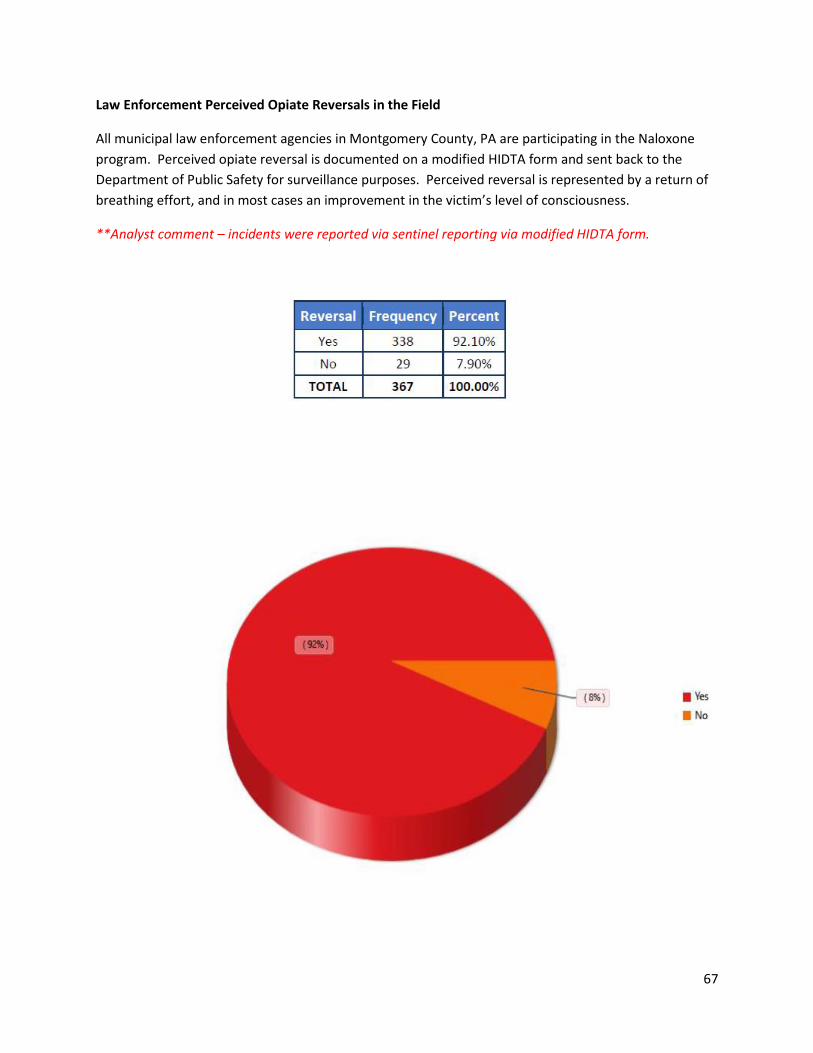
Law Enforcement Perceived Opiate Reversals in the Field
All municipal law enforcement agencies in Montgomery County, PA are participating in the Naloxone
program. Perceived opiate reversal is documented on a modified HIDTA form and sent back to the
Department of Public Safety for surveillance purposes. Perceived reversal is represented by a return of
breathing effort, and in most cases an improvement in the victim’s level of consciousness.
**Analyst comment – incidents were reported via sentinel reporting via modified HIDTA form.
Page 68
68
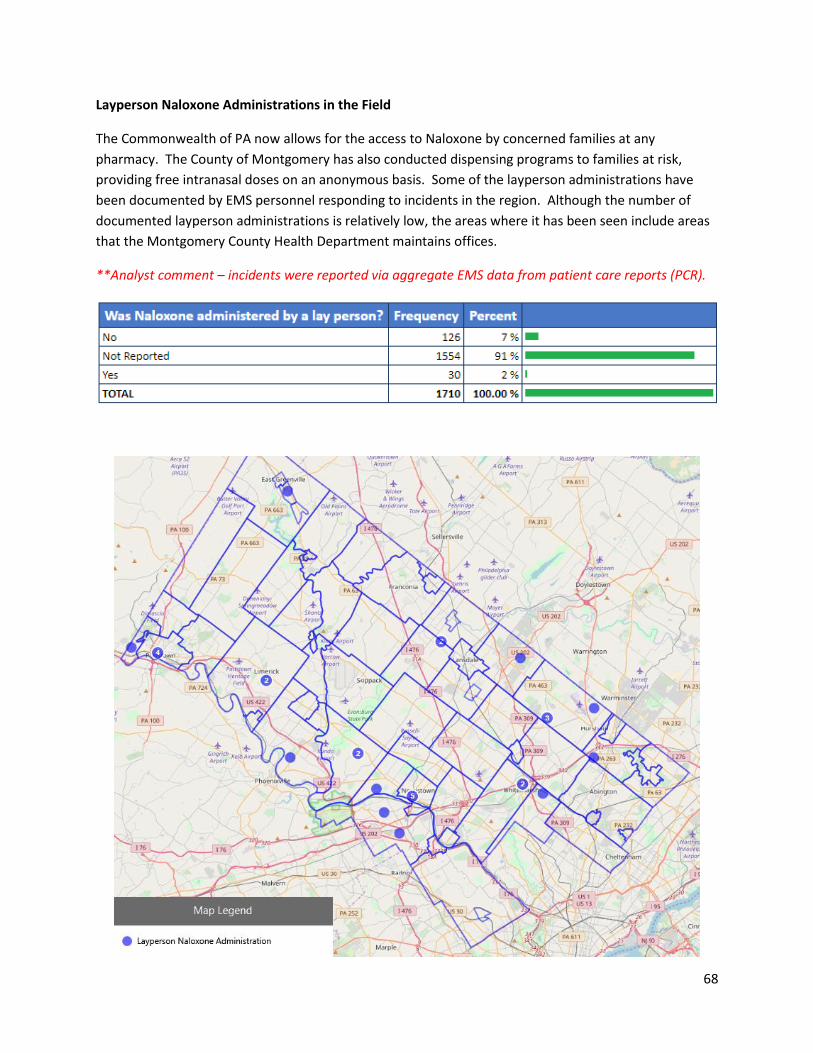
Layperson Naloxone Administrations in the Field
The Commonwealth of PA now allows for the access to Naloxone by concerned families at any
pharmacy. The County of Montgomery has also conducted dispensing programs to families at risk,
providing free intranasal doses on an anonymous basis. Some of the layperson administrations have
been documented by EMS personnel responding to incidents in the region. Although the number of
documented layperson administrations is relatively low, the areas where it has been seen include areas
that the Montgomery County Health Department maintains offices.
**Analyst comment – incidents were reported via aggregate EMS data from patient care reports (PCR).
Page 69
69
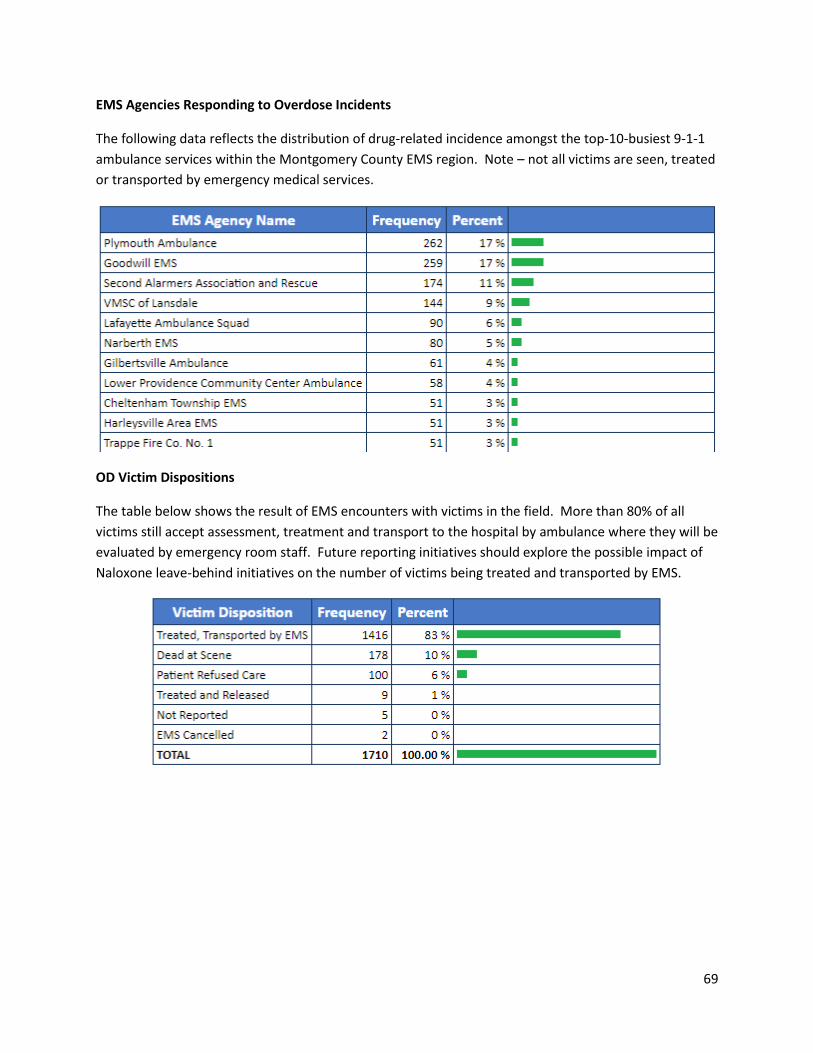
EMS Agencies Responding to Overdose Incidents
The following data reflects the distribution of drug-related incidence amongst the top-10-busiest 9-1-1
ambulance services within the Montgomery County EMS region. Note – not all victims are seen, treated
or transported by emergency medical services.
OD Victim Dispositions
The table below shows the result of EMS encounters with victims in the field. More than 80% of all
victims still accept assessment, treatment and transport to the hospital by ambulance where they will be
evaluated by emergency room staff. Future reporting initiatives should explore the possible impact of
Naloxone leave-behind initiatives on the number of victims being treated and transported by EMS.
Page 70
70
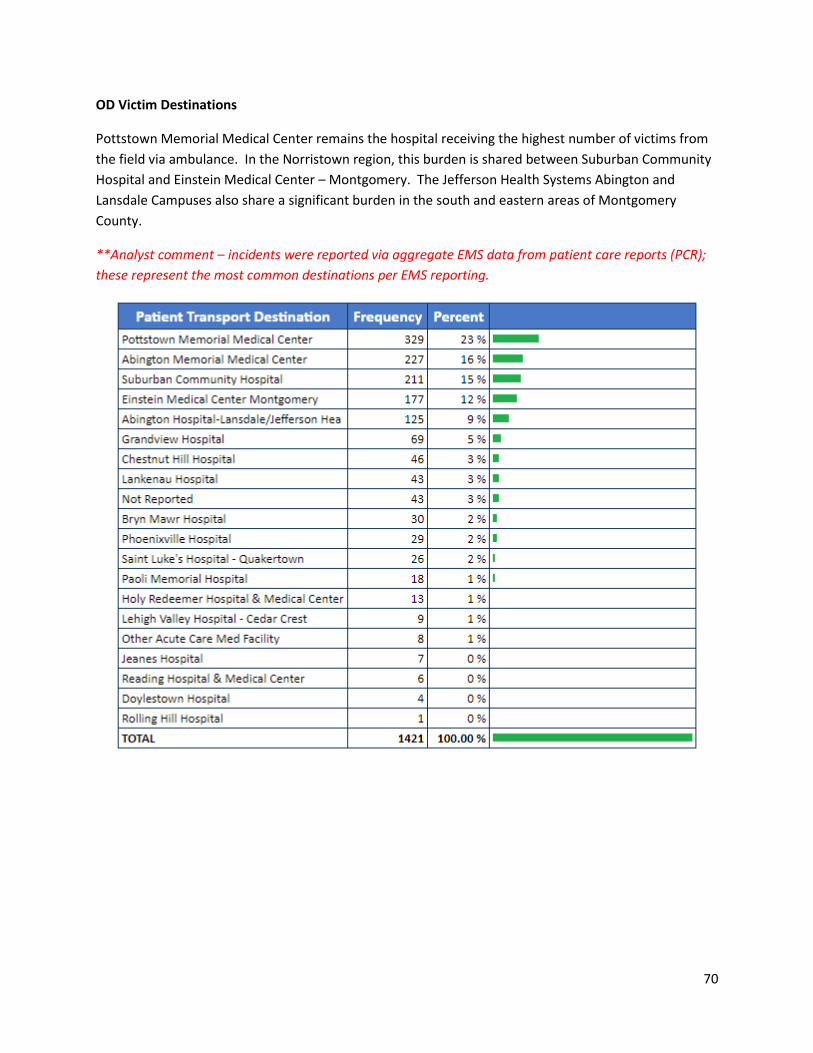
OD Victim Destinations
Pottstown Memorial Medical Center remains the hospital receiving the highest number of victims from
the field via ambulance. In the Norristown region, this burden is shared between Suburban Community
Hospital and Einstein Medical Center – Montgomery. The Jefferson Health Systems Abington and
Lansdale Campuses also share a significant burden in the south and eastern areas of Montgomery
County.
**Analyst comment – incidents were reported via aggregate EMS data from patient care reports (PCR);
these represent the most common destinations per EMS reporting.
Page 71
71
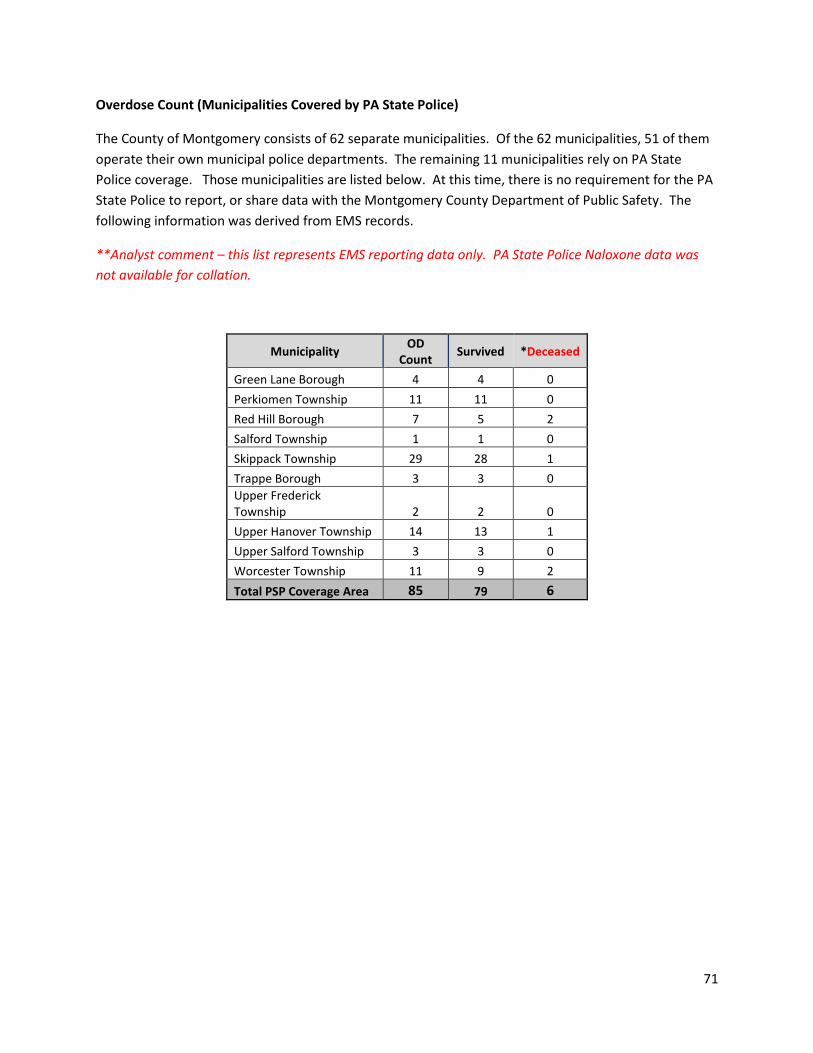
Overdose Count (Municipalities Covered by PA State Police)
The County of Montgomery consists of 62 separate municipalities. Of the 62 municipalities, 51 of them
operate their own municipal police departments. The remaining 11 municipalities rely on PA State
Police coverage. Those municipalities are listed below. At this time, there is no requirement for the PA
State Police to report, or share data with the Montgomery County Department of Public Safety. The
following information was derived from EMS records.
**Analyst comment – this list represents EMS reporting data only. PA State Police Naloxone data was
not available for collation.
Municipality OD
Count Survived *Deceased
Green Lane Borough 4 4 0
Perkiomen Township 11 11 0
Red Hill Borough 7 5 2
Salford Township 1 1 0
Skippack Township 29 28 1
Trappe Borough 3 3 0
Upper Frederick Township 2 2 0
Upper Hanover Township 14 13 1
Upper Salford Township 3 3 0
Worcester Township 11 9 2
Total PSP Coverage Area 85 79 6
Page 72
72
Data Challenges
The 2017 public safety analysis of drug-related incidents was the first of its kind. The Department of
Public Safety began its surveillance with the Division of Emergency Medical Services (EMS) leading the
project in March 2015. The initial program began with manual submission of HIDTA Naloxone
Administration Forms in 2015, and grew into the use of 9-1-1 and EMS record data. Early data collection
efforts focused strictly on the field administration of Naloxone by Police and EMS. However, the 2017
project expanded to include an analysis of clear, drug-related incidents regardless of whether or not
Naloxone was administered in the field.
The overarching purpose of this public safety intelligence project is to provide information resources to
all public safety professionals, substance abuse and mental health stakeholders and healthcare
providers alike, to better develop a coordinated response to the current opioid emergency. This
intelligence project fills an informational gap not otherwise explored by the Delaware Valley Intelligence
Center (DVIC) or any single public safety, public health or healthcare partner in the region, and offers a
more integrated common operating picture at the local, county, regional, state and national levels, by
collating data sources from multiple public safety, health and human services agencies.
Unfortunately, the current intelligence model requires extensive analyst time commitments. All current
data collection efforts are a manual process at this time, and challenged by competing reporting systems
imposed by HIDTA and the PA Criminal Intelligence Center (PaCIC). Furthermore, sentinel surveillance
systems such as the HIDTA Naloxone Overdose Reporting Form or the Overdose Information Network
(ODIN) are only as successful as the field compliance with the initiative. Competing reporting
requirements compromise the integrity of data across the spectrum of field reporting. It is not
reasonable nor efficient to require local law enforcement providers to complete multiple reports on a
single action. Conversely, the PA State Police who administer Naloxone in the field should only have a
single destination of reporting, giving greater justification for an integrated bi-directional data-sharing
model.
This report shows that 367 HIDTA Naloxone Administration report forms were submitted by law
enforcement in 2017, yet the number of Opiate-involved incidents nearly doubled that number
according to EMS run data. Considering this, there’s a critical loss of visibility when relying strictly on
single-source surveillance initiatives. Therefore, future data collection should mature into a passive
process which is deliberately planned established data-planning committee. Furthermore, multi-
disciplinary data should be “warehoused” in a single fusion center. The Montgomery County
Department of Public Safety Real Time Information Center has embarked on an initial cloud-based
framework to address this recommendation. Unfortunately, the initiative is not complete and still
requires additional planning and funding before it is fully operational.
The PA Dept. of Health, Bureau of EMS (BEMS) shifted to a new EMS data structure beginning in 2018. It
migrated from the old National EMS Information System (NEMSIS) 2.2 to version 3.4, starting in January.
With that migration came new challenges to data visibility. The BEMS does not collect all available data
fields from ambulance run charts. This scenario prevents the BEMS and its parent Department of Health
Page 73
73
from conducting reliable research using EMS run data. Currently, the BEMS data bridge is the only
overarching data warehouse for EMS data. Up until 2018, all EMS regional councils had overarching
visibility over their respective regional EMS data, but now that capability has been lost. The future of
public health and safety research using reliable, accurate and detailed EMS data has been at least
temporarily compromised until regional solutions can be developed.
Looking Forward – Areas for Improvement
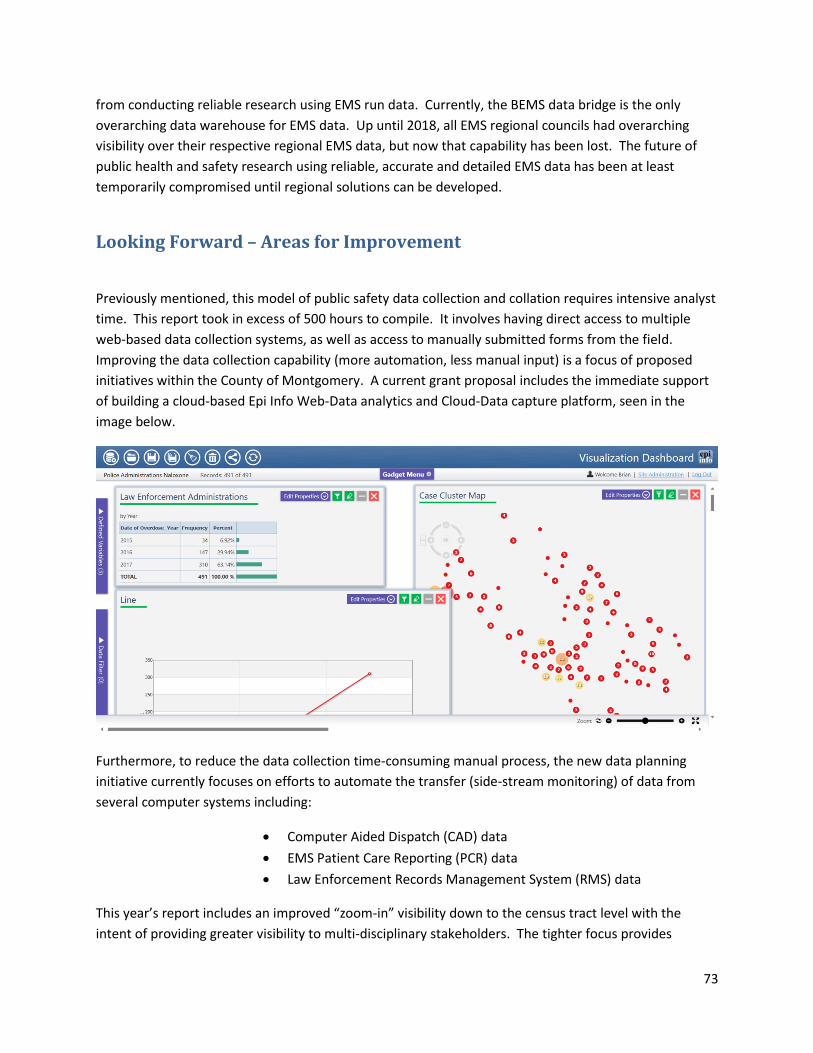
Previously mentioned, this model of public safety data collection and collation requires intensive analyst
time. This report took in excess of 500 hours to compile. It involves having direct access to multiple
web-based data collection systems, as well as access to manually submitted forms from the field.
Improving the data collection capability (more automation, less manual input) is a focus of proposed
initiatives within the County of Montgomery. A current grant proposal includes the immediate support
of building a cloud-based Epi Info Web-Data analytics and Cloud-Data capture platform, seen in the
image below.
Furthermore, to reduce the data collection time-consuming manual process, the new data planning
initiative currently focuses on efforts to automate the transfer (side-stream monitoring) of data from
several computer systems including:
• Computer Aided Dispatch (CAD) data
• EMS Patient Care Reporting (PCR) data
• Law Enforcement Records Management System (RMS) data
This year’s report includes an improved “zoom-in” visibility down to the census tract level with the
intent of providing greater visibility to multi-disciplinary stakeholders. The tighter focus provides
Page 74
74
greater informational clarity for local and regional agencies to act within a smaller area. Future
reporting will continue to include local visibility to truly focus on the community problems and provide
timely data sharing with local stakeholders, offering an abundance of “actionable intelligence.”
However, in order to ensure that a proper focus of data collection is being achieved, the formation of a
multi-disciplinary action group (MDAG) has been included as a part of the current data-sharing grant
proposal.
The inclusion of health and human services (HHS) data to complete the lifecycle picture of a victim’s
incident is a planned part of future planned data sharing, however the details have yet to be established
as a part of the MDAG planning process. The addition of HHS data will offer insight to factors associated
with near-miss and overdose repeat incidents and relapse to the crisis level. Inclusion of HHS is critical
as they are the primary partner in the response to the OD crisis. HHS will benefit greatly from
participation in the proposed data-sharing project.
The proposed data-sharing project grant proposal includes the establishment of regional, inter-
jurisdictional intel-sharing capabilities to enhance the picture across jurisdictional borders. The planned
initiative will support all ongoing and ad hoc information reporting requirements of local, regional, State
and Federal partners and be offered in a coordinated and purposeful manner. The new system can and
will include a web-based platform (Epi Info 7 Cloud) mentioned above as well as regular product
dissemination amongst partners, including the following:
o Monthly Law Enforcement Naloxone Administration Report
o Annual EMS OD Response Report
o Ad-Hoc Reporting to Stakeholders
▪ All include both statistical analysis as well as GIS visuals (when applicable)
The emergence of the Opioid epidemic presented public safety and public health officials unique insight
into the overall burden of drug-related incidents in the region due to the unfortunate loss of life.
Tracking the social patterns of presentation allows analysists to work closely with health, human
services as well as law enforcement partners in developing new responses, both tactical and strategic to
combat the plague while it is still visible. Over time, analysts predict, and history has shown that the
visibility associated with this epidemic will fade. Unfortunately, the burden of substance abuse will not
necessarily go away, it will only change as the preferred substances of abuse shift to meet local
demands.
It is the intent of this project to include enough flexibility in data collation and analysis so that as the
face of drug-abuse shifts, that visibility can be maintained, providing health and human services
agencies the opportunity to respond to the next emerging threat. Emergency medical services and law
enforcement will remain at the tip of the spear for data collection and reporting, providing valuable
insight from the point of injury or illness in a near real-time fashion.
Page 75
75
Conclusion
The Montgomery County Department of Public Safety, at the request of the County Detectives office
upgraded its analytic view of regional overdose incidents. In 2017, data analysis shifted from the
previous model of field Naloxone administration focus to a more in-depth look at all non-alcohol
substances of abuse encountered during 9-1-1 incidents via EMS and law enforcement field reporting.
De-identified aggregate data from multiple agencies was collated into a single database located on the
protected IT network and accessed using a variety of software platforms to develop a regional picture of
the drug problem faced in the field by responders. This report is intended to be shared with various
community stakeholders to help them develop their own courses of action in response to the epidemic.
This model of data collection and collation is currently time-intensive and several data access and
collection improvements are urgently needed to expedite the availability of data for future use.
Several recommendations were made as a part of a separate data-sharing grant proposal including the
need to establish a data planning committee (MDAG) with representation from all stakeholders, under
the umbrella of the Montgomery County Department of Public Safety Real Time Information Center.
The grant-proposal model has the potential to support, and not compete with, the capabilities of the
Delaware Valley Intelligence Center as a regional initiative. Most of the technology is already in-place to
build a collaborative system which will benefit all County as well as regional partners.
Finally, there is no doubt that the face of the drug-abuse plague will change soon, leading to new
visibility challenges for public safety and public health. The medical crises associated with opiate
overdoses raised our awareness of the regional drug problem by making victims more visible to
laypersons and responders alike. If regional shifts in substance preference favor stimulants, then victim
visibility associated with field Naloxone administration will be lost. However, EMS run reports will
continue to be a data-rich source of information for analysts to monitor, regardless of presenting
toxidromes. For example, if new drug use trends favor stimulant use, the current surveillance model can
be changed to look for EMS Ketamine administrations or sudden “spikes” in young heart attack victim
rates. It is recommended that this project remains supported through active multi-agency participation,
and expands to include data input from more stakeholders to provide meaningful information to
requesting agencies.