75


TRANSPORTATION MASTER PLAN CITY OF TRACY
Transportation Master Plan • November 2012 Page - i
TABLE OF CONTENTS 1. INTRODUCTION ..................................................................................... 1
1.1 INTRODUCTION ...................................................................................................................................... 1
1.2 PURPOSE OF TMP .................................................................................................................................... 2
1.3 DEVELOPMENT OF TMP ...................................................................................................................... 3
1.4 OBJECTIVES OF THE TMP.................................................................................................................... 4
1.5 REPORT ORGANIZATION ................................................................................................................. 6
2. EXISTING TRANSPORTATION SYSTEM ........................................... 7
2.1 INTRODUCTION ...................................................................................................................................... 7
2.2 STUDY AREA ................................................................................................................................................ 8
2.2.1 REGIONAL CONTEXT .......................................................................................................................... 8
2.2.2 EMERALD TRACY.................................................................................................................................... 13
2.3 INFRASTRUCTURE AND MODES OF TRANSPORTATION ...................................... 17
2.3.1 FUNCTIONAL CLASSIFICATION ................................................................................................. 17
2.3.1.1 Freeways ........................................................................................................................................ 19
2.3.1.2 Expressways ................................................................................................................................. 19
2.3.1.3 Arterials .......................................................................................................................................... 19
2.3.1.4 Collectors ...................................................................................................................................... 20
2.3.1.5 Residential ..................................................................................................................................... 20
2.3.1.6 Industrial ......................................................................................................................................... 20
2.3.2 TRAFFIC CONTROL .............................................................................................................................. 20
2.3.3 EXISTING BICYCLE CIRCULATION ............................................................................................ 21
2.3.3.1 Bicycle Facilities and Parking ................................................................................................ 21
2.3.4 EXISTING PEDESTRIAN CIRCULATION .................................................................................. 25
2.3.5 EXISTING PARKING ............................................................................................................................... 29
2.3.6 PARK AND RIDE FACILITIES ............................................................................................................ 29
2.3.6.1 Naglee Road Park and Ride ................................................................................................ 33
2.3.6.2 Prime Outlet Park and Ride ................................................................................................ 33
2.3.6.3 Tracy Transit Station Park and Ride ................................................................................ 33
2.3.6.4 6th Street and Central Avenue Park and Ride ......................................................... 34
2.3.6.5 Altamont Commuter Express (ACE) Park and Ride ............................................. 34
2.3.7 FREIGHT – TRUCK SERVICE ............................................................................................................. 34
2.3.7.1 Existing Truck Routes ............................................................................................................. 34
2.3.7.2 Through Truck Routes ........................................................................................................... 35
TRANSPORTATION MASTER PLAN CITY OF TRACY
Page - ii Transportation Master Plan • November 2012
2.3.7.3 Local Truck Routes .................................................................................................................. 39
2.3.7.4 Surface Transportation Assistance Act (STAA) Truck Routes ........................ 39
2.3.7.5 Existing Truck Stop Facility .................................................................................................. 40
2.3.8 TRACY RAILROADS .............................................................................................................................. 40
2.3.8.1 Railroad Crossings .................................................................................................................... 40
2.3.9 BRIDGES AND CULVERT FACILITIES......................................................................................... 45
2.3.10 INTELLIGENT TRANPORTATION SYSTEMS (ITS) ............................................................ 50
2.3.10.1 Existing System Inventory and Evaluation.................................................................... 50
2.3.11 TRANSIT FACILITIES .............................................................................................................................. 52
2.3.11.1 Local Fixed-Route Bus Service (Tracer) ....................................................................... 52
2.3.11.2 Regional Intercity Fixed-Route Bus Service ................................................................ 53
2.3.11.3 County Hopper Service ........................................................................................................ 53
2.3.11.4 RTD Commuter Bus Service ............................................................................................. 53
2.3.11.5 Altamont Commuter Express ........................................................................................... 54
2.4.1 ANALYSIS METHODOGOLY .......................................................................................................... 57
2.4.2 HIGHWAY CAPACITY MANUAL ................................................................................................ 57
2.4.3 LEVEL OF SERVICE STANDARDS ................................................................................................. 59
2.4.4 EXISTING LEVELS OF SERVICE....................................................................................................... 60
3. HORIZON YEAR FORECAST ............................................................... 65
3.1 INTRODUCTION .................................................................................................................................... 65
3.2 OVERVIEW OF TRANSPORTATION MASTER PLAN DEVELOPMENT
PROCESS ............................................................................................................................................................. 65
3.3 TRAFFIC FORECASTING METHODOLOGY ......................................................................... 66
3.3.1 TRACY TRAVEL DEMAND MODEL VALIDATION YEARS ......................................... 66
3.3.2 HORIZON YEAR – EXTRAPOLATION FROM GENERAL PLAN 2030 CASE . 67
3.3.3 BUILD OUT – LONG RANGE FORECAST ............................................................................. 67
3.3.4 SUSTAINABILITY STRATEGIES ASSESSMENT ...................................................................... 68
3.4 TMP LAND USE AND TRIP GENERATION ........................................................................... 70
3.4.1 LAND USE ASSUMPTIONS – HORIZON YEAR AND BUILD OUT ...................... 70
3.4.2 TRIP GENERATION CHARACTERISTICS ................................................................................ 71
3.4.3 TRIP GENERATION REDUCTIONS DUE TO SUSTAINABILITY STRATEGIES 75
3.4.4 TRIP GENERATION BY FUTURE SERVICE .............................................................................. 76
3.4.5 TRIP DISTRIBUTION .............................................................................................................................. 78
3.5 HORIZON YEAR FORECASTS, NETWORK SIZING AND PERFORMANCE ... 78

TRANSPORTATION MASTER PLAN CITY OF TRACY
Transportation Master Plan • November 2012 Page - iii
3.6 BUILD-OUT PLAN LINES .................................................................................................................... 91
4. HORIZON YEAR TRANSPORTATION MASTER PLAN ................. 99
4.1 INTRODUCTION .................................................................................................................................... 99
4.2 GOALS, OBJECTIVES, POLICIES, AND ACTIONS .............................................................. 99
4.2.1 INTRODUCTION .................................................................................................................................... 99
4.2.2 RECOMMENDED ACTIONS FOR CIRCULATION ELEMENT GOAL 1 .............. 99
4.2.3 RECOMMENDED ACTIONS FOR CIRCULATION ELEMENT GOAL 2 ........... 102
4.2.4 RECOMMENDED ACTIONS FOR CIRCULATION ELEMENT GOAL 3 ........... 103
4.2.5 RECOMMENDED ACTIONS FOR CIRCULATION ELEMENT GOAL 4 ........... 104
4.2.6 SUSTAINABILITY POLICIES, STANDARDS, AND PERFORMANCE MEASURES105
4.3 RAILROAD FACILITIES ...................................................................................................................... 111
4.3.1 INTRODUCTION ................................................................................................................................. 111
4.3.2 PLANNING RAILROAD CROSSING FACILITIES .............................................................. 111
4.3.3 FUTURE RAILROAD CROSSING FACILITIES ...................................................................... 112
4.3.4 RAILROAD CROSSING FACILITY DESIGN PLANNING ............................................. 116
4.3.5 SMART GROWTH DESIGN ELEMENTS ................................................................................ 117
4.4 LEVEL OF SERVICE ............................................................................................................................... 118
4.4.1 INTRODUCTION ................................................................................................................................. 118
4.4.2 HORIZON YEAR INTERSECTION TRAFFIC VOLUMES.............................................. 118
4.4.3 HORIZON YEAR INTERSECTION CONFIGURATION AND OPERATION . 125
4.4.3.1 Traffic Operation Evaluation Methodologies and Level of Service
Standards ..................................................................................................................................................... 125
4.4.3.2 Level of Service Criteria for Roundabouts ............................................................... 125
4.4.4 LANE CONFIGURATION/LEVEL OF SERVICE .................................................................. 125
4.5 BICYCLE AND PEDESTRIAN CIRCULATION .................................................................... 137
4.5.1 INTRODUCTION ................................................................................................................................. 137
4.5.2 FEDERAL HIGHWAY ADMINISTRATION FOUR E’S .................................................... 137
4.5.3 BICYCLE FACILITIES AND USERS .............................................................................................. 138
4.5.4 DESIGNING FUTURE ROADWAY RELATED INFRASTRUCTURE TO
COMPLEMENT BICYCLE INFRASTRUCTURE ................................................................................... 138
4.5.4.1 Bicycle Transportation Plan .............................................................................................. 143
4.5.4.2 Bikeways Connections to Land Use & Transit ....................................................... 143
4.5.4.3 Bicycle Lane Treatment at Intersections .................................................................... 144
4.5.4.4 Bicycle Path Pavement Material...................................................................................... 144
4.5.5 SMART GROWTH DESIGN ELEMENTS ................................................................................ 145

TRANSPORTATION MASTER PLAN CITY OF TRACY
Page - iv Transportation Master Plan • November 2012
4.5.5.1 Innovative Design Elements ............................................................................................. 146
4.5.6 SIDEWALKS .............................................................................................................................................. 148
4.6 BRIDGE AND CULVERT FACILITIES ........................................................................................ 149
4.6.1 INTRODUCTION ................................................................................................................................. 149
4.6.2 PLANNING BRIDGE AND CULVER FACILITIES ............................................................... 149
4.6.3 FUTURE BRIDGE AND CULVERT FACILITIES ................................................................... 149
4.6.4 BRIDGE AND CULVERT FACILITIES DESIGN PLANNING ....................................... 157
4.6.5 SMART GROWTH DESIGN ELEMENTS ................................................................................ 157
4.7 ROADWAY CLASSIFICATION AND CROSS SECTIONS ......................................... 159
4.7.1 INTRODUCTION ................................................................................................................................. 159
4.7.2 ROADWAY CLASSIFICATION .................................................................................................... 159
4.7.2.1 Parkways (Expressways) .................................................................................................... 165
4.7.2.2 Arterials (major and minor) ............................................................................................. 166
4.7.2.3 Collectors ................................................................................................................................... 167
4.7.2.4 Residential Streets and Alleys ......................................................................................... 168
4.7.2.5 Industrial Streets ..................................................................................................................... 169
4.7.3 CROSS SECTIONS ............................................................................................................................... 183
4.7.3.1 Ellis Specific Plan ..................................................................................................................... 183
4.7.3.2 Bus Stops, Utility Cabinets, and Pipelines ................................................................. 183
4.7.3.3 Light Rail or Streetcars ........................................................................................................ 184
4.7.4 TRAFFIC CALMING ............................................................................................................................. 184
4.7.5 TRAFFIC CIRCLES (MINI-ROUNDABOUTS) AND ROUNDABOUTS .............. 185
4.7.6 ACCESS MANAGEMENT ................................................................................................................ 186
4.7.7 CONTEXT-SENSITIVE DESIGN AND SMARTH GROWTH PRINCIPLES ........ 187
4.8 PARK AND RIDE FACILITIES ......................................................................................................... 188
4.8.1 INTRODUCTION ................................................................................................................................. 188
4.8.2 PLANNING PARK AND RIDE FACILITIES ............................................................................ 188
4.8.3 FUTURE PARK AND RIDE FACILITIES .................................................................................... 189
4.8.4 PARK AND RIDE FACILITY DESIGN PLANNING ........................................................... 189
4.8.5 SMART GROWTH DESIGN ELEMENTS ................................................................................ 193
4.9 INTELLIGENT TRANSPORTATION SYSTEM ..................................................................... 194
4.9.1 INTRODUCTION ................................................................................................................................. 194
4.9.2 CITY OF TRACY INTELLIGENT TRANSPORTATION VISION .............................. 194
4.9.3 CITY OF TRACY INTELLIGENT TRANSPORTATION (ITS) STRATEGIES ...... 194

TRANSPORTATION MASTER PLAN CITY OF TRACY
Transportation Master Plan • November 2012 Page - v
4.9.3.1 Communication Network ................................................................................................. 195
4.9.3.2 Advanced Transportation Management Systems (ATMS) .............................. 196
4.9.3.3 Advanced Traveler Information Systems (ATIS) .................................................. 199
4.9.3.4 System Integration ................................................................................................................. 200
4.9.4 ASSESSMENT OF INTELLIGENT TRANSPORTATION SYSTEMS ......................... 200
4.9.5 RECOMMENDATION OF INTELLIGENT TRANSPORTATION SYSTEM
INFRASTRUCTURE ............................................................................................................................................. 204
4.9.5.1 Communication Architecture .......................................................................................... 205
4.9.5.2 Communication Network ................................................................................................. 209
4.9.5.3 Communication Hubs ......................................................................................................... 209
4.9.5.4 Closed Circuit Television Systems ................................................................................ 209
4.9.5.5 Dynamic Message Sign Systems ..................................................................................... 210
Traffic Management Center .............................................................................................................. 211
4.9.5.6 Other ITS Elements .............................................................................................................. 212
4.9.5.7 Development of City’s ITS Master Plan – Roadmap for Deployment of ITS
Infrastructure .............................................................................................................................................. 212
4.10 TRUCK ROUTES .................................................................................................................................... 217
4.10.1 INTRODUCTION ................................................................................................................................. 217
4.10.2 PLANNING TRUCK ROUTES ....................................................................................................... 217
4.10.3 FUTURE TRUCK ROUTES ............................................................................................................... 218
4.10.4 TRUCK ROUTES DESIGN PLANNING ................................................................................... 218
4.10.5 SMART GROWTH DESIGN ELEMENTS ................................................................................ 218
4.11 AIR QUALITY AND SMART GROWTH DESIGN ELEMENTS ................................. 221
4.11.1 INTRODUCTION ................................................................................................................................. 221
4.11.2 ROADWAY NETWORK .................................................................................................................. 221
4.11.3 BICYCLE AND PEDESTRIAN FACILITIES ............................................................................... 222
4.11.4 PARK AND RIDE FACILITIES ......................................................................................................... 223
4.11.5 RAILROAD CROSSINGS .................................................................................................................. 224
4.11.6 TRUCK FACILITIES ................................................................................................................................ 224
4.11.7 SUSTAINABILITY POLICIES, STANDARDS, AND PERFORMANCE MEASURES224
4.12 TRANSPORTATION DEMAND MANAGEMENT ........................................................... 225
4.12.1 INTRODUCTION ................................................................................................................................. 225
4.12.2 TDM TOOLKIT ....................................................................................................................................... 225
4.12.3 TDM MEASURES .................................................................................................................................... 226
4.13 TRANSIT FACILITIES ........................................................................................................................... 228

TRANSPORTATION MASTER PLAN CITY OF TRACY
Page - vi Transportation Master Plan • November 2012
4.13.1 INTRODUCTION ................................................................................................................................. 228
4.13.2 PLANNED TRANSIT IMPROVEMENTS .................................................................................. 228
4.13.2.1 Local Fixed-Route Bus Service (Tracer) .................................................................... 228
4.13.2.2 Regional Intercity Fixed-Route Bus Service ............................................................. 228
4.13.2.3 BART Extension ..................................................................................................................... 228
4.13.2.4 Altamont Commuter Express/High Speed Rail .................................................... 229
4.13.3 FUTURE TRANSIT FACILITIES ON TRACY ROADWAYS......................................... 229
INTENTIONALLY LEFT BLANK. ................................................................................................................. 230
5. HORIZON YEAR TRANSPORTATION MASTER PLAN-COST
ESTIMATES ........................................................................................................ 233
5.1 INTRODUCTION ................................................................................................................................. 233
5.2 OVERPASS/UNDERPASS/BRIDGE/CULVERT ..................................................................... 233
5.3 INTERSECTIONS ................................................................................................................................... 237
5.4 ROADWAY SEGMENTS .................................................................................................................. 241
5.4.1 FRONTAGE POLICY .......................................................................................................................... 241
5.4.2 PROGRAM COSTS .............................................................................................................................. 247
5.5 INTELLIGENT TRANSPORTATION SYSTEM ..................................................................... 250

TRANSPORTATION MASTER PLAN CITY OF TRACY
Transportation Master Plan • November 2012 Page - vii
APPENDICES
APPPENDIX A - 2007 REGIONAL TRANSPORTATION PLAN PLANNED IMPROVEMENTS
APPPENDIX B - LEVEL OF SERVICE CALCULATION WORKSHEETS
APPPENDIX C - TRACY TRAVEL DEMAND MODEL ADJUSTMENTS
APPPENDIX D - TRACY TRAVEL DEMAND MODEL TRIP ASSIGNMENT
APPPENDIX E - ELLIS SPECIFIC PLAN CROSS SECTIONS
APPPENDIX F - ILLUSTRATIONS OF TYPICAL TRAFFIC CIRCLES (MINI- ROUNDABOUTS) AND ROUNDABOUTS
APPPENDIX G - PIPELINES LOCATION MAPS
APPPENDIX H - CONCEPTUAL LAYOUTS OF INTERSECTION IMPROVEMENTS
TRANSPORTATION MASTER PLAN CITY OF TRACY
Page - viii Transportation Master Plan • November 2012
LIST OF TABLES
Tracy Vehicle Miles Traveled (VMT) per Service Population Calculations ....................................... 1
Tracy VMT per Service Population ......................................................................................................................... 2
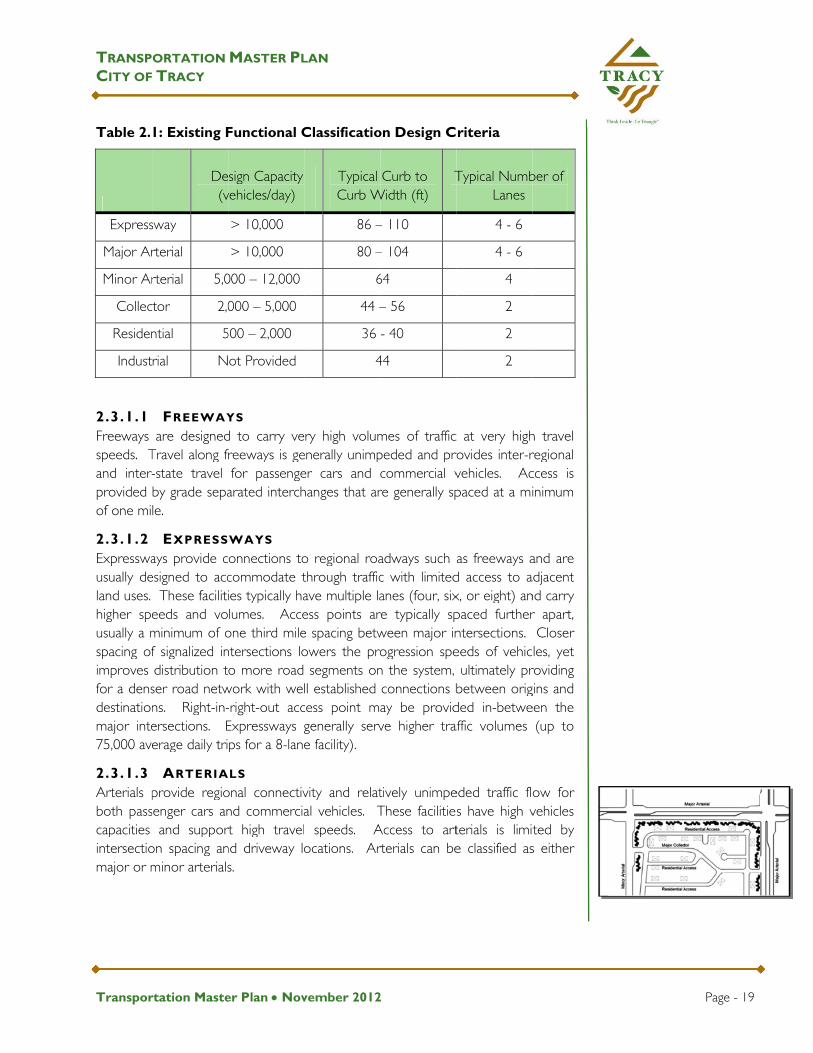
Table 2.1: Existing Functional Classification Design Criteria ................................................................... 19
Table 2.2: HCM Level of Service Criteria for Unsignalized Intersections........................................ 58
Table 2.3: HCM Level of Service Criteria for Signalized Intersections ............................................. 59
Table 2.4: Existing Intersection Level of Service ........................................................................................... 60
Table 3.1: Land uses in the Tracy Travel Demand Model: 2004 and 2006 ................................... 67
Table 3.2: Land uses outside Tracy SOI: Horizon Year and 2050 .................................................... 68
Table 3.3: Reduction Summary – Daily VMT in 2020 .............................................................................. 69
Table 3.4: Transportation Master Plan Land Use Assumptions Within Tracy SOI .................... 71
Table 3.5: FARs and Employment Densities ................................................................................................... 75
Table 3.6: Tracy Model Approximate Peak Hour Vehicle Trip Generation Rates .................... 75
Table 3.7: Trip Reductions Due to SAP Measures – Horizon Year .................................................. 76
Table 3.8: Tracy Model Estimated Peak Hour Vehicle Trip Generation for Service Areas .. 76
Table 3.9: Citywide Trip Distribution ................................................................................................................. 78
Table 4.1: Tracy Transportation Master Plan: Transportation Operations Sustainability
Benefits ............................................................................................................................................................................. 107
Table 4.2: Tracy Transportation Master Plan: Transportation Infrastructure Sustainability
Benefits ............................................................................................................................................................................. 109
Table 4.3: Horizon Year Intersection Level of Service ......................................................................... 127
Table 4.4: Over/Underpass Facilities Summary ......................................................................................... 153
Table 4.5: Bridge Facilities Summary ............................................................................................................... 154
Table 4.6: Culvert Facilities Summary ............................................................................................................. 157
Table 4.7: Recommended Cross Section Characteristics .................................................................... 183
Table 4.8: Comparison of Traffic Circles and Roundabouts Design and Operational
Elements .......................................................................................................................................................................... 185
Table 4.9: City of Tracy TDM Measures ...................................................................................................... 226
Table 5.1: Total Preliminary Cost Estimates for Horizon Year TMP Infrastructure .............. 233
Table 5.2: Preliminary Cost Estimates for Overpass/Underpass/Bridge/Culvert ..................... 235
Table 5.3: Preliminary Cost Estimates for Intersections ....................................................................... 239
Table 5.4: Preliminary Cost Estimates for Roadway Segments ........................................................ 248
Table 5.5: Preliminary Cost Estimates for Intelligent Transportation System Infrastructure251

TRANSPORTATION MASTER PLAN CITY OF TRACY
Transportation Master Plan • November 2012 Page - ix
LIST OF FIGURES
Figure 2.1: Regional Location ..................................................................................................................................... 9
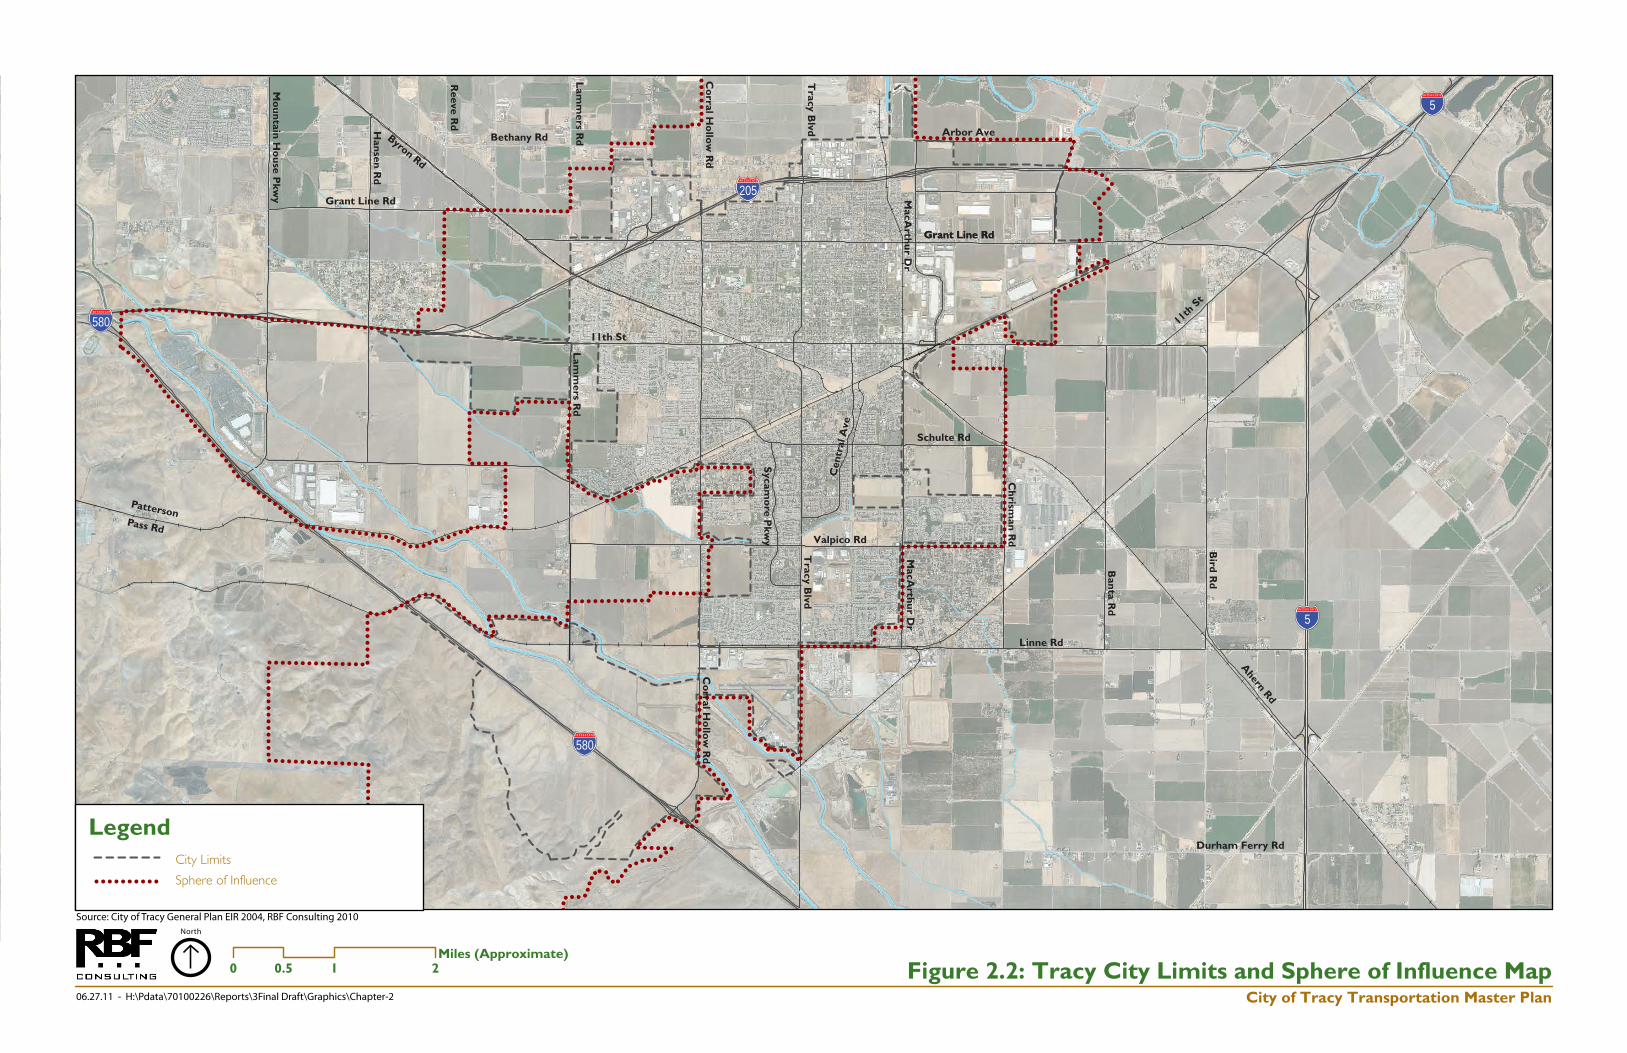
Figure 2.2: City Limits and Sphere of Influence Map ................................................................................... 11
Figure 2.3: Existing Land Use Map ....................................................................................................................... 15
Figure 2.4: Existing Roadway Functional Classification .............................................................................. 18
Figure 2.5: Existing Bikeways ................................................................................................................................... 23
Figure 2.6: Existing Sidewalks .................................................................................................................................. 27
Figure 2.7: Existing Park and Ride Facilities ..................................................................................................... 31
Figure 2.8: Existing Truck Routes ......................................................................................................................... 37
Figure 2.9: Railroad Crossings ................................................................................................................................ 41
Figure 2.10: Existing Bridges and Culverts ....................................................................................................... 47
Figure 2.11: Existing Traffic Signal Locations and Communications Infrastructure .................... 51
Figure 2.12: Existing Transit ..................................................................................................................................... 55
Figure 3.1: Tracy Future Services ........................................................................................................................... 73
Figure 3.2: Horizon Year Roadway Network ................................................................................................. 79
Figure 3.3a: Horizon Year AM Peak Hour Volumes ................................................................................... 83
Figure 3.3b: Horizon Year PM Peak Hour Volumes ................................................................................... 85
Figure 3.4a: Horizon Year AM Peak Hour V/C Ratio ................................................................................ 87
Figure 3.4b: Horizon Year PM Peak Hour V/C Ratio ................................................................................. 89
Figure 3.5: TMP Right of Way Map ...................................................................................................................... 93
Figure 3.6a: Buildout AM Peak-Hour V/C Ratio ............................................................................................ 95
Figure 3.6b: Buildout PM Peak-Hour V/C Ratio ............................................................................................ 97
Figure 4.1: Railroad Crossings and Improvements .................................................................................... 113
Figure 4.2: Study Intersection Locations ......................................................................................................... 119
Figure 4.3a: Horizon Year AM(PM) Peak Hour Volumes ..................................................................... 121
Figure 4.3b: Horizon Year AM(PM) Peak Hour Volumes ..................................................................... 123
Figure 4.4a: Horizon Year Intersection Lane Configuration ................................................................. 131
Figure 4.4b: Horizon Year Intersection Lane Configuration ................................................................ 133
Figure 4.5: Horizon Year AM(PM) Peak Hour Intersection LOS ...................................................... 135
Figure 4.6: Existing and Future Bike Routes .................................................................................................. 141
Figure 4.7: Existing and Future Sidewalks ....................................................................................................... 151
Figure 4.8: Bridges and Culverts .......................................................................................................................... 155
Figure 4.9a: Future Roadway Classification .................................................................................................... 161
TRANSPORTATION MASTER PLAN CITY OF TRACY
Page - x Transportation Master Plan • November 2012
Figure 4.9b: Recommended CMP Network Map ..................................................................................... 163
Figure 4.10: Typical 6-Lane Parkway................................................................................................................. 165
Figure 4.11: Typical 6-Lane Arterial .................................................................................................................. 166
Figure 4.12: Typical 2-Lane Major Collector ................................................................................................ 167
Figure 4.13: Typical 2-Lane Residential Street With Parking on Both Sides ............................... 168
Figure 4.14: Typical Industrial Street with Two-Way Left-Turn Lane ............................................ 169
Figure 4.15a Parkway Roadway Cross Sections ......................................................................................... 171
Figure 4.15b Arterial Roadway Cross Sections .......................................................................................... 173
Figure 4.15c Arterial Roadway Cross Sections ........................................................................................... 175
Figure 4.15d Collector Street Cross Sections ............................................................................................. 177
Figure 4.15e Residential Street Cross Sections .......................................................................................... 179
Figure 4.15f Industrial Roadway Cross Sections ......................................................................................... 181
Figure 4.16: Typical Roundabout Approach ................................................................................................. 186
Figure 4.17: Existing and Future Park and Ride Facilities ....................................................................... 191
Figure 4.18: Key Program Areas of ITS Strategies ..................................................................................... 202
Figure 4.19: Areas of ITS Strategies .................................................................................................................. 203
Figure 4.20: ITS proposed system architecture .......................................................................................... 207
Figure 4.21: Future Horizon Year ITS Infrastructure ................................................................................ 213
Figure 4.22 Future Truck Routes ........................................................................................................................ 219
Figure 4.23 Long term Transit Service Plan .................................................................................................. 231
Figure 5.1 Roadway Cross Section Responsibility ..................................................................................... 243
Figure 5.2 Irrevocable Offer of Dedication (IOD) and Roadway Improvement Responsibility
per Frontage Policy .................................................................................................................................................... 245
TRANSPORTATION MASTER PLAN CITY OF TRACY
Transportation Master Plan • November 2012 Page - 1
1. INTRODUCTION 1.1 INTRODUCTION In 2008, the City of Tracy began an update of the Transportation Master Plan (TMP). The TMP was last updated in 1994. According to the City’s 2006 General Plan, the city’s population has more than doubled to approximately 74,000 residents between 1990 and 2004. During a similar time period, the number of jobs has almost tripled to 29,000.
The transportation system is a key element in maintaining historical growth and accommodating future development. The transportation system includes three major freeways; several active rail lines; local and regional truck routes; arterial, collector, and residential streets; and bicycle, pedestrian, and transit facilities. The City is responsible for ensuring that the transportation system is providing adequate and efficient access for all modes.
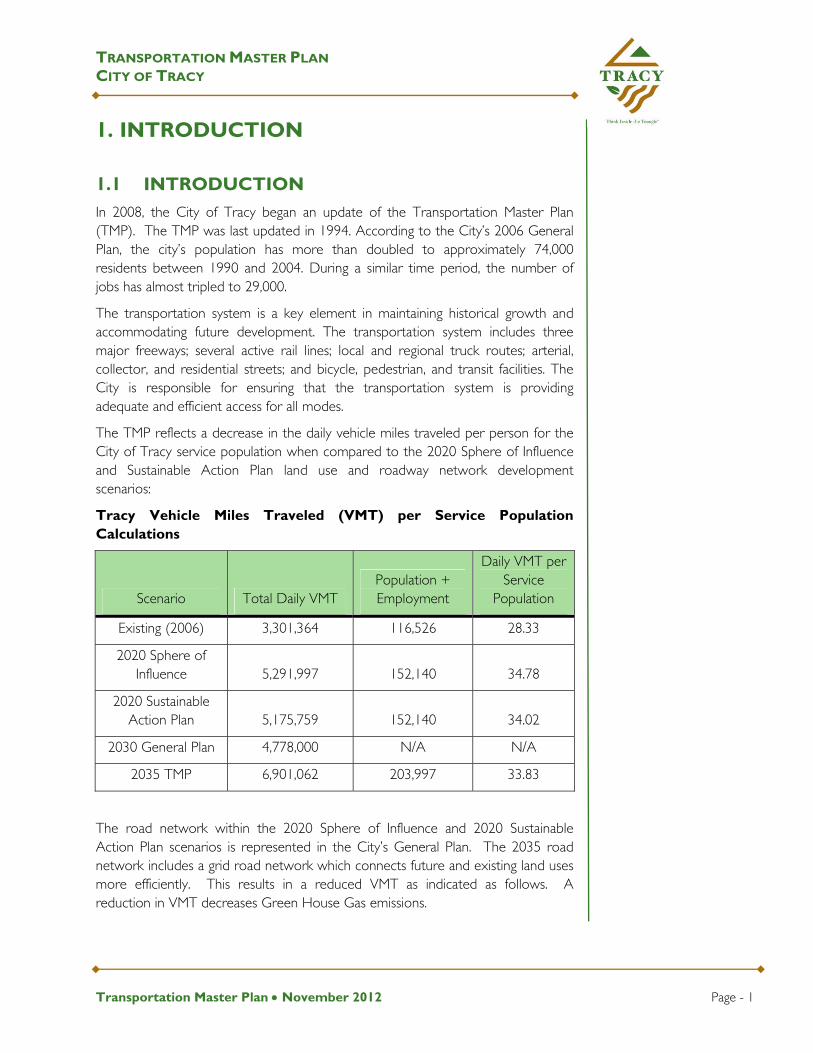
The TMP reflects a decrease in the daily vehicle miles traveled per person for the City of Tracy service population when compared to the 2020 Sphere of Influence and Sustainable Action Plan land use and roadway network development scenarios:
Tracy Vehicle Miles Traveled (VMT) per Service Population Calculations
Scenario Total Daily VMT
Population + Employment
Daily VMT per Service
Population
Existing (2006) 3,301,364 116,526 28.33
2020 Sphere of Influence 5,291,997 152,140 34.78
2020 Sustainable Action Plan 5,175,759 152,140 34.02
2030 General Plan 4,778,000 N/A N/A
2035 TMP 6,901,062 203,997 33.83
The road network within the 2020 Sphere of Influence and 2020 Sustainable Action Plan scenarios is represented in the City’s General Plan. The 2035 road network includes a grid road network which connects future and existing land uses more efficiently. This results in a reduced VMT as indicated as follows. A reduction in VMT decreases Green House Gas emissions.

TRANSPORTATION MASTER PLAN CITY OF TRACY
Page - 2 Transportation Master Plan • November 2012
1.2 PURPOSE OF TMP The TMP builds upon the goals and objectives as defined in the Circulation Element of the City’s General Plan (July 2010) and the Sustainable Action Plan (SAP) (February 1, 2011). The SAP included feasible measures to achieve sustainability in multiple sectors and to reduce greenhouse gas (GHG) emissions. These measures include policies and measures to increase transit usage and opportunities, to improving traffic flow in the city, to support development of new bicycle and pedestrian facilities, and other land use policies.
The General Plan is based upon a future horizon year of 2030 conditions. The TMP looks out another five years, to Horizon Year (2035), to provide the maximum possible infrastructure planning and to be consistent with the planned San Joaquin Council of Governments travel demand model update to Year 2035.
The TMP provides a comprehensive review of the City’s transportation system and serves as a comprehensive planning document, or blueprint, that can be utilized to identify and implement required improvements to the existing roadway system as well as expand upon the system to accommodate future development consistent with the recent General Plan update.
31
32
33
34
35
36
27
28
29
30
Year
Dai
ly V
MT
Per
Per
son
(Mile
s)
20062010
20152020
20252030
2035
2020
Sphe
re o
f Influ
ence
Roa
d Netw
ork
2020
Susta
inable
Acti
on Pl
an R
oad N
etwor
k
2035 Transportation Maste
r Plan
34.78
34.02
57%Reduction inVMT Growth
30.86
33.83
28.33
Tracy VMT per Service Population

TRANSPORTATION MASTER PLAN CITY OF TRACY
Transportation Master Plan • November 2012 Page - 3
The TMP also balances the existing and future transportation infrastructure needs with safe access for all user groups (motorists, pedestrians, bicyclists, and transit users) by incorporating strategies, principles, and design elements such as Smart Growth design elements, Context-Sensitive Design, and Complete Streets guidelines.
The Tracy TMP includes extensive use of principles of Complete Streets and Smart Growth principles through the development of a transportation system that will address all future transportation needs:
• Transit (bus, and rail)
• Cycling
• Walking
• Private vehicle movement
• Good vehicle movement
The road network system is designed to provide a comprehensive grid system of hierarchal streets that provides for a well-connected City, reduces trip lengths, promotes non-motorized travel and reduces the per capita emission of greenhouse gasses.
Every transportation element of the TMP includes implementation of Smart Growth and Complete Streets principles. Additional, comprehensive information is included in the TMP that further identifies guidelines for use in the detail design and implementation of the TMP.
This TMP shall be updated every five years for consideration of required improvements and related costs.
1.3 DEVELOPMENT OF TMP The development of the TMP was conducted with the following steps:
Step 1: Forecast Horizon Year Conditions: The City of Tracy Travel Demand model was updated to project Horizon Year conditions. Sustainable land use and transportation strategies were incorporated; Horizon Year and build-out land uses for each future service in the General Plan Update from the City were obtained; Horizon Year and build-out plan-line roadway networks (classification and number of lanes), based on the model link volume forecasts, incorporating the effects of the sustainability strategies were developed; and future intersection volumes were forecasted.
Step 2: Assess Horizon Year Roadway Network Conditions: The results from Step 1 was used to evaluate each aspect of the transportation system (roadway and intersection capacity, bridges/canals/culverts, bicycle and pedestrian

TRANSPORTATION MASTER PLAN CITY OF TRACY
Page - 4 Transportation Master Plan • November 2012
facilities, train crossings, truck facilities, park and ride facilities, and ITS system).
Step 3: Identify Horizon Year Roadway Improvements: The results from Step 2 were used to identify whether roadways and intersections needed to be widened, whether adequate bicycle and pedestrian facilities were provided and what gaps were missing in the system. Railroad and bridges/canal/culvert crossings were examined to determine whether sufficient capacity was provided. Updated roadway cross sections for various types of roadways were prepared to provide adequate access for all modes of travel. Improvements were identified to address projected deficiencies in other areas (e.g. park and ride facilities, ITS equipment, truck routing system).
Step 4: Finalize the Plan and Identify Capital Costs: Input on the proposed list of improvements was obtained from City staff and various stakeholders and preliminary cost estimates for implementation were developed.
1.4 OBJECTIVES OF THE TMP The following are objectives of the TMP:
• Provide an Implementation Plan for the Circulation Element of the City of Tracy General Plan (2011).
• Serve as a comprehensive planning document or blueprint that identifies and requires improvements to the existing transportation system and expands upon the system to accommodate future development consistent with the General Plan. The system includes transit passenger movement, goods movement, pedestrian movement, bicycle movement and private vehicular movement.
• Establish a framework of goals, policies, and implementation methodology that outlines improvement projects and programs, identifies financial resources and allocates funding, and sets project priorities to provide a safe and efficient transportation system that meets the community’s needs.
• Guide the development of transportation infrastructure and services as growth occurs under the General Plan.
• Facilitate a transportation system that is a multi-modal network of roads, bicycle lanes and paths, transit services, and pedestrian facilities that will support the planned land uses in the City by providing mobility to residents and visitors alike.
• Balance existing and future transportation infrastructure needs with safe access for all user groups (motorists, pedestrians, bicyclists, and transit users) by incorporating strategies, principles, and design elements such as Smart Growth design elements, Context-Sensitive Design, and Complete

TRANSPORTATION MASTER PLAN CITY OF TRACY
Transportation Master Plan • November 2012 Page - 5
Street guidelines.
• Facilitate the provision of an improved transportation system that enhances mobility, accommodates future growth, and maintains the quality of life in Tracy.
• Establish policies and priorities to maintain and improve the transportation system.
• Maintain consistency with the San Joaquin County Expressways Study,
• Preserve four-lane maximum arterial widths where possible to promote a more walkable, bikeable environment, particularly in new areas of future development where sustainable practices can be applied in an equitable manner.
• Decrease right-of-way and vehicular lane widths which implement Complete Street principles.
• Maintain consistency with the roadway plans in entitled project areas (Ellis Specific Plan and Gateway).
• Provide maximum roadway v/c ratios of 0.8 – 0.9 (roughly corresponding to a LOS D - E operation on a link-volume basis) to the greatest extent possible.
• Ensure the provision of bicycle and pedestrian facilities that connect people and places.
• Develop a comprehensive bicycle and pedestrian system that ensures a multi-modal infrastructure network.
• Develop a comprehensive circulation system that identifies bridge and culvert crossings to minimize traffic conflicts and preserve open space and preservation areas.
• Develop a comprehensive Park and Ride system that supports resident transit usage or carpooling to commute from the City.
• Provides a nexus for a Traffic Impact Fee Program that will fund the development of the planned transportation system through payment of impact fees by all future development.
• Develop Travel Demand Management (TDM) principles that reduces private vehicle trips and build on the regional TDM programs developed by the SJCOG
• Provide for a comprehensive transit system on all new collector, arterial and expressway roadways and providing opportunity for expanding transit services on the existing roadways.

TRANSPORTATION MASTER PLAN CITY OF TRACY
Page - 6 Transportation Master Plan • November 2012
1.5 REPORT ORGANIZATION The TMP is organized into the following chapters:
Chapter 1: Introduction – Description and purpose of a transportation master plan
Chapter 2: Existing Transportation System – Description of the existing transportation roadway system (roadway functional classification, intersection operations, pedestrian and bicycle facilities, park and ride facilities, truck facilities, bridges/canals/culverts, railroad facilities, and intelligent transportation system).
Chapter 3: Overview of TMP Development Process – Description of Horizon Year and Buildout planning horizons including land use, roadway network, mode split, trip generation and distribution, and future roadway plan lines.
Chapter 4: Horizon Year TMP – Recommended improvements to support Horizon Year growth for the various transportation elements as indicated in Chapter 2.
Chapter 5: Horizon Year TMP Cost Estimates – Discussion of the cost estimates to provide the Horizon Year infrastructure recommendations.
TRANSPORTATION MASTER PLAN CITY OF TRACY
Transportation Master Plan • November 2012 Page - 7
2. EXISTING TRANSPORTATION SYSTEM 2.1 INTRODUCTION The purpose of this chapter is to provide perceptive as to the scale of the existing transportation systems in the City of Tracy and to identify any existing operating deficiencies. The findings from this chapter will be incorporated into the Horizon Year Transportation Master Plan (TMP) to help determine the needs of the City for short and long-term future conditions.
The existing conditions determine the baseline conditions from which the Horizon Year transportation system is developed. The following elements of the transportation system in Tracy are evaluated in this chapter:
• Automobile Mobility
o Street Segments
o Intersections
o Canal and Creek Crossings
o Roadway Bridges
o Railroad Crossings
o Park and Ride
o Parking
• Pedestrian Mobility
• Bicycle Mobility
• Heavy Vehicle Mobility
• Transit
• Intelligent Transportation System
The ultimate goal of the TMP is to develop a framework of goals, policies and implementation methodology that outlines improvement projects and programs, identifies financial resources and allocates funding, and sets project priorities to provide a safe and efficient transportation system that meets the community’s needs.
Tracy residents are served by an extensive, multi-modal transportation system that includes walking and cycling facilities (on-road cycling facilities, sidewalks and multi-use pathways), transit services (on-road bus services and Park & Ride lots), roads (freeways, arterials, collector and local roads) and parking facilities (on-street and off-street).

Pagge - 8
The City of
2.2 ST2.2.1 RE
The City oAmerican CAlthough tapproximat
The City osouthwest pcenter of aInterstate 5travel and g580, to theagencies goTracy:
• Inte
• RegCo
• TraTra
• Loc
Figure
Tracy residCensus estautomobiletraveled byApproximahouseholds
f Tracy’s trans
TUDY AREGIONAL C
of Tracy is hoCommunity Sthe current ctely 70% is bu
f Tracy is locaportion of San triangle that
580 (I-580). Tgoods distribue north alongovern the tr
erstate Freew
gional Transpouncil of Gove
ansit – San Jansit District, a
cal Streets – C
e 2.2 presents
dents use autotimated that es (78% drovey walking and ately 97% ofs owning an av
T
sit service will
REA CONTEXT
ome to roughSurvey 3-Yearcity boundaryilt out.
ated approximn Joaquin Couis formed by
This orientatioution to the wg the I-5, anransportation
ways – Caltrans
portation Planernments, and
oaquin Regioand City of Tr
City of Tracy
s the existing
omobiles moin 2008 app
e alone, 16% cjust over 1%
f householdsverage of 1.2
TRANS
Transportati
be updated a
hly 82,000 per Estimates a
y covers an a
mately fifty munty (Figure y Interstate 5on provides mwest towards d to southerinfrastructure
s
nning – Sand City of Tracy
onal Rail Comracy
City limit and
re than any oproximately 9carpooled), 3
% traveled by s own at leeach.
SPORTATION
ion Master P
as part of tier
eople based as identified barea of some
miles east of S2.1). The C(I-5), Interstat
multiple accessSan Francisco
rn California e manageme
Joaquin Coy
mmission, San
d a parcel map
other mode 94% of comm% traveled byother modes
east one mo
N MASTER PCITY OF TR
Plan • Novem
2.
on the 2006by the US Ce 22 square
an Francisco ity is situated te 205 (I-205s points for reo Bay Area alalong I-5. M
ent in and a
ounty, San Jo
n Joaquin Re
p of the City.
of travel. Thmuters traveley transit, almos of transportotor vehicle,
PLAN RACY
mber 2012
-2008 ensus. miles,
in the in the ), and
egional ong I-ultiple round
oaquin
egional
he US ed by ost 2% tation.
with

F I G U R E 1
P a c i f i c O c e a n
§̈¦5
§̈¦80tu101
§̈¦5
§̈¦80
§̈¦80
§̈¦80
§̈¦505
§̈¦580
§̈¦280
tu101
tu50
§̈¦680§̈¦880tu101
§̈¦5
§̈¦205
Napa
Tracy
Davis
Modesto
Oakland
San Jose
Stockton
Fairfield
Sacramento
San Francisco
Lake
Yolo
Sonoma
Stanislaus
Napa
San Joaquin
Solano
Santa Clara
Sutter
Marin
Alameda
Sacramento
Contra Costa
San Mateo
Santa Cruz
0 10 205Miles
N O R T H
C I T Y O F T R A C Y G E N E R A L P L A N E I R
N O T I C E O F P R E P A R A T I O N - J u n e 3 0 , 2 0 0 4
R E G I O N A L L O C A T I O N
SanFrancisco
Tracy
Sacramento
Los Angeles
California
Nevada
Oregon Idaho
0 100 20050Miles
NorthSource: City of Tracy General Plan EIR 2004
06.27.11 - H:\Pdata\70100226\Reports\3Final Draft\Graphics\Chapter-2 City of Tracy Transportation Master PlanFigure 2.1: Regional Location

TRANSPORTATION MASTER PLAN CITY OF TRACY
Page - 10 Transportation Master Plan • November 2012
Intentionally Left Blank.
Grant Line Rd
Grant Line Rd
PattersonPass Rd
Schulte Rd
Grant Line Rd
Arbor Ave
11th St
Bethany Rd
Durham Ferry Rd
Linne Rd
Valpico Rd
11th
St
Byron Rd
Mo
un
tain H
ou
se Pkw
y
Reeve R
d
Han
sen R
d
Lam
mers R
dL
amm
ers Rd
Co
rral Ho
llow
Rd
Co
rral Ho
llow
Rd
Tracy B
lvdT
racy Blvd
MacA
rthu
r Dr
MacA
rthu
r Dr
Ch
risman
Rd
Sycam
ore P
kwy
Cen
tral
Ave
Ban
ta Rd
Bird
Rd
Ahern Rd
120CALIFORNIA
5
5
580
580
205
0 1 20.5Miles (Approximate)
North
Legend
Figure 2.2: Tracy City Limits and Sphere of Influence Map
City Limits
Sphere of Influence
Source: City of Tracy General Plan EIR 2004, RBF Consulting 2010
City of Tracy Transportation Master Plan06.27.11 - H:\Pdata\70100226\Reports\3Final Draft\Graphics\Chapter-2


TRANSP
CITY OF
Transpor
Goods moI-205 freein 2008 approximavolumes o132 /Chrpercent of
Figure 2map.
San Joaquwhich havJoaquin C
• H
• R
• Si
• T
• B
A completeincluded in A
The 2007 Governmencongestion a
• D
• D
• Li
• C
2.2.2 E
The City of Emerald Citand surrounSeveral tranTracy progra
ORTATION
TRACY
rtation Maste
ovement is alsway carries heast of Tracately 11 percover its entire risman Avenuf all traffic.
.3 shows the
uin County have been outlouncil of Gov
Highway mainl
Roadway and i
ignal control u
ransit facility i
icycle facility i
e listing of thAppendix A.
Regional Cts, Decembeand its econom
Developing new
Developing new
imiting Vehicle
Coordinating b
EMERALD T
f Tracy has staties Collaboranding metroposportation suam. These ob
MASTER PL
er Plan • Nov
so a significaneavy truck vocy Boulevardcent of all trlength. Total
ue, was appr
e existing land
as numerous ined in the 2
vernments, Ma
ine and interc
ntersection im
upgrades and
mprovements
mprovements
he planned im
Congestion Maer 6, 2007) mic impacts.
w land use m
w multi-moda
e Miles Trave
between privat
TRACY
arted the Emeative (ECC). olitan areas bstainability obbjectives inclu
LAN
vember 2012
t element of olumes over it was over raffic. I-580 ftruck traffic i
roximately 6,0
uses in the C
regional trans2007 Regionaay 2007). The
change safety a
mprovements
coordination
s
s
mprovements
anagement Pidentifies t
The strategie
onitoring and
al performanc
led (VMT) gro
ate and public
erald Tracy pThe goal of y making the
bjectives have de a:
2
total travel dets entire lengt11,200 truckfreeway also n 2008 on I-5000 truck tri
City overlaid
sportation impal Transportatiese include bu
and operation
improvement
identified in
Plan (San Johe strategic s include:
information p
e measures
owth
agencies
pilot program the programm more envibeen establis
emand in Trath. Total truckk trips per d
carries heavy580, east of Hips per day,
on the existin
provements pion Plan (RTPut are not lim
nal improvem
ts
the RTP ha
oaquin Counplan for re
program
which is partis to improv
ronmentally fshed by the E
cy. The k traffic day, or y truck
Highway or 18
ng base
planned P) (San ited to:
ents
as been
ncil of educing
t of the ve cities friendly. Emerald
Page - 13

TRANSPORTATION MASTER PLAN CITY OF TRACY
Page - 14 Transportation Master Plan • November 2012
Intentionally Left Blank.

North
Figure 2.3: Existing Land Use Map
Source: City of Tracy General Plan EIR 2004
City of Tracy Transportation Master Plan06.27.11 - H:\Pdata\70100226\Reports\3Final Draft\Graphics\Chapter-3


TRANSP
CITY OF
Transpor
• 20tr
• 20tr
• 20
• 20le
To make establishedof the idea
• Insh
• Inm
• Fi
• Dal
2.3 INT
The City vehicles, tof the elem
2.3.1 F
Roadwaysclassificatiothey servefrom regioroadways
DescriptioTracy areroadway fkey charanumber o
ORTATION
TRACY
rtation Maste
0% increase ravel demand
0% increase inravel demand
0% reduction
0% reductionevels.
sure objectivd from ideas as that are ap
nstalling parkinharing program
ncreasing transmile of 75 perc
lling the gaps
Develop a botong the City’s
NFRASTTRANSPO
of Tracy roadtransit, biking, ments that fo
UNCTION
s that comprison system. Te and the jurisonal facilities providing acc
ons of the exe provided infunctional clasacteristics (vef lanes) for th
MASTER PL
er Plan • Nov
in the percemanagement
n the percentmanagement
in the munici
n in the com
ves are reachthat were deplicable to tra
ng, shower am to promote
sit route covecent of reside
in sidewalks a
ttleneck imprs key corridor
RUCTURORTATIOdway networand walking.
rm the roadw
AL CLASSI
se the Tracy tThe system csdiction that th
serving the cess to land pa
xisting roadwan the followinssification in tehicular desighese various ty
LAN
vember 2012
entage of Citprograms fro
tage of non-Cprograms fro
pal VMT from
munity VMT
hed, action pleveloped durinansportation p
and dressing e bicycle usage
erage to be wnts in new de
along key ped
rovement prors.
RE ANON rk supports m The followin
way network.
IFICATION
transportationlassifies roadwhey fall undermobility of harcels for low
ay classificationg paragraphthe City of Tgn capacity, ypes of roadw
2
y employees om current (20
City employeeom current (20
m current (200
per capita fr
an measures ng communityplanning are:
facilities, ande,
ithin � mile oevelopments,
estrian routes
ogram to exe
ND M
multiple modeng sections p
N
n network areway types basr. The functiohigh volumes
volumes of v
n system thats. Figure 2.racy. Table typical curb-t
ways.
who particip006) levels.
es who partici006) levels.
06) levels.
from current
are currentlyy workshops.
d creating a
of all residents
s, and
ecute improve
ODES
es of travel inprovide a desc
e part of a hiesed on the fun of roadwayof vehicles t
vehicles.
at serves the .4 presents e2.1 summarizto-curb widt
pate in
ipate in
(2006)
y being Some
bicycle
s and �
ements
OF
ncluding cription
erarchal function ys range to local
City of existing zes the th, and
Mobility
Land Acces
Page - 17
ss
Arterials Collecto Local
rs

North
Source: City of Tracy General Plan EIR 2004
City of Tracy Transportation Master PlanFigure 2.4: Existing Roadway Funcitonal Classification
LegendMajor Arterial / Expressway / Boulevard
Minor Arterial / Major Collector
Minor Collector
City Limits
Sphere of Influence
06.27.11 - H:\Pdata\70100226\Reports\3Final Draft\Graphics\Chapter-2
TRANSP
CITY OF
Transpor
Table 2.
Express
Major Ar
Minor Ar
Collec
Residen
Indust
2.3.1.1 Freeways speeds. Tand inter-provided of one mi
2.3.1.2 Expresswausually deland uses. higher speusually a mspacing ofimproves for a densdestinationmajor inte75,000 av
2.3.1.3 Arterials pboth passcapacities intersectiomajor or m
ORTATION
TRACY
rtation Maste
1: Existing F
De(v
sway
rterial
rterial 5,0
ctor 2,0
ntial 5
rial N
FREEWAY
are designedTravel along f-state travel by grade sepale.
EXPRESS
ays provide cesigned to acc
These facilitieeds and vominimum of of signalized indistribution tser road netwns. Right-in-ersections. Eerage daily tri
ARTERIA
provide regiosenger cars an
and supporon spacing anminor arterials
MASTER PL
er Plan • Nov
Functional C
sign Capacity vehicles/day)
> 10,000
> 10,000
000 – 12,000
000 – 5,000
500 – 2,000
ot Provided
YS d to carry vefreeways is gefor passenge
arated interch
WAYS onnections tocommodate ties typically halumes. Acce
one third milentersections loo more road
work with we-right-out accExpressways gps for a 8-lane
LS onal connectivnd commerciart high travelnd driveway los.
LAN
vember 2012
Classificatio
Typical Curb W
86 –
80 –
6
44 –
36
4
ry high volumenerally unimper cars and hanges that ar
o regional roathrough trafficave multiple laess points are spacing betwowers the pro
segments onll established cess point mgenerally serve facility).
vity and relatal vehicles. T speeds. Aocations. Ar
2
on Design C
Curb to Width (ft)
T
– 110
– 104
64
– 56
- 40
44
mes of trafficpeded and procommercial vre generally sp
adways such c with limitedanes (four, sixre typically spween major inogression spen the system, connections bay be providve higher tra
tively unimpeThese facilitieAccess to artrterials can be
riteria
Typical NumbLanes
4 - 6
4 - 6
4
2
2
2
c at very highrovides inter-rvehicles. Acpaced at a mi
as freeways ad access to ax, or eight) anpaced furtherntersections. eeds of vehicultimately pr
between origded in-betweaffic volumes
eded traffic fls have high vterials is limite classified as
ber of
h travel regional ccess is inimum
and are adjacent nd carry r apart, Closer les, yet
roviding gins and een the
(up to
ow for vehicles ted by s either
Page - 19
TRANSPORTATION MASTER PLAN CITY OF TRACY
Page - 20 Transportation Master Plan • November 2012
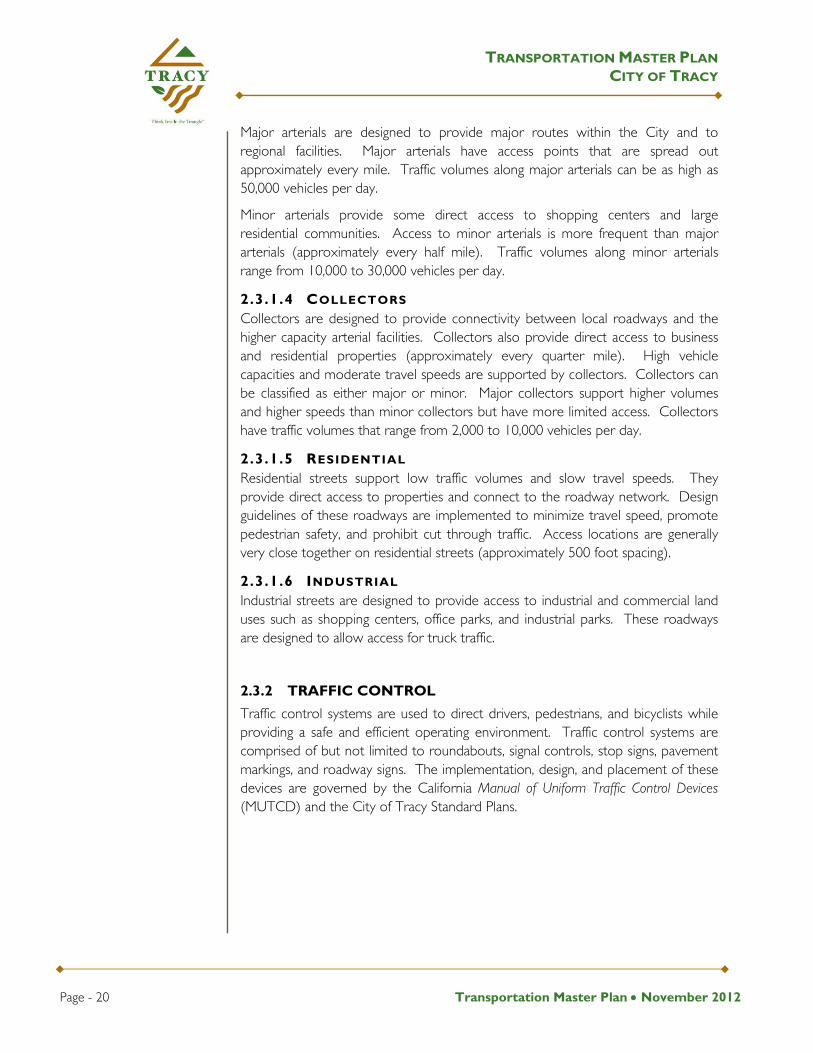
Major arterials are designed to provide major routes within the City and to regional facilities. Major arterials have access points that are spread out approximately every mile. Traffic volumes along major arterials can be as high as 50,000 vehicles per day.
Minor arterials provide some direct access to shopping centers and large residential communities. Access to minor arterials is more frequent than major arterials (approximately every half mile). Traffic volumes along minor arterials range from 10,000 to 30,000 vehicles per day.
2.3.1.4 COLLECTORS Collectors are designed to provide connectivity between local roadways and the higher capacity arterial facilities. Collectors also provide direct access to business and residential properties (approximately every quarter mile). High vehicle capacities and moderate travel speeds are supported by collectors. Collectors can be classified as either major or minor. Major collectors support higher volumes and higher speeds than minor collectors but have more limited access. Collectors have traffic volumes that range from 2,000 to 10,000 vehicles per day.
2.3.1.5 RESIDENTIAL Residential streets support low traffic volumes and slow travel speeds. They provide direct access to properties and connect to the roadway network. Design guidelines of these roadways are implemented to minimize travel speed, promote pedestrian safety, and prohibit cut through traffic. Access locations are generally very close together on residential streets (approximately 500 foot spacing).
2.3.1.6 INDUSTRIAL Industrial streets are designed to provide access to industrial and commercial land uses such as shopping centers, office parks, and industrial parks. These roadways are designed to allow access for truck traffic.
2.3.2 TRAFFIC CONTROL
Traffic control systems are used to direct drivers, pedestrians, and bicyclists while providing a safe and efficient operating environment. Traffic control systems are comprised of but not limited to roundabouts, signal controls, stop signs, pavement markings, and roadway signs. The implementation, design, and placement of these devices are governed by the California Manual of Uniform Traffic Control Devices (MUTCD) and the City of Tracy Standard Plans.

TRANSP
CITY OF
Transpor
2.3.3 E
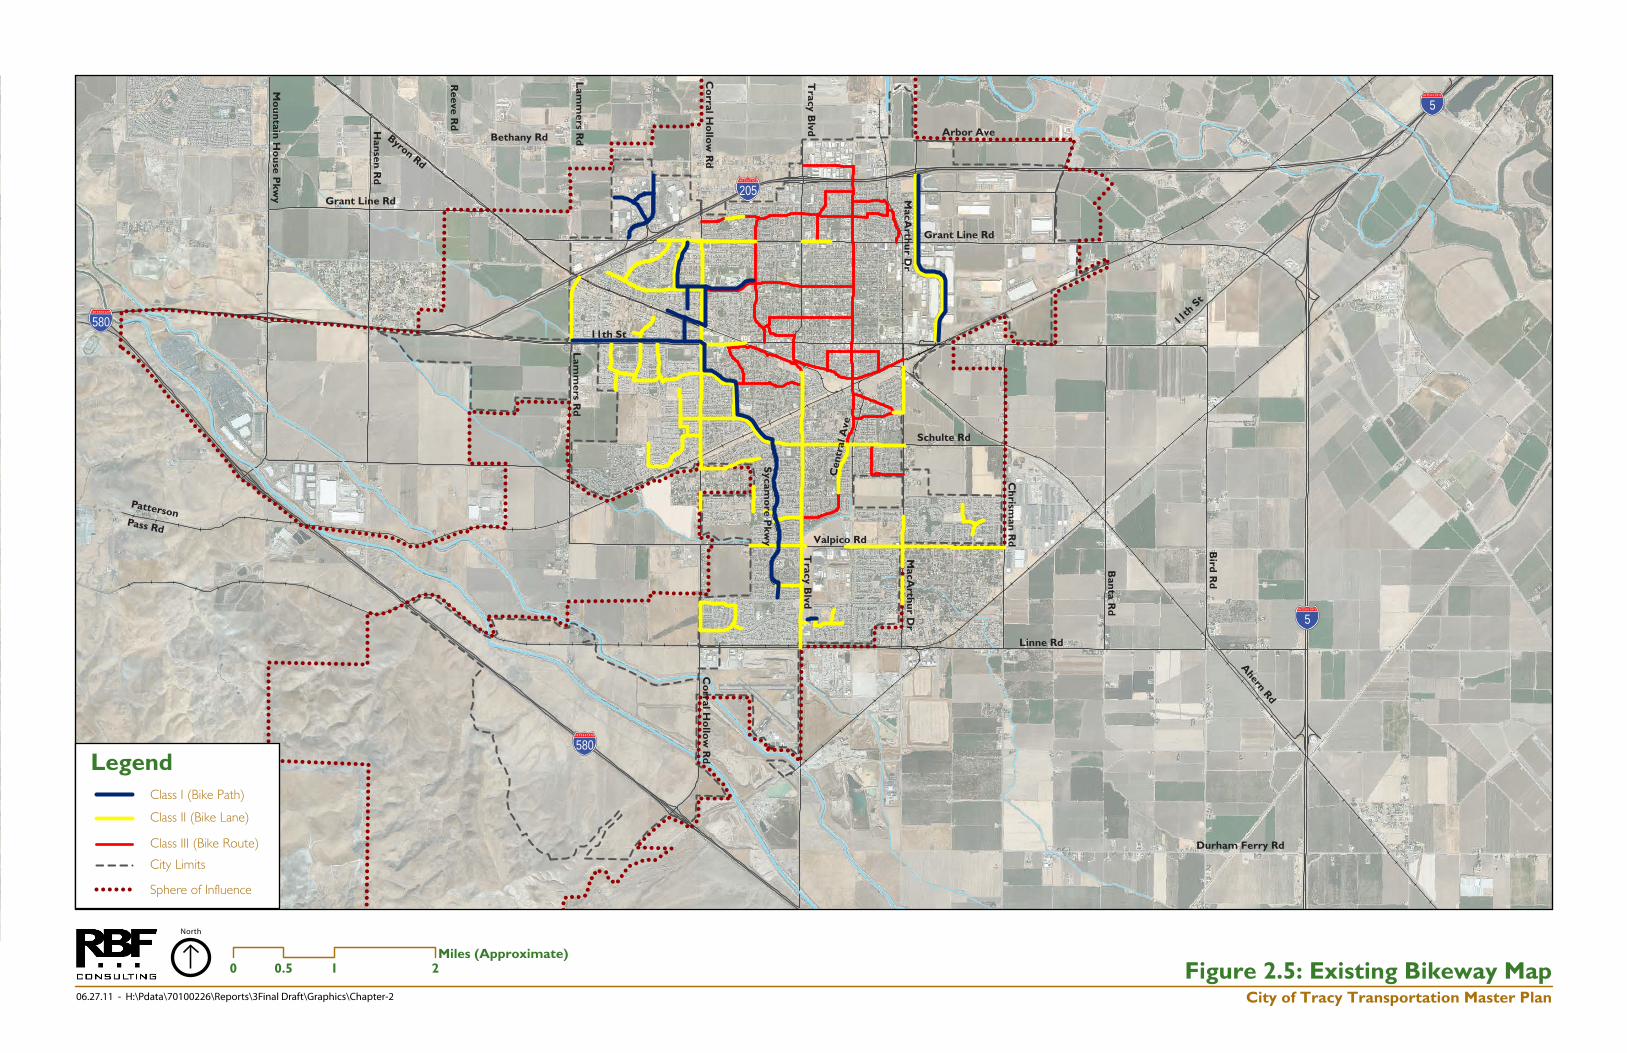
The City othe updatraising opin the proThe addefor improv
2.3.3.1 The City oDepartmestandards design staClass III. T
Class I Bikthat does by either bicyclists a
Class II Bportion oand are sprovide selanes for m
Class III Broadway wby stripingClass II fasystem.
The City ocategoriesgaps that destination
• T
• T
• Tof
ORTATION
TRACY
rtation Maste
EXISTING B
of Tracy update was to reportunities ancess of develondum, Tracy Mving the existi
BICYCLE
of Tracy usesent of Transpo
are outlined ndards classifyThe categorie
keway (Bike Pnot share theopen space o
and pedestrian
Bikeway (Bike f the roadwaigned and maervice for onemotorized veh
ikeway (Bike with motorizeg. Class III Bicilities or to c
of Tracy has as (Figure 2.5
limit its effens. The gaps
hree segment
o Betwe
o Betwe
o Under
racy Boulevar
wo segmentsf Schulte Road
MASTER PL
er Plan • Nov
BICYCLE C
ated its Bikewavise the 199
nd provide a loping an addeMaster Plan Dng bicycle circ
FACILITIE
the Caltrans ortation, 2006in Chapter
y bikeway facs are describe
Path) – A Clase roadway witor a physical ns.
Lane) – A y with motorarked for exce-way bicycle hicles.
Route) – A Ced vehicles. Tkeways are utconnect Class
an extensive b5). Althoughctiveness to include:
ts along Grant
en MacArthu
en Tracy Blvd
r the I-205 ove
rd between W
on MacArthud,
LAN
vember 2012
IRCULATIO
ays Master Pla92 Bikeways Mong range pla
endum to the Design Supplemculation.
ES AND PA
Highway Des6) for its bicy1000: Bikewilities into threed below.
ss I Bikeway ith motorized barrier and a
Class II Bikewrized vehiclesclusive use by
traffic and ar
Class III BikewThey are identilized in locats II Bikeways t
bicycle netwo the bikeway serve cyclists
t Line Road
r Drive and T
d and Lincoln
erpass
West 11th Stre
ur Drive betw
2
ON
an in April 20Master Plan aanning tool. T2005 Tracy B
ment, will iden
RKING sign Manual (6ycle facility deway Planning ee categories;
s a physically vehicles. Th
re generally t
way is a bike. They are sbicycle traffic
re located out
way is a bike rntified by signtions that do to provide a
ork that includsystem is bro through con
Tracy Boulevar
Boulevard
et and I-205,
ween Valpico
005. The purpand to identifThe City is cuBikeways Mastntify design str
6th Edition, Caesign standardand Design. ; Class I, Class
separated bikey can be septwo-way facilit
e lane that shseparated by c. Class II Bitside of the t
route that shas and not sepnot have Clacontinuous b
des all three boad, there arennecting origi
rd
Road and jus
pose of fy fund urrently ter Plan. rategies
alifornia ds. The These s II, and
ke path parated ties for
hares a striping keways through
ares the parated ass I or bikeway
bikeway e critical ins and
st north
Class I: Bike Pa
Class II: Bike La
Class III: Bike R
Page - 21
ath
ane
Route

TRANSPORTATION MASTER PLAN CITY OF TRACY
Page - 22 Transportation Master Plan • November 2012
Intentionally Left Blank.
Grant Line Rd
PattersonPass Rd
Schulte Rd
Grant Line Rd
Arbor Ave
11th St
Bethany Rd
Durham Ferry Rd
Linne Rd
Valpico Rd
11th
St
Byron Rd
Mo
un
tain H
ou
se Pkw
y
Reeve R
d
Han
sen R
d
Lam
mers R
dL
amm
ers Rd
Co
rral Ho
llow
Rd
Co
rral Ho
llow
Rd
Tracy B
lvdT
racy Blvd
MacA
rthu
r Dr
MacA
rthu
r Dr
Ch
risman
Rd
Sycam
ore P
kwy
Cen
tral
Ave
Ban
ta Rd
Bird
Rd
Ahern Rd
120CALIFORNIA
5
5
580
580
205
0 1 20.5Miles (Approximate)
North
City of Tracy Transportation Master Plan
Figure 2.5: Existing Bikeway Map06.27.11 - H:\Pdata\70100226\Reports\3Final Draft\Graphics\Chapter-2
Legend
Class III (Bike Route)
Class II (Bike Lane)
Class I (Bike Path)
Figure X-X: Existing Bikeways
City Limits
Sphere of Influence


TRANSP
CITY OF
Transpor
• O
• OB
As identiffacilities ar
• Cth
• Cth
The City rvehicle pa10.08.351provided stalls for p
Each bicycpermanenupright poentrance f
2.3.4 E
The City pedestrianroadways promote City.
Figure 2in red. Aperformedneighborh
Similar to gaps inclualong Byroand alongaddition texisting sid
ORTATION
TRACY
rtation Maste
One segment s
One segment oulevard.
fied in the Cre categorized
Class I bicycle hat may be ac
Class II bicycle he bicycle but
requires that arking stalls (C0, Bicycle Parin parking lot
parking lots wi
cle parking stnt fixture for osition. The pfor each build
EXISTING P
of Tracy is pn crossing with
and in residwalking and p
.6 provides aAlthough a dd, a preliminahoods that hav
bikeway facilde multiple seon west of Cog Grant Line to the criticaldewalks to sp
MASTER PL
er Plan • Nov
south of Valpi
along Valpico
City of Tracyd as follows:
parking facilitcessed only b
parking facilitdo not have
bicycle parkinCity of Tracy Mrking, states tts with 20 toth more than
tall shall be 5 locking or s
parking stalls aing or land us
PEDESTRIA
pedestrian frieh Americans wdential neighbprovides pede
a map of the detail inventorry inventory wve approximat
ities, the Cityegments alonorral Hollow, Road west ol gaps, ADA ecific destinat
LAN
vember 2012
ico Road, and
o Road betw
’s Bicycle Ma
ties consist of by bicyclists.
ties are bicyclocking mech
ng be providedMunicipal Codhat 2 bicycle
o 40 vehicle s 40 vehicle st
½ feet long securing the are required tose type.
AN CIRCUL
endly with wiwith Disabilitiborhoods. Testrians acces
existing sidewry of each rewas completetely 90% or g
y has critical gg Corral Hollalong Tracy
of Corral Holroutes have
tions in the Ci
2
ween MacArth
aster Plan (BM
f bicycle locke
le racks that anisms.
d at parking lode, Septembepermanent b
stalls and 5% alls.
by 2 ½ feet bicycle frameo be within 1
LATION
despread sidees Act (ADAThe sidewalk ss to destinat
walk locationsesidential neiged. The mapreater sidewa
gaps in sidewalow Road souBoulevard soullow and eastnot been es
ity.
hur Drive and
MP), bicycle
ers, or a secu
provide supp
ots with 20 oer 2009). Ordbicycle stalls sof the total
wide and ince and wheels00 feet of the
ewalk coveraA) ramps along
coverage heions througho
and highlightghborhood w
p highlights in alk coverage.
alk coverage. uth of Schulteuth of Valpicot of East Strestablished alo
d Tracy
parking
re area
port for
or more dinance shall be vehicle
clude a s in an e public
age and g major elps to out the
ts them was not
yellow,
These e Road, o Road, eet. In ong the
Page - 25

TRANSPORTATION MASTER PLAN CITY OF TRACY
Page - 26 Transportation Master Plan • November 2012
Intentionally Left Blank.

Grant Line Rd
PattersonPass Rd
Schulte Rd
Grant Line Rd
Arbor Ave
11th St
Bethany Rd
Durham Ferry Rd
Linne Rd
Valpico Rd
11th
St
Byron Rd
Mo
un
tain H
ou
se Pkw
y
Reeve R
d
Han
sen R
d
Lam
mers R
dL
amm
ers Rd
Co
rral Ho
llow
Rd
Co
rral Ho
llow
Rd
Tracy B
lvdT
racy Blvd
MacA
rthu
r Dr
MacA
rthu
r Dr
Ch
risman
Rd
Sycam
ore P
kwy
Cen
tral
Ave
nu
e
Ban
ta Rd
Bird
Rd
Ahern Rd
120CALIFORNIA
5
5
580
580
205
0 1 20.5Miles (Approximate)
North
City of Tracy Transportation Master Plan
Figure 2.6: Existing Sidewalk Map06.27.11 - H:\Pdata\70100226\Reports\3Final Draft\Graphics\Chapter-2
Legend
Existing Neighborhoods with Sidewalks
Existing Sidewalks on Major Streets
City Limits
Sphere of Influence


TRANSP
CITY OF
Transpor
2.3.5 E
The City’sand parkinalso a majcan eitheNotwithstto Tracy’s employeechoice. Ththe develo
Parking sestreet parsignificant planning developmparking lot
2.3.6 P
A Park-anowner usethe facilitythere are Figure 2
1. N
2. P
3. Tin
4. 6t
5. AR
ORTATION
TRACY
rtation Maste
EXISTING P
s goals and acng pricing to jor consumerer help or tanding these businesses an
s, customers he interests ofopment of a b
ervices providerking lots, ancosts, but alsofunctions, thents, and has ts.
PARK AND
d-Ride facilityes a public try during the
five Park an.7.
Naglee Road (
rime Outlets
racy Transit ntersection)
th Street and
Altamont ComRoad intersecti
MASTER PL
er Plan • Nov
PARKING
ctions it takesinfluence how
r of land, and hinder the
concerns, adnd institutionsand visitors wf employers, sbalanced parki
ed directly bynd enforcemeo generate sige City also some regulat
RIDE FACI
y is generally aransport or caday and retri
nd Ride facilit
(Naglee Road
(MacArthur D
Station (sou
Central Aven
mmuter Expresion)
LAN
vember 2012
, will acknowlw people chothe treatmene achievemedequate parkins. Parking enabwho travel by stores, serviceing system.
y the City incluent of parkingnificant reven
influences ttory control o
LITIES
an area used tarpooling to ceved when tties within th
d /Pavillion Par
Drive /E. Pesca
utheast corne
nue (northwes
ss (ACE) Trai
2
ledge the abiloose to trave
nt of parking went of comng is an issuebles them to automobile, w
e providers m
ude on-streetng by-laws. Tnues. As well, the supply oover privately
to park vehiclcommute. Vethe commutee City of Tr
rkway intersec
adero Avenue
er 6th Stree
st corner of th
n Station (Tra
ity of parkingel. Parking arewithin develop
mpact comme of vital imporemain accesswhether by nust be consid
t parking, seveThese service
through its laof parking inrun off-street
les, while the ehicles are par returns. Curacy as illustra
ction)
e)
et /Central A
he intersectio
acy Boulevard
g supply eas are pments
munities. ortance sible to
need or dered in
eral off-es have and use n new t public
vehicle arked in urrently, rated in
Avenue
n)
d /Linne
Page - 29

TRANSPORTATION MASTER PLAN CITY OF TRACY
Page - 30 Transportation Master Plan • November 2012
Intentionally Left Blank.
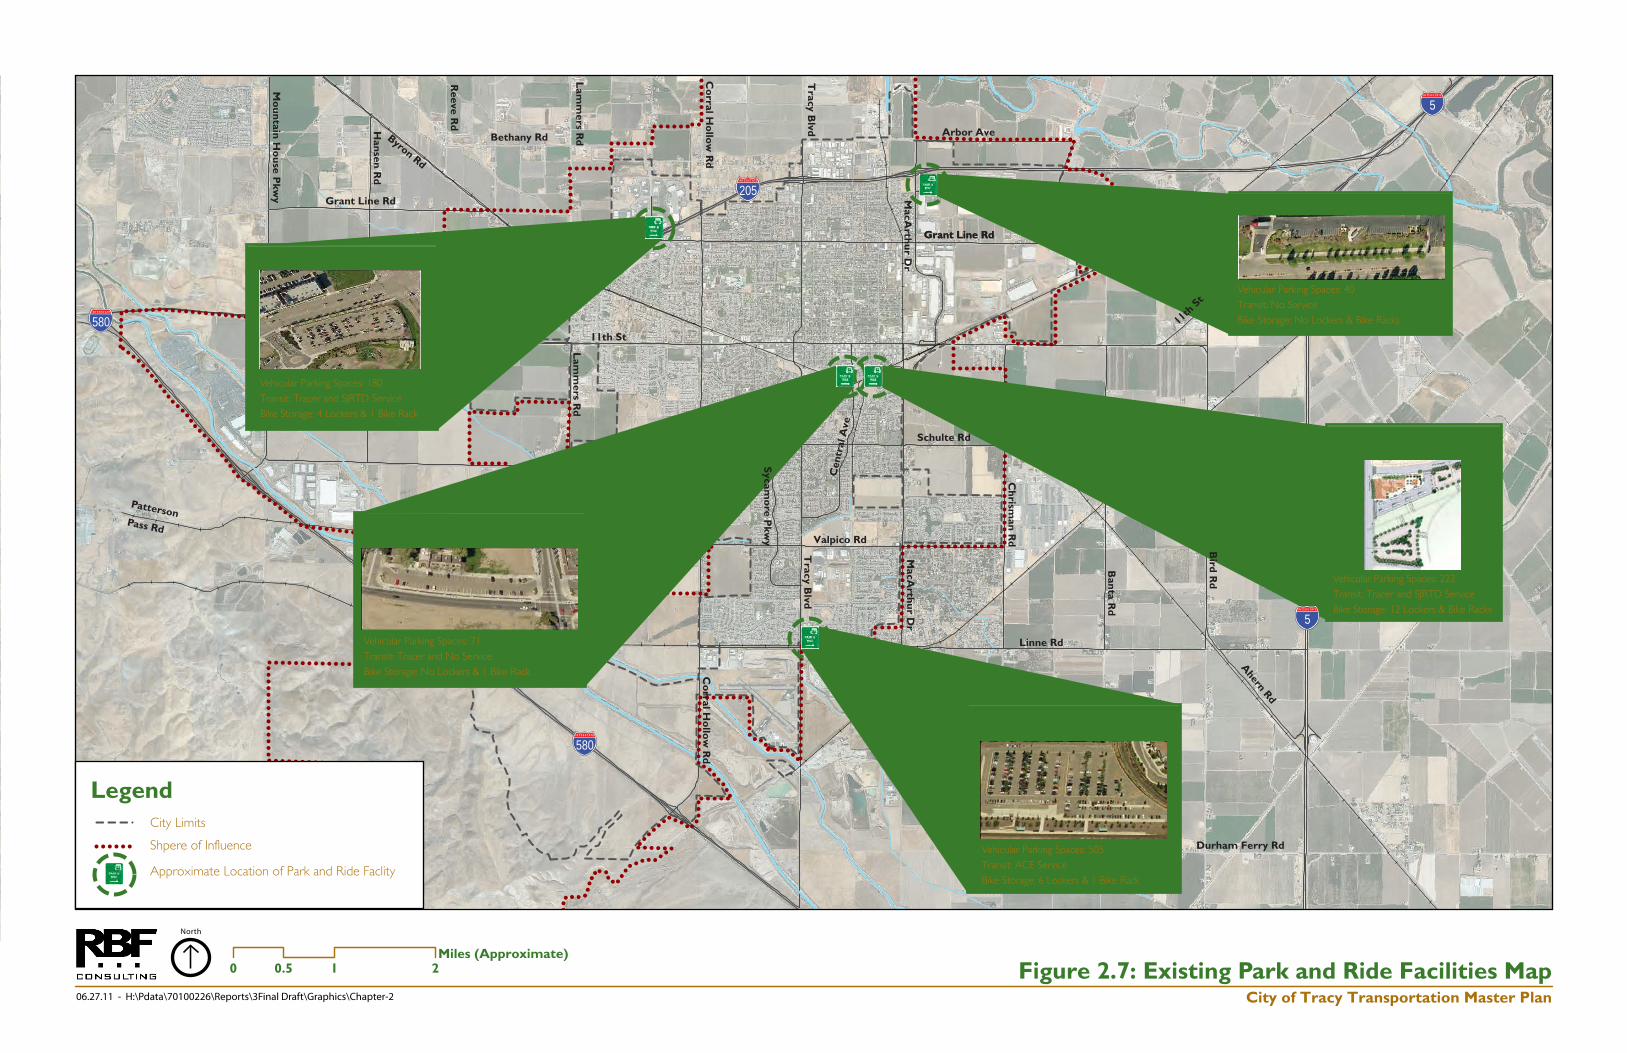
Naglee Road Park and Ride
Vehicular Parking Spaces: 180
Transit: Tracer and SJRTD Service
Bike Storage: 4 Lockers & 1 Bike Rack
Sixth Street and Central Avenue Park and Ride
Vehicular Parking Spaces: 71
Transit: Tracer and No Service
Bike Storage: No Lockers & 1 Bike Rack
Altamont Communiter Express(ACE) Park and Ride
Vehicular Parking Spaces: 505
Transit: ACE Service
Bike Storage: 6 Lockers & 1 Bike Rack
Grant Line Rd
Prime Outlet Park and Ride
Vehicular Parking Spaces: 40
Transit: No Service
Bike Storage: No Lockers & Bike Racks
Tracy Transit CenterPark and Ride
Vehicular Parking Spaces: 222
Transit: Tracer and SJRTD Service
Bike Storage: 12 Lockers & Bike Racks
Grant Line Rd
PattersonPass Rd
Schulte Rd
Grant Line Rd
Arbor Ave
11th St
Bethany Rd
Durham Ferry Rd
Linne Rd
Valpico Rd
11th
St
Byron Rd
Mo
un
tain H
ou
se Pkw
y
Reeve R
d
Han
sen R
d
Lam
mers R
dL
amm
ers Rd
Co
rral Ho
llow
Rd
Co
rral Ho
llow
Rd
Tracy B
lvdT
racy Blvd
MacA
rthu
r Dr
MacA
rthu
r Dr
Ch
risman
Rd
Sycam
ore P
kwy
Cen
tral
Ave
Ban
ta Rd
Bird
Rd
Ahern Rd
120CALIFORNIA
5
5
580
580
205
0 1 20.5Miles (Approximate)
North
City of Tracy Transportation Master Plan
Figure 2.7: Existing Park and Ride Facilities Map06.27.11 - H:\Pdata\70100226\Reports\3Final Draft\Graphics\Chapter-2
Legend
Approximate Location of Park and Ride Faclity
Shpere of Influence
City Limits


TRANSP
CITY OF
Transpor
2.3.6.1 This parkisouthside has a parkbike rack a/Park and service op(SJRTD) oThe followfacility.
• #
• #
• #
• #
• #
• #
• #
• #
• #
• #
2.3.6.2 This parkiback of Prof I-205 vehicles waccess forand from
2.3.6.3 The Tracyfor the Ci6th Streeincludes apublic restinfrastructplaza, deslockers anAvenue. CSJRTD op
ORTATION
TRACY
rtation Maste
NAGLEE
ng lot is locatof Naglee R
king capacity foand 4 bike locRide signalize
perates one loperates sevewing bus rou
# Route B - W
#153-Livermor
#160-Bart 1 -
#166-Lockhee
#170-San Jose/
#171-Bart 2 -
#172-Lockhee
#173-Sunnyval
#174-Mtn.View
#175 - Santa C
PRIME Ong lot is locarime Outlet sand MacArth
with no bicycler the shoppingthe shopping
TRACY Ty Transit Statity of Tracy. It
et. The Transan indoor pastrooms, threeture for up tosignated bus, nd bike racksCurrently, Traperates two r
MASTER PL
er Plan • Nov
ROAD PAR
ted between oad and wesor 170 regulackers. Access ed intersectionocal bus serv
eral inter-regioutes provide
West Valley Ma
re 1 - Livermo
Pleasanton/D
d 3 Sunnyvale
/Metro Dr-Lig
Pleasanton/D
d 4 Sunnyvale
le – SJRTD
w/Palo Alto –
Clara – SJRTD
UTLET PAR
ated on the nhopping cente
hur Drive. The facilities prog center. Currcenter to Tra
TRANSIT ST
on opened ot is located onsit Station cossenger waitine community o three rechataxi and vanp
s. Access to tacer operatesregional bus s
LAN
vember 2012
RK AND RID
Grant Line Rot of I-205 /Nr vehicles andto the parkin
n. Currently, Tvice and San onal bus servservices to t
all /Tracy Tran
ore/Sandia La
ublin – SJRTD
e- SJRTD
ght Rail
ublin – SJRTD
e- SJRTD
SJRTD
D
RK AND RI
north side of er, and is in chis lot has a ovided. Accessrently, Tracer acy Transit Sta
TATION PA
n February 1,n the southeaontains approng area, a ticmeeting room
arging spaces pool pickup athe parking l five local buervices to an
2
DE oad & Pavilion
Naglee Road id 10 ADA vehg lot is providTracer fixed rJoaquin Regi
ices to and frthe Naglee R
nsit Station - T
bs – SJRTD
D
D
DE E. Pescaderolose proximitparking capa
s to the parkinoperates Rou
ation.
ARK AND R 2010 and seast corner of oximately 6,00cket sales andms, 222 parkifor electric veand drop-off ot is provide
us services, Rod from Stock
n Parkway alonterchange. Thicles. It also hded via Nagleroute and paronal Transit rom this parkRoad Park an
TRACER
Avenue andty to the interacity for 45 ng lot is shareute A bus ser
RIDE erves as a tranCentral Aven00 square fed informationing spaces (inehicles), an ozones, and
ed along N. Coutes A thru kton, Routes
ong the This lot has one e Road
ratransit District
king lot. nd Ride
d in the rchange regular
ed with rvice to
nsit hub nue and eet and n office, ncluding outdoor 12 bike Central E, and
26 and
Page - 33

Pagge - 34
90.
2.3.6.4 This parkinthe north sparking capfacilities. AcAvenue and
2.3.6.5
The Tracy and ride lotThe lot alsoprovided vservices betmorning an
2.3.7 FR
The followobtained fr1068 adopt
2.3.7.1 The existineast-west ddisperse toLine Road,connects trMacArthur Road, Elevea through tsouth.
Section 3.0the City refive tons orfor carryingdrive only oingress by dunloading.
Currently tTruck Routare indicate
6TH STRE
g lot is locateside of 6th Strpacity for 67 ccess to this d C Street.
ALTAMON
RIDE ACE station t has a parkino contains onvia a drivewaytween Stocktd two from S
REIGHT – T
ing section derom the existted 11-16-04)
EXISTING
g truck routedirection. Ac the City via and I-205 /
ruck traffic on Drive, and al
enth Street, antruck route o
8.290 of the estricting vehicr more, licensg goods for pion truck routedirect route to
here are thretes” and “Loced throughou
T
ET AND CE
ed diagonally reet, betweenregular vehicparking lot is
NT COMMU
is located at ng capacity foe bike rack any along Tracton and San JSan Jose return
RUCK SERV
escribes the eting City of T) and survey o
TRUCK RO
es in the City ccess to tructhe interchan/ MacArthur I-205 to the so the commnd Grant Lineon Corral Ho
City’s Municipcles routes wed commercickup and delie designated so and from re
e types of trucal Truck Rouut the City w
TRANS
Transportati
ENTRAL AV
across from n Central Avecles and 4 AD
provided via
TER EXPRE
Tracy Boulevor 493 regularnd 6 bike lockcy Boulevard. ose. Two tran in the eveni
RVICE
existing trucksTracy Truck Rof field data.
OUTES y of Tracy runck routes orignges at I-205
Drive. Theindustrial area
mercial areas ine Roads. Trucollow Road v
pal Code estawithin the Cityially as a truckvery. Vehiclestreets exceptestricted stree
uck routes witutes” and STA
with the appro
SPORTATION
ion Master P
VENUE PA
the Tracy Trenue and C StDA vehicles aa a driveway a
ESS (ACE)
vard and Linnr vehicles andkers. Access tCurrently, A
ains depart froing.
s routes in thRoute Map (p
n primarily in ginate from / Eleventh St
e existing truas in the soutn the north anck access to I-via the I-580
ablishes truck y with a grosk in the state es meeting thit when neces
et for the purp
thin the City AA truck rouopriate signag
N MASTER PCITY OF TR
Plan • Novem
RK AND RI
ransit Station treet. This lotand has no balong both C
) PARK AN
ne Road. Thisd 12 ADA veto the parkingACE providesom Stockton
he City of Traper City ordi
a north-soutInterstate 205treet, I-205 / uck route neh and northeand central via -580 is providinterchange t
k routes throus vehicle weigof origin, ands requiremen
ssary for egresposed of load
of Tracy: “Thutes. These rge specific to
PLAN RACY
mber 2012
DE along
t has a bicycle
Central
D
s park ehicles. g lot is s daily in the
acy as nance
th and 5 and Grant
etwork ast via Larch ed via to the
ughout ght of d used nt shall ss and
ding or
rough routes
o each

TRANSP
CITY OF
Transpor
route type
2.3.7.2 Through tCity of Trlocated oufreight witthroughou
Existing th
• A
• By
• C
• C
• CC
• El
• El
• G
• G
• H
ORTATION
TRACY
rtation Maste
e per MUTCD
THROUG
truck routes aracy from anyutside the Citthin the Cityut the City can
hrough truck r
Arbor Road (M
yron Road (w
Corral Hollow
Corral Hollow
Chrisman RoadCity limits)
leventh Street
leventh Street
Grant Line Roa
Grant Line Roa
Holly Drive (A
MASTER PL
er Plan • Nov
D requiremen
H TRUCK Rare defined ay point outsidty to proceedy of Tracy. An be found in
routes within t
MacArthur Dri
west City limits
Road (Larch
Road (Linne
d (North of V
t (Lammers R
t (MacArthur
ad (West City
ad (MacArthu
rbor Road to
LAN
vember 2012
ts.
ROUTES as a route thade the City a entirely throA map showFigure 2.8.
the City of Tr
ive to Holly D
s to Lammers
Road to Gran
Road to I-580
Valpico Road
Road to the w
Drive to east
y limits to Cor
r Drive to Eas
Larch Road)
2
at allows any and destined ough without uwing the locat
racy include:
Drive)
s Road)
nt Line Road)
0)
portion of Ch
est City limits
t City limits)
rral Hollow Ro
st City limits)
vehicle enterfor any otheunloading or tion of truck
hrisman Road
s)
oad)
ring the er point loading routes
d within
Page - 35

TRANSPORTATION MASTER PLAN CITY OF TRACY
Page - 36 Transportation Master Plan • November 2012
Intentionally Left Blank.
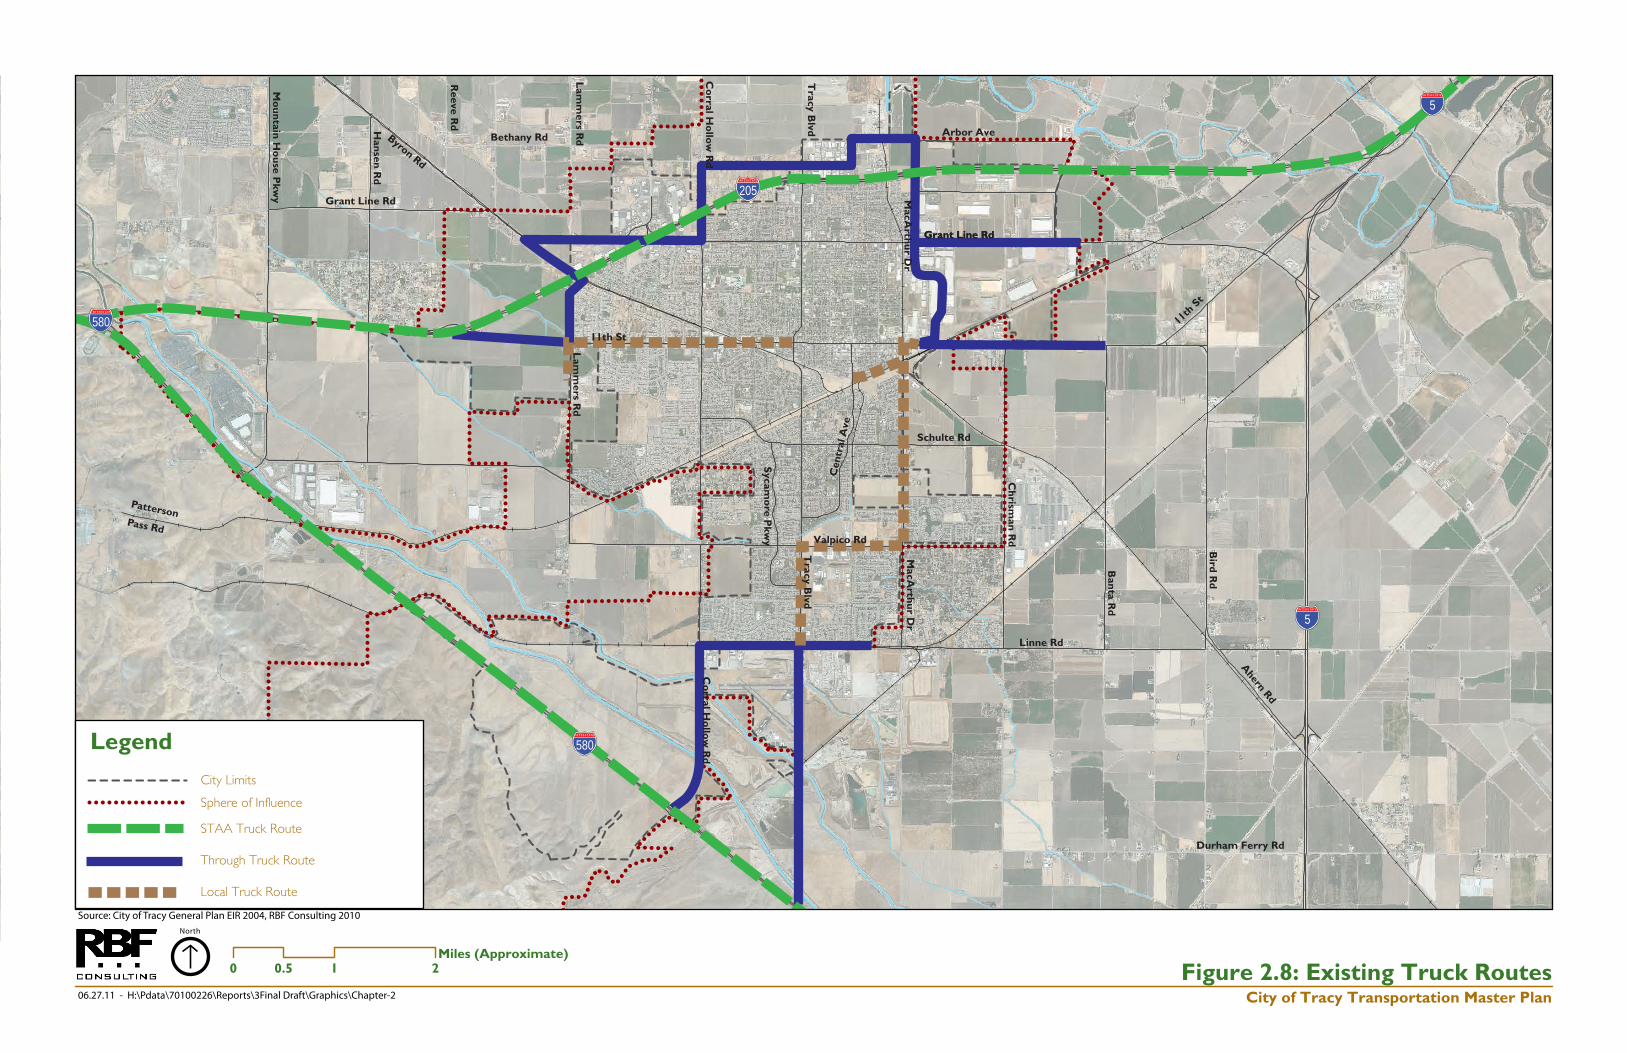
Grant Line Rd
Grant Line Rd
PattersonPass Rd
Schulte Rd
Grant Line Rd
Arbor Ave
11th St
Bethany Rd
Durham Ferry Rd
Linne Rd
Valpico Rd
11th
St
Byron Rd
Mo
un
tain H
ou
se Pkw
y
Reeve R
d
Han
sen R
d
Lam
mers R
dL
amm
ers Rd
Co
rral Ho
llow
Rd
Co
rral Ho
llow
Rd
Tracy B
lvdT
racy Blvd
MacA
rthu
r Dr
MacA
rthu
r Dr
Ch
risman
Rd
Sycam
ore P
kwy
Cen
tral
Ave
Ban
ta Rd
Bird
Rd
Ahern Rd
120CALIFORNIA
5
5
580
580
205
0 1 20.5Miles (Approximate)
North
Source: City of Tracy General Plan EIR 2004, RBF Consulting 2010
06.27.11 - H:\Pdata\70100226\Reports\3Final Draft\Graphics\Chapter-2
Legend
STAA Truck Route
Through Truck Route
Local Truck Route
Sphere of Influence
City Limits
City of Tracy Transportation Master PlanFigure 2.8: Existing Truck Routes


TRANSPORTATION MASTER PLAN CITY OF TRACY
Transportation Master Plan • November 2012 Page - 39
• Lammers Road (Byron Road to Eleventh Street)
• Larch Road (Holly Drive to Corral Hollow Road)
• Linne Road (East City limits to West City limits)
• MacArthur Drive (Arbor Road to Eleventh Street)
• Tracy Boulevard (Larch Road to I-205)
• Tracy Boulevard (Linne Road to South City limits).
2.3.7.3 LOCAL TRUCK ROUTES Local truck routes are defined as a route that may not be used by any truck to move from any point outside of the City of Tracy continuously to any other point located outside the City of Tracy without unloading or loading within the City of Tracy. All local truck traffic trips must use the shortest local truck traffic route between connecting or through truck traffic routes and the origin and destination within the City.
Existing local truck routes within the City of Tracy include:
• Eleventh Street (Lammers Road to Tracy Boulevard)
• Eleventh Street (north leg MacArthur Drive to south leg MacArthur Drive)
• Lammers Road (Eleventh Street to 0.5 miles south of Eleventh Street) City portion
• MacArthur Drive (Eleventh Street to Sixth Street)
• MacArthur Drive (Valpico Road to Mount Diablo Avenue)
• Sixth Street (MacArthur Drive to Central Avenue)
• Tracy Boulevard (Linne Road to Valpico Road)
• Valpico Road (Tracy Boulevard to MacArthur Drive).
• MacArthur Drive (Mount Diablo Avenue to Sixth Street.
2.3.7.4 SURFACE TRANSPORTATION ASSISTANCE
ACT (STAA) TRUCK ROUTES The Surface Transportation Assistance Act (STAA) of 1982 authorized the establishment of a national network of highways designated for use by large trucks. On these highways, Federal width and length limits apply. The STAA allows large trucks to operate on the Interstate and certain primary routes called collectively the National Network (NN). These trucks, referred to as STAA trucks, are longer than California legal trucks. As a result, STAA trucks have a larger turning radius than most local roads can accommodate. The law allows for "reasonable access" to and from the NN for terminals, deliveries, trucks stops, repairs, and other reasons. The NN is recommended for through truck traffic (e.g. traffic that is passing through the area), and trucks are allowed to operate on truck-restricted

Pagge - 40
roads if the
Through thlimits is alsNetwork ST
2.3.7.5 There is oTracy BouleServices ofservices, loa
2.3.8 TR
The City ofEach of theareas throuUnion Pacifthe region.
The main liis used foCommuter trains operTracy. Thescheduled sSan Francisfor StocktoCounty line
2.3.8.1 Due to the1 grade sepdistributed Tracy Bouleshown in F
1. Lamcrosign
2. Lamtwo
3. CoInteappgat
ey have no oth
he City of Trao a designateTAA routes.
EXISTING
ne designatedevard ¼ mile ffered at this ad monitors, d
RACY RAIL
f Tracy has these lines consughout the Cific Railroad C
ne runs alongor both freigr Express (ACrate daily on te line along Bservice whichco Bay Area.
on. The rail line is no longer
RAILROAD
prevalence oparated railrothroughout t
evard, and Maigure 2.9 an
mmers Road ossing consistsnals.
mmers Road so travel lanes
orral Hollow Rersection: Thproximately 4e controlled
T
her means of
acy, I-205 is a ed STAA rou
TRUCK ST
d truck stop to the northtruck stop i
driver lounges
ROADS
hree major raisists of severaity. These lineorporation, w
g the southernght and comCE). Approximthis track. Th
Byron Road is connects theThe line to
ne at the soutin service and
D CROSSIN
of railroad lineoad crossing wthe City with acArthur Drivnd are describ
between Sc of two trave
south of Valpwith gravel ro
Road, north ois at-grade cr
40 feet to thewith flashing
TRANS
Transportati
access to the
a STAA routeute. Both rou
TOP FACIL
within the Ch of the I-205nclude refuels, showers, an
l lines that rual spurs that aes are current
which also ope
n border of Tmmuter rail smately ten frehe remaining s used minimae City to thethe northeastthwest of thed is used for s
GS es, there are 1within the Cittwo crossing
ve. Each of thed in detail be
chulte and Vl lanes with co
pico Roads: Toads and stop
of the Coral rossing consise north of thwarning sign
SPORTATION
ion Master P
ir destination.
e. I-580 to thutes are desig
ITY City of Tracy 5 / Tracy Bouling, truck pa
nd laundry.
n east to wesare used to atly owned anerates freight
Tracy along Linservice opera
eight trains andlines run thro
ally and does e industrial cet is used for e City has tracstorage of trai
9 at-grade raity of Tracy. gs each on Coe railroad croelow:
Valpico Roadontrol gates a
This at-grade p sign only con
Hollow Roadsts of four trhe intersectioals and is co
N MASTER PCITY OF TR
Plan • Novem
.
he south of thgnated as Na
located on Nulevard interchrking, truck p
st through theaccess the indnd operated brail service th
nne Road. Thated by Altad six commutough the cennot have reg
nters of the Nlocal freight bcks that stop n cars only.
ilroad crossingThese crossinorral Hollow
ossings locatio
ds: This at-and flashing w
crossing consntrol.
d / Eleventh ravel lanes lon. This crossordinated wit
PLAN RACY
mber 2012
he city ational
North hange. permit
e City. dustrial by the rough
his line amont ter rail nter of gularly North bound at the
gs and ng are Road, ns are
-grade arning
sists of
Street ocated sing is th the

Grant Line Rd
Grant Line Rd
PattersonPass Rd
Schulte Rd
Grant Line Rd
Arbor Ave
11th St
Bethany Rd
Durham Ferry Rd
Linne Rd
Valpico Rd
11th
St
Byron Rd
Mo
un
tain H
ou
se Pkw
y
Reeve R
d
Han
sen R
d
Lam
mers R
dL
amm
ers Rd
Co
rral Ho
llow
Rd
Co
rral Ho
llow
Rd
Tracy B
lvdT
racy Blvd
MacA
rthu
r Dr
MacA
rthu
r Dr
Ch
risman
Rd
Sycam
ore P
kwy
Cen
tral
Ave
Ban
ta Rd
Bird
Rd
Ahern Rd
120CALIFORNIA
5
5
580
580
205
0 1 20.5Miles (Approximate)
North
Legend
Railway Crossing - At Grade Gate Controlled
Railway Crossing - At Grade Sign Controlled
* Crossing located on Arbor Avenue- Crossing numbers corresponds with numbers in Existing Conditions Draft Report
City of Tracy Transportation Master PlanFigure 2.9: Railroad Crossings
R R#
City Limits
Sphere of Influence
Storage Use Rail Line
Daily Use Rail Line
Sporadic Use Rail Line
R R#
NO GATESOR LIGHTS
Source: City of Tracy General Plan EIR 2004, RBF Consulting 2010
R R3
NO GATESOR LIGHTS
R R11
NO GATESOR LIGHTS
R R2
NO GATESOR LIGHTS
R R14
R R19
R R6
R R20
R R1
R R4
R R7
R R10
R R15
R R13
R R8
R R5
R R17
R R16
*
06.27.11 - H:\Pdata\70100226\Reports\3Final Draft\Graphics\Chapter-2


TRANSPORTATION MASTER PLAN CITY OF TRACY
Transportation Master Plan • November 2012 Page - 43
signals at the adjacent intersection.
4. Corral Hollow Road south of Schulte Road: This crossing consists of a single track with 4 vehicle travel lanes. Vehicle crossing is controlled by control gates and flashing warning lights.
5. Corral Hollow Road north of Linne Road: This crossing is located approximately 100 feet to the north of the Corral Hollow Road / Linne Road intersection. The crossing consists of a single track with two vehicle travel lanes. Vehicle crossing is controlled by gate controls and flashing warning lights. This nearby intersection is stop sign controlled and thus does not require coordinated signals.
6. Tracy Boulevard, south of Sixth Street: This crossing is located between the intersections of Tracy Boulevard / Sixth Street and Tracy Boulevard / Beechnut Avenue. The tracks are positioned midway between the two intersections approximately 20 feet from both intersections. Both intersections are signalized and are coordinated with the crossing gates. This at-grade crossing consists of a single track and 4 vehicle travel lanes. Vehicle crossing control is restricted with gate controls and flashing warning lights.
7. Tracy Boulevard, north of Fourth Street: This crossing is located approximately 20 feet to the north of the Tracy Boulevard / Fourth Street intersection. The crossing consists of a single track, with 5 vehicle lanes. Vehicle crossing control is restricted by gate controls and flashing warning lights.
8. Tracy Boulevard, north of Linne Road: This crossing is located approximately 70 feet to the north of the Tracy Boulevard / Linne Road intersection. The at-grade crossing consists of a single track, with two vehicle travel lanes. Vehicle crossing control is restricted by gate controls and flashing warning lights. This crossing is located adjacent to the Tracy ACE station and parking lot.
9. MacArthur Drive, grade separated crossing: This grade separated crossing is located east of the MacArthur Drive / Eleventh Street intersection. The crossing consists of two tracks with a four lane bridge overpass above.
10. Schutle Road, east of Central Avenue: This crossing is located approximately 250 feet from the intersection of Schulte Road / Central Avenue. The at-grade crossing consists of a single track with 4 vehicle travel lanes. Vehicle crossing control is restricted by gate controls and flashing warning lights.
11. Arbor Avenue, between South Holly Drive and MacArthur Drive: This at-grade crossing provides freight rail access to the Holly Sugar Corporation to the north. This single track is currently used for storage only as the

TRANSPORTATION MASTER PLAN CITY OF TRACY
Page - 44 Transportation Master Plan • November 2012
track is obstructed by a fence at the Holly Sugar Corporation property line. This crossing does not have stop sign or gate crossing controls.
12. East Grant Line Road, west of MacArthur Drive: This crossing is located approximately 500 feet from the East Grant Line Road / MacArthur Drive intersection. The at-grade crossing consists of a single track with 4 vehicle travel lanes. Vehicle crossing is controlled by gate controls and flashing warning lights.
13. MacArthur Drive / Eleventh Street Intersection: This crossing is located at the east leg of the MacArthur Drive / Eleventh Street intersection. The at-grade crossing consists of a single track with 4 vehicle travel lanes. The crossing coordinated with the MacArthur Drive / Eleventh Street traffic signal. Vehicle crossing is controlled by gate controls and flashing warning lights.
14. West Lenne Road, east of MacArthur Drive: This crossing is located approximately 700 feet from the West Lenne Road / MacArthur Drive intersection. The at-grade crossing consists of a single track with two vehicle travel lanes. The track is currently being used for storage only as a fence obstructs the track at the industrial properties to the south. There is no crossing control and only a railroad crossing sign is provided.
15. MacArthur Drive, south of Eleventh Street: This at-grade crossing consists of a two tracks with two vehicle travel lanes. Vehicle crossing is controlled by gate controls and flashing warning lights.
16. Chrisman Road, north of Schulte Road: This crossing is located approximately 60 feet from the intersection of Chrisman Road and Schulte Road. This at-grade crossing consists of a single track with two vehicle travel lanes. Vehicle crossing is controlled by gate controls and flashing warning lights.
17. Chrisman Avenue, north of Linne Road: This at-grade crossing consists of two tracks with two vehicle travel lanes. Vehicle crossing is controlled by gate controls and flashing warning lights.
18. Banta Road, north of Linne Road: This at-grade crossing consists of a single track with two vehicle travel lanes. Vehicle crossing is controlled by gate controls and flashing warning lights.
19. Grant Line Road, east of Seventh Street: This crossing is located approximately 450 feet from the intersection of Grant Line Road and Seventh Street. This at-grade crossing consists of a single track with two vehicle travel lanes. Vehicle crossing is controlled by gate controls and flashing warning lights.
20. Schutle Road between Corral Hollow Road and Tracy Boulevard: This at-

TRANSPORTATION MASTER PLAN CITY OF TRACY
Transportation Master Plan • November 2012 Page - 45
grade crossing consists of a single track with four vehicle travel lanes. Vehicle crossing is controlled by gate controls and flashing warning lights.
2.3.9 BRIDGES AND CULVERT FACILITIES
The City of Tracy has several creeks, canals, and a system of aqueducts that run throughout the City. Major waterways include the Delta Mendota Canal and California Aqueduct running parallel to each other to the southwest of Tracy. Several smaller channels run throughout the City providing irrigation and collecting runoff that drains into the California Aqueduct system.
Interstate 205 has 10 over/under crossings along its stretch through the City of Tracy. These locations include;
• I-205 / Mountain Houseparkway
• 1-205 / Hansen Road
• I-205 / Eleventh Street
• I-205 / Byron Road
• I-205 / Grant Line Road
• I-205 / Corral Hollow Road
• I-205 / Tracy Boulevard
• I-205 / South Holly Drive
• I-205 / MacArthur Drive
• I-205 / Paradise Avenue
The City’s bridge system consists of a network of 14 bridges and culverts that provide transportation access over these waterways. The City of Tracy bridge type and locations are shown in Figure 2.10 and are described in detail below:
1. Mountain House Parkway, north of Schulte Road: This bridge provides access across the California Aqueduct and is approximately 200 feet long consisting of two travel lanes with concrete and steel barriers. The posted speed limit on this bridge is 45 MPH.
2. Von Sosten Road, east of Mountain House Parkway: This culvert provides access across a drainage canal and is approximately 80 feet long consisting of two travel lanes. The posted speed limit on this culvert is 35 MPH.
3. Von Sosten Road, east of Grunauer Road: This culvert provides access across a drainage canal and is approximately 60 feet long consisting of two travel lanes. The posted speed limit on this culvert is 35 MPH.
4. Grant Line Road, east of Mountain House Parkway: This culvert provides access across a drainage canal and is approximately 80 feet long consisting
TRANSPORTATION MASTER PLAN CITY OF TRACY
Page - 46 Transportation Master Plan • November 2012
Intentionally Left Blank.

Grant Line Rd
Grant Line Rd
PattersonPass Rd
Schulte Rd
Grant Line Rd
Arbor Ave
11th St
Bethany Rd
Durham Ferry Rd
Linne Rd
Valpico Rd
11th
St
Byron Rd
Mo
un
tain H
ou
se Pkw
y
Reeve R
d
Han
sen R
d
Lam
mers R
dL
amm
ers Rd
Co
rral Ho
llow
Rd
Co
rral Ho
llow
Rd
Tracy B
lvdT
racy Blvd
MacA
rthu
r Dr
MacA
rthu
r Dr
Ch
risman
Rd
Sycam
ore P
kwy
Cen
tral
Ave
Ban
ta Rd
Bird
Rd
Ahern Rd
120CALIFORNIA
5
5
580
580
205
0 1 20.5Miles (Approximate)
North
Source: RBF Consulting 2010
06.27.11 - H:\Pdata\70100226\Reports\3Final Draft\Graphics\Chapter-2
Legend
City of Tracy Transportation Master PlanFigure 2.10: Existing Bridges and Culverts
City Limits
Sphere of Influence
Bridge
Culvert
Over/Under Pass
#
#
10
6
9
1
8
14
5
7
13
2
4
3
12
11


TRANSPORTATION MASTER PLAN CITY OF TRACY
Transportation Master Plan • November 2012 Page - 49
of two travel lanes. The posted speed limit on this culvert is 35 MPH.
5. Lammers Road, south of West Schulte Road: This culvert provides access across a drainage canal and is approximately 50 feet long consisting of two travel lanes. The posted speed limit on this culvert is 35 MPH.
6. Lammers Road, south of Valpico Road: This bridge provides access across the Delta Mendota Canal and is approximately 110 feet long consisting of two travel lanes with steel barriers along each side. The posted speed limit on this bridge is 45 MPH.
7. Corral Hollow Road, north of Valpico Road: This culvert provides access across a drainage canal and is approximately 35 feet long consisting of two travel lanes. The posted speed limit on this culvert is 45 MPH.
8. Corral Hollow Road, south of Linne Road: This bridge provides access across the Delta Mendota Canal and is approximately 115 feet long consisting of two travel lanes with steel barriers along each side. The posted speed limit on this bridge is 45 MPH.
9. Corral Hollow Road, north of I-580: This bridge provides access across the California Aqueduct and is approximately 175 feet long consisting of two travel lanes with steel barriers along each side. The posted speed limit on this bridge is 45 MPH.
10. Tracy Boulevard, south of Linne Road: This small culvert provides access across a drainage ditch and is approximately 20 feet long consisting of two travel lanes. There is no posted speed limit across this culvert.
11. South Tracy Boulevard, south of the Tracy Municipal Airport Driveway: This culvert provides access across the Delta Mendota Canal and is approximately 200 feet long consisting of two travel lanes. There is no posted speed limit across this culvert. The culvert is approximately 200 feet wide across the aqueduct and does not have side barriers.
12. MacArthur Drive, south of Etcheverry Drive: This culvert provides access across a drainage ditch and is approximately 30 feet long consisting of two travel lanes. There is a small metal barrier on the east side and concrete barrier on the west side of the culvert crossing.
13. Linne Road, west of Chrisman Avenue: This culvert provides access across a drainage canal and is approximately 25 feet long consisting of two travel lanes. There is a low-lying concrete barrier on each side of the culvert crossing. The posted speed limit across the culvert is 45 MPH.
14. Paradise Avenue, north of Arbor Avenue: This bridge provides across the Tom Paine Slough to the north of the City and is approximately 150 feet long and consists of two travel ways with metal barriers on each side.
TRANSPORTATION MASTER PLAN CITY OF TRACY
Page - 50 Transportation Master Plan • November 2012
2.3.10 INTELLIGENT TRANPORTATION SYSTEMS (ITS)
Intelligent Transportation Systems (ITS) are transportation networks that include information and communication technologies that are designed to improve the safety and operation of the transportation infrastructure. There are numerous types of ITS systems that range from simple variable message signs to more advanced real time vehicle parking guidance systems.
2.3.10.1 EXISTING SYSTEM INVENTORY AND EVALUATION An inventory of the City of Tracy’s existing traffic signal equipment, communications equipment, communications alignment was conducted.
There are sixty-five (65) signalized intersections within the City of Tracy that are operating via Model 170 traffic signal controllers located inside Type 332 cabinets at each local intersection. The traffic signal controllers are managed by Quicknet traffic management control and software system.
The City of Tracy’s existing traffic signal communication infrastructure (citywide) primarily consists of twisted pair copper wire signal interconnect cable and conduit that interconnect the existing traffic signals. At designated roadway segments communications are provided over microwave and/or radio communications.
Figure 2.11 illustrates the City of Tracy’s existing traffic signal locations and communication system infrastructure.
It should be noted that ITS systems have been discussed during community workshops for the Emerald Tracy program. The discussions included topics such as, continuing to implement a comprehensive signal coordination program, install adaptive traffic controls, synchronized signals, transit and emergency signal priority, and other traffic flow management techniques.

NorthSource: City of Tracy
06.27.11 - H:\Pdata\70100226\Reports\3Final Draft\Graphics\Chapter-2 City of Tracy Transportation Master PlanFigure 2.11: Existing Interconnect Master Plan
TRANSPORTATION MASTER PLAN CITY OF TRACY
Page - 52 Transportation Master Plan • November 2012
2.3.11 TRANSIT FACILITIES
Transit plays an important role for many commuters in Tracy. Tracy isalso a connection point for regional transit trips to and from the Bay area and connect transit services to the Central Valley. The public transit system includes both bus and rail components. The City is serviced by the following public transportation services:
• Local fixed-route and commuter bus services operated by the City (TRACER)
• Regional intercity fixed-route bus service operated by the San Joaquin Regional Transit District (RTD)
• County Hopper Service operated by RTD
• Commuter express bus service operated by RTD
• Altamont Commuter Express (ACE) rail service
Figure Figure 2.12 displays existing bus transit system within the City of Tracy.
2.3.11.1 LOCAL FIXED-ROUTE BUS SERVICE (TRACER) Fixed-route services run on a set route and time with fixed stops. TRACER offers five fixed bus routes, Routes A-E. Routes A, B and C run Monday through Friday from approximately 7:00 AM to 7:00 PM and Saturday from 9:00 AM to 5:00 PM. Routes D and E run only on weekdays when school is in session. TRACER does not operate on Sundays and holidays.
• Route A provides service to/from the Tracy Transit Station to West Valley Mall, and runs along East Street, MacArthur Drive, Grant Line Road, Tracy Boulevard and Corral Hollow Road. It also provides services to other major destinations within the City including Prime Outlets, Civic Center and West Valley Mall. It operates between 7:00 AM to 7:50 PM on weekdays and between 9:15 AM to 5:10 PM on Saturdays. Headways range between 30 to 90 minutes.
• Route B also provides service to/from the Tracy Transit Station to West Valley Mall, and runs along Holly Drive, Eaton Avenue, Tracy Boulevard, Lowell Avenue, Corral Hollow Road, Grant Line Road and Naglee Road. Major destinations served along this route include Sutter Tracy Community Hospital, Civic Center, Walmart and West Valley Mall. It operates between 7:00 AM to 6:55 PM on weekdays, and between 9:00 AM to 4:55 PM on Saturday. This service is provided with 60-minute headways during the weekdays and Saturdays.
• Route C provides service to/from the Tracy Transit Station to south Tracy residential area, along 10th Street, Eleventh Street, Corral Hollow Road, Schulte Road, Tracy Boulevard and Central Avenue. Major destinations served along this route include Civic Center, U.S. Post Office, Williams Middle School and SaveMart. It operates between 7:00 AM to 6:50 PM on weekdays, and between 9:00 AM to 4:50 PM on Saturday. This service is

TRANSP
CITY OF
Transpor
pSa
• RwarARalhiru
2.3.11.2The RTD Stockton vTracy. MaTransit Staweekdays westboun
2.3.11.3The RTDroute busRipon andGeneral Pservice hoWithin thstops at mMonday tweekdays nine westb
2.3.11.4San Joaquservices frand Southours. RoStockton Naglee PDublin/Pleservice frLockheed between Manteca, number o
ORTATION
TRACY
rtation Maste
rovided with aturday.
Route D and Rweekdays. Theround the Cit
Avenue, TracyRoad, Sycamor
ong these roigh schools inuns in the mo
2 REGIONA
operates onevia Lathrop. R
ajor destinatioation. It operawith six east
d (Manteca to
3 COUNTY
D County Ho service connd Lathrop. ThPublic Dial-Aours in the ae City, this ro
major locationhrough Fridaywith eight e
bound (Mante
4 RTD CO
uin Commuterom Naglee Rh Bay, Mond
oute 150 conand one fro
Park and Reasanton BARrom Stockto
Martin in SuNorthrup Gand Tracy. Thf runs during
MASTER PL
er Plan • Nov
approximatel
Route E are cese routes prty limits and
y Boulevard, Lre Parkway anoutes include Tracy, and Trning and two
AL INTERCI
e fixed-route Route 27 runsons served aloates betweentbound (Tracyo Tracy) runs.
Y HOPPER Spper (Route
necting Stockthe Hopper re-Ride (DAR)
areas coveredoute runs alos such as Way between 5:3astbound Traeca to Tracy)
MMUTER Ber provides sRoad Park & day through nsists of two om Manteca, ide Lot and
RT station. Ron, Lathrop, unnyvale. Rou
Grumman in hese commutthe morning a
LAN
vember 2012
y 60-minute
commuter rorovide a clock
run along EaLowell Avenund Central ACivic Center
Tracy Sports Co runs in the a
ITY FIXED-bus line (Rou
s along Grant ong this routen 5:30 AM to y to Manteca).
SERVICE 90) is a dev
ton, Tracy, Loeplaces RTD services dur
d by the Hopong Grant Linl-Mart. Route 30 AM and 1acy to Mantecruns.
BUS SERVIC
several inter-Ride lot to tFriday, durinfeeder busethat both m
d then travutes 166 and Manteca, anute 173 provSunnyvale t
ter routes maand evening p
2
headways on
utes and provkwise and coast Street, Houe, Corral Ho
Avenue. Majorr, library, elemComplex. Rouafternoon.
-ROUTE BU
ute 27) that cLine Road an
e include Civi7:37 PM on
) runs and 4
viated fixed-odi, Manteca, Countywide ring Hopper pper service. e Road with 90 operates
11:00 PM on ca) runs and
CE regional bus the East Bay ng commute es, one from meet at the vels to the 172 provide d Tracy to vides service to Stockton, ake a limited periods.
both weekda
vide service ounterclockwisolly Drive, Kaollow Road, r destinations mentary, middutes D/E mak
US SERVIC
connects the nd East Streetic Center and
ays and
only on se loop avanagh Schulte served
dle and kes two
E City to t within d Tracy
Page - 53

TRANSPORTATION MASTER PLAN CITY OF TRACY
Page - 54 Transportation Master Plan • November 2012
2.3.11.5 ALTAMONT COMMUTER EXPRESS ACE is a passenger rail service connecting Stockton to San Jose - http://www.acerail.com/mapsstations/tracystation.aspx. ACE operates on weekdays, excluding holidays. The ACE station in Tracy is located along Tracy Boulevard near Linne Road. ACE operates three westbound trains during the morning commute arriving in Tracy at 4:49 AM, 5:35 AM and 7:09 AM and three eastbound trains during the evening commute arriving in Tracy at 5:09 PM, 6:09 PM and 7:09 PM. ACE connects to the parallel feeder and distribution services, including RTD and TRACER in the City.

Figure 2.12: Existing Transit ServiceCity of Tracy Transportation Master Plan
0 1 20.5Miles (Approximate)
LegendACE Regional Rail (Heavy Rail)
City LimitsPark and Ride Lot
Sphere of Influence
North
Source: RBF Consulting 2011
3.20.12 - H:\Pdata\70100226\Graphics\Figures
Existing
San Joaquin RTD (Bus)Route 27Route 90Commuter Routes:150, 166, 172, & 173(Stop at Naglee Park & Ride)
TRACER (Bus)Route ARoute BRoute CRoute D/E (Commuter)
C
C
A
DB
D
90
27
NagleePark & Ride
ExistingACE Station
Tracy Multimodal
Transit Station
VON SOSTEN RD
GRANT LINE RD
CAPITAL PARKS DR
MO
UN
TA
IN H
OU
SE
PK
WY
SCHULTE RD
OLD SCHULTE RD
MIDDLE RD
LARCH RD
SUGAR RD
ARBOR AVE
GRANT LINE RD
ELEVENTH ST
VALPICO RD
LINNE RD
LOWELL AVE
HA
NS
EN
RD
RE
EV
E R
D
LA
MM
ER
S R
DL
AM
ME
RS
RD
CO
RR
AL
HO
LL
OW
RD
TR
AC
Y B
LV
D
SY
CA
MO
RE
PK
WY
CE
NT
RA
L A
VE
MA
CA
RT
HU
R D
RM
AC
AR
TH
UR
DR
CH
RIS
MA
N R
D
BA
NT
A R
D
DURHAM FERRY RD
AH
ERN RD
BIR
D R
D
HAN
SEN RD
BYRON RD
LAM
ME
RS E
XT
N.
BYRON RD
COMMERCE WAY
PA
VIL
LIO
N P
KW
Y
PAVILLION PKWY
LIN
CO
LN
BL
VD
PA
RA
DIS
E R
D
LOVELY RD
KA
SSON
RD
Delta M
endota Aqueduct
California A
queduct
205
33CALIFORNIA
5
5
580
205
205
J4
J4
580

TRANSPORTATION MASTER PLAN CITY OF TRACY
Transportation Master Plan • November 2012 Page - 57
2.4 EXISTING INTERSECTION OPERATIONS Weekday AM and PM commute peak-hour traffic operations at key intersections were analyzed to determine the existing conditions of the roadway network. The results of the analysis identify operating deficiencies in the transportation system and will be used to develop long-range planning strategies. 2.4.1 ANALYSIS METHODOGOLY
The methodologies used to perform the operational analyses and provide quantitative levels of service (LOS) were based on the 2000/2010 Highway Capacity Manual (HCM) for unsignalized and signalized intersections. The evaluation of signalized and unsignalized intersection operations was performed using the Synchro 7.0 analysis software. These methodologies are consistent with City standards for traffic analysis.
2.4.2 HIGHWAY CAPACITY MANUAL
Traffic flow operations based on the HCM methodology at intersections were evaluated using a LOS concept. The LOS concept uses a grading scale of “LOS A” through “LOS F” with “LOS A” representing free flowing conditions and “LOS F” representing forced flow conditions.
Factors used in determining intersection LOS vary depending on the control device at the intersection. For all-way stop intersections, average delay per vehicle is used to define the LOS of the intersection operation. The average delay is determined based on the roadway capacity (number of travel lanes) provided on each intersection approach and the traffic demand.
For side-street stop controlled intersections, the operating efficiency of vehicle movements is analyzed. Vehicles on minor street approaches must yield to the through movements of the major streets. The LOS for stopped/yielding vehicles is based on the distribution of gaps in the traffic stream along the major street and driver judgment on the minor street approach in selecting gaps. The LOS reported includes both the overall or average value at the intersection for all movements and also the worst approach of the minor street stopped vehicles.
The HCM calculates the LOS of the minor street approaches and the overall intersection LOS based on this data. It should be noted that both the overall intersection LOS and the minor approach LOS are provided in this EIR. This is because traffic on the minor street approaches has the lowest priority of right-of-way at the intersection and, therefore, is the most critical in terms of delay. The threshold for each LOS grade is provided in Table 2.2 (HCM Level of Service Criteria for Unsignalized Intersections).

TRANSPORTATION MASTER PLAN CITY OF TRACY
Page - 58 Transportation Master Plan • November 2012
Table 2.2: HCM Level of Service Criteria for Unsignalized Intersections
Level of Service
Description Control Delay
(seconds/vehicle)
A Intersections operating at LOS A contain no congestion. The intersection operates with very little delay, from 0 to 10 seconds per vehicle.
0 – 10
B Intersections operating at LOS B contain very little congestion. The intersection operates with minimal delay, from 10 to 15 seconds per vehicle.
>10 – 15
C Intersections operating at LOS C contain little congestion. The intersection operates with some delay, from 15 to 25 seconds per vehicle.
>15 – 25
D Intersections operating at LOS D contain some congestion. The intersection operates with longer delays, from 25 to 35 seconds per vehicle.
>25 – 35
E Intersections operating at LOS E border on being congested. The intersection operates with delays from 35 to 50 seconds per vehicle.
>35 – 50
F Intersections operating at LOS F contain congestion. The intersection operates with delays over 50 seconds.
>50
Source: Highway Capacity Manual, (2000 /2010), Chapter 17, Unsignalized Intersections, p. 17-2 and p. 17-22.
For signalized intersections, average control delay per vehicle is utilized to define intersection LOS. Delay is dependent on a number of factors including the signal cycle length, the roadway capacity (number of travel lanes) provided on each intersection approach and the traffic demand. The threshold for each LOS grade is provided in Table 2.3 (HCM Level of Service Criteria for Signalized Intersections).

TRANSPORTATION MASTER PLAN CITY OF TRACY
Transportation Master Plan • November 2012 Page - 59
Table 2.3: HCM Level of Service Criteria for Signalized Intersections
Level of Service
Description Control Delay
(seconds/vehicle)
A Intersections operating at LOS A contain no congestion. The intersection operates with very little delay, from 0 to 10 seconds per vehicle.
0 – 10
B Intersections operating at LOS B contain very little congestion. The intersection operates with minimal delay, from 10 to 20 seconds per
>10 – 20
C Intersections operating at LOS C contain little congestion. The intersection operates with some delay, from 20 to 35 seconds per vehicle.
>20 – 35
D Intersections operating at LOS D contain some congestion. The intersection operates with longer delays, from 35 to 55 seconds per vehicle.
>35 – 55
E Intersections operating at LOS E border on being congested. The intersection operates with delays from 55 to 80 seconds per vehicle.
>55 – 80
F Intersections operating at LOS F contain congestion. The intersection operates with delays over 80 seconds.
>80
Source: Highway Capacity Manual, (2000/2010), Chapter 16, Signalized Intersections, p. 16-2.
2.4.3 LEVEL OF SERVICE STANDARDS
The City of Tracy has established LOS D, where feasible, as the minimum acceptable LOS for roadway and overall intersection operations. However, there are certain locations where these standards do not apply. The following provides a list and description of exceptions to the LOS standard of LOS D.
• Within ¼ mile of any freeway, LOS E shall be allowed on roadways and at intersections to discourage inter-regional traffic from using City streets.
• In the Downtown and Bowtie area of Tracy LOS E, shall be allowed.
• At intersections where construction of improvements is not feasible, the LOS may fall below the City’s LOS D standard.
• During construction of intersection improvements or funded but not yet constructed, the LOS may temporarily fall below the City’s LOS D standard.
The Caltrans standard for level of service is the LOS C/D threshold in which LOS

TRANSPORTATION MASTER PLAN CITY OF TRACY
Page - 60 Transportation Master Plan • November 2012
C is acceptable in all cases and LOS D is acceptable on a case-by-case basis.
The county of San Joaquin has established LOS D as the minimum acceptable LOS for roadway and intersection operations.
2.4.4 EXISTING LEVELS OF SERVICE
Weekday AM and PM peak-hour traffic counts were conducted primarily in 2003 with a few locations counted in 2002. Intersections 12, 13, 16, 17, 18, 20, 21, 23, 28, and 46 were not included in the 2004 General Plan and subsequently were not counted in 2002 or 2003, but rather in 2009.
The Synchro software program was utilized to conduct weekday Existing AM and PM peak hour level of service calculations at each study intersection. The LOS results are listed in Table 2.4 below and are shown graphically on Figure 2.13. All intersections operate at an acceptable LOS during the existing weekday AM and PM peak hours except for the following intersections.
• Corral Hollow Road/Eleventh Street
• MacArthur Drive/Shulte Road
• MacArthur Drive/Valpico Road
• Byron Road/Grant Line Road
The Synchro output calculations are provided in Appendix B.
Table 2.4: Existing Intersection Level of Service
Delay LOS
Number Intersection Control Type AM PM AM PM
3 I-205 WB Ramps/Naglee Road Signal 13 14 B B
4 I-205 EB Ramps/Grant Line Road Signal 11 20 B C
5 I-205 WB Ramps/Tracy Boulevard Signal 14 23 B C
6 I-205 EB Ramps/Tracy Boulevard Signal 8 10 A A
7 I-205 WB Ramps/MacArthur Drive Signal 8 8 A A
8 I-205 EB Ramps/MacArthur Drive Signal 6 5 A A
9 Naglee Road (I-205 WB Ramps) /Grant Line Road Signal 8 12 A B
12 I-580 WB Ramps/Mountain House Parkway SSS 5 2 A A
13 I-580 EB Ramps/Patterson Pass Road SSS 3 30 A C
16 I-580 WB Ramps/Corral Hollow Road SSS 7 2 A A

TRANSPORTATION MASTER PLAN CITY OF TRACY
Transportation Master Plan • November 2012 Page - 61
Delay LOS
Number Intersection Control Type AM PM AM PM
17 I-580 EB Ramps/Corral Hollow Road SSS 3 6 A A
18 Naglee Road/Middle Road SSS 5 5 A A 20 MacArthur Drive/Arbor Avenue AWS 8 8 A A 21 Paradise Road / Arbor Avenue SSS 3 3 A A 22 Lammers Road/Byron Road AWS 10 13 A A 23 Lammers Road/Grant Line Road SSS 1 6 A A
25 Corral Hollow Road/Grant Line Road Signal 22 34 C C
26 Tracy Boulevard/Grant Line Road Signal 19 35 B C
27 MacArthur Drive/Grant Line Road Signal 22 20 C B
28 Chrisman Avenue/Grant Line Road Signal 10 10 A A
29 Lammers Road/Eleventh Street Signal 17 21 B C
30 Corral Hollow Road/Eleventh Street Signal 40 33 D C
31 Tracy Boulevard/Eleventh Street Signal 23 29 C C
32 MacArthur Drive/Eleventh Street (North) Signal 6 6 A A
33 Chrisman Avenue/Eleventh Street (South) Signal 19 17 B B
37 Corral Hollow Road/Shulte Road Signal 20 20 B B
38 Tracy Boulevard/Shulte Road Signal 25 21 C C 39 MacArthur Drive/Shulte Road Signal 43 26 D C 40 Lammers Road/Valpico Road SSS 9 9 A A
41 Corral Hollow Road//Valpico Road AWS 14 12 B A
42 Tracy Boulevard/Valpico Road AWS 16 16 C C 43 MacArthur Drive/Valpico Road Signal 40 22 D C 44 Corral Hollow Road/Linne Road SSS 6 11 A B 45 Tracy Boulevard/Linne Road AWS 12 9 B A 46 Naglee Road/Park and Ride Signal 13 21 B C 47 Byron Road/Grant Line Road SSS 31 58 D F
Note: Level of service ratings exceeding the LOS standard are highlighted in bold text.

TRANSPORTATION MASTER PLAN CITY OF TRACY
Page - 62 Transportation Master Plan • November 2012
Intentionally Left Blank.

Grant Line Rd
PattersonPass Rd
Schulte Rd
Grant Line Rd
Arbor Ave
11th St
Bethany Rd
Durham Ferry Rd
Linne Rd
Valpico Rd
11th
St
Byron Rd
Mo
un
tain H
ou
se Pkw
y
Reeve R
d
Han
sen R
d
Lam
mers R
dL
amm
ers Rd
Co
rral Ho
llow
Rd
Co
rral Ho
llow
Rd
Tracy B
lvdT
racy Blvd
MacA
rthu
r Dr
MacA
rthu
r Dr
Ch
risman
Rd
Sycam
ore P
kwy
Cen
tral Aven
ue
Ban
ta Rd
Bird
Rd
Ahern Rd
120CALIFORNIA
5
5
580
580
205
0 1 20.5Miles (Approximate)
North
Figure 2.13: Existing Level of ServiceCity of Tracy Transportation Master Plan02.02.12 - H:\Pdata\70100226\Reports\3Final Draft\Graphics\Chapter-2
BB/
BC/A
B/
DF/
BC/
46
BBC BB
B
BCA
BBA
3
49
47
CC/
25
BC/
26
CB/
27
BC/
5
BBC
AA/
AAA
AA/
AAA6
AA/
AA8
7
CC/
31
AA/
32
DC/
30
BC/
29
BB/
33
BB/
37
CC/
38
FB/
39
AA/
40
BA/
41
CC/
42
DC/
43
AB/
44
BA/
45
AA/
23
AA/
12
AAAAA
AC/
AAC
A13
AA/
AAAA
17
AA/
16
AAA
AA/
22
AA/
18
AA/
28
AA/
AAA
A20
AA/
21
Legend
Level of Service AM/PM
Sphere of Influence
City Limits
XX/


