37
ISSN: 1439-2305 Number 401 – August 2020 TRADE AGREEMENTS AND INTERNATIONAL TECHNOLOGY TRANSFER Inmaculada Martínez-Zarzoso Santiago Chelala

ISSN: 1439-2305
Number 401 – August 2020
TRADE AGREEMENTS AND
INTERNATIONAL TECHNOLOGY
TRANSFER
Inmaculada Martínez-Zarzoso
Santiago Chelala

1
Trade Agreements and International Technology Transfer
ABSTRACT
This is the first paper that analyzes for a global sample how trade agreements that include technology-
related provisions impact exports of goods, and how this impact differs depending on the technology
content of the goods. It includes estimations of a structural gravity model for a panel of 176 countries
over the period 1995-2015. The model differentiates between provisions relating technology transfer,
technical cooperation, research and development (R&D), and patents and intellectual property rights.
It also estimates the differences in these effects depending on whether the trade flow in question is
between countries with similar or different levels of development. The main results indicate that
regional trade agreements (RTAs) that contain technology provisions generate a significantly higher
volume of trade than RTAs that do not, after controlling for the depth of the RTAs. For countries that
ratify RTAs that include such provisions, it is exports of technology-intensive goods that increase the
most. Trade agreements including such provisions have a heterogeneous effect that varies by income
level of the trading partners and depends on the extent to which the RTA incorporates other
provisions.
Keywords: sectoral exports; trade agreements; gravity model; PPML; technology transfer;
innovation; Intellectual Property Rights.
JEL codes: F13; O33.
* Corresponding author: [email protected]. The authors would like to thank Marcelo Florensa, Juan Carlos
Hallak, Jakob Madsen and the participants at the BID-INTAL conference held in Buenos Aires in August 2018
for the very helpful comments and suggestions received. We also would like to thank Bianca Pacini for helping
with data collection and processing. Financial support received from the Spanish Ministry of Economy and
Competitiveness, Project ECO2017-83255-C3-3-P (AEI, FEDER, EU) and from project UJI-B2017-33 is
gratefully acknowledged.
Inmaculada Martínez-Zarzoso*
University of Göttingen and Universitat
Jaume I
Santiago Chelala
University of Buenos Aires

2
Trade Agreements and International Technology Transfer
1. Introduction
In recent decades, the defining feature of international economic relations has been the proliferation of
trade agreements, which have filled what Bhagwati (1995) described as the “spaghetti bowl” to the
brim. Over time, however, these agreements have become more complex and have gone from
focusing solely on tariff reductions –shallow agreements– to having a much wider scope –deep
agreements– in which technology transfer provisions have gone from being the exception to the rule.
In 2019, many countries were negotiating or planning to negotiate free trade agreements. In particular,
negotiations between the European Union (EU) and third countries were successfully concluded with
Japan and Singapore in 2019 and with Vietnam in 2020. However, EU negotiations with India, which
started in 2007, were brought to a de facto standstill in 2013, and the same happened with Malaysia in
2012 and Thailand in 2014. Feasibility studies on the consequences of such commitments can delay
agreements for years. For instance, some critical issues in the EU-India negotiation are generic
medicine production in India, the existence of technological transfer restrictions and the EU interest in
patent protection.
A relevant issue surrounding the negotiations of regional trade agreements (RTAs)1 is how the type of
innovation and technology exchange provisions included in the RTA could affect trade flows. This is
the main subject of this paper. We hypothesize that the effects will depend on the products exported
by the negotiating countries and on their level of development. We should expect the effect to be
heterogeneous across goods, being stronger on goods that are more technology intensive. In our
empirical analysis, we differentiate between high, low and medium technology-intensive goods. The
effect on aggregated trade should represent an overall effect. Although an effect on FDI or cross-
border patent flows also seems plausible, we focus exclusively on trade flows. When an FTA is
1 We refer to RTAs as they are defined in the WTO: “RTAs, which are reciprocal preferential trade agreements between two
or more partners, constitute one of the exemptions and are authorized under the WTO, subject to a set of rules”.
https://www.wto.org/english/tratop_e/region_e/region_e.htm.

3
signed, the affected firms benefit from free trade and do not need to pursue internationalization
strategies through FDI, given that tariff/non-tariff measures are no longer barriers to trade.
This paper therefore seeks to answer three elemental questions. First, to what extent do technology
clauses included in RTAs affect trade flows? Second, what kind of goods do they affect the most,
distinguishing between the technological content of goods according to a classification proposed by
UNCTAD? Finally, does this effect vary according to the type of clause and the income per capita of
the signatory countries?2
With this aim, we compiled a database of RTAs with technology transfer and innovation-related
provisions, drawing on a detailed analysis of the fine print of trade agreements that have entered into
force in the last decades. We classified provisions into four subgroups: general intention to transfer
technology, technical cooperation, intellectual property, and joint work on R&D. Using these data in
combination with bilateral trade flows and gravity variables, the effect of these provisions on trade are
evaluated distinguishing between RTAs with and without technology provisions and controlling for
the depth of the RTA. Methodologically, we estimated a gravity model using bilateral exports among
176 countries over the period from 1995 to 2015 to examine whether RTAs impact trade differently
depending on which technology-related provisions they include. Our estimations distinguished
between the four possible types of clauses.3 For instance, the RTA between the EU and the Caribbean
Community (EU-CARIFORUM) establishes the intensification of activities to promote innovation
and technology transfer between the parties (article 135). The Japan-Indonesia RTA establishes
explicit technical cooperation in the telecommunications sector (article 134), whereas the Chile-
Australia RTA regulates trade in R&D and innovation (article 18.3). Finally, the South Korea-United
States agreement includes the protection of intellectual property rights (chapter 18). More specifically,
Article 18.11 states the obligation to ratify and comply with the 10 international agreements listed;
these include conventions, such as Paris and Berne, and treaties, such as Budapest and Singapore.The
2For this purpose we chose the classification of goods of high, medium and low technological content, to try to observe
whether the clauses effectively produce a sophistication of trade. In relation to countries, we use the United Nations
definition, which for 2017 lists developed (North) and developing countries (South). 3 In all of these cases, the effects do not derive exclusively from trade between the signatory countries, but also from the
specific cooperation instruments that are used as vehicles for RTAs.
4
provisions mostly refer to all goods, but also contain specific references to given categories such as
pharmaceutical and agricultural chemical products (art 18.9).4
To our knowledge, the only related study (Campi and Dueñas, 2018) focuses exclusively on the
effects on trade of RTAs with intellectual property rights (IPR) provisions. The authors estimate a
traditional gravity model that disregards multilateral resistance factors, the exclusion of which is
known to generate biases in the estimated coefficients. The main novelties of our study are threefold.
First, we extend the types of provisions analyzed to include technical cooperation, innovation, and
technology transfer, in addition to IPR. The second novelty is a methodological improvement, since
we estimate a structural gravity model with multilateral resistance terms using the latest techniques
put forward in the international trade literature (Head and Mayer, 2014; Yotov et al., 2016; Zylkin,
2016). Finally, we are able to isolate the effect of the technology-type provisions by controlling for
the depth of the RTAs, the participation of the signatory countries in the Agreement on Trade-Related
Aspects of Intellectual Property Rights (TRIPS)5 and for membership of the World Trade
Organization (WTO) and currency unions. If excluded from the model, all these factors could
generate biases in the estimation of the main effect.
Our main results show that RTAs that include technology transfer provisions generate a significantly
higher volume of trade, which in some cases goes beyond the increase generated by RTAs without
these provisions. If we break the results down by sector for countries that ratify RTAs with
technology provisions rather than ones without, it is the exports of technology-intensive goods that
increase the most. Broken down by levels of economic development, the effects are found to be
heterogeneous and also depend on the number of provisions covered by the RTA.6
This article is organized as follows: section 2 reviews the literature on the impact of technology
content provisions on trade; the different types of transfer provisions and the empirical evidence are
4 Some provisions on technology transfer address the interests of strategic sectors, such as laboratories in the case of patents
or intellectual property, or industrial sectors supported by the government and for which cooperation in technological matters
is included.5 The TRIPS agreement is the most comprehensive multilateral agreement on intellectual property. It came into effect in
1995. 6 Another possibility would be to distinguish the sectoral impact on agricultural trade, industrial trade or even trade in
services, in a possible extension of this work. The North-South division allows us to analyse the impact of the treaties if they
are signed by countries with the same or different levels of development, considering as usual North as developed countries
and South as developing countries, following UN distinction as we see later in the paper.
5
described in section 3; the specification of the gravity model and estimation methodology are detailed
in section 4; section 5 presents the results by type of good and type of technology transfer clause, and
by the level of development of the trade partners in question. Section 6 outlines our conclusions.
2. Technology Transfer and Trade
There are two ways in which trade agreements can generate technological spillover: indirectly,
through an increase in trade flows; and directly, if they include specific technology related
provisions.7 On the one hand, indirect spillovers are analyzed in Hoppe (2005), who concludes that
there are three factors that might affect technology transfer: 1) direct efforts to make the transfer
successful; 2) the capacity to adopt new technologies; 3) the fundamental differences between the
donor country and receptor country. Trade enables technology transfer through imports of capital
goods and openness to export markets that enable learning-by-doing, thus increasing total factor
productivity (TFP). These types of external benefits are usually referred to as technological
knowledge spillovers.Trade might provide technology to the importer, surpassing what it would have
acquired or developed itself. Along these lines, Keller (2004) concludes that there is evidence that
imports are a significant channel for technology diffusion. For instance, bilateral relations may
provide information on technologies developed abroad, when the importer receives and analyzes the
good. Alternatively, migrations could also provide such information. People with different
technological backgrounds may travel to the destination country carrying their different knowledge,
which they transfer to the local population in the importing country8. Introducing a product with
innovative technology content into the market can accelerate competition and learning, enabling
countries to reach international standards through contact with foreign products that leads to a
spillover effect. Similarly, Madsen (2007) draws on 135 years of data on TFP and imports with high-
technology content for OECD countries and finds that there is a robust relationship between TFP and
7 The mechanism is direct when these provisions entail cooperation, technical assistance, regulatory changes or enforcement
mechanisms. For example, the EU-CARIFORUM agreement covers support for the promotion of innovation, diversification,
modernization, development and product and process quality in businesses and in the intensification of activities promoting
those links. It also provides enforcement mechanisms concerning intellectual property rights, including corrective measures
and penalties in case of infringement.
8An additional technology transfer mechanism may be mergers or acquisitions with foreign FDI, where new technologies
spill over into the host sector. In fact, the exchange of goods, services or ideas (people) can lead to technology transfer, even
through informal channels, or through educational exchange programs. In this paper we only study one specific mechanism.

6
knowledge imports. Specifically, technological knowledge spillovers contributed to TFP-related
convergence among OECD countries between 1870 and 2004. This spillover effect may arise with or
without the presence of RTAs.
On the other hand, direct transfers of technology require explicit commitments in the agreements,
which are not necessarily found in all of them. RTAs can be used as a tool to increase technology
transfer not just through trade itself but also through specific provisions that regulate this transfer and
cover aspects related to technical cooperation.9 The technology-related provisions that are included in
deep RTAs mostly refer to all goods, but also contain specific references to certain sectors. For
example, Chapter 2 of the RTA between the EU and CARICOM is dedicated to Innovation and IPR.
Section 1 contains six articles, of which two refer to specific sectors, namely, information and
telecommunication technologies and renewable energy. In section 2, most articles refer to all sectors,
with special references to plant varieties and animals. It contains four subsections dedicated to listing
the main principals, defining standards and covering enforcement and cooperation matters. According
to subsection 1, the signatory countries have a transition period in which to enact the corresponding
national laws required to comply with the given obligations; this period is 6 years in general and 12
years for least developed countries. Moreover, special references to compliance with international
agreements, such as TRIPS and WIPO, are included. The wording used is “signatory countries shall
comply with…”. Subsection 4 gives a very detailed description of the procedures concerning
infringement of the obligations, remedies and corrective measures to be applied.
A second example is the agreement between the US and South Korea, which dedicates 12 articles in
Chapter 18 to IPR. Article 18.11 states the obligation to ratify and comply with the 10 international
agreements listed. These include conventions, such as Paris and Berne, and treaties, such as Budapest
and Singapore. Only one article (18.9) refers to “certain regulated products”, specifically to
pharmaceutical and agricultural chemical products. Since most RTAs with technology provisions
specifically state that members have to comply with TRIPS, it is important to refer here to the main
purpose of this agreement. TRIPS is a minimum standards multilateral agreement concerning
9 Ivus (2010) points to the existence of a virtuous circle by showing that better consolidated property rights have positive
effects on trade.

7
intellectual property that provides protection for nearly all forms of IPR in the member countries.
Those countries are free to determine the appropriate method of implementing the provisions of the
agreement in accordance with their own legal system. TRIPS also includes enforcement, remedies and
dispute resolution procedures. Although the idea is that all WTO members will have to comply with
TRIPS, specific transition periods were originally established giving developing countries more time
–initially until 2005– to adapt their legal system to certain obligations and to comply with them. The
waiver has been extended up to 2013 for the least developed countries and until 2016 for certain
obligations, mostly concerning pharmaceutical products. Detailed information can be found on the
WTO website.
The main difference between TRIPS and the technology provisions included in the RTAs is that the
latter are a means to reinforce the compliance mechanisms and concretize the technical cooperation
procedures already established in TRIPS; they also serve as a bridge to ensure enforcement of the
national regulations.
Intellectual property has been analyzed in Campi and Dueñas (2018), who explore how RTAs with
IPR chapters affected trade for a panel of 110 countries over 19 years. The authors distinguish
between products that are highly intellectual property-intensive and those that are not, finding that the
results are similar for both types of goods. Surprisingly, the authors find that trade flows between
developed countries benefit most, while no important gains for developing countries are observed.
However, they estimate a gravity model that does not incorporate the so-called time-variant
multilateral resistance terms and excludes zero trade flows from the analysis. Generally speaking,
these two factors generate biases in the RTA effects (Head and Mayer, 2014).
Finally, Dhingra et al. (2018) examine the contribution of deep non-tariff provisions on international
trade in goods and services. When considering IPR provisions separately, they do not find that RTAs
with these provisions boost gross bilateral trade in goods. This could be due to the fact that many of
the trade agreements in force are not covered by their limited sample of 43 countries. We contribute to
the cited literature by using a global sample of countries, applying an enhanced econometric
methodology and considering a finer classification of technology-related provisions than in previous
studies.

8
3. Trade Agreements Containing Technology Provisions
To carry out this study, we created a database that drew on a detailed analysis of the fine print of trade
agreements. The process started by screening information from the legal text of 302 bilateral or
multilateral trade agreements filed with the WTO, the World Bank, or the Organization of American
States (OAS). From these agreements we selected those coded as free trade agreements (FTAs),
economic integration agreements (EIAs), FTAs & EIAs and Custom Unions (CUs), thus excluding
Partial Scope Agreements (PSAs) and Preferential Trade Agreements (PTAs)10
. The remaining
agreements in our dataset total 231, of which 201 were signed between 1995 and 2015, which is the
period covered in our empirical analysis. We categorized agreements depending on whether they
contained provisions on general intention to transfer technology; technical cooperation; R&D and
innovation; and patents and intellectual property.11
More specifically, the first category “general intention to transfer technology” refers to RTAs that
include innovation policies, participation in framework programs on innovation, the promotion of
technology transfer and dissemination of new technologies. The second category “technical
cooperation” lists shared research projects, exchange of researchers, and development of public-
private partnerships as objectives of the RTAs. In the third group “ R&D and innovation” the text of
the RTAs refers to collaboration in research and development projects and innovation. Finally, the
fourth group “patents and intellectual property rights” contain RTAs with provisions that refer to
patenting activities and intellectual property in the corresponding regulatory framework, obligations
and enforcement mechanisms. We believe that the categories allow us to better distinguish between
general intentions, specific forms of cooperation, commitments and obligations, which is important
for the empirical analysis. We analyzed the text of the agreements in order to identify commitments
around this set of categories. The distribution of exports depending on the type of provision included
is shown in Figure 1.
10
In a previous version, we included Partial Scope Agreements (PSA) and Economic Cooperation Agreements (ECA)
examining a total of 302 agreements. We have eliminated them from this section since the empirical analysis only considers
RTAs that are at least FTAs. 11
We consider the full set of free trade agreements that have been notified to the WTO up to December 2016, in keeping
with the methodology proposed by Hofmann et al. (2018). The authors classified trade agreements based on the provisions
they include on different aspects such as environment, labor, social and intellectual property rights issues. In the empirical
analysis we restrict the sample to those RTAs signed after 1994, since trade data from UNCTAD disaggregated by
technological content are only available from 1995 onwards.

9
Figure 1. Distribution of Aggregated Exports by Type of Provision
Source: Compiled by the authors based on bilateral and multilateral trade agreements.
The sum of the four categories is greater than the number of agreements because there are agreements
that include more than one of the types of technology provision considered here. All the same, our
analysis reveals that most agreements contain just one type of technology provision. In particular, 158
RTAs contain only one type, whereas 32 include all four types analyzed and 73 have none.
Among the agreements that include all four areas, the main proponents are the EU (with Caribbean,
North African and Eastern European countries, Central America, Chile, Israel and South Africa) and
EFTA (with Colombia and Peru), Costa Rica (with China and Singapore), the United States (with
Panama and Peru) and Chile (with Turkey), some of which are geographically close to the other party
(for example the US-Panama agreement) and some of which are not (Costa Rica-Singapore).
Among the agreements that do not include any of these clause types, many are between developing
countries, with fewer between developed and developing countries (5 promoted by the EU, 7 by
EFTA, 2 by the US).
Looking at the distribution of bilateral export flows, a comparison of flows between pair of countries
with no trade agreements and flows with agreements that do or do not contain technology provisions
0.0
5.1
.15
De
nsity
-10 0 10 20lexp
RTA_noTech
TECTRA
RD
TECCOP
PatPI
kernel = epanechnikov, bandwidth = 0.5357
Kernel density estimate
10
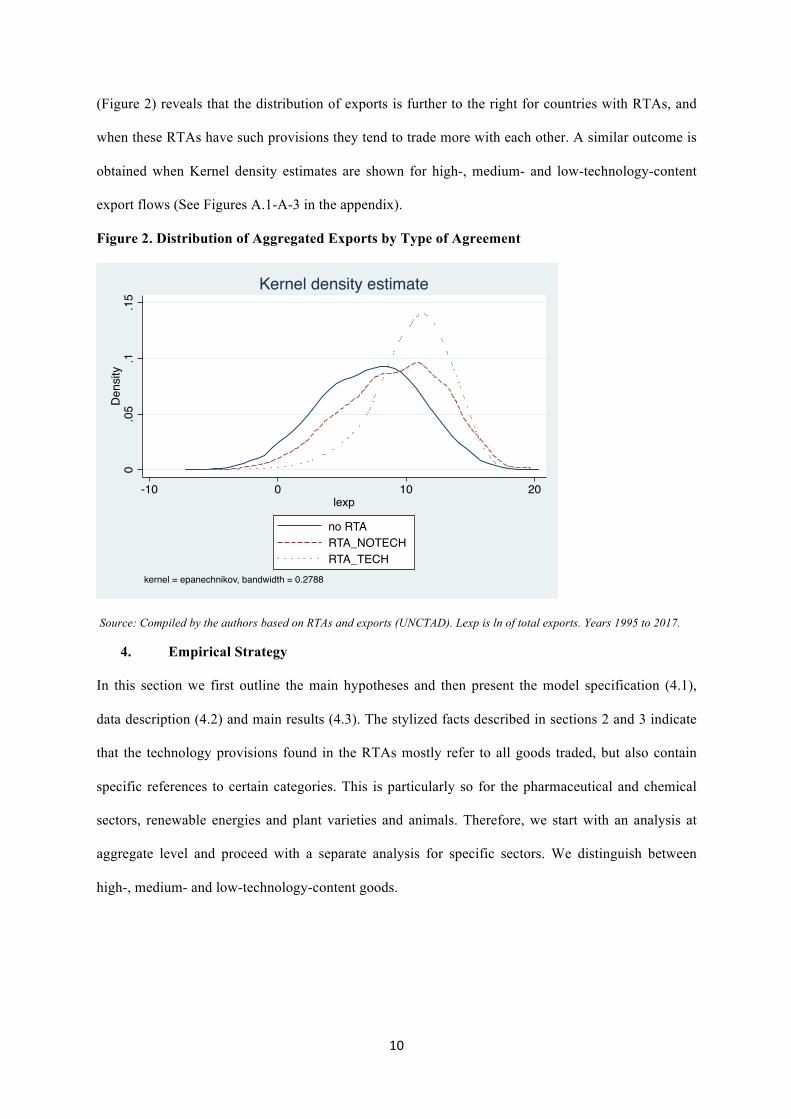
(Figure 2) reveals that the distribution of exports is further to the right for countries with RTAs, and
when these RTAs have such provisions they tend to trade more with each other. A similar outcome is
obtained when Kernel density estimates are shown for high-, medium- and low-technology-content
export flows (See Figures A.1-A-3 in the appendix).
Figure 2. Distribution of Aggregated Exports by Type of Agreement
Source: Compiled by the authors based on RTAs and exports (UNCTAD). Lexp is ln of total exports. Years 1995 to 2017.
4. Empirical Strategy
In this section we first outline the main hypotheses and then present the model specification (4.1),
data description (4.2) and main results (4.3). The stylized facts described in sections 2 and 3 indicate
that the technology provisions found in the RTAs mostly refer to all goods traded, but also contain
specific references to certain categories. This is particularly so for the pharmaceutical and chemical
sectors, renewable energies and plant varieties and animals. Therefore, we start with an analysis at
aggregate level and proceed with a separate analysis for specific sectors. We distinguish between
high-, medium- and low-technology-content goods.
0.0
5.1
.15
De
nsity
-10 0 10 20lexp
no RTA
RTA_NOTECH
RTA_TECH
kernel = epanechnikov, bandwidth = 0.2788
Kernel density estimate

11
The main hypotheses are: 1) Shallow RTAs have a positive effect on trade in goods due to the
elimination of tariffs among the member countries12
, whereas deep agreements have a greater trade
effect. 2) With the inclusion of technology-related provisions, which stimulate technology transfer
and protect innovations, a direct technology-related effect on trade is generated, in addition to the
expected positive effect postulated in 1). 3) The direct and indirect effects could vary depending on
the type of goods traded and the level of development of the trading partners. 4) The effects could
vary by provision.
4.1 Specifications for the Gravity Model
The gravity model has been widely used to predict bilateral trade flows between countries as it is
nowadays considered to be a structural model with solid theoretical underpinnings (Anderson, 1979;
Bergstrand, 1985; Eaton and Kortum, 2002; Anderson and Van Wincoop, 2003; Feenstra, 2016;
Allen, Arkolakis, and Takahashi, 2014). It is particularly appropriate for estimating the effects of
trade policies and the importance of the costs of trade that are associated with distance and trade
facilitation factors.
Our estimations will capture the effects on bilateral trade of RTAs without and with technology
provisions. When an RTA does not contain such provisions, the effect on trade will be solely due to
the elimination of trade barriers. RTAs with provisions will have an extra “direct” effect on trade due
to the increasing collaboration in R&D and the protection of IPR, particularly in technology-intensive
sectors. The econometric model captures the differences between RTAs with and without technology
provisions controlling for the number of other provisions that are not trade-related. In other words, we
compare agreements of similar depth and in this way the try to mimic the counterfactual, that is,
similar RTAs without those provisions.
Two of the model’s most widely appreciated properties are its structural flexibility, which can
accommodate the different factors that affect trade, and its predictive power for aggregate trade flows.
In its simplest form, when applied to trade, the gravity model predicts that the bilateral exports
12Shallow integration involves the elimination of barriers to the movement of goods and services across national borders
within the RTA, whereas deep integration involves establishing or expanding the institutional enviornment in order to
facilitate trade.

12
between two countries are directly proportional to the product of their economic “mass” and inversely
proportional to the costs of trade (distance) between them.
According to the underlying theory that has been reformulated and extended by Anderson and van
Wincoop (2003), the model assumes constant elasticity of substitution and product differentiation by
place of origin. In addition, prices differ among locations due to symmetric bilateral trade costs. The
reduced form of the model is specified as
𝑋!"# =!!"!!"
!!
!
!!"#
!!"!!"
!!!
(1)
where Xijt is bilateral exports from country i to country j in year t, and Yit, Yjt and YtW
are the gross
domestic products in, respectively the exporting country, the importing country and the world in year
t. tijt denotes trade costs between the exporter and the importer in year t and Pit and Pjt are the so-
called multilateral resistance terms (MRT).13
σ is the elasticity of substitution between all goods.
The log-linearized specification of the gravity model is as follows:
𝑙𝑛𝑋!"# = 𝛿! + 𝛼! ln𝑌!" + 𝛼! ln𝑌!" +(1 − 𝜎)𝑙𝑛 𝑡!"# − (1 − 𝜎) 𝑙𝑛𝑃!" − (1 − 𝜎) 𝑙𝑛𝑃!" +
𝜀 !"# (2)
where t represents annual periods; Xijt are the exports from country i to country j in period t in current
US dollars. Yit (Yjt) indicates the exporter’s (importer’s) GDP, all of which are expressed in natural
logarithms (ln) and the constant (𝛿!) represents world income that varies over time. The trade cost
between the trading partners is usually proxied with time-invariant and time-variant factors that
facilitate or hamper trade. Among the former are the geographic distance between countries i and j
and other bilateral dummy variables that take the value of 1 if countries i and j share a language, have
a shared border, or have colonial ties14
. Among the latter are: being a member of a trade agreement
13Multilateral resistance terms reflect relative trade costs with respect to the rest of the world. This concept was introduced
by Anderson and van Wincoop (2003) into the gravity model. Bilateral trade is not only affected by bilateral interactions, but
also by interactions with the rest of the world. 14Other geographical factors that vary by country, such as the geographic area (Area) of countries i and j and dummy
variables that indicate whether they have access to the sea (Landlock) have also been used in the traditional gravity literature.

13
(RTA), currency union (CU), the WTO or having ratified TRIPS. Finally, εijt is the error term and is
assumed to be identically and independently distributed.
Estimating the coefficient for the RTA variable will allow us to evaluate the change in bilateral
exports using information from before and after the entry into force of each agreement, indicating
whether or not exports between each pair of RTA member countries have increased significantly as a
consequence of access to the integration area. In the following estimations, we also distinguish
between RTAs depending on whether they include any of the four types of technology transfer clause
described above.
In line with the recent gravity literature, the MRT are modeled as time-varying country-specific
dummies, as specified in equation (3) below. And to overcome the potential endogeneity of the RTA
variable we follow Baier and Bergstrand (2007) and introduce bilateral time-invariant dummy
variables to account for all unobserved heterogeneity that is attached to each country pair relationship.
𝑙𝑛 𝑋!"# = 𝛿!" + 𝜏!" +𝜑!" + 𝛾𝑇𝑃!"# + 𝛽!𝑅𝑇𝐴!"#$! + 𝜀 !"# (3)
where the RTA variable denotes both countries (country pair ij) being members of trade agreements in
period t, and k indicates whether the agreement contains provisions on innovation and technology
transfer (RTA_tech, k=1) or does not (RTA_notech, k=2). We also consider the depth of the
agreement (RTA_depth, k=3). RTA_depth indicates the depth of the agreement, where depth is
defined on the basis of the number of provisions covered and is taken from Dür et al. (2014).15
TPijt
represents other time-variant trade cost variables, as described below equation (2), namely, CU, WTO
and TRIPS. The fixed (bilateral) effects associated with trade, δij, represent the time-invariant
characteristics of the trade relationship between i and j and are included to avoid biases due to
unobservable factors that affect trade. Given that the influence of variables that are bilateral and time-
invariant —such as geographical distance, a common language, or a shared border— is absorbed by
fixed bilateral effects, the estimated coefficients for these factors are not directly obtained in this
specification of the model.
15It is important to include this variable as agreements that include technology provisions could have a different effect on
trade for all types of exports depending on whether the agreements are deep and comprehensive, or only shallow. The
correlation between RTA_depth and RTA_tech is low.
14
Exporter-time τit and importer-time φjt fixed effects represent all the factors that are specific to each
country and time period and affect trade flows. These are included to control for inward and outward
multilateral resistance, that is, third countries’ barriers to trade that affect the costs of trade, mainly to
account for factors such as relative prices, institutions, infrastructure, or legal factors that vary by
country and over time, including the exporter’s/importer’s GDP. Consequently, the inclusion of MRT
in the form of dummy variables for each exporter-time and importer-time pair absorbs the effects of
the income of the trading countries. The inclusion of these three sets of fixed effects (bilateral,
exporter-period, and importer-period) has been recommended in the literature as a suitable way of
identifying the effects of RTAs on trade (Baier and Bergstrand, 2007; Yotov et al., 2016).
Even though it is common practice to estimate the gravity model in its log-linear form, there are many
advantages to estimating the model in its multiplicative form using the Poisson Pseudo Maximum
Likelihood Estimator (PPML), as originally suggested by Santos Silva and Tenreyro (2006).16
First,
the log-transformation of the dependent variable leads to the loss of the zero trade flows and when the
zeros are not arbitrarily missing data or random rounding errors, they could carry important
information. These zeros could be due to high trade barriers or regular rounding errors associated with
small trade flows; as such, dropping these observations will produce inconsistent estimates17
. While
there are a number of ways to overcome the problem of zero trade flows,18
PPML is preferred here as
it is straightforward in its application and avoids the theoretically inconsistent method of replacing
zero trade flows with an arbitrary value. A second argument in favor of this approach is that,
according to Santos Silva and Tenreyro (2006), estimating the gravity model in its log-linear form
rather than in levels can lead to misleading conclusions in the presence of heteroskedasticity as the log
transformation affects the disturbances. The PPML estimator resolves this issue, as it is valid under
general forms of heteroskedasticity.
16For the implementation of this estimation method, the newly available Stata command ppml_panel_sg (Zylkin, 2017) was
employed.17While the data extracted from UNCTAD did not contain any zeros,
balancing the data to obtain all possible importer,
exporter and year combinations led to a large number of observations for which trade values were missing, either because
they were not reported or they were actually zero. 18Yotov et al. (2016) (p. 19) presents five possible solutions to this problem.

15
The rapid ongoing development of new techniques for estimating the model based on theoretical
developments has given rise to a series of practical recommendations documented in Head and Mayer
(2014) and more recently in Yotov et al. (2016). The authors also suggest proxying MRT and bilateral
unobserved heterogeneity using the three abovementioned sets of fixed effects. In line with these
developments, the specification for the structural gravity model is as follows:
𝑋!"# = 𝐸𝑥𝑝 𝛿!" + 𝜏!" +𝜑!" + 𝛾𝑇𝑃!"# + 𝛽!𝑅𝑇𝐴!"#$! + 𝜀 !"# (4)
where the variables are as described below equations (2) and (3).
4.2. Data Sources and Variables
The data on total exports and exports disaggregated by technology intensity came from UNCTAD
(unctadstat.org). The classification used here is based on Lall (2000) and divides products into three
groups depending on their level of technology content: high (HT), medium (MT), and low (LT). The
HT group contains products that use advanced technologies and change rapidly, which thus require
significant investment in R&D and a focus on product design. Some examples are aircraft and
telecommunication equipment, pharmaceutical products and medicaments (see Table A.2 in the
Appendix). The MT group includes capital goods and intermediate products that use skill-intensive
technologies and form the basis for industrial activity in mature economies. They tend to include
complex technologies with relatively high levels of R&D, require advanced skills, and extended
periods of learning. Goods in the engineering and automotive subgroups require considerable
interaction between firms to achieve technical efficiency. Finally, the LT group contains stable
technologies that are already widespread. These technologies are used in capital equipment at the
lower end of the range and are based on relatively simple skills. Many traded products in this group
are homogenous and compete on price, and include textiles, garments and footwear. The labor costs
of these tend to play a significant part in their competitiveness. As economies of scale and barriers to
entry for these products are generally low, the end market tends to grow slowly, with income
elasticities below one.
With regard to the data sources for the explanatory variables used in this paper, the data for GDP were
obtained from the World Bank Development Indicators Database (World Bank, 2019), while data on
16
distance, shared border, common language, colonial ties, geographic area, and access to the sea came
from CEPII. The construction of RTA variables by type was explained in section 3.
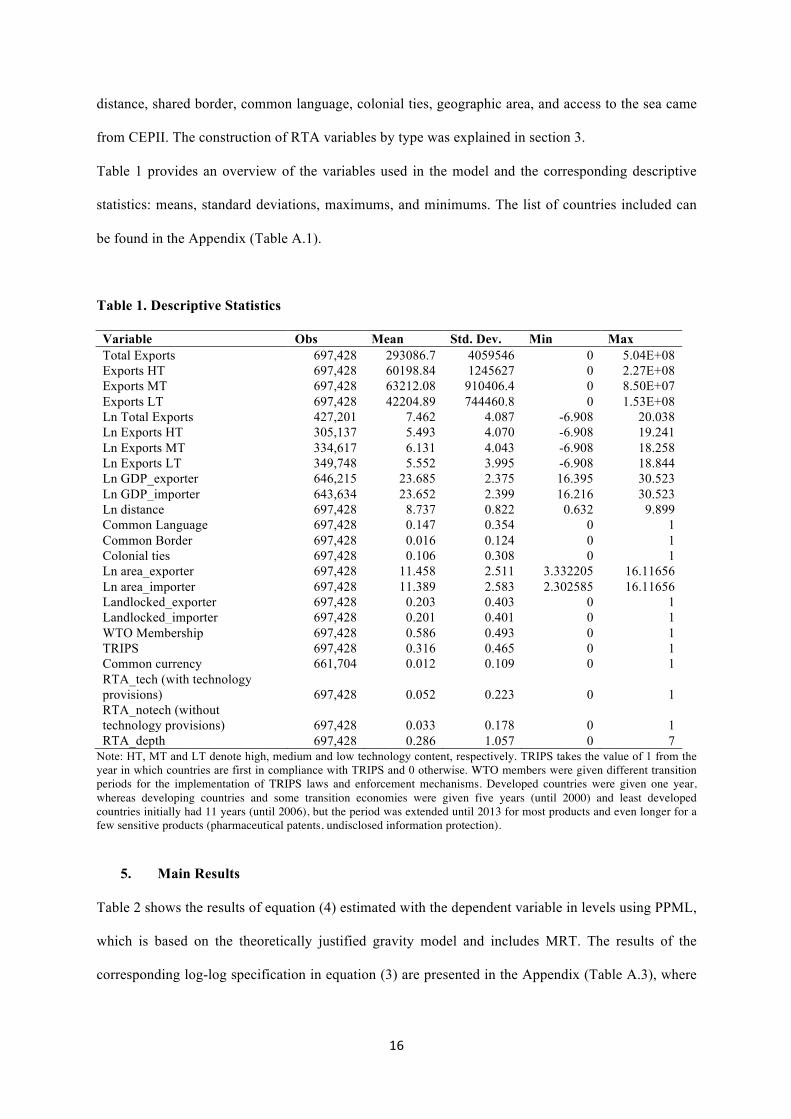
Table 1 provides an overview of the variables used in the model and the corresponding descriptive
statistics: means, standard deviations, maximums, and minimums. The list of countries included can
be found in the Appendix (Table A.1).
Table 1. Descriptive Statistics
Variable Obs Mean Std. Dev. Min Max
Total Exports 697,428 293086.7 4059546 0 5.04E+08
Exports HT 697,428 60198.84 1245627 0 2.27E+08
Exports MT 697,428 63212.08 910406.4 0 8.50E+07
Exports LT 697,428 42204.89 744460.8 0 1.53E+08
Ln Total Exports 427,201 7.462 4.087 -6.908 20.038
Ln Exports HT 305,137 5.493 4.070 -6.908 19.241
Ln Exports MT 334,617 6.131 4.043 -6.908 18.258
Ln Exports LT 349,748 5.552 3.995 -6.908 18.844
Ln GDP_exporter 646,215 23.685 2.375 16.395 30.523
Ln GDP_importer 643,634 23.652 2.399 16.216 30.523
Ln distance 697,428 8.737 0.822 0.632 9.899
Common Language 697,428 0.147 0.354 0 1
Common Border 697,428 0.016 0.124 0 1
Colonial ties 697,428 0.106 0.308 0 1
Ln area_exporter 697,428 11.458 2.511 3.332205 16.11656
Ln area_importer 697,428 11.389 2.583 2.302585 16.11656
Landlocked_exporter 697,428 0.203 0.403 0 1
Landlocked_importer 697,428 0.201 0.401 0 1
WTO Membership 697,428 0.586 0.493 0 1
TRIPS 697,428 0.316 0.465 0 1
Common currency 661,704 0.012 0.109 0 1
RTA_tech (with technology
provisions) 697,428 0.052 0.223 0 1
RTA_notech (without
technology provisions) 697,428 0.033 0.178 0 1
RTA_depth 697,428 0.286 1.057 0 7
Note: HT, MT and LT denote high, medium and low technology content, respectively. TRIPS takes the value of 1 from the
year in which countries are first in compliance with TRIPS and 0 otherwise. WTO members were given different transition
periods for the implementation of TRIPS laws and enforcement mechanisms. Developed countries were given one year,
whereas developing countries and some transition economies were given five years (until 2000) and least developed
countries initially had 11 years (until 2006), but the period was extended until 2013 for most products and even longer for a
few sensitive products (pharmaceutical patents, undisclosed information protection).
5. Main Results
Table 2 shows the results of equation (4) estimated with the dependent variable in levels using PPML,
which is based on the theoretically justified gravity model and includes MRT. The results of the
corresponding log-log specification in equation (3) are presented in the Appendix (Table A.3), where

17
the results of the linearized traditional specification of the gravity model are also shown for
comparative purposes19
.
Table 2 presents the results for total exports in column 1. When using the PPML method,20
the
estimated effects are generally larger than those obtained with the log-log model.21
The results for the
variables of interest (RTA_tech and RTA_notech) suggest that while RTAs containing provisions of
this type increase total exports by 24%22
for shallow agreements (RTA_depth=0), RTAs without such
provisions also show a significant effect on total exports, of slightly higher magnitude.23
We also
estimated the model with PPML eliminating zero trade flows, keeping the same number of
observations as in the log-log model, and the results show that the effects of RTA_tech are smaller in
magnitude (the RTA_tech coefficient is 0.081 instead of 0.215 for total exports)24
.
When the model is estimated for exports with different levels of technology content—HT, MT, and
LT, according to the abovementioned UNCTAD classification—the results vary. For exports with HT
content (in column 2, Table 2), agreements containing only technology provisions have a significant
effect in terms of stimulating export growth, whereas agreements without such provisions are less
effective. More specifically, the point coefficient for RTA_tech indicates that adding technology
provisions to an RTA increases trade in HT products by 21% (column 2, first row) independently of
whether or not the RTA contains any other type of provisions. Indeed, RTA_depth is not statistically
significant for HT products (column 2), and the same is the case for RTA_notech. This means that the
partial effect on trade of adding technology provisions is around 15%, [(exp{0.189-0.0526}-1)*100],
19The first column in Table A.3 presents the estimations using traditional gravity variables. In the second column, variables
that vary by country are replaced by origin and destination fixed effects, and in the third column bilateral variables are
replaced by dyadic fixed effects. The traditional gravity variables present the expected signs and magnitudes; the GDP
coefficients are close to the theoretical value of one in column (1); distance, area and landlocked variables show negative
and significant coefficients, and sharing a border, an official language or colonial ties all increase trade significantly, as
expected. WTO membership, TRIPS and common currency all show positive and significant effects on total exports, which
are reduced when controlling for country-time and pair fixed effects in column (4).
20The command ppml_panel_sg, written by Zylkin (2016), was used ("symmetric pair effects" option is appropriate for
identification if all main variables are symmetric with respect to direction of trade, Zylkin post: Statalist 8th November
2017).21
According to Bergstrand et al. (2015), PPML estimates tend to be larger than OLS estimates for RTAs.22Compared with 14% for RTA_tech in column 4, Table A.3.
23 As usual, the percentage increase in trade attributed to RTAs is obtained by applying the exponential (anti-log) to the
estimated coefficient, subtracting 1, and multiplying by 100. 24
Full results are available in the Appendix (Table A.4).

18
which we interpret as the direct effect, whereas the trade effect of eliminating trade policy barriers is
around 6%.
The results for exports with MT content are shown in column3 of Table 2. The effect of RTA_tech is
positive and small for shallow RTAs, when RTA_depth=0, and lower in magnitude than the effect of
RTA_notech, but for RTAs with more than 1 provision type (RTA_depth=2-7) the effect is significant
and sizable. For those with LT content, the effect of RTA_tech is statistically significant even for
shallow agreements and adds a 5% increase to the effect of RTA_notech (see column 4 in Table 2).
The results also show that the coefficient of RTA_depth is positive and significant for MT and LT
groups, indicating that deeper RTAs promote exports with MT content the most. In this estimation,
TRIPS and WTO present collinearity problems and cannot be estimated in the same model. We show
the results including TRIPS since it is more relevant in this setting. The estimated coefficient for
TRIPS indicates that total exports and exports with LT content are positively affected, whereas the
effect is not statistically significant for exports with MT and HT content. Finally, countries in a
currency union trade substantially more than others, with the effect being slightly higher for total
exports and exports with MT content.
Table 2. Estimation of the Gravity Model for Export Flows (PPML)
(1) (2) (3) (4)
Dep. Variable: X_Total X_HT X_MT X_LT
Ind. Variables:
RTA_tech 0.215*** 0.189*** 0.0266 0.165***
(0.0318) (0.0440) (0.0359) (0.0355)
RTA _notech 0.324*** 0.0526 0.452*** 0.118*
(0.0576) (0.0478) (0.0503) (0.0625)
RTA _depth 0.0441*** 0.000976 0.0784*** 0.0702***
(0.00620) (0.00735) (0.00750) (0.00781)
Common currency 0.779*** 0.517*** 0.667*** 0.538***
(0.0414) (0.0418) (0.0405) (0.0349)
TRIPS 0.540*** -0.0680 0.185 0.597***
(0.125) (0.197) (0.172) (0.0922)
Observations 587,469 608,560 626,353 627,756
Pseudo R-squared 0.982 0.990 0.980 0.989
Note: Standard errors in parentheses. *** p<0.01, ** p<0.05, * p<0.1. Panel structural gravity estimation fixed effects
included: exporter-year, importer-year, exporter-importer (symmetric). Clustered standard errors, clustered by exporter-
importer (default). HT, MT and LT denote high, medium and low technology content, respectively. RTA_tech/_notech
denote membership in Regional Trade Agreements with/without technology-related provisions. RTA_depth is an index that
varies between 1 and 7, with higher numbers indicating that more provisions are included.
19
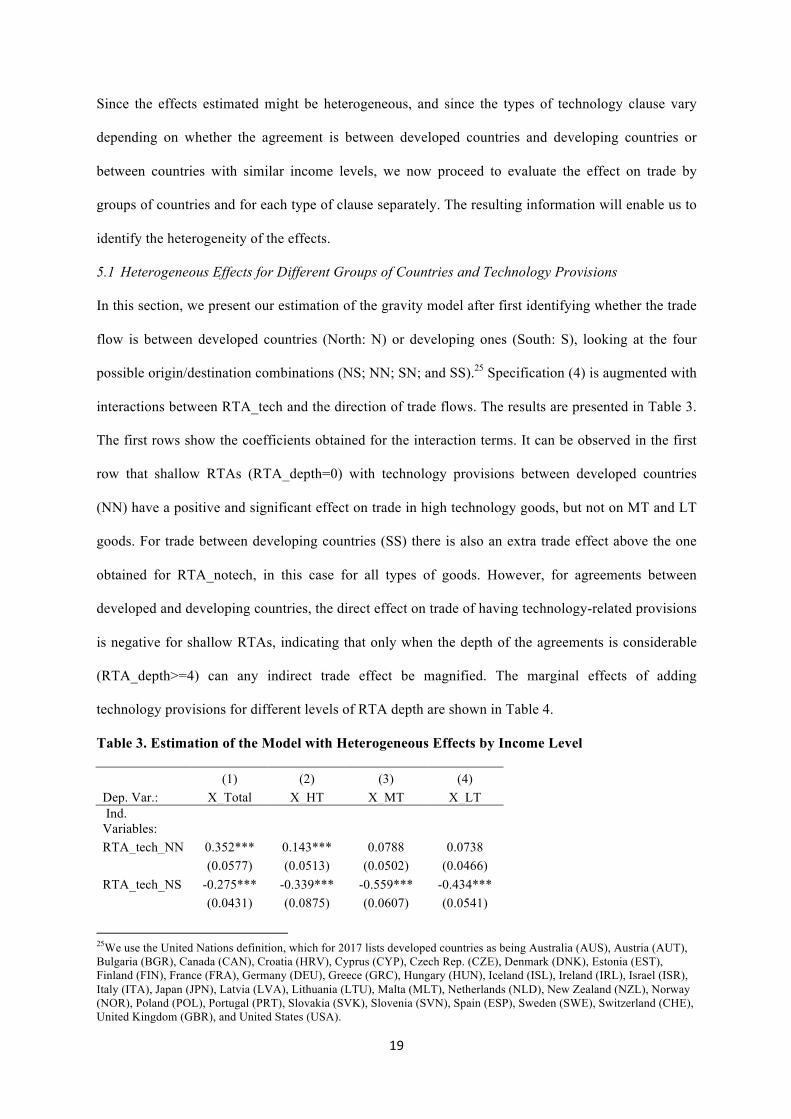
Since the effects estimated might be heterogeneous, and since the types of technology clause vary
depending on whether the agreement is between developed countries and developing countries or
between countries with similar income levels, we now proceed to evaluate the effect on trade by
groups of countries and for each type of clause separately. The resulting information will enable us to
identify the heterogeneity of the effects.
5.1 Heterogeneous Effects for Different Groups of Countries and Technology Provisions
In this section, we present our estimation of the gravity model after first identifying whether the trade
flow is between developed countries (North: N) or developing ones (South: S), looking at the four
possible origin/destination combinations (NS; NN; SN; and SS).25
Specification (4) is augmented with
interactions between RTA_tech and the direction of trade flows. The results are presented in Table 3.
The first rows show the coefficients obtained for the interaction terms. It can be observed in the first
row that shallow RTAs (RTA_depth=0) with technology provisions between developed countries
(NN) have a positive and significant effect on trade in high technology goods, but not on MT and LT
goods. For trade between developing countries (SS) there is also an extra trade effect above the one
obtained for RTA_notech, in this case for all types of goods. However, for agreements between
developed and developing countries, the direct effect on trade of having technology-related provisions
is negative for shallow RTAs, indicating that only when the depth of the agreements is considerable
(RTA_depth>=4) can any indirect trade effect be magnified. The marginal effects of adding
technology provisions for different levels of RTA depth are shown in Table 4.
Table 3. Estimation of the Model with Heterogeneous Effects by Income Level
(1) (2) (3) (4)
Dep. Var.: X_Total X_HT X_MT X_LT
Ind.
Variables:
RTA_tech_NN 0.352*** 0.143*** 0.0788 0.0738
(0.0577) (0.0513) (0.0502) (0.0466)
RTA_tech_NS -0.275*** -0.339*** -0.559*** -0.434***
(0.0431) (0.0875) (0.0607) (0.0541)
25
We use the United Nations definition, which for 2017 lists developed countries as being Australia (AUS), Austria (AUT),
Bulgaria (BGR), Canada (CAN), Croatia (HRV), Cyprus (CYP), Czech Rep. (CZE), Denmark (DNK), Estonia (EST),
Finland (FIN), France (FRA), Germany (DEU), Greece (GRC), Hungary (HUN), Iceland (ISL), Ireland (IRL), Israel (ISR),
Italy (ITA), Japan (JPN), Latvia (LVA), Lithuania (LTU), Malta (MLT), Netherlands (NLD), New Zealand (NZL), Norway
(NOR), Poland (POL), Portugal (PRT), Slovakia (SVK), Slovenia (SVN), Spain (ESP), Sweden (SWE), Switzerland (CHE),
United Kingdom (GBR), and United States (USA).
20
RTA_tech_SN -0.256*** -0.0964** -0.438*** -0.401***
(0.0406) (0.0451) (0.0434) (0.0485)
RTA_tech_SS 0.576*** 0.536*** 0.490*** 0.700***
(0.0424) (0.0706) (0.0453) (0.0491)
RTA_notech 0.209*** -0.0261 0.351*** 0.0347
(0.0564) (0.0498) (0.0489) (0.0615)
RTA_depth 0.0879*** 0.0345*** 0.129*** 0.122***
(0.00626) (0.00782) (0.00744) (0.00770)
CU 0.700*** 0.481*** 0.598*** 0.470***
(0.0397) (0.0400) (0.0391) (0.0342)
TRIPS 0.547*** -0.0294 0.236 0.599***
(0.117) (0.188) (0.161) (0.0896)
Observations 587,469 608,560 626,353 627,756
R-squared 0.982 0.990 0.981 0.989
Note: Standard errors in parentheses. *** p<0.01, ** p<0.05, * p<0.1. Panel structural gravity estimation fixed effects
included: exporter-year, importer-year, exporter-importer (symmetric). Clustered standard errors, clustered by
exporter-importer (default). The coefficients of TRIPS, RTA_depth and Common currency variables are not shown to
save space. Flow identifies whether the trade flow is between developed countries (North: N) or developing ones
(South: S). HT, MT and LT denote high, medium and low technology content, respectively. RTA_tech/_notech
denote membership in Regional Trade Agreements with/without technology-related provisions.
The results shown in Table 3 also suggests that RTAs with technology provisions benefit exports
between developing countries (SS) proportionately more, as indicated by the coefficient of
RTA_tech_SS. They also benefit exports of goods with LT content relatively more, although they do
still benefit HT and MT exports when the agreement includes technology provisions and exports go
from one developing country to another.
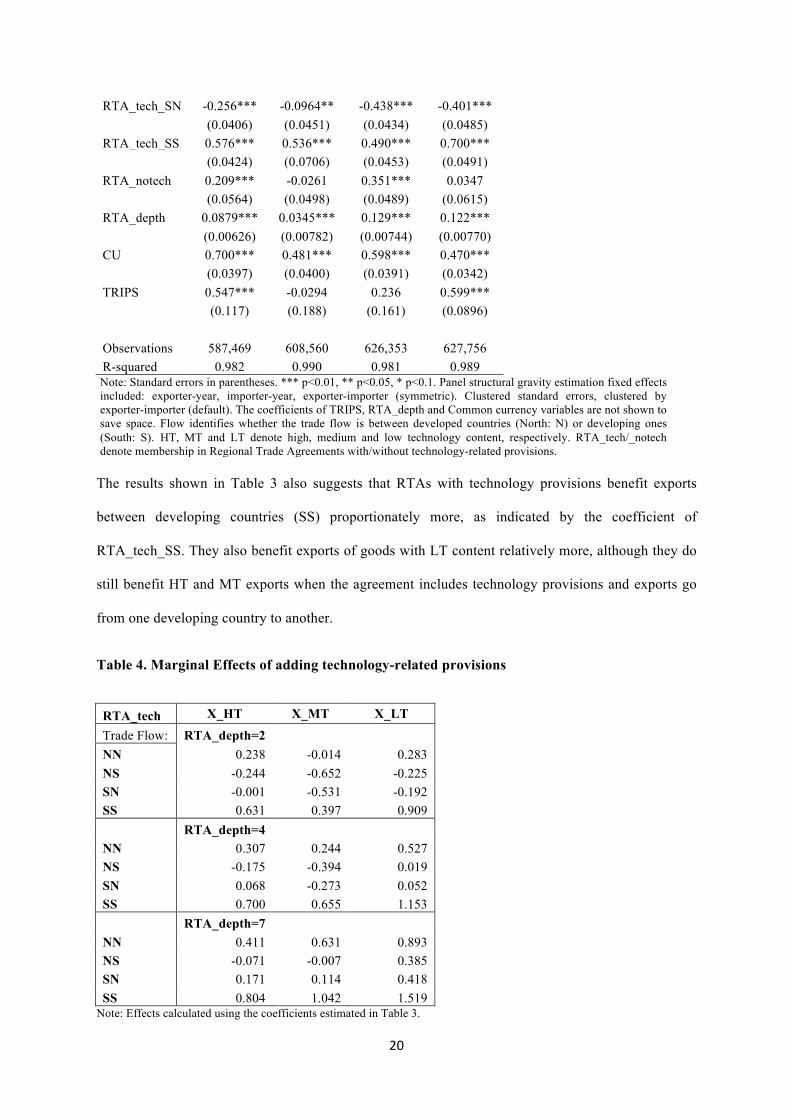
Table 4. Marginal Effects of adding technology-related provisions
RTA_tech X_HT X_MT X_LT
Trade Flow: RTA_depth=2
NN 0.238 -0.014 0.283
NS -0.244 -0.652 -0.225
SN -0.001 -0.531 -0.192
SS 0.631 0.397 0.909
RTA_depth=4
NN 0.307 0.244 0.527
NS -0.175 -0.394 0.019
SN 0.068 -0.273 0.052
SS 0.700 0.655 1.153
RTA_depth=7
NN 0.411 0.631 0.893
NS -0.071 -0.007 0.385
SN 0.171 0.114 0.418
SS 0.804 1.042 1.519 Note: Effects calculated using the coefficients estimated in Table 3.

21
Table 4 shows that the incremental effect on exports of adding technology-related provisions is
substantial for SS trade flows and increase with the depth of the RTAs (number of additional
provisions on other subjects). For NN trade, the marginal effects are also positive for all types of
goods when the depth of the RTA is at least 4, whereas for NS and SN negative marginal effects are
shown for less inclusive RTAs (RTA_depth<4). This means that the short-run effects on trade of
including technology-related provisions could lead to lower exports if the RTAs do not also regulate
product, labor and environmental standards, for example. Finally, for RTAs of maximum depth, most
marginal effects are shown to be positive, and it is only for exports from developed to developing
countries (NS) that some small negative effects are found.
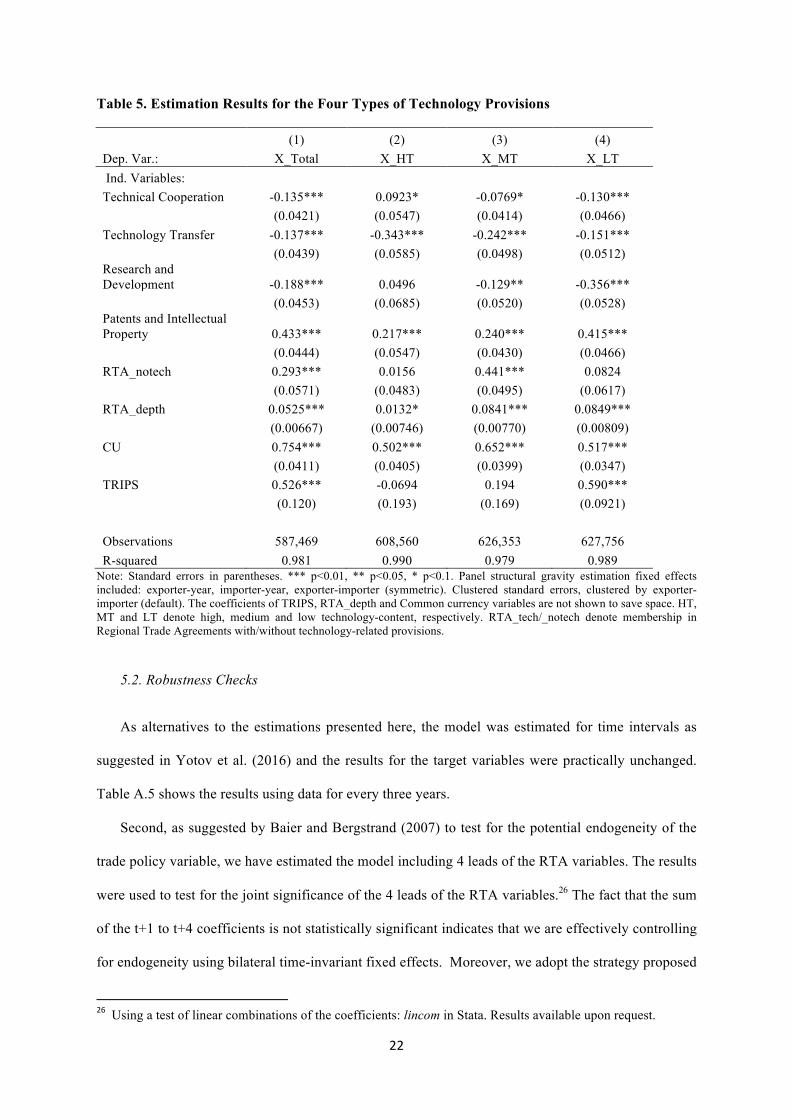
Next, we differentiate between each of the four possible technology clause types. The gravity model is
estimated with each provision relating to technology and innovation included separately in a single
model for total exports and exports of HT, MT and LT goods. The aim is to ascertain whether the
different types of provisions have a different direct effect on exports. The results, shown in Table 5,
indicate that we cannot accept that the RTA with provisions affects exports equally for each type of
provision. In particular, for total exports (column 1) RTAs with provisions on intellectual property
rights and patents increase exports significantly more than RTAs without such provisions, whereas
those with technology transfer, technical cooperation or R&D provisions show a negative coefficient,
indicating that for shallow agreements the addition of those provisions does not magnify the trade
effect of basic RTAs; on the contrary, they reduce it. For HT goods, both intellectual property rights
and technical cooperation seem to exert a positive effect on exports, which is not present for RTAs
without technology provisions (RTA_notech is not statistically significant in column 2). However,
adding technology transfer provisions seems to decrease HT exports, perhaps due to the fact that it
will facilitate importers’ specialization in the production and exports of these goods. Concerning MT
and LT exports, it also seems in this case that the most influential provisions are those concerning
patents and intellectual property; and once again, the additional trade effect is positive and slightly
higher than for HT goods. However, adding provisions in the other three categories considered does
seem to reduce exports.
22
Table 5. Estimation Results for the Four Types of Technology Provisions
(1) (2) (3) (4)
Dep. Var.: X_Total X_HT X_MT X_LT
Ind. Variables:
Technical Cooperation -0.135*** 0.0923* -0.0769* -0.130***
(0.0421) (0.0547) (0.0414) (0.0466)
Technology Transfer -0.137*** -0.343*** -0.242*** -0.151***
(0.0439) (0.0585) (0.0498) (0.0512)
Research and
Development -0.188*** 0.0496 -0.129** -0.356***
(0.0453) (0.0685) (0.0520) (0.0528)
Patents and Intellectual
Property 0.433*** 0.217*** 0.240*** 0.415***
(0.0444) (0.0547) (0.0430) (0.0466)
RTA_notech 0.293*** 0.0156 0.441*** 0.0824
(0.0571) (0.0483) (0.0495) (0.0617)
RTA_depth 0.0525*** 0.0132* 0.0841*** 0.0849***
(0.00667) (0.00746) (0.00770) (0.00809)
CU 0.754*** 0.502*** 0.652*** 0.517***
(0.0411) (0.0405) (0.0399) (0.0347)
TRIPS 0.526*** -0.0694 0.194 0.590***
(0.120) (0.193) (0.169) (0.0921)
Observations 587,469 608,560 626,353 627,756
R-squared 0.981 0.990 0.979 0.989
Note: Standard errors in parentheses. *** p<0.01, ** p<0.05, * p<0.1. Panel structural gravity estimation fixed effects
included: exporter-year, importer-year, exporter-importer (symmetric). Clustered standard errors, clustered by exporter-
importer (default). The coefficients of TRIPS, RTA_depth and Common currency variables are not shown to save space. HT,
MT and LT denote high, medium and low technology-content, respectively. RTA_tech/_notech denote membership in
Regional Trade Agreements with/without technology-related provisions.
5.2. Robustness Checks
As alternatives to the estimations presented here, the model was estimated for time intervals as
suggested in Yotov et al. (2016) and the results for the target variables were practically unchanged.
Table A.5 shows the results using data for every three years.
Second, as suggested by Baier and Bergstrand (2007) to test for the potential endogeneity of the
trade policy variable, we have estimated the model including 4 leads of the RTA variables. The results
were used to test for the joint significance of the 4 leads of the RTA variables.26
The fact that the sum
of the t+1 to t+4 coefficients is not statistically significant indicates that we are effectively controlling
for endogeneity using bilateral time-invariant fixed effects. Moreover, we adopt the strategy proposed
26 Using a test of linear combinations of the coefficients: lincom in Stata. Results available upon request.
23
by the same authors of incorporating the RTA variable with a number of different lags to consider the
effects of phasing in trade agreements; the estimated coefficients indicate that the effects materialized
between 4 and 8 years after the entry into force of the RTA, depending on the type of goods traded.
Third, we have replicated the results in Campi and Dueñas (2019) using the gravity model with
the dependent variable in logarithms and with pair fixed effects, but without MRT. The results,
reported in Table A.6, show that the RTA coefficient is very similar to the one obtained by those
authors, whereas the coefficients for the RTA with and without intellectual property provisions differ.
We obtained a positive and significant effect for the RTA with intellectual property provisions and a
not statistically significant coefficient for RTA without, whereas they reported a stronger and positive
effect for RTA without intellectual property provisions. This could be due to the fact that the number
of observations in our estimations is almost double that used by Campi and Dueñas (2019), despite the
fact that we restricted the sample of countries to match their sample. More research is needed to find
the cause of the divergence in the results.
Finally, we have replicated the results in Dhringra et al. (2018) for gross exports of goods using
high dimensional fixed effects with 2-year (as in their baseline model) and 4-year time intervals. The
results are shown in Table A.7. Columns 1 and 2 are comparable to those in columns 1 and 4 of Table
A1 (Dhringra et al., 2018, page 25). Columns 4 to 8 replicate their Table A17 (Dhringra et al., 2018,
apge 38). We confirm that for their sample of 43 countries the coefficient on intellectual property
provisions is not statistically significant, whereas in the extended sample a positive and significant
effect is found for it, as it is the case in our estimations.
Conclusions
Including innovation provisions for direct technology transfer in RTAs has different effects on exports
depending on the direction of trade, the level of development of the countries of origin and
destination, and the type of clause included in the agreement. The main results of this study indicate
that regional trade agreements (RTAs) that contain technology-related provisions generate a
significantly higher aggregate volume of trade than RTAs that do not, after controlling for the depth
of the agreements. When all countries are considered, for those that ratify RTAs with such provisions
rather than those without, it is exports of technology-intensive goods that increase the most.

24
Patterns found in the results indicate which countries or sectors should benefit from the inclusion of
technology provisions. SS agreements have positive effects on exports of HT, MT and LT, which are
higher in magnitude for LT exports; this finding reflects their relatively low level of technological
development. In NN agreements, the effects of RTAs are less pronounced. For RTAs between
countries with different levels of development the addition of technology-related provision could have
detrimental effects on exports in the short run, but this depends on the depth of the RTAs. For deep
and comprehensive trade agreements the additional trade effect tends to be positive for almost all
trade flows, with only exports from developed to developing countries showing small negative effects.
The good news is that for the most part our results support the inclusion of intellectual property
related provisions in the RTAs, given that those provisions seem to exert an additional positive effect
on trade, even for shallow RTAs. Conversely, provisions related to technology transfer, R&D and
technical cooperation might be looser and hence less effective.
In certain circumstances, the existence of provisions may not be enough in itself to guarantee effective
technology transfer. To complement them, it may be necessary to create appropriate enforcement
mechanisms to build on the vague provisions in trade agreements. These might take the form of
monitoring committees formed of representatives from both parties whose sole function is to ensure
compliance with these provisions. Establishing binational parliamentary committees is another such
possibility.27
The WTO laid the groundwork for technology transfer through TRIPS and has urged developed
countries to create reports to document the steps they have taken to apply the articles on cooperation
in their relations with lower-income countries. In line with these commitments, it is important to
continuously assess the impact of agreements, especially the aspects that relate to technology transfer,
an issue which is by nature constantly changing. By estimating how RTAs containing different types
of innovation and technology transfer provisions affect trade, this study is intended as a step in this
direction. The main results suggest that it is important for agreements to include such provisions,
particularly if they are to be effective at increasing medium-technology exports from new
27
This was the case for the Chile–China agreement, following which the Permanent Binational Commission and
the Mechanism for Strategic Dialogue for Economic Cooperation and Coordination were created. For more
examples, see Chelala (2018).

25
industrialized countries to developing countries, which in turn facilitates knowledge and technology
transfer between countries and generates technology spillovers.
To distinguish between the effects of the provisions depending on the enforcement mechanisms that
are set out in the RTAs, this study could be extended by classifying RTA provisions according to how
stringently they are enforced. Alternatively, a more straightforward approach could be to see whether
effects vary depending on levels of rule of law and the effectiveness of governance in exporter
countries.
We also leave for future research the estimation of the effects of RTAs containing innovation and
technology provisions on the technological level of the countries that ratify such agreements,
distinguishing between the pure trade effect effects and those that are due to direct technology
transfer. To that end, the trade forecasts obtained from the gravity model could be included, together
with proxies for participation in RTAs with those provisions, in a model of the determinants of R&D
expenditure and innovative activity.
26
References
Allen, T., Arkolakis, C., and Takahashi, Y. 2014. “Universal Gravity.” NBER Working Paper No.
20787. Cambridge: National Bureau of Economic Research.
Anderson, J. E. 1979. “A Theoretical Foundation for the Gravity Equation”. The American Economic
Review, 69(1):106–116.
Anderson, J., and van Wincoop, E. 2003. “Gravity with Gravitas: A Solution to the Border Puzzle.”
American Economic Review 93(1), 170-192.
Baghdadi, L., Martínez-Zarzoso, I., and Zitouna, H. 2013. “Are RTA Agreements with Environmental
Provisions Reducing Emissions?” Journal of International Economics 90(2): 378–390.
Baier, S., and Bergstrand, J. 2007. “Do Free-Trade Agreements Actually Increase Members’
International Trade?” Journal of International Economics 71(1): 72–95.
Bergstrand, J. H. 1985. “The Gravity Equation in International Trade: Some Microeconomic
foundations and empirical evidence”. The Review of Economics and Statistics, 67 (3):474-481.
Bergstrand, J. H., Larch, M. and Yotov, Y.V. 2015. “Economic Integration Agreements, Border
Effects, and Distance Elasticities in the Gravity Equation” European Economic Review 78, 307-327.
Bhagwati, J. 1995. “US Trade Policy: The Infatuation with FTAs.” Columbia University Discussion
Paper Series No. 726. Also in Claude Barfield (ed.), The Dangerous Obsession with Free Trade
Areas, AEI, 1995.
Campi, M. and Dueñas, M. 2018. “Intellectual Property Rights, Trade Agreements and International
Trade”, Research Policy forthcoming.
Chelala, S. 2018. “Acuerdos comerciales y tecnología. Mecanismos de transferencia y efecto derrame
de conocimiento: evidencia empírica y casos de estudio.” Relaciones Internacionales 54: 55–76.
Chelala, S., and Martínez-Zarzoso, I. 2017. “Anti-Innovation Bias? The Technological Impact of
Trade Agreements,” Integration & Trade Journal 42: 142–155.
Dhingra, S., Freeman, R. and Mavroedi, E. (2018), “Beyond tariff reductions: what extra boost from
trade agreement provisions?”, WP 12795 , CEPR.
Dür, A., Baccini, L., and Elsig, M. 2014. “The Design of International Trade Agreements: Introducing
a New Dataset.” The Review of International Organizations 9(3): 353–375.
Eaton, J., and Kortum, S. 2002. “Technology, Geography, and Trade.” Econometrica. 70 (5): 1741–
1779.
Feenstra, R. 2016. Advanced International Trade: Theory and Evidence. 2nd
Edition. Princeton:
Princeton University Press.
Head, K., and Mayer, T. 2014. “Gravity Equations: Workhorse, Toolkit, and Cookbook.” In: G.
Gopinath, E. Helpman, and K. Rogoff, editors. Handbook of International Economics, Vol. 4.
Amsterdam: Elsevier-North Holland: 131-195.

27
Hofmann, C., Osnago, A., and Ruta, M. 2018. “The Content of Preferential Trade Agreements.”
World Trade Review, forthcoming.
Hoppe, M. 2005. “Technology Transfer Through Trade.” Nota di Lavoro No. 19.2005. Milan:
Fundazione Eni Enrico Mattei.
Jinji, N., Zang, X. And Haruna, S. (2019) Do Deeper Regional Trade Agreements Enhance
International Technology Spillovers? The World Economy, forthcoming.
Keller, W. 2004. International Technology Diffusion. Journal of Economic Literature 42: 752-
782.Lall, S. 2000. “The Technological Structure and Performance of Developing Country
Manufactured Exports, 1985-1998. Working Paper Number 44, Queen Elizabeth House, University of
Oxford.
Ivus, O. 2010. “Do Stronger Patent Rights Raise High-tech Exports to the Developing World?”
Journal of International Economics, 81(1): 38–47.
Madsen, J.B. 2007. “Technology Spillover Through Trade and TFP Convergence: 135 Years of
Evidence for the OECD Countries.” Journal of International Economics 72(2): 464–480.
Maskus, K. 2016. “Patents and Technology Transfer Through Trade and the Role of Regional Trade
Agreements.” In: Megaregionalism 2.0: Trade and Innovation within Global Networks, edited by D.
Ernst and M. Plummer. New Jersey: World Scientific Publishing.
Santos Silva, J. and Tenreyro, S. 2006. “The log of gravity”. The Review of Economics and Statistics,
88(4):641–658.
World Bank 2019. Development Indicators 2019. World Bank, Washington D.C.
Yotov, Y. V., Piermartini, R., Monteiro, J.-A., and Larch, M. 2016. “An Advanced Guide to Trade
Policy Analysis: The Structural Gravity Model”. World Trade Organization, Geneva.
Zylkin, T. 2016. “PPML_PANEL_SG: Stata Module to Estimate Structural Gravity Models via
Poisson PML.” Statistical Software Components S458249, Boston College Department of Economics,
revised May 18, 2017.

28
Appendix
Figure A.1. Distribution of High-Technology-Content Exports by Type of Agreement
Source: Compiled by the authors based on RTAs and exports (UNCTAD). Lexp is ln of high-tech exports. Years 1995 to
2017. Figure A.2. Distribution of Medium-Technology-Content Exports by Type of Agreement
Source: Compiled by the authors based on RTAs and exports (UNCTAD). Lxmtet is ln of medium-tech exports. Years 1995 to
2017. Figure A.1. Distribution of Low-Technology-Content Exports by Type of Agreement
Source: Compiled by the authors based on RTAs and exports (UNCTAD). Lxltet is ln of low-tech exports. Years 1995 to
2017.
0.0
5.1
.15
De
nsity
-10 0 10 20lxhtet
no RTA
RTA_NOTECH
RTA_TECH
kernel = epanechnikov, bandwidth = 0.2990
Kernel density estimate
0.0
5.1
.15
De
nsity
-10 0 10 20lxmtet
no RTA
RTA_NOTECH
RTA_TECH
kernel = epanechnikov, bandwidth = 0.2911
Kernel density estimate
0.0
5.1
.15
De
nsity
-10 0 10 20lxltet
no RTA
RTA_NOTECH
RTA_TECH
kernel = epanechnikov, bandwidth = 0.2839
Kernel density estimate

29
Table A.1. List of Countries
Afghanistan Czech Rep. Kuwait Rwanda
Albania Cote d'Ivoire Kyrgyzstan Samoa
Algeria People's Rep. of Korea Lao People's Dem. Rep. Sao Tome and Principe
Angola Denmark Latvia Saudi Arabia
Antigua and Barbuda Djibouti Lebanon Senegal
Argentina Dominica Lesotho Seychelles
Armenia Dominican Rep. Liberia Sierra Leone
Australia Ecuador Libya Singapore
Austria Egypt Lithuania Slovakia
Azerbaijan El Salvador Luxembourg Slovenia
Bahamas Equatorial Guinea Madagascar Solomon Isds
Bahrain Eritrea Malawi Somalia
Bangladesh Estonia Malaysia South Africa
Barbados Ethiopia Maldives Spain
Belarus Fiji Mali Sri Lanka
Belize Finland Malta Sudan
Benin France Mauritania Suriname
Bermuda Gabon Mauritius Swaziland
Bhutan Gambia Mexico Sweden
Bolivia Georgia Mongolia Switzerland
Bosnia Herzegovina Germany Morocco Syria
Botswana Ghana Mozambique TFYR of Macedonia
Brazil Greece Myanmar Tajikistan
Brunei Darussalam Greenland Namibia Thailand
Bulgaria Guatemala Nepal Togo
Burkina Faso Guinea Netherlands Tonga
Burundi Guinea-Bissau New Zealand Trinidad and Tobago
Cambodia Guyana Nicaragua Tunisia
Cameroon Haiti Niger Turkey
Canada Honduras Nigeria Turkmenistan
Cape Verde Hungary Norway Tuvalu
Central African Rep. Iceland Oman USA
Chad Indonesia Pakistan Uganda
Chile Iran Palau Ukraine
China Iraq Panama United Arab Emirates
China, Hong Kong SAR Ireland Papua New Guinea United Kingdom
China, Macao SAR Israel Paraguay Uruguay
Colombia Italy Peru Uzbekistan
Comoros Jamaica Philippines Vanuatu
Congo Japan Poland Venezuela
Costa Rica Jordan Portugal Viet Nam
Croatia Kazakhstan Qatar Yemen
Cuba Kenya Rep. of Korea Zambia
Cyprus Kiribati Rep. of Moldova Zimbabwe

30
Table A.2. Classification of Goods
Lall (20002) Classification from UNCTAD
DC04 Low technology manufactures: textile, garment and footwear
611 Leather
612 Manufactures of leather, n.e.s.; saddlery & harness
613 Furskins, tanned or dressed, excluding those of 8483
651 Textile yarn
652 Cotton fabrics, woven
654 Other textile fabrics, woven
655 Knitted or crocheted fabrics, n.e.s.
656 Tulles, trimmings, lace, ribbons & other small wares
657 Special yarn, special textile fabrics & related
658 Made-up articles, of textile materials, n.e.s.
659 Floor coverings, etc.
831 Travel goods, handbags & similar containers
841 Men's clothing of textile fabrics, not knitted
842 Women's clothing, of textile fabrics
843 Men's or boys’ clothing, of textile, knitted, croche.
844 Women's clothing, of textile, knitted or crocheted
845 Articles of apparel, of textile fabrics, n.e.s.
846 Clothing accessories, of textile fabrics
848 Articles of apparel, clothing access., excluding textile
851 Footwear
LDC05 Low technology manufactures: other products
642 Paper & paperboard, cut to shape or size, article
665 Glassware
666 Pottery
673 Flat-rolled prod., iron, non-alloy steel, not coated
674 Flat-rolled prod., iron, non-alloy steel, coated, clad
675 Flat-rolled products of alloy steel
676 Iron & steel bars, rods, angles, shapes & sections
677 Rails & railway track construction mat., iron, steel
678 Wire of iron or steel
691 Structures & parts, n.e.s., of iron, steel, aluminium
692 Metal containers for storage or transport
693 Wire products (excluding electrical) and fencing grills
694 Nails, screws, nuts, bolts, rivets & the like, of metal
695 Tools for use in the hand or in machine
696 Cutlery
697 Household equipment of base metal, n.e.s.
699 Manufactures of base metal, n.e.s. 821 Furniture & parts
893 Articles, n.e.s., of plastics
894 Baby carriages, toys, games & sporting goods
895 Office & stationery supplies, n.e.s.
897 Jewellery & articles of precious materia., n.e.s.
31
898 Musical instruments, parts; records, tapes & similar
899 Miscellaneous manufactured articles, n.e.s.
LDC06 Medium technology manufactures: automotive
781 Motor vehicles for the transport of persons
782 Motor vehic. for transport of goods, special purpo.
783 Road motor vehicles, n.e.s.
784 Parts & accessories of vehicles of 722, 781, 782, 783
785 Motorcycles & cycles
LDC07 Medium technology manufactures: process
266 Synthetic fibres suitable for spinning
267 Other man-made fibres suitable for spinning
512 Alcohols, phenols, halogenat., sulfonat., nitrat. der.
513 Carboxylic acids, anhydrides, halides, per.; derivati.
533 Pigments, paints, varnishes and related materials
553 Perfumery, cosmetics or toilet prepar. (excluding soaps)
554 Soaps, cleansing and polishing preparations
562 Fertilizers (other than those of group 272)
571 Polymers of ethylene, in primary forms
572 Polymers of styrene, in primary forms
573 Polymers of vinyl chloride or halogenated olefins
574 Polyethers, epoxide resins; polycarbonat., polyesters
575 Other plastics, in primary forms
579 Waste, parings and scrap, of plastics
581 Tubes, pipes and hoses of plastics
582 Plates, sheets, films, foil & strip, of plastics
583 Monofilaments, of plastics, cross-section > 1mm
591 Insecticides & similar products, for retail sale
593 Explosives and pyrotechnic products
597 Prepared addit. for miner. oils; lubricat., de-icing
598 Miscellaneous chemical products, n.e.s.
653 Fabrics, woven, of man-made fabrics
671 Pig iron & spiegeleisen, sponge iron, powder & granu
672 Ingots, primary forms, of iron or steel; semi-finis.
679 Tubes, pipes & hollow profiles, fittings, iron, steel
786 Trailers & semi-trailers
791 Railway vehicles & associated equipment
882 Cinematographic & photographic supplies
LDC08 Medium technology manufactures: engineering
711 Vapour generating boilers, auxiliary plant parts
713 Internal combustion piston engines, parts, n.e.s.
714 Engines & motors, non-electric; parts, n.e.s.
721 Agricultural machinery (excluding tractors) & parts
722 Tractors (excluding those of 71414 & 74415)
723 Civil engineering & contractors' plant & equipment
724 Textile & leather machinery, & parts thereof, n.e.s.
725 Paper mill, pulp mill machinery; paper articles man.
726 Printing & bookbinding machinery, & parts thereof
727 Food-processing machines (excluding domestic)

32
728 Other machinery for particular industries, n.e.s.
731 Machine-tools working by removing material
733 Mach.-tools for working metal, excluding removing mate.
735 Parts, n.e.s., & accessories for machines of 731, 733
737 Metalworking machinery (excluding machine-tools) & parts
741 Heating & cooling equipment & parts thereof, n.e.s.
742 Pumps for liquids
743 Pumps (excluding liquid), gas compressors & fans; centr.
744 Mechanical handling equipment, & parts, n.e.s.
745 Other non-electr. machinery, tools & mechan. appar.
746 Ball or roller bearings
747 Appliances for pipes, boiler shells, tanks, vats, etc.
748 Transmis. shafts
749 Non-electric parts & accessor. of machinery, n.e.s.
762 Radio-broadcast receivers, whether or not combined
763 Sound recorders or reproducers
772 Apparatus for electrical circuits; board, panels
773 Equipment for distributing electricity, n.e.s.
775 Household type equipment, electrical or not, n.e.s.
793 Ships, boats & floating structures
811 Prefabricated buildings
812 Sanitary, plumbing, heating fixtures, fittings, n.e.s.
813 Lighting fixtures & fittings, n.e.s.
872 Instruments & appliances, n.e.s., for medical, etc.
873 Meters & counters, n.e.s.
884 Optical goods, n.e.s.
LDC09 High technology manufactures: electronic and electrical
716 Rotating electric plant & parts thereof, n.e.s.
718 Other power generating machinery & parts, n.e.s.
751 Office machines
752 Automatic data processing machines, n.e.s.
759 Parts, accessories for machines of groups 751, 752
761 Television receivers, whether or not combined
764 Telecommunication equipment, n.e.s.; & parts, n.e.s.
771 Electric power machinery, and parts thereof
774 Electro-diagnostic appa. for medical sciences, etc.
776 Cathode valves & tubes
778 Electrical machinery & apparatus, n.e.s.
LDC10 High technology manufactures: other
525 Radio-actives and associated materials
541 Medicinal and pharmaceutical products, excluding 542
542 Medicaments (incl. veterinary medicaments)
712 Steam turbines & other vapour turbin., parts, n.e.s.
792 Aircraft & associated equipment; spacecraft, etc.
871 Optical instruments & apparatus, n.e.s.
874 Measuring, analysing & controlling apparatus, n.e.s.
881 Photographic apparatus & equipment, n.e.s.
Source: https://unctadstat.unctad.org.

33
Table A.3. Estimation of the Traditional Log-Linearized Gravity Model for Export Flows
Gravity model
Fixed Effects
(FE):
Traditional
Time FE
Origin,
destination
,time FE
Pair and
time FE
Pair, origin-time, destination-time FE
(1) (2) (3) (4) (5) (6) (7)
Dependent
variable:
lnX_total lnX_total LX_total lnX_total lnX_HT LX_MT lnX_LT
Independent
variables:
RTA_tech 0.791*** 1.067*** 0.236*** 0.134*** -0.036 0.221*** 0.153*** (0.060) (0.054) (0.032) (0.020) (0.027) (0.028) (0.024) RTA_notech 1.126*** 0.982*** -0.003 -0.055** -0.116*** 0.061** -0.032 (0.068) (0.064) (0.037) (0.023) (0.029) (0.030) (0.024) RTA_depth -0.037*** -0.118*** 0.021*** 0.006 0.017*** -0.018*** 0.003 (0.012) (0.011) (0.006) (0.004) (0.006) (0.006) (0.005) WTO members 0.285*** 0.220*** 0.192*** 0.135*** 0.044 0.095* 0.075* (0.030) (0.034) (0.025) (0.035) (0.055) (0.055) (0.044) TRIPS 0.233*** 0.227*** 0.132*** 0.063** 0.192*** 0.116*** 0.082*** (0.030) (0.030) (0.021) (0.025) (0.034) (0.042) (0.028) Common currency 0.387*** 0.179* 0.182*** 0.165*** 0.302*** 0.151*** 0.273*** (0.097) (0.095) (0.033) (0.024) (0.039) (0.035) (0.029) Ln GDP_exporter 1.228*** 0.309*** 0.431***
(0.006) (0.024) (0.023)
Ln GDP_importer 0.976*** 0.727*** 0.811***
(0.007) (0.020) (0.018)
Ln distance -1.149*** -1.450***
(0.017) (0.019)
Common language 0.709*** 0.690***
(0.037) (0.038)
Common border 0.978*** 0.615***
(0.099) (0.098)
Colonial ties 0.844*** 0.875***
(0.053) (0.048)
Ln Area_exporter -0.083***
(0.006)
Ln Area_importer -0.011*
(0.007)
Landlocked_export
er
-0.500***
(0.033)
Landlocked_import
er
-0.408***
(0.032)
Observations 387,180 387,180 387,180 402,398 285,565 314,413 329,052 Adjusted R-squared 0.670 0.740 0.153 0.879 0.860 0.837 0.868
Note: Robust standard errors clustered by pair (exporter-importer) in parentheses. *** p<0.01, ** p<0.05, * p<0.1. HT, MT
and LT denote high, medium and low technology content, respectively. The number of bilateral trade flows included in
columns (1) to (3) is 27,242. Ln denotes natural logs. RTA_tech/_notech denote membership in Regional Trade Agreements
with/without technology-related provisions and RTA_depth is an index that varies between 1 and 7, with higher numbers
indicating that more provisions are included.
34
Table A.4. Results excluding zero trade flows (PPML)
(1) (2) (3) (4)
Dep. Var.: X_Total X_HT X_MT X_LT
Ind. Variables:
RTA_tech 0.0807*** 0.171*** -0.000764 0.129***
(0.0270) (0.0439) (0.0358) (0.0351)
RTA_notech 0.323*** 0.0419 0.428*** 0.104*
(0.0526) (0.0477) (0.0498) (0.0618)
RTA_depth 0.0340*** 0.00294 0.0818*** 0.0755***
(0.00535) (0.00732) (0.00746) (0.00781)
Common
currency 0.215*** 0.515*** 0.663*** 0.536***
(0.0248) (0.0417) (0.0405) (0.0350)
TRIPS 0.451*** -0.0526 0.197 0.626***
(0.114) (0.198) (0.175) (0.0922)
Observations 402,398 285,565 314,413 329,052
R-squared 0.988 0.990 0.981 0.990
Note: Robust standard errors clustered by pair (exporter-importer) in parentheses. *** p<0.01, ** p<0.05, * p<0.1. Panel
structural gravity estimation fixed effects included: exporter-year, importer-year, exporter-importer (symmetric).
RTA_tech/_notech denotes membership in Regional Trade Agreements with/without technology-related provisions. HT, MT
and LT denote high, medium and low technology content, respectively.
Table A.5. Intervals every three years and by export type (PPML)
(1) (2) (3) (4)
Dep. Var.: X_Total X_HT X_MT X_LT
Ind. Variables:
RTA_tech 0.173*** 0.153*** 0.0196 0.183***
(0.0327) (0.0433) (0.0363) (0.0367)
RTA_notech 0.291*** 0.0263 0.433*** 0.112*
(0.0571) (0.0474) (0.0515) (0.0642)
RTA_depth 0.0498*** 0.00292 0.0801*** 0.0638***
(0.00635) (0.00735) (0.00752) (0.00786)
Common
currency 0.694*** 0.454*** 0.618*** 0.488***
(0.0424) (0.0427) (0.0410) (0.0350)
TRIPS 0.579*** -0.122 0.231 0.649***
(0.138) (0.216) (0.178) (0.0978)
Observations 222,259 219,698 229,662 230,140
R-Squared 0.982 0.991 0.981 0.989
Note: Robust standard errors clustered by pair (exporter-importer) in parentheses.. *** p<0.01, ** p<0.05, * p<0.1. Panel
structural gravity estimation fixed effects included: exporter-year, importer-year, exporter-importer (symmetric).
RTA_tech/_notech denotes membership in Regional Trade Agreements with/without technology-related provisions. HT, MT
and LT denote high, medium and low technology content, respectively.

35
Table A.6. Replication of Campi and Dueñas (2018)
(1) (2) (3) (4) (5) (6)
Dep. Variable lnX_Total lnX_Total lnX_Total lnX_Total lnX_Total lnX_Total
ij FE ij FE ij FE ij FE ij FE ij FE
Independent Variables
RTA 0.085***
(0.022)
RTA_noIP
-0.068**
-0.056* -0.056* -0.057*
(0.033)
(0.033) (0.030) (0.030)
RTA_IP
0.163*** 0.161*** 0.127*** 0.135***
(0.028) (0.028) (0.030) (0.030)
L5. RTA_noIP
0.005 0.008
(0.033) (0.033)
L5. RTA_IP
0.088*** 0.096***
(0.028) (0.028)
lrgdp_exp 1.103*** 1.103*** 1.111*** 1.113*** 0.981*** 0.966***
(0.054) (0.054) (0.054) (0.054) (0.058) (0.058)
lrgdp_imp 1.248*** 1.248*** 1.255*** 1.257*** 1.398*** 1.385***
(0.046) (0.046) (0.046) (0.046) (0.048) (0.048)
hc_imp 0.339*** 0.345*** 0.328*** 0.328*** 0.109 0.073
(0.094) (0.094) (0.094) (0.094) (0.107) (0.106)
hc_exp 0.372*** 0.372*** 0.365*** 0.363*** 0.119 0.083
(0.100) (0.100) (0.100) (0.100) (0.110) (0.109)
TRIPS
0.387***
(0.038)
Observations 223,018 223,018 223,018 223,018 168,582 168,582
Number of id 13,730 13,730 13,730 13,730 13,694 13,694
Adjusted R-squared 0.211 0.211 0.211 0.211 0.183 0.184
Note: Robust standard errors clustered by pair (exporter-importer) in parentheses.. *** p<0.01, ** p<0.05, * p<0.1.
RTA_IP/_noIP denotes membership in Regional Trade Agreements with/without Intellectual Property-related provisions. L5
denote the corresponding variable at period (t-5). Lrgdp_exp, lrgdp_imp denotes real gross domestic product of the exporter
and the importer, respectively and hc_exp, hc_imp denotes human capital index for the exporter and the importer, both
variables from the Penn World Tables.

36
Table A.7 Results using Dhringra et al. (2018) samples
WIOD Sample of 43 countries (2001-2014) Countries in Table A.1 (1995-2014)
Dep. Variable: (1) (2) (3) (4) (5) (6) (7) (8) (9)
LnX_Total 2y_interval 2y_interval 2y_interval 4y_interval 4y_interval 4y_interval 4y_interval 4y_interval 4y_interval
Ind. Variables
RTA -0.028 -0.038 -0.027 -0.054 -0.244*** -0.197* 0.067*** -0.002 -0.050
(0.032) (0.039) (0.043) (0.063) (0.093) (0.102) (0.022) (0.033) (0.042)
RTA_depth 0.025* 0.027*
0.060*** 0.064***
0.020*** 0.016**
(0.013) (0.015)
(0.022) (0.024)
(0.008) (0.008)
Intellectual Property
-0.029
-0.086
0.092*
(0.070)
(0.098)
(0.048)
WTO
0.138**
(0.064)
TRIPS
0.092**
(0.047)
Common Currency
0.124***
(0.047)
Observations 14,600 14,600 14,600 8,297 8,297 8,297 112,208 112,208 112,134
Adjusted R-squared 0.935 0.935 0.935 0.933 0.933 0.933 0.873 0.873 0.873
Note: Robust standard errors clustered by pair (exporter-importer) in parentheses. *** p<0.01, ** p<0.05, * p<0.1. Ln denotes natural logs. RTA /_depth denote membership in Regional Trade
Agreements /with Intellectual Property-related provisions and RTA_depth is an index that varies between 1 and 7, with higher numbers indicating that more provisions are included. Panel
structural gravity estimation fixed effects included: exporter-year, importer-year, exporter-importer.


