376
00 Trade, Doha, and Development A Window into the Issues Richard Newfarmer Editor THE WORLD BANK Trade Department Poverty Reduction and Economic Management Vice-Presidency Washington D.C.

00Trade, Doha, and DevelopmentA Window into the Issues
Richard NewfarmerEditor
THE WORLD BANKTrade Department
Poverty Reduction and Economic Management Vice-PresidencyWashington D.C.

ii
TRADE, DOHA, AND DEVELOPMENT: A WINDOW INTO THE ISSUES
Copyright © 2006The International Bank for Reconstruction and Development / The World Bank1818 H Street, N.W.Washington, D.C. 20433, U.S.A.All rights reservedManufactured in the United States of AmericaFirst Printing: November 2005
1 2 3 4 5 07 06 05
The findings, interpretations, and conclusions expressed herein are those of the author(s)and do not necessarily reflect the views of the International Bank for Reconstruction andDevelopment/The World Bank and its affiliated organizations, or those of the ExecutiveDirectors of The World Bank or the governments they represent.
The World Bank does not guarantee the accuracy of the data included in this work. Theboundaries, colors, denominations, and other information shown on any map in this workdo not imply any judgment on the part of The World Bank of the legal status of anyterritory or the endorsement or acceptance of such boundaries.
The material in this publication is copyrighted. Copying and/or transmitting portions or allof this work without permission may be a violation of applicable law. The InternationalBank for Reconstruction and Development/The World Bank encourages dissemination ofits work and will normally grant permission promptly to reproduce portions of the work.
For permission to photocopy or reprint any part of this work, please send a request withcomplete information to the Copyright Clearance Center, Inc., 222 Rosewood Drive,Danvers, MA 01923, USA, Tel: 978-750-8400, Fax: 978-750-4470, www.copyright.com.All other queries on rights and licenses, including subsidiary rights, should be addressed tothe Office of the Publisher, The World Bank, 1818 H Street NW, Washington, DC 20433,USA, Fax: 202-522-2422, email: [email protected].
ISBN-10: 0-8213-6437-5 ISBN-13: 978-0-8213-6437-6eISBN: 0-8213-6438-3 DOI: 10.1596/978-0-8213-6437-6
Cover photo by Chris Stowers.
Library of Congress Cataloging-in-Publication Data has been requested.

iii
Foreword ............................................................................................................. vii Uri Dadush
Acknowledgments ............................................................................................... ix
Acronyms and Abbreviations ............................................................................... xi
Setting the Stage1. Through the Window: Beacons for a Pro-Poor World Trading System .......... 15 Richard Newfarmer
2. The Multilateral Trading System: Mid-Flight Turbulence or Systems Failure? ... 27 Elwyn Grainger Jones and Carlos A. Primo Braga
3. Doha Policies: Where are the Pay-offs? .......................................................... 43 Kym Anderson, Will Martin and Dominique van der Mensbrugghe
4. Estimating the Benefits: Why Numbers Change ............................................. 59 Dominique van der Mensbrugghe
Agriculture:The Heart of the Doha Round5. Agriculture: The Key to Success of the Doha Round ..................................... 77 Kym Anderson and Will Martin
6. Market Access Barriers in Agriculture and Options for Reform ...................... 85Kym Anderson, Harry de Gorter and Will Martin
7. Domestic Support in Agriculture: The Struggle for Meaningful Disciplines ... 97Harry de Gorter and J. Daniel Cook
8. Export Subsidies: Agricultural Policy Reform and Developing Countries ..... 109Harry de Gorter
9. Cotton and Developing Countries: Implications for Development ................ 119 John Baffes
10. Sugar Policies: Opportunity for Change ...................................................... 129 Donald Mitchell
Manufacturing and Services Trade: Opening Markets for the Future11. Market Access for Nonagricultural Products: In Search of a Formula ......... 139 Will Martin and Maros Ivanic
Table of Contents

iv
TRADE, DOHA, AND DEVELOPMENT: A WINDOW INTO THE ISSUES
12. Life after Quotas? Early Signs of the New Era in Trade of Textiles and Clothing ............................................................................................... 151 Paul Brenton and Mombert Hoppe
13. Services in a Development Round: Proposals for Overcoming Inertia ........ 161 Aaditya Mattoo
Trade Facilitation, Trips and the Regulatory Agenda14. Trade Facilitation: Progress and Prospects for the Doha Negotiations ....... 175
Gerard McLinden
15. Intellectual Property and Public Health: The WTO’s August 2003Decision in Perspective ............................................................................. 187
Carsten Fink16. The Debate on Geographical Indications in the WTO ................................ 197 Carsten Fink and Keith Maskus
Dealing with Special Development Concerns17. More Favorable Treatment of Developing Countries: Ways Forward ............ 209 Bernard Hoekman
18. The Value of Trade Preferences for Africa ................................................... 219 Paul Brenton and Takako Ikezuki
19. WTO Accession: Moving the Goal Posts? ................................................. 227 Simon Evenett and Carlos A. Primo Braga
Regional Trade Agreements: The Second Front of Negotiations20. Regional Trade Agreements: Designs for Development .............................. 243 Richard Newfarmer
21. NAFTA at 10 Years: Lessons for Development ........................................... 255 Daniel Lederman, William Maloney and Luis Servin
22. Beyond Cotonou: Economic Partnership Agreements in Africa .................. 263 Larry Hinkle, Mombert Hoppe and Richard Newfarmer
23. Enhancing Trade Preferences for LDCs: Reducing the Restrictiveness ofRules of Origin ........................................................................................... 277
Paul Brenton
24. Tightening TRIPS: Intellectual Property Provisions of U.S. Free Trade Agreements ...................................................................................... 285 Carsten Fink and Patrick Reichenmiller
25. Compensating Lost Revenue in Regional Trade Agreements ..................... 301 Peter Walkenhorst

v
26. Regionalism vs. Multilateralism. ................................................................. 309 Dominique van der Mensbrugghe, Richard Newfarmer and Martha Denisse Pierola
Aid for Trade: Working on the Supply Side and Managing Adjustment27. Aid for Trade ............................................................................................... 319 Julia Nielson
28. Preference Erosion: The Terms of the Debate .............................................. 329 Bernard Hoekman, Will Martin and Carlos A. Primo Braga
29. From Marrakesh to Doha: Effects of Removing Food Subsidies on the Poor ...................................................................................................... 341 Donald Mitchell and Mombert Hoppe
30. Sanitary and Phytosanitary Regulation: Overcoming Constraints .............. 353 Steve Jaffee
31. The World Bank in Trade: The New Trade Agenda ..................................... 371 Richard Newfarmer and Dorota A. Nowak


As 2005 comes to an end, debate over the Doha Development Agenda isbecoming heated. The international community faces a relatively simplechoice in Hong Kong in December: will nations overcome powerful, if
narrow, interest groups at home to promote more rapid economic growth in thefuture, or will they be unable to reach a meaningful agreement, leading to an uncer-tain future for the Doha Round and the world trading system?
The choice nations collectively make at the upcoming ministerial meeting ofthe World Trade Organization (WTO) is important to development. For decades theglobal trading system has been stacked against growth in developing countries.The products that the poor produce—mainly agricultural products and labor-inten-sive manufactures—face disproportionately high barriers to trade. And their chiefasset, their own labor, faces greater restrictions to global mobility than any otherasset. This situation has arisen because previous rounds of multilateral trade nego-tiations reduced protection on manufacturing products, the primary interest of theearly members of the negotiating club representing the dominant countries. Nowthe membership of the WTO has grown to include most developing countries. It isfor this reason that the Doha Round is important: It has given all countries of theworld the opportunity to work collectively on barriers of interest to developingcountries and to the world’s poor.
Although the choice is simple, it is not easy. The underlying details of theissues are notoriously complex. Observers have a difficult time penetrating the veilof legal and economic opacity that envelops the negotiations. The details are suf-ficiently technical and multifarious that experts in one area are often unaware oftechnical details in another.
And details make the difference between opening markets and merely appear-ing to do so through a vacuous agreement that looks good on the surface but doeslittle or nothing to widen opportunities for poor traders in the global market place.This book provides succinct analyses of the most critical issues facing negotiators,highlighting the choices that most affect development. It is a window into theissues.
The WTO negotiations are not the only ones shaping the world trading sys-tem. Regional trade agreements in growing numbers are introducing preferentialtrade arrangements between subsets of the international community. Some extendtrade and support development through “open regionalism.” But others distort
Foreword
vii

viii
TRADE, DOHA, AND DEVELOPMENT: A WINDOW INTO THE ISSUES
trade, retard development, and undermine the multilateral system with a web ofdiscrimination. For that reason, we have included a section on these arrangements.
A third subject of international policy discussions—”aid for trade”—affectsdeveloping countries’ opportunities to participate in the global market. Withoutsuch aid, many countries will not have the infrastructures and institutions necessaryto take advantage of new market opportunities, whether from Doha or regionalarrangements. The debate over aid for trade poses hard questions: How much aid iswarranted in view of competing needs, say in health or education? And how cannew aid be channeled to be most effective?
Gathered here are trade notes written by World Bank staff and distinguishedacademics for a series inaugurated in 2003, as well as new essays prepared especiallyfor this volume. All of the material pertains directly to the issues at stake in theWTO ministerial meetings in Hong Kong in December. We hope that it will contributeto a better world trading system, one that is more equitable and more supportive ofdevelopment.
Uri B. DadushDirector, Trade Department
World Bank

ix
This book was prepared by staff in the World Bank’s Trade Department,including experts from the Poverty Reduction and Economic ManagementTrade Unit, the Development Economics Department (Trade Research team
and Prospects Group), and the World Bank Institute as well as the Latin Americaand Africa regions. We also benefited from the contributions of leading academicsfrom around the world. All of the contributors gave generously of their time toprepare these papers, often deferring other urgent work to produce a much neededchapter. This compilation would not have been possible without their willingnessto share their considerable expertise and their devotion to the ideas of this book.
Dorota Nowak managed the project with deftness and dedication fromconception to publication. Her farsighted planning, systematic attention to detail,and unflappable tenacity made the book a reality. Carlos A. Primo Braga, William J.Martin, and Bernard Hoekman provided unfailingly generous comments,suggestions, and help. John Panzer, manager of the PREM Trade Unit, providedconstant encouragement and willingly pitched in whenever necessary. The bookwas produced under the general direction of Uri Dadush, director of the TradeDepartment, and under the guidance of Danny Leipziger, vice-president of thePoverty Reduction and Economic Management Network.
And finally, I would like to thank the production team who worked underDorota Nowak’s direction—Maria Amparo Gamboa who typeset the book and wastruly a mainstay of this project through too many weekends; Michael Paul forproofreading and assisting in other matters; Awatif Abuzeid for assistance with thefront matter; Mombert Hoppe, Martha Denisse Pierola, and Katherine Rollins fortheir work on the figures and tables; Araceli J. Jimeno who assisted with revisions;and Abdennour Azeddine for his invaluable technical support. Steven Kennedy,with his careful editorial pen, managed to improve even the most turgid of ourprose. Stuart Tucker of the World Bank’s Office of the Publisher coordinated theprinting process.
Richard NewfarmerTrade DepartmentWorld Bank
Acknowledgments


ACP Africa, Caribbean and Pacific Group of StatesAD/CVD Antidumping/Countervailing DutyAGOA African Growth Opportunity ActAMS Aggregate Measure of SupportAPEC Asia-Pacific Economic CooperationARV AntiretroviralASEAN Association of Southeast Asian NationsATC Agreement on Textiles and ClothingCAFTA Central American Free Trade AgreementCARICOM Caribbean CommunityCEPII Centre d’Etudes Prospectives et d’Informations
InternationalesCETs Common External TariffsCFF Compensatory Financing FacilityCGE Computable General EquilibriumCOMESA Common Market of Eastern and Southern AfricaCOMTRADE U.S. Commodity Trade StatisticsDAC Development Assistance CommitteeDDA Doha Development AgendaDSB Dispute Settlement BodyDTIS Diagnostic Trade Integration StudyEBA Everything But ArmsEBRD European Bank for Reconstruction and DevelopmentEC European CommunitiesECCAS Economic Community of Central African StatesEDF European Development FundEPAs Economic Partnership ArrangementsEPZs Export Processing ZonesEU European UnionFAO Food and Agriculture OrganizationFAPRI Food Agricultural Policy Research InstituteFDA Food and Drug AdministrationFDI Foreign Direct InvestmentFTAs Federal Trade AgreementsGATS General Agreement on Trade in Services
Acronyms and Abbreviations
xi

xii
TRADE, DOHA, AND DEVELOPMENT: A WINDOW INTO THE ISSUES
GATT General Agreement on Tariffs and TradeGDP Gross Domestic ProductGI Geographical IndicationsGSP Generalized System of PreferencesGTAP Global Trade Analysis ProjectHACCP Hazard Analysis and Critical Control PointHIV/AIDS Human immunodeficiency virus/acquired immune deficiency
syndromeICAC International Cotton Advisory CommitteeIDB Inter-American Development BankIF Integrated FrameworkIMF International Monetary FundIPR Intellectual Property RightsITO International Trade OrganizationLDCs Least Developed CountriesMFN Most Favored NationMPS Market Price SupportNAFTA North America Free Trade AgreementNAMA Non-agricultural Market AccessNFIDCs Net-Food-Importing Developing CountriesOECD Overseas Economic Cooperation DevelopmentOIE Office International des EpizootiesOTDS Overall Trade-Distorting SupportPROCAMPO Programa para el CampoPRS Poverty Reduction StrategyPSE Producer Support EstimateR&D Research and DevelopmentRII Review of International InvestorsRLCA Revenue Loss Compensation ArrangementRTAs Regional Trade AgreementsSACU Southern African Customs UnionSAM Social Accounting MatrixSCM Subsidies and Countervailing MeasuresSDT Special and Differential TreatmentSPS Sanitary and PhytosanitarySTEs State Trading EnterprisesTFNG Trade Facilitation Negotiating GroupTIM Trade Integrated MechanismTRAINS Trade Analysis Information SystemTRIPS Trade-Related Intellectual Property RightsTRQ Tariff Rate Quota

xiii
UEMOA Union Economique et Monétaire Ouest AfricaineUNCTAD United Nations Commission for Trade and DevelopmentUR Uruguay Round negotiationsURAA Uruguay Round Agreement on AgricultureUSTR United States Trade RepresentativeVAT Value-Added TaxWAEMU West African Economic and Monetary UnionWCO World Customs OrganizationWITS World Integrated Trade SolutionsWTO World Trade Organization


THROUGH THE WINDOW
15
Through the Window: Beacons for a Pro-PoorWorld Trading System
Richard Newfarmer
1
While enormously beneficial for most people in developing countries,globalization has bypassed many of the poorest countries and poorestpeople.1 Domestic policies and obstacles matter, but inequities in the
world trading system also put developing countries at a disadvantage. Three forceshave the potential to open global markets to more people: the current round ofmultilateral trade negotiations, regional trade negotiations, and the prospect of new“aid for trade” to help the poorest countries invest in infrastructure and institutionsnecessary to participate more effectively in the global marketplace.
The Doha Round hangs precariously in the balance. Even if there is anagreement in Hong Kong (China), a pro-poor outcome is not automatic. Resultsdepend critically on the details of any trade agreement. This book peers throughthe mass of complexity—in agriculture, nonagricultural market access, services,and trade facilitation—to see what really matters for poor people.
Even as multilateral negotiations continue, many developing countries areengaged on a second front of negotiations, regional trade agreements. Some 75countries are negotiating so-called Economic Partnership Agreements (plurilateralfree trade agreements) with the European Union. The United States, having justcompleted a free trade agreement with Central America and the Dominican Republicas its seventh FTA, has a half-dozen new agreements in train. Many developingcountries are following a similar path; consider Chile’s recent free trade agreementwith China.
Regional trade agreements can widen markets, deepen integration, and promoteeconomies of scale in regulation and investment. However, they also are inherentlydiscriminatory. Often the weakest countries are excluded; in effect, they pay for thepreferences received by others. So how can these new arrangements minimize thedisadvantages of preferential agreements and maximize advantages? A section ofthis book sets out guideposts for evaluating the development effects of upcomingregional negotiations.
Even with greater access to markets, many of the poorest countries may beunable to seize the opportunities that come with more open markets, either becauseof inadequate infrastructure, poorly performing trade-related institutions (such ascustoms), or domestic policies that create disincentives or impediments to trade.Still other developing countries may need additional help in adjusting domestic,regional, or global policy reforms to take advantage of new trade opportunities. Forthese reasons, the G-8 summit in Gleneagles in July 2005 supported calls for

TRADE, DOHA, AND DEVELOPMENT: A WINDOW INTO THE ISSUES
16
additional “aid for trade.” A final section of this book discusses aid for trade relatedto standards, trade facilitation, and managing any adjustment costs from the erosionof preferences or from higher food prices that developing countries may experienceas a consequence of a trade deal.
This introduction, drawing on the chapters of this volume, highlights the keydecisions that will mean the difference between the success and failure of currentefforts to open markets for products of the poor. In that sense, it provides “policybeacons” to assess outcomes in the three broad areas: multilateral negotiations,regional negotiations, and aid for trade.
Realizing the development promise of the Doha AgendaA Doha Round agreement that slashed trade barriers would stimulate trade andraise incomes around the world, leading to a substantial reduction in global poverty.Although any agreement is not likely to be ambitious enough to generate the$290–460 billion in annual income that full liberalization might bring to the globaleconomy, it could realize part of this potential and lift incomes of poorcountries—and poor people—over the long term. The opening chapters byAnderson, Martin, and van der Mensbrugghe use quantitative methods2 to assesswhere the main pay-offs are to be found in merchandise trade liberalization, with theconclusion that agriculture is the key to the Doha Round.
Agriculture is the locomotive of the development roundAgriculture is central to the development promise of this trade round. First, some 70percent of the world’s poor live in rural areas. Second, most of the world’s tradeprotection is applied to agricultural products. Agriculture alone would produceroughly two-thirds of the gains that could be anticipated from full liberalization ofmerchandise trade. Progress can be made in increasing access to markets, reducingtrade-distorting domestic support, and export subsidies.
Market accessProtection facing developing-country exporters in agriculture is four to seven timeshigher than in manufactures in the Organisation for Economic Co-operation (OECD)countries, and two to three times higher in developing countries. Tariff peaks againstproducts from poor countries are particularly high in rich countries. Tariff escalationthat discourages development of further processing is more pronounced inagriculture than in manufactures in both rich and poor countries. And hefty specificduties are common in rich countries. Because they automatically increase protectionwhen commodity prices fall, specific duties throw the burden of adjustment ontoglobal prices and poor countries. Forty-six percent of agricultural tariff lines inEurope contain such duties.

THROUGH THE WINDOW
17
Tariff- and budget-based support to agriculture in OECD countries amountedto $350 billion in 2004—of which some $280 billion went directly to producers(roughly one-third from the budget and two-thirds from border measures).3 Nontariffmeasures—including antidumping and other forms of contingent protection, sanitarystandards, and technical barriers to trade—augment formal barriers. In fact, suchmeasures may restrict trade more than border barriers (World Bank 2005). Thecombined effect of all of these forms of support is to stimulate overproduction inhigh-cost rich countries and shut out potentially more competitive products frompoor countries. As Mitchell’s chapter shows, the European Union went from beinga net importer of sugar in the early 1980s to being a net exporter today.
The chapters by Anderson, Martin, and van der Mensbrugghe and by de Gorterset out important benchmarks of success in overcoming the problems posed byrestrictive trade policies in agriculture. Increasing market access is by far the mostimportant element of success. Their chief findings are as follows:• Tariff cuts must be deep to have effect. This is true because WTO-agreed ceilings
(bound tariffs) are well above today’s applied rates, so negotiators will have toagree on cuts of 70 percent or more to ensure that applied rates decline (or at leastdo not rise).
• Exclusions for sensitive products have to be extremely limited. Exempting even 2percent of tariff lines is enough to render virtually meaningless any deal that islikely to emerge from Doha. Why? Because most countries rely on tariff peaks injust a few product lines, but those lines account for a significant share of trade.
• Capping all tariffs at 100 percent would help. In many countries, very hightariffs, often in combination with tariff rate quotas, keep out products. Establishingbinding caps can prevent or limit this effect. Steps should be taken to limit theapplication of specific duties, reduce tariff escalation, and curb nontariff barriers.
• All countries have to contribute. While agricultural protection is highest in richcountries, many developing countries also have high protection.4 It is in theinterest of all countries—and of great interest to the world’s poor—to reduceprotection everywhere.
Domestic supportDomestic support, while less damaging to developing countries than border barriers,greatly distorts trade in particular commodities and for particular countries.
Sugar is illustrative. In the European Union, Japan, and the United States acombination of quotas, tariffs, and subsidies allows domestic sugar producers toreceive more than double the world market price. OECD governments support sugarproducers at the rate of $6.4 billion annually—an amount nearly equal to all developing-country exports of sugar.5 Prices are so high that it has become economic to growsugar beets in cold climates and to convert corn to high-fructose corn syrup. Sugarimports in the OECD have shrunk to next to nothing.

TRADE, DOHA, AND DEVELOPMENT: A WINDOW INTO THE ISSUES
18
Similarly, U.S. subsidies to cotton growers totaled $3.1 billion in 2003, about 1.5times higher than U.S. foreign aid to Africa (see chapter by Baffes). These subsidiesdepress world cotton prices by 10–20 percent, reducing the income of thousands ofpoor farmers in West Africa, Central and South Asia, and other poor countries. InWest Africa alone, where cotton is a critical cash crop for many small-scale andnear-subsistence farmers, annual income losses for cotton growers surpass $150million annually.
More than 70 percent of subsidies in rich countries are directed to large (oftencorporate) farmers. These farmers have incomes that are higher—often substan-tially so—than average incomes in Europe, Japan, and, to a lesser extent, the UnitedStates. Subsidies make the rich richer and the poor poorer. What should be doneabout domestic support in agriculture?• Deep cuts in bound levels of support are required to discipline actual levels.
As with tariffs, the bindings in the Uruguay Round were exceedingly generous,and applied levels of support have usually fluctuated well below the ceilings.Therefore, cuts in excess of 70 percent are required to have positive effects—andto protect against the temptation to raise applied levels of support. At the sametime, loopholes that allow relaxation of disciplines on trade-distorting subsidieshave to be closed.
Export subsidiesAlthough export subsidies distort world trade less than border barriers and domesticsupport, they are not trivial. Of the $280 billion in support to farmers, some $10–12billion takes the form of export subsidies. The WTO’s July 2004 Framework onagriculture contained a commitment to phase them out upon successful conclusionof the round. At issue is the timetable.• Phasing out of export subsidies by 2010, mentioned by some G-8 leaders at
the Gleneagles summit in July 2005, would promote development.
Nonfarm trade is important to growth in poor countriesHaving grown at nearly twice the rate of agricultural exports, exports of manufacturesnow constitute nearly 80 percent of all developing-country exports. Tariffs onmanufacturing in high-income countries are on average lower than in developingcountries. But the tariffs that rich countries charge developing countries are abouttwice those they charge other industrial countries, in the aggregate. Exporters ofmanufactures from industrial countries face, on average, a tariff of 1 percent on theirsales to other industrial countries; exporters in developing countries, by contrast,pay anywhere from 1.2 percent (if they are from Latin America, where NAFTAweighs heavily) to 5.4 percent (if they are from South Asia). However, the problemis not solely a North–South issue. Latin American exporters of manufactures, for

THROUGH THE WINDOW
19
example, face tariffs in South Asia that are thirteen times higher than in industrialcountries. Similarly, Sub-Saharan African exporters face tariffs in South Asia thatare nearly six times higher than the tariffs they face when exporting to industrialcountries. Tariffs that East Asian exporters pay to Latin America are three timeshigher than those they face in high income countries.
Protection takes forms other than tariffs—among them quotas, specific duties,and contingent protection measures such as antidumping duties. As with tariffs,both rich and poor countries tend to use these measures more frequently againstlabor-intensive products from developing countries, particularly textiles and clothing.Average antidumping duties are seven to ten times higher than tariffs in industrialcountries, and around five times higher in developing countries (World Bank 2005).
Textiles and clothing are particularly important for developing countries. Thegood news is that the quotas under the Agreement on Textiles and Clothing (ATC)ended on January 1, 2005; the bad news is that behind those quotas remains a wallof high tariffs. As Brenton and Hoppe point out in their chapter, the feared takeoverby China of textile and clothing exports with expiration of the ATC quotas has beenoverblown. With increasing trade volumes in general, many developing countries,including least developed countries (LDCs) such as Bangladesh, have expandedtheir market share in the European Union and United States in the half-year sincethe end of quotas. At the same time, exports especially of some relatively high-wageexporting regions, such as Hong Kong (China), Taiwan (China), and Republic ofKorea have declined. Some adjustment is sure to be required, and the internationalcommunity should be ready to help those countries that experiencedifficulties—a challenge taken up in the aid-for-trade discussions.
Martin and Ivanic point to guideposts for reform of nonfarm trade:• The tariff ceilings chosen and the formula for cutting the highest tariffs will
determine how much new access to markets Doha will provide. As withagriculture, exempting a large number of tariff lines from cuts could easilyeviscerate the gains from any cutting formula adopted.
Services liberalization could raise productivityServices are the fastest-growing component of the global economy. Even indeveloping countries, services exports grew more rapidly than manufactures in the1990s (World Bank 2001: chapter 3). More efficient backbone services—in finance,telecommunication, domestic transportation, retail and wholesale distribution, andprofessional and business services—improve the performance of the wholeeconomy through broad linkage effects. Estimates suggest that, after controllingfor other determinants of growth, countries that fully liberalized trade and investmentin finance and telecommunications grew on average 1.5 percentage points fasterthan other countries over the past decade (Mattoo and others 2001).

TRADE, DOHA, AND DEVELOPMENT: A WINDOW INTO THE ISSUES
20
So far, however, the Doha Round has fallen far short of its potential to unlockaccess to foreign markets for services exports. While many countries have madeambitious requests, the responding offers are said to be disappointing. This isdespite the fact that many developing and industrial countries have an interestboth in liberalizing their own services markets and obtaining improved access tothe markets of their trading partners.
Mattoo, in reviewing the lack of progress to date, suggests a set of negotiatinggoals with which both the business and the development community could identify:locking in the current openness of cross-border trade for a wide range of services;eliminating barriers to foreign investment, either immediately or in a phased mannerif regulatory inadequacies need to be remedied; and allowing greater freedom ofinternational movement at least for intra-corporate transferees and for serviceproviders engaged to fulfill specific services contracts.
Three types of actions might pave the way to these goals.• First, self-selected groups of WTO members could articulate their broad
liberalization goals in model commitments and regulatory principles forspecific modes or sectors—along the lines of the Understanding on FinancialServices and the Telecommunications Reference Paper. Once a critical mass ofmembers sign up, they could extend the benefits to all WTO members on amost-favored-nation (MFN) basis; others could join later when they felt it intheir interest to do so. An individual member’s incentive to participate in aparticular sector or mode would, of course, depend on the willingness of itstrading partners to make commitments in modes and sectors (within and outsideservices) in which the member had an export interest.
• Second, the international community should establish a mechanism to providepolicy advice and regulatory assistance for developing countries at theirrequest, helping them to identify services that they can comfortably liberalizewithout fear of dislocation or macroeconomic turbulence and others that mayrequire improvements in regulation and supervision prior to liberalization.
• Third, to spur progress on labor mobility, governments in countries thatsupply labor could assume responsibility for screening and selecting workers,facilitating and verifying their return, and for combating illegal migration.Immigration authorities in member countries would be requested to define a setof obligations that source countries would have to fulfill to be eligible for anallocation of temporary-presence visas; these could be limited, at least at theoutset of the program, to just a few categories of individuals, such as intra-corporate transferees and service providers engaged to fulfill specific servicescontracts.The larger services framework advanced by Mattoo would allow members, on
the basis of greater confidence in their regulatory frameworks and the scope for

THROUGH THE WINDOW
21
regulatory cooperation, to respond more meaningfully to the requests forliberalization made by their fellow WTO members.
Regional trade agreements and unilateral preferential regimesRegional trading agreements constitute a second front of trade negotiations formany developing countries. With the expiration of the European Union’s CotonouAgreement with the African, Caribbean, and Pacific countries (ACP), some 75developing countries are undertaking complex negotiations with the European Unionto establish new Economic Partnership Agreements. The United States, meanwhilehas opened discussions of free trade with the Andean countries, the SouthernAfrican Customs Union, and others. Developing countries, too, are engaged in aquickening pace of negotiations: China with the ASEAN countries, India, and Brazil;and Chile with Republic of Korea, to name a few examples. All in all, regional tradeagreements (RTAs) are proliferating rapidly, now covering more than 40 percent ofworld trade.
As many as half of all RTAs are counterproductive: they divert trade and endup depriving countries of income. RTAs are most likely to increase national incomesover time if they pursue a strategy of “open regionalism” (World Bank 2004). Forthat reason, regional negotiators should follow a few basic rules.• Negotiators in North–South plurilateral arrangements should work with
partners to ensure that intraregional obstacles to trade are phased out andthat a competitive external MFN regime is in place before trade preferencesfor the northern trade partners are introduced, a suggestion elaborated in thechapter by Hinkle, Hoppe, and Newfarmer.
• Liberal rules of origin can make the difference between genuine marketopenings and illusory ones. The Blair Commission recommended a 10 percentvalue-added rule or a change in tariff heading for transformed goods. Ruleswould be less burdensome if they were uniform across agreements (seeBrenton’s chapter).
• Rules and regulations governing investment and intellectual property rightsmust be appropriate to the development context in which they arepromulgated, as Fink and Hoekman argue in their respective chapters.
• Openings in services should be introduced with adequate regulation, permitentry on an MFN basis and, where possible, encourage competition.Even RTAs based on open regionalism grant preferences to some while
discriminating against others. The best way to minimize those effects is to bringdown the high tariffs that create the discriminatory benefits offered to preferredcountries. That can be done only through multilateral agreement.
Unilateral and voluntary preferential regimes—such as the U.S. African Growthand Opportunity Act and the European Union’s Everything ButArms program—are a prominent feature of some countries’ trade regimes. Each has

TRADE, DOHA, AND DEVELOPMENT: A WINDOW INTO THE ISSUES
22
different rules and exemptions that have the effect of limiting market access. AsBrenton shows in his chapter, the actual value of trade preferences is remarkablylow for all but a few developing countries. One reason is that rich countries grantpreferences voluntarily rather than as part of a binding multilateral negotiation;those preferences often come laden with restrictions, product exclusions, andadministrative rules that prevent beneficiaries from taking full advantage of them.For example, only 39 percent of potentially preferred imports into the Quadcountries—Canada, the European Union, Japan, and the United States—under theGeneralized System of Preferences (GSP) actually took advantage of preferentialaccess, and usage rates are declining.
To make preferences more effective, especially for LDCs:• Programs in the Quad countries should be expanded to cover all exports of
LDCs, with an indefinite time period.• Restrictive rules of origin that raise the cost of taking advantage of preferences
should be replaced with a simple rule that facilitates access and use of globallysourced competitive inputs. A nonrestrictive rule of origin, as with RTAsgenerally, would require no more than 10 percent value added or a change oftariff heading (see Brenton’s chapter).
Aid for tradeMarket access is not the whole development story. Even if developing countriessucceed in obtaining access to new markets, they will have to adopt complementarypolicies—removing obstacles to private investment, improving public investmentin infrastructure, and providing education—to ensure that domestic firms respondto the new opportunities and that benefits are transmitted to the poor. Said differently,liberal trade policies must be embedded in a coherent development strategy—theyare not a substitute for it. Aid for trade, as Nielson shows in her chapter, can play animportant role in helping countries design complementary trade policies.
The cost of moving goods across international borders is often as important asformal trade barriers in determining the landed cost of goods—and ultimately marketshare. Every day spent in transit because of poor roads or delays in customs addsnearly one percent to the cost of goods on average (Hummels 2001). In developingcountries, moreover, transit costs are routinely two to four times higher than in richcountries.
Additional aid for trade through investments in roads, ports, logistics, andthrough policy advice on reforms of trade-related institutions such as customs canplay an important role. Eliminating delays in developing countries would lowertrading costs very significantly, particularly if accompanied by liberalization oftransport and telecommunications and streamlined regulations to promote domesticcompetition. As Jaffee’s chapter makes clear, adapting to standards set in the high-income countries can be costly and prevent access to markets, although the effort

THROUGH THE WINDOW
23
to adapt usually brings rewards. Multilateral efforts are under way outside theWTO to promote—and in some cases finance—institutional changes to facilitatetrade and meet rising food-safety standards. Key players include the bilateral donors,the World Customs Organization, the regional development banks, and the WorldBank. Newfarmer and Nowak in their chapter describe how the World Bank isincreasing its aid-for-trade efforts and how those efforts have moved away from thepolicy conditionality of the 1980s. Even with these increased efforts, however,resources are likely to fall short of demand.• Greater development assistance for much-needed trade infrastructure, help
with standards and compliance, and support for policy reforms could helpovercome impediments to exports. Abundant examples come from the 20 or sotrade diagnostic studies undertaken as part of the Integrated Framework, asdescribed in the chapter by Newfarmer and Nowak.The inclusion of trade facilitation in the WTO General Council’s decisions of
July 2004 is appearing increasingly felicitous. Many countries now share the viewthat reforms to lower the costs of trading make good development sense. McLinden’schapter reviews progress to date in negotiations on trade facilitation, noting thatdiscussions on binding disciplines have taken a back seat to the dissemination ofbest practice in institutional reforms. McLinden offers recommendations on how tomake the most of the opportunity presented by the launch of negotiations:• High-income countries should make disciplines flexible enough to
accommodate countries that have low capacity to implement accords, anddeveloping countries should view the WTO negotiations as an opportunity toadvance their domestic reform agenda and accelerate the implementation ofbest practices. On the basis of close consultations between negotiators inGeneva and specialists at home, governments should secure agreement onpractical measures that will enable their traders to compete better in regionaland international markets.Aid for trade can also help in managing adjustment to a new world of incentives.
A Doha Round agreement may precipitate a terms-of-trade loss for a few developingcountries, as Hoekman, Martin, and A. Primo Braga show in their chapter. Likewise,Mitchell and Hoppe show that if Doha succeeds in reducing rich-country subsidiesto food production, a few countries may experience terms-of-trade losses. Suchlosses are likely to be limited for several reasons. The value of preferences for mostcountries is actually quite small (see Brenton), and these are eroding under pressurefrom regional trade agreements and domestic adjustment in the US and EU. Similarly,only a few food importers are likely to suffer income losses from terms of trade.First, any upward price movement is estimated to be less than half the averageadjustments these economies experience annually as a result of normal cyclicalfluctuations in prices (see the Mitchell and Hoppe chapter). Second, many foodimporters also export other agricultural products that will benefit from liberalization;

TRADE, DOHA, AND DEVELOPMENT: A WINDOW INTO THE ISSUES
24
moreover, some food importers will gain access to new markets in nonagriculturalproducts and be able to export. Third, countries that now impose tariffs on foodimports can lower those tariffs to offset any increase in global prices on poordomestic consumers. Fourth, since prices will change relatively slowly, some foodimporters will increase domestic production in response to higher prices andbecome self-sufficient or even net exporters. All these caveats notwithstanding,some countries nonetheless may require help and need additional resources, andthat should be forthcoming.• Donor countries and development institutions should make additional
resources available to support internal and external adjustment in countriesthat clearly stand to suffer from a Doha agreement. To be effective, thesehave to be supportive of a coherent program of domestic reform to promotegrowth rather simply dedicated to maintaining unsustainable consumptionwithout resource reallocation.
The world’s trading system at the crossroads?A. Primo Braga and Grainger-Jones in their chapter consider differing views on theevolution of the WTO negotiations, including the possibility that the world tradingsystem is entering a systemic crisis. Ultimately they discount that notion, in partbecause all countries have an interest in maintaining and strengthening the system.The expansion of global trade at nearly twice the rate of world GDP growth hasfueled an unprecedented prosperity, for which the multilateral system, by loweringtrade barriers and preventing endemic trade wars, can claim much of the credit. Atthe same time, Primo Braga and Grainger-Jones also caution against complacency.
Complacency and unwillingness to tackle domestic forces of protection couldwell spell the demise of the Doha Round. However, positive action is the antidote,and now would be a good time to act in all three of the policy arenas discussedhere: doing a pro-poor Doha deal, designing trade-creating regional agreements,and augmenting aid for trade. High-income countries could take the lead by, amongother things, moving forward with assertive new steps to open agricultural markets,offering less restrictive rules of origin in regional accords, and providing additionalaid for trade. Middle-income countries, with their now established interest in theglobal system, could contribute through assertive new proposals in manufacturesand services. Low-income countries, which have a new interest in and responsibilityfor the emerging global system, could contribute by accepting core disciplinesconsistent with their development interests, crafting proposals in regionalnegotiations that link domestic reforms to trade reforms, and working with donorsto use aid for trade effectively. In the event the Doha agenda were to founder, theregional trade agenda and aid for trade effort will assume an ever greater importancefor developing countries. Here too both rich and poor countries have a responsibility

THROUGH THE WINDOW
25
to design these agreements so they create trade and reinforce domestic reformsrather than preempt them. The challenges are daunting. But the rewards aresubstantial.
Notes1. The author is Economic Adviser, International Trade Department, World Bank. He gratefully
acknowledges comments from Carlos A. Primo Braga, Bernard Hoekman, Aaditya Mattoo, andJulia Nielson.
2. These models are necessarily limited because, as described in the chapter, they do not takeinto account services liberalization; they assume all preferences are utilized; they do not accountfor increasing returns to scale, and they cannot account for the effect that new marketopportunities have in spurring new products and diversification; all of these tend to underestimatethe effect of trade liberalization on income. On other hand, it is assumed that all countries willbe able to respond to shifts in relative prices and demand, an assumption that will not hold insome countries because of inadequate infrastructure and/or other supply side constraints.
3. The difference goes to spending on research and development, food programs for low-incomeconsumers, and other programs that indirectly benefit agriculture.
4. The WTO has a wide definition of “developing countries” that includes some members ofthe OECD, such as Republic of Korea.
5. This figure includes transfers from consumers associated with border barriers.
ReferencesFinger, Michael J., and Julio Nogues. 2006. Fighting Fire with Fire: Safeguards and Anti-
dumping in Latin American Trade Liberalization. New York: Palgrave Macmillan and theWorld Bank.
Hummels, David. 2001. “Time as a Trade Barrier”. Mimeo. Department of Economics, PurdueUniversity, Lafayette, Indiana.
Mattoo, A., R. Rathindran, and A. Subramanian. 2001. “Measuring Services Trade Liberalizationand its Impact on Economic Growth: An Illustration.” World Bank Policy Research PaperNo. 2655. World Bank, Washington, D.C.
World Bank. 2001. “Trade in Services: Using Openness to Grow.” In Global Economic Prospects2002: Making Trade Work for the World’s Poor. Washington, D.C.
______. 2004. Global Economic Prospects 2005: Trade, Regionalism and Development.Washington, D.C.
______. 2005. Global Monitoring Report. Washington, DC.
Further readingAnderson, K., and W. Martin, eds. 2006. Agricultural Trade Reform and the Doha Development
Agenda. New York: Palgrave Macmillan .Evenett, Simon, and Bernard Hoekman, eds. 2006. Economic Development and Multilateral
Trade Cooperation. New York: Palgrave Macmillan.Hertel, Thomas, and L. Alan Winters, eds. 2006. Poverty and the WTO: Impacts of the Doha
Development Agenda. New York: Palgrave Macmillan.


The Multilateral Trading System: Mid-FlightTurbulence or Systems Failure?
Carlos A. Primo Braga and Elwyn Grainger-Jones
2
The current round of multilateral trade negotiations, the first since the foundingof the World Trade Organization (WTO), was launched in November 2001 inDoha, Qatar. Organized around the so-called Doha Development Agenda
(DDA), it is intended to enhance the development relevance of the WTO.Expectations for its successful conclusion remain mixed. The failure of the WTOMinisterial in Cancun, Mexico, in September 2003 underscored the difficulties facedby negotiators. The August 1, 2004, WTO General Council decisions, by contrast,were hailed by many as an important achievement that helped put the DDA back ontrack after the “detour” in Cancun. The agreed negotiation frameworks—particularlyon agriculture—were an important step in the right direction. As the limited progressachieved since then suggests, however, negotiators still face major challenges inbringing this round to a successful conclusion.1
This cyclical pattern of good and bad news on the multilateral trade system (asexemplified by the “downs” in Seattle (1999) and Cancun (2003) and the “ups” inDoha (2001) and Geneva (2004)) has motivated an ongoing debate about its health.2
2005 will be a critical year for the DDA. Many expect the Hong Kong Ministerial(December 13–18, 2005) to be a harbinger of the fate of the “development” round.Moreover, the outcome of the Doha Development Agenda—a first for the WTO—is considered an important factor in shaping the future of the institution.
Are the WTO and the multilateral rules-based system facing a serious crisis, orare the problems experienced so far in the DDA the usual turbulence thatcharacterizes complex trade negotiations? More specifically, can the multilateraltrading system deliver a “development round”? In summarizing the debatesurrounding these questions, this note presents three stylized perspectives on thehealth of the multilateral trade system. The first sets out the business-as-usualview, according to which current difficulties are nothing new and, as in previousrounds, will be resolved when the time for a deal is right. The second focuses on thelack of progress in the negotiations and argues that current circumstances conspireagainst the capacity of the system to deliver an ambitious outcome. The thirdpaints a bleaker picture of “systemic crisis.”
The note starts with a brief historical review of the system. It goes then into ananalysis of the evolution of the DDA and the main obstacles to a successfulconclusion of the round. It concludes with an evaluation of the dangers of failure inthe negotiations. This discussion led us to conclude that claims of a systemic crisis
27

TRADE, DOHA, AND DEVELOPMENT: A WINDOW INTO THE ISSUES
28
may well be exaggerated, but that complacency about the health of the multilateraltrade system is not warranted.
A bit of historyThe modern multilateral trade system, with its emphasis on nondiscrimination, wasborn in 1948, when the General Agreement on Tariffs and Trade (GATT) enteredinto force. The GATT era witnessed eight rounds of multilateral trade negotiations.The last, the Uruguay Round (1986–94), culminated in the establishment of theWorld Trade Organization on January 1, 1995. The Uruguay Round led to the mostcomprehensive set of multilateral trade agreements to date. It not only extendedmultilateral rules to services and trade-related aspects of intellectual property rightsbut also brought agricultural trade back under GATT disciplines. Not surprisingly,there was unfinished business. Some 30 items in the Uruguay Round included a“built-in agenda” for further negotiations. There also was a large unfinished agendain agriculture, as evidenced by the desire of some WTO members (particularly theEuropean Communities, EC) to extend the scope of WTO disciplines to new themessuch as competition, investment, transparency in government procurement, andtrade facilitation, themes that became known as the Singapore issues. The unfin-ished agenda led to calls for a new round of negotiations in the late 1990s.3
The DDA was launched in Doha, Qatar, at the Fourth WTO Ministerial(November 2001) amid much optimism about the ability of the multilateral system totranscend national differences. The tragic events of September 11, 2001, weighingheavily on national capitals in the run-up to that meeting, encouraged major tradingnations to build bridges in multilateral forums. Optimism was fueled by a sense thatthe major players would not allow a repeat of the failed Seattle Ministerial. Manydeveloping countries, particularly Asian and African countries, agreed to launchnegotiations on the understanding that the new round would be a “development”round. The DDA would cover most of the core elements of the WTO—agriculture,services, and nonagricultural market access. The decision on the Singapore issueswas left to the Fifth WTO Ministerial (Cancun) with the proviso that it wouldrequire explicit consensus.
The early momentum was soon lost. The Doha mandate established a series ofinterim deadlines on a variety of subjects with a view to concluding the round bythe end of 2004. All major deadlines were missed and extended, fueling cynicismabout the ability of the WTO process to deliver negotiations within the originaltimetable. WTO members failed, for example, to meet the self-imposed deadline ofMarch 31, 2003, to agree on general terms for a deal on agriculture—an issue seenby most as the deal breaker for the round. Members also failed to meet a similardeadline for negotiations on manufacturing tariffs. Deadlines were extended twicein discussions on special and differential treatment (SDT), but members still failed

THE MULTILATERAL TRADING SYSTEM
29
to reach agreement before the Cancun Ministerial. The end-December 2002 deadlinefor a compulsory-licensing solution to problems faced by countries with nopharmaceutical manufacturing capacities was also missed, although a solution wassubsequently found prior to Cancun.
The Cancun WTO Ministerial meeting in September 2003 was mandated fromDoha as a “mid-term review” to provide guidance on moving negotiations forwardand to make decisions in several areas—most importantly how to proceed withrespect to the Singapore issues. Missed deadlines meant that what was envisagedas a mid-term review was bound to become a forum for divisive confrontations.Ministers failed to agree on the text prepared in advance of the meeting, thusrelegating negotiations to further months of drift.
There were three key trigger points that, at least on the surface, precipitatedthe collapse of negotiations at Cancun: agriculture, cotton, and the Singaporeissues.• On agriculture, developing countries—in particular, the coalition known as the
G-20—refused to accept the limited ambitions on subsidy cuts, market access,and elimination of export subsidies by northern countries.4
• Cotton was chosen by nongovernmental organizations as the poster child ofthe unfairness of the multilateral trade system, with subsidies in industrializedcountries tilting the playing field against developing countries. In mid-2003,Benin, Burkina Faso, Chad, and Mali proposed the elimination of cottonsubsidies worldwide and the establishment of a compensation fund to reimbursethe least developed countries (LDCs) for revenues lost because of subsidies inindustrialized countries. There was no agreement in Cancun on this request.
• On the Singapore issues, the European Union offered to unbundle the fourissues at the eleventh hour and to begin negotiating on one or two (startingwith trade facilitation). However, the countries that objected to negotiationson these topics saw too few concessions on agriculture to agree to proceed,with most advocating that all four subjects should be dropped entirely orrelegated for further clarification by WTO working groups.Cancun was followed by a period of mutual recrimination in which the reasons
for the failure of the meeting were extensively analyzed.5 By March 2004, however,negotiations restarted in earnest. There was broad recognition that the politicalcalendar in some of the main trading nations was not particularly conducive to boldcommitments in the near future. At the same time, it was also recognized that ifagreement on the negotiating frameworks could not be reached by mid-2004, theround would be in serious trouble.
In the early hours of August 1, 2004, the WTO General Council reached deci-sions on frameworks to continue with multilateral negotiations on agriculture andindustrial products, on a series of recommendations concerning services and de-

TRADE, DOHA, AND DEVELOPMENT: A WINDOW INTO THE ISSUES
30
velopment-related issues, and on a text on modalities for negotiations on tradefacilitation, which included a decision to drop the other three Singapore issues fromthe DDA. These decisions became known as the “July package”.6
The framework for agriculture laid the foundations for reform of global agricul-tural trade.7 It called for the parallel elimination of all forms of export subsidies, aswell as all export measures with equivalent effect (export credits, export credit guar-antees and insurance programs, trade-distorting practices of exporting state trad-ing enterprises, and food aid). The end date for the elimination of all forms of exportsubsidies and the time profile for the implementation, however, remained to benegotiated.
The framework also committed member countries to substantial reductions oftrade-distorting domestic support, encompassing the so-called Amber and Blueboxes, as well as de minimis subsidies. In the first year of implementation of theagreement, countries are expected to cut at least 20 percent of the overall level oftrade-distorting support. The framework calls for substantial improvements in mar-ket access for all products. Tariff reductions are expected to be made from boundrates and expected to foster greater harmonization of tariff regimes, with deepercuts in higher tariffs. In the case of sensitive products, “substantial improvement”is to be achieved through a combination of tariff-quota expansion and tariff cuts.The framework, however, leaves to the next stage of the negotiations the details ofthe tiered formula to be applied (for example, number of bands and type of tariffreduction in each band) and the criteria for selection of sensitive products. Marketaccess remains the most controversial pillar of the agricultural negotiations. Finally,there was agreement that cotton would be dealt as a priority, but in the context ofthe overall agricultural negotiations rather than as a stand-alone issue.
The framework on nonagricultural market access set the stage for the pursuitof tariff cuts according to a nonlinear formula and the reduction or elimination ofnontariff barriers. Many issues, however, remained open to debate, and somedeveloping-country members (particularly African countries) have been vocal incriticizing what they perceive as the limited flexibility afforded to them. In the area ofservices, WTO members agreed to intensify their efforts with a view to ensuring asubstantive outcome with respect to market access. A new date (May 2005) wasestablished for presenting new and revised offers.8 Concrete recommendations onhow best to make SDT provisions more operational were also postponed to July2005.9
The July 2004 package reinvigorated the Doha Round. Negotiations over thenext 12 months, however, proceeded slowly. Limited progress was achieved inaddressing some technical questions—such as the methodology for calculating advalorem equivalents for specific duties in agriculture—but, overall, the negotiatingtargets often referred to as benchmarks for evaluating progress by July 2005 were

THE MULTILATERAL TRADING SYSTEM
31
missed, 10 reigniting doubts about the ability of WTO members to reach a timelyconclusion of the DDA. In what follows, we review different perspectives on theprospects of the current negotiations.
Just mid-flight turbulence?Some analysts point out that current difficulties in the negotiations resemble theturbulence experienced in past negotiations. Moreover, they argue that withappropriate corrective actions, the DDA could still deliver a substantive outcome.11
There are five main planks to their argument.12
First, failures and delays in trade negotiations are nothing new.13 Multilateraltrade rounds have always taken a long time and often have lasted longer thanoriginally intended, with “failed” ministerial meetings preceding an agreement.Indeed, the predecessor to the WTO—the GATT—was a “provisional” agreementthat lasted until 1994 because of the failure of the United States to agree on theestablishment of the International Trade Organization (ITO) proposed in an ambitiousdraft charter in the late 1940s. A ministerial meeting in Geneva, intended to launch anew round, failed in 1982. Two years into the Uruguay Round, begun in 1986,negotiations on a mid-term review in Montreal ended in deadlock. A ministerialmeeting in Brussels in 1990, in turn, was not able to bring the negotiations to aclosure, with treatment of agriculture as the main sticking point. In the WTO era, thefailed ministerial meeting at Seattle in 1999 was followed by a successful launch ofnegotiations at the next ministerial in Doha. In this light, some argue that highlypublicized failures such as Seattle may be necessary to shock the system intoaction.
In the same vein, the fact that the original deadline for the conclusion of theround (December 2004) was missed does not constitute in itself a major indictmentof the system. That deadline was always more of a target to keep the pressure onnegotiations than a plausible end point. This short leash allowed the WTO to pushfor progress in what would otherwise have been a dormant period.
Second, the growing complexity and breadth of the negotiations means that,inevitably, negotiations will take longer than before. The duration of negotiationsgradually extended from one year for the first four rounds up to eight years for theUruguay Round (table 1). In parallel, the number of negotiating partners swelledfrom 23 in 1947 to 148 in the current negotiations. Further, the breadth of thenegotiating agenda has expanded significantly. The first five rounds essentiallycovered market access (focusing on tariffs). The Kennedy Round added somenontariff measures and antidumping measures; the Tokyo Round added “plurilateralagreements”14; and the Uruguay Round covered all existing areas, plus rules,services, intellectual property, and dispute settlement, while strengtheningmultilateral disciplines for trade liberalization with respect to textiles and clothingand agriculture. The DDA covers most of the above plus so-called development

TRADE, DOHA, AND DEVELOPMENT: A WINDOW INTO THE ISSUES
32
issues (in particular, SDT), and, at least initially, a discussion of whether to launchfull negotiations on the Singapore issues. These themes, in turn, are influenced bythe continuous debate on the so-called implementation issues, reflecting concernsraised by some developing countries about difficulties in implementingUruguay Round agreements.
Third, negotiations have already achieved some results. WTO members reacheda deal on the compulsory licensing issue in TRIPS and health shortly before Cancun.At the technical level, WTO members have built up their understanding of eachothers’ positions on all the main issues, as illustrated by the July package and, morerecently, by the agreement on how to calculate ad valorem equivalents with respectto specific duties in agriculture. Moreover, one of the controversial Singaporeissues (trade facilitation) became one of the most dynamic areas in the negotiations,with a large number of proposals on the table, including joint proposals by developedand developing countries. Less tangible but equally important is a change innegotiating dynamics: the WTO is becoming a truly world trading organization.Developing countries are increasingly assertive, leading many to argue that thesilver lining of the failure of Cancun was that developing countries found theirvoice in the negotiations.
Fourth, there is a well-established tradition for trade negotiators to “talk up”and exaggerate their differences until the very last minute. Negotiators often engagein a game of “chicken” in which each tries to demonstrate its strength to the otherby standing firm on its position.15 These tactics can exaggerate the perceived gulfbetween country positions. There are numerous examples of apparently intractabledifferences falling away as trade negotiators are replaced by government ministersin the endgame of negotiations. For example, a deal on the Singapore issues seemedunlikely going into the Doha Ministerial, but, in the interest of securing the launchof the round, the European Union at the last minute moderated its proposals. Forthe same reason, the United States changed its position to agree to launchnegotiations on antidumping in the DDA.
Finally, some analysts argue that even though the negotiations are facing aseries of difficulties, the political environment since September 11 is such thatfailure is not an option. According to this perspective, the “war on terror” willengender strong political support from the top to achieve a prodevelopment outcomewhen the time is ripe for the completion of the negotiations.16
According to those that embrace the “business as usual” perspective, theproblems identified above can be surmounted as long as key trading nations keeptheir commitment to a liberal rules-based trade regime. There may be a need forsome adjustment with respect to the governance structure of the WTO, and countriesmay need to show restraint in engaging in preferential trade agreements, but themultilateral trade system and the DDA, while confronting many challenges, are

THE MULTILATERAL TRADING SYSTEM
33
experiencing in-flight turbulence, not systemic crisis.17
The DDA: a mismatch between expectations and reality?Many commentators argue that the experience of the first four years of the DohaRound suggests little cause for optimism for significant trade liberalization. Doubtsfrom developing countries about the benefits of multilateral liberalization, unrealisticexpectations about the capacity of the system to deliver development outcomes,and lack of enthusiasm from traditional demandeurs are often mentioned in thiscontext.18 These concerns are well captured by Curtis and Ciuriak (2005) who pointout that to launch “the Doha Round in late 2001, before completing and digestingthe Uruguay Round results and China’s accession to the WTO and integration intothe global trading system, might well have been a great mistake.” The followingarguments support that perspective:
First, the Doha Round was an unwanted child for some members of the WTO.The European Union was its main champion, proposing an ambitious agenda thatwould extend the WTO’s mandate further into domestic regulation. Many developingcountries initially resisted the launch of a new round. Their main objections werethat (i) they were still struggling to implement Uruguay Round agreements; (ii) theywere not ready for more trade liberalization; (iii) they did not have the capacity tonegotiate a new round at that point in time; and (iv) they were not convinced thatdeveloped countries would be prepared to offer enough in the way of subsidy andtariffs cuts in sensitive areas to justify the costs of new negotiations. It is alsoworth noting that many developing countries feared that MFN liberalization wouldworsen their competitive position by eroding preferences.19
Second, expectations were too high at the launch of negotiations. The currentnegotiations are often referred to as the “Development Round”—a term that wasalready being used in the late 1990s.20 The communiqué of the Doha Ministerialframed the negotiating agenda in terms of its potential benefits for developingcountries. The text was full of references to development, increasing technicalassistance, cutting agricultural subsidies in the North, addressing developing-country concerns on SDT and implementation, lowering tariff barriers on productsof interest to developing countries, providing duty- and quota-free access toproducts from LDCs, and addressing concerns about the impact of TRIPS on thecapacity of developing countries to deal with health crises.
Third, some seemingly intractable issues were papered over at the DohaMinisterial only to resurface at a later date. This is not unusual in internationalnegotiations. The DDA contained a number of early deadlines on issues ofimportance to those resisting new negotiations—among them an ambitious agendato review Uruguay Round commitments on SDT. Those deadlines occupied a greatdeal of negotiators’ time following the launch of the round, with limited results.
Overly high expectations and a difficult agenda were not a good start for the

TRADE, DOHA, AND DEVELOPMENT: A WINDOW INTO THE ISSUES
34
round. There was also little early progress on the core issue of agriculture, with theEuropean Union and United States seen to favor a limited reform agenda.21 In theabsence of many early deliverables, the European Union’s attempts to launchnegotiations on the Singapore issues failed to garner support from mostdeveloping countries.
Fourth, there was no consensus on what a “Development Round” meant interms of new concessions granted to, or offered by, developing countries. Widelyvarying views on the role of trade policy in the development process added to thecomplexity of the negotiations. To take one example, SDT proposals related toGATT Article 28 call for greater freedom to restrict trade to protect infant industries.This was seen as a development deliverable by some developing-country members.In stark contrast, many developed (and some developing) countries argued thatgreater exemptions to WTO disciplines would harm developing countries.
Underlying most SDT-related disagreements in the WTO is the concept ofpolicy space, which has become synonymous with development for somecommentators and some WTO negotiators.22 To some extent it also has been anorganizing theme for those challenging what they perceive as the established tradeorthodoxy. Many developing-country negotiators argue that the more advancedcountries used infant-industry protection to industrialize, hence WTO rules shouldallow developing countries to do the same. Further, many argue that the Northshould open their markets to products from the South and cut subsidies withoutasking for reciprocal market opening. In contrast, developed countries have soughtto explain the benefits of “policy lock-in” through the WTO, questioning the abilityof interventionist trade policies to promote growth and emphasizing the costs ofnot engaging in reciprocal bargaining in the WTO.23
Fifth, some observers have claimed that there is no clear leadership innegotiations from the major power blocs. Frequent comparisons are made to theUruguay Round, where the United States was a driving force in negotiations. Thereis a perception that the United States is only half-engaged in current negotiations,devoting at least equal energy to the pursuit of new regional and bilateral tradeagreements and often adopting unilateral decisions (on steel and agriculture, forexample) that called into question its commitment to the multilateral process. TheEuropean Union, in turn, although also publicly committed to multilateralism, hasbeen unable to come to terms with its own agricultural problems.24 And majordeveloping countries (notably Brazil), while effectively pursuing an offensive tacticin agriculture, have adopted a wait-and-see approach with respect to other themessuch as services and nonagricultural market access.
Sixth, the private sector in industrialized countries seems lukewarm about thecurrent round. This contrasts with the high level of engagement of business leadersand business organizations during the Uruguay Round. One possible reason forthis lukewarm attitude is that the concept of the Development Round may have led

THE MULTILATERAL TRADING SYSTEM
35
business to question the benefits to be gained from the negotiations. Moreover,with the acceleration of the business cycle and increased shareholder concernswith results, business has become more focused on the short term. In this context,it is not surprising that protracted multilateral negotiations have a lower priority inthe allocation of resources for lobbying national governments.
All these considerations have been cited in predictions that the initial ambitionsof the DDA will not be realized. There is growing concern that the Hong KongMinisterial in December 2005 may not be able to deliver full-fledged modalities fornegotiations in agriculture and nonagricultural market access. If the results of theupcoming ministerial are not significant, it is unlikely that the round will be completedwithin the lifetime of the current U.S. Trade Promotion Authority. As a consequence,the negotiations could linger on for several additional years.25
A systemic crisis?The previous section outlined a series of arguments that put in doubt the ability ofthe DDA to deliver an ambitious liberalization outcome. It also underscored the lackof consensus on the meaning of a Development Round. Could these problems,however, reflect a deeper and more profound failure of the multilateral trading systemassociated with the WTO? There are those who believe that current problems innegotiations are a symptom of multilateralism in crisis.26
First, the “global commons” of ideas has swung from seeing trade opening asgenerally a good thing to something to be feared. In particular, skeptics questionthe ability of developing countries to compete in their own markets with competitionfrom developed countries and to take advantage of new market opportunitiesbecause of weak supply capacity. At the same time, support from the traditionaladvocates of liberal trade, such as the United States, is being undermined by growinganxieties about the capacity of industrialized economies to compete in agriculture(the Brazilian threat), manufacturing (the Chinese threat), and even in services (theIndian threat).27
Second, the “mercantilist motor” of the multilateral trading system may haverun out of fuel. The original logic of multilateral trade negotiations was thatnegotiators would trade tariff reductions. Even though theory tells us that unilateralliberalization is generally a good thing for small economies, the political economy ofthe process is such that reciprocity becomes a useful lever. Trade liberalization isthen presented as the price to be paid for new access to other markets. This model,which served the multilateral trading system well in the past, is coming underpressure for the following reasons: (i) “mercantilist” calculations are much morecomplex when regulatory issues are involved; (ii) much of the low-hanging fruitwas picked in previous rounds, and what protection remains is in sensitive areaswhere political risks of confronting concentrated vested interests are high (forexample, would European governments be able to claim that new market access in

TRADE, DOHA, AND DEVELOPMENT: A WINDOW INTO THE ISSUES
36
the South is adequate compensation for the feared impact on the rural economyarising from liberalization?) and (iii) many developing countries have becomeincreasingly risk-averse in agreeing to new concessions, reflecting the perceptionthat they got a bad deal in the Uruguay Round. In short, the incentives to “free-ride” on the public good of the multilateral rules-based system have increased,weakening the appeal of engaging in reciprocal concessions.
Third, the rapid proliferation of regional and bilateral trade agreements isundermining the core principle (nondiscrimination) of the multilateral trade system,raising several concerns. Regional trade agreements—RTAs—are absorbing scarcetime and energy from negotiators. Many of the poorest WTO members are part ofseveral regional and bilateral trade negotiations, distracting them from multilateralism.RTAs may also lock in competing and sometimes incompatible regulatory practices,making it harder to harmonize standards in the multilateral system at a later date. Forexample, some observers have expressed concerns that the imposition of TRIPs-plus rules on intellectual property rights will further erode flexibilities in the WTOTRIPS agreement—in particular in the area of compulsory licensing.28 A relatedconcern is that a new generation of RTAs contains dispute-settlement provisionsthat have the potential to conflict with WTO dispute settlement.
Fourth, slow progress in the DDA is increasing concern about whether theWTO is an effective place to do business. The economically advanced countriesmay conclude that WTO does not meet their constantly evolving business needsbecause of difficulties in negotiating and agreeing upon rigorous new standards inthe multilateral context, thus hastening the trend toward regionalism. As thenegotiating agenda extends into areas beyond tariffs, it has become more difficultto develop rules that reconcile the needs of the advanced trading nations withthose of the less advanced countries. The WTO Customs Valuation agreement is agood example. An approach that suited the more advanced countries appears to beexpensive and difficult for less advanced countries to implement.29 Furtherdifferentiation in the application of WTO rules based on different implementationcapacities appears to be difficult to reconcile in the face of an increasingly legalisticapproach to rulemaking.
Moreover, some members came away from Cancun with serious doubts aboutthe ability to reach agreement by consensus among such a heterogeneous andlarge number of countries, although no clear alternative has been presented.30
There are therefore real challenges in making the mechanics of a truly representativetrade negotiation work effectively.
Finally, there are those that point to a legitimacy crisis of the global governanceregime associated with WTO agreements. Although the trade focus of the WTO isperceived by many analysts as a plus, critics emphasize that unless the multilateraltrade regime is able to address other important goals—such as poverty and theenvironment—while promoting a fair distribution of outcomes in a transparent

THE MULTILATERAL TRADING SYSTEM
37
manner, its political legitimacy will be increasingly contested in the streets and inparliaments around the world.31
Concluding remarksThese three perspectives are, of course, stylized summaries of the evolving debateon the future of the multilateral trading system. As already mentioned, we believethat claims of a “systemic crisis” may well be exaggerated, but this is not an invitationto complacency. After all, concerns about the DDA outcome become increasinglypertinent as time passes without substantive progress in the negotiations.
Action needs to be taken to avoid the erosion of the multilateral trading system.Renewed progress to meet the ambitious objectives of the DDA would provide ahuge confidence boost to the multilateral trading system and make a significantcontribution to the world economy.32 On the other hand, a timid set of reforms andlimited multilateral liberalization will generate not only small benefits, but it couldalso feed skepticism about the capacity of the multilateral trading system to contributeto economic development.
Even worse, a failed DDA would damage the WTO by eroding its relevance.This is not in the long-term interests of developing countries, which have a realstake in a strong rules-based multilateral trading system, irrespective of new market-access gains from the DDA. WTO rules lock in existing access on a nondiscriminatorybasis, an increasingly valuable asset in a time of growing protectionist pressures,political tensions, and the potential reemergence of trade blocs. They also promotetransparency and good governance. Moreover, the WTO dispute-settlement systemprovides for a rules-based mechanism that allows developing countries to defendtheir interests against larger and better-resourced trading partners, as the recentsugar and cotton cases attest.
As the number of WTO stakeholders grows and reciprocity increasinglyrequires complex trade-offs between greater market access in sensitive areas (suchas agriculture) and rules (intellectual property rights), the capacity of the WTO topromote nondiscriminatory trade liberalization is under stress. This puts anadditional premium on leadership dedicated to promote the global public goodderived from credible multilateral rules.33 Independently of the direct impact of theDDA on developing economies, the continued use of the WTO as a forum fornegotiations is essential to the preservation of the multilateral trade system, whichremains an important objective both for developed and developing countries alike.In sum, the answer to the original question posed in this paper—can the multilateraltrade system deliver a Development Round?—is a qualified yes, but timeis running out.

TRADE, DOHA, AND DEVELOPMENT: A WINDOW INTO THE ISSUES
38
Notes: a. Included in the list of contracting parties/members are those countries that weresignatories to the GATT by the end of each trade round or became signatories in its immediateaftermath.b. The European Communities, though an official WTO member in its own right, have beenexcluded for purposes of statistical continuity in the ratio of developed to developing countries.c. Developing-country classifications are based on GATT/WTO practices and on Kasteng,Karlsson, and Lindberg (2004).Source: Compiled by the authors based on WTO/GATT documents.
Table 1. Overview of GATT and WTO negotiating rounds
Round Year Negotiated items
Total b Developing country share
(percent) c
Geneva 1947 23 48 TariffsAnnecy 1949 23 48 TariffsTorquay 1950–1951 33 46 TariffsGeneva 1955–1956 35 46 TariffsDillon 1960–1962 42 50 Tariffs
Kennedy 1964–1967 75 68 Tariffs, some nontariff barriers, antidumping measures
Tokyo 1973–1979 85 71 Tariffs, nontariff barriers, plurilateral agreements
Uruguay 1986–1994 128 77 Tariffs, nontariff barriers, rules, services, intellectual property rights, agriculture, textiles and clothing, institutional issues
Doha 2001– 148 76 Agriculture, nonagricultural market access, services, intellectual property rights, rules, further work on UR items and implementation-related issues, development, and trade facilitation.
Number of contracting
parties/members a

THE MULTILATERAL TRADING SYSTEM
39
Notes1. Elwyn Grainger-Jones is Principal Economist, European Bank for Reconstruction and
Development (EBRD). This note was prepared while he was a consultant with the World Bank.Carlos A. Primo Braga is Senior Adviser, International Trade Department, World Bank. Com-ments and assistance from R. Newfarmer, B. Hoekman, K. Brokhaug, W. Martin, R. Sally, A.Mattoo, H. Corbet, J.P. Chauffour, and P. Reichenmiller are gratefully acknowledged. This notereflects solely the views of the authors. It does not necessarily reflect the views of the WorldBank Group, the EBRD, or the Executive Directors of either institution.
2. See, for example, the series on “What’s Holding Up Doha?” Finance and Development(March 2005).
3. These topics were first introduced in the debate at the Singapore WTO Ministerial of 1996.Accordingly, they became known as the “Singapore issues.” Sir Leon Brittan, former EC com-petition and trade commissioner, was an early champion of the idea of a new trade round.
4. The G-20 came to life on August 20, 2003, as a reaction to a joint U.S.-EU paper onagriculture. It has since become an influential voice in the agricultural negotiations, under theleadership of Brazil. The coalition encompasses both Cairns Group countries (which favor anambitious liberalization agenda) and G-33 countries, which have defensive interests in agricul-ture (focusing on food security and rural development). The G-20 has positioned itself as the“pragmatic voice” of the South, aiming for elimination of export subsidies, substantial reduc-tions of trade-distorting support, market access liberalization, and special and differential treat-ment for developing countries. In March 2005, the group included Argentina, Bolivia, Brazil,Chile, China, Cuba, Egypt, Guatemala, India, Indonesia, Mexico, Nigeria, Pakistan, Paraguay,Philippines, South Africa, Thailand, Tanzania, Uruguay, Venezuela, and Zimbabwe.
5. See, for example, Hoekman and Newfarmer (2003).6. See WTO (2004).7. For details see Primo Braga (2004).8. That deadline was missed. By May 31, there were 62 initial offers (covering 86 members)
and 9 revised offers.9. This deadline was also missed and the Chairman of the Special Session reported to the WTO
General Council in July 2005 that recommendations for a decision should be presented by theHong Kong Ministerial Conference.
10. Speaking at the OECD Ministerial on May 4, 2005, Dr. Supachai Panitchpakti (then WTODirector General) identified the following items as required components for a “substantialbreakthrough” at the ministerial: concrete modalities for agriculture and nonagricultural marketaccess, a critical mass of market-opening services offers, significant progress in areas such asrules and trade facilitation, and a proper reflection of the development dimension. He alsopointed out that time was running out for the negotiators to achieve these goals. His report, aschairman of the Trade Negotiations Committee to the General Council, further elaborated onthese targets and stated that “progress made [since 2004] had been insufficient” (WTO 2005).See also http://www.wto.org/english/news_e/news05_e/dg_oecd_4may05_e.htm.
11. It is worth noting that full merchandise liberalization (ignoring potential dynamicgains associated with productivity increases) could add roughly $300 billion per year tothe global economy by 2015. Even though agriculture and food processing account forless than 10 percent of world trade, trade liberalization of agriculture and food wouldaccount for 63 percent of gains (with textiles and clothing accounting for 27 percent andother manufactures 10 percent). An ambitious Doha outcome, featuring the eliminationof export subsidies and significant cuts in domestic support and tariffs in developed anddeveloping countries, could deliver roughly one-third ($96.1 billion) of the full-merchan-dise-liberalization scenario, with agricultural liberalization delivering roughly two-thirdsof the gains. Services liberalization, particularly for the movement of people, couldsignificantly expand those welfare results. See Anderson, Martin, and van der Mensbrughe

TRADE, DOHA, AND DEVELOPMENT: A WINDOW INTO THE ISSUES
40
(2005) for detailed calculations of the welfare implications of different DDA scenarios.12. See, for example, Srinivasan (2003), Cline (2005), and Messerlin (2005).13. It is worth noting that the negotiations on the Free Trade Area of the Americas, for
example, have been going on for more than 10 years and that the completion of the EU-Mercosur negotiations also missed its original target (2004).
14 The Tokyo Round “codes”: subsidies and countervailing measures—interpreting Articles 6,16 and 23 of GATT; technical barriers to trade—sometimes called the standards code; importlicensing procedures; government procurement; customs valuation—interpreting Article 7; an-tidumping—interpreting Article 6, replacing the Kennedy Round code; bovine meat arrange-ment; international dairy arrangement; trade in civil aircraft.
15. The traditional description of the “chicken game” presents a situation in which twoplayers drive their cars at each other on a narrow road. Each has the choice of swerving to avoida collision or not swerving. The first to swerve loses face among his peers. If neither swerves,both die.
16. This point is made in Cline (2005).17. See Sutherland and others (2004) for a detailed discussion on how best to address WTO’s
institutional challenges in the current economic environment.18. See, for example, Mattoo and Subramanian (2005) and Curtis and Ciuriak (2005).19. Mattoo and Subramanian (2004) review challenges faced by poor countries in engaging in
WTO negotiations.20. See, for example, Short (1999), a speech delivered at UNCTAD by the former British
secretary of state for international development, the Rt. Hon. Clare Short (see http://www.gene.ch/gentech/1999/Mar–Apr/msg00068.html).
21. See Primo Braga (2004) for a description of the evolution of the agricultural negotiationsand the role of different coalitions.
22. See Corrales-Leal, Sugathan, and Primack (2003).23. These polar positions on the costs and benefits of SDT are well captured in Bhagwati
(2004) and Oyejide (2004).24. Critics cite the Franco-German deal on the mid-term review of the Common Agricultural
Policy.25. For a discussion of U.S. interests in the DDA and the U.S. legislative agenda affecting its
trade policies see Schott (2005).26. See Sally (2004) for a detailed presentation of this perspective.27. The negotiations take place against a backdrop of significant debate on the benefits of
globalization by governments and the public. The debate on the costs and benefits of interna-tional economic integration is well captured in Wolf (2004).
28. See Fink and Reichenmiller (2005).29. See Finger and Schuler (2000).30. See the discussion on “variable geometry” and plurilateral agreements in Sutherland and
others (2004).31. See, for example, Esty (2002) and Trotman (2004).32. In October 2005, the U.S. made an important move by presenting a more ambitious
proposal for agricultural liberalization. This was followed by a flurry of additional proposals andreactions from other WTO members and coalitions. At the time of writing, however, noconsensus had yet emerged on market access with a wide gulf separating the more ambitiousproposals from the U.S. and the G-20, for example, vis-à-vis the EU proposal.
33. This leadership is also required to advance the “aid for trade” agenda as discussed in IMFand World Bank (2005).

THE MULTILATERAL TRADING SYSTEM
41
ReferencesAnderson, K., W. Martin, and D. dan der Mensbrugghe. 2005. “Market and Welfare Implications
of Doha Reform Scenarios.” Unpublished paper. Development Research Group, World Bank,Washington, DC.
Bhagwati, Jagdish. 2004. “Trading for Development: How to Assist Poor Countries.” In Dohaand Beyond: The Future of the Multilateral Trading System, ed. M. Moore (Cambridge:Cambridge University Press).
Cline, William R. 2005. “Doha Can Achieve Much More than Skeptics Expect.” Finance andDevelopment (March): 22–23.
Corrales-Leal, Werner, Mahesh Sugathan, and David Primack. 2003. “Spaces for DevelopmentPolicy: Revisiting Special and Differential Treatment.” Paper prepared for the Joint ICTSD–GP International Dialogue: Making Special and Differential Treatment More Effective andResponsive to Development Needs, May 6–7, 2003, Chavannes-de-Bogis, Switzerland.
Curtis, John M., and Dan Ciuriak. 2005. “Scoping the End-Game in the Doha Round: A RoundtableDiscussion.” Report on a meeting organized by the Centre for International GovernanceInnovation at the University of Waterloo, IDRC, and the Department of Foreign Affairs andInternational Trade, Canada, on February 17–18, 2005.
Esty, Daniel C. “The World Trade Organization’s Legitimacy Crisis.” World Trade Review (1):7–22.
Finger, J. M., and P. Schuler. 2000. “Implementation of Uruguay Round Commitments: TheDevelopment Challenge” World Economy (23): 511–26.
Fink, Carsten, and Patrick Reichenmiller. 2005. “Tightening TRIPS: The Intellectual PropertyProvisions of Recent U.S. Free Trade Agreements.” Trade Note 20. Development ResearchGroup, World Bank, Washington, DC.
Hoekman, Bernard, and Richard S. Newfarmer. 2003. “After Cancun: Continuation or Col-lapse.” Trade Note 13. Development Research Group, World Bank, Washington, DC.
International Monetary Fund and the World Bank. 2005. “Doha Development Agenda and Aidfor Trade.” Paper presented to the Development Committee, September 25, Washington,DC.
Kasteng, Jonas, Arne Karlsson, and Carina Lindberg. 2004. “Differentiation between Develop-ing Countries in the WTO.” Report 2004:14E, Swedish Board of Agriculture, Stockholm.
Mattoo, Aaditya, and Arvind Subramanian. 2004. “The WTO and the Poorest Countries: TheStark Reality.” IMF Working Paper WP/04/81. International Monetary Fund, Washington,DC.
Mattoo, Aaditya, and Arvind Subramanian. 2005. “Why Prospects for Trade Talks Are NotBright.” Finance and Development (March): 19–21.
Messerlin, Patrick A. 2005. “Success Requires a ‘Grand Vision.’” Finance and Development(March): 24–25.
Oyejide, T. Ademola. 2004. “Development Dimensions in Multilateral Trade Negotiations.” InDoha and Beyond: The Future of the Multilateral Trading System, ed. M. Moore. Cambridge:Cambridge University Press.
Primo Braga, Carlos A. 2004. “Agricultural Negotiations: Recent Developments in the DohaRound.” Trade Note 19. Development Research Group, World Bank, Washington, DC.
Sally, Razeen. 2004. “The End of the Road for the WTO? A Snapshot of International TradePolicy after Cancun.” World Economics 5 (January–March): 1–14.
Schott, Jeffrey J. 2005. “Confronting Current Challenges to U.S. Trade Policy.” In The UnitedStates and the World Economy: Foreign Economic Policy for the Next Decade, ed. C. FredBergsten. Washington, DC: Institute for International Economics.
Short, Clare. 1999. “Future Multilateral Trade Negotiations: A ‘Development Round’?” Speechto UN Conference on Trade and Development, March 2.

TRADE, DOHA, AND DEVELOPMENT: A WINDOW INTO THE ISSUES
42
Srinivasan, T. N. 2003. “The Future of the Global Trading System: Doha Round, CancunMinisterial and Beyond.” Unpublished paper, at www.econ.yale.edu/~srinivas/ Yale University
Sutherland, Peter, Jagdish Bhagwati, Kwesi Botchwey, Niall FitzGerald, Koichi Hamada, John H.Jackson, Celso Lafer, and Thierry de Montbrial. 2004. The Future of the WTO: AddressingInstitutional Challenges in the New Millennium. Geneva: World Trade Organization.
Trotman, LeRoy. 2004. “The WTO: The Institutional Contradictions.” In Doha and Beyond:The Future of the Multilateral Trading System, ed. M. Moore. Cambridge: Cambridge Univer-sity Press.
Wolf, Martin. 2004. Why Globalization Works. New Haven, CT: Yale University Press.

Doha Policies: Where are the Pay-offs?
Kym Anderson, Will Martin,and Dominique van der Mensbrughhe
3
The Doha Round could promote development.1 But it will fall significantlyshort if it does not liberalize agriculture and include some effort by developingcountries as well as high-income countries. The potential gains from full
multilateral trade liberalization range from $290 to $460 billion (Anderson, Martinand van der Mensbrugghe 2006a). According to the simulations reported here, aDoha agreement that makes significant cuts in WTO-agreed ceilings (bound rates)for tariffs could bring those gains within reach.
The need for deep cuts in bound rates is especially acute in agriculture, whereprotection is far higher than in manufacturing and where bound rates exceedapplied rates by especially large margins. Two measures are important for capturingpotential benefits: (i) capping maximum tariffs and (ii) resisting the temptation toexclude a large number of products from cuts. Exempting even 2 percent of tarifflines could eviscerate the round.
But cuts in bound rates must be more than broad and deep; they must applyto developing as well as developed countries. The benefits to developing countriesof an ambitious Doha agreement will come as much from reform in the South asfrom reform by high-income countries. For that reason, developing countries mustparticipate fully in the round by offering larger tariff cuts and making real reformsrather than seeking shelter under the banner of special and differential treatment(SDT).
This note presents results from modeling five scenarios to assess the effect ofdifferent magnitudes and types of cuts in agriculture and nonagricultural products.Before presenting details of these scenarios, we survey the potential gains in botha dynamic and static sense, to provide an idea of what is possible from the rightagreement and to lay down a benchmark against which to evaluate possibleoutcomes of the Doha Round. We then analyze the five scenarios to illuminatesome of the major issues that will determine the success of the Doha Round.
The range of the possible: What could full multilateralliberalization deliver?Full removal of protection—both domestic and at the border—on trade in goodswould raise global real income by an estimated $287 billion in 2015, relative to abaseline scenario and assuming that trade reform has no impact on underlyingproductivity.2 The gains would be higher for high-income countries in dollar terms,
43

TRADE, DOHA, AND DEVELOPMENT: A WINDOW INTO THE ISSUES
44
but as a percentage of initial income they would be larger for developingcountries (table 1).3
The gains in various parts of the world can be decomposed by source (table 2).At the global level, nearly two-thirds of the gains would be derived from thecomplete removal of protection on agriculture and food, with 14 percent generatedby removal of remaining protection on textiles and apparel and only 23 percent byremoving protection in all other manufacturing sectors. Agricultural protection isequally important for the gains to developing and high-income countries,accounting respectively for 63 and 64 percent of the regional gains. About 50percent of the gains to developing countries come from removal of barriers ontrade among developing countries. This is also true for agricultural reform.Developing countries gain just about as much whether high-income countriesliberalize agriculture and food or developing countries do so.
These estimates of gain assume that trade opening has no impact onproductivity and that the only dynamic effect of the gains comes from relativelysmall changes in investment volumes and structural shifts. In an alternativespecification, the change in trade openness—as measured by the export-to-outputratio at the individual sector level—is linked to a change in productivity. Thealternative scenario assumes that if trade openness leads to larger export volumesas a share of total output, sectoral productivity will increase. The linkage betweenexporting and productivity can be motivated by a combination of effects—amongthem matching international standards, overcoming threshold effects, reaping scaleeconomies, taking advantage of network effects, and learning by doing.4 Theeffects of this linkage between trade and productivity can be seen in the columnsof table 1 labeled “Full-reform, dynamic.” The global gains from this scenariowould rise to 1.1 percent relative to the baseline, compared with a rise of 0.7percent without the productivity boost. However, the gains for developing countriesmore than double—from $86 billion to $200 billion—as the impacts of reform leadto a higher relative shift to exports compared to the high-income countries.
These simulation results cover only a narrow, if important, set of issues in thecontext of international trade negotiations. For example, services—which accountfor between 50 and 80 percent of national output and have high entry barriers—arenot covered, nor is trade facilitation. Other factors can influence the size of thegains in merchandise trade reform. For example, the results may be understatedbecause of the assumption of full utilization of preferences, and the perniciouseffects of high tariffs may be dampened through product and country aggregation.On the other hand, the gains to low-income countries may be overstated if anticipatedsupply responses do not materialize—hence the importance of the “aid for trade”agenda being developed to encourage supply responses.

DOHA POLICIES
45
b. P
erce
ntag
e ch
ange
com
pare
d w
ith b
asel
ine
Sour
ce:
Aut
hors
’ si
mul
atio
ns u
sing
Wor
ld B
ank
Lin
kage
mod
el.
Sce
nari
o 1
Scen
ario
2Sc
enar
io 3
Scen
ario
4Sc
enar
io 4
Ag
only
Ag-
SSP
Ag-
SSP
+ca
pA
g+n
onag
(S
DT
)+
pro
duct
ivit
y
(1)
(2)
(3)
(4)
(5)
(6)
(7)
(8)
Hig
h-in
com
e0.
620.
810.
200.
060.
130.
250.
300.
30D
evel
opin
g0.
841.
970.
090.
000.
010.
160.
290.
22M
iddl
e-in
com
e0.
851.
770.
10–0
.01
0.01
0.15
0.27
0.21
Low
-inc
ome
0.82
2.79
0.05
0.01
0.00
0.18
0.38
0.30
Wor
ld0.
671.
080.
180.
040.
100.
230.
300.
28
Cou
ntry
gro
upF
ull r
efor
m,
dyna
mic
Scen
ario
5
Ag+
nona
g F
ull
refo
rm,
stat
ic
Tab
le 1
. C
ha
ng
e i
n r
ea
l in
co
me
in
alt
ern
ati
ve
Do
ha
sc
en
ari
os
, 2
01
5
a.
Do
llar
cha
ng
e (
in b
illio
ns
of
20
01
do
llars
) co
mp
are
d t
o b
ase
line
sce
na
rio
Sce
nari
o 1
Scen
ario
2Sc
enar
io 3
Scen
ario
4Sc
enar
io 4
Ag
only
Ag-
SSP
Ag-
SSP
+ca
pA
g+n
onag
(S
DT
)+
Pro
du
ctiv
ity
(1)
(2)
(3)
(4)
(5)
(6)
(7)
(8)
Hig
h-in
com
e20
1.6
261.
165
.618
.143
.279
.995
.896
.4D
evel
opin
g85
.720
0.1
9.0
–0.4
1.1
16.1
29.9
22.9
M
iddl
e-in
com
e69
.514
5.1
8.0
–0.5
1.0
12.5
22.3
17.1
L
ow-i
ncom
e16
.255
.01.
00.
10.
03.
67.
65.
9W
orld
287.
346
1.2
74.5
17.7
44.3
96.1
125.
711
9.3
Cou
ntry
gro
upF
ull
refo
rm,
stat
icF
ull r
efor
m,
dyna
mic
Scen
ario
5
Ag+
non
ag (
all)

TRADE, DOHA, AND DEVELOPMENT: A WINDOW INTO THE ISSUES
46
Developing High-income WorldDeveloping countries liberalize:Agriculture and food 28 19 47Textile and wearing apparel 9 14 23Other merchandise 6 52 58All sectors 43 85 128High-income countries liberalize:Agriculture and food 26 109 135Textile and wearing apparel 13 2 15Other merchandise 4 5 9All sectors 43 116 159All countries liberalize:Agriculture and food 54 128 182Textile and wearing apparel 22 16 38Other merchandise 10 57 67All sectors 86 201 287
Developing High-income WorldDeveloping countries liberalize:Agriculture and food 33 9 17Textile and wearing apparel 10 7 8Other merchandise 7 26 20All sectors 50 42 45High-income countries liberalize:Agriculture and food 30 54 47Textile and wearing apparel 15 1 5Other merchandise 3 2 3All sectors 50 57 55All countries liberalize:Agriculture and food 63 64 63Textile and wearing apparel 25 8 14Other merchandise 12 28 23All sectors 100 100 100
Gains by region (US$ billions)
Share of global gain (percent)
Table 2. Regional and sectoral source of gains from full liberalizationof global merchandise trade, developing and high-income countries,2015Change in real income in 2015 relative to the baseline scenario
Note: Small interaction effects are distributed proportionately and numbers are rounded tosum to 100 percent.Source: Authors’ simulation using World Bank’s Linkage model.

DOHA POLICIES
47
Modeling possible Doha scenariosThe Doha Round was launched at the WTO’s meeting of trade ministers at Dohain late 2001. The following ministerial meeting, in Cancún in September 2003, endedin acrimony and without an agreement on how to proceed. At Cancún, developingcountries made it abundantly clear that further progress would not be possiblewithout a commitment by developed countries to significantly lower theiragricultural subsidies (notably for cotton). An intense period of consultations inJuly 2004 ended in the early hours of August 1 with a decision on how the Dohawork program should proceed (WTO 2004). The so-called July FrameworkAgreement hints at how a Doha agreement might be structured. What emergedwith respect to the three major agricultural issues, or pillars, is especially important.5
To illustrate the different issues involved in a possible Doha outcome, welook at five reform scenarios. The first three deal with different aspects of agriculturalreform, which, as noted above, is particularly important as a source of potentialgains. The alternative agricultural scenarios show the impacts of allowing forexemptions for so-called special or sensitive products, and allowing for a cap onthe highest tariffs. The final two scenarios add manufacturing (also known asNAMA, for nonagricultural market access) to the mix, with the final scenarioshowing the relative importance of special and differential treatment (SDT).
Underlying these scenarios are the levels of protection actually imposed. Oneof the key features of protection is the difference between the so-called boundlevel of protection and the applied level of protection. A country may have anactual tariff of 20 percent on an item, whereas the bound tariff is 100 percent. Thisallows the country to raise tariffs to 100 percent under current WTO rules. Thedifference between the bound tariff and the actual tariff is called the “bindingoverhang.” Because the negotiations focus on the bound tariffs, which aresubstantially higher than applied tariffs in most cases, the proposed reductionswill have to be high if any measurable liberalization is to occur. In the case of theexample above, even an 80 percent cut in the bound tariff would lead to noliberalization. A cut of 90 percent in the bound tariff would lead to a 50 percent cutin actual protection.
The scenarios envisaged reflect the following assumptions:• In terms of domestic agricultural support, where there is a huge gap between
bindings and actual support, we assume cuts relative to actual support of 28percent in the United States, 16 percent in the European Union, 10 percent inAustralia, and 18 percent in Norway, corresponding to a cut of 75 percent ofthe bound rates for countries with AMS notifications6 above 20 percent ofthe value of production and cuts of 60 percent for all other countries. Theseassumptions affect only the four economies mentioned.
• Export subsidies are eliminated as inconsistent with WTO rules.• A Harbinson-type formula (WTO 2003b) is used for agricultural tariffs—that is

TRADE, DOHA, AND DEVELOPMENT: A WINDOW INTO THE ISSUES
48
top–down progressivity, but on a line-by-line basis rather than an average-cutbasis; with greater cuts than in the original Harbinson formula to achieve moreimpact with respect to market access; and on a marginal-cut basis (as in aprogressive income tax) to avoid discontinuities. The simulations are based ona 45 percent, 70 percent, and 75 percent bound-rate cutting rule for developedcountries; a 35 percent, 40 percent, 50 percent, and 60 percent cutting rule fordeveloping countries; and no cuts for least developed countries.
• Negotiations on nonagricultural market access have lagged behind those onfarm products, so in the absence of any clear guidance we assumed a 50percent cut in bound tariffs by developed countries and 33 percent bydeveloping countries other than least developed (from which no cuts are beingdemanded).How high are the tariffs from which these cuts will be made? We draw on the
dataset compiled by the Centre d’Etudes Prospectives et d’InformationsInternationales (CEPII) for 2001 and use the World Bank’s LINKAGE model to projectthe world economy first to 2005, taking into account the complete implementationof the Uruguay Round, the accession to the WTO by China, and the eastwardexpansion of the European Union to 25 members. The tariffs so generated areassumed to remain unchanged to 2015 in our baseline scenario (table 3, column 1).The tariffs for farm products are more than three times the average for all goodsand so promise to be a major source of gains from reform.
The core agricultural reform scenario (Scenario 1) would reduce tariffs on farmgoods by one-third globally but by very little in developing countries because ofSDT and a large degree of binding overhang (table 3.a). If “sensitive” and “special”farm products are subjected to smaller cuts, as in Scenario 2, the drop in farm tariffswould be far less. Even when a cap of 200 percent is applied, as in Scenario 3, onlysome of that effect is restored. When nonagricultural tariffs are also cut, as inScenario 4, the global average tariff on all goods—4.7 percent in the baseline—falls to 3.5 percent (table 3.b). It would fall even further if developing countriesfully engaged in Doha reform, as in Scenario 5; indeed their average tariff wouldfall nearly as much again in that scenario as by moving from Scenario 1 to Scenario 4.
Estimates of welfare and trade impacts of prospective DohareformsScenario 1 focuses first on agricultural reform alone. Column 3 of table 1 suggeststhat agricultural liberalization using the harmonizing tiered formula (Scenario 1)would generate a global gain of $75 billion even without the inclusion ofnonagricultural tariff reform (column 6)—translating into 80 percent of the gainswhen NAMA is included. But almost all of those benefits accrue to the reforminghigh-income countries, such that developing countries would gain only $9 billion

DOHA POLICIES
49
because their tariff binding overhang is so great as to lead to almost no cuts inapplied tariffs.7
In Scenario 2, we consider the effects of allowing countries to exempt up to 2percent of tariff lines as sensitive products (and another 2 percent in developingcountries for “special” farm products). Under this scenario the global gains from aDoha Round would shrink to just $18 billion (column 4 of table 1), and developingcountries as a group would be worse off because of deteriorating terms of trade,with little offsetting expansion of export volumes in other areas.
If such exceptions are to be made, it would be important to exploit theopportunity—provided for in the July 2004 Framework—to cap bound tariffs.Scenario 3 shows that even a cap as high as 200 percent on exempted productswould restore at least half of the welfare gain foregone by allowing exceptionaltreatment (column 5 of table 1).
The final two scenarios add nonagricultural tariff cuts to the agriculturalreforms in the preceding scenarios. In Scenario 4, the gain to developing countriesdoubles by adding nonfarm reforms, relative to Scenario 1 where only agricultureis cut, contributing one-third of the extra boost to global welfare ($7.1 billion out ofthe $21.6 billion difference between the global gains from Scenarios 1 and 4).
a.Percent tariff rates Agriculture and food
Table 3. Average applied tariffs under different Doha scenarios, 2015
b. All merchandise
Note: Baseline uses tariffs in 2005. Scenario 1 assumes cuts in agriculture only using a modifiedHarbinson tiered formula with higher percent reductions for higher tariffs. Scenario 2 is thesame as Scenario 1, but with exemptions for special or sensitive products. Scenario 3 is thesame as Scenario 2, but with a 200 percent cap on the highest tariffs. Scenario 4 is the sameas Scenario 1, but includes reductions in manufactured tariffs. Scenario 5 is the same asScenario 4, but drops special and differential treatment for developing countries.Source: Authors’ simulations using World Bank Linkage model.
Scenario 1 Scenario 2 Scenario 3 Scenario 4 Scenario 5Ag only Ag-SSP Ag-SSP+cap Ag+nonag (SDT) Ag+nonag (all)
High-income 15.9 8.4 13.5 11.5 8.2 7.5Developing 14.2 12.5 13.4 13.3 12.4 10.6 Middle-income 12.1 10.4 11.4 11.2 10.3 8.9 Low-income 22.0 20.7 21.5 21.5 20.7 17.5World 15.2 10.0 13.5 12.2 9.9 8.8
Country group Baseline
Scenario 1 Scenario 2 Scenario 3 Scenario 4 Scenario 5Ag only Ag-SSP Ag-SSP+cap Ag+nonag (SDT) Ag+nonag (all)
High-income 2.9 2.3 2.7 2.5 1.6 1.6Developing 8.4 8.2 8.3 8.3 7.5 6.8 Middle-income 7.2 7 7.1 7.1 6.3 5.6 Low-income 15.5 15.3 15.5 15.4 14.6 13.4World 4.7 4.2 4.5 4.4 3.5 3.2
Country group Baseline

TRADE, DOHA, AND DEVELOPMENT: A WINDOW INTO THE ISSUES
50
Scenario 4 also assumes a productivity boost from trade openness, as in the globalreform scenario. In this case, the global gains would increase to $126 billion, anincrease of 31 percent over the static gains, but a near doubling of the gains fordeveloping countries (column 7 of table 1).
In Scenario 5, the developing countries (including the least developed) fullyengage in the reform process, forgoing the lesser cuts provided for in Scenarios 1to 4. That boosts their welfare and global welfare substantially, because their cutsin bound tariffs lead to considerably larger cuts in applied tariffs. In percentageterms, the gains for the low-income countries are higher than for the middle-incomecountries. The deeper cuts from Scenario 5 allow developing countries to reapgreater efficiency gains, overcoming potential losses from negative terms-of-tradeeffects on food-importing countries and losses from preference erosion.8
What effect would the reforms discussed here have on agricultural net income(value added by the farming sector)? Agricultural value added would fall in thoseregions with the highest agricultural protection (Western Europe, Northeast Asia,and, to a lesser extent, the United States). However, in the Doha reform scenario(Scenario 4)9 none of the developing countries or regions, except for the richercountries of Eastern Europe and Central Asia, would suffer a decline in agriculturalnet income, despite the lowering of their own agricultural tariffs (table 4). Thereason their farmers would fare better than protected rich-country farmers—eventhough the average agricultural tariff in developing countries is nearly as high asthat in high-income countries (14.2 percent compared with 15.9 percent in thebaseline)—is that a much larger proportion of developing-country agriculture isinternationally competitive and so need not be protected from imports. This resulthas clear implications for poverty alleviation, given that perhaps as many as 70percent of the world’s poor live in farm households in developing countries.
The trade consequences of Scenario 4 are summarized in table 5. The firstcolumn shows that by 2015, annual developing-country exports would be greaterby $41 billion for agricultural products, $25 billion for textiles and clothing, and $12billion for other manufactures. The total increase of $78 billion is smaller than thatfor high-income countries ($135 billion), but that difference is less when expressedin percentage terms (a 2.6 percent increase for developing countries, comparedwith 3.1 percent for high-income countries). This scenario thus takes globalmerchandise trade one-fifth of the way to where it would be with completely freetrade in merchandise by causing average real export prices of numerous farmproducts to rise at least part way toward where they would be in internationalmarkets under free trade (figure 1). For other products where export supplies expandmore easily, it is the volume of global exports that would rise, rather than theirprice. This is true particularly for the most-protected farm products—rice, sugarand beef (figure 2a). The percentage increases in developing-country exports of

DOHA POLICIES
51
those products would be even larger. Cotton export volume would rise more than16 percent (figure 2b).
Of particular interest to trade negotiators are changes in bilateral trade.Negotiators want to see the extent to which an exchange of market access will be“balanced.” Under Scenario 4, developing countries expand their exports ofagricultural and textile products to high-income countries more than they expandtheir imports of such products from high-income countries. But the opposite is trueof other manufactures, so that for merchandise trade in total the difference is notgreat. In f.o.b. terms developing countries would sell $62 billion more to high-income countries in 2015, and would buy $55 billion in return, under Scenario 4(table 4, columns 2 and 3). This small gap might be tolerated by high-income countries
Scenario 4Ag+nonag (SDT)
High-income –74.6 –34.2Developing 35.6 24.8 Middle-income 45.3 20.9 Low-income –9.7 3.9 East Asia and Pacific 5.5 3.9 South Asia –18.1 1.2 Europe and Central Asia –4.5 –0.3 Middle East and North Africa 0.3 1.0 Sub-Saharan Africa 4.3 1.1 Latin America and the Caribbean 45.0 16.7World –39.0 –9.5
Scenario 4Ag+nonag (SDT)
High-income –19.4 –8.9Developing 2.9 2.0 Middle-income 5.3 2.4 Low-income –2.5 1.0 East Asia and Pacific 1.1 0.8 South Asia –6.8 0.5 Europe and Central Asia –4.0 –0.3 Middle East and North Africa 0.3 0.9 Sub-Saharan Africa 6.7 1.8 Latin America and the Caribbean 27.4 10.2World –2.4 –0.6
Full global liberalization
US$ billions, 2001
Percent change
Full global liberalization
Changes in value added relative to baseline
Table 4. Impact of reform scenarios on agricultural value added, 2015
Source: Authors’ simulations using World Bank Linkage model.

TRADE, DOHA, AND DEVELOPMENT: A WINDOW INTO THE ISSUES
52
as a concession to development, but if necessary it could be narrowed throughgreater developing-country reform in goods or by having developing countriesgive more than they get in the opening of trade in services.
Implications for developing countries: What’s important?Among the many policy implications of our analysis, several are worth highlighting.First, with so much to be gained from implementing the July 2004 FrameworkAgreement (global gains of $95–120 billion per year, or more if dynamic gains aretaken into account), the political will must be found to bring the Doha Round to asuccessful conclusion, and the sooner the better. Multilateral cuts in tariff bindingsare helpful because they lock in previous unilateral trade liberalizations thatotherwise would remain unbound and hence vulnerable to reversals to higherprotection; they also can be used as an opportunity to multilateralize previouslyagreed preferential trade agreements, thereby reducing the risk of trade diversioncaused by those agreements.
Second, agricultural reforms need to be significant if the Doha agreement is tobe pro-development and pro-poor. Outlawing agricultural export subsidies is theobvious first step. Doing so will bring agriculture into line with the basic GATTrule against such measures and, in the process, limit the extent to which governments
Table 5. Gains in bilateral trade flows from Doha Scenario 4, 2015Difference in bilateral trade flows at FOB prices compared to baseline
(US$ billions)
Note: Aggregations exclude intra-EU trade.Source: Authors’ simulations using World Bank Linkage model.
ExporterWorld High-income countries Developing countries
Agricultural products World 56 46 9 High-income 15 15 0 Developing 41 31 10Textiles and clothing World 41 28 12 High-income 16 5 11 Developing 25 23 2Other manufactures World 117 68 49 High-income 105 60 44 Developing 12 8 5Total World 213 142 71 High-income 135 80 55 Developing 78 62 16
Importer

DOHA POLICIES
53
-5
0
5
10
15
20
25
Cotton Oil seeds Coarse grains Dairy Apparel Cars andparts
Full liberalization
DDA
Figure 1. Effects of Doha Scenario 4 compared with full tradeliberalization on world product prices, 2015
(percentage change in the average price)
Source: Authors’ simulations using World Bank LINKAGE model.
Figure 2a. Effects of Doha Scenario 4 compared with full tradeliberalization on global export volumes, 2015
0
20
40
60
80
100
120
140
160
180
Rice Sugar Oils/fats Beef Apparel Cars andparts
Full liberalization
DDA
(percentage changes)

TRADE, DOHA, AND DEVELOPMENT: A WINDOW INTO THE ISSUES
54
Figure 2b. Effects of Doha Scenario 4 compared with full tradeliberalization on export volumes for developing countries, 2015
(percentage changes)
0
50
100
150
200
250
Rice Sugar Oils/fats Beef Apparel Cars andparts
Cotton
Full liberalization
DDA
Source: Authors’ simulations using World Bank LINKAGE model.
encourage agricultural production by other means (since it would remove oneoption for, and hence raise the cost of, surplus disposal). Concurrently, domesticsupport commitments must be cut very substantially to reduce binding overhang.In so doing, the countries with the highest subsidies need to reduce their support,not just for the sake of their own economies, but also to encourage developingcountries to reciprocate by opening their markets as a quid pro quo. Even moreimportant, agricultural tariff bindings must be cut drastically—so that some genuinemarket opening can occur. Allowing lesser cuts for even just a few “sensitive” and“special” farm products would greatly reduce the gains from reform, given thetariff peaks currently in place. If it turns out to be politically impossible not todesignate some products as “sensitive” and “special,” it will be imperative toimpose a cap, so that bound tariffs in excess of the cap, regardless of the productinvolved, would have to be reduced.
Third, expanding nonagricultural market access at the same time as reformingagriculture is essential for a balanced exchange of “concessions”—and more thantextiles and clothing must be involved. The additional benefits of including othermerchandise and services in a liberalization deal are that the resulting tradeexpansion would be many times greater for both rich and poor countries and thewelfare gains substantially larger for developing countries.

DOHA POLICIES
55
Fourth, South–South “concessions” also are needed, because half of thepotential benefits to developing countries are to be gained from trade within thedeveloping world. That means reconsidering the extent to which developingcountries liberalize. They are trading much more with each other now than in the1980s and now stand to benefit most from reforms in their own regions. Even leastdeveloped countries should consider reducing their binding overhang. Doing soin the context of the Doha Round allows them to demand more concessions(compensation for erosion of preferences or other damage to their terms of trade),something they will not get if they hang on to the opportunity, provided in the JulyFramework, not to engage in reform.
What emerges from our analysis is that developing countries would not haveto reform very much under the most likely Doha deals, because of the large gapsbetween their tariff bindings and applied rates. But to realize more of their potentialgains from trade, they would need to commit to additional trade (and complementarydomestic) reforms. High-income countries could encourage them to commit togreater reform not only by being willing to widen access to their own markets butalso by providing more targeted aid. To that end, a new proposal has been putforward to reward developing-country commitments to greater trade reform withan expansion of trade-facilitating aid. The new aid would be provided by a majorexpansion of the current Integrated Framework, operated by a consortium ofinternational agencies for least developed countries (Hoekman and Prowse 2005).This proposal may provide an attractive path for developing countries seeking totrade their way out of poverty. It also is potentially a far more efficient way fordeveloped countries to assist low-income countries than the current systems oftariff preferences.10
Notes1. The authors are grateful for the collaboration of numerous colleagues, especially Tom Hertel,and for research funding from the UK Department for International Development. The viewsexpressed here are the authors’ alone. More detailed analysis is can be found in Anderson,Martin, and van der Mensbrugghe (2006a), available at www.worldbank.org/trade/wto.2. The baseline scenario is a projection of the global economy between 2001 and 2015 thatincludes some major policy changes—among them the European Union’s recent expansion to25 members, China’s WTO accession commitments, the elimination of the quotas on trade intextile and apparel, and final implementation of the other Uruguay Round commitments. Thesepolicy changes are phased in between 2001 and 2005. All other policies are fixed at their initiallevels.3. Van der Mensbrugghe (2005) compares the global gain of $287 billion with past World Bankestimates and with other widely cited simulation results.

TRADE, DOHA, AND DEVELOPMENT: A WINDOW INTO THE ISSUES
56
4. Other potential channels link trade openness and productivity. See Anderson, Martin, andvan der Mensbrugghe (2006b) for an overview.
5. More detail on the July 2004 Framework and the importance of the three pillars is availablein Anderson, Martin, and Valenzuela (2005).
6. The aggregate measure of support (AMS) is a summary indicator of the level of supportaccorded a sector and notified by member countries to the WTO.
7. We use World Bank definitions of developing countries. Thus the high-income countriesinclude protective Republic of Korea and Taiwan (China) as well as Hong Kong (China) andSingapore.
8. For more details of our results for Sub-Saharan Africa, see Anderson, Martin, and van derMensbrugghe (2005c).
9. The remainder of the discussion focuses on Scenario 4. This scenario reflects perhaps themost positive reading of the July 2004 Framework—though other positions have been set forththat reflect even greater reforms—and without the potential eviscerating effects of sensitiveand special product exemptions.
10. See also Nielson (2005) in this volume for more on the aid-for-trade agenda.
ReferencesHoekman, B., and S. Prowse. 2005. “Policy Responses to Preference Erosion: From Trade as
Aid to Aid for Trade.” Paper presented at the World Bank Conference on Preference Erosion:Impacts and Potential Policy Responses, Geneva, June 13–14.
Nielson, J. 2005. “Aid for Trade.” In Trade, Doha and Development: A Window into the Issues,ed. R. Newfarmer. Washington, DC: World Bank.
WTO. 2003b. “Negotiations on Agriculture: First Draft of Modalities for the Further Commit-ments” (Harbinson Draft). TN/AG/W/1/Rev.1. Geneva. March.
_____. 2004. “Decision Adopted by the General Council on 1 August 2004” (July FrameworkAgreement). WT/L/579. Geneva. August.
Further readingAnderson, K., and W. Martin. 2006a. “Agricultural Trade Reform and the Doha Development
Agenda.” Policy Research Working Paper 3607. World Bank, Washington, DC. WorldEconomy 28(9):1301-27. September.
———. 2006b. “Agricultural Market Access: The Key to Doha Success.” Trade Note 23,World Bank, Washington, DC. July.
Anderson, K., W. Martin, and E. Valenzuela. 2005. “On the Relative (Un-)Importance ofAgricultural Subsidies versus Market Access in the WTO’s Doha Round.” Processed,Washington, DC: World Bank.
Anderson, K., W. Martin, and D. van der Mensbrugghe. 2006a. “Market and WelfareImplications of the Doha Reform Scenarios.” In Agricultural Trade Reform and the DohaDevelopment Agenda, ed. K. Anderson and W. Martin (chapter 12). New York: PalgraveMacmillan.
———. 2006b. “Global Impacts of the Doha Scenarios on Poverty.” In Putting DevelopmentBack into the Doha Agenda: Poverty Impacts of a WTO Agreement, ed. T. Hertel and L. A.Winters (chapter 17). New York: Palgrave Macmillan.
———. 2006c. “Would Multilateral Trade Reform Benefit Sub-Saharan Africa?” Policy ResearchWorking Paper 3616, World Bank, Washington, DC, June. Forthcoming in the Journal ofAfrican Economies.

DOHA POLICIES
57
Hoekman, B., and S. Prowse. 2005. “Policy Responses to Preference Erosion: From Trade asAid to Aid for Trade.” Paper presented at the World Bank Conference on PreferenceErosion: Impacts and Potential Policy Responses, Geneva, June 13–14.
Nielson, J. 2005. “Aid for Trade.” In Trade, Doha and Development: A Window into theIssues, ed. R. Newfarmer. Washington, DC: World Bank.
van der Mensbrugghe, D. 2005. “Estimating the Benefits of Trade Reform: Why NumbersChange.” In Trade, Doha and Development: A Window into the Issues, ed. R. Newfarmer.Washington, DC: World Bank.
WTO (World Trade Organization). 2003a. “Negotiating Group on Market Access: Report bythe Chairman” (Girard Text). TN/MA/12. Geneva. September.
———. 2003b. “Negotiations on Agriculture: First Draft of Modalities for the FurtherCommitments” (Harbinson Draft). TN/AG/W/1/Rev.1. Geneva. March.
———. 2004. “Decision Adopted by the General Council on 1 August 2004” (July FrameworkAgreement). WT/L/579. Geneva. August.


Estimating the Benefits of Trade Reform: WhyNumbers Change
Dominique van der Mensbrugghe
4
Much attention has been paid to the World Bank’s analyses of multilateraltrade reform. According to our latest estimates, full liberalization of worldmerchandise trade would increase global income in 2015 relative to the
baseline by $290 to $460 billion, with higher percentage gains for developingcountries (0.8 to 2.0 percent) than for high-income countries (Anderson and others2005). These numbers are significantly lower than earlier World Bank estimates(World Bank 2001, 2003), which put the global gains of full merchandise tradereform at some $400 billion per year in 2015. This note examines why the numbers ofhave changed and, more generally, why estimates of gains from reformcan vary widely.
The answer lies in a mixture of factors: new data on tariffs, incorporation ofrecent major reforms in trade policy (notably in China), inclusion of preferentialtrade arrangements, and new poverty elasticities with respect to growth. Beyondthese methodological issues, it is important to distinguish the scenario underanalysis—whether it is full liberalization (the basis of all calculations and thebenchmarks of this note) or partial reforms; whether the analysis is static or dynamic(and includes a productivity response); and whether the scenario includes services(which are usually omitted).
Underlying most estimates are many assumptions that can result in grossover- or underestimates of the effects of merchandise trade reform. As factorscontributing to overestimation in the World Bank estimates (and common to manyother studies) one might cite the optimistic supply response, the optimism embodiedin the baseline,1 the failure to take into account baseline policy changes and theloss of quota rents, the degree of protection,2 overstatement of the relation betweenincome growth and poverty reduction, and closure effects.3 The assumptions thatmight lead to underestimation include low Armington elasticities and market shares,4
the failure to consider market structure (procompetition effects) and scale economies,neglect of positive productivity effects, and product aggregation. As well, thebaseline may bias the estimate downward, as it probably understates the increasein trade openness—even with constant trade policies—as the global economypushes forward. Most multilateral trade analyses have also largely ignored reformof services trade, which is generally believed to be highly distorted but is difficultto deal with empirically.
This note introduces the new numbers generated by the World Bank’s globaltrade model, known as LINKAGE.5 The basic model has not undergone any major
59

TRADE, DOHA, AND DEVELOPMENT: A WINDOW INTO THE ISSUES
60
change, but changes in the underlying database and the baseline scenario havealtered key numbers from earlier estimates, though by and large the main findingsstill hold. The next section will describe the key changes to the database andbaseline. This will be followed by a section on the impact of global merchandisetrade reform. A final section will describe how these results line up with some otherprominent exercises.
Changes to the database and baselineGTAP release 6.0Since the early 1990s, global general equilibrium trade models have increasinglyrelied on a single database developed, maintained, and updated by the GlobalTrade Analysis Project (GTAP) located at Purdue University.6 The GTAP databaseis a multisectoral and multiregional global social accounting matrix (SAM). Itintegrates national input–output tables, bilateral trade flows from COMTRADE,and different sources of data on trade protection and domestic support into asingle, consistent global SAM. GTAP has just issued its latest release, 6.0, thatdivides economic activity into 57 sectors and 87 countries and compositeregions—70 of which are individual countries.7 There are two major changes inGTAP6 compared with the previous release. First, it has a new base year—2001rather than 1997. This represents a change in the relative structure of the globaleconomy, with some countries/sectors growing more rapidly than others, and alsogreater trade, since growth in trade generally outpaces output.8
The second change is the source of GTAP’s protection data. Whereas in thepast protection data generally came from TRAINS/IDB and, for agriculturalprotection, the Agricultural Market Access Database, the new data comes mostlyfrom MAcMap—a joint product of the Centre d’Etudes Prospectives etd’Informations Internationales in Paris (CEPII) and the International Trade Centre(ITC) in Geneva.9 MAcMap is the result of a huge effort to provide a morecomprehensive picture of trade protection. The database is collated at the HarmonizedTariff System 6-digit level and incorporates preferential arrangements—bothreciprocal and nonreciprocal. It also provides the ad valorem equivalent of specifictariffs and an estimate of the tariff equivalent of TRQs. Finally, it contains effectivetariff rates, MFN tariffs, and bound rates. It is thus possible to measure the relativeimportance of preferential access and the “binding overhang” between bound andapplied rates.
In summary, the new database provides a more recent snapshot of the globaleconomy with a 2001 base year instead of 1997 and a more comprehensive pictureof trade protection, particularly through the incorporation of preferences.
The tariff rates on goods under GTAP5 and GTAP6 are summarized in table A-1.The two data sets are not compatible since they come from different sources andreflect the use of different methodology. Thus, even though tariffs in 2001 appear to

ESTIMATING THE BENEFITS OF TRADE REFORM
61
be lower in general than the 1997 assessment, the effect cannot be confidentlyattributed to a lowering of tariff barriers during the four-year interval. Clearly, theincorporation of preferences into the dataset will have made a significant difference.One example is the Middle East and North Africa, where tariffs on agriculture andfood are now evaluated at 14 percent compared with 61 percent in theprevious release.
The largest modifications have been made to tariffs on agriculture and food. Atthe global level they are down nearly 10 percentage points from GTAP5 to GTAP6,and this holds across both developed and developing regions. The changes in themanufacturing sectors are much less pronounced, with a drop of some 2.5 percentagepoints in textile and clothing and about 1.5 percentage points for all other goods.
These apparent tariff changes suggest that assessments of the gains fromglobal reform should be reduced from those devised on the basis of the GTAP5database. The expected gains from agricultural reform—as a contributor to theoverall gains—also should be reduced. Two factors, however, could influence theresults in the other direction, toward greater gains. First, the size and structure ofthe global economy, different in 2001, could raise the overall gains from trade reform.In particular, the most heavily protected economies have been growing more rapidlythan the less protected, while trade has advanced more rapidly than output. Second,the average tariffs may conceal higher peak tariffs the replacement of which couldproduce larger gains than might appear in estimates prepared on the basis ofaverage tariffs.
Baseline reformsThe current analysis, like past analyses, is predicated on a baseline scenario that takesthe global economy from the base year, now 2001, though a future year, typically 2015.The baseline scenario relies on a number of assumptions—most related to supply-sidevariables such as labor supply, savings behavior (and hence capital stocks), andproductivity. The baseline can also incorporate changes to policies, which, in pastexercises, were fixed at their base-year levels, with no change in tax or subsidy rates.10
The new baseline incorporates some policy changes that reflect some (but notnecessarily all) existing commitments. The major commitments include theimplementation of the final phases of the Uruguay Round, including the elimination ofthe textile and clothing quotas,11 the expansion of the European Union to include the10 new member countries, and the commitments made by China in its WTO accessionagreement. Of these elements, the most significant are China’s commitments and theremoval of the textile and clothing quotas. Their impact will be described below. China’stariffs on agriculture and food are estimated to be reduced by nearly three-quarters (38 percent to 10 percent) and in manufacturing by 50 percent (19 percent to10 percent in textiles and clothing and 11 percent to 5 percent in other sectors).

TRADE, DOHA, AND DEVELOPMENT: A WINDOW INTO THE ISSUES
62
Global trade reformGlobal welfareThe new estimate of the global welfare impact from full merchandise tradereform—including the elimination of domestic support and export subsidies—is$287 billion, about 30 percent lower than the previous estimate of $413 billion, whichwas based on GTAP5 (figure 1). Under the new scenario, developing countriesgarner only 30 percent of the global gains in dollar terms, but continue to gain morein percentage terms (relative to their baseline income) than rich countries.
It is possible to decompose the change into three distinct components—thechange in the database, the impact of preferences, and the impact of the baselinepolicy changes. The GTAP database is available with two different tariff structures.The standard database reflects applied tariffs including all preferences—reciprocaland nonreciprocal. The alternative database assumes that the preferential rates arenot used and that imports enter under the applied MFN rate. This latter database,which assumes zero utilization of preferences, is closer than the new standard tothe last release of the GTAP5 database.
Note: The three right columns are all based on the GTAP6 data base. MFN assumes applicationof MFN tariff rates. Pref assumes application of preferential tariff rates. Baseline includespreferential tariffs and existing policy commitments, such as China’s WTO accession andelimination of the textile and clothing quotas. The “Baseline” column represents the WorldBank’s current baseline estimate of the gains from full merchandise trade reform.
Source: World Bank simulations.
Figure 1. Global gains from full merchandise trade reform undervarious scenarios
0
50
100
150
200
250
300
350
400
450
GTAP5 MFN Pref Baseline
High-incomecountries
Developingcountries

ESTIMATING THE BENEFITS OF TRADE REFORM
63
In dollar terms, assuming the MFN tariff rates obtain, global gains decline from$413 billion in 2015 to $382 billion. While it would be easy to justify the decline bydeclaring that it reflects reforms undertaken between 1997 and 2001, it is not possibleto make this statement simply by comparing tariff schedules between GTAP5 andGTAP6, because the tariff data have been processed using different methodologies.There are two ways to assess the level of reform between 1997 and 2001. The mostconvincing would be tariff line by tariff line—though the problem of aggregationcannot be ignored if some lines show an increase and others a decrease. Thesecond would be to reproduce a tariff database using the same methodology aswas used in the construction of GTAP5. With this caveat in mind, had there been notariff reform one would expect the global gains to increase between 1997 and 2001,for two reasons. The first is inflation—though the change in exchange-ratevaluations makes this explanation less than straightforward. The second is theincrease in trade openness in most regions, as trade growth typically outpacesincome growth. This would tend to increase the distortion induced by agiven tariff rate.
On a percentage basis, the global gain, comparing the MFN-based GTAP6 withGTAP5, declines by 0.2 percentage points—from 1.1 percent of baseline income to0.9 percent (in 2015). The gains to developing countries drop by somewhat morethan for high-income countries—from 1.7 to 1.5 percent in the case of the former,and from 0.8 to 0.7 percent in the case of the latter—possibly indicating greatertrade reform in developing countries.
A subsequent scenario—using the standard preference-inclusive GTAP6database—shows the impact of assuming full utilization of available preferences.In this case, the dollar gains from full liberalization drop to $341 billion (from $382billion). For developing countries, this implies a gain of 1.1 percent from fullmerchandise trade reform—a rather substantial drop from the gains that appearwhen using the MFN-based tariffs (1.5 percent) and from GTAP5 (1.7 percent)—whichbasically assumed MFN tariffs. For the rich countries, there is relatively no impactfrom assuming application of the preference-based tariffs.
Finally, our new standard baseline also includes quantifiable policy-reformcommitments—final implementation of the Uruguay Round, including eliminationof apparel and textile quotas, expansion of the European Union to 25 countries, andChina’s WTO accession commitments. This brings the estimate of the global gainsfrom merchandise trade reform to $287 billion in 2015—equivalent to a gain in globalincome of 0.7 percent. It also further reduces the gains for developingcountries—with the overall gains now at only 0.8 percent of their baselineincome—or nearly one-half of the estimate obtained using GTAP5. The mostsignificant drop is for China, which sees its gain fall from 0.6 percent to only 0.2percent, because the substantial gains from WTO accession are already reflected inthe baseline.

TRADE, DOHA, AND DEVELOPMENT: A WINDOW INTO THE ISSUES
64
One must not conclude from the downward revision of the gain that merchandisetrade reform is less important today than it was a year or two ago. First, the lowerprojected gains reflect gains already secured between 1997 and 2001, as well asthose anticipated from existing commitments. Second, the counterfactual scenarioagainst which the new full-reform scenario is being compared is one of consolidatedgains. However, a failure to complete the Doha negotiations or a rise in trade tensionscould lead to backsliding in trade policy commitments. In agriculture, the richcountries have hardly curtailed domestic support even as they have carried outtheir commitments to the letter. And though the apparel and textile quotas are nowhistory, there is strong pressure to prevent the structural changes most analystshad predicted would occur from the phaseout. Finally, there is currently no strongdomestic constituency for reform in the key stakeholder states that have movedmultilateral liberalization forward in the past.
Regional impactsThe impacts of the various baseline assumptions vary across regions (figure 2).Moving from the MFN tariff rates to the preferential rates has significant impactsfor Bangladesh, the Middle East and North Africa, and Sub-Saharan Africa, amongothers. In Africa, the selected Sub-Saharan countries (SSS) regional grouping thatincludes an eight-country aggregation of small countries sees its global gains dropby 55 percent when the preferential tariff data base is used rather than the MFN-based data base. Bangladesh would actually suffer a loss from global merchandisetrade reform against a baseline scenario that incorporated preferential tariffs, be-cause it derives such significant benefits from existing preferences.
The World Bank’s final baseline scenario—using the preferential tariffs andincorporating commitments—has different implications in different regions. ForChina, and the East Asia and Pacific region in aggregate, the incorporation of policycommitments lowers significantly the gains from global reform since a sizeableportion of the reform gains will be reflected in the baseline scenario. South Asia isalso affected by the baseline policy changes—but in different ways. India gainsless from global reform when the policy commitments are incorporated in the baseline,i.e. it derives positive gains from the baseline policy changes. Bangladesh on theother hand sees more gains from global trade reform when the policy commitmentsare included. This signifies that it loses from the policy reforms in the baseline,perhaps a consequence of its loss of quota rents from the eliminationof the quotas on apparel.
DecompositionAt the global and subregional level, nearly two-thirds of the gains against the newstandard baseline are generated by free trade in agriculture and food (table 1). Thispercentage is somewhat higher than with the former baseline; it also reflects a

ESTIMATING THE BENEFITS OF TRADE REFORM
65
relative rotation between the subregions. Under GTAP5, only about 58 percent ofthe global gains came from agriculture. But for developing countries, agriculturerepresented 72 percent of their total gains—of which 53 percent came from theirown liberalization of agriculture. Another way to say this is that of the $177 billionin gain garnered by developing countries in the previous global reform scenario,$94 billion came from their own agricultural reform. With the new baseline—whichincorporates significant reforms already made—the developing countries’ ownagricultural reform generates only $27 billion in (additional) gain—or only aboutone-third of their total gain. The rotation also implies that developing countrieshave about the same amount at stake from rich country reform in agriculture as fromtheir own reform.
Dynamic vs. static effectsAlthough the standard LINKAGE model is dynamic, the dynamic effects of tradereform are relatively limited. They come mainly through two channels. First, highergrowth and incomes raise saving rates and therefore investment and the stock ofcapital. Second, the price of capital goods declines as tariff rates are set to zero.
Percent change in real income in 2015 from global merchandise trade reform
Figure 2. Regional impact of alternative scenarios using GTAP6database
Note: The three columns are all based on the GTAP6 data base. MFN assumes application ofMFN tariff rates. Pref assumes application of preferential tariff rates. Baseline includespreferential tariffs and existing policy commitments, such as China’s WTO accession andelimination of the textile and clothing quotas. The “Baseline” column represents the WorldBank’s current baseline estimate of the gains from full merchandise trade reform.Source: World Bank simulations.
-0.5
0.0
0.5
1.0
1.5
2.0
2.5
3.0
3.5
4.0
Dev
elop
ing
East A
sia
China
South A
sia
Banglad
esh
India
ECA
MENA
SSA
Selec
ted SSA
Res
t of S
SA
Latin
Amer
ica
Brazil
Mex
ico
Baseline
MFN
Pref

TRADE, DOHA, AND DEVELOPMENT: A WINDOW INTO THE ISSUES
66
Source: World Bank simulation.
Table 1. Decomposition of gains from full merchandise tradereform by sector and region
Change in real income in 2015
To developing
To developed Global
To developing
To developed Global
Reform by developing countries
Agriculture and food 28 19 47 33 9 17
Manufacturing 15 66 81 17 33 28
All 43 85 128 50 42 45
Reform by developed countries
Agriculture and food 26 109 135 30 54 47
Manufacturing 17 7 24 18 3 8
All 43 116 159 50 57 55
All countries liberalize:
Agriculture and food 54 128 182 63 64 63
Manufacturing 32 73 105 37 36 37
All 86 201 287 100 100 100
Reform by developing countries
Agriculture and food 94 41 135 53 17 33
Manufacturing 6 135 141 4 57 34
All 100 176 276 57 75 67
Reform by developed countries
Agriculture and food 34 68 102 19 29 25
Manufacturing 43 –8 35 24 –3 8
All 77 60 137 43 25 33
All countries liberalize:
Agriculture and food 128 109 237 72 46 57
Manufacturing 49 127 176 28 54 43
All 177 236 413 100 100 100
GTAP5 standard baselineBillions of dollars Percent of regional gain from total
Allocation of gains
GTAP6 standard baselineBillions of dollars Percent of regional gain from total

ESTIMATING THE BENEFITS OF TRADE REFORM
67
Therefore countries obtain more from the same nominal level of investment. If theaverage tariff on capital goods is 10 percent and all capital goods are imported, thenthe investment rate climbs by 10 percent with tariff reform (assuming no change innominal savings)—a “static” dynamic gain.12 The final section of this note com-pares static dynamic gains with the comparative static version of the model. Itshows that static dynamic gains raise the global gain from merchandise trade re-form by roughly 23 percent with respect to the pure comparative static gains.
In an alternative scenario, we allow productivity to be influenced by changesin trade. In a true endogenous growth model, changes in productivity would beinfluenced by changes in research and development and by the technology embodiedin imports, either better intermediate inputs (such as agricultural chemicals andseeds) or better equipment. Other channels also have been identified in the literatureas possibly affecting productivity. Among these are the procompetitive effects ofimports (for example, through rationalization and scale economies), and theprocompetitive effects of exporting (learning by doing, matching internationalstandards, overcoming threshold effects, and so on). We have chosen to illustratedynamic effects through the latter channel (procompetitive effects of exporting) byassuming that a share of productivity can be explained by a trade openness measuredefined by the sectoral ratio of exports to output. This is calibrated in the baselinesimulation. In the corresponding shock simulation, productivity will increase withthe export-to-output ratio.13 For manufacturing, the elasticity is set at 1; foragriculture, one-half.14
The productivity assumption leads to a sizeable increase in the gains fromtrade reform, particularly for developing countries (table 2). At the global level, thegains from trade increase from $287 billion to $461 billion—a rise of 1.1 percent inglobal income compared to 0.7 percent with static gains alone. But for developing
Table 2. Full liberalization of global merchandise trade, withoutand with productivity growth, 2015
Source: World Bank Simulations.
US$ billions Percent
US$ billions Percent
High-income countries 202.0 0.6 261.0 0.8Developing countries 86.0 0.8 200.0 2.0Middle-income countries 70.0 0.8 145.0 1.8Low-income countries 16.0 0.8 55.0 2.8World total 287.0 0.7 461.0 1.1
Change in real income in 2015 relative to baselineFixed productivity Flexible productivity

TRADE, DOHA, AND DEVELOPMENT: A WINDOW INTO THE ISSUES
68
countries, the gains rise from 0.8 percent to 2.0 percent and from $86 billion to $200billion. The main reason the dynamic gains are so much higher for developingcountries is that their tariffs are considerably higher, thus the changes in tradestructure will be greater. And even if agricultural distortions are high in rich countries,agriculture as a share of GDP is much lower; therefore the increase in productivityin agriculture has less impact, economy-wide, than in developing countries. Low-income countries gain the most on a percentage basis, because on average theyhave the highest tariff levels.
The dynamic gains are lower in relative terms compared to previous WorldBank estimates (2001, 2003). Developing countries’ gains are 2.3 times higher in thenew estimates, compared with 3.2 times higher in previous estimates (World Bank2001). There are two main reasons. The first is consistent with what has alreadybeen developed: The combination of lower base-year tariffs and incorporation ofpreferences and policy changes has lowered trade barriers from the levels estimatedpreviously. One therefore anticipates fewer policy-driven changes in the export-to-output ratio and in the resulting changes in productivity. This is particularly true inagriculture, especially in China, from which a significant portion of the dynamicgains were coming. Those productivity gains are now captured in the baselinesimulation. The second reason is because we have lowered from 0.75 to 0.5 theelasticity of productivity and trade openness in agriculture from the previous level.
Poverty impactsThe linkages between trade and poverty are complex. The theoretical aspects ofthose linkages are developed in detail in McCulloch and others (2001). Hertel andWinters (2005) contains an impressive number of country case studies. The simplestway to abstract the relationship is to derive the trade-induced change in GDP andthen apply the so-called poverty elasticity to determine the change in the headcountindex and then the number of poor. That operation assumes no change in thedistribution of income. In previous World Bank estimates (2001, 2003), and in thisnote, we use a modified version of this simple approach. We equate the rise in theincome of the poor to the food wage of unskilled workers—departing from theassumption of distribution neutrality. (Given the comparative advantage ofdeveloping countries in unskilled goods, unskilled wages usually will rise morethan other factor prices.) We also take the price of food and clothing as the relevantprice index for most households, because food and clothing are their mainconsumption items.
Under these assumptions, and given a baseline poverty forecast and incomepoverty elasticity, the number of poor living on $1 a day or less would drop by 32million with global merchandise trade reform, compared to the baseline forecast of622 million, or a global reduction of roughly 5 percent (table 3). For the $2 a daypoverty line, the drop in the number of poor would be 66 million people, compared

ESTIMATING THE BENEFITS OF TRADE REFORM
69
Table 3. Poverty impacts under various scenarios
GTAP6 baseline
Full reform
World Bank (2003)
poverty baseline
With World Bank (2003)
poverty baseline
Plus with World Bank (2003)
change in real wage
Plus with World Bank (2003)
poverty elasticity
Poverty headcount in 2015 (1) (2) (3) (4) (5) (6)
PercentEast Asia and Pacific 0.9 0.8 2.3 2 1.5 1.8Europe and Central Asia 0.4 0.3 1.3 1.1 1.1 1.2Latin America and the Caribbean 6.9 6.6 7.6 7.2 7.4 7.2Middle East and North Africa 0.9 0.7 1.2 1 0.5 0.7South Asia 12.8 12.5 16.4 15.9 15.6 15.3Sub-Saharan Africa 38.4 36 42.3 39.7 38.8 34.5Developing country total 10.2 9.7 12.5 11.8 11.4 10.8
Millions of people Level Change Level
East Asia and Pacific 18.6 2.2 44.1 4.8 15.0 9.7Europe and Central Asia 1.7 0.2 5.9 0.7 0.9 0.5Latin America and the Caribbean 42.9 2.1 45.9 2.2 1.4 2.4Middle East and North Africa 3.5 0.7 4.3 0.8 2.7 1.9South Asia 215.9 5.6 267.8 7.0 12.7 17.3Sub-Saharan Africa 339.5 21.1 365.7 22.7 30.1 67.7Developing-country total 622.0 31.9 733.8 38.2 62.7 99.4
Poverty headcount in 2015
PercentEast Asia and Pacific 11.3 10.1 18.2 16.3 12.2 14.2Europe and Central Asia 5.2 4.8 10.3 9.5 9.4 9.4Latin America and the Caribbean 19.6 19.0 20.5 19.8 20.1 19.4Middle East and North Africa 11.9 10.4 10.2 8.9 5.8 5.8South Asia 54.2 53.6 59.2 58.6 58.1 55.4Sub-Saharan Africa 69.2 66.9 70.7 68.3 67.6 57.6Developing-country total 32.0 30.9 36.4 35.0 33.3 31.6
Millions of people Level Change LevelEast Asia and Pacific 229.8 23.6 354.2 36.4 115.2 77.7Europe and Central Asia 24.7 1.8 47.6 3.5 4.1 4.0Latin America and the Caribbean 121.8 4.1 124.0 4.2 2.6 6.4Middle East and North Africa 45.7 6.0 37.7 4.9 16.2 16.3South Asia 912.2 9.6 968.3 10.2 18.6 62.5Sub-Saharan Africa 612.2 20.4 611.8 20.4 27.1 113.3Developing-country total 1946.3 65.6 2143.6 79.7 183.7 280.2
Change
$1 a day measure
Change
$2 a day measure
Note: Column (1) represents the most recent poverty baseline for 2015. Column (2) representsthe impact of global reform on poverty—in levels for the headcount index, and as a change inthe number of poor in millions. For example, the total headcount index falls from 10.2% inthe baseline to 9.7% after the reform. This translates into 32 million fewer persons livingunder the $1 a day poverty line. Column (3) represents an earlier baseline forecast (WorldBank 2003). Columns (4) through (6) show the changes in poverty from global reform undervarious assumptions: (4) using the previous poverty forecast; (5) using the previous povertyforecast and the previous change in the real wage; and (6) using the previous poverty forecastand the previous change in the real wage and a uniform poverty elasticity of 2.
Source: World Bank Simulations.

TRADE, DOHA, AND DEVELOPMENT: A WINDOW INTO THE ISSUES
70
to a baseline forecast of nearly 2 billion people, a decline of 3.4 percent.These estimates are significantly below similar estimates generated two years
ago (World Bank 2003). Table 3 attempts to reconcile the new estimates with the old.A first key difference is the change in the baseline poverty forecast. This can
be seen by comparing column (3)—the old forecast—with column (1), the currentforecast. The $1 a day poverty forecast for 2015 is down by more than 100 millionpersons, largely because of a revision to the forecasted headcount index, withrelatively sharp declines across all regions.15 Global trade reform applied to thepoverty forecast contained in World Bank (2003) would accentuate, modestly, thedecline in the number of poor (column 4)—for example to 38 million instead of 32million for the $1 a day indicator, with the largest absolute change in the East Asiaand Pacific region.
The second key difference comes from the impact of the shock on the foodwage. Given the change in the dataset—notably the incorporation of preferencesand policy commitments—the change in the food wage under the new dataset andbaseline is smaller than with the previous results.16 Using the change in the foodwage from the previous reports, the change in the $1 a day number of poor from fullreform would be 63 million, not 38 million; and 184 million versus 80 million for the$2 /day indicator.
In the new estimate, we use a revised and region-specific set of income-povertyelasticities. In previous reports, we used a uniform world average17—initially forlack of better information. The regional $1/day poverty elasticities are more varied,ranging from around 0.9 for Sub-Saharan Africa to over 3 for East Asia. For $2/day,the global elasticity is less than 2, and the range is from 0.5 in Sub-Saharan Africa to2.0 in East Asia. Column (6) shows the impact of using a uniform elasticity of 2rather than the region-specific elasticities. For the $1/day poverty line, the numberof poor lifted out of poverty by global trade reform would rise to nearly 100 million.
Of the three changes in the new poverty-impact estimate, the single mostimportant—at the global level—is the change to region-specific elasticities, followedby the change to the impact on the food wage, with the change in the povertyforecast playing only a modest role. The change to region-specific elasticities isparticularly important in the context of a dynamic scenario. Given that poverty willbe reduced significantly in East Asia, where the income-poverty elasticity is alsohighest, the average poverty elasticity—weighted by the number of poor—isdeclining over time as the number of poor becomes more concentrated in low-elasticity regions.
This also raises the important relevance of the time dimension in modelingtrade reform. The poverty impacts will depend crucially on assumptions about thebaseline level of poverty. If, for example, a comparative static model is used, and thechanges to poverty are calculated relative to the base-year level of poverty—say2001—then the number of poor lifted out of poverty will be much higher than in a

ESTIMATING THE BENEFITS OF TRADE REFORM
71
realistic forward-looking scenario, where the number of poor in many regions willbe much lower in the baseline. In the case of China, using the base year povertylevel would imply a reduction of the number of poor of 14.4 million, versus only 1.2million in our standard forward-looking forecast.
Comparison with GTAP-based modelsOne of the most widely used models for trade policy analysis is the one developedand supported by GTAP and known as the GTAP model.18 In many respects it isquite similar to the Bank’s LINKAGE model. Most studies using the GTAP modelimplement the model in comparative static mode, in which there is no time dimen-sion and typically all factor stocks are maintained at their base-year levels. A policyshock involves perturbing one or more policy instruments, re-solving for the newequilibrium, and then comparing the results of the policy simulation with the baselinedata. (The baseline data may include a so-called presimulation shock, such asChina’s WTO accession commitments.)
Model parameters are typically chosen to reflect some medium- or long-termhorizon. For example, capital mobility may be fairly restricted for a medium-termhorizon, but fairly free if the analyst has a longer-term horizon in mind, that is, onewhere adjustments have time to work themselves out.
In order to compare LINKAGE and GTAP model results, we must simulate LINKAGE
as a comparative static model. This has two effects. First, the dollar-based resultswill be smaller because they will reflect the economy of 2001 and not that of aprojected 2015. Second, the results will tend to be smaller because dynamic effectsare ignored. The comparative static simulation is run with different sets of parametersto show the influence of those parameters and to converge toward a behavioralmodel that is close to the GTAP model.
The model runs test the influence of two key sets of parameters. The first arethe Armington parameters, which measure the degree of substitution betweendomestic goods and imports. The second set reflects the degree of mobility of land.The standard LINKAGE model uses its own set of Armington trade elasticities thathave evolved over time based on previous studies, but that have been more or lessconstant over the last few years (and in recent World Bank estimates). Thoseelasticities are in the mid-to-high range of those used in global models—between 4and 6. GTAP has revised its Armington elasticities upward—they had been in the2–4 range. The new estimates are based on more recent econometric evidence andare closer to the LINKAGE elasticities.19 The LINKAGE elasticities are still higher—anaverage of 35 percent overall. All else equal, this will raise the gains from globalreform relative to the GTAP model.
On land mobility, GTAP assumes a relatively low degree of land transformation.20
GTAP has a transformation elasticity of 1, whereas the default assumption in LINKAGE
is perfect mobility. LINKAGE moreover allows the overall land supply to fluctuate

TRADE, DOHA, AND DEVELOPMENT: A WINDOW INTO THE ISSUES
72
with land prices—with low supply elasticities for countries with land constraints.We first scale back the dynamic gains to the 2001 base year to make comparisons
easier. The so-called static gain of $287 billion in 2015—from the standard dynamicscenario—is equivalent to $156 billion relative to the 2001 economy.21 The regionalimpacts will not add up to the global because the regions are growing at differentrates in the baseline. The second column of table 4 shows the impact of globalmerchandise trade reform in a pure comparative static framework, but using thestandard LINKAGE elasticities. A comparison of columns 1 and 2 provides anassessment of the static dynamic gains. Essentially, these come from two sources.The first is the increase in savings and investment generated by higher growth anda reduction in the price of capital goods (from the elimination of tariffs), whichcombine to raise the capital stock and therefore contribute to the dynamic gains.The second effect comes from the nature of the dynamic baseline itself. The baselinehas countries growing at different rates, assumes an increase in the trade-to-GDPratio, and incorporates other structural changes that would tend to increase thegains from trade reform over time, particularly for developing countries, where thecomparative static gains are considerably lower than the static dynamic gains.
The impact of using the GTAP trade elasticities is shown in the third column oftable 4. Given that these are lower than the standard LINKAGE elasticities, one wouldanticipate a decline in the gains from global trade reform. The global gains are about30 percent lower, but the gains to developing countries are lower by 55 percent.Lowering land mobility, in addition to the lower Armington elasticities in column 4,eviscerates the gains to developing countries, with three of the six regional aggregates
Table 4. Global merchandise trade reform in a comparative staticframework
Source: World Bank simulations.
Scaled dynamics
Comparative static
GTAP trade
elasticities
+GTAP land
elasticity(1) (2) (3) (4)
High-income countries 109.8 103.7 77.9 75.8Developing countries 43.9 23.7 10.6 2.0East Asia and Pacific 9.4 6.9 3.7 0.6South Asia 2.2 –1.2 –2.1 –1.5Europe and Central Asia 3.5 3.9 2.3 1.9Middle East and North Africa 8.1 3.8 2.2 1.6Sub-Saharan Africa 2.8 0.7 0.2 –0.1Latin America and the Caribbean 17.9 8.1 4.0 –0.5World 156.4 127.4 88.5 77.8

ESTIMATING THE BENEFITS OF TRADE REFORM
73
showing losses. Reducing land flexibility lowers the ability of some of the developingregions to respond to new agricultural market opportunities—particularly Sub-Saharan Africa and Latin America.
ConclusionsThis note describes some of the key changes to the World Bank’s assessment ofglobal merchandise trade reform over the last year and compares those changeswith earlier assessments. Our assessment of the gains from global merchandisetrade reform—global and regionally—are lower now for two main reasons:1) Adoption of a new base year incorporating reforms between 1997 and 2001.2) The baseline scenario now accounts for the use of trade preferences and for
significant policy reforms—notably, elimination of the apparel and textile quo-tas and China’s WTO accession commitments.These two factors have different effects across developing countries. The
incorporation of preferences lowers the estimate of overall gains from global reformfor countries in Sub-Saharan Africa and other low-income countries, whereas incor-poration of policy reforms in the baseline largely reduces estimated gains to China.
Perhaps inevitably, the focal point of trade analysis has been the so-called welfaregain (or gain in real income). But therein lies a frustration, since so many other factorsare changing—most of which have more policy relevance than the overall gains. Forexample, identifying who wins and who loses will drive the political dynamics of trade
Table A1. Average tariffs—GTAP5 versus GTAP6
Note: Averages are weighted using import shares. EU average excludes intra-EU trade.
Percent
GTAP5 GTAP6 GTAP5 GTAP6 GTAP5 GTAP6 GTAP5 GTAP6World average 27.2 16.7 12.8 10.2 5.5 4.2 7.5 5.2High-income 26.6 16.0 10.1 7.5 2.9 1.9 4.8 2.9Australia, Canada, New Zealand 15.9 7.4 13.1 10.7 2.2 1.9 3.0 2.3United States 10.8 2.4 11.2 9.8 2.4 1.8 2.9 1.8European Union 22.4 13.9 10.4 5.2 4.2 2.2 6.0 3.2Japan 50.3 29.4 11.6 9.7 1.6 1.4 9.2 5.2
Korea and Taiwan 49.4 55.0 7.6 9.2 5.7 4.1 8.8 7.6Developing countries 28.1 17.7 18.5 17.0 10.6 9.0 12.5 9.9East Asia and Pacific 27.8 26.3 22.7 17.8 10.9 9.3 12.2 10.5China 38.8 37.6 24.1 19.4 13.8 12.1 15.6 13.6South Asia 24.4 33.9 29.5 20.1 24.9 22.0 24.8 23.5India 25.9 50.3 29.2 26.6 21.7 25.6 22.0 28.1Europe and Central Asia 18.5 14.8 12.7 10.7 7.4 4.8 8.8 6.0Middle East & North Africa 61.0 14.1 20.2 27.1 10.9 9.1 18.2 9.8Sub-Saharan Africa 27.5 18.2 23.7 23.7 13.1 11.6 14.7 12.6Latin America and Caribbean 16.2 10.3 14.5 11.3 9.7 7.5 10.3 7.7
Agriculture and food
Textile and clothing Other industry
Total merchandise
trade

TRADE, DOHA, AND DEVELOPMENT: A WINDOW INTO THE ISSUES
74
reform more than the overall income gain.22 Digging deep into the model results toelucidate the key mechanisms behind the gains and losses, undertaking sensitivityanalysis to test the robustness of the conclusions to key assumptions, and comparingresults across models will increase our appreciation of the importance of trade reformand improve the credibility of these modeling exercises. Notwithstanding theirlimitations, this class of models has become an important part of the analysis of globalpolicy issues, with trade policy foremost among them.
Notes1. For example, the changing net trade position of Sub-Saharan Africa.2. By ignoring preferences, for example.3. Lump-sum taxation to replace lost tariff revenues is considered to be distortion-free, but it
is not a realistic option in most countries. There will be additional costs to alternative fiscalmeasures.
4. Prohibitive tariffs typically mean that initial trade shares are zero. Most models cannotcreate market shares if the shares are zero initially.
5. The model’s specification is provided in van der Mensbrugghe (2005).6. See www.gtap.org.7. Input–output tables do not exist for the composite regions. They are assigned proto-typical
economic structures scaled to the published national accounts. The trade data accurately reflectsthe information from COMTRADE.
8. There are also valuation changes, because all national data is converted to a single currency,the U.S. dollar.
9. See Bouët and others (2004) for more information.10. The only change was the household direct tax rate, which evolved to maintain a fixed fiscal
deficit. Public expenditures are assumed to grow at the same rate as GDP in the baseline.11. The textile and clothing quotas are implemented using export-tax equivalents. These
introduce a price wedge between the producer price in the source country and the consumer pricein the destination country. However, unlike an import tariff, the revenue accrues to the export-ing country. The wedges have been calibrated to existing information on the price of auctionedquotas.
12. A brief note on terminology: comparative static gains are the gains from global reformbased on the static base-year structure of the economy, i.e. 2001 in the case of GTAP6. The‘static’ dynamic gains are based on a dynamic baseline, in the present case through 2015, whichincorporates changes in the structure of the global economy over a 14-year period. Amongother things, the global economy will be much larger (50 percent if it grows on average by3 percent per annum). We call these ‘static’ dynamic gains because there is no influence of thereforms on productivity. Finally, the ‘dynamic’ gains arise from allowing for a linkage betweenthe reforms and productivity
13. For example, if productivity in a given sector is 2 percent in the baseline and the export-to-output ratio increases by 10 percent in that sector, then sectoral productivity will increase to2.08, an elasticity of 0.4, because only 40 percent of sectoral productivity is linked to openness.
14. The agricultural elasticity is lower than in previous studies. Because the existing empiricalevidence relates to manufacturing, we have made a modest assumption in agriculture by halvingthe elasticity.
15. The poverty forecast relies on two main elements. The first is the long-term economicforecast. This has not changed appreciably over the last few years, although better-than-

ESTIMATING THE BENEFITS OF TRADE REFORM
75
expected performance between 2001 and 2005 has led to some upward revision. The second isthe estimate of the income poverty elasticity. This is constantly evolving as new householdsurveys become available and the methodology is improved.
16. Both the unweighted and population-weighted average change is about 50 percent.17. The standard estimate at the world level is an elasticity of 2; that is, for each percentage-
point increase in developing-country income, the headcount index declines by 2 percent.18. See Hertel (1997) for more details.19. We considered moving to the new GTAP elasticities but decided against doing so for two
reasons. First, the new GTAP elasticities were close enough to the standard LINKAGE elasticities.Therefore, the advantage of comparability of results over time and across LINKAGE model simu-lations outweighed the advantages of using a new set of econometrically estimated parameters.Second, the ranking of some of the new GTAP elasticities were puzzling and raised questionsabout the robustness of the estimates. For example, sugar and oil seeds have a lower substitutionelasticity than other crops or clothing.
20. Both models use a constant-elasticity-of-transformation function to allocate aggregateland across sectors based on relative returns to land.
21. I.e. apply the percentage gain in 2015 to the level of global GDP in 2001.22. See for example Anderson and others (2005).
ReferencesAnderson, Kym, Will Martin, and Dominique van der Mensbrugghe. 2005. “Market and Welfare
Implications of Doha Reform Scenarios.” In Agricultural Trade Reform and the Doha Devel-opment Agenda, ed. Kym Anderson and Will Martin. New York and Washington, DC: PalgraveMacmillan and World Bank.
Bouët, Antoine, Yvan Decreux, Lionel Fontagné, Sébastien Jean, and David Laborde. 2004. “AConsistent, Ad Valorem Equivalent Measure of Applied Protection across the World: TheMAcMap–HS6 database.” CEPII Working Paper 2004-22, Centre d’Etudes Prospectives etd’Informations Internationales, Paris. December.
Hertel, Thomas W. (ed.). 1997. Global Trade Analysis: Modeling and Applications. Cambridge:Cambridge University Press.
Hertel, Thomas W., and L. Alan Winters (eds.). 2005. Putting Development Back into the DohaAgenda: Poverty Impacts of a WTO Agreement. Washington, DC: World Bank.
McCulloch, Neil, L. Alan Winters, and Xavier Cirera. 2001. Trade Liberalization and Poverty:A Handbook. Centre for Economic Policy Research, London, UK.
van der Mensbrugghe, Dominique. 2005. “LINKAGE Technical Reference Document: Version 6.0.”Unpublished paper. Development Prospects Group, World Bank, Washington, DC.
World Bank. 2002. Global Economic Prospects and the Developing Countries 2002: MakingTrade Work for the Poor. Washington, DC: World Bank.
_________. 2004. Global Economic Prospects: Realizing the Development Promise of theDoha Agenda. Washington, DC: World Bank.
_________. 2005. Global Economic Prospects: Trade, Regionalism, and Development, WorldBank, Washington, DC.


Agriculture:The Key to Success of the Doha Round
Kym Anderson and Will Martin
5
Agriculture accounts for almost two-thirds of the economic gains that couldbe obtained by dismantling the present global system of merchandise tradebarriers and farm subsidies. This truth holds for the world as a whole and
for developing countries as a group. Developing countries are therefore right tofocus on agriculture in the Doha Round negotiations.1
To date, the agricultural policies of developed countries have captured most ofthe attention. That is understandable, as many developing countries believe thatthey were shortchanged in the Uruguay Round and are determined to obtain greaterconcessions from developed countries before liberalizing their own markets.However, our modeling suggests that over half of the gains to developing countriesfrom global agricultural reforms would come from liberalization by developingcountries themselves (table 1). This is true for two reasons: first, because agriculturaltariffs are slightly higher in developing than developed countries (18 percentcompared with 16 percent on average in 2001) and, second, because a growingshare of developing country trade is now with other developing countries.
The three pillarsDeveloping countries—among them the G-20—are emphasizing the need for cutsto agricultural subsidies in the developed world, partly because they think that isthe main distortion2 but also because they do not want to lower their own foodimport restrictions. But the focus on subsidies alone is misplaced. Our modelingresults indicate that 93 percent of the welfare gains from removing global distortionsto agricultural incentives would come from reducing import tariffs. Just 2 percent ofdistortion is due to export subsidies and 5 percent to domestic support measures(table 2). It is certainly important to discipline domestic subsidies and to phase outexport subsidies, both to prevent redirection of assistance from tariffs towarddomestic subsidies and to bring agriculture into line with non-farm trade in notusing export subsidies. But to ignore market access in the Doha Round would be toforgo most of the potential gains from trade reform.
The current Doha Round has the advantage of beginning from the frameworkof rules and disciplines agreed in the Uruguay Round Agreement on Agriculture, inparticular, the three clearly identified “pillars” of market access, export subsidies,and domestic support. True, negotiators took more than three years to agree on aframework for the current talks, reached at the end of July 2004, but that agreementnow is likely to guide the negotiations for some time. It therefore provides a strong
77

TRADE, DOHA, AND DEVELOPMENT: A WINDOW INTO THE ISSUES
78
basis for undertaking ex ante analysis of various options potentially available toWTO members during the Doha negotiations.
Pondering what might be achievable under a Doha partial reform package, it isclear that the devil will be in the details. For example, commitments on domesticsupport for farmers are currently so much higher than actual support levels that the20 percent cut in the total bound aggregate measure of support (AMS), promised inthe July 2004 Framework Agreement will require no actual reductions in support byany World Trade Organization (WTO) member. A cut of 75 percent in bound AMSlevels would be needed to get some action from those countries that provide themost domestic support; and even such a cut would produce reductions in 2001levels of domestic support by only four WTO actors: the United States (28 percent),European Union (18 percent), Norway (16 percent), and Australia (10 percent).Because the European Union and Australia have already introduced reforms, theymight not need to make further reductions even with a 75 percent cut in bound levels.
Large cuts in bound rates also are needed to erase substantial binding overhangin agricultural tariffs. The average bound rate in developed countries is almosttwice as high as the average applied rate, and in developing countries the ratio iseven greater (table 3). Thus large reductions in bound rates are needed before it ispossible to bring about any improvements in market access. To bring down theaverage actual agricultural tariff by one-third, bound rates would have to be reducedfor developed countries by at least 45 percent, and by up to 75 percent for thehighest tariffs, under a tiered formula.
Even large cuts in bound tariffs do little if “sensitive products” are exempted.If members succumb to the political temptation to put limits on tariff cuts for themost sensitive farm products, much of the prospective gain from Doha couldevaporate. Even if only 2 percent of agricultural tariff lines (in the 6-digit harmonized
Table 1. Effects on developing country economic welfare of full tradeliberalization by groups of countries and products, 2015 (percent)
Source: Anderson and Martin (2005, Table 4).
Agriculture and food
Textiles and clothing
Other manufactures
Allgoods
Percentage due to:Developed country policies 30 17 3 50Developing countries' policies 33 10 7 50All countries' policies 63 27 10 100
From full liberalization of:
Note: Developed countries include the transition economies that joined the EuropeanUnion in April 2004. The definition of developing countries used here is that adopted bythe WTO. Thus it includes the four East Asian tigers: Hong Kong (China), Korea, Rep.,Singapore, and Taiwan (China).

AGRICULTURE
79
classification, HS6, with around 800 lines for agriculture and food) in developedcountries are classified as sensitive (and 4 percent in developing countries, toincorporate their “special products” demand), and are thereby subject to just a 15percent tariff cut (as a substitute for the tariff rate quota (TRQ) expansion mentionedin the Framework Agreement), the welfare gains from global agricultural reformwould shrink by three-quarters. If at the same time bound tariffs in excess of 200percent had to be reduced to that cap rate of 200 percent, welfare gains wouldshrink by one-third.
Given the high binding overhang of developing countries, relatively fewcountries would have to cut their actual tariffs and subsidies at all, even if tieredformulae were used to make the greatest cuts in the highest bindings. That is evenmore true if “special products” are subjected to smaller cuts. Politically bindingoverhang makes it easier for developing and least developed countries to offer bigcuts on bound rates.
Combining agricultural and nonagricultural market accessExpanding nonagricultural market access would add substantially to the gains fromagricultural reform. Adding a 50 percent cut to nonagricultural tariffs by developedcountries (and 33 percent by developing countries and zero by least developedcountries (LDCs)) to the tiered formula cut in agricultural tariffs would double thegains from Doha for developing countries. That would bring the global gains to $96billion from Doha merchandise liberalization, roughly one-third of the potentialwelfare gains from full liberalization ($287 billion).
These absolute numbers undoubtedly underestimate the actual magnitudes ofprospective benefits. First, merchandise trade liberalization opens domestic marketsto new competition and improved technology. This, together with scale effects
Source: Anderson and Martin (2005, Table 5); Anderson, Martin and Valenzuela (2005).
Table 2. Distribution of global welfare effects of removing allagricultural tariffs and subsidies, 2001 (percent)
a High-income countries include the newly industrialized East Asian economies of Hong Kong(China), Korea, Rep., Singapore, and Taiwan (China) as well as the transition economies thatjoined the European Union in April 2004.
Agricultural liberalization component
High-incomea
countries
Developing countries
World
Import market access 66 27 93Export subsidies 5 –3 2Domestic support 4 1 5All measures 75 25 100
Beneficiary region

TRADE, DOHA, AND DEVELOPMENT: A WINDOW INTO THE ISSUES
80
from specialization, tends to increase productivity. These dynamic productivityeffects can multiply the gains several times. Second, our calculations assume thatpreferences in regional and other preferential trading arrangements are fully utilized,and that developing countries have access at the listed rates. Detailed analysisshows that this is rarely the case. Brenton (2003), for example, found that mucheligible trade does not take advantage of preferential access, probably because ofonerous rules of origin obligations or quantitative limits built into the schemes.Because our modeling cannot take this underutilization into account, it overstatesthe degree of liberalization in the base year and thus understates the effects offurther most-favored-nation (MFN) liberalization. Third, the analysis here considersonly merchandise trade effects and does not incorporate effects of distortions inservices trade. With services negotiations proceeding fitfully, the amount of newliberalization may prove to be minimal. Nonetheless, services liberalization has apowerful growth effect (Mattoo and others 2001), which is not included in ourcalculations. Working in the opposite direction is the fact that benefits are not asautomatic as the models assume because real-world constraints on supply responsemay impede exporters in developing countries from taking advantage of newopportunities. Nonetheless, the weight of the foregoing considerations, takentogether, suggests that the absolute benefit of Doha merchandise liberalization islikely to be larger than the $96 billion in our calculations.
Tracing the gainsWithin the developing world, most of the gains from the comprehensive Dohascenario go to large countries, notably Argentina, Brazil, others in Latin America,India, Thailand, South Africa, and others in southern Africa. The rest of Sub-SaharanAfrica gains when nonagricultural market access is expanded—especially when
Source: Anderson and Martin (2005, Table 2).
Table 3. Agricultural weighted average import tariffs, by region,2001 (percent, ad valorem equivalent, weights based on imports)
a. Includes preferences and in-quota Trade Rate Quota (TRQ) rates where relevant, as wellas the ad valorem equivalent of specific tariffs.b. Developed countries include the transition economies that joined the European Union inMay 2004. The definition of developing countries used here is that adopted by the WTO.Thus it includes the four East Asian tigers: Hong Kong (China), Korea, Rep., Singapore, andTaiwan (China).
Bound tariff Applied tariff a
Developed countries b 27 14Developing countries 48 21
of which: LDCs 78 13World 37 17

AGRICULTURE
81
developing countries participate as full partners in the negotiations and offersubstantial reductions in their own rates of protection. An important part of thisresult stems from increases in market access—on a nondiscriminatory basis—byother developing countries.
Some least developed countries in Sub-Saharan Africa and elsewhere may beslight losers in our static Doha simulations when developed countries cut theirtariffs and those LDCs choose not to reform. Their losses result from deterioration intheir terms of trade because of erosion of tariff preferences affecting their exports or,if they are net food importers, because they would face higher prices on imports oftemperate foods. Our simulations overstate the benefits of tariff preferences for LDCs,however, since they ignore the trade-dampening effect of complex rules of origin andthe grabbing of much of the rents from preferences by developed country importers.But even if they continued to be losers after correcting for those realities, it remainstrue that preference-receiving countries could be compensated for preference erosionthrough increased aid at relatively small cost to current preference providers. In theprocess, other developing countries currently hurt by LDC preferences would enjoygreater access to the markets of reforming developed countries.
What is to be done?Several clear implications for the Doha Round follow from this analysis. First, inaddition to outlawing agricultural export subsidies, domestic support bindingsmust be cut very substantially to reduce binding overhang. In so doing, the countrieswith the highest subsidies, namely the European Union and the United States, needto reduce their support, not just for the sake of their own economies but also toencourage developing countries to reciprocate by opening their markets as a quidpro quo. An initial cut of 20 percent would be nothing more than a start in eliminatingthe overhang.
Second, agricultural tariff bindings must be cut very deeply to allow somegenuine market opening to occur. Getting rid of the tariff binding overhang thatresulted from the “dirty tariffication” of the Uruguay Round should be the firstpriority, but more than that is needed if market access is to expand. Exempting evenjust a few “sensitive” and “special” products is undesirable, as it would greatlyreduce the gains from reform and tend to divert resources into, instead of awayfrom, enterprises in which countries have their least comparative advantage. If itturns out to be politically impossible not to designate some products as sensitiveor special, it would be crucial to impose a cap such that for any product with abound tariff in excess of, say, 100 percent, that tariff would have to be reduced tothe cap rate.
Third, it is essential to expand nonagricultural market access while reformingagriculture. A balanced exchange of concessions is impossible without addingother sectors. With other merchandise included, moreover, trade expansion would

TRADE, DOHA, AND DEVELOPMENT: A WINDOW INTO THE ISSUES
82
be four times greater for both rich and poor countries—and poverty in low-incomecountries would be reduced considerably.
And fourth, developing countries have to contribute to the round, particularlythrough South–South “concessions.” Since developing countries are trading somuch more with each other now, they are the major beneficiaries of reforms withintheir own regions. Upper-middle-income countries might consider giving leastdeveloped countries duty-free access to their markets (mirroring the recent initiativesof developed countries) or, even better, making MFN tariff reductions. Even leastdeveloped countries should consider reducing their tariff binding overhang, sincedoing so gives them more scope to demand “concessions” (or compensation forpreference erosion and other factors affecting their terms of trade) from richercountries, without requiring them to cut their own applied tariffs very much.
ConclusionThe good news is that there is a great deal to be gained from liberalizing merchandisetrade—especially agricultural trade—under Doha, with a disproportionately highshare of that potential gain (relative to their share of the global economy) available todeveloping countries. To realize that gain, significant reform in agriculture is required.However, the political sensitivity of farm support programs, coupled with thecomplexities of the measures introduced in the Uruguay Round Agreement onAgriculture and of the modalities set out in the Doha Framework Agreement of July2004, ensure that the details of the final Doha agreement will be important and hotlycontested. To realize more of their potential gains from trade, developing and leastdeveloped countries will need to participate fully in trade reforms, as well as adoptcomplementary domestic reforms and invest more in trade facilitation. High-incomecountries could encourage them to take the necessary steps by opening up their ownmarkets to developing country exports and by providing more targeted aid.
To that end, The World Bank and IMF have advanced a new proposal to rewarddeveloping country commitments to trade reform by expanding trade-facilitating aidthrough the Integrated Framework, now operated by a consortium of internationalagencies for least developed countries (see chapter on Aid for Trade in this volume).This proposal, which was endorsed at the IMF and World Bank Annual Meeting inlate September 2005 may provide an attractive path for developing countries seekingto trade their way out of poverty, not least because it would dampen the tendency ofexpanded aid to provoke a rise in the real exchange rate. It also offers a far moreefficient way for developed countries to assist low-income countries than the currentsystems of tariff preferences.Notes

AGRICULTURE
83
1. This note is based on the authors’ article in the September 2005 issue of The World Economyand on Agricultural Trade and the Doha Development Agenda, edited by the authors, publishedby Palgrave Macmillan and the World Bank in November 2005. It was prepared by LeadEconomists, Kym Anderson and Will Martin in the Development Research Group of theWorld Bank. The authors are grateful for the collaboration of numerous colleagues, especiallyDominique van der Mensbrugghe and Tom Hertel, and for research funding from the UKDepartment for International Development.
2. For an explanation of why there is so much confusion over the importance of subsidies versusbarriers to imports, see Anderson, Martin and Valenzuela (2005).
ReferencesAnderson, K., and W. Martin. 2005. “Agricultural Trade Reform and the Doha Development
Agenda.” Policy Research Working Paper 3607, World Bank, Washington, DC. May. And inThe World Economy 28:9:1301-27 (September 2005).
Anderson, K., W. Martin and E. Valenzuela. 2005. “On the Relative (Un-) Importance ofAgricultural Subsidies versus Market Access in WTO’s Doha Round. Mimeo. World Bank,Washington, DC.
Brenton, P. 2003. “Rules of Origin in Free Trade Agreements.” Trade Note 4, DevelopmentEconomics Department, World Bank, Washington, DC. http://www.worldbank.org/trade/
Hoekman, B., and S. Prowse. 2005. “Development and the WTO: Beyond Business as Usual.”Bridges no. 2–3 (February–March), International Centre for Trade and SustainableDevelopment, Geneva.
Mattoo, A., R. Rahindran, and A. Subramanian. 2001. “Measuring Services Trade Liberalizationand Its Impact on Economic Growth: An Illustration.” Policy Research Working Paper 2655,World Bank, Washington, DC.
Further ReadingAnderson, K., W. Martin, and D. van der Mensbrugghe. 2005. “Would Multilateral Trade
Reform Benefit Sub-Saharan Africa?” Policy Research Working Paper 3616, World Bank,Washington, DC. July. And in the Journal of African Economies 15 (forthcoming 2006).


Market Access Barriers in Agriculture andOptions for Reform
Kym Anderson, Harry de Gorter and Will Martin
6
Agricultural protection and subsidies account for about two-thirds of thetrade distortion caused by government policies. And most of the distor-tion traceable to agricultural policies is generated by import barriers. For
that reason, negotiating wider market access in agriculture is critical to the successof the Doha Round.1
The World Trade Organization (WTO) Agriculture Framework Agreement ofJuly 2004 calls for significant tariff cuts using a tiered formula that imposes largerpercentage cuts in higher tariffs. (See table 1 for a summary of all of the provisions.)This proposed approach is a vast improvement over the average-cut formula appliedin the Uruguay Round Agreement on Agriculture, which allows countries to meettheir commitments through large proportional reductions in tariffs that were alreadylow and small reductions in high tariffs.
The new formula still will require substantial cuts in tariffs before meaningfultrade liberalization is realized. This is because of the prevalence in agriculture oftariff peaks (a small number of tariff lines protect the bulk of domestic production),binding “overhang” (bound tariffs are above applied tariffs), “water” in the tariff(tariff reductions initially have no impact), and tariff escalation (higher tariffs onprocessed raw materials). Furthermore, the Framework Agreement contains aSensitive Product designation that would allow some commodities to escape thefull extent of tariff cuts in exchange for an expansion of tariff rate quotas (TRQs).
A fundamental requirement for success in any trade negotiation is balancebetween flexibility and discipline. There must be enough flexibility to accommodatethe unique needs of each member, and enough discipline to yield the gains in exportmarket opportunities that are the raison d’être of trade negotiations. The tieredformula appears to strike a balance between discipline and flexibility by creatingbands that allow for progressive tariff cuts. But Sensitive Products may introduceflexibility at the cost of the discipline needed to widen market access. The level oftrade liberalization realized, therefore, will depend critically on key details, such asthe level of tariff cuts in each tier, the maximum tariff level to be negotiated, reductionsin tariff escalation, and the requirement for an overall cut in average tariffs.
This note analyzes these issues and lays out some options for meaningfultrade liberalization, consistent with the language and provisions outlined in theFramework Agreement.
85

TRADE, DOHA, AND DEVELOPMENT: A WINDOW INTO THE ISSUES
86
BackgroundAlthough developing countries have almost doubled their share of world trade inmanufactures over the last two decades, their share in agricultural trade has remainedabout 30 percent. During the 1990s, the growth of developing-country agriculturalexports to industrial countries slowed as exports to other developing countriesaccelerated. Today’s middle-income countries have managed to increase their globalmarket share, principally by entering other developing countries’ markets and byaggressively diversifying into nontraditional exports, such as seafood products,fruits, vegetables, cut flowers, and processed foods. Growth of these nontraditionalexports, which generally have low protection, has outpaced growth of traditionalcommodities by three to one (figure 1). Meanwhile, many low-income countrieshave had less success; their share of world agricultural trade has declined.
These trade patterns reflect the structure of global protection. Although theconversion of nontariff barriers to tariffs during the Uruguay Round was an importantstep forward, import protection in agriculture remains high, nontransparent, andantidevelopment. Average agricultural tariffs remain much higher than manufacturingtariffs, which average less than 4 percent and are about 10 percent of what theywere 60 years ago. The average agricultural tariff is 62 percent, by contrast, withhigh variation among countries and commodities. In addition, about 50 percent ofdomestic production in countries belonging to the Organization for Economic
Table 1. Summary of the market access provisions of the WTOFramework Agreement on Agriculture
Source: Josling (2005).
Tariff cuts
Tariff rate quotas
Safeguards
Special and differential treatment for developing countries
Other
Substantial improvement in market access through tariff reductions from bound rates.Single approach for all countries: tiered formula to ensure progressivity. Types of
commitments within bands and number of bands to be negotiated.Role of a tariff cap to be evaluated.Designation of an "appropriate number" of sensitive products, which would be
subject to a mix of tariff cuts and TRQ expansion.
Reduce in-quota tariffs and improve administration (as part of balance of concessions).Some TRQ expansion for all sensitive products.
Future of special agricultural safeguard (SSG) under negotiation.Establish new special safeguard mechanism (SSM) for developing countries.
Proportionately less tariff reductions for developing countries, with longer implementation period.Developing countries may designate special products on criteria of
"food and livelihood security," which would be subject to more flexible treatment.Fullest possible liberalization of trade in tropical products and alternatives to illicit
narcotic crops by developed countries.
Tariff escalation reduced by formula to be agreed upon.Erosion of preferences to be addressed using Harbinson paragraph 16 as reference.

MARKET ACCESS BARRIERS IN AGRICULTURE
87
Cooperation and Development (OECD) is protected by TRQs. Studies show thatpreferences to developing countries barely begin to compensate for these highlevels of protection (Brenton and Ikezuki 2005).
Widespread use of specific tariffs in developed countries (which makeup two-thirds of their agricultural tariffs) obscure actual levels of protection, becausespecific duties are generally higher than the simpler and more transparent ad valoremtariffs that are generally used in developing countries (figure 2). The use of specifictariffs causes a bias against developing countries because it results in higher tariffson lower-priced imports. Even more important are the cyclical implications of suchtariff structures: as world price go down, specific tariffs go up when expressed inpercentage terms. While conversion of specific tariffs into ad valorem form wouldbe desirable in principle, it would raise many of the dangers that emerged in theconversion of nontariff barriers into tariffs during the Uruguay Round. To avoidanother round of “dirty tariffication” through large, covert increases in protection,it will be important during the conversion of specific tariffs to include in the modalitiesgoverning the negotiations a provision to ensure that a transparent approach isfollowed (similar to paragraph 9 of the Harbinson Draft).2
Note:Tropical products: coffee, cocoa, tea, nuts, spices, textile fibers, sugar and confectionery. Temperate products:meats, milk, dairy, grains, animal feed, edible oil, and oil seeds. Other processed products include: tobacco andcigarettes, alcoholic and nonalcoholic beverages, and other processed food.Source: World Bank 2003.
Figure 1. Developing country exports have surged in nontraditionalproducts with low protection
Composition of developing countries exports, percent
0
10
20
30
40
50
60
TropicalProducts
TemperateProducts
Seafood, Fruits,Vegetables and
Flowers
OtherProcessedProducts
1981
1991
2001
0
10
20
30
40
50
60
TropicalProducts
TemperateProducts
Seafood, Fruits,Vegetables and
Flowers
OtherProcessedProducts
1981
1991
2001

TRADE, DOHA, AND DEVELOPMENT: A WINDOW INTO THE ISSUES
88
Tariffs are typically higher for processed raw materials (figure 3). Bydiscouraging diversification into value-added and processed products—areas inwhich trade is expanding rapidly—such escalation punishes investors indeveloping countries who seek to add value to production for export. It alsohelps account for developing countries’ generally poor penetration ofdeveloped-country markets in processed foods.
Two other key features of agricultural tariffs are the large difference betweenbound and applied rates and their extremely high peaks. The first feature, knownas “binding overhang” (figure 4), means that a larger reduction in bound ratesmust be made before applied rates change. High peaks result in large differencesbetween average rates and maximum tariff rates (called “tariff dispersion”) indeveloped countries (table 2), compared with developing countries, which arecharacterized by low tariff dispersion. Developing countries have higher averageagricultural tariffs than industrial countries, but the level of protection in developedcountries is higher than average tariffs (figure 5) because of the prevalence oftariff peaks: just a few tariff lines protect most of domestic production in high-income countries. One consequence of those peaks is that most of the economicwelfare cost of global agricultural distortions is accounted for by a small number ofcommodities. Rice and beef alone are responsible for the bulk of that cost, withsugar, oilseeds and other livestock products accounting for another quarter (table 3).
Source: World Bank 2003.
Figure 2. Specific duties hide high protection
Percent
0
10
20
30
40
50
60
70
Australia US EU Jordan
Average Ad ValoremTariff
Average Ad ValoremTariff Equivalent
0
10
20
30
40
50
60
70
Australia US EU Jordan
Average Ad ValoremTariff
Average Ad ValoremTariff Equivalent

MARKET ACCESS BARRIERS IN AGRICULTURE
89
Table 2. Tarfiff Peaks and Variance in Selected Countries (percent)
Source: Aksoy 2005.
Country or Group Average Tariff Maximum Tariff Standard Deviation
Canada 4.1 238.0 13.5
Japan 10.9 50.0 10.1
United States 9.9 350.0 26.5
European Union 19.0 506.3 27.3
Republic of Korea 39.9 917.0 107.9
Brazil 13.2 55.0 5.6
Costa Rica 14.2 154.0 18.0
Morocco 67.4 376.5 70.6
Indonesia 8.9 170.0 25.6
Malawi 16.5 25.0 8.5
Togo 15.6 20.0 6.1
Uganda 13.6 15.0 3.2
Source: World Bank 2003.
Figure 3. Tariffs escalate for final products
Average tariffs, percent
0
10
20
30
40
50
60
QUAD Canada Japan US EU LargeM iddleIncome
Count ries
OtherM idd leIncome
Count ries
LowerIncome
Count ries
Raw
Intermediate
Final
0
10
20
30
40
50
60
QUAD Canada Japan US EU LargeM iddleIncome
Count ries
OtherM idd leIncome
Count ries
LowerIncome
Count ries
Raw
Intermediate
Final
TRADE, DOHA, AND DEVELOPMENT: A WINDOW INTO THE ISSUES
90
Tariff rate quotasTariff rate quotas (TRQs) on imports, implemented in the Uruguay Round Agreementon Agriculture for sectors in which nontariff barriers were converted into tariffs, area complicating factor. Countries agreed to allocate quotas for imports up to 5 percentof domestic consumption (“minimum access” quotas) and to safeguard currentlevels of access if imports exceeded 5 percent of consumption (“current access”quotas). Countries were to permit imports under the quota at lower tariffs (called the“in-quota” tariff), whereas imports over the quota would face the higher MFN tariff.In-quota tariffs, unlike over-quota tariffs, were neither bound nor reduced in theAgreement on Agriculture. The average over-quota bound tariff of 115 percent issubstantially higher than both the average in-quota tariff and the average tariff forall of agriculture, both of which are 59 percent.
But TRQs are the source of a host of potential problems. First, because theyprotect about 50 percent of OECD agricultural production, it would be unwise toallow all the products they protect to be deemed Sensitive Products, as wassuggested in some proposals before the July 2004 Framework Agreement. Second,many quotas are not filled, suggesting that reductions in over-quota tariffs mayhave less impact than might otherwise be expected. Actual problems with TRQs areevident, as well. The first-come, first-served approach to their administration (usedby many countries), for example, sometimes causes imports to be rushed anddomestic prices to fall. Import licenses allocated on demand allow high-cost firms to
operate, while licenses allocated on the basis of historical shares fail to ensurecompetition. Some state trading enterprises have been known to import low-qualityproducts for animal feed to fulfill their obligations yet continue to protect theirdomestic farmers. More problems abound from a plethora of additional regulations.For example, seasonal licenses, time limits, limits per firm, and a domestic purchaserequirement all impose extra costs on importing firms. These and several otherregulations were found (de Gorter and Klianga 2005) to affect over $30 billion intrade. For these reasons, it is doubtful that the path to wider market access inagriculture lies through TRQs.
Designing the tariff reduction formulaLarge cuts in high tariffs are the key to unlocking the development potential ofmarket access in agriculture. The July 2004 Framework Agreement advanced theagricultural market access negotiations in several ways. By moving from the flawedaverage-cut methodology imbedded in the Uruguay Round Agreement onAgriculture, it provides scope to increase market access by making the greatestreductions in the highest and most distorting tariffs. But the thresholds and numberof bands have yet to be negotiated.

MARKET ACCESS BARRIERS IN AGRICULTURE
91
The tiered approach of the Framework Agreement ensures some degree ofharmonization of national systems of agricultural tariffs (although much less thancould be achieved using a Swiss formula that not only reduces higher tariffs morethan lower tariffs but also has a common maximum tariff for all countries). But thetiered formula poses some critical design issues—among them the placement of thebands, the depth of cuts, and the presence or absence of a tariff cap. Recognizingthese issues, the G-20 proposal of July 8, 2005, proposes a tariff cap of 100 percentfor developed countries and 150 percent for developing countries. Scenariosanalyzed by the World Bank (Jean, Laborde and Martin 2005) show that only formulasthat bring about very deep cuts in bound rates will have a substantial impact onaverage applied tariffs and hence on market access, particularly when allowance ismade for some degree of slippage from designations of Sensitive and SpecialProducts. A progressive tariff reduction formula that imposed cuts of 45, 70, and 75percent in bound tariffs in developed countries would reduce the average tariffsfacing developing countries from 15 percent to 10 percent—an important gain inmarket access, but only one-third of the way to complete liberalization.
The need to limit the number of tariff lines for Sensitive Products is alsorecognized in the G-20 proposal. The scenario analysis of the World Bank foundextraordinary sensitivity of the results to self-selected Sensitive and SpecialProducts. For example, if 2 percent of tariff lines are excluded from reductions asSensitive Products and a further 2 percent as Special Products in developing
Table 3. Commodity contributions to global welfare cost of foodand agricultural subsidies and tariffs
Source: Unpublished GTAP model results by K. Anderson and E. Valenzuela, World Bank(September, 2005).
Share of total welfare cost of protection (percent)
Rice 35Beef and sheepmeat 18Sugar 8Oilseeds 7Pork and poultry 6Dairy products 5Coarse grains 5Wheat 4Other processed food 12Total 100

TRADE, DOHA, AND DEVELOPMENT: A WINDOW INTO THE ISSUES
92
Bound and applied tariffs on agriculture, percent
Source: Jean, Laborde and Martin 2006.
Figure 4. Bound tariffs exceed applied rates
0
20
40
60
80
100
120
USA
SACU
Mex
ico
Canad
a
ASEAN
Europ
ean U
nion
Turke
y
Mag
hreb
nonL
DC-SSA
EFTA
Pakist
an
Japa
nIn
dia
Korea
Bound
Applied
(153%)
0
20
40
60
80
100
120
USA
SACU
Mex
ico
Canad
a
ASEAN
Europ
ean U
nion
Turke
y
Mag
hreb
nonL
DC-SSA
EFTA
Pakist
an
Japa
nIn
dia
Korea
Bound
Applied
(153%)
Figure 5. Border protection and average tariffs for selectedcountries
Note: MPS measures the tariff equivalent of all tariff and nontariff barriers to imports usingOECD data but excludes protection afforded by taxpayer-funded production subsidies and the like.Source: World Bank 2003.
Border protection and average tariffs for selected countries, percent
0
20
40
60
80
100
120
140
Japan EU Norw ay Canada US Hungary Mexico Turkey
Market price support
Average Tariffs
0
20
40
60
80
100
120
140
Japan EU Norw ay Canada US Hungary Mexico Turkey
Market price support
Average Tariffs

MARKET ACCESS BARRIERS IN AGRICULTURE
93
0
10
20
30
40
50
60
70
80
90
100
0 10 20 30 40 50 60 70 80 90 100 110 120 130 140 150
USA
G-20EU
G-10
0
10
20
30
40
50
60
70
80
90
100
0 10 20 30 40 50 60 70 80 90 100 110 120 130 140 150
USA
G-20EU
G-10
Figure 6. Bands and Cuts for Developed Countries: ProposalsProposed cut
Initial Tariff (AVE)Source: Marcos Jank, Institute for International Trade Negotiations (ICONE), 2005.
Source: Marcos Jank, Institute for International Trade Negotiations (ICONE), 2005.
0
10
20
30
40
50
60
70
0 10 20 30 40 50 60 70 80 90 100 110 120 130 140 150
USA
G-20EU
G-10
0
10
20
30
40
50
60
70
0 10 20 30 40 50 60 70 80 90 100 110 120 130 140 150
USA
G-20EU
G-10
Initial Tariff (AVE)
Proposed cut
Figure 7. Bands and Cuts for Developing Countries: Proposals

TRADE, DOHA, AND DEVELOPMENT: A WINDOW INTO THE ISSUES
94
countries, the liberalization of applied duties is reduced by two-thirds overall andmuch more in Canada, Japan, and Republic of Korea. The cut in applied tariffs fallseven more—by 80 percent. A tariff cap would help reduce the losses to liberalizationresulting from designations of Sensitive and Special Products, particularly bybringing about substantial reductions on cereals. Clearly, if the Doha Round is tobe successful in increasing market access, it will be important to ensure (a) that onlya small share of products is accorded special treatment, (b) that substantial reductionsin protection are made even on these products, or (c) that the number of productsis restricted in a more meaningful way than by restricting the number of tariff lines.
Another design issue related to the simple tiered formula is the discontinuitiesbetween bands that can result from a system of higher cuts for tariffs in bands withhigher tariff rates. Assume, for example, a tariff threshold of 90 percent. If there werea 10 percentage point difference between the rates of cut, tariffs just over thatthreshold would end up nearly 10 percentage points below tariffs at the threshold.One possible solution to this problem is to implement a tiered formula similar to thatof a progressive income tax, whereby higher marginal rates of reduction are madeon tariffs in higher tariff bands. Another possibility is a rate of cut that increaseswith the height of the tariff.
Recent reform proposals by the U.S. (2005), the G-20 (2005), the EU (2005) and theG-10 (2005) have elaborated considerably on the Framework. These proposals specifytiered formulas for tariff reduction with maximum reduction rates in industrial countriesof 90 percent, 75 percent, 60 percent and 45 percent respectively. In developingcountries, the cuts are smaller, and increases in cuts take place from higher tariff levels.The relationship between the proposed cuts is shown in figures 6 and 7. The proposalsalso differ crucially in the number of “sensitive” products allowed; the U.S. proposed1 percent of tariff lines, the EU has proposed 8 percent and the G-10 has proposed 10or 15 percent. Jean, Laborde and Martin (2005) show that even 2 percent of sensitiveproducts can almost eliminate the market access gains resulting form a tiered formula.
Policy optionsIf governments wish to promote development through increased market access,
they have several options:• Limit the number of tariff lines in the Sensitive and Special Product categories.
Research shows that placing just 2 percent of tariff lines in those categoriescan eviscerate the benefits of trade liberalization.
• Impose a tariff cap at the 100 percent level suggested by the G-20 to overcomethe effects of tariff peaks, binding overhang, and gaps between applied tariffsand the protection actually provided.
• Impose an overall reduction in average tariffs to ensure that the tiered approachis effective and as a further guard against the adverse effects of the Sensitive

MARKET ACCESS BARRIERS IN AGRICULTURE
95
and Special Product categories.• Build progressivity into every tariff band to ensure reduction in tariff escalation
and avoid discontinuities or overlap between tariffs in the bands.• Convert all specific tariffs into ad valorem equivalents using a transparent
methodology that will not allow a clandestine increase in protection.• Encourage full participation by developing countries, especially as Special
Products designations could reduce their liberalization substantially.• Require reductions in in-quota tariffs, or eliminate them altogether. In-quota
tariffs can put a significant brake on the trade liberalizing effects of quotaexpansion.
• Increase minimum access quotas from 5 percent to 10 percent of domesticconsumption in the base year.
• Expand current access quotas, which account for 58 percent of trade underTRQs. Because minimum access quotas frequently go unfilled, an expansion incurrent access quotas may be more effective.
• Do not leave to importing countries the choice of whether to reduce over-quota tariffs or expand quotas. Research shows that the minimum tradeexpansion under each scenario is far less than either the tariff reduction orquota expansion scenario alone, so governments wishing to protect farmerscan do so more easily if given the choice.
• Switch all TRQs to applied tariffs with no limits on imports, or require thelicenses to be auctioned. Quota underfill frequently indicates potential problemswith administration methods.
• Phase out TRQ regulations such as time limits, past trading performance, limitsper firm, seasonal quotas, and domestic purchase requirements because theyimpose costs on importing firms and may contribute to high rates of underfilledquotas.
Notes1. This note draws on findings from a research project funded by the United Kingdom’s
Department for International Development and the World Bank-Netherlands Partnershipprogram. It was written by Kym Anderson and William J. Martin, both Lead Economists in theWorld Bank Development Research Group (DECRG)) and the International Trade Departmentand by Harry de Gorter, Associate Professor of Agricultural Economics at Cornell University inIthaca, New York.
2. The former negotiations’ chairperson, Stuart Harbinson, drafted a “modalities” paper in2003 in search for a compromise to lead to a final agreement (WTO 2003). The “modalities”are targets (including numerical targets) for achieving the objectives of the negotiations, as wellas issues related to rules.

ReferencesAksoy, M.A. 2005. “Global Agricultural Trade Polices.” In Global Agricultural Trade and
Developing Countries (chapter 3), ed. A. Aksoy and J. Beghin. Washington, DC: World Bank.Brenton, P. and T. Ikesuki. 2005. “The Impact of Agricultural Trade Preferences, with Particular
Attention to the Least Developed Countries.” In Global Agricultural Trade and DevelopingCountries (chapter 4). ed. A. Aksoy and J. Beghin. Washington, DC: World Bank.
de Gorter, H., and E. Kliauga. 2005. “Reducing Tariffs versus Expanding Tariff Rate Quotas.” InAgricultural Trade Reform and the Doha Development Agenda (chapter 5), ed. K. Andersonand W. Martin. New York: Palgrave Macmillan.
EU. 2005. “Making Hong Kong a Success: Europe’s Contribution.” European Commission,Brussels, October 28, 2005.
G-10. 2005. G-10 Agriculture Proposal. October 10, 2005. www.insidetrade.com.G-20. 2005. G-20 Proposal on Market Access. October 12, 2005. www.insidetrade.com.Jean, S., D. Laborde, and W. Martin. 2005. “Consequences of Alternative Formulas for Agricultural
Tariff Cuts.” In Agricultural Trade Reform and the Doha Development Agenda (chapter 4),ed. K. Anderson and W. Martin. New York: Palgrave Macmillan.
Josling, T. 2005. “The WTO Agricultural Negotiations: Progress and Prospects.”Choices 20 (2)Martin, W. 2004. “Market Access in Agriculture: Beyond the Blender.” Trade Note 17.
Development Research Group, World Bank, Washington, DC. July. http://web.worldbank.org/WEBSITE/EXTERNAL/TOPICS/TRADE/
0,contentMDK:20115046~pagePK:148956~piPK:216618~theSitePK:239071,00.html.U.S. 2005. U.S. Proposal for Bold Reform in Global Agricultural Trade. October 10, 2005.
www.ustr.gov.World Bank. 2003. “Agricultural Policies and Trade.” In Global Economic Prospects 2004:
Realizing the Development Promise of the Doha Agenda (chapter 3). Washington, DC:World Bank.
WTO. 2003. “Negotiations on Agriculture: First Draft of Modalities for Future Commitments.”WTO Document TN/AG/W/1/Rev.1 Geneva.
96
TRADE, DOHA, AND DEVELOPMENT: A WINDOW INTO THE ISSUES

Domestic Support in Agriculture: The Struggle forMeaningful Disciplines
Harry de Gorter and J. Daniel Cook
7
The current basis for multilateral negotiations of global agricultural trade isthe July 2004 Agriculture Framework of the World Trade Organization (WTO).Negotiators had hoped to reach an agreement on how, by how much, and
when cuts in agricultural support should be made by the end of July 2005, but thathope was not realized because of major disagreements on the level and method ofreductions. The focus now is how to move from the 2004 Agriculture Framework toa more specific agreement in time for approval at the WTO’s Hong Kong Ministerialin December 2005, so that agreed modalities can be translated into draft schedulesof subsidy reductions.
This note examines the provisions of the July 2004 Framework concerningdisciplines specific to domestic support, discusses the main issues under negotiationand their prospects for success, and makes specific recommendations for moreeffective disciplines.1
Domestic support disciplines in the WTO Agreement onAgriculture and in the July 2004 FrameworkDomestic support—support provided through subsidies paid by government toproducers or through administered prices—is classified under the WTO 1995Agreement on Agriculture as falling into three “boxes.” Amber Box policies arethose deemed to be the most trade-distorting and hence are subject to disciplines.The extent of subsidies is gauged by the “aggregate measurement of support”(AMS) that they provide. Exempted from discipline is so-called de minimissupport—defined as subsidies up to a fixed proportion (presently 5 percent) of thecurrent value of production in each category of product-specific and non-product-specific support. Blue Box policies are potentially trade-distorting, but becausethey include supply restrictions they are currently exempted from reductions. GreenBox payments are not related to current output and therefore are consideredminimally trade-distorting. Like Blue Box policies, they are exempt from reductions.
The Agreement on Agriculture called on developed countries to reduce AmberBox support (or total AMS) by 20 percent by 2000. Developing countries were toreduce AMS by 13 percent by 2004. For developing countries, a wider list of policieswas exempt from reductions. The least developed countries were wholly exemptfrom subsidy-reduction commitments.
The July 2004 Framework retains many of the concepts of the 1995 Agreementon Agriculture but adds new ideas of great significance. In addition to disciplining
101

TRADE, DOHA, AND DEVELOPMENT: A WINDOW INTO THE ISSUES
102
the AMS, the framework calls for a minimum 20 percent cut in “overall trade-distortingsupport” (OTDS), defined as the sum of the AMS bound ceiling and the allowedmaxima of Blue Box payments and de minimis support (table 1). In addition, it alsocaps each component of overall support—specifically AMS, de minimis support,and Blue Box subsidies. Reductions in support for each component are to counttoward the country’s commitment to reduce overall support. The overall commitmentto reduce trade-distorting support may become binding when the ceilings are belowactual overall support. Similarly, one or more of the individual component reductioncommitments may require reduction in actual support to be under the ceiling.Reduction commitments for individual categories are required even if together theyexceed the required reduction in overall support. In addition, the framework calls fordeeper cuts in OTDS and its individual components by countries that providehigher levels of support. This tiered approach to progressively reduce domesticsupport is designed to help harmonize support levels among countries. The specificdetails of the tiered formula are not specified in the framework.
The framework calls for an expansion of the Blue Box criteria to includepayments on fixed areas and yields that are not linked to production constraints.Total Blue Box subsidies would be limited to 5 percent of an historical average valueof production. The framework includes an exception for countries currently abovethe cap to gradually make reductions to the 5 percent cap during the implementationperiod. Green Box definitions are to be reviewed and clarified, but the frameworkdoes not call for a numerical cap on this form of support. However, tighter scrutiny,along with implementation of the outcome of the WTO Cotton Panel, could yetcause some significant adjustments in Green Box criteria and policies.
An empirical assessment of the 2004 framework for a sample ofcountriesThe likely effects of the framework on current support ceilings for a select group ofcountries are illustrated in table 2. Product-specific and non-product-specific deminimis and Blue Box ceilings are each 5 percent of the value of production, except forEU Blue Box payments, where actual levels exceed the 5 percent limit by $8.74 billion.
The actual level of OTDS is much lower than the ceilings for all countries. Forexample, the current level of OTDS in the European Union is $62.7 billion, well underthe ceiling of $93.5 billion. This begs the essential question of whether commitmentsto reduce support will affect current policies at all. As for the individual componentsof OTDS, current support is also below the ceiling except for Blue Box payments inthe European Union. Also notable are several cases where the current level of supportis close to the ceilings: AMS and non-product-specific support in the United States,AMS in Korea, and non-product-specific support in Canada.
Because of the wide gap between the permitted level of support and the actuallevel of support, a gap often known as “water,” a reduction in ceilings and permitted

DOMESTIC SUPPORT IN AGRICULTURE
103
Ove
rall
tra
de-d
isto
rtin
g su
ppor
t
Red
uce
over
all t
rade
-dis
tort
ing
supp
ort s
ubst
anti
ally
: dow
npay
men
t (20
%)
in f
irst
yea
r.A
mbe
r B
ox
Cap
pro
duct
-spe
cifi
c A
MS
leve
ls a
t his
tori
cal a
vera
ges.
Red
ucti
ons
in to
tal A
MS
sho
uld
lead
to p
rodu
ct-s
peci
fic
redu
ctio
ns.
Blu
e B
ox
Cap
pay
men
ts to
5%
of
agri
cult
ural
pro
duct
ion
from
sta
rt o
f im
plem
enta
tion
per
iod.
Gre
en B
oxR
evie
w G
reen
Box
cri
teri
a an
d im
prov
e su
rvei
llan
ce a
nd m
onit
orin
g.D
e m
inim
is le
vel
Neg
otia
te th
e re
duct
ion
of th
e le
vel o
f de
min
imis
sup
port
.
Dev
elop
ing
coun
trie
s:
hav
e lo
nger
impl
emen
tati
on p
erio
ds.
h
ave
low
er r
educ
tion
coe
ffic
ient
s an
d hi
gher
de
min
imis
leve
ls.
r
etai
n th
e us
e of
Art
icle
6.2
, all
owin
g ex
tra
scop
e fo
r do
mes
tic
prog
ram
s.
Spe
cial
and
dif
fere
ntia
l tre
atm
ent
for
deve
lopi
ng
coun
trie
s
Mov
e to
har
mon
ize
max
imum
all
owed
leve
ls o
f or
cei
ling
s in
ove
rall
trad
e-di
stor
ting
sup
port
- O
TD
S -
de f
Agg
rega
te M
easu
rem
ent o
f S
uppo
rt (
AM
S)
plus
de
min
imis
plus
Blu
e B
ox. A
tier
ed f
orm
ula
is to
be
used
: re
duce
sup
port
by
coun
trie
s w
ith
high
er O
TD
S c
eili
ngs.
Red
uce
the
tota
l AM
S s
ubst
anti
ally
by
use
of a
tier
ed f
orm
ula:
gre
ater
eff
orts
to r
educ
e su
ppor
t by
coun
trie
Box
sup
port
.
Red
efin
e to
incl
ude
paym
ents
wit
h pr
oduc
tion
lim
itin
g re
quir
emen
t and
thos
e w
ith
no p
rodu
ctio
n re
quir
ed:
base
d on
fix
ed a
reas
and
yie
lds
and
head
age
as w
ell a
s pa
ymen
ts b
ased
on
less
than
85%
of
base
pro
duct
ion
Sour
ce:
Josl
ing
(200
5).
Tab
le 1
. Su
mm
ary
of
the
do
mes
tic
sup
po
rt p
rovi
sio
ns
of
the
WT
O F
ram
ewo
rk A
gre
emen
t o
n A
gri
cult
ure
,Ju
ly 2
004

TRADE, DOHA, AND DEVELOPMENT: A WINDOW INTO THE ISSUES
104
levels is likely to have much less impact on actual policy—for several reasons. First,proposed reductions affect the AMS ceilings and the newly created maximum permittedlevels for de minimis and Blue Box support—not the actual levels of support. Thisalone greatly dilutes the disciplines. The permitted level of de minimis support (10percent of the value of production—5 percent each for product- and non-product-specific) is a large number by itself. The maximum allowed de minimis would averageone-third of the producer support estimate (PSE) for OECD countries in 2001 and 87percent of the domestic-support component of the PSE (defined as total support lessborder support). Current use of de minimis support is already quite significant forsome countries. Current levels in Canada, for example, exceed notified total AMSsupport by more than 40 percent (see the last column in table 2). U.S. de minimissupport is almost 50 percent of total notified AMS.
But additional water has accumulated because of an inflated baseline, shiftingbetween boxes, and double counting of border support. Policy shifts occurringafter the base period of the Agreement on Agriculture (1986–88) but before the
Table 2. Analysis of the 2004 Framework Agreement proposals ondomestic support, selected countries (in millions of U.S. dollars)
Note: The data in the table correspond to the average of the last three years of notifiedsupport for each region or country: European Union and United States = 1999–2001; Japan =2000–02; Korea and Canada = 1998–2000; Mexico = 1996–98.a. The EU blue box ceiling here is the historical average of actual support, higher than thepermitted 5 percent of value of production of $11.9 billion.b. Product-specific de minimis ceiling is less than 5 percent of the total value of productionbecause support for some products are over five percent of the value of production and so isincluded in the AMS. The proportion varies by country, with the European Union having thehighest share of de minimis in the AMS, whereas Mexico has none.c. Assumes all countries eliminate official support prices without actually changing support, sothe price-gap portion of the AMS simply evaporates.Source: WTO notifications and authors’ calculations.
EU a U.S. Japan Korea Mexico CanadaCurrent ceilings
Overall trade-distorting support (OTDS) 93,503 44,118 43,622 7,261 15,476 5,412
AMS 59,538 19,103 34,031 1,321 8,718 2,771
Product-specific de minimis b 1,428 5,773 1,497 2,132 2,703 692
Non-product-specific de minimis 11,900 9,621 4,047 2,539 2,703 974
Blue Box 20,637 9,621 4,047 1,269 1,352 974
Current levels
OTDS 62,679 23,299 7,096 1,814 876 1,391
AMS 41,505 16,026 6,017 1,325 876 577 Product-specific de minimis 103 102 131 121 0 137
Non-product-specific de minimis 434 7,171 175 368 0 677
Blue Box 20,637 0 772 0 0 0
Potential “water” in the AMS due to price gap c 29,058 5,862 3,725 1,317 777 287

DOMESTIC SUPPORT IN AGRICULTURE
105
implementation period (starting in 1995) are exemplified by the European Union’sconversion of approximately $20 billion of Amber Box support to the Blue Box in1992, which lowered reported AMS relative to the baseline that included thesepayments. Another factor was the shift of payments from the Blue Box to the GreenBox during the implementation period. Crop deficiency payments in the UnitedStates, for example, were in the Blue Box before the 1996 Farm Bill. But with decouplingin the 1996 Farm Bill, this program was shifted into the Green Box. The change inpolicy was a positive step, but the baseline remained high and allowed water toaccumulate in the Blue Box, as shown in the U.S. column in table 2.
Another source of water in domestic support ceilings is the peculiar manner inwhich the AMS is calculated. In addition to trade-distorting, taxpayer-fundeddomestic subsidies, the AMS includes “market price support,” defined as eligibleproduction multiplied by the difference between the administered price and a fixedworld reference price. The product of that operation does not depict “domesticsupport” per se. Instead, it is a faulty measure of support provided at the borderthrough tariffs, import quotas or export subsidies (box 1) since and administeredprice cannot be sustained without supporting border measures. Reducing or eveneliminating an official support price without altering border protection need nothave any market impact. Japan is a case in point. There the official support price forrice was eliminated in 1997, and Japan’s total AMS, as notified to the WTO, droppedby $20 billion. However, because the country made no changes in import controls,effective support remained the same. So a substantial portion of the water in Japan’stotal AMS of approximately $34 billion (table 2) can be attributed to an adjustmentmade to an administered price in order to “achieve” reduction commitments withoutactually reducing support. As discussed below, the redundancy of this “price-gap”component of the AMS must be recognized when assessing the impact of anygiven cuts.
Because of the ambiguity of the legal text of the Agreement on Agriculture andthe discretion given to governments in how they declare specific support programs,there is evidence that support has been moved from box to box to meet domesticsupport disciplines. This is possible because there are no product-specific limitsfor the Amber Box—it is an aggregate sectorwide limit for all agricultural productsand policies. This enables countries that reform policies in one sector to increasesupport in other sectors or introduce new support for the reformed sector.
Support can be shifted between, as well as within, boxes. Lax criteria haveallowed countries to move support toward either undisciplined or less constrainedcategories. For example, the United States declared the new emergency cropsubsidies of 1998–2001 as non-product-specific de minimis support even thoughthey were based on specific product prices. This move allowed the United States tocircumvent the ceiling on total AMS. In anticipation of ceilings becoming a constraint,the 2004 framework now proposes to expand the definition of the Blue Box and its

TRADE, DOHA, AND DEVELOPMENT: A WINDOW INTO THE ISSUES
106
ceiling to 5 percent of an historical value of production for all of agriculture. Withlittle change in the levels of emergency payments (except in name: they are nowcalled countercyclical payments), the United States will be able to dramaticallyreduce its non-product-specific de minimis support by shifting it to the Blue Box.The United States and other countries will be able to do so simply because of aproposed change in the definition of what is “less trade distorting.”
Box 1. How part of the AMS can evaporate without changingactual support
The Agreement on Agriculture included a measure of border protectionin the AMS called “market price support” (MPS), which is measured byproduction multiplied by the difference between the current administered“official” domestic price support and a fixed world reference price in1986–1988:
MPS = Q*(Pd
off-Pw
ref)
where Q is current production, Pd
off is the official domestic price support andP
wref is the fixed world reference price. Actual world prices fluctuate above
and below the world reference price, while domestic market prices dolikewise relative to the domestic administered price. Measuring MPS in thisway can cause a major discrepancy between actual MPS levels and the levelnotified to WTO. So the MPS component of the AMS is a poor measure ofborder protection for a subset of commodities that have official domesticsupport prices. This problem in measuring the AMS is highlighted by thefact that it sometimes is notified to the WTO as a negative number (when thesupport price is below the fixed world reference price) and thus may offsettaxpayer-financed, trade-distorting subsidies. At the other extreme, supportprices have sometimes been so far above world reference prices that theAMS has exceeded the OECD’s total PSE for some countries in the past,even though the AMS is supposed to measure trade-distorting domesticsupport, which is just one component of the PSE. But most importantly, theMPS component of the AMS is very arbitrary because a country can simplyreduce or eliminate the official price support without changing actualsupport.
Source: Baffes, Cook, and de Gorter (2005).

DOMESTIC SUPPORT IN AGRICULTURE
107
Current Formula ProposalsSince October 10, the United States, EU and G-20 have advanced specific proposalsbased on the July 2004 Framework Agreement. These all involve tiered reductionswith larger cuts in those economies with the largest absolute amount of domesticsupport.2 The U.S. proposal calls for a 75 percent reduction in Overall TradeDistorting Support (OTDS) for countries with over $60 bil., a 53 percent reductionfor OTDS between $10 and $60 bil., and a 31 percent reduction for lower levels ofOTDS. The corresponding reductions in the Aggregate Measurement of Support(AMS) are 83-60-37 percent.3
The EU calls for 70-60-50 percent cuts in each of OTDS and AMS. The EUplaces itself in the highest band, the United States in the middle and all othersexcept Japan in the lowest. The proposal calls for the Japan to be in the middle bandfor OTDS, but either in the highest for AMS or otherwise in the middle with“additional contributions”.4 The G-20 is the most ambitious of all, with 80-75-70percent cuts in OTDS ceiling and 80-70-60 percent cuts in AMS ceilings
The United States calls for a 50 percent reduction in allowed de minimis (to 2.5percent of the value of production) for each of product and non-product specificsupport. The EU calls for an 80 percent reduction in allowed de minimis to onepercent of the value of production while G-20 argues for reductions in de minimis asneeded to meet overall OTDS reductions.
All three proposals agree with the expanded definition of the Blue Box as putforth in the July Framework to encompass payments with production-limitingrequirements and payments that do not require production. However, the UnitedStates calls for the cap to be set at 2.5 percent of the value of production, instead offive percent as proposed in the July Framework.
Both the United States and the EU propose product specific caps in the Amberbox but with differing base periods: the United States recommends a base period of1999-2001 while the EU argues that product-specific caps should be based on theentire implementation period.
An empirical assessment of the October proposalsThe effects of these proposals on AMS and OTDS levels are shown in Figures 1and 2. The height of the bars in each figure shows the ceilings, while the percentageabove the bar shows the share of that support that could be eliminated withoutreducing actual support5. Therefore, the white area is equivalent to actual supportlevels and the grey area represents overhang (i.e., “water”) in the ceiling. The threelines across the bars show the level of the ceilings after the reductions implied byeach proposal.
These figures highlight the very large gaps between committed and actualsupport in recent years, and the consequent need for large reductions in ceilingsbefore any real policy changes will be required.

TRADE, DOHA, AND DEVELOPMENT: A WINDOW INTO THE ISSUES
108
In Figure 1, the EU would be required to reduce OTDS relative to the historicalbenchmark under all three proposals. This is politically feasible as the EU will beconverting most of its trade distorting payments into green box payments after the2003 CAP reforms.6
The ceiling for U.S. OTDS in Figure 1 shows that no reduction in supportrelative to the historical benchmark would be required under its own proposal,while a slight reduction would be required under the EU proposal and a significantreduction under the G-20 proposal. Of the other countries considered only the EUwould be required to reduce its AMS support relative to 1999-2001 levels, and onlyby 1 percentage point under the G-20 proposal.
In regards to the AMS ceilings for each of the three proposals shown in Figure2, only the United States would be required to make sizeable cuts in its actual AMS.Assuming the water due to the price-gap is eliminated simply by taking official pricesupports off the book, the United States would be left with a required cut of only$2,523 million, far less than the proposed 60 percent nominal reduction.
-
10
20
30
40
50
60
70
80
90
100
EU US Japan Korea Mexico Canada
64%
60% 92%
93%
99%
80%
Overhang
ActualUS Proposal
G-20 Proposal
EU Proposal
-
10
20
30
40
50
60
70
80
90
100
EU US Japan Korea Mexico Canada
64%
60% 92%
93%
99%
80%
Overhang
ActualUS Proposal
G-20 Proposal
EU Proposal
US Proposal
G-20 Proposal
EU Proposal
Source: Authors calculations based on data from WTO notifications
Figure 1. Water in domestic support
Overall Trade-Distorting Support (OTDS)US$ billion

DOMESTIC SUPPORT IN AGRICULTURE
109
While the reductions in actual support required by even the most ambitious ofthese proposals would be modest, the potential value of such disciplines is perhapsgreater than it seems in that it would rule out the possibility of countries’ potentiallyreverting to much higher levels of support in the future.
Suggestions for New Rules Which formula is finally adopted will be hugely important. In addition,negotiators will need to give careful attention to a number of other issues, either inthe current negotiations or in the future, including:• The 2004 Agriculture Framework proposed a cap on product-specific AMS. This
is important as it would limit countries’ ability to shift support among sensitivecommodities. The WTO also should consider introducing a commitment to reducesupport per unit and by sector, along the lines of a tariff, to make reductions moreeffective.
Figure 2. Water in domestic supportAMS (Aggregate Measure of Support)
Source: Authors calculations based on data from WTO notifications
US$ billion
-
10
20
30
40
50
60
70
EU US Japan Korea Mexico Canada
79%
47%
93%
99%
99%
90%
US Proposal
G-20 Proposal
EU Proposal
Overhang
Actual
-
10
20
30
40
50
60
70
EU US Japan Korea Mexico Canada
79%
47%
93%
99%
99%
90%
US Proposal
G-20 Proposal
EU Proposal
US Proposal
G-20 Proposal
EU Proposal
Overhang
Actual

TRADE, DOHA, AND DEVELOPMENT: A WINDOW INTO THE ISSUES
110
• Because of the WTO Cotton Panel ruling, product-specific direct-incomepayments to farmers in the Green Box should be distinguished from expendituresfor public goods. The former should be reported as part of a new Amber Box.
• Reduction commitments should be imposed only on the taxpayer-financed portionof the current AMS—plus the Blue Box, product-specific and non-product-specific de minimis subsidies, and product-specific, direct farm income paymentsunder the current Green Box. This new (flashing?) Amber Box would report onlydomestic subsidies that distort trade and that are not border protection. Such adiscipline will minimize countries’ ability to avoid reductions in support by shiftingsupport from box to box.
• The Green Box should be maintained for expenditures that provide publicgoods or prevent negative externalities. But programs listed in Annex 2 of theAgreement on Agriculture as non-trade-distorting or minimally trade-distortingmust be more tightly defined to screen out abuses. For example, crop insuranceprograms, which have been found to be very trade-distorting, are currently inthe Green Box, and tax concessions are not even considered support. Strictrules, definitions, and monitoring arrangements are required. In recognition ofthe fact that even these newly defined Green Box expenditures are likely tohave some effect on production (and therefore on trade), consideration shouldbe given to introducing a cap on the value of production.
Notes1. The World Bank–Netherlands Partnership Program and the United Kingdom’s Department
for International Development provided much-appreciated support for the research reportedhere. The note was written by Harry de Gorter, Associate Professor of Agricultural Economicsat Cornell University in Ithaca, New York, and by J. Daniel Cook, an international trade analystin the Agriculture and Fisheries Division, Office of Industries of the U.S. International TradeCommission (USITC). This paper’s view’s do not necessarily represent those of the USITC orany of its individual Commissioners. We are grateful to William J. Martin for the useful commentshe provided .
2. All three proposals use the same three tiers of >$60 bil, $10-$60 bil, and < $10 bil.3. U.S. and G-20 proposals use tiers of >$25 bil, $12-25 bil, and < $12 bil.4. For purposes of this analysis a 65 percent cut in Japan’s AMS will be used as the “additional
contribution.” It is possible for Japan to make the larger “contribution” and still not have theirAMS ceiling binding.
5. In making this calculation, we assume that WTO members would utilize their right undercurrent rules to exclude support provided through Market Price Support from their AMS byabolishing administered support prices while not changing any policies (as Japan did for rice in1997, thereby eliminating reported support calculated by the “price-gap”).
6. Also stated by the EU in their “Statement of EU conditional negotiating proposals – withexplanatory annotations”. 10 October 2005. Memo/05/357.

DOMESTIC SUPPORT IN AGRICULTURE
111
ReferencesBaffes, J., J. Daniel Cook, and H. de Gorter. 2005. “Issues in Measuring Domestic Agricultural
Support Disciplines in the WTO.” Trade Note, International Trade Department, WorldBank, Washington, DC.
Josling, Tim. 2005. “The WTO Agricultural Negotiations: Progress and Prospects,” Choices20(2): 131-136.
Further ReadingBrink, L. 2005. “WTO 2004 Agriculture Framework: Disciplines on Distorting Domestic
Support.” International Agricultural Trade Research Consortium Working Paper 05-1. May.http://iatrcweb.org/publications/working.htm
Cook, J. Daniel. 2005. “Issues on Disciplining Domestic Support for Agriculture in the WTO.”Unpublished MSc thesis, Cornell University, August.
Hart, C., and J. Beghin. 2006. “Rethinking Domestic Support Disciplines.” In AgriculturalTrade Reform and the Doha Development Agenda, ed. K. Anderson and W. Martin. Washingtonand New York: World Bank and Palgrave Macmillan.
Jensen, H., and H. Zobbe. 2006. “Consequences of Reducing AMS Limits.” In Agricultural TradeReform and the Doha Development Agenda, ed. K. Anderson and W. Martin. Washington andNew York: World Bank and Palgrave Macmillan.


Export Subsidies: Agricultural Policy Reform andDeveloping Countries
Harry de Gorter
8
The WTO’s July 2004 Framework Agreement calls for the elimination—by acredible date certain—of all forms of export subsidy in agriculture and fordisciplines on export measures that have the effect of a subsidy, including
the subsidy components of export credits and state trading enterprises (STEs).Food aid is to be disciplined to avoid disruption of commercial trade flows, whileexport taxes and restrictions are to be subject to tighter rules. The elimination ofexport subsidies and their equivalents will finally put agriculture on an equal foot-ing with manufacturing products, for which export subsidies were banned manyyears ago.1
So-called implicit export subsidies in many forms are disbursed indirectly andnontransparently through food aid programs, STEs (low-interest loans and gov-ernment underwriting of losses), publicly underwritten export credits (long maturi-ties and below-market interest rates), export promotion activities, and domesticpolicy levers that can, in combination, function as an export subsidy. Suchnontransparent mechanisms were subject to few disciplines in the Uruguay RoundAgreement on Agriculture (URAA) and so are key issues for the current negotia-tions, despite the complexity of calculating their subsidizing effect.
Export taxes, used in periods of high world prices to keep domestic prices low,are not constrained by the URAA. Because they increase the cost of food for netimporters, some countries are pressing in the current negotiations for constraintson such taxes and for greater flexibility to protect their own food-crop sectors andso increase self-sufficiency.
This note evaluates the effectiveness of the disciplines imposed on exportsubsidies in the URAA and presents options for new multilateral rules. We showhow countries have circumvented their commitments on explicit export subsidiesand explore issues related to indirect export subsidies, as well as some omissionsand improper measures associated with commitments to reduce export competition.
Explicit export subsidies in the URAACommitments on export competition in the URAA focused mostly on explicit, tax-payer-financed export subsidies. Twenty-five countries agreed to reduce both thevolume and value of their export subsidies and to prohibit new subsidies for 23product categories. Each country committed to reduce the volume of subsidizedexports by 21 percent over six years from the level in the 1986–90 base period (14percent over a 10-year period for developing countries), and to reduce the value of
109

TRADE, DOHA, AND DEVELOPMENT: A WINDOW INTO THE ISSUES
110
export subsidies by 36 percent (24 percent for developing countries). Temporaryexemptions for developing countries allow subsidies for marketing, handling, costreduction, and international transport, while the least developed countries are notsubject to reduction commitments at all.
Following adoption of the URAA, the European Union (EU) accounted formore than 90 percent of explicit export subsidies worldwide, which averaged about$5 billion per annum, well below the aggregate limit of approximately $10 billion.Apart from some isolated instances of limit breaches and the addition of exportsubsidies for some developing countries, the commitments were met. But this wasprimarily because the base period from which reductions were made was one of lowworld prices and high levels of export subsidy, making the targets easy to achieve.Abnormally high world prices in 1997–98, exchange rate developments, and domesticpolicy reforms all contributed to the ease with which countries fulfilled theircommitments. Finally, loopholes in the URAA (described below) were amplyexploited.
Table 1. Summary of provisions of the WTO Framework Agreementon export competition, July 2004
Source: Josling (2005).
Export subsidies
Export credits
Food aid
State trading enterprises
Special and differential treatment for developing countries
Export restrictions • Strengthen disciplines on export prohibitions and restrictions.
• Allow longer implementation periods for reductions and elimination.• Permit developing countries to continue to benefit from Article 9.4 exceptions.• Make appropriate provisions for export credits in line with Decision on Least Developed and Net Food-Importing Countries.• Accord developing countries special consideration in negotiation of disciplines on STEs.• Allow, in exceptional circumstances, ad hoc temporary financing arrangements relating to exports to developing countries.
• Eliminate export subsidies by a credible end date.• Agree on schedule and modalities of reductions.
• Eliminate export credits, guarantees, and insurance programs with repayment period of more than 180 days.
• Eliminate food aid that is not in conformity with disciplines to be agreed. Disciplines will be aimed at preventing commercial displacement.• Negotiate other food aid issues (role of international organizations, humanitarian and development issues, aid in grant form).
• Eliminate trade-distorting practices of state trading enterprises.• Negotiate use of monopoly powers.

EXPORT SUBSIDIES
111
Circumventing explicit export subsidy commitmentsThe experience of the Uruguay Round has important implications for the currentnegotiations. Several loopholes in the URAA made commitments to reduce directexport subsidies less effective than they appear to have been.• Countries were allowed to designate a different base period (1991–92) other
than the initial 1986–90 average. In anticipation of this option, some countriesactually increased subsidies in the 1991–92 period, a practice known as front-loading.
• Subsidy commitments could be banked across years if unused, a practiceknown as rollover, or shielded under commodity-group aggregates. Rolloverallowed countries to increase subsidies when world prices were low, furtherdepressing the world price to the detriment of producers in developing coun-tries. Because reduction commitments were tied to commodity groups, coun-tries could avoid reductions on selected products while meeting their aggre-gate commitment by reducing subsidies on other lines in the same group.
• As opposed to the discipline on tariffs, where per unit or ad valorem duties arebound, only the total amount spent on export subsidies (or the volume ex-ported) is regulated. This implies less control over the trade distortions causedby export subsidies, because the same value of export subsidy allocated to acommodity can have different effects on the quantities exported, and thereforeon world price. The data on export subsidy equivalents confirm that thesedifferences are significant across countries, commodities, and over time (Ruiz2000).
• Failure to restrict per unit subsidies also allows seasonal subsidies, wherebyexports receive high subsidies for part of the year without causing the total ofthe period to exceed the constraint. During the season of high subsidy, theimpact on world price can be substantial.The objective of eliminating all forms of export subsidies must necessarily
close opportunities for avoidance of and delay in implementing trade liberalization.
Issues related to implicit export subsidiesIndirect export subsidies not only are more difficult to measure than direct subsi-dies, but also involve programs that under some circumstances are beneficial orcrucial, such as food aid. Hence, any rules to discipline their use must be carefullydesigned and will involve more disciplines on reporting and monitoring than willthose on more explicit forms of subsidy.
Food aidAlthough food aid can have market effects similar to those of export subsidies, itwas not included in the URAA schedule of reductions. Crucial in cases of nationaldisaster, food aid has been used by developed countries to dispose of surpluses,

TRADE, DOHA, AND DEVELOPMENT: A WINDOW INTO THE ISSUES
112
provide budget support for the recipient government, and underpin foreign policy.Such uses have created serious problems. When given in kind, food aid may bedetrimental to local producers by lowering prices and altering traditional dietarypreferences. When distributed outside normal commercial distribution channels—as it usually is—in-kind food aid also disrupts the development of those channelsand interrupts the movement of food to the deficit areas from surplus regions in thecountry and from neighboring countries. Disruption increases the likelihood andseverity of future famine. Hence, food aid should be purchased from other develop-ing countries and from food surplus areas of the country assisted, as a first priority.Also, food aid should never be used by industrial countries as a way of disposingof surpluses.
To avoid these risks, food aid in full grant form such as cash or vouchersshould be directed to meet the needs of well-defined vulnerable groups or in re-sponse to an emergency as determined by the United Nations. This will also sup-port local producers and traders. For these reasons, cash aid is often preferable toin-kind distribution. The exceptions are crisis situations where transportation isseverely disrupted or markets are not functioning, or when there are good reasonsto believe that in-kind food distribution can be better targeted to those with thegreatest need.
Export creditsOfficially supported export credit programs average about $6.5 billion per annum,with the United States providing around 50 percent of the world total. The pro-grams involve credit guarantees, public assumption of risk, and subsidization ofinterest and insurance. It is very difficult to measure the value of the export subsidyassociated with these programs because the value of the risk reduction they pro-vide is difficult to estimate. At the same time, export credit programs enhance foodsecurity for countries suffering from financial or food crisis, thereby expandingexports to everyone’s benefit. However, only about 20 percent of agricultural exportcredit is extended to poor developing countries. Although the subsidy componentof these credit programs is found to be small, disciplines are required for all suchpublic expenditures (with exemptions for poor country importers in emergencysituations).
State trading enterprisesSTEs and domestic policies that allow for market segmentation and protection ofdomestic markets can subsidize exports through price discrimination, that is, byusing revenues from high domestic prices to subsidize fixed costs for the rest ofproduction, which is then exported (box 1). STEs and domestic marketing arrange-

EXPORT SUBSIDIES
113
Box 1. Price discrimination and pooling can combine to createan export subsidy
Export subsidies based on price pooling and price discrimination are quitecomplex and can occur in different settings. Extra revenues derived fromprice discrimination are “pooled” and then “averaged” to farmers, therebyacting as a production subsidy, while higher prices to consumers act like aconsumption tax. No tax revenues are involved, but the outcome is identicalto that of a standard taxpayer-financed export subsidy: supply is increasedand demand is reduced at the same time. Such practices are often referred toas “consumer-financed” export subsidies.
Price discrimination with pooling can be carried out by an STE or throughlegislation fixing domestic prices. Nontraded domestic products (fluid milk,for example) can be used to support implicit export subsidies. Although themilk itself is not traded internationally, its high domestic price can be used tocross-subsidize exports of related products such as cheese or milk powder. Ifan STE practices price discrimination only in world market segments, withouttaxing domestic consumers, but pools the revenues, the resulting subsidy isnot disciplined in the URAA.
The Dispute Settlement Body of the WTO ruled in 2003 and 2004 for theCanadian dairy and EU sugar sectors, respectively, that price discriminationalone with production quotas have the effect of cross-subsidizing exportsand so violate commitments made under the URAA to reduce exportsubsidies. The WTO panel agreed with Brazil’s argument that higherdomestic prices for quota production have allowed farmers to expand outputand sell the extra output at lower world prices below total average costs ofproduction. The practice constitutes a subsidy because losses in one market(the export market) are offset by profits in another (the domestic quotamarket).
Why should farmers accept a loss on exports? Because the unit-cost sav-ings they realize from higher output are greater than the marginal losses theyincur. Exploiting economies of scale under these circumstances constitutescross-subsidization, according to the WTO panel. Output is also distortedbecause some farmers limit their production to the quota amount and wouldhave exited the industry were it not for high domestic prices on the quota. Thisis output distortion due to “exit deterrence” as opposed to distortions that aredue to cross-subsidization (where some farmers produce beyond the quotaamount at lower world prices but are able to do so because of higher domesticprices).

TRADE, DOHA, AND DEVELOPMENT: A WINDOW INTO THE ISSUES
114
ments can also be used to pool revenues to farmers, a practice that constitutes anexport subsidy if domestic consumer prices are higher than world prices. Domesticproduction expands with pooling, and consumption declines, as in the case of ataxpayer-financed export subsidy. Pooling can occur over time and across marketsand commodities.
Some export STEs may counter the power of multinational trading firms andhence may improve competitive conditions in the market. But disciplines are neededto ensure that STEs are more transparent and subject to the same general rules asprivate firms. In particular, disciplines should be placed on price pooling and ontaxpayer support to STEs (for credit guarantees or promotion, for example), withtargets for their eventual phasing out. More stringent requirements for reportingacquisition costs and prices are required to ensure that any price discrimination bythe STE is within normal business practices and that no product is sold on worldmarkets consistently below domestic prices. There should be no discriminationagainst private firms’ participation in the market; nondiscrimination discouragesSTEs from using discriminatory practices. Special financing privileges should bealso disciplined, with exemptions for poor countries dealing with inadequate insti-tutional infrastructure.
Objectives for negotiatorsSome lessons can be drawn regarding the general principles of an effective agreementon export subsidies, and some specific holes can be identified that need to beeliminated.
General principles• Because countries have committed to eliminate all forms of export subsidy, a
firm deadline for phasing them out should be agreed upon. Five years may bereasonable.
• Countries are encouraged to make a gesture of good faith when signing the
Box 1 (continued)
These rulings have implications for all production subsidies on limited out-put (known as “infra-marginal” subsidies), whether financed by taxpayers orconsumers. Subsidies on a limited amount of output have been increasingsince the URAA was adopted. It is therefore possible that other commoditysectors and countries are in contravention of their export subsidy reductioncommitments.
Source: Kropp and de Gorter (2005).

EXPORT SUBSIDIES
115
agreement by offering a down payment in the form of an across the board cutin export subsidies immediately.
• Ad valorem (percentage) limits on the per unit subsidy (as a percentage of theworld price) should be introduced on a commodity-by-commodity basis, com-bined with a ceiling on the total value of exports that may be subsidized. Thead valorem limit will place a constraint on the difference between domestic andworld prices, while the value limit will constrain the impact of export subsidieson world markets.
• Monitoring of export subsidies should be strengthened by coordinating datacollection among organizations (including the OECD and the WTO). One pos-sibility is to consider mandating the WTO Trade Policy Review Mechanism toprovide an annual evaluation of the effects of export subsidies, focusing inparticular on developing countries.
• The banking of export subsidies, whereby they are rolled over to subsequentyears, should be banned.
• All commitments should be made on a per product basis, accompanied by auniform system of classifying products.
• Delaying or avoiding reductions through practices like front-loading shouldbe anticipated and prevented.
• Special and differential treatment for developing countries should not go be-yond Article 9.4 of the URAA, which specifies exclusions for subsidies onmarketing, handling and transportation only.
Plugging holes in the URAA• The URAA lacks rules that directly govern export credits, payment guaran-
tees, and direct financing. As these policies have the effect of subsidizingexports, such rules are needed as part of the disciplines on export subsidies.The methodology developed by the OECD (2001) should be adopted to in-clude the export-subsidy component of such measures; that component wouldbe counted against reduction commitments.
• Specific disciplines on export credits should be established, such as a maxi-mum repayment term, a minimum cash payment by the importer, and premiumsbased on risk.
• All expenditures involving direct, in-kind disposal of public food stocks inexport markets should be subjected to the same rules as normal export subsidies.
• URAA provisions on food aid should be tightened to facilitate genuine foodaid while preventing the abuse of aid to circumvent export subsidy restrictions.Proposals include limiting food aid to the form of grants only, and to provisionin-kind only in response to appeals from the United Nations or other appropriateinternational bodies. Donations in cash or channeled through international

TRADE, DOHA, AND DEVELOPMENT: A WINDOW INTO THE ISSUES
116
agencies should be preferred (WTO 2002).• Stronger disciplines on STEs are needed. At a minimum, STEs should be
subjected to the same export-subsidy rules as private sector enterprises.Notification and transparency requirements must be tightened to preventdisguised export subsidies. Government financing and underwriting of lossesshould be eliminated, as well as any associated direct export subsidies. Oneoption would be to strengthen and extend the disciplines of GATT Article XVIIand Article II on state-trading exports to include limits on ad valorem subsidies.Another option is to mandate coexistence with private companies to eliminatethe monopoly element of the market.
• Rules are needed to constrain consumer-financed export subsidies, especiallyrevenue-pooling arrangements or cross-subsidization through pricediscrimination.
• Export taxes should be constrained and eventually phased out. For any devel-oping countries that still depend on these taxes as an important source ofgovernment revenue, the phaseout period could be prolonged.
Notes1. This note was prepared by Harry de Gorter who is an Assistant Professor of Agricultural
Economics at Cornell University in Ithaca, New York.
ReferencesJosling, Tim. 2005. “The WTO Agricultural Negotiations: Progress and Prospects,” Choices
20(2): pp 133.Kropp, J., and H. de Gorter. 2005. “The Economics of Cross-Subsidization: Implications of the
WTO Panels on EU Sugar and Canadian Dairy.” Paper presented at the IATRC summersymposium on Pressures for Agricultural Policy Reform, Seville, Spain, June 21.
OECD (Organisation for Economic Co-operation and Development). 2001. July. Paris.Ruiz, L. 2000. “The Impacts of Export Subsidy Reduction Commitments in the Agreement on
Agriculture on International Trade: A General Assessment”. M.S. thesis, August, CornellUniversity.
World Trade Organization Negotiations on Agriculture Committee on Agriculture Special Session
TN/AG/6 (02-6943) December 18, 2002.
Further ReadingMesserlin, P. and B. Hoekman. 2005. “Consequences of Removing the Exception of Agricul-
tural Export Subsidies”. In Agricultural Trade Reform and the Doha Development Agenda, K.Anderson and W. Martin (eds.), New York: Palgrave Macmillan co-published with the WorldBank.

EXPORT SUBSIDIES
117
de Gorter, H., L. Ruiz, and M. Ingco, M. 2004. “Export Competition Policies.” In Agricultureand the WTO: Creating a Trade Sysytem for Development, M. Ingco and J. Nash (eds.),Washington, D.C., and New York: World Bank and Oxford Press.


Cotton and the Developing Countries: Implications forDevelopment
John Baffes
9
When it comes to cotton, rich countries’ trade policies negate their devel-opment policies. Subsidies paid to producers in rich countries depressworld prices and cut into the livelihood of millions in developing
countries, where cotton is a typical, and often dominant, smallholder crop.Cotton’s share in world trade is small, but it is an important cash crop for
several poor countries at both farm and national levels. For four West Africanproducers (Benin, Burkina Faso, Chad and Mali), for example, cotton represented20–44 percent of total merchandise exports in 2001-03. The corresponding figuresfor Uzbekistan, Tajikistan, and Turkmenistan were 32, 15, and 12 percent, respectively.Cotton’s contribution to the Gross Domestic Product (GDP) of these countries hasbeen substantial, ranging from 2.4 percent (Chad) to 6.1 percent (Mali). The percapita GDP in most of these cotton-dependent countries is well below $500 (table 1).
This note analyzes the effects of government interventions in the global cottonmarket.
The market settingMore than two thirds of the world’s cotton is produced by developing countries.Over the last four decades production grew at an annual rate of 1.8 percent, reaching25 million tons in 2005 (from 10.2 million tons in 1960). Most of the growth came fromChina and India, which tripled and doubled their production during the period.Other countries that significantly increased their shares of the world cotton marketwere Greece, Pakistan, and Turkey. Some new entrants also contributed to thisgrowth. Australia, for example, which produced only 2,000 tons of cotton in 1960,averaged 650,000 tons during the late 1990s. Francophone Africa produced lessthan 100,000 tons in the 1960s and now produces ten times as much. The UnitedStates and the Central Asian republics of the former Soviet Union, the two dominantcotton producers during the 1960s, have maintained their output levels at about 3.5and 1.5 million tons, respectively, effectively halving their market shares. A numberof Central American countries that used to produce almost 250,000 tons of the fibernow produce virtually none.
A recent survey of costs of cotton production found that Brazil, China, andPakistan are the lowest-cost producers, followed by Australia, Turkey, and WestAfrica. High-cost producers are Israel, Syria and the United States (U.S.). In linewith most primary commodities, real prices for cotton have declined considerablyduring the last 40 years; they are currently half their 1960 levels. There is no doubt
119

TRADE, DOHA, AND DEVELOPMENT: A WINDOW INTO THE ISSUES
120
that the low prices seen recently have been influenced by the support provided bymajor players, which we now examine.
The policy settingRich countries protect their cotton industries through domestic subsidies whichaveraged $4 billion annually between 1997 and 2004 (table 2). Cotton subsidies inthe United States have a long history dating from the commodity programs of theGreat Depression. The specific provisions of these programs—including the onefor cotton—change with each “Farm Bill” passed by the Congress (Farm Bills areintroduced approximately every 4 to 5 years), but their chief objective has remainedlargely unchanged: to transfer income from taxpayers (and to a lesser extentconsumers) to commodity producers.
The main channels of support to U.S. cotton producers are price-basedpayments, decoupled payments, crop insurance, and countercyclical payments(table 3). U.S. cotton users and exporters also receive some support.• Price-based payments (also known as loan rate payments) are designed to
compensate cotton growers for the difference between the market price andthe target price when the latter exceeds the former.
• Decoupled payments (renamed direct payments in the 2002 Farm Bill) arepredetermined annual payments calculated on the basis of area historically
Table 1. Cotton’s importance to West African and Central Asianeconomies, 2001-03 Averages
Source: Food and Agriculture Organization (FAOSTAT) and World Bank (World DevelopmentIndicators).
Burkina Faso 105 44.6 3.3 235 245Chad 53 29.4 2.4 182 381Benin 126 27.7 4.5 455 289Mali 193 22.7 6.1 849 203Togo 42 8.9 2.7 467 251
Central AsiaUzbekistan 727 22.1 4.4 3,295 591Tajikistan 103 14.1 7.7 729 190Kyrgyzstan 36 7 2.2 524 295Turkmenistan 139 4.5 3 3,065 859Azerbaijan 22 1.2 0.3 1,906 788Kazakhstan 86 0.8 0.3 10,412 1,534
West and Central Africa
Cotton exports
U.S.$ millions
Per capita GDP
(2000 US$)
Merchandiseexports
(US$ millions)
Percentageof GDP
Percentage of merchandise
exports

COTTON AND THE DEVELOPING COUNTRIES
121
used for cotton production. Direct payments were introduced with the 1996Farm Bill to compensate producers for “losses” following the elimination ofdeficiency payments.
• Crop insurance is a subsidy to weather-related crop failures.• Countercyclical payments were introduced in 1998 (as “emergency payments”)
to compensate producers for income “lost” due to low commodity prices. Theywere made permanent under the 2002 Farm Bill. Payments to cotton exportersand domestic end-users (also known as export subsidies or Step-2 payments)are made when domestic prices exceed world prices, so that U.S. exportersmaintain their competitiveness. Implicitly, cotton exporters receive anothersubsidy through the export credit guarantee program which insures importersof U.S. cotton against potential defaults.In addition to these transfers there are numerous other publicly funded
programs—among them research and extension services and subsidized irrigation.The European Union’s (EU) budgetary expenditure on the cotton sector ranged
between €740 million and €903 million in 1996–2000, implying that, on average, EUcotton producers received more than twice the world price (table 2). EU cottonproducers receive support even in periods of high prices, since the budgetaryallocation to the cotton sector must be disbursed. They received approximately thesame level of support in 1995 and 2002, for example, although cotton prices in 1995were twice as high as in 2002.
The European Union has made adjustments to its cotton program, among thema 1999 reform that effectively capped the budgetary expenditures allocated to theindustry. A major reinstrumentation of the EU cotton program will take place in 2006.Under the Luxembourg Council’s decision of April 22, 2004 (based on a September2003 proposal), an estimated €700 million is expected to fund two support measures,
Table 2. Estimated government assistance to cotton producers,1997–2004
1997 1998 1999 2000 2001 2002 2003 2004
US 1,163 1,947 3,432 2,149 3,937 3,075 1,021 2,244China 2,013 2,648 1,534 1,900 1,217 800 1,303 1,145Greece 659 660 596 537 735 718 761 836Spain 211 204 199 179 245 239 233 230Turkey — 220 199 106 59 57 22 115Brazil 29 52 44 44 10 — — —Mexico 13 15 28 23 18 7 6 49Egypt 290 — 20 14 23 33 9 89
U.S. $ millions
Notes:— No dataSource: International Cotton Advisory committee; US Department of Agriculture;
European Union.

TRADE, DOHA, AND DEVELOPMENT: A WINDOW INTO THE ISSUES
122
with 65 percent of the support taking the form of a single decoupled payment andthe remaining 35 percent taking the form of an area payment. Eligibility for thedecoupled payment is limited to growers who produced cotton during the three-year period 1999–2001. The area payment will be given for a maximum area of380,000 hectares in Greece, 85,000 hectares in Spain, and 360 hectares in Portugaland will be proportionately reduced if claims exceed the maximum area allocated toeach country. To receive decoupled payments, cotton growers must keep the landin good agricultural use. To receive area payments they must plant (but notnecessarily produce) cotton.
Impact of policiesNumerous models have evaluated the impact of policies on the cotton market, withconsiderable variation in the results. The International Cotton Advisory Committee(ICAC), for example, concluded from a study based on a short-run partial equilibriummodel that in the absence of direct subsidies, average cotton prices during the2000–01 season would have been 30 percent higher than what they actually were.The ICAC study acknowledged that while the removal of subsidies would result inlower production in the countries that use them (and hence higher prices in theshort term), the impact would be partially offset by shifting production tononsubsidizing countries in the medium to longer terms. Goreux (2003), who extendedthe ICAC model by replacing the base year with average subsidies for 1998–2002,estimated that in the absence of support the world price of cotton would have beenbetween 3 and 13 percent higher during that period, depending on the value ofdemand and supply elasticities. Gilson and others (2004), using subsidy data for1999 and a model similar to Goreux’s, estimated that removal of subsidies by theChina, the European Union, and the United States, and would increase the worldprice of cotton by 18 percent.
Reeves and others (2001) used a simple Computable General Equilibrium (CGE)model to find that removal of production and export subsidies by the United States
(millions of U.S. dollars)
Table 3. Budgetary transfers to the U.S. cotton sector, 1995–1996 to2002–2003
1995 1996 1997 1998 1999 2000 2001 2002Coupled 3 0 28 535 1,613 563 2,507 248
PFC/DP 0 599 597 637 614 575 474 914
Emergency/CCP 0 0 0 316 613 613 524 1,264
Insurance 180 157 148 151 170 162 236 194
Step-2 34 3 390 308 422 236 196 455
TOTAL 217 759 1,163 1,947 3,432 2,149 3,937 3,075
Note: PFC = production flexibility contracts. DP = direct payments. CCP = countercyclicalpayments.
Source: U.S. Department of Agriculture.

COTTON AND THE DEVELOPING COUNTRIES
123
and the European Union would reduce U.S. cotton production by 20 percent andexports by 50 percent, with much higher figures for the European Union. They alsoestimated that if support were not in place, world cotton prices would be 10.7percent higher compared to their 2001–02 levels. FAPRI (2002) found that underglobal liberalization (removal of trade barriers and domestic support in all commoditysectors), the world price for cotton would increase over the baseline scenario by anaverage of 12.7 percent over the 10-year period. Based largely on the FoodAgricultural Policy Research Institute’s (FAPRI) data and assumptions, Sumner(2003) estimated that had all U.S. cotton subsidies not been in place during themarketing years 1999–2002, the world price of cotton would have been almost 13percent higher.
Based on a partial equilibrium model, Tokarick (2003) found that multilateraltrade liberalization in all agricultural markets (including cotton) is expected to inducea 2.8 percent increase in the world price of cotton. Tokarick also calculated thatglobal reforms will generate annual gains of $95 million. Poonyth and others (2004)estimated that removal of cotton subsidies (as reported in the World TradeOrganization (WTO) notifications) would increase the world price of cotton between3.1 and 4.8 percent, depending on the assumed value of demand and supplyelasticities. Shepherd (2004) and Pan and others (2004) found a negligible impact ofsubsidies on the world price of cotton.
The models reviewed here produced highly divergent results, partly reflectingthe structure of the models and the assumed elasticities. But a number of otherreasons are at play as well. First, there are differences in the level and structure ofsupport. For example, some models incorporate China’s support to its cotton sector
Table 4. Effect of removal of distortions in world cotton market,2003-2004 to 2011-2012
Note: Average is taken over the 10-year period 2001-2002 to 2010-2011.Source: Food and Agriculture Policy Research Institute (2002).
2003–2004 2005–2006 2007–2008 2009–2010 2011–2012 Averagea
World Price 15.6 13.7 13 12.2 11.7 12.7Exports
Africa 12.1 15.1 14 13.1 12.3 12.6Australia 3.9 3 2.7 2.3 2.1 2.7United States –8.4 –6.6 –4.0 –1.5 0.9 –3.5Uzbekistan 5.4 6.9 6.7 6.4 6.2 6World 3.9 5.6 6.2 6.7 7.3 5.8
ProductionUnited States –18.3 –7.9 –5.9 –4.1 –2.3 –6.7European Union –77.4 –77.7 –78.3 –78.8 –79.0 –70.5Uzbekistan 3.1 4.7 4.6 4.4 4.2 4Africa 4.5 7.5 7.1 6.7 6.3 6
(percentage change over baseline)

TRADE, DOHA, AND DEVELOPMENT: A WINDOW INTO THE ISSUES
124
and hence model its removal; others do not. Second, there are differences in theunderlying scenarios. Some models assume liberalization in all commodity markets,whereas others assume liberalization in the cotton sector only. Third, the modelsuse different base years and hence different levels of subsidies. For example, supportin the United States during 1999 was three times as high as in 1997.
Setting all differences aside, however, and taking a simple average over allmodels, it appears that in the absence of support the world cotton price would havebeen about 10 percent higher than it actually was. Applying that simple average tothe cotton-producing countries of Francophone Africa, those countries lostapproximately $150 million annually in export earnings due to subsidies.
Not all models reported gainers and losers from the removal of cotton subsidies.The most complete analysis in that respect is offered by the FAPRI study. FAPRIconcluded that the largest gains would go to Africa, which would increase itsexports by an average of 12.6 percent (table 4). Exports from Uzbekistan and Australiawould increase by 6.0 and 2.7 percent, respectively, while exports from the UnitedStates would decline by 3.5 percent. The most dramatic impact would come on theproduction side: the European Union’s cotton output would decline by more than70 percent.
In addition to low prices and a skewing of export shares, support by majorplayers has triggered several noteworthy reactions:• Many cotton-producing countries have introduced “reactive support.” For
example, the Arab Republic of Egypt, Brazil, India, Mexico and Turkey provided$0.5 billion in support for their producers in 2001–02.
• Brazil initiated a WTO consultation, claiming losses to its cotton exports fromsubsidies by the United States. WTO recently ruled in Brazil’s favor.
• Four West African cotton producers (Benin, Burkina Faso, Chad, and Mali) arepressing the WTO for accelerated removal of support for cotton (in the so-called West Africa Cotton Sector Initiative).
Implications of cotton policiesBrazil vs. the United StatesOn September 27, 2002, Brazil requested consultation with the United Statesregarding U.S. subsidies to cotton producers. On March 18, 2003, the DisputeSettlement Body of the WTO established a panel to examine the issue, and on April26, 2004, the WTO issued an interim ruling in favor of Brazil. The final ruling (issuedon September 8, 2004) concluded that “the United States is under the obligation totake appropriate steps to remove the adverse effects or…withdraw the subsidy”(WTO 2004a).
Brazil argued that U.S. cotton subsidies were inconsistent with provisions ofthe Agreement on Subsidies and Countervailing Measures, the Agreement onAgriculture, and the General Agreement on Tariffs and Trade and were causing

COTTON AND THE DEVELOPING COUNTRIES
125
“serious prejudice to the interests of Brazil” because of a “significant price depressionand price suppression” (WTO 2002). Brazil’s claims can be summarized as follows(Schnepf 2004):• During the four marketing years from 1999 to 2002 U.S. domestic support to
cotton was in excess of the support provided in 1992, the limit year under theWTO Agreement on Subsidies and Countervailing Measures (figure 1).
• U.S. export subsidies (export credit guarantees and the so-called step-2payments) violated the Agreement on Agriculture.
• Direct payments to U.S. producers did not qualify for exemption from reductioncommitments as decoupled support, because of the associated prohibitionagainst the planting of fruits and vegetables (i.e. direct payments should havebeen reported under the Amber Box instead of the Green Box category).Using the econometric model developed by FAPRI discussed earlier, Brazil
claimed that the U.S. subsidies induced a 41 percent increase in U.S. cotton exports,reducing the world price of cotton by 12.6 percent and causing an estimated injuryto Brazil of more than $600 million for 2001 alone. The United States appealed thecase but the original ruling remained by and large intact. The U.S. announced thatit would eliminate the export subsidies. However, it remains unclear what, if any,steps it will take regarding containing the overall level of subsidies and theinappropriate placing of direct payments in the Amber Box.
The ruling was issued against the background of the ongoing critical agriculturalnegotiations, the expiration of the peace clause, the more assertive stance taken bythe G-20, and the West African sectoral initiative on cotton (see following section).
0.0
1.0
2.0
3.0
4.0
1985/86 1987/88 1989/90 1991/92 1993/94 1995/96 1997/98 1999/00 2001/02 2003/04
1991/92 level of assistance
Figure 1. Assistance to US Cotton Growers (US $ billion)
Source: US Department of Agriculture

TRADE, DOHA, AND DEVELOPMENT: A WINDOW INTO THE ISSUES
126
The ruling has numerous implications for the WTO and the Doha DevelopmentAgenda and for developing countries and international institutions (Baffes 2005c):• As the first case of a developing country challenging an OECD farm subsidy
program in the WTO, it may set a precedent. If further cases follow, there maybe a shift in the focus of WTO activities from negotiation to litigation.
• The way to avoid a significant increase in such disputes is to make significantprogress in the Doha Development Agenda. Hence, the ruling may help agenciessuch as the EU Commission and the U.S. Trade Representative’s Office confrontdomestic protectionist lobbies.
• The ruling strengthens the claims of many developing countries that OECDsubsidies distort global commodity markets and depress world prices.
• This dispute spotlights the importance of models analyzing the effects ofsubsidies on world prices and export shares, making model developers moreaccountable for the analysis. The ruling reveals the importance and weaknessesof current measures of support and the differences in WTO, U.S., and EUdefinitions of “decoupled support.”
West African cotton sector initiativeOn May 16, 2003, four West African cotton producing countries (Benin, BurkinaFaso, Chad, and Mali) submitted a joint proposal to the WTO demanding removalof support to the cotton sector by the United States, China, and the EuropeanUnion and compensation for damages until full removal of support. The WestAfrican countries were aided in this move, often referred to as the “cotton initiative,”by IDEAS, a Geneva-based NGO funded by the Swiss government.
The four countries argued that subsidies cost them an estimated $250 million inexport earnings during the 2001/02 marketing season—$1 billion when the indirecteffects of these subsidies were considered (cotton prices averaged $0.82 a kilogramin October 2001, the lowest since November 1972 with the exception of August1986). Because the standard WTO remedies (compensation through supplementaryconcessions or imposition of countervailing duties) were not feasible, the proposalcalled for “transitional…financial compensation…to offset the injury caused bysupport of production and export.” The compensation would be proportional to thesubsidies, declining and ending as the subsidies were reduced and abolished. Theproposal argued that the direct and indirect effects of support for cotton productionshould be taken into account when determining compensation and that “the unitamount and the total amount of subsidies should be taken into account when dividingthe compensation among countries which subsidize production” (WTO 2003).
The initiative received considerable attention during the Cancùn Ministerial.The director general of WTO urged ministers to consider the proposal “seriously.”While numerous countries were sympathetic, there were doubts whether it would

COTTON AND THE DEVELOPING COUNTRIES
127
benefit the Doha Development Agenda to treat one commodity differently fromothers. Furthermore, it soon became apparent that direct compensation was unlikely.The inability to deal effectively with the initiative was one reason for the failure toreach agreement in Cancùn.
It was finally determined that while the trade part of the request (subsidies) fellwithin WTO’s mandate, the development part of the request (compensation) shouldbe handled by the multilateral institutions in coordination with the concernedgovernments. To that end, at a WTO-sponsored conference on March 23–24, 2004,in Cotonou, Benin, both bilateral and multilateral donors reaffirmed their willingnessto deal with the development part of the cotton initiative.
On August 1, 2004, the WTO General Council reached a decision to proceedwith multilateral trade negotiations, emphasizing that the theme should be addressed“ambitiously, expeditiously, and specifically” (WTO 2004b). The director generalwas instructed to consult with international organizations, including the BrettonWoods institutions, the Food and Agriculture Organization, and the InternationalTrade Center, to direct existing programs and any additional resources towarddevelopment of the economies where cotton is of vital importance. Progress on the“cotton initiative” is being monitored at WTO meetings following the establishmentof the sub-committee on cotton (WTO 2004c).
Policy changesAs mentioned above, the European Union reformed its cotton policy recently byreplacing its price-support mechanism with two new support measures. With thenew support structure expected to be in place until 2011, EU cotton producers willstill receive subsidies, albeit with a less distorting effect on production and trade.The 2002 U.S. Farm Bill, on the other hand, which will be in place until 2007 guaranteesU.S. cotton producers high prices until 2007. However, part of this subsidy may beremoved or altered in response to the recent WTO ruling.
Several cotton-producing countries (especially in Sub-Saharan Africa) thathad been taxing their cotton sectors undertook substantial policy reforms in the1990s to increase efficiency. Although these reforms have beenattributed—correctly—to conditions imposed by the World Bank and theInternational Monetary Fund in the context of structural adjustment programs, thereforms were the only feasible alternative in most cases. Faced with falling worldcotton prices and plagued by inefficiencies, poor management, and often outrightcorruption, the parastatals that handled the marketing and trade of cotton had beenstaggering under huge debts, remaining afloat only through infusions of statecapital. Some had even gone bankrupt.
Substantial reforms were undertaken during the mid-1990s by Tanzania, Uganda,Zambia, and Zimbabwe (Baffes 2001). With the exception of Tanzania (where thereform process was never completed), the reforms generated a considerable supply

TRADE, DOHA, AND DEVELOPMENT: A WINDOW INTO THE ISSUES
128
response. Growers now receive a higher share of export prices and timely payments.There have been numerous reports that the quality of cotton declined after thereforms, but these reports have not been substantiated. West African cottonproducers are also contemplating reforms. Central Asian cotton producers, mainlyUzbekistan, still intervene heavily in their cotton sectors; reforms are unlikely totake place soon.
ReferencesBaffes, J. 2001 “Policy Reforms in the Cotton Market.” In Commodity Market Reforms:
Lessons from Two Decades, ed. A. Takamasa, J. Baffes, D. Larson, and P. Varangis. Regionaland Sectoral Studies, World Bank, Washington, DC.
______ 2005. “The Cotton Problem.” The World Bank Research Observer 20:109-144.FAPRI (Food and Agricultural Policy Research Institute) (2002). “The Doha Round of the
World Trade Organization: Liberalization of Agricultural Markets and its Impact on DevelopingEconomies.” Paper presented at the IATRC Winter Meetings.
Goreux, L. 2004. “Reforming the Cotton Sector in Sub-Saharan Africa.” Africa Region WorkingPaper Series 47. World Bank, Washington, DC.
International Cotton Advisory Committee. 2003. Production and Trade Policies Affecting theCotton Industry. Washington, DC.
Pan, S., S. Mohanty, D. Ethridge, and M. Fadiga. 2004. “The Impacts of U.S. Cotton Programson the World Market: An Analysis of Brazilian and West African WTO Petitions.” Departmentof Agricultural and Applied Economics, Texas Tech University.
Poonyth, D., A. Sarris, R. Sharma, and S. Shui. 2004. “The Impact of Domestic and TradePolicies on the World Cotton Market.” Commodity and Trade Policy Research WorkingPaper, U.N. Food and Agriculture Organization, Rome.
Reeves, G., D. Vincent, D. Quirke, and S. Wyatt. 2001. “Trade Distortions and Cotton Markets:Implications for Global Cotton Producers.” Center for International Economics, Canberra.
Schnepf, R. (2004). “U.S.-Brazil WTO Cotton Subsidy Issue.” Congressional Research ServiceReport. Washington, D.C
Shepherd, B. 2004. “The Impact of U.S. Subsidies on the World Market of Cotton: AReassessment.” Groupe d’Economie Mondiale (GEM), Institut d’Etudes Politiques de Paris.
Sumner, D. A. 2003 “A Quantitative Simulation Analysis of the Impacts of U.S. Cotton Subsidieson Cotton Prices and Quantities.” Unpublished paper, Department of Agricultural and ResourceEconomics, University of California, Davis.
Tokarick, S. (2003). “Measuring the Impact of Distortions in Agricultural Trade in Partial andGeneral Equilibrium.” International Monetary Fund Working Paper, WP/03/110, Washington,DC.
World Trade Organization (2002). United States—Subsidies on Upland Cotton: Request forConsultations by Brazil. WT/DS267/1. Geneva.
_____ (2004a). United States—Subsidies on Upland Cotton: Report of the Panel. WT/DS267/R. Geneva.
_____ (2004b). Doha Work Programme. WT/L/579. Geneva._____ (2004c). Establishment of the Sub-Committee on Cotton. TN/AG/13. Geneva.

Sugar Policies: Opportunity for Change
Donald Mitchell10
The source of about 7 percent of the world’s calorie supplies, sugar is animportant commodity in many countries, accounting for 10 percent or moreof total export earnings of 12 developing countries during 1995–2000.1
However, its importance as a source of export earnings has declined over time,partly because imports by Organization for Economic Co-operation and Development(OECD) countries have declined. In the 1970s, the European Union, Japan, and theUnited States accounted for half of the world’s total sugar imports. Since then, U.S.sugar imports have declined from more than 5 million tons per year to slightly morethan 1 million tons per year. The European Union, once a net importer of about 2.5million tons, is now a net exporter of about 5 million tons. Japan decreased sugarimports from 2.5 to 1.5 million tons between 1970 and 2000. Thus, three of thelargest sugar importers in the 1970s have now become self-sufficient (figure 1),slowing the growth of world trade and exports from developing countries.2
These countries reduced imports not because of gains in productiveefficiencies or a strong comparative advantage in sugar production but because ofhigh protection. Producers in these countries receive more than double the worldmarket price thanks to government guarantees, import controls, and productionquotas—a combination of policies that has encouraged production of sugar andsugar substitutes, reduced consumption and imports, and deprived lower-costproducers (many in developing countries) of export opportunities. Totalgovernment support to producers in the European Union, Japan, and the UnitedStates averaged $6.4 billion in 2004 according to OECD estimates. In comparison,total sugar exports from developing countries were about the same in recent years.
The clout of the U.S. sugar industry was recently demonstrated when itopposed and almost prevented the passage of the Central American-DominicanRepublic Free Trade Agreement (CAFTA-DR) because the agreement increasedthe sugar quotas of these countries (Wall Street Journal, July 28, 2005). The U.S.sugar industry had earlier prevented sugar from being included in the Australia–U.S.free trade agreement, even though sugar is an important export for Australia. TheWashington Post reported (February 9, 2004) that the powerful U.S. sugar lobbyand affiliated individuals and political action committees had donated $20.2 millionto both U.S. political parties since 1990. Pressures for change are building, however,and the opportunity for sugar policy reform is better now than in several decades.
129

TRADE, DOHA, AND DEVELOPMENT: A WINDOW INTO THE ISSUES
130
BackgroundSugar occurs naturally in most foods, but it is economically extracted from only afew crops—among them sugar beets, sugar cane, and corn. Common sugar, orsucrose, is extracted in identical and nearly pure form from sugar cane and sugarbeets. Dextrose is a sugar derived synthetically from starch (most commonly corn),and fructose is a very sweet sugar derived from dextrose. High-fructose corn syrup(HFCS), produced by the enzymatic conversion of a portion of the dextrose in cornsyrup to fructose, is used as a sugar substitute in soft drinks. The fact that identicalor nearly identical sugars can be produced from different crops provides producersand consumers with a wide range of substitution possibilities. But it also meansthat sugar policies are often complex, as the different industries vie for governmentsupport. For example, the European Union and Japan have legislated quotas onHFCS production in order to limit competition with sugar.
HFCS is a nearly perfect sugar substitute in uses such as soft drinks. It andother corn syrups now account for 40 percent of caloric sweeteners in Japan, androughly half of U.S. caloric sweetener consumption (figure 2). Discovered in thelate 1960s, the technique for commercial production of high-fructose corn syrupwas made profitable by high sugar prices in the protected Japanese and U.S. markets.Today, economies of scale, improvements in production techniques, and large
Source: Based on FAO data.
Figure 1. Inefficient producers in the North are crowding out efficientproducers in the South
-10
0
10
20
30
40
50
1965 1970 1975 1980 1985 1990 1995 2000
Net Imports of European Union, Japan and United States
World Exports
Million tons
World sugar exports and net imports of the European Union, Japan and theUnited States, 1965-2003

SUGAR POLICIES
131
installed production capacity (financed under high prices) have made corn syrupscompetitive with sugar from cane and less costly than sugar from beets.
Costs of production favor producing sugar from cane. Major exporters canproduce refined (white) sugar from cane at an average cost of about 13 cents perpound, compared to 26 cents per pound from sugar beets (table 1). The higher costof production from sugar beets is one of the reasons why protection is high innorthern hemisphere countries, which produce sugar mostly from sugar beets.HFCS requires large investments in plant and equipment and a low-cost source ofstarch. Because producers in the United States, a major producer of corn, havealready made such investments, HFCS production costs in the United States arecompetitive with sugar produced from sugar cane.
Policy changes are inevitableThe European Union proposed major reforms to its sugar regime following a ruling bythe World Trade Organization (WTO) Appellate Body on April 28, 2005. That rulingupheld an earlier ruling in a case brought by Australia, Brazil, and Thailand, whichcharged that the European Union was subsidizing its sugar exports beyond the limitspermitted in the Uruguay Round Agreement on Agriculture. The WTO AppellateBody dismissed the EU appeal in full, confirming that all EU sugar exports are subsidized,either directly or indirectly. The European Union, after declaring that it would abide
Source: Based on USDA data.
Figure 2. Sugar supersizing in the U.S.
Million tonsU.S. consumption of sugar and high-fructose corn syrup, 1970–2004
0
2
4
6
8
10
12
1970 1975 1980 1985 1990 1995 2000
Sugar
HFCS
0
2
4
6
8
10
12
1970 1975 1980 1985 1990 1995 2000
Sugar
HFCS

TRADE, DOHA, AND DEVELOPMENT: A WINDOW INTO THE ISSUES
132
by the ruling, tabled a reform proposal on June 22, with a target of getting an agreementbefore the WTO meeting in Hong Kong in December 2005.
The reform proposed by the European Commission calls for an internal pricecut of 39 percent over two years beginning in 2006–07. EU sugar beet producers areto be compensated for 60 percent of the price cut through the Single Farm Payment,which would be linked to environmental and land management standards. Theexisting A and B quotas are to be merged into a single production quota, andintervention prices are to become a reference price. A private storage system will beintroduced as a safety net in case the market price falls below the reference prices.
Source: LMC International as reported in Sugar and Sweeteners Outlook, EconomicResearch Service, USDA, September 2004. Actual market prices are from World Bank.
Table 1. Average costs of producing cane sugar, beet sugar, andhigh-fructose corn syrup by categories of producers, and actualsugar prices, 1997/98–2001/02
a. Measured in nominal U.S. cents per pound, ex-mill, factory basis.b. Average of six producing regions (Australia, Brazil (Center/South), Guatemala, Malawi,Zambia, and Zimbabwe).c. Average of seven countries (Australia, Brazil, Colombia, Cuba, Guatemala, South Africa, andThailand).d. Average of seven countries (Belgium, Canada, Chile, France, Turkey, United Kingdom, andUnited States).e. Average of four countries (Belgium, France, Germany, and Turkey).f. HFCS-55, dry weight.g. Average of 22 countries (Argentina, Belgium, Bulgaria, Arab Republic of Egypt, Canada,China, Finland, France, Germany, Greece, Hungry, Italy, Japan, Mexico, Netherlands, Poland,Slovakia, South Korea, Spain, Taiwan (China), Turkey, United Kingdom, and United States).h. Raw cane sugar price is U.S. cents per pound, July–June average of monthly prices, f.o.b.Caribbean ports.
Category 1997–1998 1998–1999 1999–1990 2000–2001 2001–2002
Raw cane sugar
Low cost producers b 8.25 8.11 6.84 7.95 6.59
Major exporters c 10.55 9.66 8.70 9.51 8.38
Cane sugar, white equiv.
Low cost producers b 11.92 11.77 10.39 11.60 10.11
Major exporters c 14.41 13.45 12.41 13.28 12.06
Beet sugar, refined
Low cost producers d 22.44 24.07 23.12 23.56 24.23
Major exporters e 25.44 27.02 25.51 24.2 26.19
High-fructose corn syrup f
Major producers g 12.62 11.41 11.62 12.87 12.62
Actual Market Prices
Raw cane sugar h 10.76 7.18 6.20 9.81 7.21
U.S. cents per pound a

SUGAR POLICIES
133
The European Commission also proposed an assistance scheme for the ACP (Africa,Caribbean, Pacific) countries that includes a broad range of support options thatcan be tailored to each country.
With successful conclusion of the Doha Round of multilateral trade negotiationsexpected to require reform on sugar, the proposed reform of the EU sugar regimehas had the effect of isolating the United States. The United States has notannounced a sugar reform package, but it will face strong internal and externalpressures for reform in the next several years. The external pressures will includepolitical pressures in the Doha Round and market pressures stemming frominternational agreements such as North American Free Trade Agreement (NAFTA)and CAFTA-DR. The U.S. sugar program accounts for a disproportionately largeshare of the Aggregate Measure of Support (AMS), which is expected to be cut aspart of a Doha Round agreement. This will lead to internal pressures for reform asother commodity groups fight to protect their own support programs.
Market pressures will come primarily from Mexico, which will be allowedunlimited duty-free access in 2009 under NAFTA. This could lead to a surge ofimports, a build-up of U.S. government stocks, and large budget outlays unless theUnited States reduces its internal sugar price supports. The next U.S. farm bill,scheduled for 2007, is the most likely occasion for policy reform.
Japan faces less internal pressure for reform, but it provides higher protectionto its sugar producers than the European Union and United States. It should bepressured to reform its sugar policy by developing country exporters.
The benefits of reform are substantialProtection in the world sugar market is imposed by developed countries at greatcost to themselves and those developing countries with the economic potential toexpand exports.
The welfare benefits of sugar policy reform are substantial—and the gainsgreatest from multilateral reform. According to recent studies of the global sugarand sweetener markets, the global welfare gains from removing all trade distortionsare estimated to be as much as $4.7 billion per year. In countries with the highestprotection (Japan, Western Europe, the United States, Indonesia, and Eastern Europe,in descending order) net imports would increase by an estimated 15 million tons peryear as production falls and consumption rises. World sugar prices would increaseby as much as 40 percent, while prices in countries that heavily protect their marketswould decline to the benefit of consumers. The greatest price declines would occurin Japan, where sugar prices would fall 65 percent, followed by a 40 percent declinein Western Europe, and a 25 percent decline in the United States. Brazilian producersstand to gain the most from liberalization: around $2.6 billion per year. Partiallyoffsetting that gain is a loss of $1 billion to Brazilian consumers, who would payhigher prices after liberalization—leaving a net gain of $1.6 billion for Brazil.

TRADE, DOHA, AND DEVELOPMENT: A WINDOW INTO THE ISSUES
134
If existing polices in the European Union and United States are adjusted toaccommodate higher imports under the ACP, Europe’s Everything But Arms (EBA)agreement, NAFTA, and other agreements, many low-cost producers, includingBrazil, would lose because they do not currently have large quotas and are notamong the ACP, EBA, or NAFTA countries. A better alternative is to push for fullliberalization of the world sugar market in order to allow efficient producers toexpand production and exports, and consumers in protected markets to benefitfrom lower prices. Full liberalization may also make policy change more palatablebecause no country would be singled out for reform. It also has the advantage ofoffering somewhat higher world prices to soften the adjustment for producers inprotected markets.
But not all countries stand to gain from reformA number of countries have preferential access to the EU or U.S. sugar marketsthrough the ACP/EU Sugar Protocol and the U.S. sugar import program (table 2).These countries receive the high internal price on quota exports. Their preferentialaccess is valued at about $800 million per year compared to world market prices—less than it appears, because many of these producers have high production costsand would not produce at world market prices, and because world price increasesafter full liberalization would partially offset the loss of high prices in preferentialmarkets. The net loss to these exporting countries from full liberalization is estimatedto total $450 million per year.
Table 2. Countries with large quotas in the EU and U.S. sugarmarkets
Source: European Commission 2004 and USDA 2003.
CountrySugar quota
2003/04 CountryMauritius 491,031 17.3 Dominican 185,335 9.5
Fiji 165,348 20.7 Brazil 152,691 3.3
Guyana 159,410 28.0 Philippines 142,160 0.1
Jamaica 118,696 5.4 Australia 87,402 1.5
Swaziland 117,845 11.9 Guatemala 50,546 7.8
Barbados 50,312 9.5 Argentina 45,281 0.2
Belize 40,349 19.2 Peru 43,175 0.2
Trinidad & Tobago 43,751 0.9 Panama 30,538 2.0
Zimbabwe 30,225 3.2 El Salvador 27,379 2.1
Malawi 20,824 6.0 Colombia 25,273 1.6
EU quota holders U.S. quota holders
Share of exports from
sugar
Share of exports from
sugarSugar quota
2003/04

SUGAR POLICIES
135
Low-cost producers with small EU or U.S. quotas relative to their total exportswould benefit from policy reform because they would gain more from increasedexports and the rise in world market prices than they would lose from erodedpreferences. These countries include Australia, which has a U.S. quota of 87,000thousand tons and total exports of more than 4 million tons; Brazil, with a U.S. quotaof 152,000 tons and total exports of more than 17 million tons; and Thailand, with anEU quota of 14,000 tons and exports of 3-4 million tons.
Countries with no quota to the EU and U.S. markets, such as Arab Republic ofEgypt and Sudan, would benefit from both higher exports and higher world prices.Other compensations for the loss of quotas may also be available, including broad-based economic supports such as the Economic Partnership Agreements now beingnegotiated by the European Union.
Employment in sugar industriesEstimates of employment in developing countries’ sugar industries have beendeveloped from various reports, surveys, and industry statements (table 3), althoughno systematic accounting is available. Such estimates show considerablecross-country consistency among high- and low-cost producers. Brazil, Guyana,and South Africa are among the lowest-cost producers; their rates of raw sugarproduction per industry employee are estimated to range from 16.3 to 19.9 tons peryear. Moderately high-cost producers, such as Fiji and Mauritius, produce about 8tons of raw sugar per industry employee. Jamaica, a very high-cost producer withproduction costs estimated at about 24 U.S. cents per pound, produces about 5.5tons of raw sugar per industry employee. Based on these estimates, an additionalmillion tons of sugar production from a low-cost sugar producing developing countrywould generate about 55,500 direct employment jobs. If the production came from ahigh-cost producer, the same million tons of production would generate about128,000 direct employment jobs. (Additional indirect employment would also begenerated in transportation and related industries, but no attempt has been made toestimate these jobs.)
Based on these estimates of productivity, full liberalization could generatebetween 832,500 and 1,920,000 jobs in developing countries by raising imports ofdeveloping-country sugar into highly-protected markets by 15 million tons. Thenet global employment effect would be less because some jobs would be lost in thehighly protected markets. In the United States, for example, an estimated 6,000sugar beet growers produce half of the country’s sugar. Many of these jobs wouldbe lost. However, new jobs would be created to accommodate processing of rawcane sugar imported to replace the decline in sugar produced from beets.

TRADE, DOHA, AND DEVELOPMENT: A WINDOW INTO THE ISSUES
136
ConclusionsThe chances for global reform of sugar policy are better than they have been forseveral decades. The European Union has already proposed major reforms to itssugar regime following a ruling by the WTO Appellate Body on April 28, 2005. Thatruling, upholding an earlier ruling in a case brought by Australia, Brazil, and Thailand,confirmed that all EU sugar exports are subsidized, either directly or indirectly. TheEU’s proposal in response calls for a 39 percent cut in internal prices and othermeasures to increase the market orientation of the sugar sector. The United Stateshas not yet proposed reform to its sugar program, but there are strong external andinternal market pressures for reform.
The current round of multilateral trade negotiations offer an excellent opportunityfor developing countries to push for reform, which would create jobs and raise foreignexchange earnings, while also benefiting consumers in highly-protected markets whopay several times the world market price for sugar.
In anticipation of reform, countries with high protection will need to devisepolicies to compensate countries for the loss of quotas and producers for the loss ofprotection. Such compensation should be designed so that it does not continue tosupport sugar production but rather supports sugar producers during an adjustment
Notes and Sources: Production is the three-year average of raw sugar production during1999–2001 from FAOSTAT. Employment data are from various sources and include totaldirect employment in sugar factories and the number of growers. Employment data for Brazilare from OECD (1999); Fiji and Guyana data are from F.O.Lichts; data for Jamaica are fromthe Jamaican Sugar Authority; Kenya data are from the Kenya Sugar Board; Malawi data arefrom the Malawi Ministry of Commerce and Industry; Mauritius data are from F.O.Lichts;Mexico; and South Africa data are from OECD (1999).
Table 3. Raw sugar produced per sugar industry employee,selected developing countries, 1999–2001
Country
Direct employment(growers and
factory)
Tons of raw sugar produced average
Tons of raw sugar produced per
employee
Brazil 1,100,000 19,485,000 17.7 Guyana 18,000 293,072 16.3 South Africa 130,000 2,589,667 19.9
Fiji 40,500 336,333 8.3 Jamaica 38,000 208,351 5.5 Mauritius 65,000 529,299 8.1
Malawi 17,000 200,667 11.8 Mexico 300,000 5,069,233 16.9
Low-cost producers
High-cost producers
Other producers

SUGAR POLICIES
137
period. This type of adjustment was used in the United States for peanut producersfacing the threat of increased imports due to WTO and NAFTA agreements. In the2002 U.S. farm bill, the loan rate for edible peanuts was cut by half (compared to therate prevailing in the mid-1990s), production quotas were eliminated, and direct cashpayments were made to producers. The payments consisted of deficiency payments(paid when prices fell below the new loan rates), decoupled direct payments, andcounter-cyclical payments. Quota holders were compensated through direct paymentsfor their loss of quota rights. A similar program is needed for sugar.
Unwinding the system of protection and support will require new policies insome developing countries. Some high-cost producers may be able to raiseproductivity, but others will have to contract. Policies that encourage investments toincrease productivity and assist in the shift of resources to other, more internationallycompetitive activities, may be in order. Development assistance can play a supportiverole in all of these areas.
Note1. The 12 countries and the average share of export earnings derived from sugar during 1995–2000 were: Gambia (91 percent), Reunion (63 percent), Cuba (41 percent), Saint Kitts and Nevis(37 percent), Fiji (25 percent), Belize (25 percent), Guyana (24 percent), Mauritius (21 per-cent), Swaziland (17 percent), Dominican Republic (14 percent), Guadeloupe (12 percent),Barbados (11 percent).2. Donald Mitchell is Lead Economist in the Development Prospects Group of The World Bank.This note is based on “Sugar Policies: Opportunity for Change, World Bank Policy ResearchWorking Paper 3222, February 2004.
Further ReadingBorrell, Brent, and David Pearce. 1999. “Sugar: The Taste Test of Trade Liberalization.” Center
for International Economics, Canberra and Sydney, September 1999.Mitchell, Donald. 2004. “Sugar Policies: Opportunity for Change.” Policy Research Working
Paper 3222, World Bank, Washington, DC.Sheales, Terry, Simon Gordon, Ahmed Hafi, and Chris Toyne. 1999. “Sugar International Poli-
cies Affecting Market Expansion.” ABARE Research Report 99.14, Australian Bureau ofAgricultural and Resource Economics, Canberra.
Wohlgenant, Michael K. 1999. “Effects of Trade Liberalization on the World Sugar Market.”U.N. Food and Agriculture Organization, Rome.
USDA (United States Department of Agriculture). 2003. Sugar and Sweetener Situation andOutlook Yearbook. Economic Research Service, Washington, DC.
———. 2004. “Sugar and Sweeteners Outlook.” Economic Research Service, Washington, DC.September 28.

Market Access for Nonagricultural Products:In Search of a Formula
Will Martin and Maros Ivanic
11
Developing countries’ exports of nonagricultural products have risen rap-idly in recent years, with manufactures leading the way (World Bank 2003).Nonagricultural products now constitute the overwhelming majority of
merchandise exports from developing countries.1 In East Asia, the share ofmanufactures in total exports has risen from 50 to 90 percent in the past two decades;in Latin America and the Caribbean, it has risen from 20 to 60 percent. Even in Sub-Saharan Africa the share of manufactures has risen from 10 to 25 percent. Othernon-agricultural products, such as resources and fishery products, are also importantto many developing countries. While many of these exports are subject to lowtariffs in the major industrial-country markets, some are subject to high peak tariffsthat sharply restrict market access.
The early stages of the Doha negotiations were marked by a flurry of tariff-cutting proposals for nonagricultural market access (NAMA)—among them veryconcrete proposals from China, the European Union, India, and the United States.Building on these proposals, particularly the proposal from China, the Chairman ofthe Negotiating Group for NAMA of the World Trade Organization (WTO) proposedin May 2003 the application of a Swiss formula (see equation 1 below and Francoisand Martin 2003) that would impose a ceiling tariff based on each country’s originalaverage tariff. These proposals were coupled with other proposals for completeelimination of tariffs in certain sectors.
In considering any formula approach to liberalization, WTO members mustweigh the formula’s implications for their own tariff structure and for their market-access opportunities abroad. Although tariff reductions are based on bound tariffs,which can be substantially above the tariff rates actually applied, countries usuallyhave little trouble assessing the implications of a proposal for their own appliedtariffs. Such an evaluation can be undertaken using widely-available software suchas EXCEL, and information on bound tariffs (the limits, agreed and recorded atWTO, above which applied tariffs cannot be increased), and applied tariffs. Assessingthe implications for tariff revenues is a little more difficult, but still relativelymanageable. By contrast, it is a major task for countries to assess a formula’s likelyeffects on their market-access opportunities, since these depend on a range offactors including the nature of the formula; the average and distribution of tariffs;and the importance of exports to each of the country’s export markets. A particularchallenge is posed by the gaps between tariff bindings and the tariffs actuallyapplied. A further complication results from the preferences available on some
143

TRADE, DOHA, AND DEVELOPMENT: A WINDOW INTO THE ISSUES
144
developing country exports, and the increasing number of preferential tradearrangements, both of which cause applied tariff rates to fall below the scheduledmost-favored-nation (MFN) rates on some trade.
Earlier work (World Bank 2003: 89–98) reviewed the key proposals for reform ofnonagricultural market access at that time and provided a broad assessment of theirmarket-access implications for several key countries. This note updates that reviewand assesses the likely effects of current proposals on market access for eachdeveloping-country region. Each country’s situation will differ from the broadaverages that we are able to consider in this note, but we hope these broadassessments will provide an initial guide, and provide an illustration of what can bedone in making these assessments.2
Three formulas under discussion within WTOThree formula approaches (modalities) are currently under consideration in thecurrent WTO negotiations on nonagricultural market access (WTO 2005a):• A single Swiss formula with flexibilities for developing countries,• A Swiss formula with two coefficients—one for industrial and one for
developing countries,• A Swiss formula with coefficients based on countries’ average tariffs.
The Swiss formula has a long history in the multilateral trading system, havingbeen applied in the Tokyo Round of negotiations in the 1970s (Laird and Yeats1987). It involves setting new tariffs, t
1, using equation (1):
(1)0
01
.
ta
tat
+=
Where t0
is the base tariff, and a is the “ceiling” parameter that determines thehighest possible tariff in the new tariff schedule. This function has the property ofreducing higher tariffs by more than lower tariffs—with extremely high tariffs beingreduced to just below the ceiling. It also makes smaller cuts in low tariffs than woulda proportional formula—a feature that helps preserve tariff revenues, since low-tariff, high-volume items are often important sources of government revenue.
A stylized representation of the impact of a Swiss formula on tariffs is given infigure 1. The figure is drawn for a ceiling parameter of 16 percent, a value that playedan important role in the Tokyo Round (Baldwin 1986). The figure shows three broadfeatures of the formula—small tariffs are cut by less than with a proportional cutthat would provide the same reduction in average tariffs; high tariffs are cut morethan proportionally; and an initial tariff equal to the coefficient is reduced to half thecoefficient value. Three examples are useful to illustrate the potential strength ofthese effects. By applying the formula illustrated, with a coefficient of 16 percent,an initial tariff of 1 percent would be reduced to 0.94 percent— a 6 percent reduction.

MARKET ACCESS FOR NONAGRICULTURAL PRODUCTS
145
By contrast, an initial tariff of 1,000 percent would be reduced to 15.7 percent—areduction of more than 98 percent. An initial tariff of 16 percent wouldbe reduced by half.
The top–down nature of the Swiss formula means that it automatically tends tolessen two major concerns of developing countries—tariff peaks and tariff escalation.Its effectiveness in lowering peak tariffs and reducing tariff escalation is consistentwith the requirements of WTO’s July 2004 Framework (WTO 2004). And it isparticularly important for tariff reduction in industrial countries, where averagetariffs are low but peak tariffs burden many products of interest to developingcountries—among them textiles, clothing, and footwear.
Most attention in the current negotiations seems to be focused on the secondand third of the approaches (modalities) under consideration. Pakistan (WTO 2005a)has advocated the second, with the ceiling parameter for industrial and developingcountries based on the average bound tariffs in each group—rounded to 6 and 30percent. Some developed countries, while agreeing with Pakistan’s broad approach,seek lower coefficients, particularly for developing countries. Other countries,including Argentina, Brazil, and India (WTO 2005b) favor an approach based onearlier proposals by China and the former chair of the WTO’s Negotiating Group forNAMA, in which ceiling parameters are based on average tariffsin individual countries.
Figure 1. A Swiss formula cuts higher tariffs more
Final Tariff, t1
Initial tariff, t00 16 32
16
32
t1=0.5t0
t1=16t0/(16+t0)
Final Tariff, t1
Initial tariff, t00 16 32
16
32
t1=0.5t0
t1=16t0/(16+t0)
Impacts of a Proportional and a Swiss Formula for Tariff Cutting

TRADE, DOHA, AND DEVELOPMENT: A WINDOW INTO THE ISSUES
146
Another key issue under discussion is the treatment of tariffs that are currentlyunbound. Most nonagricultural tariffs are now bound in the industrial countries,but in developing countries binding coverage varies widely. Blackhurst, Enders,and Francois (1996) reported that the import coverage of tariff bindings on industrialproducts in developing countries rose from 13 to 61 percent as a result of theUruguay Round, with many countries committing to 100 percent binding. However,coverage rates remain below 10 percent in Mauritius, Zimbabwe, and many othercountries.
The binding of tariffs has value, even if applied tariffs are not actually reduced(Francois and Martin 2004), because binding rules out subsequent increases intariffs, and particularly increases that create costly tariff peaks. With broad agreementon the desirability of achieving 100 percent coverage of tariff bindings in NAMA,as in agriculture, there have been several proposals for dealing with unboundtariffs in the formulas. These include the original proposal by the NAMA chair touse twice the applied rate as the base for cutting and binding tariffs. Another,proposed by Canada, Hong Kong (China), New Zealand, and Norway (CHNN), is toallow countries to add 5 percentage points to each currently applied tariff. A third,proposed by Pakistan, is to add 30 percentage points to each tariff (WTO 2005a).
Effects of NAMA proposals on developing countries’ market accessTo help relieve the uncertainty surrounding the outcome of the negotiations onbinding rates, we experimented with setting the base rates from which cuts are to bemade at different multiples of bound rates. Given these choices, we examined theimplications of the competing formulas for market access. Our analysis was doneusing UNCTAD’s TRAINS database, taking into account the preferential treatmentprovided unilaterally by Australia, Canada, the European Union, Japan and theUnited States. While most earlier studies ignore preferences and hence exaggeratethe market access gain from liberalization, our analysis overstates these gains tosome degree by assuming full preference utilisation. Our use of weighted averagetariffs also understates the benefits since highly restricted products have smallinitial trade shares.
Highly summarized results are expressed in table 1 as the average tariff facingexporters from each developing-country region, and as the coefficient of variationof those tariffs—a measure that provides an indication of the prevalence of tariffpeaks and escalation relative to the mean tariff. The results were obtained (as inWorld Bank 2003) by cutting bound rates and then assessing the impacts on thecorresponding applied rates. Only when bound rates fall below initial applied ratesare applied rates cut, and then by only as much as is needed to keep the applied rateat or below the bound rate. In contrast with our earlier results, however, we focushere on the implications for export-market access, rather than on countries’ owntariffs.

MARKET ACCESS FOR NONAGRICULTURAL PRODUCTS
147
In generating the numbers presented in the table, we used three basic optionsthat cover the range of possibilities for tariff-cutting formulas and treatment ofunbound rates. These range form the Chairman’s Proposal to a proposal that pro-vides for much deeper cuts in developing country tariffs through a lower ceilingand smaller increase in unbound tariffs prior to cutting.
Option proposed by the former chair of WTO NAMA NegotiatingGroup• Unbound tariffs are first bound at twice the country’s applied MFN average.• Cuts are made using a Swiss formula with a coefficient equal to the country’s
tariff base average. Least developed countries and those with less than 35percent coverage do not make cuts.
Option proposed by Pakistan• Unbound tariffs are bound at MFN rate plus 30 percentage points.• Cuts use a Swiss formula with a coefficient of 6 for developed countries and 30
for developing countries. Least developed countries and those with less than35 percent binding coverage do not make cuts.
Option represented by authors’ combination of proposals fromCHNN and Industrial Countries• Unbound tariffs are bound by MFN rate plus 5 percentage points.• Swiss-formula cuts use a coefficient of 5 for developed countries and 15 for
developing countries. Least developed countries and those with less than 35percent binding coverage do not make cuts.
Table 1. Implications of different formula options for average tariffsfacing developing countries
CHNN = Canada, Hong Kong (China), New Zealand, Norway.CV = coefficient of variation.
(Percent)
Average CV Average CV Average CV Average CVSub-Saharan Africa 2.3 560 1.9 510 1.4 340 1.1 270East Asia, Pacific 3.9 380 2.6 290 1.9 240 1.6 180Europe, Central Asia 3.6 420 2.6 330 1.9 240 1.6 180Latin America 4.1 370 2.8 300 2.2 290 1.9 220South Asia 6.0 420 4.1 330 3.0 290 2.6 240Mid. East, N. Africa 2.0 400 1.6 360 1.3 290 1.0 200
PostPreChair Pakistan CHNN-Industrial

TRADE, DOHA, AND DEVELOPMENT: A WINDOW INTO THE ISSUES
148
Shaving tariff peaksKey features of table 1 are the relatively low unweighted average tariffs facing
most developing regions once preferences in key markets are taken into account.The very high coefficients of variation of tariffs facing exporters, however, hint atthe presence of serious tariff peaks on some products. For Sub-Saharan Africa, forexample, the coefficient of variation is 560 percent of the mean, implying a substantialshare of tariffs that are five or more times the mean tariff. Many of these areassociated with peak tariffs, on which preferences are not available, in keyindustrial-country markets.
The three proposals all reduce average tariffs and the coefficient of variationof tariffs. However, it is clear that the two proposals that use a single ceilingparameter for developing countries—the Pakistan and U.S.–CHNN approaches—are more effective in reducing the barriers facing developing countries than is theproposal from the former chair of the WTO Market Access Committee, in whichthe ceiling parameter is based on each country’s average tariff.
The CHNN Industrial approach is more effective in reducing market-accessbarriers than is Pakistan’s approach. While Pakistan’s proposal would reduce thepain that developing countries face in their home markets, it would also reducetheir gain in market access. The sharp reduction in the coefficient of variation inthe tariffs facing each country bears testimony to the success of the approach inreducing tariff peaks and escalation.
Effects on the distribution of high tariffsAdditional insights into the effects of the proposals on the barriers facing eachcountry are given in six plots, one for each region (figure 2). These show the valueof trade subject to each level of tariffs. Because tariff peaks reduce the volume oftrade in high-tariff categories, we have first estimated the trade that would exist ineach category under free-trade conditions, and then plotted those values againstthe tariff rates.3 While the precise pattern varies among regions, a key feature ofthe initial distribution of tariffs is sizeable numbers of tariffs at or close to zero andsome peaks associated with rates well above zero. For exporters from Sub-Sa-haran Africa, for example, there is a substantial peak in the value of exports ofproducts that face tariffs between 30 and 35 percent.
When the tariff-cutting formulas are applied, the entire distribution of tariffsshifts to the left, increasing the share of trade that is subject to tariffs of close tozero. In many cases, that shift is much less marked under the former chair’s for-mula than under the other two.
The difference between the Pakistan and CHNN Industrial proposals in low-ering tariffs on large traded-goods categories differs substantially among regions.In South Asia, for instance, the CHNN Industrial proposal is much more effective

MARKET ACCESS FOR NONAGRICULTURAL PRODUCTS
149
in reducing high tariffs than the other proposals: virtually all exports from the regionwould face tariffs of 7.5 percent or less. Pakistan’s proposal brings a much smallerfraction of exports into this category. By contrast, in East Asia, all three proposalsgenerate surprisingly similar results, and all are quite effective at reducing the shareof exports subject to high tariffs.
ConclusionThe objectives of this note were to provide an outline of the approaches to reformbeing considered in the ongoing negotiations on nonagricultural market accessand to provide some simple estimates of the likely effectiveness of those approachesin expanding market access for developing countries. The results indicate that all ofthe approaches would have some effect in expanding market access and reducingpeak tariffs. The two more aggressive approaches, however, would be more effec-tive in reducing barriers. Although regional averages do not accurately representthe situation of any individual country, the results presented here do illustrate whatcan be done for any individual country seeking to assess the implications of alter-native formulas for market access. They also show that raising the level of ambitionin the negotiations on nonagricultural market access has the potential to provideimportant market access gains to developing countries as a group.

TRADE, DOHA, AND DEVELOPMENT: A WINDOW INTO THE ISSUES
150
Tariff rates (percent)
Value (in US $ billion)
Value of exports by tariff rate from East Asia
Source: Authors’ calculations.
0
50
100
150
200
250
300
350
400
450
0 2.5 5 7.5 10 12.5 15
Original
Chairman formula
CHNN-Industrial
Pakistani formula
Figure 2: Value of exports by tariff rate by region:
Tariff rates (percent)
Value of exports by tariff rate from East Europe, Central AsiaValue (in US $ billion)
Source: Authors’ calculations.
0
50
100
150
200
250
0 2.5 5 7.5 10 12.5 15
Original
Chairman formula
CHNN-Industrial
Pakistani formula

MARKET ACCESS FOR NONAGRICULTURAL PRODUCTS
151
Source: Authors’ calculations.
Value of exports by tariff rate from Latin America
Value (in US $ billion)
Tariff rates (percent)
0
50
100
150
200
250
300
350
400
450
500
0 2.5 5 7.5 10 12.5 15
Original Chairman formula
CHNN-Industrial
Pakistani formula
Source: Authors’ calculations.
Value of exports by tariff rate from Middle East, North Africa
Value (in US $ billion)
Tariff rates (percent)
0
50
100
150
200
250
0 2.5 5 7.5 10 12.5 15
Original
Chairman formula
CHNN-Industrial
Pakistani formula

TRADE, DOHA, AND DEVELOPMENT: A WINDOW INTO THE ISSUES
152
Tariff rates (percent)
Tariff rates (percent)
Source: Authors’ calculations.
Value of exports by tariff rate from Sub-Saharan Africa
Value (in US $ billion)
0
20
40
60
80
100
120
0 2.5 5 7.5 10 12.5 15
Original
Chairman formula
CHNN-Industrail
Pakistani formula
Source: Authors’ calculations.
Value of exports by tariff rate from South Asia
Value (in US $ billion)
0
10
20
30
40
50
60
0 2.5 5 7.5 10 12.5 15
Original
Chairman formula
CHNN-Industrial
Pakistani formula

MARKET ACCESS FOR NONAGRICULTURAL PRODUCTS
153
Notes1. The authors would like to acknowledge the important contributions made by World Bank
staff Olivier Jammes, Ganesh Kumar Seshan and Jerzy Rozanski on an earlier trade note. Specialthanks go to Jurgen Richtering of the World Trade Organization and Marcelo Olarreaga of theWorld Bank who provided valuable comments on drafts of this chapter.
2. The World Bank and the United Nations Conference on Trade and Development (UNCTAD)have produced a software program—World Integrated Trade Solutions (WITS)—that allowsanyone with knowledge of trade and tariff statistics (plus a computer and access to the Internet)to assess the implications of proposed formulas for their own trade regime, and for their market-access opportunities. See http://wits.worldbank.org/witsweb for more information.
3. This adjustment was made using a Constant Elasticity of Substitution demand function withan elasticity of substitution of 3, and taking the tariffs to zero before calculating the country’sexport volumes.
ReferencesBaldwin, R. E. 1986. “Toward More Efficient Procedures for Multilateral Tariff Negotiations.”
Aussenwirtschaft 41(2–3): 379–94.Blackhurst, R., A. Enders, and J. Francois. 1995. “The Uruguay Round and Market Access:
Opportunities and Challenges for Developing Countries.” In The Uruguay Round and theDeveloping Countries, ed. W. Martin and L. A. Winters. Cambridge: Cambridge UniversityPress.
Francois, J., and W. Martin. 2003. “Formula Approaches for Market Access Negotiations.”World Economy 26(1): 1–28.
Francois, J., and W. Martin. 2004. “Commercial policy, bindings and market access” EuropeanEconomic Review 48: 665–79. June.
Laird, S., and A. Yeats. 1987. The Uruguay Round: A Handbook for the Multilateral TradeNegotiations, Washington DC: World Bank.
World Bank. 2003. Global Economic Prospects 2004: Realizing the Development Promise ofthe Doha Agenda. Washington, DC.
WTO (World Trade Organization). 2004. “Framework for Establishing Modalities in MarketAccess for Nonagricultural Products.” Annex B in “Doha Work Program: Decision Adoptedby the General Council on August 1, 2004.” WT/L/579. Geneva,
———. 2005a. “Market Access for Nonagricultural Products: The Way Forward: Communicationfrom Pakistan to the World Trade Organization.” TN/MA/W/60. Geneva.
———. 2005b. “Market Access for Nonagricultural Products: Communication to the NegotiatingGroup on Nonagricultural Market Access from Argentina, Brazil and India.” TN/MA/W/54.Geneva.
Laird, S. and de Cordoba, S. eds. 2006. “Coping with Trade Reforms: Implications of the WTOIndustrial Tariff Negotiations for Developing Countries.” Palgrave-Macmillan, Basingstoke,UK. See www.unctad.org.
WTO 2003. Draft Elements of Modalities for Negotiations on Non-Agricultural Products,World Trade Organization, Geneva, 19 August, TN/MA/W/35/Rev. 1.

Life after Quotas? Early Signs of the New Era in Tradeof Textiles and Clothing
Paul Brenton and Mombert Hoppe
12
On January 1, 2005, the system of quotas that had regulated imports oftextiles and clothing into rich countries for 30 years was finally dismantled.1
That step came despite a last-gasp attempt by certain importing countries,in alliance with a number of developing countries that had benefited from thesystem’s restrictions on China and other Asian countries, to delay the reform. Inliberalizing the most protected manufacturing sector, the expiration of the quotasystem completed a major achievement of the Uruguay Round of multilateral tradenegotiations concluded 10 years earlier.2 Textiles and clothing remain subject torelatively high tariff barriers in both developed and developing countries, andcertain developing countries, notably the least developed (LDCs), still receivesignificant tariff preferences in developed-country markets.
Much has been written about the likely impact of the reforms and the fear thatmarkets will become swamped by Chinese products, with adverse implications forother developing-country producers that export to the developed countries. Thisnote takes a first look at the initial impact of the changes and discusses what theysuggest for developing-country strategies in textiles and clothing.
The development significance of exports of textiles and clothingAlthough both can be crucial to development, the textiles and clothing sectors aredistinct. The modern textiles sector is capital intensive and subject to growingautomation. Production has tended to become geographically concentrated, withonly a few developing countries having the capacity to export substantial amountsof standardized textile products. The clothing sector remains labor intensive,technology is relatively simple, start-up costs are comparatively small, and scaleeconomies are not important. All of these factors favor production in locationswhere labor costs are low.
Diversification into export categories with greater value added than traditionalagricultural exports is a major objective for many developing countries. Throughmanufactures of clothing developing countries have been able to significantlyincrease and diversify exports with positive effects on incomes, employment, andpoverty.3 The relative importance of clothing, in terms of the share of total non-oilexports, exceeds that of textiles in all but the developed-country regions (figure 1).Both textiles and clothing are particularly important in the exports of South Asianand African countries.
155

TRADE, DOHA, AND DEVELOPMENT: A WINDOW INTO THE ISSUES
156
Changes in trade following the removal of remaining quotasChanges in trade in textiles and clothing products hit the newspapers first withpredictions that world markets would be swamped with Chinese products andthousands of jobs lost in other developing countries.4 The issue was back in theheadlines after the United States (U.S) and European Union (EU) acted to restoreprotection (at least temporarily) against certain Chinese products under safeguardagreements negotiated at the time of China’s accession to the World TradeOrganization (WTO).5
Despite the ink spilled over the issue in the media, it is still too early to drawfirm conclusions about the impact of the removal of quotas. Here we look atinformation on imports of textiles and clothing products into the European Unionand the United States in the first six months of 2005 and show that the impact islikely to be more nuanced than many commentators have suggested. It is quitelikely that many developing countries will have opportunities to continue to exportclothing products provided their domestic business climate is favorable.
While U.S. imports from China have increased strongly since the quotas expired,imports from a number of other developing countries also have increased significantly(figure 2). U.S. imports from Bangladesh, a country that many thought would be hithard, increased by more than 20 percent in the first half of this year. In fact, U.S.imports from a range of countries across Africa, Asia, and South America have
Figure 1 here
Source: COMTRADE data accessed through WITS.
0 10 20 30 40 50
South AsiaAfrica
Central and East EuropeChina
Latin AmericaEast Asia ex China
Middle EastOceaniaEurope
North America
Textiles
Clothing
Figure 1. Textiles and clothing are important for developing countries
percent of Non-Oil exports (2004)

LIFE AFTER QUOTAS?
157
increased, while imports from other countries in the same regions, as well as importsfrom developed countries, have declined. In absolute terms the largest declines inimports are from Hong Kong (China), Republic of Korea, Mexico, Taiwan (China),and Macao, in that order.6
A similar situation prevails in the EU market (figure 3). Imports from China haveincreased strongly, but so have imports from certain other developing countries,including Bangladesh, Cambodia, Arab Republic of Egypt, Madagascar, and Vietnam.Large declines in imports have been recorded for Hong Kong (China) and Macao,while significant reductions in imports are reported from a range of countries inAsia, Eastern Europe, and the Middle East.
Because the initial response to the removal of quotas in the United States andthe European Union was far from homogenous, identifying clear patterns is difficult.On balance, removal of quotas appears to have led to a much more competitiveglobal market for textiles and clothing products. After years of suppression, EU andU.S. imports from China have grown strongly, but opportunities remain for efficientsuppliers in other countries to expand output and exports.
Chinese exports have increased substantially in many product categories, but
Source: USITC.
Figure 2. Winners and losers in the US, post ATCProportionate change in US textile and clothing imports by supplier
(first half 2005/first half 2004), percent
ChinaTunisiaHait i
UgandaNicaragua
IndiaJordan
BangladeshPeruMali
Sr i LankaCambodiaIndonesia
Pakist anSwaziland
ColombiaThailand
VenezuelaGuat emalaHondurasKenya
Viet namEl Salvador
IsraelDominican RepEgypt
It alyUnit ed Kingdom
TurkeyPhilippines
MexicoCost a Rica
Lesot hoCanadaJapan
EcuadorTaiwan (China)
MoroccoKorea
Maurit iusHong Kong (China)
Macao (China)Sout h Af r ica
LaosMaldives
Bolivia
-100 -50 0 50 100
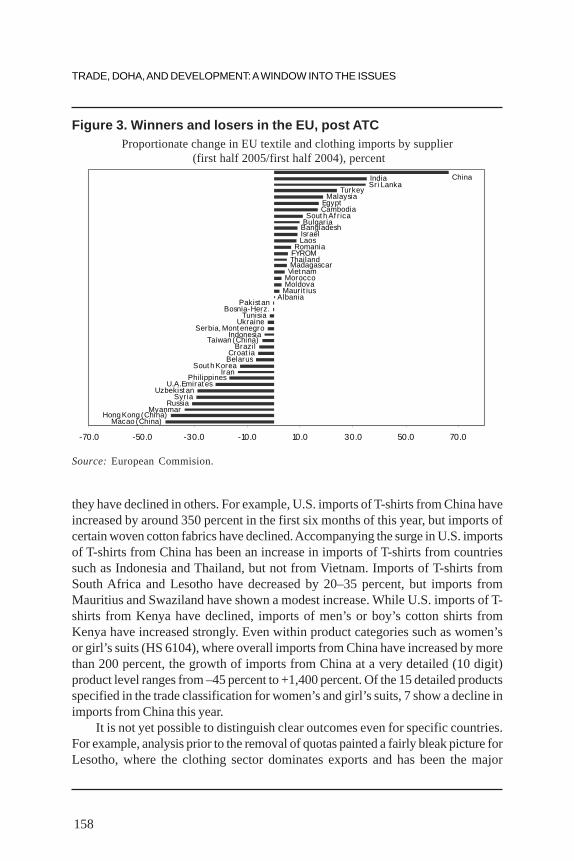
TRADE, DOHA, AND DEVELOPMENT: A WINDOW INTO THE ISSUES
158
they have declined in others. For example, U.S. imports of T-shirts from China haveincreased by around 350 percent in the first six months of this year, but imports ofcertain woven cotton fabrics have declined. Accompanying the surge in U.S. importsof T-shirts from China has been an increase in imports of T-shirts from countriessuch as Indonesia and Thailand, but not from Vietnam. Imports of T-shirts fromSouth Africa and Lesotho have decreased by 20–35 percent, but imports fromMauritius and Swaziland have shown a modest increase. While U.S. imports of T-shirts from Kenya have declined, imports of men’s or boy’s cotton shirts fromKenya have increased strongly. Even within product categories such as women’sor girl’s suits (HS 6104), where overall imports from China have increased by morethan 200 percent, the growth of imports from China at a very detailed (10 digit)product level ranges from –45 percent to +1,400 percent. Of the 15 detailed productsspecified in the trade classification for women’s and girl’s suits, 7 show a decline inimports from China this year.
It is not yet possible to distinguish clear outcomes even for specific countries.For example, analysis prior to the removal of quotas painted a fairly bleak picture forLesotho, where the clothing sector dominates exports and has been the major
Source: European Commision.
Figure 3. Winners and losers in the EU, post ATCProportionate change in EU textile and clothing imports by supplier
(first half 2005/first half 2004), percent
ChinaIndiaSri Lanka
TurkeyMalaysia
EgyptCambodia
Sout h Af r icaBulgaria
BangladeshIsraelLaos
RomaniaFYROMThailandMadagascar
Viet namMoroccoMoldova
Maurit iusAlbania
Pakist anBosnia-Herz.
TunisiaUkraine
Serbia, Mont enegroIndonesia
Taiwan (China)Brazil
Croat iaBelarus
Sout h KoreaIran
PhilippinesU.A.Emirat es
Uzbekist anSyria
RussiaMyanmar
Hong Kong (China)Macao (China)
-70.0 -50.0 -30.0 -10.0 10.0 30.0 50.0 70.0

LIFE AFTER QUOTAS?
159
source of employment growth in recent years. Initial reports in the press early in2005 appeared to confirm those fears, suggesting that at least 10 factories had shutdown and at least 10,000 workers (roughly one-fifth of the industry workforce) hadlost their jobs.7 However, exports of clothing to the United States, which accountsfor almost all of the output of Lesotho, decreased only slightly (by 5.3 percent, orabout $10 million) over the first half of 2005 compared to the same period in 2004.Some commentators suggest that a portion of the job losses reflects substantialimprovements in labor productivity. Others report that during the course of thisyear some factories have reopened and others have opened for the first time. Noofficial data are available on job losses in the clothing sector in Lesotho this year,nor have any official pronouncements been made. The picture is further clouded bythe fact that very similar products have exhibited quite different export performance.Exports to the United States of women’s and girl’s cotton trousers have declinedsubstantially, but exports of men’s and boy’s cotton trousers have increasedsignificantly. Thus, diagnoses that concentrate on broad sectoral factors will havelimited power in explaining developments in the clothing industry in 2005. A carefulanalysis will need to dig down to identify firm-specific characteristics and responses.
The changes for countries such as Sri Lanka and Bangladesh are in sharpcontrast to predictions of the dire impact of the end of quotas. It was suggestedthat one million jobs would be lost in Bangladesh and that one-half of factories inthe industry in Sri Lanka would close down (as reported in Oxfam 2004). It is tooearly to conclude with confidence that the expiration of quotas will not have a majornegative impact on these countries. Buyers in the European Union and UnitedStates may be postponing decisions to begin sourcing in China while uncertaintypersists concerning official protection against Chinese products. Nevertheless,some countries that were expected to be hit hard by the removal of quotas havemanaged to increase the value of their exports to the European Union and theUnited States, even in product categories in which Chinese exports have grown thefastest, suggests that opportunities for a range of developing countries to export,especially in the clothing sector, will remain.
While global buyers will review their sourcing strategies, many have indicatedthat they will not risk placing all their orders with China and will seek to maintain amore diversified sourcing structure. Moreover, China cannot fill every niche. Thetextiles and clothing sectors have a large number of niches that vary by country tosuit vastly differing tastes. Even a small share of a small niche of the United Statesor a large European country can have a substantial economic impact on a smalldeveloping country.
Here it is worth stressing the differences between the European and U.S. markets.Large buyers in the United States, such as Walmart, look to suppliers that cansatisfy economy-wide demand for standard products. The EU market, by contrast,remains considerably fragmented along national lines. Footwear is one sector in

TRADE, DOHA, AND DEVELOPMENT: A WINDOW INTO THE ISSUES
160
which the European Union and United States imposed quantitative restrictionsagainst China and other East Asian suppliers in the late 1980s. Those restrictionswere removed in the 1990s. In the United States, China now accounts for around 70percent of U.S. imports. Its share of EU footwear imports, however, is less than 15percent. As a last observation, China and India are experiencing high growth rates.Rising domestic demand will reduce some of the excess supply that can be exported.At the same time, rising wages will shrink competitive margins.
A strategy to support competitiveness of the clothing sectorWhat elements are likely to comprise a successful strategy to support the clothingsector in developing countries?
Review domestic trade policies to remove constraints that act againstclothing exportsFor clothing producers the ability to source fabrics and other inputs from the globalmarket is a crucial competitive factor. Many developing countries apply high importduties on products used as inputs in textile and clothing industries, thereby limitingthe capacity to export competitive final products. Producers in many developingcountries pay considerably higher than world prices for yarns, fabrics, sewingneedles, and other inputs (table 1). In many cases drawback schemes reimburseexporters for these duties, but poor implementation often leads to delays in payment,while exporters bear the cost of compliance with the schemes.8
The ability to fill orders quickly is a significant competitive advantage in theclothing sector. That makes the efficiency of customs procedures on both importedinputs and the exported product, and the availability, cost, and speed of transportservices, important determinants of competitiveness. In many developing countries,and especially in Africa and South Asia, long delays in customs and poor transportinfrastructure keep producers away from key global markets. Compared with China,the documentary requirements and customs procedures of many developing
Table 1. Applied import duties on cotton yarns, cotton fabrics andsewing needles in selected countries, 2005
Source: TRAINS database on WITS.
Bangladesh Brazil Ethiopia Kenya Mexico Morocco Nigeria Pakistan
Cotton yarns 15.0 14.0 20.0 20.0 15.0 32.5 40.0 5.0
Cotton fabrics 30.0 18.0 40.0 25.0 15.7 40.0 75.0 25.0
Sewing needles 30.0 17.5 20.0 15.0 20.0 10.0 20.0 10.0
Percent

LIFE AFTER QUOTAS?
161
countries are onerous and complicated, thereby slowing imports and exports (table 2).Customs reform, improvements to ports and transport infrastructure, and thestimulation of competition among transport companies are all important measuresto support the competitiveness of the clothing sector.
Improve the business environmentMany countries have lower labor costs than China in the production of clothing (therelevant metric is the price per one standard minute). Moldova, for example, has perminute costs that are two-thirds of those in China. Labor costs are also lower inBangladesh and in many countries in Africa than in China. In many of these countries,however, the advantage of low labor costs is undermined by high indirect costs resultingfrom a hostile business environment. The World Bank estimates that the cost of doingbusiness in Africa, for example, is as much as 40 percent higher than in other developingregions (World Bank 2005). Countries that implement policies to provide a favorablebusiness climate can help their firms compete in both domestic and overseas markets.
Exploit cost advantages in areas other than laborLabor cost is just one of the elements that influence the sourcing decisions of globalbuyers. The value of proximity and turnaround increases the competitive importanceof efficiency in customs, handling, and transport. Many buyers, particularly in Europe,are turning to products with very limited shelf life and hence short production runs, soflexibility and responsiveness can give firms a critical competitive edge. At the sametime, environmental and labor standards affect the sourcing decisions of growingnumbers of buyers.9
Advocate for more effective trade preferencesThe European Union, United States, and other developed countries offer substantialpreferences on clothing products. Full preferences are available in the European Unionto all LDCs and ACP (Africa-Caribbean-Pacific) countries. Partial preferences are availableto other developing countries. The United States offers preferences on clothing productsto Central and South American countries and to African countries under the African
Table 2. Average time required to satisfy import and exportprocedures in selected countries, 2004
Source: World Bank, Doing Business Database, www.doingbusiness.org.
Bangladesh Brazil Ethiopia Kenya Morocco Nigeria Pakistan China
Imports 57 43 57 62 33 53 39 24
Exports 35 39 46 45 31 41 33 20
Days

TRADE, DOHA, AND DEVELOPMENT: A WINDOW INTO THE ISSUES
162
Growth and Opportunity Act (AGOA),10 but not to Asian LDCs such as Bangladeshand Cambodia.
But preferences typically are severely curtailed by restrictive rules of origin. Inparticular, EU and U.S. rules of origin (with the notable exception of imports from mostAfrican countries under AGOA) severely limit the ability of clothing producers tosource fabrics from the global market, thus reducing the economic potential of availablepreferences. To obtain preferences, firms must use more expensive inputs from localfirms or from the European Union or the United States, which usually negates thebenefit of preferential access. In fact, it is apparent that for many producers of clothingin countries that receive preferences the higher cost of having to use inputs dictatedby the rules of origin exceeds the margin of tariff preference. The result is that firmssource their inputs globally and forgo preferences.11 A significant liberalization ofrules of origin would allow developing countries to take advantage of availablepreferences and thus soften the shock of the removal of quotas.
ConclusionsThe end of three decades of quantitative restrictions on textiles and clothingproducts in developed countries entails both challenges and opportunities formany developing countries.
Countries that have a favorable business environment, efficient customs andtransport systems, and competitive firms that are flexible enough to meet therequirements of overseas buyers can prosper—even in the face of unfetteredcompetition from China. Developed countries can assist by (a) providing a stabletrade-policy environment in which investors can make effective long-term decisions,(b) ensuring that all LDCs have access to preferences on clothing products, and (c)liberalizing the rules of origin governing those preferences in ways that bettersupport development.
The early data discussed in this analysis give a preliminary and partial indicationof the outcome of the removal of quotas on textiles and clothing products in the EUand U.S. markets. The analysis suggests that certain countries have seen largedeclines in the value of their exports of textiles and clothing products, declines thatmay entail substantial adjustment. Even countries that have continued to increaseexports may experience significant adjustment toward more efficient firms in thetextile and clothing sectors. A clear view of these adjustment pressures requiresmore detailed information on the impact on firms and workers of the expiration ofthe quota system. Nevertheless, it is clear that in the absence of other employmentopportunities workers made redundant from the textile and clothing sectors may fallback into poverty. Thus, minimizing the costs incurred by released workers andtheir families and facilitating their adjustment into alternative employment will be amajor challenge in a number of countries.
International organizations and bilateral donors can support developing

LIFE AFTER QUOTAS?
163
countries, especially the least developed, in adjusting to the substantial trade shocksthat may arise from the expiration of quotas on textiles and clothing. That supportmust include analytical work to lay the basis for effective decision-making, as wellas technical assistance and capacity building in the areas of customs reform, tradefacilitation, and improving the investment climate. In some cases, it should includefinancial assistance. The IMF’s Trade Integration Mechanism may playa role in cases of large, adverse effects on countries’ balance of payments.12
In sum, the paramount challenge facing international organizations, bilateraldonors, and national governments is to provide a favorable business environmentin which companies can restructure their operations and access the financing theyneed to compete more effectively, and to assist workers who lose their jobs as thetextile and clothing sectors adjust to new global realities.
Notes1. The authors are Paul Brenton, Senior Economist in the International Trade Department of
the World Bank, and Mombert Hoppe, Junior Professional Associate in the Trade Departmentof the World Bank. They are grateful for the comments and suggestions of Richard Newfarmer.
2. From January 1995 to January 2005, international trade in textiles and clothing tradeoperated under the 10-year transitional program of the WTO’s Agreement on Textiles andClothing (ATC). Before the Agreement took effect at the end of the Uruguay Round, a largeshare of exports of textiles and clothing from developing countries to the industrial countrieswas subject to quotas under a special regime known as the Multifibre Arrangement (MFA), whichoperated outside the normal rules of the General Agreement on Tariffs and Trade (GATT),notably the rule against discrimination in trade. The MFA provided for the application ofquantitative restrictions against specific countries for a wide range of textile and clothingproducts. The purpose of ATC was to gradually integrate textiles and clothing into GATT (nowWTO) rules through the progressive removal of quotas.
3. Kabeer and Mahmoud (2004) suggest that the production of garments for export inBangladesh has generated 1.6 million new jobs, most of which were captured by women. Manyof these workers tend to be migrants from poorer areas. Kabeer and Mahmoud also find thatwages for garment workers are double those of other workers involved in nontradable activities.There is, however, some evidence to suggest that workers in this sector are vulnerable tochanging employment contracts and the increasing “casualization” of work (Nadvi 2004).
4. “Thirty Million Jobs Could Disappear with the End of Apparel Quotas.” Business Week,December 15, 2003.
5. Both the European Union and the United States have introduced new trade restrictionsagainst imports from China since early 2005, and China has “voluntarily” sought to limitcertain exports by levying an export tax. In the European Union, new quota restrictions on 10categories (8 of which refer to clothing products) have been justified on the basis that therapidity of the change in trade “made effective adjustment impossible.” Initially this argumentwas made in relation to EU producers, although it is not clear how many producers in theEuropean Union really compete directly with Chinese products; recently it has been extended onthe grounds that it is important for producers in the Maghreb and other developing countries. Onthe other hand, some commentators suggest that the restrictions in the European Union andUnited States are diverting Chinese products to large developing-country markets such as SouthAfrica. In the United States safeguard cases have concluded that Chinese imports “are disrupting

TRADE, DOHA, AND DEVELOPMENT: A WINDOW INTO THE ISSUES
164
and threatening to disrupt” U.S. markets. These arguments have been accepted despite the factthat the agreement to phase out quotas allowed for a 10-year period of adjustment.
6. The declines for Hong Kong (China), Macao, and Taiwan (China) may reflect that underquotas a portion of mainland China’s exports were handled by middlemen in these countries andrecorded as their exports. Hence some of the recorded increase in China’s exports reflects thereorganization of trade. Similarly, part of the falling price of imports from China results fromthe elimination of middlemen (Mayer 2005).
7. “Southern Africa: Textile Industry Undone by Globalisation.” IRINnews.org, September 26, 2005.8. In Bangladesh, for example, it has been reported that reimbursement takes 58 days on average
and requires 6 percent of additional expenditure to obtain the refund check (WTO 2005).9. Reports in the press conjecture that the continued success of the clothing industry in
Cambodia (where exports to the European Union and United States increased substantially in2005) reflects a strategy of enhancing labor standards. That strategy has improved quality andcaptured the attention of international buyers. In addition, it has been suggested that constraintson cutting labor costs have led factory owners to push the government to tackle corruption andunnecessary bureaucratic rules. See, for example, “Labor Standards Help Cambodia KeepCustomers.” International Herald Tribune, May 11, 2005. This issue is ripe for detailed analysisand assessment.
10. See Brenton and Ozden (2005).11. Thus, for example, in 2002 only 50 percent of the exports of Bangladesh to the European
Union that were eligible for preferences under the Everything But Arms program actuallyrequested preferences due to rules of origin. Similarly, only 36 percent of Cambodia’s eligibleexports requested EU preferences. A key feature of AGOA is that many African countries canexport to the United States using globally sourced fabrics. This has led to substantial supplyresponses and higher exports to the United States in a number of cases including Lesotho,Swaziland, Kenya, and Uganda. South Africa, however, faces restrictive rules of origin requiringthe use of domestic or U.S. fabrics. In 2004 exports of clothing from South Africa to the UnitedStates where almost 20 percent lower than in 2001.
12. See http://www.imf.org/external/np/exr/facts/tim.htm. However, certain countries, such asLesotho and Haiti, have substantial clothing sectors but do not have immediate access to theIMF’s Trade Integration Mechanism (TIM) as they are not engaged in an IMF program, andtheir sectors, unaided, could founder. (see WTO (2005) for more details).
ReferencesBrenton, P., and C. Ozden. 2005. “Trade Preferences and Apparel and the Role of Rule of
Origin: The Case of Africa.” Presented at the WTO conference on Preference Erosion:Impacts and Policy Responses, Geneva, June.
Kabeer, N., and S. Mahmud. 2004. “Globalisation, Gender, and Poverty: Bangladeshi WomenWorkers in Export and Local Markets.” Journal of International Development 16.
Mayer, J. 2005. “Not Totally Naked: Textiles and Clothing Trade in a Quota-free Environment.”Journal of World Trade 39: 393–426.
Nadvi, K. 2004. “Globalisation and Poverty: How Can Global Value Chain Research Inform thePolicy Debate?” IDS Bulletin 35: 20–28.
Oxfam. 2004. “Stitched Up: How Rich-Country Protectionism in Textiles and Clothing TradePrevents Poverty Alleviation.” Briefing Paper 60. http://www.oxfam.org.uk/what_we_do/issues/trade/downloads/bp60_textiles.pdf
World Bank. 2005. Meeting the Challenges of Africa’s Development: A World Bank GroupAction Plan. World Bank: Washington, D.C.
WTO. 2005. “Options for Least-Developed Countries to Improve their Competitiveness in theTextiles and Clothing Business.” WT/COMTD/LDC/W/37, Geneva.

Services in a Development Round: Proposals forOvercoming Inertia
Aaditya Mattoo
13
Much of the public discourse on the Doha Development Agenda hasfocused on trade in goods, particularly protectionist policies in agricul-ture. Negotiations on trade in services have received much less attention.
The neglect matters. The potential benefits of services trade reform are huge, butservices negotiations in the World Trade Organization (WTO) are making littleprogress.
One problem, of course, is that services negotiations are part of a stagnantwhole. Progress in other areas, notably agriculture, is a necessary condition forprogress in services. But it is not a sufficient condition. To produce a servicesoutcome that supports broader development goals will require extraordinaryintellectual, technical, and political effort.
This note first describes the current, sad state of negotiations. It then arguesthat the negotiations could be galvanized by agreement on three goals that shouldappeal equally to the development and business communities. Finally, the noteadvances three proposals that may help achieve those goals: the first pertains to areform of the negotiating process; the second and third argue for the negotiationsto be complemented by broader cooperation to remedy regulatory inadequaciesand to deal with the particular issues raised by labor mobility.
Where do things stand?At Cancún, services were not an area of disagreement. Ministers recognized theprogress made in the negotiations and urged participants to intensify efforts toreach a successful conclusion. As we approach Hong Kong, the mood is lesssanguine. The progress so far consists of a large number of confidential butreportedly highly ambitious requests that WTO members (including severaldeveloping countries) have made to each other for greater market access, andreportedly disappointing offers of improved access submitted so far by more than60 WTO members (including many developing countries). The chair of the WTOServices Trade Negotiations Committee, Alejandro Jara, concluded in July 2005 that
Notwithstanding the fact that the number of offers has improved since my last report,it was widely acknowledged that the overall quality of initial and revised offers isunsatisfactory. Few, if any, new commercial opportunities would ensue for servicesuppliers. Most members feel that the negotiations are not progressing as theyshould. It is clear that much more work will be necessary in order to bring the qualityof the package to a level that would allow for a deal.1

TRADE, DOHA, AND DEVELOPMENT: A WINDOW INTO THE ISSUES
166
There is a growing perception that the request-and-offer process is not prov-ing to be fruitful and that there is a need for complementary negotiating methods. Inparticular, some WTO members have suggested the adoption of numerical bench-marks to secure wider sectoral coverage, as well as qualitative criteria to ensure thatcommitments embody a certain degree of openness. Meanwhile, negotiations oncompleting the General Agreement on Trade in Services (GATS) framework of rules(on safeguards, government procurement, subsidies, and domestic regulation)—underway since the conclusion of the Uruguay Round—have borne little fruit.
What should the goals be?The negotiations have fallen into a low-level equilibrium trap: little is expected andless offered. Members need to identify a set of desirable and feasible goals to givedirection and momentum to the negotiations. These goals must be articulated not inarbitrary and opaque numerical terms, but in terms that resonate equally with thedevelopment and business communities.
Realizing the development benefits of services reformRecent research concludes that the increase in real income from a cut in servicesprotection by half would be five times larger than that generated from comparablegoods trade liberalization (Robinson and others 1999). Countries that successfullyreformed their financial and telecommunications services sectors have grown, onaverage, about a percentage point faster than other countries (box 1). This reflectsthe key role of services such as finance, transport, and telecommunications indetermining economic performance, and the spillover benefits of liberalization asfactors move across countries.
It would be wrong, however, to assume that these gains can be realized by amechanical opening up of services markets. A flawed reform program can underminethe benefits of liberalization. For example, if privatization of state monopolies toprivate owners (sometimes foreigners) is conducted without creating conditions ofcompetition, the simple result may be transfers of monopoly rents to private owners.Similarly, if increased entry into financial sectors is not accompanied by adequateprudential supervision, the result may be insider lending and poor investmentdecisions. Also, if policies to ensure universal service are not put in place,liberalization need not improve access to essential services for the poor. Managingreforms of services markets therefore requires integrating trade opening with acareful combination of competition and regulation.
The challenge is to ensure that international commitments reflect good economicpolicy rather than the dictates of domestic political economy or internationalnegotiating pressure. In particular, it is essential to distinguish between the areaswhere liberalization is prevented solely by the political power of vestedinterests—to which the WTO’s reciprocal market opening is an antidote—and those

SERVICES IN A DEVELOPMENT ROUND
167
Box 1. Dynamic benefits of services trade reform
Certain services industries clearly possess growth-generating charac-teristics. Thus, financial services play a central role in the transformationof savings to investment, telecommunications in the diffusion of knowl-edge, transport in a country’s ability to participate in global trade,education and health services in building up the stock of human capital,and business services in reducing transactions costs and adding value toproducts. Barriers to entry in several services sectors, ranging fromtelecommunications to professional services, often are maintained notonly against foreign suppliers but also against new domestic suppliers.Full liberalization can, therefore, lead to enhanced competition from bothdomestic and foreign suppliers. Greater foreign factor participation andincreased competition together imply a larger scale of activity, and hencegreater scope for generating the growth-enhancing effects. Even withoutscale effects, the import of foreign factors that characterizes servicessector liberalization could still have positive effects because they arelikely to bring technology with them.
Econometric evidence suggests that openness in services improvesgrowth in the long run (figure 1a). After controlling for other determinantsof growth, countries that fully reformed the financial services sector grew,on average, about 1 percentage point faster than other countries. An evengreater impetus on growth was found to come from fully reforminga boththe telecommunications and the financial services sectors. Estimatessuggest countries that fully liberalized both sectors grew, on average,about 1.5 percentage points faster than other countries (figure 1b).
While these estimates indicate substantial gains from liberalizing keyservices sectors, it would be wrong to infer that those gains can berealized by a mechanical opening up of services markets. Managingreforms of services markets requires that trade opening be accompaniedwith a careful combination of competition and regulation (see text on thesecond page of this note).
a. The measure of reform included not just liberalization but also regulatory improvements.

TRADE, DOHA, AND DEVELOPMENT: A WINDOW INTO THE ISSUES
168
Growth rate (controlling for other factors)
Box 1. (continued)
Note: Number of countries in sample in parenthesisa) The openness index for telecommunications captures the degree of competition,restrictions on ownership and the existence of an independent regulator (needed to enablecompetitive entry), and draws on an ITU-World Bank database for 1998. The index forfinancial services captures the restrictions on new entry, foreign ownership and capitalmobility, and draws primarily upon commitments made by countries under the GATS,which are known to reflect closely actual policy, and data in the IMF’s Annual Report onExchange Arrangements and Exchange Restrictions.Source: Mattoo, Rathindran, and Subramarian (2005).
0 2 4 6 8 10
South Asia (3)EAP (5)
SSA/MNA (17)ECA (3)
LAC (18)High Income (26)
SSA/MNA (42)ECA (3)
South Asia (5)EAP (8)
LAC (21)High Income (21)
Financial Services
Telecoms
Index of liberalizationa
Figure 1a. Developing countries lag in services liberalization
Figure 1b. Greater liberalization in services is associated with more rapidgrowth
L in e a r p re d ic t io n
1 8 .5
- 0 .0 2 4
0 .0 5 9
IT A N Z L
S L V
P A N
P R T
F IN
IS L
A R G
C H E
E S P
B E L N L D
N O R U S A C A N S G P
E G Y F R A
S W E
G R C
G U Y
A U S
G B R
A U T
C Y P J A M
B O L
D N K
M L T
M W I
C R I
Z A F T U R
M O Z
K E N
IN D
M A R
V E N
M E X P H L
N IC C H L
U R Y K O R P E R
M Y S
E C U
A G O
T H A
H N D
C O L
T U N L K A
B R A
ID N
D O M
Composite services liberalization index
Source: Mattoo, Rathindran, and Subramarian (2005).

SERVICES IN A DEVELOPMENT ROUND
169
where regulatory or other problems need to be remedied before the full benefits ofliberalization can be reaped. Even in the latter case, if the time frame for reform couldbe predicted, a government would be in a position to decide whether to precommitin the WTO to future liberalization in order to lend credibility to the reform programand obtain a negotiating benefit.
The evidence of benefits conditional on appropriately designed reformprograms points to our first goal:
Goal 1: WTO members will eliminate barriers to foreign participation insectors where there is adequate regulatory preparedness, and consistent withtheir development goals. They will precommit to eliminating barriers where thenecessary conditions for successful market opening can be fulfilled in a predictabletime span.
Preempting protection in cross-border trade in servicesThe shared interest in an open services markets is vividly illustrated by the patternof cross-border trade in business services. While industrial countries are still thelargest exporters of such services, several developing countries are among themost dynamic (box 2). Since the mid-1990s, the business-services exports of 20developing countries, including Brazil, Costa Rica, India, Israel and Mauritius havegrown by more than 15 percent per year.
Many countries, rich and poor, are reaping large efficiency gains from thisenhanced international division of labor. The U.S. banking industry alone is estimatedto have saved more than $8 billion over the last four years, and the cost savings forthe world’s top hundred financial institutions could be as high as $138 billionannually. And the development potential of cross-border trade in services is beingfelt in an ever-widening group of developing countries that are equipping themselveswith the appropriate skills, infrastructure, and institutions.
But such trade will also create adjustment pressures and could provoke aprotectionist backlash—signs of which are already visible in recent procurementrestrictions and regulatory impediments. It would therefore be wise to preemptprotectionism, to ensure that any adjustment pressures are dealt with throughdesirable domestic assistance rather than inefficient barriers to trade. That pointsto our second goal.
Goal 2: WTO members will lock in the current openness of cross-border tradefor a wide range of services. Certain services, such as those that involve themobility of capital, may be exempted.
Reaping the gains from the temporary migration of service providersThe most stringent barriers to service trade are those involving the mobility ofindividual service providers, known as “mode 4” in the GATS context. Such temporarymovement offers arguably the neatest solution to the problem of how some forms

TRADE, DOHA, AND DEVELOPMENT: A WINDOW INTO THE ISSUES
170
of international migration are best managed, enabling mutual gains from trade whileaverting to a large extent social and political costs in host countries and brain drainfrom poor countries. Recent research finds that if industrial countries were to allowtemporary access to foreign service providers equal to just 3 percent of their laborforce, the global gains would be over $150 billion—more than the gains from thecomplete liberalization of all trade in goods (Winters and others 2003). Those gainswould be shared equally by the industrial and developing countries.
The challenge is to define a package that can liberate at least some forms ofmovement from the prohibitive political difficulties that have prevented any progresson mode 4. First of all, in order to harness the coincidence of interest betweenindustrial and developing countries, the package would include both intracorporatemovement and the movement of personnel independently of commercial presence.Second, in order to remain politically feasible, the proposed liberalizing commitmentsmight be required to apply (a) only above specified skill thresholds, (b) to strictlytemporary presence of a specified duration (say, less than one year), and, forindependent movement, (c) to the fulfillment of services contracts to the exclusionof other employment arrangements. Countries would of course be free to adoptmore flexible and liberal regimes for other types of movement; for example, it mightbe possible to make greater progress on the movement of the unskilled throughbilateral agreements. But the GATS negotiations would focus most fruitfully on thetype of movement for which there seems to be an emerging international market,and for which multilateral negotiations can help eliminate explicit restrictions andcreate streamlined procedures. This leads to our third goal.
Goal 3: WTO members will allow greater freedom for the temporary presenceof at least some categories of individuals, such as intracorporate transferees andservice providers to fulfill specific services contracts.
How do we get there?In principle, the traditional WTO mechanism of reciprocal market opening couldhelp attain all three goals. In practice, the mechanism has not functioned in servicesbecause of inadequacies in the negotiating process and failure to win the consentand support of regulators. To revive reciprocity, the negotiating process must bereformed; more importantly, regulators must be reassured that regulatoryweaknesses will be remedied and regulatory cooperation facilitated. Each of theseactions is relevant for all modes of service delivery, but in some cases it is convenientto illustrate the significance of each with regard to a particular mode.
Reforming the services negotiating process to further desirable goalsBetween identifying worthwhile goals and making them an integral part of the Dohanegotiations, falls the shadow. How can negotiations be informed by and leadtoward desirable goals?

SERVICES IN A DEVELOPMENT ROUND
171
Box 2. Developing countries’ growing stake in cross-bordertrade in business services
“Other business services” in the IMF balance-of-payments systemincludes a range of services (other than services like banking, insurance,and telecommunications) that provide intermediate inputs throughout theproduction processes for goods and services. As the figure 2a belowshows, the bulk of such exports still originate in OECD countries. But asthe exports of the EU and the U.S. grew by 3.5 and 11.2 percent per annumin the second half of the 1990s, those of India, Peru, Israel, Romania, andBrazil and several others grew at annual rates in excess of 30 percent.Moreover, many other developing countries—including Nicaragua,Argentina, Jamaica, China and Barbados—have witnessed high rates ofgrowth (figure 2b).
0
50
100
150
200
250
300
Africa and theMiddle East
South Asia LAC East Asia andthe Pacific
OECD
1990
1995
2000
2001
2a. Regional distribution of other business services exports, 1995–2000US $ billion

TRADE, DOHA, AND DEVELOPMENT: A WINDOW INTO THE ISSUES
172
The current bilateral request-and-offer approach, adopted as the dominantnegotiating method in the services negotiations, is leading nowhere. There is astrong case for complementing it with certain collective approaches to negotiations.In a world of unequal bargaining power, multilateral approaches (which must beseen to be equitable and efficient if they are to produce agreement) are likely toyield a more desirable outcome than bilateral negotiations. Avoiding sector-by-sector and country-by-country bartering of commitments can substantially reducethe transactions costs of negotiations. Formulae, applied multilaterally, can helpovercome the free-rider problem that arises in negotiations conducted under most-favored-nation (MFN)-based system.2 Use of such formulae is perhaps the onlycredible way to grant credit to unilateral liberalizers. In contrast, it is much moredifficult to ensure compensation for the loss of negotiating coinage caused byunilateral liberalization in a bilateral request-and-offer negotiation.
In goods negotiations, collective approaches have typically taken the form offormula cuts in tariffs and subsidies. In services, quantitative assessments of offersor numerical targets would be an unhelpful distraction because even the bestavailable methods of quantifying barriers to trade are hopelessly inadequate (Findlayand Warren 2003). At best, it would be possible to measure differences in the
Percent
Box 2 . (continued)
Note: “Other business services” includes: “merchanting and other trade related services,” “operational leasingservices,” and “miscellaneous, business, professional and technical services,” which include: “legal,accounting management, consulting, public relations services,” “advertising, market research, public opinionpoll services,” “research and development services,” “architectural, engineering, other technical services.”
2b. Average growth rates of exports of other business services for selectedcountries, 1995–2000
-10 0 10 20 30 40 50
IndiaPeru
IsraelRomania
BrazilEstonia
NicaraguaArgentina
JamaicaDominica
ChinaBarbados
NigeriaAustraliaCanada
USAMauritius
GhanaEurope
Japan

SERVICES IN A DEVELOPMENT ROUND
173
sectoral coverage of commitments, possibly weighted by some crude measure ofthe level of openness.3 To get agreement on any such target, however, would beextremely difficult and consume valuable negotiating time and energy. Even ifagreement were reached on a target, it may merely invite a spate of dubious entriesalong the lines of “economic needs tests” to create the illusion of coverage. Such aresult would confirm the high level of cynicism about the GATS process.
Any goals must be articulated not in arbitrary and opaque numerical terms, butin terms that resonate with the development and business community. A far morefruitful collective approach would be for groups of members, akin to the “friends”groups that already exist, to champion clearly specified goals—possibly similar tothose identified above. These goals could be embodied in model schedules (ormodel regulatory principles) along the lines of the Understanding on FinancialServices, the Telecommunications Reference Paper, and the Model Schedule forMaritime Transport. The building blocks of model schedules are relativelystraightforward, and some have already been proposed for specific modes(Chaudhuri and others 2004) ; (Mattooand Wunsch 2004).
By an appropriate choice of sectors and levels of openness, it should bepossible to strike a balance between collective commitment and individual flexibility,as well as between sound policy and negotiating imperatives. Different levels ofambition are possible. At the very least, this approach can provide a framework fornegotiations. Or it could help establish a presumption in favor of a certain thresholdlevel of commitments. Or it could represent a formula for liberalizing commitments,analogous to the “zero-for-zero” goods formulae, with the objective of securingacceptance by at least a critical mass of members—defined as a group of memberseach of whom would be willing to accept the commitments provided all others in thegroup do so.
Proposal 1: Members will adopt, or at least complement, the current request-and-offer approach with, a collective approach to negotiations. Groups of memberswill champion clearly specified goals and articulate them in model schedules (ormodel regulatory principles). By appropriate choice of sectors and level ofcommitments, agreement will be secured among a critical mass of members.
An individual member’s incentive to participate in a particular sector or modewill, of course, depend on the willingness of its trading partners to make commitmentsin modes and sectors (within and outside services) in which the member has anexport interest. A reformed negotiating method can help, but ultimately memberswill need to make the hard political bargains necessary for a successful outcome.
The next two proposals address the substantive concerns that inhibitcommitments in the GATS context.

TRADE, DOHA, AND DEVELOPMENT: A WINDOW INTO THE ISSUES
174
Policy advice, and diagnosing and remedying regulatory inadequaciesMarket access in services is negotiated within the WTO. Policy advice andassistance for regulatory reform, by contrast, are provided by multilateral institutionsand other agencies. There is virtually no link between the two processes.4
This disconnect persists even though it is clear that improvedregulation—ranging from prudential regulation in financial services toprocompetitive regulation in a variety of network-based services—will be critical torealizing the benefits of services liberalization in many sectors. Policy interventionwill also be necessary to ensure universal service because liberalization per se willnot always deliver adequate access to the poor. Regulatory institutions can becostly and require sophisticated skills. For example, even a bare-bonestelecommunications regulatory authority is likely to cost around $2 million eachyear, or 5 percent of the government budget in a country like Dominica. The DohaDeclaration contains innumerable references to technical assistance, but not one ofthese is binding.
It is desirable to establish a credible link between policy advice and regulatoryassistance, on the one hand, and liberalization commitments, on the other. Addedurgency is lent by negotiating deadlines—improved offers to liberalize were to besubmitted by the end of May this year—but negotiating pressure alone is hardlylikely to produce the best responses. In the Uruguay Round negotiations, mostcountries erred on the side of caution and made few commitments to genuineliberalization, while some may have gone too far. For example, the Gambia andGuyana have allowed unrestricted cross-border trade in financial services in theirGATS commitments—and hence capital mobility—while the United States and theEuropean Union have not. Malaysia, Pakistan, the Philippines and others agreed toprotect foreign incumbents while they offered new entrants inferior conditions ofoperation—leading to less rather than more contestable markets. A decision on“duty-free” electronic commerce created the legal illusion of a liberated medium,while the much greater threat of discriminatory quantitative and regulatory barrierswas not addressed. The liberalization of maritime and air transport has not beenseriously negotiated, and exemptions from competition law continue because ofthe power of vested interests in industrial countries, even though Sub-SaharanAfrican countries pay transport costs that are on average more than five timesgreater than the tariffs they face.
Development institutions have a stake in the outcome of the servicesnegotiations, because GATS negotiations can be harnessed to deliver much-neededreform and also because unbridled mercantilism could produce outcomes that areantithetical to development. Thus the following question requires an answer: Isthere a good reason to defer liberalization, or not to make binding commitments?Weaknesses in existing mechanisms for prudential or procompetitive regulation,the need to alleviate adjustment costs, and the desire to ensure universal access in

SERVICES IN A DEVELOPMENT ROUND
175
liberalized markets may be good reasons for gradual rather than abrupt opening.Service exporting firms in industrial countries also have a stake, not only in
ensuring that markets are opened, but also that such opening is sustainable and ina sound regulatory environment. These objectives can be served by support forimproved regulatory institutions and universal access policies. Just as in a nationalcontext the private sector is required to contribute, directly or indirectly (throughtaxation) to financing the regulator without compromising the arms-lengthrelationship, it should be possible for the private sector to contribute resources forregulatory reform in developing countries. Private sector contributions could alsohelp ensure that assistance is genuinely additional and not diverted from otherforms of public assistance.
Proposal 2: The international development community will establish amechanism, funded by public and private donors, to provide policy advice andto diagnose and remedy regulatory inadequacies for developing countries thatare considering liberalizing commitments. Recourse to the mechanism will bevoluntary.5
If such a mechanism is to work, then there must be a demand for assistance,which will emerge only if there are fewer suspicions and greater appreciation of itsvalue. On the one hand, countries must be confident that the mechanism will servetheir needs and not be a Trojan horse designed for the sole purpose of inducingthem to make market-opening commitments. The mechanism must therefore beestablished in consultation with the relevant countries; credible funding must beprovided for diagnostics and remedial action; and it must be clearly understoodthat recourse to the mechanism will not create an obligation to make commitments.On the other hand, user countries must also see the usefulness of establishing alink between negotiations and assistance in order to foster desirable reform.6
Facilitating regulatory cooperationFacilitating regulatory cooperation could help deal with apprehensions aboutliberalization of all modes. For example, in financial services, confidence in cooperationby the home-country regulator could lead to openness to both commercial presenceand cross-border trade. Similarly, in international transport services, confidence inthe enforcement of home-country competition law may increase the willingness toliberalize in importing countries. We focus here on the presence of natural persons,or mode 4. Progress in these negotiations has become a precondition for moremeaningful developing-country participation in the process of reciprocal marketopening. And it is proving extremely difficult for some countries to make meaningfulconcessions in this area.
How can we make mode 4 a milestone rather than a millstone for the servicesnegotiations? First of all, members need to recognize that simply asserting thatmode 4 is about trade in services and not about migration cannot dispel deep-

TRADE, DOHA, AND DEVELOPMENT: A WINDOW INTO THE ISSUES
176
rooted fears raised by the entry of foreign providers. These fears have to beacknowledged and addressed. One way forward may be to take a more cooperativeand less antagonistic approach to mode 4, drawing upon the experience of a fewrelatively successful bilateral and regional agreements.7
The inclusion of labor mobility in the framework of a multilateral tradeagreement implies that obligations are assumed by host countries to provide marketaccess on an MFN basis regardless of conditions in source countries. In contrast,the assumption of obligations by source countries also is a key element of regionaltrade agreements North American Free Trade Agreement (NAFTA) and Asia-PacificEconomic Cooperation (APEC) that have facilitated mobility of the skilled, and ofbilateral labor agreements (such as those between Spain and Ecuador, Canada andthe Caribbean, and Germany and Eastern Europe) that have to a limited extentimproved access for the unskilled. Source-country obligations include premovementscreening and selection, accepting and facilitating return, and commitments tocombat illegal migration. In effect, cooperation by the source can help addresssecurity concerns, ensure temporariness, and prevent illegal labor flows in a waythat the host cannot accomplish alone—and constitute a service for which the hostmay be willing to pay by allowing increased access.
Can these elements be incorporated in a multilateral agreement? One possibilityis that host countries commit under the GATS to allow access to any source countrythat fulfills certain specified conditions—along the lines of mutual-recognitionagreements in other areas. Even if these conditions were unilaterally specified andcompliance determined unilaterally, it would still be a huge improvement over thearbitrariness and lack of transparency in existing visa schemes. Eventually, it wouldbe desirable to negotiate these conditions (and even establish a mechanism tocertify their fulfillment) multilaterally rather than in an unequal, nontransparent,and potentially labor-diverting bilateral context.
In the current GATS framework, when a country makes a market accesscommitment, it is obliged to grant a fixed level of access every year in the futureregardless of domestic economic conditions. In contrast, bilateral labor agreementsallow host countries to vary the level of access depending on the state of theeconomy. One example is the bilateral agreement between Germany and certainEastern European countries, under which the quota on temporary migrants increased(decreased) by 5 percent for every one percentage point decrease (increase) in thelevel of unemployment. It may be desirable to consider GATS commitments alongthese lines, which allow necessary flexibility, albeit in a transparent, predictable,and objectively verifiable manner—a big improvement over the opaque economicneeds tests that infest GATS schedules.
Proposal 3: Immigration authorities in member countries would be requestedto define a set of conditions that source countries need to fulfill—in terms ofscreening services providers, accepting and facilitating their return, and making

SERVICES IN A DEVELOPMENT ROUND
177
efforts to combat illegal migration—to be eligible for an allocation of temporaryvisas. These conditions could be the basis for a dialogue between immigrationauthorities in host and source countries. GATS commitments on mode 4 would betransparently and predictably conditional on source-country cooperation andhost-country economic conditions.
ConclusionThere is considerable scope for the WTO to play its traditional role of facilitatingreciprocal liberalization, not only by exploiting trade-offs across goods and servicesbut also within services. But for the process to work, the negotiating process mustbe reformed and regulators reassured. These steps may help generate a virtuouscycle of mutually beneficial liberalization rather than a bitter round of grudgingconcessions.
To summarize the main proposals in this paper:• First, members should adopt, or at least complement the current request-and-
offer approach with, a collective approach to negotiations. Groups of membersshould champion clearly specified goals and articulate them in model schedules(or model regulatory principles). By appropriate choice of sectors and level ofcommitments, agreement should be secured among a critical mass of members.
• Second, a critical mass of members should lock in the current openness ofcross-border trade in a wide range of services, while retaining the right toimpose any regulation or restriction that does not discriminate againstforeigners.
• Third, a critical mass of members should eliminate barriers to foreign participationin sectors where there is no good reason to defer liberalization. The samemembers should precommit to eliminating barriers where the necessarypreconditions can be fulfilled in a predictable time span. To complement thiseffort, a multilateral commitment should be made to provide policy advice andto help poor countries establish regulatory mechanisms necessary forsuccessful liberalization.
• Finally, a critical mass of members should allow greater freedom for the temporarypresence of intracorporate transferees and of service providers to fulfill specificservices contracts. Commitments in this area could be made transparently andpredictably conditional on the unemployment rate in host countries and onsource countries’ assumption of certain obligations related to certification,expatriation, and illegal immigration.

TRADE, DOHA, AND DEVELOPMENT: A WINDOW INTO THE ISSUES
178
Notes1. WTO Document TN/S/20.2. The problem arises in bilateral negotiations because each of the beneficiaries of a concession
from a trading partner may be tempted to understate their willingness to pay for it, hoping thatoffers of reciprocal concessions from other members will be sufficient to induce the concession.
3. See, for example, Hoekman (1996) and Mattoo (1999).4. The exception are certain countries that recently acceded to or are acceding to the WTO—
among them China, the Russian Federation, and Vietnam.5. Such a mechanism could be part of a broader “aid for trade” initiative of the type called for
in the United Nations Millennium Project (2004) and by the G-8 at Gleneagles in 2005. See alsoHoekman (2005) and Prowse (2005).
6. In the past, many developing countries either did not engage at all in the negotiations, orsuccumbed to the bandwagon effect, as in the basic telecommunications negotiations, wheremany rushed forward to submit schedules of commitments at the last minute; the only directlylinked assistance they received (including from the World Bank) was in drafting their schedules.
7. This section draws on joint work done with Julia Nielson.
ReferencesChaudhuri, S., A. Mattoo, and R. Self. 2004. “Moving People to Deliver Services: How Can the
WTO Help?” Journal of World Trade 38: 363–93.Findlay, C., and T. Warren (eds.). 2000. Impediments to Trade in Services: Measurement and
Policy Implications. London and New York: Routledge.Hoekman, B. 1996. “Assessing the General Agreement on Trade in Services.” In The Uruguay
Round and the Developing Countries, ed. W. Martin and L. A. Winters. Cambridge: Cam-bridge University Press.
Hoekman, B. 2005. “Expanding WTO Membership and Heterogeneous Interests.” World TradeReview.
Mattoo, A. 2000. “Financial Services and the WTO: Liberalization Commitments of the Devel-oping and Transition Economies.” World Economy 23(3): 351–86.
Mattoo, A., R. Rathindran, and A. Subramanian. 2005. “Measuring Services Trade Liberalizationand Its Impact on Economic Growth: An Illustration.” Journal of Economic Integration.
Mattoo, A., and S. Wunsch. 2004. “Pre-Empting Protectionism in Services: The WTO andOutsourcing.” Journal of International Economic Law 7: 765–800.
Prowse, S. 2005. “Aid for Trade: Increasing Support for Trade Adjustment and Integration—AProposal.” Unpublished paper, Department for International Development, London.
Robinson, S., Z. Wang, and W. Martin. 1999. “Capturing the Implications of Services TradeLiberalization.” Paper presented at the Second Annual Conference on Global EconomicAnalysis, Gl. Avernaes Conference Center, Ebberup, Denmark, June 20–22.
U.N. Millennium Project. 2004. “Trade for Development.” Task Force on Trade New York,United Nations, New York.
Winters, L. A., T. L. Walmsley, Z. K. Wang, and R. Grynberg. 2003. “Liberalising TemporaryMovement of Natural Persons: An Agenda for the Development Round.” World Economy26(8): 1137–61.
WTO Document TN/S/20.

Trade Facilitation: Progress and Prospects for theDoha Negotiations
Gerard McLinden
14
It is widely acknowledged that lowering the costs of trading can be as importantas lowering tariffs in foreign markets.1 Too often, outdated and inefficient pro-cessing systems, procedures, and infrastructure can result in high transaction
costs, long delays in the clearance of goods, and opportunities for administrativecorruption. Hummels (2001) estimates that cutting delivery times by one day (byreducing waiting time in ports or delays in customs) would reduce the averagelanded costs of goods around the world by 0.8 percent. Inefficiencies in the pro-cessing of trade adversely affects a country’s competitiveness by raising the costof imported inputs and saddling exports with dead weight inefficiencies. Countriesthat facilitate the movement of imports and exports, by contrast, are likely to attractinvestment and help their small and medium-sized enterprises participate and com-pete in the international trading system.
Most developing countries could do betterMany developing countries lag far behind the Organization for Economic Cooperationand Development (OECD) average in the time it takes to process imports and exports(figures 1a and b), putting their traders at a significant disadvantage and furtherpressuring already stretched port and transport infrastructure.
Evidence suggests that improvements in border clearance systems andprocedures can significantly reduce delays and lower traders’ transaction costs. Atthe same time, such improvements typically enhance revenue collection and thelevel of community protection provided by border institutions (Table 1). For thesereasons, trade facilitation reform based on better customs processing and improvedborder management procedures has become an important development issue inrecent years, as reflected in increased levels of investment by governments anddonors alike. Its importance is also reflected in numerous provisions related totrade facilitation in recent bilateral and regional trading agreements and in the pushby many countries for multilateral rules on trade facilitation within the World TradeOrganization (WTO).
The decision of the WTO General Council in July 2004 to launch negotiationson trade facilitation was not taken lightly. Many developing countries had seriousreservations about whether new WTO disciplines were a good way to promotereform. This note examines progress in the negotiations and argues that developingcountries can use new WTO obligations to further their domestic reform agenda
179

TRADE, DOHA, AND DEVELOPMENT: A WINDOW INTO THE ISSUES
180
rather than distort it—provided they develop a coherent negotiating strategy basedon securing agreement to a range of practical measures to facilitate trade and makeit easier for traders to compete in regional and international markets.
Trade facilitation has always been a WTO concernProvisions and obligations related to trade facilitation have been a central part ofthe GATT/WTO system since 1948 (Box 1 ).
The desirability of revisiting the WTO’s existing trade-facilitation measureswas first proposed in 1996 at the Singapore Ministerial Conference. Five years later,at the 2001 Ministerial meeting in Doha, WTO members decided to launchnegotiations on trade facilitation provided that members could reach explicitconsensus on the modalities for negotiation at the 5th ministerial meeting in Cancun,Mexico, in September 2003. The negotiations in Cancun broke down in acrimonywhen members could not reach agreement on the four so-called Singapore issues,one of which was trade facilitation.2 At a meeting of the WTO General Council inJuly 2004, agreement was finally reached to launch negotiations on trade facilitation.
But it was a reluctant consensus. While almost all WTO members acknowledgethe benefits to be obtained by investing time and energy in improving trade facilitation,several were reluctant to commit to a series of new multilateral rules while they are stillstruggling to implement existing commitments. Several members believed that they
Source: World Bank, Doing Business 2006.
0 5 10 15 20 25 30
SS Africa
South As.
ECA
MNA
Latin Am
East Asia
OECD
Figure 1a. Port and customs inefficiency drive up the cost of imports
Days through ports to warehouse

TRADE FACILITATION
181
lack the necessary capacity and resources to implement additional obligations.Moreover, many developing country members were concerned that new rules on tradefacilitation may expose them to action under the WTO’s dispute-settlement mechanisms.
Modalities for negotiations on trade facilitationThe modalities for negotiations on trade facilitation—Annex D of the package thatemerged from the July 2004 WTO Council meeting—were therefore constructed insuch a way as to address and protect the interests of developing-country members,particularly least developed countries (LDCs), through four unique features.• The scope of the negotiations is limited to clarifying and improving the relevant
aspects of Articles V, VIII, and X of the General Agreement on Tariffs and Trade(GATT) with a view to further expediting the movement, release, and clearanceof goods, including goods in transit. Members explicitly narrowed the definitionof trade facilitation to “the simplification and harmonization of internationaltrade procedures.”3
• The modalities do not necessarily envisage binding rules as the outcome ofnegotiations. “It is understood that [the negotiations are] without prejudice tothe possible format of the final result of the negotiations and would allowconsideration of various forms of outcomes” .
• Any commitments ultimately negotiated are to be calibrated to theimplementation capabilities of developing-country members. LDC memberswill not be expected or required to undertake commitments that are inconsistentwith their individual development, financial and trade needs, or theiradministrative and institutional capabilities. Likewise, they will not be obligedto undertake investments in infrastructure beyond their means.
Table 1. Some benefits of enhanced trade facilitation for governmentsand traders
Source: UNECE 2002. Trade facilitation: An introduction to the basic concepts andbenefits, 2002 (www.unece.org).
Governments Traders
• Increased effectiveness of control methods
• Lower costs and shorter delays
• More effective and efficient deployment of resources
• Faster customs clearance and release through predictable official intervention
• Correct revenue yields • Simpler commercial framework for domestic and international trade
• Improved trader compliance • Enhanced competitiveness
• Encouragement of foreign investment

TRADE, DOHA, AND DEVELOPMENT: A WINDOW INTO THE ISSUES
182
• The modalities duly link implementation of any commitments to the receipt oftechnical assistance and support for capacity building both during thenegotiations and in the course of implementation. Indeed six of Annex D’s tenparagraphs are devoted to the issue of technical assistance and capacitybuilding.In one sense, the content of the Annex D document, developed in the weeks
leading up to the July 2004 General Council meeting, was a victory for the developing-country members in that its provisions clearly shelter them from obligations that arebeyond their means and capacity. At the same time, the document commits thedeveloped countries to providing appropriate technical assistance. However, thesesame provisions may leave LDCs in a position where they are required to implementalmost nothing of substance, which may encourage them to postpone necessaryimprovements to their border processing regimes and so prolong their marginalstatus in the international trading system.
Box 1. Existing GATT Trade Facilitation-Related Articles
Article I (most-favored-nation treatment) requires that imports from, orexports to, any WTO member must receive nondiscriminatory treatment inthe application of customs duties and customs formalities.
Article V (freedom of transit) provides a basis for an environment inwhich the transit of goods is free from barriers to transport and discrimina-tion among suppliers, firms, and traders from different countries.
Article VIII (fees and formalities connected with importation andexportation) relates in general to customs clearance procedures andincludes a general commitment to nondiscrimination and transparency infees and rules applied to goods crossing borders.
Article X (publication and administration of trade regulations)contains general commitments to assist in ensuring timely publication ofregulations regarding imports, including fees, customs valuation procedures,and other rules. It also provides general obligations to maintain transparentadministrative procedures for review of disputes in customs.
Trade facilitation is addressed in other WTO obligations and provisions,as well, including special agreements on matters such as Customs Valuation,Import Licensing, Preshipment Inspection, Rules of Origin, TechnicalBarriers to Trade, Sanitary and Phytosanitary Measures, and IntellectualProperty Rights.

TRADE FACILITATION
183
The trade-facilitation negotiations—progress to dateIn October 2004 the WTO Trade Negotiations Committee established a TradeFacilitation Negotiating Group (TFNG) under the chairmanship of AmbassadorYacob Muhamad Noor of Malaysia. Since beginning its work in November, thegroup has met at four- to six-week intervals. As of the end of September 2005, WTOmembers had submitted more than 50 proposals, focused on clarifying and improvingArticles V, VIII and X. To assist members to analyze the proposals and to provide abasis for further discussion within the TFNG, the WTO Secretariat has prepared acompilation or summary document (TF/TN/W43) that is updated after each meetingof the TFNG.4
The proposals submitted to date, covering all aspects of GATT Articles V, VIII,and X, have stimulated productive discussion and debate within the TFNG. Proposalsrange from relatively straightforward issues that are likely to be incorporated in anypossible new agreement (such as employing risk-management principles to assessthe risks posed by imported cargo), to more difficult and resource-intensivemeasures, such as the implementation of electronic single-window regimes.Significant time has been devoted to discussing the needs and priorities ofdeveloping-country members for technical assistance and capacity building.
Overall, the negotiations have been conducted in a spirit of cooperation andcompromise not always evident in other areas of negotiation within the WTO. With
0 5 10 15 20
SS Af rica
MNA
South As.
ECA
Latin Am
East Asia
OECD
Figure 1b. Port and customs in efficiency drive up the cost of export
Days through ports to warehouse
Signatures required to export
Source: World Bank, Doing Business 2006.

TRADE, DOHA, AND DEVELOPMENT: A WINDOW INTO THE ISSUES
184
most of the key proposals now in hand, negotiations will shift toward a process ofclarifying those proposals, and then narrowing and refining the list of measuresthat are likely to be agreed on.
Support from international organizationsThe modalities encouraged international organizations—including the InternationalMonetary Fund, OECD, UNCTAD, World Customs Organization (WCO), and theWorld Bank—to “undertake a collaborative effort.” To date, the internationalorganizations have focused on three key areas: (a) promotion and advocacy tohighlight the benefits of trade facilitation and encourage members to seek a positiveand ambitious outcome; (b) sharing of information on relevant tools, instruments,and international standards; and (c) providing advice and assistance to help membersdetermine needs and priorities for technical assistance related to the negotiatingagenda.
Noteworthy in this regard is OECD’s ongoing work on the cost of introducingand implementing trade-facilitation measures. The WCO, too, has supported thenegotiations by providing information on its instruments and tools, including theRevised Kyoto Convention and its Time Release Study methodology. The WCOalso has partnered with the WTO secretariat, UNCTAD, and the World Bank tocontribute its expertise through workshops, seminars, and other events throughoutthe world. UNCTAD has been equally active, providing advice and guidance to
WB/WCO proposal analysis grid
Figure 2. Governments should look for high benefits, low cost reforms
Source: World Bank and World Customs Organization.
Reject Proposal?
Support ProposalBut…
Consider S & DT and TA/Capacity Building needs
& priorities?
Don’t Care? Support Proposal
Low
High
Impl
em
ent
atio
nD
iffic
ulty
/Cos
t
Benefits for Government and TradersLow High
Reject Proposal?
Support ProposalBut…
Consider S & DT and TA/Capacity Building needs
& priorities?
Don’t Care? Support Proposal
Low
High
Impl
em
ent
atio
nD
iffic
ulty
/Cos
t
Benefits for Government and TradersLow High

TRADE FACILITATION
185
members based on its capacity building experience and hosting or contributing toa range of relevant educational and informational events in Geneva and around theworld. The World Bank’s support for negotiations has been focused on providingbalanced advice to negotiators on the benefits and consequences of an ambitioustrade-facilitation agreement. It has also helped developing-country negotiatorsovercome some of the practical constraints they face.4 The World Bank’s engagementhas been premised on the view that much of the technical expertise necessary toexamine and assess proposals as they are tabled within the TFNG already exists inmembers’ capitals and that real-time contact between Geneva-based negotiatorsand content specialists in the capital will help developing-country members gainconfidence in their ability to implement the measures under negotiation.
Several points of nascent agreement have emerged from the discussions oftechnical assistance and capacity building:• Although needs, priorities, and capacities vary enormously from region to
region and from country to country, there is a significant degree of commonalityand much agreement about the potential benefits of the proposals tabled todate.
• Most proposals are positive and have been welcomed by government officialsand private sector representatives. Fears of excessive costs and a lack oftechnical capacity associated with implementation may have been overstated.This not to suggest that members would not benefit from well-targeted capacitybuilding support, but that many of the measures currently proposed can beimplemented with relatively modest amounts of technical assistance andcapacity building support. The assessments of members’ home-based specialistshave revealed that many of the measures proposed to date within TFNG wouldultimately have been introduced by members’ customs administrations as theyrepresent best practice in customs and border management and are frequentlyincluded in existing internationally agreed instruments.5
• Content-matter specialists have also noted that many of the barriers toimplementation are domestic (insufficient political commitment to reform andpoor interagency cooperation are two examples) and thus not susceptible toresolution through the sort of technical assistance and capacity building thathave been under discussion.
• Few countries are starting from scratch as most are already engaged in someform of reform and modernization of their border processing regimes (oftensupported by significant donor support) and therefore any technical assistanceand capacity building support that is ultimately provided will need tocomplement rather than displace existing efforts.With respect to the proposals tabled within the TFNG, many participants have
noted that it is easier to identify needs for assistance than it is to ascertain theprecise form and cost of that assistance. Donor organizations have a comparative

TRADE, DOHA, AND DEVELOPMENT: A WINDOW INTO THE ISSUES
186
advantage in this area, because they possess much more experience and expertisein developing and costing technical assistance and capacity building activities.Clearly, concerns about the potential costs associated with implementing a newagreement have been at the center of the debate within the TFNG and a clearerunderstanding of exactly what is required will greatly facilitate negotiation of ameaningful agreement.
Inspired in part by the above conclusions, the World Bank will undertake, inthe first half of 2006, a series of studies to provide more detailed information tomembers about the actual costs of closing the gap between existing systems andprocedures and those envisaged under a new trade-facilitation agreement.
In the coming months negotiators within the TFNG will focus on refining themeasures that have been proposed to date. Essentially, they will weigh up the costsand benefits of individual proposals and measures based on their own needs andpriorities. Although this is often a complex process involving the participation ofmany national stakeholders the basic decisions that can be made are illustrated bythe proposal-analysis grid prepared by the WCO and the World Bank (figure 2).Members must decide whether the potential benefits to their governments andtraders justify the cost and effort of implementation. To date, when content-matterspecialists have been involved in the assessment of the various proposals, the vastmajority of proposals have been deemed worthy of support; that is, the specialistsplaced them in one of the two right-hand quadrants of the grid.
Challenges ahead: prospects for a new WTO trade-facilitationagreementThe key to a positive outcome will depend in large part on the capacity of developedcountry members and the international organizations to deal with the remainingconcerns of developing and LDC members about the potentially high costs ofimplementation and the availability of technical assistance and capacity buildingsupport. The difficulty is complicated by the fact that the precise content of a newagreement is not yet clear. For example, several countries have submitted proposalsrelating to the implementation of a “single window” at which traders might obtainall of the permits and clearances required for the importation or exportation ofgoods. Depending on the definition ultimately employed in a new agreement,members’ needs for technical assistance and capacity building related to the singlewindow could vary from almost nothing to many millions of dollars.6 Likewise, thescale of a country’s needs for technical assistance and capacity building will dependon the provisions for special and differential STDT treatment that might apply tospecific measures.
In the continuing absence of precise information on the scope, content, andmagnitude of the technical assistance needs facing members it will be difficult for

TRADE FACILITATION
187
developed-country members and international organizations to make open-endedcommitments about the provision of technical assistance and capacity building.
A second complication is related to donors’ concerns that the imperatives of anew WTO agreement on trade facilitation might subsume or displace their existingprojects and development assistance activities agreed though existing bilateral andmultilateral channels. To move away from this approach would be to ignore thefocus on “demand driven” assistance that has characterized donor support inrecent years.
Differentiating between the specific issues on the negotiating agenda andcomprehensive trade-related reform is sometimes extremely difficult. For example,many customs and border clearance systems involve a series of separate butinterdependent activities; several members have expressed concerns about acceptingnew obligations that may require changes in underlying technical and administrativesystems. Identifying critical interdependencies among the specific WTO measuresunder negotiation will be an important element of the work being done by membersand international organizations to determine needs and priorities for technicalassistance and capacity building support.
The World Bank and other multilateral and bilateral donors have reported onthe scale and scope of their trade-facilitation activities in meetings of the TFNG.Such information has raised members’ awareness of the scope and scale of donorsupport already available. The process of sharing such information will have tocontinue in the coming months, because obtaining an ambitious agreement willrequire universal confidence that developing-country members will be able obtainthe help they need to implement the agreement.
While the nature and shape of a suitable international mechanism to coordinateand manage this process is still being discussed within the TFNG, it is generallyaccepted by WTO members that it will need to ensure effective cooperation andcoherence between all the different players and meet certain key criteria. In essence,to allay the concerns of developing-country and LDC members, the coordinationmechanism must have the following attributes:• A robust process for identifying needs and priorities and matching those needs
and priorities with technical assistance and capacity building support; and• Sufficient flexibility to allow bilateral and multilateral donors to contribute according
to their capacity, resources, priorities, and comparative advantage7; and• The ability to build on or complement, rather than replace or duplicate, existing
bilateral and multilateral mechanisms developed by donors over many yearsand established in close consultation with client governments; and
• Economies of scale (for example, if many countries determine that they needtechnical assistance to introduce a measure such as risk management, it wouldseem sensible to develop a core package that can then be tailored to meet thespecific needs of individual members); and

TRADE, DOHA, AND DEVELOPMENT: A WINDOW INTO THE ISSUES
188
• Compatibility with other relevant international tools, standards, and tradefacilitation developments;8 and
• As least resource intensive as possible to ensure scarce resources are notwasted on unnecessary administrative activities; and
• Incorporate some form of robust evaluation and review mechanism.The need to develop effective mechanisms to coordinate and manage the
delivery of technical assistance associated with the implementation of the TF agree-ment is well acknowledged by all donors. Such mechanisms should build on exist-ing initiatives at the multilateral and bilateral levels and be consistent with thebroad Aid for Trade initiative that is underway. Of critical importance at the momentis that members continue to define the content of a new trade-facilitation agreementin full confidence that their concerns about the long term availability of technicalassistance needs are understood and that a suitable mechanism will be developedto deal with their legitimate concerns about implementation capacity.
ConclusionThe decision taken by the WTO General Council in July 2004 to launch negotiationson trade facilitation reflects a widely shared view that reforms to facilitate themovement of imports and exports and reduce costs and delays make gooddevelopment sense. To make the most of the opportunity presented by the launchof negotiations, developing countries (and particularly the least developed) shouldview the WTO negotiations as an opportunity to further their domestic reformagenda and accelerate the implementation of measures already accepted as goodpractice and incorporated in a range of internationally agreed instruments. Toreinforce that view of the negotiations, developing-country negotiators in Genevashould work closely with content matter specialists at home to develop a coherentnegotiating strategy that focuses on securing agreement on a range of practicalmeasures that will make it easier for their traders to compete in regional andinternational markets.
Notes1. The author is a Senior Trade Facilitation Specialist–in the International Trade Department
of the World Bank.2. The other Singapore issues were trade and investment, trade and competition policy, and
transparency in government procurement.3. A wider definition of trade facilitation could include all aspects of the supply chain including
government regulations, business competency and efficiency, the performance of customs andother regulatory agencies, the quality and availability of transport infrastructure, such as roads,airports, ports, etc., information and communications technology, and trade-related finance andinsurance services, among other things.
4. See WTO Document TN/TF/W/43/Rev 3.

TRADE FACILITATION
189
5. The Bank launched a Trade Facilitation Negotiations Support Project in February 2005. Itis designed to assist members who have limited resources in Geneva to provide their negotiatorswith real-time analysis and advice on the content and implications of proposals tabled inGeneva. The project has three components. Component I involved the development of a TradeFacilitation Negotiation Support Guide (available in English, French, and Spanish) to helpmembers establish negotiation-support groups in their capitals and improve the level of commu-nication between content specialists and Geneva-based negotiators. Component II consists of aseries of pilot workshops designed to promote the use of the guide and to demonstrate theusefulness of capital-based support groups to Geneva-based negotiators. Pilot workshops havebeen conducted in Jamaica, Uganda, and Sri Lanka and the results shared with WTO members.Three more pilot workshops will be conducted in the second half of 2005. Component III willconsist of a series of in-country studies of the cost of compliance focused on determining thecost of implementing a new agreement.
6. Such as the WCO’s Revised Kyoto Convention on the Simplification and Harmonization ofCustoms practices.
7. Recent World Bank projects that have included the development of a genuine electronicsingle window to connect traders with relevant government agencies have ranged in cost from$5.6 million to more than $30 million.
8. For example, Malaysia has recently offered its customs academy for use for regionalworkshops, seminars, and other events during the negotiations and later implementation. Like-wise, India has indicated its willingness to make its training facilities and expertise available toother countries in the region to assist with implementation of commitments that may flow froma new trade-facilitation agreement.
9. For example, at the WCO Council sessions in June 2005, the directors-general of 164customs administrations agreed on a Framework of Standards to Secure and Facilitate GlobalTrade (www.wcoomd.org). The framework overlaps many of the measures under considerationin the WTO negotiations.
ReferencesHummels, D. 2001. “Time as a Trade Barrier.” Mimeo. Department of Economics, Purdue
University, Lafayette, Ind.UNECE. 2002. “Trade Facilitation: An Introduction to the Basic Concepts and Benefits.”
Geneva:United Nations, ECE/TRADE/289. www.unece.org.World Bank. 2006. Doing Business. Washington, D.C.


Intellectual Property and Public Health: The WTO’s August 2003 Decision in Perspective
Carsten Fink
15
In August 2003, members of the World Trade Organization (WTO) agreed on awaiver to certain WTO intellectual property rules. The waiver was designed toimprove access to generic drugs for countries in need. Promoting poor people’s
access to medicines and vaccines is central to alleviating poverty and fighting theHIV/AIDS epidemic. Only 5 percent of infected patients in the developing worldreceive the antiretroviral (ARV) drugs that have made AIDS a treatable disease inrich countries. Better access to drugs is equally important for combating malaria,tuberculosis, diarrhea, cancer and many other diseases that annually kill millions ofchildren and working-age adults in poor countries. This note outlines the mainelements of the so-called August 2003 Decision and explores how it may affectaccess to medicines in poor countries.1
Patents, generics, and drug pricesNewly developed medicines are generally protected by patents that offer time-limitedmarket exclusivity to the patent holder, usually a research-based pharmaceuticalcompany. The patent system provides incentives for pharmaceutical innovation. Itallows patent holders to charge prices in rich-country markets that recoupinvestments in research and development (R&D). But rich-country prices for newdrugs can be unaffordable to poor people in the developing world. For example, thecost of an ARV drug therapy in developed nations can easily exceed $30 a day,whereas three billion of the world’s people live on less than two dollars a day.
Efforts have been made to reduce drug prices in poor countries. In the case ofARVs, pharmaceutical companies have offered steep price discounts to developing-country governments. In selected countries, they also have offered drugs for freeand provided the health infrastructure needed to make antiretroviral treatmentseffective. While such actions are laudable, they are not systematic and depend onthe good will of private firms. Clearly, the scale of the health crisis in the developingworld is too large to be solved by private philanthropy alone.
Another strategy is to rely on manufacturers of generic drugs to producecopycat versions of patented products and so force down prices throughmarket competition. Indeed, the price discounts on ARVs offered by theoriginator companies were probably brought about as much by competitionfrom generic producers as by voluntary decision (figure 1). As of June 2005,generic manufacturers—especially from India, but also from otherdeveloping countries—offered the lowest prices for most AIDS drugs.2
191

TRADE, DOHA, AND DEVELOPMENT: A WINDOW INTO THE ISSUES
192
TRIPS, compulsory licenses, and the Doha DeclarationGeneric production is possible for the great majority of essential medicines, whichcurrently are not protected by patents in developing countries.3 However, thispractice may become more difficult as stronger patent rules required by the WTOhave come into effect. As part of the Uruguay Trade Round (1986–94), members of(what is now) the WTO negotiated the Agreement on Trade-Related Aspects ofIntellectual Property Rights (TRIPS). That agreement obliges countries to extendpatent protection to pharmaceutical products and processes. While TRIPS foreseesvarious periods of transition for developing countries, the supply of generics maybe significantly curtailed in the near future (box 1).
In principle, governments have the option of overriding the market exclusivityof patents by granting so-called compulsory licenses to generic manufacturers.TRIPS allows the use of compulsory licenses. In cases of “national emergency orother circumstances of extreme urgency,” and in cases of public, noncommercialuse, it does not even require that the proposed user first make efforts to obtain avoluntary license from the patent holder.4
Responding to concerns that the TRIPS patent rules could undermine accessto medicines in poor countries, WTO members issued a declaration at their ministerialmeeting in Doha, Qatar in 2001, reaffirming the right of governments to usecompulsory licenses. Indeed, several developing country governments have granted
Figure 1: Originator and Generic Drug Prices for a Sample ARVTriple - Combination
Notes: Sample of ARV triple-combination: stavudine (d4T) + lamivudine (3TC) + nevirapine(NVP). Lowest world prices per patient per year.Source: Médicines sans Frontières, “Untangling the Web of Price Reductions,” variouseditions, available at www.accessmed-msf.org.
-
2,000
4,000
6,000
8,000
10,000
12,000
May Aug Nov Feb May Aug Nov Feb May Aug Nov
Originator price
Generic price
93
10,439
2,767
350
727 295 209
2000 2001 2002
-
2,000
4,000
6,000
8,000
10,000
12,000
May Aug Nov Feb May Aug Nov Feb May Aug Nov
Originator price
Generic price
93
10,439
2,767
350
727 295 209
2000 2001 2002
(Dollars)

INTELLECTUAL PROPERTY AND PUBLIC HEALTH
193
compulsory licenses on different AIDS drugs in the past few years—for example,Malaysia, Mozambique, and Zambia.5 Notwithstanding these recent cases,compulsory licenses have not been used frequently in the past, for two reasons.First, as pointed out above, most medicines in developing countries have been freeof patents, so there has been little need to override market exclusivity. Second, thethreat of permitting the production of competing generic medicines has ledpharmaceutical companies to offer the drugs at cheaper prices. This arguablyhappened when some in the U.S. government advocated overriding the patent ofthe drug Ciprofloxacin during the 2001 anthrax crisis.6 Similarly, the pharmaceuticalcompany Roche offered a 40 percent price reduction on its AIDS drug, Viracept, toBrazil after the Brazilian government publicly announced in 2001 that it would issuea compulsory license to a local laboratory.7
In the future, as more products in more places will be protected by patents,granting compulsory licenses to local producers may emerge as an effective strategyto promote generic competition in developing countries that have the capacity tomanufacture pharmaceuticals. Well-developed pharmaceutical industries can befound, for example, in Argentina, Brazil, China, India, and Thailand. Yet many otherdeveloping countries—especially the least developed countries of Africa—do notpossess pharmaceutical manufacturing capabilities. These countries can effectivelyuse the compulsory licensing option only if they are allowed to import genericdrugs. Yet it was legally uncertain whether this would be allowed under TRIPS (Box2). Acknowledging the difficulties that countries with insufficient or nomanufacturing capacity face in using the compulsory licensing mechanism, theDoha Declaration called for negotiations to solve the problem.
The August 2003 decisionPost-Doha negotiations on implementing the declaration lasted almost two yearsand were marked by acrimonious debate. Several points of contention emerged—among them which countries should be eligible importers, whether to limit the rangeof diseases to which the new system would apply, and what kind of reportingrequirements and safeguards should be established (Abbott 2005). WTO memberswere not able to strike a deal by the December 2002 deadline specified in the DohaDeclaration, with the United States alone blocking the proposed compromise.Another attempt at consensus failed in February 2003. But in August, amid concernsthat the stalled negotiations would risk failure of the September 2003 WTO MinisterialMeeting in Cancún, Mexico, an agreement was reached.8
The August 2003 deal consists of a decision by WTO members, accompaniedby a statement from the chair of the WTO General Council that spelled out certainshared understandings on the interpretation and implementation of the decision.Key elements of the new system are as follows:

TRADE, DOHA, AND DEVELOPMENT: A WINDOW INTO THE ISSUES
194
The provisions of TRIPS entered into force on a staggeredschedule—with the main obligations applicable to developed countries atthe beginning of 1996, and most obligations applicable to developingcountries as of January 1, 2000. Developing countries were allowed to delaythe introduction of pharmaceutical patent protection until the beginning of2005, and the least developed countries are still entitled to a transition periodending in 2016 (with the possibility of a further extension). At the same time,a convoluted compromise negotiated during the Uruguay Round obligeddeveloping countries that did not immediately provide for patent protectionto accept applications for pharmaceutical product patents during thetransition period (so-called mailbox patents) and grant “exclusive marketingrights” to those products for five years or until the patent is granted orrejected, whichever is shorter.
In practice, these transition periods mean that pharmaceutical compoundsfor which patents were filed before the entry into force of the TRIPSagreement (January 1, 1995) will not receive patent protection in thosecountries that previously excluded pharmaceutical products from the scopeof patentability. The compounds that will remain open to generic competitioninclude the great majority of medicines on essential drug lists, among them anumber (but not all) of the ARVs. Drugs patented after developing countriesimplemented their TRIPS obligations—including some of the most effectivenew treatments to combat HIV/AIDS, malaria, and tuberculosis—are nowcoming into markets. As time goes by, they will make up a growing share ofpharmaceutical sales.
Of special relevance is the situation of India—the most important supplierof generic drugs. Following the conclusion of the Uruguay Round, Indiaopted for the mailbox transition mechanism to fulfill its TRIPS obligation. Fullpharmaceutical product patent protection became available only with the2005 amendments to the Indian Patents Act. However, the March 2005amendment contains a provision allowing Indian manufacturers to continuegeneric production of drugs for which mailbox patents are granted. Thisprovision would appear to delay the arrival of medicines supplied undermarket exclusivity in India.
Least developed countries in Africa and elsewhere will not be required toprotect drug patents for the foreseeable future. While many of thesecountries do not possess generic manufacturing capabilities in the firstplace, some do, and the staggered structure of the TRIPS transition periodsmay encourage generic pharmaceutical production in the least developedcountries. Pharmaceutical manufacturers in Bangladesh, for example, areseeking to build on this advantage.
Box 1. Untangling the TRIPS transition periods

INTELLECTUAL PROPERTY AND PUBLIC HEALTH
195
• Its applicability is not limited to a predefined set of diseases (as was favored bysome WTO members during negotiations) or to emergency situations.9 At thesame time, members acknowledged that the system should not be used “as aninstrument to pursue industrial or commercial policy objectives.”
• Eligible importing members are defined as any least developed country as wellas any other member that finds that it has insufficient pharmaceuticalmanufacturing capacity for the product in question. However, severaldeveloping countries indicated that they would use the system only in situationsof national emergency or other circumstances of extreme urgency.10 The majorityof OECD countries and the countries that recently acceded to the EuropeanUnion opted out of the system altogether.11
• The importing member must notify the WTO of its grant of a compulsorylicense (or its intention to make such a grant) and the names and expectedquantities of the pharmaceutical products needed.12 The exporting membermust notify the WTO of the name of the generic manufacturer(s), the productsand quantities for which the license is granted, and the countries to whichgeneric drugs are to be exported. In addition, the exporting manufacturer has topost detailed information about its shipments on a dedicated website.
• A number of safeguards minimize the risk that drugs produced under the systemand destined for poor countries should leak into rich countries’ pharmaceuticalmarkets. Prices of patented medicines are substantially higher in the developedworld, creating opportunities to profit by illegally diverting drugs. Thus,pharmaceutical products produced under the system have to be appropriatelylabeled and, to the extent possible, distinguished through special packaging,coloring, and shaping (provided this does not significantly affect prices). Inaddition, importing countries must take reasonable measures to preventreexportation of the products in question.The August 2003 Decision takes the form of a waiver of existing TRIPS rules. It
also instructs WTO members to adopt a permanent amendment to the TRIPSagreement that would be based, “where appropriate,” on the decision. This has nothappened, because WTO members still hold different views on the amendment.The United States—supported by Japan and Switzerland—would like it to includea reference to the statement by the chair of the General Council, a step opposed bymany developing-country members, which argue that such a reference would elevatethe legal status of the chair’s statement, which they view as separate from thedecision.
Several of the members that said they would use the system only in emergencieshave emphasized that their undertaking was voluntary. They oppose an amendmentthat would formally incorporate a list of countries opting out of the system. Thegroup of African WTO members has proposed an amendment that does not refer tothe chair’s statement and that eliminates several provisions of the decision that the

TRADE, DOHA, AND DEVELOPMENT: A WINDOW INTO THE ISSUES
196
group views as redundant—for example, certain notification requirements. Severaldeveloped-country members have criticized the proposal as upsetting the delicatebalance achieved in the August 2003 Decision.
Meanwhile, the August 2003 Decision retains its full legal effect. Several WTOmembers have begun to implement it in national laws and regulations. Canada andNorway were the first countries to amend their patent laws in 2004, allowing genericmanufacturers from these countries to become exporters under the new system.India also implemented the decision as part of its March 2005 amendment to itspatent act—an important step because some of the world’s most competitive genericmanufacturers are located in there. In addition, legislative changes are under way inthe European Union, Republic of Korea, Switzerland, and elsewhere.
How important is the new system?To date, the sysytem has not been used, and it may not be used for some time, asmost drugs are not covered by patents in key producer countries—notably India(see box 1). In addition, there is no need to invoke the system if an exporting
The TRIPS agreement does not prohibit governments from importinggeneric drugs under a compulsory license. Instead, the conflict arises inthe exporting country. Article 28 of TRIPS confers on patent holders theexclusive right to make patent protected products. Thus if a genericmanufacturer in country A produces a drug for export to country B (wherethe government has issued a compulsory license), it may infringe on therights of the patent holder in country A.
A special case arises if the drug in question is already produced under acompulsory license in country A. Article 31(f) of TRIPS mandates thatcompulsory licenses “shall be authorized predominantly for the supply ofthe domestic market of the Member authorizing such use.” (Emphasisadded.) If compulsory licenses are granted in large developing countriessuch as Brazil, China, and India, a nonpredominant share of productioncould still represent a significant supply for least developed countries.However, there may well be situations in which an exporter in a membercountry, acting in response to a compulsory license issued by anothermember (with insufficient capacity), would not intend to sell a predominantpart of its production in the local market. Finding a solution to that problemwas the crux of the post-Doha negotiations on TRIPS and public health.
Box 2. Imports of generic drugs under compulsory licenseand TRIPS rules

INTELLECTUAL PROPERTY AND PUBLIC HEALTH
197
country grants a compulsory license to supply the domestic market and a“nonpredominant share” of production is exported (see box 2).
But as more patented drugs come onto developing-country markets, there maywell be situations in which countries with no or insufficient manufacturing capabilitiesseek to import under compulsory license medicines that are not available abroad asgenerics. While compliance with the decision’s notification and safeguardrequirements seems manageable, there are other barriers to overcome. In particular,it may take more than a year and significant up-front investments for a genericsupplier to deliver quality medicines. Ensuring interim supplies from the patentholders and finding foreign manufacturers willing to take on the business riskinvolved—especially if the quantities involved are small—may not be easy. In anycase, even if the system is not used frequently, countries with insufficientmanufacturing capability are now in a more credible position to break the price holdof pharmaceutical patents when negotiating drug prices. As pointed out above, thethreat of compulsory licenses has been a valuable bargaining tool forgovernments in the past.
Moving forward: the need for further actionThe August 2003 Decision was an important landmark in ensuring consistencybetween multilateral intellectual property rules and public health objectives. Yetprogress in resolving intellectual property–related conflicts is insufficient to widenaccess to medicines in poor countries. Complementary action is needed in severalareas.
First, sufficient financial resources are needed to fight the developing world’shealth crisis. While substantial funding has become available in recent years,UNAIDS projects a gap between pledged funds and real needs totaling more than$18 billion over the next three years. The agency says that annual spending of $22billion will be needed by 2008.13
Second, to effectively treat patients in poor countries, large investments incomplementary health infrastructure are necessary, including hospitals, roads,warehouses, and medical personnel. In addition, the procurement of generic drugsrequires the development of quality control mechanisms. In the case of ARVs,drugs of inferior quality can cause AIDS patients to become resistant, even todrugs of better quality. A WHO program to prequalify generic producers of ARVsalready helps governments in selecting quality generic medicines. That programneeds to be complemented by quality assurance regulations at the nationallevel—and by greater capacity to implement and monitor those regulations.
Third, relatively little research has been done on diseases that are prevalent inthe developing world but not common in rich countries. For such diseases, the lowpurchasing power of patients in poor countries limits the incentives for research-based pharmaceutical companies to invest in such research (even if the economic

TRADE, DOHA, AND DEVELOPMENT: A WINDOW INTO THE ISSUES
198
value of patents remained undiluted by compulsory licenses.) In 2003, NorthAmerica, the European Union, and Japan alone accounted for 88 percent of the $466billion of global pharmaceutical sales. The low-income countries with the heaviestdisease burden probably account for less than 2 percent of global sales. It is thereforeimportant to find alternative incentive mechanisms and funding sources to encouragemore R&D specific to developing countries.14
ConclusionThe WTO’s August 2003 Decision has established a new system for countries withinsufficient manufacturing capabilities to import generic medicines under compulsorylicenses. Fully operational until replaced by a formal amendment to the TRIPSagreement, it may develop into a useful policy option as the share of drugs patentedin the developing world grows over the next five to ten years. Meanwhile, it will beimportant to address other barriers to promoting access to medicines—notablyinsufficient funding, weak health infrastructures, and inadequate incenives to engagein R&D specific to the diseases of the poorest countries.
Notes1. This Trade Note was written by Carsten Fink, Senior Economist at the World Bank
Institute. It is a revised version of Trade Note No. 5, which was published in May 2003.Comments by Frederick Abbott, Carlos Braga, Philip John Hedger, Manjula Luthria, RichardNewfarmer, Juan Rovira, Beata Smarzynska Javorcik and Arvind Subramanian are gratefullyacknowledged.
2. Comparing prices of originator and generic drugs is a tricky business. For example, some ofthe generic manufacturers listed in the pricing guides published by Médecins Sans Frontières arenot prequalified by the WHO as meeting standards of quality and compliance with goodmanufacturing practices. These manufacturers do not necessarily produce substandard medicines,as exclusion from the WHO list does not mean that a drug has failed to gain approval from anational drug regulator. Different price quotation practices with regard to transportation anddistribution costs, as well as currency fluctuations, further complicate price comparisons.
3. The World Health Organization’s Model List of Essential Drugs has excluded many drugsprotected by patents, as affordability is one of the criteria used in designating medicines asessential. However, WHO’s latest list includes a significant number of patented drugs (particularlyfor treatment of HIV/AIDS).
4. The term “compulsory license” is often used loosely. As a matter of domestic policy, thereis an important distinction between use of a patent by third parties (private firms) and use bygovernments.
5. See WHO Document EB115/32 (“Antiretrovirals and Developing Countries”). In the caseof Malaysia, the license in question was for the import of antiretroviral drugs from India for usein public hospitals only.
6. According to a October 2001 press release of the U.S. Department of Health and HumanServices, Bayer agreed to supply ciprofloxacin at $0.95 per tablet, much less than the previousdiscounted price of $1.77 (http://www.os.dhhs.gov/news/press/2001pres/20011024.html). In aJanuary 2002 “Form 20-F” filing with the U.S. Securities and Exchange Commission, Bayerinformed investors that “in response to the recent bioterror attacks in the United States, the

INTELLECTUAL PROPERTY AND PUBLIC HEALTH
199
U.S. and Canadian governments contemplated compulsory licensing of our ciprofloxacinantibiotic—in effect, permission to generic manufacturers to market ciprofloxacin before theexpiry of our patent rights.”
7. See the press release by Roche, dated August 31, 2001. http://www.roche.com/media-news-2001-08-31-e.pdf.
8. The Cancún WTO Ministerial Meeting failed anyway, for different reasons.9. The decision refers to the public health problems recognized in paragraph 1 of the Doha
Declaration. That paragraph reads: “We recognize the gravity of the public health problemsafflicting many developing and least-developed countries, especially those resulting from HIV/AIDS, tuberculosis, malaria and other epidemics.”
10. These countries are Hong Kong (China), Israel, Republic of Korea, Kuwait, Macao (China),Mexico, Qatar, Singapore, Taiwan (China), Turkey, and the United Arab Emirates.
11. These countries include all 30 members of the OECD (except Republic of Korea, Mexico,and Turkey) as well as Cyprus, Estonia, Latvia, Lithuania, Malta, the Slovak Republic, andSlovenia
12. This notification is required only if the drug in question is protected by patent in theimporting country.
13. See “Resource Needs for an Expanded Response to AIDS in Low and Middle IncomeCountries,” presented to the UNAIDS Programme Coordinating Board in 2005 (available atwww.unaids.org).
14. The World Health Organization’s Commission on Intellectual Property Rights, Innovation,and Public Health is collecting proposals to this effect (see www.who.int/intellectual property).
ReferencesAbbott, Frederick M. 2005. “The WTO Medicines Decision: World Pharmaceutical Trade and
the Protection of Public Health.” American Journal of International Law 99: 317–58.
Data sourcesData on the number of people infected by HIV/AIDS and the number who receive antiretroviraldrugs are from UNAIDS. The $30 figure on the estimated costs of antiretroviral therapy indeveloped countries is approximately equivalent to the $10,439 figure shown in figure 1. Thefigure on global pharmaceutical sales in 2003 and the share of North America, the EuropeanUnion and Japan in these sales are from the IMS Health Review 2004.


The Debate on Geographical Indications in the WTO
Carsten Fink and Keith Maskus16
New rules and mechanisms for the protection of geographical indications(GIs) have been a subject of lively discussion in the current multilateraltrading round—the Doha Development Agenda (DDA). Some WTO
members advocate stronger multilateral protection for GIs and view progress on theissue as an important quid pro quo for advancing negotiations in other areas. Othermembers favor a less ambitious outcome as part of an eventual Doha Round package,and, in particular, argue that the negotiating mandate on GIs is limited in scope andambition. Differences do not break along the typical North–South divide associatedwith intellectual property discussions in the WTO, nor along the lines of some ofthe main negotiating alliances in the DDA. Proponents of a stronger GI systeminclude, Bulgaria, the European Union, Kenya, India, Sri Lanka, Switzerland, andThailand. Members favoring a less ambitious outcome include Argentina, Australia,Canada, Chile, Costa Rica, Guatemala, Japan, Namibia, Taiwan (China), and theUnited States.1
This note will take stock of the discussion on GIs stands as WTO membersprepare for the Sixth WTO Ministerial Conference in Hong Kong in December 2005.It also will put this discussion into a broader economic perspective and highlightsome of the key issues at stake.
What are geographical indications?Geographical indications are signs that link a product to a particular place, such asa city or region. Their use indicates that a product possesses certain qualities orenjoys a reputation associated with its geographical origin.2 Many GIs pertain tofood products, for which quality is often directly linked to a region’s inherentcharacteristics, such as soil attributes or climatic conditions. But a GI may alsoreflect certain manufacturing skills or production processes that are associatedwith a particular place. Box 1 presents examples of geographical indications fromaround the world.
Governments have long used various legal instruments to protect GIs frommisappropriation by nonoriginal producers. Historically, protection was first affordedthrough consumer protection laws, such as regulations against false tradedescriptions. In many countries, GIs have also been recognized as a form ofintellectual property—either as part of the trademark system or through dedicatedlaws for their protection. To obtain protection through the intellectual propertysystem, interested parties must register their GIs with a designated public body.
201

TRADE, DOHA, AND DEVELOPMENT: A WINDOW INTO THE ISSUES
202
Economic ConsiderationsLike other forms of intellectual property, GIs arise as a solution to certain failures inmarkets for information.3 They are used primarily for products that are known ineconomics as “search goods” or “experience goods.” Simple commodities, such aswheat and sugar, generally do not command GI protection because they can beproduced with a reasonable degree of homogeneity in many locations. Accordingly,consumers need not worry too much about searching for specific qualitycharacteristics. However, products with known quality variations (and thereforedifferentiated or heterogeneous), do carry significant search costs for consumers.By providing a signal to potential buyers, GIs can lower those costs and makemarkets more efficient. Such a signal can be particularly important in the case ofexperience goods, such as wine and cheese, where consumers understand thequality from prior consumption but cannot distinguish quality simply by inspectingthe product.
The signaling function of GIs is valuable not only for consumers in the domesticeconomy, but also for those in foreign countries. In fact, their role in internationaltrade may be greater than in domestic commerce, because informational problemsare likely to be more pronounced when producers and consumers are located indifferent countries.
Conceptually GIs are closely related to trademarks, which identify a product ashaving been produced by a particular enterprise. Because firms wish to protect thevalue of their trademarks, and reputation associated with them, they have a strongincentive to produce goods of a particular and predictable quality. Many food
Box 1. A few examples of geographical indicationsa
a. Not all of the products listed here have necessarily been registered as GIs.b. Or individual member states.
Country of origin ProductsChile Valle del Maipo (wine)Colombia Colombian coffeeIndia Darjeeling (tea), Basmati (rice)
European Union b Chablis (wine), Ouzo (spirit), Roquefort (cheese), Solingen (steel products)
Mexico Tequila (spirit)New Zealand New Zealand lambSri Lanka Ceylon (tea)Switzerland Swiss watches, Etivaz (cheese)Thailand Thai silkUnited States Washington State apples, Idaho potatoes, Florida oranges

THE DEBATE ON GEOGRAPHICAL INDICATIONS
203
products bear both a GI and a trademark to signal the quality of the geographicorigin and the quality of the individual producer.
Trademarks and GIs differ in two significant respects. First, a trademark isusually the property of a particular firm; other firms cannot compete under the samemark.4 In contrast, a GI is a piece of property shared by several or many firms. Theshared nature of a GI can raise problems of collective action. Free-riding by low-quality producers is one concern, but this is usually overcome by linking the use ofa GI to achievement of specific attributes detailed in the GI registration. Still,establishing, defining, enforcing, and jointly marketing GIs requires coordinationand can involve nontrivial transaction costs. This explains why GIs are sometimesmanaged or supported by (quasi-)public institutions, such as the “Consorzio delProsciutto di Parma” representing producers of Parma ham in Italy (Rangnekar 2004).
A second, related difference is that trademarks do not attach to a location,whereas GIs do. Accordingly, a good protected by trademark can be producedanywhere, whereas at least some significant portion of a good protected by GIsmust be produced within the indicated location. It is at this point that conflictsbetween protection systems can arise, as discussed below.
From the perspective of producers, GIs offer a means of attaching a reputationfor quality to a place name that may then be marketed and used on labels. In thiscontext, GIs can encourage firms to add value to their products, either by investingin higher-quality production techniques or by marketing.
Studies have quantified the price premia associated with certain GI-protectedproducts. A 1999 EU consumer survey found that 40 percent of consumers wouldpay a 10 percent premium for origin-guaranteed products (WTO 2004). Econometricmodels employing so-called hedonic pricing techniques support the willingness topay more for GI products. One econometric study found that certain regionaldesignations for Bordeaux wines command a large price premium—as much as $15per bottle in the case of the “Pomerol” designation (Landon and Smith 1998). Anothersuch study found that wines with a “Napa Valley” designation were priced 61percent higher than wines with a “California” designation (Bombrun and Sumner2003). Evidence for price premia is not limited to wines. Econometric work on theSpanish market for meat products showed, for example, that products bearing the“Galician Veal” label commanded a premium of $0.21 per kilogram (Loureiro andMcCluskey 2000).
From this evidence, there is little doubt that protection through GIs can supportsignificant increases in value-added through premium pricing. In this context,enterprises in some developing countries may be able to gain by using GIs innational and international markets.

TRADE, DOHA, AND DEVELOPMENT: A WINDOW INTO THE ISSUES
204
Where does the controversy lie?Like other intellectual property rights, it may be difficult to strike an optimal balancebetween consumer needs and producer gains in designing GIs. The economicconsiderations outlined above indicate that one key criterion in assessing theadequacy of a particular GI regime is its ability to reduce consumer confusion andsearch costs. From this perspective, exclusive rights attached to a GI can be overlystrong if they exclude alternative users that could enter the market and competewithout confusing consumers.4 This is especially relevant for geographicalexpressions that have evolved as product descriptions in the common language ofcertain countries—consider, at the extreme, expressions such as “china” for porcelainwares or “parmesan” for hard, dry, sharply flavored cheeses.
Policymakers’ views on how best to strike a balance in the protection of GIsdiffer markedly across countries. For example, in the United States nonoriginalproducers have been allowed to use GIs on certain products as long as the truegeographical origin of the products is made clear. This has given rise to so-calledsemi-generic expressions (such as “American-made Pecorino cheese”). By contrast,the European Union has a strong set of GI rules that give owners stronger exclusiverights than do U.S. rules. In addition, EU laws protect so-called traditional expressionsthat describe certain methods of production (such as “ruby” for a class of port fromPortugal).
The more lenient U.S. approach to GIs system is arguably more conducive toentry than the EU system. Little systematic evidence exists about whether it mayconfuse consumers. Complicating an economic assessment of different protectionregimes is that certain GI products are likely to have significant status value.Economists view “status goods” as products for which the mere use or display ofa particular label confers prestige on their buyers—regardless of a product’s quality.6
“Champagne,” “Beluga caviar,” and “Kobe beef” may fall into this category. Use ofthese GIs by nonoriginal producers may undermine the status value attached toproducts, eroding the price premia of original producers—even if consumers arenot confused about the true origin of their purchases.7
As a matter of law, GIs receive protection at the level of national jurisdictions;international conflicts result from different national approaches to protection. Inparticular, constituencies such as those in the European Union, which hosts manyGIs and provides strong protection, view weaker standards of protection abroad asa barrier to their exports. Even if there is little direct competition from producers inforeign countries, standards of GI protection can still matter because they mayinfluence competition from third countries. For example, Singapore’s GI rules affectthe extent to which European producers face competition from American producersusing semi-generic expressions. To resolve such conflicts, various internationalagreements for the protection of GIs have emerged over time.

THE DEBATE ON GEOGRAPHICAL INDICATIONS
205
The existing international system for protecting GIsInternational rules for the protection of GIs were first established in severalintellectual property conventions, notably the Paris Convention (originally signedin 1883) and the Madrid Agreement (originally signed in 1891). However, theseconventions were primarily concerned with repressing deceptive indications oforigin in international trade and did not provide for harmonized standards. TheLisbon Agreement (originally signed in 1958) went further, requiring signatories toprotect “appellations of origin” against usurpation (wrongful appropriation) orimitation and by establishing a system through which signatories to the agreementcan register their appellations of origin.8 However, only 23 countries have becomecontracting parties to the Lisbon Agreement.9
An important shift in international GI rulemaking was brought about by thecoming into force of the WTO’s Agreement on Trade-Related Aspects of IntellectualProperty Rights (TRIPS) in 1995. The TRIPS Agreement sets minimum standards ofintellectual property protection, which all 148 WTO members as well as countriesacceding to the WTO must, in principle, respect.10 In the area of GIs, it establishesthe following rules:• Members must establish the legal means to prevent GIs from being used by
nonoriginal producers in a way that would mislead the public as to thegeographical origin of a good or would constitute an act of unfair competition.
• A higher level of protection is reserved for GIs relating to wines and spirits. Forthese two classes of products, members have to prevent the use by nonoriginalproducers of a GI, even where the true origin of the good is made clear or useof the GI is accompanied by expressions such as “kind,” “type,” “style,” or thelike.
• These obligations are subject to certain exceptions. For instance, membersare not required to protect GIs that were used in good faith before the TRIPSAgreement was signed. Similarly, members are not required to protect GIsthat are considered to have become part of the common language.11 Whethera geographical name is considered generic depends on its historical use inthe language of a WTO particular member and may require domestic judicialinterpretation.TRIPS provisions on GIs reflect a negotiating compromise reached in the
Uruguay Round of trade negotiations. Accordingly, they did not fully satisfy theproponents of stronger GI protection. The European Union, in particular, has pursuedstronger protection in the context of bilateral trade agreements and in dedicatedbilateral GI agreements. For example, additional obligations for the protection of GIspertaining to wines and spirits exist in bilateral agreements between the EuropeanUnion and Australia, Canada, Chile, Mexico, and South Africa. Most notably, theseagreements contain lists of specific GIs to which signatories are required to apply

TRADE, DOHA, AND DEVELOPMENT: A WINDOW INTO THE ISSUES
206
the higher level of protection mentioned above. Several of the European GIs listed—especially for spirits—had been used by local producers; such use had to be (orwill have to be) phased out, even though it would likely have fallen under theexceptions of the TRIPS Agreement.12
In September 2005, the European Union and the United States concluded anAgreement on Trade in Wines settling certain longstanding disputes on wine namesand wine-making practices. As part of this agreement, the Unites States promised toseek legislative changes to limit the use of 17 semi-generic names—among themChablis, Champagne, Chianti, Port, and Sherry. However, current use of these nameswill be grandfathered such that U.S. producers can continue to sell their winesunder their present names. In return, the European Union pledged to recognize U.S.wine-making practices, thereby facilitating access of U.S. wine producers to theEuropean market.
Geographical indications in the Doha Development AgendaDiscussions on GIs in the DDA have centered on three elements: the establishmentof a multilateral system of registration for geographical indications; the extensionof the higher level of protection to products other than wines and spirits; and theprotection of product names as established through a list of geographical indicationscurrently used by nonoriginal producers (often referred to as the “claw-back” of GIs).
Source: Based on submissions of WTO members since 2001 (TN/IP/W/3, TN/IP/W/5, TN/IP/W/10, and as summarized by the WTO Secretariat in Document TN/C/W/25).
Table 1. WTO members with more and less ambition to strengthenGI protection
More ambitious members Less ambitious membersMultilateral GI register Bulgaria, European Union, Georgia,
Iceland, Mauritius, Moldova, Nigeria, Romania, Sri Lanka, Switzerland, Turkey
Argentina, Australia, Canada, Chile, Colombia, Costa Rica, Dominican Republic, Ecuador, El Salvador, Guatemala, Honduras, Japan, Mexico, Namibia, New Zealand, Philippines, Taiwan (China), United States
Argentina, Australia, Canada, Chile, Colombia, Dominican Republic, Ecuador, El Salvador, Guatemala, Honduras,
New Zealand, Panama, Paraguay, Philippines, Taiwan (China), United States
“Claw-back” European Union
Extension of higher level protection
Bulgaria, Cuba, European Union, Georgia, Guinea, Iceland, India, Jamaica, Kenya, Kyrgyz Republic, Liechtenstein, Macedonia, Madagascar, Mauritius, Morocco, Pakistan, Romania, Sri Lanka, Switzerland, Thailand, Tunisia, Turkey

THE DEBATE ON GEOGRAPHICAL INDICATIONS
207
Table 1 depicts the differential level of ambition of WTO members to strengthenGI protection along these three dimensions. The European Union is generally themember with the greatest ambition on all three, though several other developed anddeveloping countries also see themselves as having offensive interests in theprotection of GIs. The group of less ambitious members is often associated with the“New World”—which refers primarily to countries in the Western Hemisphere.However, the group also includes countries in other regions(e.g., Namibia, the Philippines).
The creation of a multilateral GI register is the least controversial in that it hasan explicit negotiating mandate. The TRIPS agreement called for negotiations toestablish such a register for wines, and the ministerial declaration launching theDDA in 2001 broadened that mandate by widening the scope of the envisagedregister to include spirits. Several explicit proposals for the design of a multilateralGI register have been put forward, but WTO members were not able to reachagreement by the original 2003 deadline. Substantial differences remain on severalfeatures of the registration system, including:• Scope of coverage. The more ambitious members would like the register to
cover products other than wines and spirits, whereas other members wouldprefer to adhere to the more limited negotiating mandate.
• Legal effect of registered GIs. According to TRIPS, the purpose of the multilateralregister is to “facilitate the protection of geographical indications.” The moreambitious members believe that effective facilitation requires a legal presumptionthat registered GIs are protected in the territory of WTO member states.Moreover, unless members were to lodge a reservation against a multilaterallynotified GI within 18 months, they should not be able to refuse protection ofthat GI–even if protection was not required by a country’s obligations underTRIPS. Other members believe that requiring WTO members simply to consultthe multilateral register when making decisions about registration and protectionat the domestic level would suffice in facilitating protection.
• Legal effect in nonparticipating member countries. The TRIPS mandate makesclear that participation by WTO members in the registration system will bevoluntary. However, under the proposal put forward by the European Union,there would still be a legal effect of registered GIs in nonparticipating membercountries. While there would be no legal presumption of protection,nonparticipating members—just like participating members—could not refuseprotection of a multilaterally registered GI unless they objected to the notificationwithin 18 months. Other members favor a system in which multilateralregistration has no legally binding effect whatsoever in nonparticipatingcountries. As for the question of extending the higher level of protection toproducts other than wines and spirits, differences of WTO members center on

TRADE, DOHA, AND DEVELOPMENT: A WINDOW INTO THE ISSUES
208
whether the Doha Ministerial Declaration establishes a negotiating mandatefor such a move. Members with more defensive negotiating interests on thisissue argue that negotiations can take place only if the WTO’s TradeNegotiating Committee so decides, whereas the European Union and othermembers believe a negotiating mandate exists already.13
Substantively, the proponents of extension argue that the current system dis-criminates against countries that are not significant producers of wines and spiritsbut that possess valuable GIs on other products that may be subject to usurpationin foreign jurisdictions. This explains why developing countries such as India,Kenya, Pakistan, and Thailand support extension. The opponents of extensioncontend that certain uses of GIs by nonoriginal producers can improve consumerchoice, as long as the true origin of products is made clear. They also argue thatthere is no proof that the existing level of protection under TRIPS is insufficient.Finally, New World producers have pointed out that, in many cases, productionmethods and product names were brought in by immigrants decades ago. Somereference to the original geographical names is therefore justified and should not beregarded as usurpation.
Probably the most controversial element in the current discussions is the “claw-back” initiative. In 2003, the European Union advanced a list of geographicalnames for which it wished to prohibit use by nonoriginal producers—mirroring theapproach taken in some of the European Union’s bilateral agreements. Many of thenames on the list do not enjoy GI protection in certain jurisdictions, as they areconsidered to be generic terms falling under the common-language exception of theTRIPS Agreement. The European Union (acting alone) put forward the claw-backinitiative in the DDA’s agricultural negotiations, and not in the TRIPS Council—theWTO forum normally responsible for trade-related intellectual property issues.That move has been criticized by some members because the negotiating mandateon agriculture set by the Doha Ministerial Declaration does not mention GIs.14 TheEuropean Union’s GI list includes wines and spirits as well as other products suchas Gorgonzola, Parmigiano Reggiano, Prosciutto di Parma, and Roquefort. If ac-cepted, it would imply new obligations even for those countries that have enteredinto bilateral agreements on wines and spirits with the European Union.
ConclusionGIs may become a contentious topic in the run-up to the Hong Kong WTOMinisterial Conference in December 2005. The European Union and other Europeancountries view progress on GIs as an important quid pro quo for improved marketaccess and reduction of subsidies in agriculture. The Hong Kong MinisterialConference may be the moment to strike a bargain, as one of its key aims is theconclusion of modalities for the DDA’s agriculture negotiations. At the same time,

THE DEBATE ON GEOGRAPHICAL INDICATIONS
209
WTO members remain deeply divided on the three elements outlined above. Progresson any one of them would require significant movement by those members withopposing interests, which seems possible only with substantial political impetus.
From an economic perspective, the “claw-back” of geographical names currentlynot receiving protection would likely bring the greatest and most immediate economicbenefit for the European Union. But it would also require the largest adjustments bynonoriginal producers who currently use European GIs. The scale of adjustmentsremains uncertain, however. For example, while nonoriginal producers may experiencea temporary decline in market share, the experience of Australian wine producerssuggests that the cessation of semi-generic terms under the Australia-EU bilateralagreement did not harm local products. To the contrary, it has been argued that therebranding of affected products and associated marketing efforts provided a boostfor Australian producers.15 Aside from such anecdotal evidence, there is littlesystematic evidence on the size of adjustment costs. Similarly, there is little evidenceabout the effects—in direction and size—of a GI “claw-back” on consumer welfare.
Some developing countries stand to gain from stronger WTO rules for GIprotection. However, benefiting commercially from GIs requires complementaryefforts to identify valuable GIs and to build an international reputation for them.Many developing countries have only recently begun to develop national GI systems;it will take time before substantial commercial benefits will arise. Meanwhile, thereare difficult questions to resolve in delineating the geographic boundaries of a GI,defining its quality attributes and other characteristics, establishing quality controlmechanisms, and collectively managing and promoting an indication. In addition,there is the risk that certain rent-seeking producers may use GIs as devices forexcluding competitors capable of producing goods of comparable quality.Addressing these challenges will require concerted efforts regardless of whatemerges from the GI discussions in the DDA.
Notes1. This Trade Note was written by Carsten Fink, Senior Economist at the World Bank Institute
and Keith Maskus, Professor of Economics and Chair of the Economics Department at theUniversity of Colorodo in Boulder. Comments by Antonio Berenguer, Lauro Locks, Wolf Meier-Ewert, Pedro Roffe, Maximiliano Santa Cruz, Christopher Spenneman, Thu-Lang Tran Waseschaand David Vivas are gratefully acknowledged.
2. The WTO’s Agreement on Trade-Related Aspects of Intellectual Property Rights definesGIs as “indications which identify a good as originating in the territory of a Member, or a regionor locality in that territory, where a given quality, reputation or other characteristic of the goodis essentially attributable to its geographical origin.” There are two instruments related to GIs:indications of source and appellations of origin. Indications of source are broader than GIs, inthat goods do not necessarily have to exhibit a quality, reputation, or other characteristicattributable to its geographic origin. Appellations of origin are narrower than GIs in that theynecessitate a link to quality or some other special characteristic directly attributable to a good’sgeographic origin. Reputation alone is insufficient.

TRADE, DOHA, AND DEVELOPMENT: A WINDOW INTO THE ISSUES
210
3. The failure of the market to provide for an efficient allocation of resources when consumersare unable to assess the quality of products was first observed by Akerlof (1970).
4. Exceptions are so-called collective marks and certification marks, which can be owned by anassociation of companies. In fact, these types of marks are used in some jurisdictions as aninstrument for the protection of GIs.
5. Josling (2005) argues that an overly strict GI regime that prohibits the use of place namesin ways that have no possibility of confusing consumers may be considered protectionist froma trade policy perceptive.
6. Fink and Smarzynska (2002) discuss status goods more extensively.7. Such an outcome is not certain, however. It is equally possible that clearly distinguishable
and low-quality copycat products enhance the perceived exclusiveness of the original products.8. See note 2 for the difference between appellations of origin and GIs.9. The 23 countries are Algeria, Bulgaria, Burkina Faso, Congo, Costa Rica, Cuba, Czech
Republic, Democratic People’s Republic of Korea, France, Gabon, Georgia, Haiti, Hungary,Israel, Italy, Mexico, Peru, Portugal, Republic of Moldova, Serbia and Montenegro, Slovakia,Togo, and Tunisia.
10. Least developed countries (LDCs) are exempted from most TRIPS disciplines—includingthe specific obligations on GIs—until December 31, 2005, although this deadline can be postponedupon duly motivated request. The two LDCs that have acceded to the WTO since 1996—Cambodiaand Nepal—were granted a transition period until December 31, 2006.
11. In addition, WTO members are not required to protect foreign GIs that are not protectedin their country of origin. Thus, any country seeking to promote a GI has to provide domesticprotection before seeking to have the indication protected internationally. For an in-depthdiscussion of the TRIPS provisions on GIs, see chapter 15 in UNCTAD-ICTSD (2005).
12. For a more detailed discussion of the European Union’s bilateral agreements, see Vivas andSpennemann (2005).
13. According to the ministerial declaration launching the DDA, the question of GI extensionis considered an “outstanding implementation issue” to be dealt with “as a matter of priority” bythe TRIPS Council, “which shall report to the Trade Negotiations Committee […] by the end of2002 for appropriate action.”
14. The framework for agriculture negotiations adopted by WTO members in July 2004identifies GIs as an issue “of interest but not agreed.”
15. See Battaglene (2005). In addition, Schamel and Anderson (2003) find that regional originhas become a major determinant of prices in the Australian wine industry, with price premiaaveraging about 31 percent for wines carrying Australian GIs.
ReferencesAkerlof, G. A. 1970. “The Market for Lemons: Qualitative Uncertainty and the Market
Mechanism.” Quarterly Journal of Economics 84: 488–500.Battaglene, Tony. 2005. “The Australian Wine Industry Position on Geographical Indications.”
Paper presented at the Worldwide Symposium on Geographical Indications in Parma, Italy,June 27–29.
Bombrun, Helene, and Daniel A. Sumner. 2003. “What Determines the Price of Wine?” AICIssues Brief 18, University of California, Davis.
Fink, Carsten, and Beata Smarzynska. 2002. “Trademarks, Geographical Indications, andDeveloping Countries.” In Development, Trade, and the WTO: A Handbook (pp. 403–12),ed. Bernard Hoekman, Aaditya Mattoo, and Philip English. Washington, DC: World Bank),pp. 403-41.
Josling, Timothy. 2005. “Geographical Indications: Protection for Producers or ConsumerInformation?” Unpublished paper. Stanford Institute for International Studies, Palo Alto, CA.
Landon, Stuart, and Constance E. Smith. 1998. “Quality Expectations, Reputation, and Price.”Southern Economic Journal 64(3): 628–47.

THE DEBATE ON GEOGRAPHICAL INDICATIONS
211
Loureiro, Maria Luz, and Jill J. McCluskey. 2000. “Assessing Consumer Response to ProtectedGeographical Identification Labeling.” Agribusiness 16(3): 309–20.
Rangnekar, Dwijen. 2004. “The Socio-Economics of Geographical Indications: A Review ofEmpirical Evidence from Europe.” UNCTAD-ICTSD Project on IPRs and SustainableDevelopment, Issues Paper 8. www.iprsonline.org.
Schamel, Günter, and Kym Anderson. 2003. “Wine Quality and Varietal, Regional and WineryReputations: Hedonic Prices for Australia and New Zealand.” Economic Record 79(246):357–69.
UNCTAD-ICTSD. 2005. Resource Book on TRIPS and Development. Cambridge: CambridgeUniversity Press.
Vivas-Eugui, David, and Christoph Spennemann. 2005. “The Treatment of GeographicalIndications in Recent Regional and Bilateral Free Trade Agreements.” In The IntellectualProperty Debate: Perspectives from Law, Economics and Political Economy, ed. Meir Pugatch.Cheltenham, England: Edward Elgar.
World Trade Organization. 2004. World Trade Report 2004. Geneva: WTO.


More Favorable Treatment of Developing Countries:Ways Forward
Bernard Hoekman
17
Although the principle of more favorable treatment for developing countrieshas a long history and is firmly embedded in the World Trade Organization(WTO),1 the existing system of differential treatment has left both developed
and developing countries dissatisfied. In the current Doha trade negotiations, as inthe implementation of multilateral trade rules, it is among the more important issuesto be resolved.2
Currently, “special and differential treatment” (SDT) provisions in the WTOrules call for preferential access to developed country markets, exemptions (transitoryand permanent) from certain rules, and promises of development assistance. Thereare good reasons for SDT. One is that very small and low-income economies lackthe institutional strength to manage the full panoply of WTO rules and might wellfind the returns to developing the necessary strength outweighed by the costs.Small and poor countries may also lack the resources to overcome natural obstaclesto trade or to pursue policies to address market failures.
The Doha Declaration called for a review of SDT provisions, with a view to“strengthening them and making them more precise, effective, and operational.”During 2001-02, developing countries made some 88 specific suggestions tostrengthen SDT—among them improved preferential access to industrialized countrymarkets, exemptions from specific WTO rules, binding requirements to providetechnical and financial assistance to help developing countries implement multilateralrules and benefit from negotiated rights, and an expansion in aid to address supply-side constraints. Despite intensive talks and numerous meetings, however, noagreement has yet proved possible on strengthening SDT provisions.
One reason for this is that a common element of many of the proposals was toconvert existing “best-endeavors provisions” into binding obligations that couldbe enforced through WTO dispute settlement procedures. Another is the differencein views on what types of exemptions make economic sense. Indeed, the debate onstrengthening SDT overlaps to a significant extent the broader issue of making theWTO more supportive of development—perhaps the most serious challengeconfronting the WTO, given the huge differences in the level of developmentamong WTO members.
Breaking the deadlock will require actions by developed and developingcountries alike to bolster the three major pillars of SDT:• Greatly improved market access for developing countries.• Mechanisms to ensure that WTO rules and disciplines support development
213

TRADE, DOHA, AND DEVELOPMENT: A WINDOW INTO THE ISSUES
214
• Increased development assistance (“aid for trade”).The outlines of a possible package of measures to make SDT more effective are
sketched out below.
Market access for disadvantaged countriesTrade preferences have been a mainstay of SDT since the late 1960s. Unfortunately,evidence suggests that preferences generally deliver less than expected. First, formost goods, particularly manufactures, the margin of tariff preference granted todeveloping countries is often small. For example, Amjadi, Reinke and Yeats (1996)show that, at the end of the Uruguay Round transition period, Sub-Saharan Africancountries would have preference margins averaging slightly less than 2.5 percentagepoints.3
Of course, there are cases where tariffs are higher or where quotas providepreferred partners with deeper preferences that are potentially more valuable. Butthese are not as common as they may appear on the surface. Consider, for example,textiles and clothing. This simple and labor-intensive sector is one in whichdeveloping countries clearly have comparative advantage. It also has some of thehighest most-favored-nation (MFN) tariffs, potentially offering the greatest marginsof preference. But the United States, for example, grants no general preferences ontextiles and clothing, although it does offer some to particularly favored partners—such as the African nations covered by the African Growth and Opportunity Act.The European Union does grant tariff preferences on textile and clothing exportsunder its general system of preferences (GSP), the Cotonou Agreement, and variousregional agreements—and, since 2001, to the Least-Developed Countries (LDCs)under the Everything But Arms (EBA) initiative—but all of these are subject torestrictive and cumbersome rules of origin.
In key product categories in which they have a comparative advantage,developing countries receive no significant tariff preferences (table 1). In general,preferences tend to be the most limited where tariff peaks exist (Hoekman, Ng, andOlarreaga 2002). This has been changing—for example, the EBA gives duty- andquota-free access to LDCs for virtually all products. But the countries that are hometo most of the world’s poor, including Brazil, China, India, Indonesia, Malaysia,Pakistan and Thailand, are granted only limited preferences, if any.
In summary, research suggests that preferences are often of little value (a)because they exclude textiles, agricultural products, or other important items, (b)because they place limits on the value of exports eligible for preferential treatment(including so-called competitive needs tests), or (c) because other nontariff measuresare used to restrict access. Combined with complex administrative requirementsand red tape, notably restrictive rules of origin, the effect is to reduce investment inactivities that could otherwise benefit from preferences.

MORE FAVORABLE TREATMENT
215
One way to strengthen SDT would be for developed countries to extend duty-and quota-free market access, as under the EBA, to all developing countries. Fromthe perspective of the Millennium Development Goals, a good case can be madethat preferences should focus on the poor, wherever they are located, and not on alimited set of countries. In absolute terms, most poor people live in countries thatare not LDCs—such as China and India. Limiting preferences to the poorestcountries—while appropriate in light of limited institutional and infrastructureweaknesses in these countries—ignores the majority of the poor in the world today,who confront tariffs on world markets that are more than twice as high as thoseconfronting nonpoor producers (World Bank 2002).
But deep trade preferences for larger economies are not politically feasible.Therefore, action is required to liberalize, on a nondiscriminatory basis, trade ingoods and services in which developing countries have a comparative advantage.A binding commitment by developed countries to abolish export subsidies, decoupleagricultural support and significantly reduce—or abolish—tariffs on labor-intensiveproducts of export interest to developing countries would provide a strong signalof commitment to poverty alleviation by developed countries. A correspondingcommitment to expand temporary access for developing country service providersby a specific amount—say by 1 percent of the workforce—and not to restrict cross-border trade in services would also bring substantial benefits (Mattoo 2005).
MFN-based market access is not traditionally considered an element of SDT.But it may well have the greatest impact on development. For one thing, it couldrebalance the WTO by removing “reverse SDT”—special opt-outs and exemptions
Table 1. Key products lacking GSP preferences in the European Unionand United States
Note: GSP countries only; LDCs obtain deeper preferential treatment. China is included inthe European Union’s GSP but excluded by the United States.Source: WITS.
Total imports
($bn)
GSP recipients'
market share
(percent)
Average tariff rate (percent)
Average tariff rate faced by
GSP recipients (percent)
Total imports
($bn)
GSP recipients'
market share
(percent)
Average tariff rate (percent)
Average tariff rate faced by
GSP recipients (percent)
Dairy products 1.1 13.0 13.4 19.7 1.0 16.0 9.9 15.9Textiles & yarn 9.8 21.0 7.8 7.2 16.1 42.0 5.4 4.6Apparel & clothing 58.5 47.0 15.3 15.9 43.4 56.0 10.2 8.8
Leather products 7.2 24.0 10.4 11.5 5.6 80.0 2.3 1.9
Footwear 15.3 18.0 10.6 10.0 8.5 67.0 7.5 7.4Ceramics & glassware 7.9 13.0 6.3 8.2 5.5 28.0 5.1 3.8
United States European Union

TRADE, DOHA, AND DEVELOPMENT: A WINDOW INTO THE ISSUES
216
that benefit interest groups in industrialized countries at the expense of developingcountries. Examples include agricultural subsidy programs, high protection for textileproducts, and tariff peaks and escalation that imply high rates of effective protectionfor developed country industries. Removing such distortions would not only benefitdeveloping countries (and developed country consumers), but would also promotefurther trade reforms in developing countries.
Implementation of WTO rulesSDT includes derogations or exemptions from certain WTO rules. Is this a goodthing? Not if poor countries would derive a positive net benefit from implementingthe rules. While governments presumably consider that possibility in the course ofnegotiations, past experience suggests that the necessary analysis and consultationsoften are not undertaken, explaining why there is now a lack of “ownership” of—support for—some WTO rules in many of these nations.
In considering the net benefit of WTO rules, it is important to make a distinctionbetween trade-policy disciplines and rules that require significant upfront investmentof resources to establish or strengthen institutions. Trade-policy disciplines shouldapply uniformly to all WTO members (Hoekman, Michalopoulos, and Winters 2004),but when it comes to trade institutions and domestic regulation, one size does notnecessarily fit all. A given country’s development priorities may not leave room foreffective compliance with some aspects of WTO agreements. Certain measuresmay require many preconditions before implementation will be beneficial. Somedisciplines may not be appropriate for very small countries, in that the regulatoryinstitutions that they require may be unduly costly—countries may lack the scaleneeded for benefits to exceed implementation costs.
These observations suggest there is a need to differentiate among developingcountries when determining the reach of resource-intensive WTO rules. Possibleapproaches to differentiation are:• Total flexibility for developing countries to invoke exemptions as long as these
do not harm any other member country.• Country-specific determinations of eligibility for rule-related SDT provisions
that would apply to a predefined set of agreements, so as to limit SDT tocountries that need it most—the poorest countries and very small states.
• An agreement-specific approach in which objective criteria in each agreementwould link implementation by developing countries to local conditions, priorities,and capacities (based on an audit of costs), and to availability oftechnical assistance.Of these approaches, the first is clearly discernible in many countries’ current
proposals. As the status of the negotiations suggests, it is unlikely to prove fruitful.The second would require renegotiating the three country classifications currentlyused in the WTO—LDCs, all other developing countries, and developed countries.

MORE FAVORABLE TREATMENT
217
A good case can be made for reclassification, given that many countries that definethemselves as developing have per capita incomes that are many multiples of thepoorest countries. However, this has been a politically sensitive issue in the WTO.The third option would allow the issue of defining general eligibility to be avoided,but it involves significant transaction costs.
Any approach to strengthening rule-related SDT will require substantialthought and discussion among WTO members, as well as recognition that capacitiesand priorities differ hugely across the membership. Given the steady expansion ofthe WTO into regulatory areas, a serious discussion of rule-related SDT is critical ifdevelopment-relevance is to be more than a slogan. A first step discussed inHoekman (2005) could be to allow for greater policy flexibility for developingcountries, accompanied by greater efforts on the part of WTO members to assistdeveloping countries attain their trade objectives, with a regular multilateralmonitoring of outcomes and effects of the policies pursued.
Renegotiation of certain WTO disciplinesMany developing countries believe that the rules in some WTO agreements are notdevelopment friendly. Rather than seek opt-outs through SDT, however, it may bepreferable to renegotiate the agreements. For example, in agriculture, it may be usefulto introduce new rules to ensure that developing countries have the freedom topursue policies that support the rural poor. With respect to intellectual property, theworld as a whole has an interest in ensuring that developing countries have theflexibility to provide their poor with access to drugs at affordable prices and thattraditional knowledge is protected and properly remunerated. Two examples of directrelevance to the SDT and development debate where WTO disciplines can beimproved are rules of origin and the requirements for regional integration. On the first,there is a strong case for substantial relaxation of such rules to allow goods to benefitfrom preferential access programs as long as a minimal amount of labor value hasbeen added. Current rules of origin for processed goods tend to require too high localcontent in terms of intermediates, or else require that such inputs are sourced from thecountry granting the preference. This works against the exploitation of comparativeadvantage and the need to specialize in narrow parts of the value chain—a keyrequirement for firms and countries as the world economy becomes more integrated.The experience with AGOA for those countries benefiting from relaxed rules of originhas illustrated that such rules can be a binding constraint on the development andexpansion of manufactured exports. The second example concerns the design ofNorth-South regional integration. Here a beneficial rule change would require Southernmembers of such agreements to pursue partial MFN liberalization as opposed torequiring complete preferential (discriminatory) liberalization in favor of the high-income partner. This would avoid trade diversion costs while also attenuating thefiscal impacts—giving more time to put in place alternative tax collection mechanisms.

TRADE, DOHA, AND DEVELOPMENT: A WINDOW INTO THE ISSUES
218
Aid for tradeDevelopment assistance can play an important role in building the institutional andtrade capacity that developing countries need if they are to benefit from betteraccess to markets. But the desire of donors to see developing countries implementcertain WTO agreements should not divert assistance from recipients’ own priorities.The risk of such diversion is one of the downsides of proposals to make technicalassistance mandatory under the WTO and to link implementation of WTO agreementsto the provision of such assistance. To ensure that trade priorities are identified forfunding, a better approach is to support efforts to embed trade-related technicalassistance in national priority-setting processes, such as the Poverty ReductionStrategy Paper (PRSP), used by governments and the donor community. Oncetrade-related needs have been embedded in national priorities, donors andinternational financial institutions must stand ready to expand assistance to helpbolster trade capacity and strengthen trade-related institutions in developingcountries.
Export diversification was the primary motivation for preferences. But many ofthe poorest countries have not managed to use preferences to diversify and expandexports. Benefiting more from integration into the trading system requires improvingthe productivity and competitiveness of firms and farmers in the poorest countries.Supply constraints are the primary factors that have constrained the ability of manyAfrican countries to benefit from preferences. Improving trade capacity can bepursued through a shift to more (and more effective) development assistance thattargets domestic supply constraints as well as measures to reduce the costs ofentering foreign markets.
Recognizing the importance of complementary policy actions and the need forsupport for adjustment and integration to achieve successful trade reform in low-income economies does not imply that the Doha Round should be any less ambitiousor deliberately slowed. The reverse is true. But it should be complemented byactions to redistribute some of the global gains from trade reform to help addressthe trade and growth agenda in the poorest countries—in the process helping toattain the original objective motivating preferential access regimes.
The quid pro quoReciprocity is the engine of WTO negotiations. In the past, however, the lure ofnonreciprocal preferences has kept developing countries from exploiting the majorsource of gains from trade liberalization—namely the reform of their own policies.4
Unilateral liberalization could be linked to market access by granting negotiating“credit” to developing countries that make significant autonomous reforms. Oneway to achieve this would be through a formula approach to tariff negotiations that

MORE FAVORABLE TREATMENT
219
used the level and extent of reduction in tariff bindings as the focal point ofliberalization commitments.5 Given that many developing countries either have notbound tariffs at all or have high tariff bindings, such an approach would ensure thatcredit was given for past reductions in applied tariffs.
On the rules side, an important quid pro quo to shore up the trading systemwould be for developing countries to accept that core WTO trade policy rules arebeneficial. This does not imply that developing countries should be forced to signaway all flexibility to use trade policies. But the economic literature has shown thattariffs and other traditional trade policy tools are poor instruments for theachievement of economic development objectives (Hoekman and others 2004).Abiding by WTO procedural rules on the use of such instruments will benefitconsumers and enhance welfare in developing countries. It will also help focusattention on areas where SDT could make a real difference.
ConclusionMoving forward on SDT requires a mechanism to enable developing countries,particularly the poorest, to benefit more fully from participation in the multilateraltrading system. Greater differentiation among developing countries arguably mustbe part of a new grand bargain within WTO. The existing country classificationsystem of LDCs (as defined by the United Nations) and other developing countries(self-declared) has resulted in a mechanism that is ineffective for all.
Of the three major dimensions of SDT—better market access for developingcountries’ exports of goods and services, implementation and enforcement of WTOrules, and expanded development assistance (“aid for trade”)—rapid movement ispossible on the first and last. Agreement on how to deal with implementationconstraints and define the reach of resource-intensive rules, however, will taketime. The formation of a high-level group operating under the auspices of the WTOGeneral Council to discuss options for a new mechanism for rule-related SDT, couldbe a first step forward.
SDT cannot be a one-way street. Differentiation implies that only a subset ofdeveloping countries should be eligible for SDT, and that the more advanced shouldaccept that they are not eligible. All developing countries, even those that qualifyfor SDT, should engage in the exchange of trade policy commitments (market access).Providing credit for past autonomous reforms can and should figure in thenegotiating modalities that are adopted, but the viability of the trading systemrequires that the core principles and rules apply to all members.

TRADE, DOHA, AND DEVELOPMENT: A WINDOW INTO THE ISSUES
220
Notes1. In 1965, developing country demands for special status in the multilateral trading system led
to the drafting of a new Part IV of the GATT. This introduced the concept of SDT fordeveloping countries. In 1979 a Framework Agreement was negotiated, which included the so-called Enabling Clause. Officially called Differential and More Favorable Treatment, Reciprocityand Fuller Participation of Developing Countries, the Enabling Clause provided for departuresfrom MFN and other GATT rules. It also created a permanent legal basis for the operation of thegeneral system of preferences (GSP) established under UNCTAD auspices and codified principles,practices, and procedures regarding the use of trade measures by developing countries, givingdeveloping countries more flexibility in applying trade measures to meet their “essentialdevelopment needs.”
2. This Trade Note was written by Bernard Hoekman, Manager, World Bank. It draws on jointwork done with Caglar Ozden, Costas Michalopoulos, Susan Prowse and Alan Winters.
3. Preferences should be assessed in terms of the price advantage they confer rather than, as isquite common, the percentage of the tariffs they remit. To have 100 percent remission of a 1percent tariff is worth far less—1 percentage point—than a 50 percent remission of a 10percent tariff—5 percentage points.
4. Ozden and Rheinhart (2005) argue that countries with preferential access to developedcountry markets—even if it is of limited value due to administrative requirements andexceptions—have less of an incentive to pursue trade liberalization. Nonreciprocity also helpsto explain why tariff peaks today are largely found on goods produced in developing countries.In the absence of a willingness by developing countries to open access to their own markets therewas less incentive for OECD countries to reduce barriers in areas of export interest to developingcountries.
5. See Francois and Martin (2003) for an in-depth analysis of alternative formula-basedapproaches.
ReferencesAmjadi, A., U. Reinke, and A. Yeats. 1996. “Did External Barriers Cause the Marginalization of
Sub-Saharan Africa in World Trade?” Policy Research Working Paper 1586, World Bank,Washington, DC.
Francois, J., and W. Martin. 2003. “Formula Approaches for Market Access Negotiations.” TheWorld Economy 26:1–28.
Hoekman, B. 2005. “Operationalizing the Concept of Policy Space in the WTO.” Journal ofInternational Economic Law 8(2): 405-24.
Hoekman, B., F. Ng, and M. Olarreaga. 2002. “Tariff Peaks in the Quad and Least DevelopedCountry Exports.” World Bank Economic Review 16:1–22.
Hoekman, B., C. Michalopoulos, and L. A. Winters, 2004. “Special and Differential Treatmentfor Developing Countries.” The World Economy, 27: 481-506.
Mattoo, A. 2005. “Services in a Development Round: Three Goals and Proposals.” Journal ofWorld Trade 39(6): 1223-37
Ozden, Caglar, and E. Rheinhart. 2005. “The Perversity of Preferences.” Journal of DevelopmentEconomics, 78 (1): 1-21.
World Bank. 2002. Global Economic Prospects and the Developed Countries: Making TradeWork for the Poor. Washington DC: World Bank.
Further ReadingBrenton, Paul. 2003. “Integrating the Least Developed Countries into the World Trading
System: The Current Impact of EU Preferences under Everything But Arms.” Journal ofWorld Trade, 37 (3): 623-46.

MORE FAVORABLE TREATMENT
221
Mattoo, Arvind, Devesh Roy, and Arvind Subramanian. 2003. “The Africa Growth andOpportunity Act and Its Rules of Origin: Generosity Undermined?” The World Economy, 26(6): 829-52.
Oyejide, T. Ademola. 2002. “Special and Differential Treatment.” In Development, Trade andthe WTO: A Handbook, ed. B. Hoekman, Aaditya Mattoo and Philip English. Washington,DC: World Bank.
Prowse, Susan. 2005. “Aid for Trade: Increasing Support for Trade Adjustment and Integration,”in Simon Evenett and Bernard Hoekman (eds). Economic Development and MultilateralTrade Cooperation. Palgrave, World Bank.
Stevens, Christopher. 2002. “The Future of SDT for Developing Countries in the WTO.”Unpublished paper, Institute for Development Studies, University of Sussex. May.
Winters, L. A. 2001. “Post-Lomé Trading Arrangements: The Multilateral Option.” InRegionalism in Europe: Geometries and Strategies After 2000, ed. Jürgen von Hagen andMika Widgren. Leiden: Kluwer Academic Press.


The Value of Trade Preferences for Africa
Paul Brenton and Takako Ikezuki18
Improving the ability of the least developed countries (LDCs) to participate inworld markets can stimulate growth and reduce poverty. To help achieve thosegoals, industrial countries offer developing countries preferential access to
their markets through lower duties. In this note we discuss the magnitude of thepreferences granted by the European Union, Japan, and the United States to Sub-Saharan African countries and show that only a small number of countries actuallyreceive substantial preferences.1
The role of trade preferencesTariffs introduce a wedge between the world price of a product and the price in thedomestic market. The premium normally accrues to the government of the import-ing country as tariff revenue. Under preferences, however, it may go to the devel-oping country beneficiary, thereby raising returns to the activity that enjoys thepreference and, depending on the nature of competition in domestic product andfactor markets, stimulate expansion of that activity, with implications for wagesand employment.
However, if there is little effective competition among buyers/importers in thedeveloped country then the suppliers/exporters in the developing country may beunable to acquire much of the price premium. Ozden and Olareaga (2005) find thatonly one-third of the available rents for African exports of clothing to the U.S.under The African Growth Opportunity Act (AGOA) actually accrue to the export-ers. In addition, as will be discussed below, the costs of satisfying the rules gov-erning preferences reduces the extent to which they raise actual returns in devel-oping countries.
The arguments underlying trade preferences are that the small scale of indus-try and low level of development in developing countries lead to high costs, whichreduce countries’ ability to compete in global markets, and to a lack of diversifica-tion, which increases risks. Developing countries, especially least developed coun-tries, face much higher trade-related costs than other countries in getting theirproducts into international markets. Some of these costs may reflect institutionalproblems in the exporting countries, such as inefficient practices or corruption,which require a domestic policy response. They may also reflect weak transportinfrastructure and firms’ lack of access to standard trade facilitating measuressuch as insurance and trade finance.
223

TRADE, DOHA, AND DEVELOPMENT: A WINDOW INTO THE ISSUES
224
Trade preferences are expected to provide a premium over the normal rate ofreturn and so encourage investment in these economies. The increase in trade dueto preferences leads to more output and, if there are scale economies, to lowercosts, further stimulating trade. It is important, however, that the sectors that re-ceive preferences and investment should be those in which the country has acomparative advantage in the long term and that investment not be based on a falsecomparative advantage derived from the margin of preference.
Adverse effectsTariff preferences can lead to several adverse effects. When rents do accrue to thedeveloping country, they tend to accrue not to the poorest constituents but to theowners of the most intensively used factors. With agricultural preferences, themain beneficiaries are typically the owners of land. Preferences will typically have astrong impact on poverty only if the landowners are poor. So, even when prefer-ences create substantial transfers for producers in developing countries, they maynot stimulate the long-term growth of exports or reduce poverty, and may lead to aless diversified export base. Preferences can create a degree of dependence thatconstrains flexibility and diversification and results in high-cost production ofpreferred products (Topp 2001).
Finally, negotiations under the Doha Round have shown that preferences canbe used to bolster external support for protectionist policies in industrial countriesand to weaken proposals to reduce protection.
The value of preferences offered by the European Union, Japan,and the United StatesTable 1 summarizes the calculated value of the preferences of the European Union,Japan and the United States for Sub-Saharan African countries in 2002. We allowfor the fact that both the European Union and the United States have schemes thatoffer enhanced preferences to exporters in Sub-Saharan Africa beyond those of thestandard Generalized System of Preferences (GSP). The United States has introducedthe African Growth and Opportunity Act (AGOA), while the EU has the CotonouAgreement and Everything But Arms (EBA) arrangement (a special provision in theEU’s GSP scheme) for the least developed countries. The value of the preferencesobtained under those arrangements is derived from the value of exports for whichpreference is actually requested multiplied by the preference margin. This is theimplicit transfer of tariff revenue due to the preference scheme, all of which weassume goes to the developing country. This is presented in table 1 as a share ofthe total value of exports to each market.
The overall value of EU preferences to Sub-Saharan African countries underthe Cotonou Agreement and the EBA amounted to just 4 percent of the value of theaffected countries’ exports to the European Union in 2002 (table 1). The value of

THE VALUE OF TRADE PREFERENCES FOR AFRICA
225
U.S. preferences for Sub-Saharan African countries under AGOA and the GSPamounted to 1.3 percent of the value of exports to the United States. Japanesepreferences to Sub-Saharan African exporters amounted to 0.1 percent of the valueof exports. The value of preferences to non-LDCs is higher than that for LDCs in theEU schemes, while this situation is reversed for the U.S. and Japanese schemes.
The benefits of preferences are highly concentrated on a small number ofbeneficiaries. Under the EU schemes, 60 percent of the benefits accrue to fivecountries. For the United States, the top five beneficiaries account for almost three-quarters of the value of preferences, while for Japan the top five account for nearly90 percent. For the LDCs, the top 10 beneficiaries account for 100 percent of thebenefits under the U.S. and Japanese schemes and more than 90 percent of thebenefits offered by the EU schemes. Thus, the value of preferences for the remaining37 countries (although they are not the same countries in each case) is very small.
Preferences are also concentrated on a small number of sectors, especially forthe LDCs. In the EU schemes these are mainly agricultural products (sugar, fruits,and processed meat and fish). U.S. preferences are dominated by clothing andmineral fuels. Fish, iron and steel, and nickel dominate Japanese preferences. Al-most one-third of the value of EU preferences is derived from sugar, the market forwhich is highly distorted. These preferences will be affected by the EU’s reform of
a Defined at the two-digit level of the harmonized system.
Table 1. Summary of the impact of trade preferences for Sub-SaharanAfrica, 2002
Source: Calculated using data from USITC, EUROSTAT and Japanese Ministry of Trade.
Percent
EU US Japan EU US Japan EU US Japan
Value of preferences/ total exports
4.0 1.3 0.1 2.3 2.1 0.4 5.1 1.1 0.1
Share of top 5 beneficiaries in total value of preferences requested
59.9 73.9 88.9 73.8 98.8 95.8 76.9 92.9 98.7
Share of top 10 beneficiaries in total value of preferences requested
80.1 95.4 97.7 91.2 100.0 100.0 97.5 99.3 100.0
Share of top sectora in total value of preferences
31.3 31.9 41.0 37.1 51.5 70.9 34.5 33.4 31.9
Share of top 3 sectorsa in total value of preferences requested
56.5 79.6 63.6 68.5 91.3 92.2 65.2 71.3 56.8
Sub-SaharanAfrica (total) LDCs Non-LDCs

TRADE, DOHA, AND DEVELOPMENT: A WINDOW INTO THE ISSUES
226
its sugar policies; they should be distinguished from general trade preferences thatarise from a tariff preference in otherwise undistorted sectors.
For only five countries do the combined preferences requested in the EU,Japan and U.S. account for more than 10 percent of the value of total non-oilexports (table 2). For 35 of the countries—73 percent of the total in Sub-Sa-haran Africa—preferences amount to less than 5 percent of the value of ex-ports. For 18 countries preferences are negligible, amounting to less than 1 percentof exports.
Because the trade preferences obtained in the EU, Japanese, and U.S. marketsamount to a very small proportion of the value of exports of all but a few countriesof Sub-Saharan Africa, the impact of those preferences is likely to be very muted.Only a small number of countries receive substantial transfers under current schemes.These are driven mainly by preferences for sugar in the European Union and forclothing in the United States.
Why do trade preferences fall short of their potential?Trade preferences have not transformed the export and growth performance ofmost developing country beneficiaries, although performance may have been worsewithout them and a few countries may have benefited substantially. Trade prefer-ences have not enabled beneficiaries as a group to increase their market shares inthe main preference-granting markets. Why?
First, many products produced in developing countries are subject to zeroMFN duties in industrial countries, and therefore no trade preference can be given.Second, products with high duties are typically excluded from preferences or thepreference margin is very small. For a small number of products, preference marginsare substantial, though usually within strict quantitative limits and only for certain
Table 2. Classification of Sub-Saharan African countries by magnitudeof the value of combined (non-oil) preferences in the European Union,Japan, and United States relative to total (non-oil) exports, 2002
Source:Based on calculations using data from USITC, EUROSTAT and Japanese Ministry ofTrade.
Angola, Burundi, Central African Republic, Chad, Congo, Democratic Republic of Congo, Djibouti, Equatorial Guinea, Gabon, Guinea, Liberia, Mali, Níger, Nigeria, Rwanda, Sao Tome and Principe, Somalia, South Africa
Between 1 percent and 5 percent
Benin, Botswana, Burkina Faso, Cameroon, Cape Verde, Comoros, Eritrea, Ethiopia, Ghana, Ivory Coast, Mauritania, Sierra Leone, Sudan, Tanzania, Togo, Uganda, Zambia
Greater than 5 percent but less than 10 percent
Gambia, Guinea-Bissau, Kenya, Madagascar, Mozambique, Namibia, Senegal, Zimbabwe
Greater than 10 percent Lesotho, Malawi, Mauritius, Seychelles, Swaziland
Less than 1 percent

THE VALUE OF TRADE PREFERENCES FOR AFRICA
227
countries. Some countries that have been granted preferential access for sugar andtobacco, for example, have received large transfers due to preferences.
Third, many of the schemes are surrounded by uncertainty concerning theirduration and the discretion that the donors have to exclude countries and products.That uncertainty limits incentives to invest in the beneficiary countries to takeadvantage of preferences.
Fourth, exporters in developing countries are often hampered in their ability totake advantage of preferences by complex rules of origin, which impose two typesof costs: (a) the additional costs of sourcing inputs and designing productionstructures to ensure compatibility with the rules of origin, and (b) the costs ofdemonstrating conformity with the rules, in terms of documentation, accounting,and obtaining the relevant certificate.
Here we have concentrated on aspects of the preferential schemes that limittheir impact, rather than on limitations in the beneficiaries’ capacity to satisfy otherrequirements for market access, such as public and private standards related tohealth, safety, and quality, as well as broader constraints relating to transportation,energy, and so on, all of which constrain the supply response to preferences indeveloping countries, just as they do trade opportunities in general.
ConclusionsTrade preferences are not a panacea for success but rather should be seen as justone part of a strategy for export-led growth. In principle, trade preferences canpromote development by providng temporary margins of preference to enable in-dustries to adjust and compete more effectively in global markets. Multilateral tradeliberalization contributes to this outcome by ensuring that preferences have a shorthalf-life and that inefficient, high-cost industries with entrenched lobbies do notconstrain flexibility and adjustment. Multilateral liberalization is also important forlimiting the trade-diverting impact of preferences on other countries (usually otherdeveloping countries).
In practice, only a small number of countries receive large transfers as a resultof preferences in developed country markets. The values of preferences are largestin the EU market, driven by a narrow range of products and the very high EU pricefor sugar. In a very few countries, such as Mauritius, preferences appear to havecontributed to a relatively strong economic performance and economic diversifica-tion (Subramanian and Roy 2003). In some other countries, preferences have led tolarge transfers, but domestic industries have experienced rising costs and decliningoutput and have accumulated large debts.2 But most beneficiaries of European,Japanese, and U.S. preferences have experienced little or no impact. Preferenceshave done little to stimulate the export of a broader range of products.

TRADE, DOHA, AND DEVELOPMENT: A WINDOW INTO THE ISSUES
228
Preference schemes would be enhanced by• Extending coverage to all products and making schemes permanent (as with
the EBA).• Liberalizing rules of origin and simplifying the process of certifying compli-
ance. If all schemes had the same simple and easy-to-apply rules, a producer ina least developed country could make production and investment decisionson the basis of equal and predictable access to all industrial markets.
The impact of preferences on developing countries would be facilitated by• Improving the domestic investment environment.• Addressing the internal barriers that raise the costs of trade for developing
countries—inadequate and high-priced transport services, inadequate andunreliable energy supplies, inefficient customs practices, and lack of trade-supporting financial and telecommunications services.The challenge is to find preference schemes that complement the domestic
reforms that developing countries must undertake to improve the returns to exportswithout stifling diversification and multilateral trade liberalization.
Developed countries should not treat trade preferences as a substitute fordirect development assistance, which remains crucial in alleviating internal barriersthat constrain supply responses to trade opportunities. Nor should they allowallocations of development assistance to be distorted by preferences. While thereis a need to address the difficulties that a small number of countries may face fromthe erosion of preferences under multilateral liberalization, such needs must not bemet by redirecting assistance away from the large number of low-income countriesthat do not benefit from preferences. At the same time, developing countries mustnot view preferences as an alternative to domestic reforms that are needed toimprove investment conditions, promote effective competition, and facilitateintegration into the global economy.

THE VALUE OF TRADE PREFERENCES FOR AFRICA
229
Notes1. This chapter was written by Paul Brenton, Senior Economist, and Takako Ikezuki, Junior
Professional Associate Economist, of the International Trade Department of the World Bank.Comments from Elke Kreuzwieser and Faezeh Foroutan on the paper underlying this chapter aregratefully acknowledged.
2. For example, Mitchell (2005) concludes that despite substantial preferences, most Carib-bean sugar producers are not competitive and will need to close or restructure once the EuropeanUnion reforms its sugar policies.
ReferencesMitchell, D. 2005. “Sugar in the Caribbean: Adjusting to Eroding Preferences.” Policy Research
Working Paper, World Bank, Washington, DC.Ozden, C., and M. Olarreaga. 2005. “AGOA and Apparel: Who Captures the Tariff Rent in the
Presence of Preferential Market Access?” World Economy 28, 63-77.Subramanian, A., and D. Roy. 2003. “Who Can Explain the Mauritian Miracle: Meade, Romer,
Sachs or Rodrik?” In Search of Prosperity - Analytical Narratives on Economic Growth, ed D.Rodrik. Princeton University Press, Oxford.
Topp, V. 2001. “Trade Preferences: Are they Helpful in Advancing Economic Development inPoor Countries?” ABARE, Canberra.
Further ReadingBrenton, P., and T. Ikezuki. 2005. “The Impact of Agricultural Trade Preferences, with Particu-
lar Attention to the Least Developed Countries.” In Global Agricultural Trade and DevelopingCountries, ed. A. Aksoy and J. Beghin. Washington DC: World Bank.
Hoekman, B., and C. Ozden. 2005. “Trade Preferences and Differential Treatment of Develop-ing Countries: A Selective Survey.” Policy Research Working Paper 3566, World Bank,Washington, DC.
Stevens, C., and J. Kennan. 2005. “Making Trade Preferences More Effective.” Trade Note,Institute of Development Studies, University of Sussex, http://www.ids.ac.uk/IDS/global/pdfs/CSJKTradePreferences.pdf.


WTO Accession: Moving the Goalposts?
Simon J. Evenett and Carlos A. Primo Braga19
Since it was created a decade ago, the World Trade Organization (WTO) haswelcomed 20 new members. On October 13, 2004, Cambodia became theWTO’s 148th member, almost 10 years after it had first applied and just over
a year after its membership package was approved at the Cancún MinisterialConference. Cambodia is the second least developed country (LDC) to join theWTO, following Nepal’s accession on April 23, 2004.1
Countries applying for WTO membership face a long and complex process.Some pending applications date back to the late 1980s (Algeria’s, for example) andearly 1990s (those of Belarus, Russian Federation, Saudi Arabia, Ukraine). Applicantsoften need to implement substantive reforms to align their domestic institutionsand policies with WTO disciplines. Many cannot engage effectively in accessionnegotiations for lack of trained personnel or because of institutional and financialconstraints. Roughly one-third of the 30 governments now in the process ofaccession are LDCs. (See Annex 1 for a list of current applicants.)2
Notwithstanding these concerns, the demand for WTO accession remainsstrong. Moreover, as illustrated by the experiences of China and, more recently,Cambodia, WTO accession can be an effective lever to promote trade liberalizationand substantive regulatory reform. In this note, we discuss the experience ofdeveloping countries with the WTO accession process and highlight theimplications for policymakers in applicant countries and in existing WTO members.3
Why do nations join the WTO?Policymakers from countries seeking to join the WTO give a range of economic,legal, and political reasons for doing so. For some, the rationale is to further integratetheir country into the world economy. The expectation is that more predictableaccess to foreign markets, which WTO membership can bring, will result in higherexports. Another economic rationale is to attract more foreign direct investmentand, more generally, to use WTO membership as a seal of approval recognized bythe international business community. The legal advantages of accessing a rules-based system and of using the WTO dispute-settlement process are often mentionedas well. Many nations join the WTO for political reasons. Transition economies, forexample, often see WTO membership as a means to signal their commitment tojoining the international community of market-based economies.
There is some overlap between these rationales and the potential benefits ofWTO accession identified in economic research—particularly with regard to
231

TRADE, DOHA, AND DEVELOPMENT: A WINDOW INTO THE ISSUES
232
bolstering exports and foreign direct investment.4 Economists would point to thebenefits that flow from better foreign access to the acceding nation’s markets,specifically in terms of price and variety of imports. By binding national tariffs,committing to eliminate quotas on imports, and reforming other state measures,WTO membership can enhance the credibility of an acceding nation’s policies andthus reduce the uncertainty faced by the private sector. It can also improve importantcomponents of the national business environment, which, in turn, has sizeabledomestic payoffs.
The reality of the WTO accession processThe experience of 20 members that have joined the WTO since 1995, and of the 30countries and custom territories now seeking to join, form the basis of much of whatis known about the WTO accession process. Not every aspect of the process ispublicly documented. In particular, little is known about the numerous bilateralnegotiations between an applicant and existing WTO members. Because of theselacunae, a certain amount of folklore has arisen concerning the accession process.Recently, studies have shed some light on the validity of the folklore. The mainfindings of those studies are described below.5 However, readers, particularlystakeholders in applicant countries, should bear in mind that key steps in the WTOaccession process remain confidential. It is also important to keep in mind thatnoneconomic considerations can play a role in shaping the process.6
The formal procedures that an applicant must follow to become a WTO memberare well established. They involve at least 20 distinct steps.7 The most important arethe creation of a Working Party of WTO members to consider the application formembership,8 the drafting of a memorandum on the applicant’s foreign trade regime,satisfactory responses to questions about the memorandum posed by existingWTO members, the conclusion of bilateral negotiations with each of the WorkingParty members, and the adoption of the Protocol of Accession by the WorkingParty and then by the WTO’s General Council or Ministerial Conference.
Throughout this process the onus is on the applicant to satisfy the demandsof existing WTO members. This apparently one-sided procedure has given rise tothe following perceptions:• The WTO accession process is increasingly costly and complex and takes
longer and longer to complete.• The price of joining the WTO now includes commitments that go beyond the
General Agreement on Tarriffs and Trade (GATT)/WTO agreements.• The accession process takes little account of the specific circumstances of
applicant countries or their needs for special and differential treatment.The underlying reason for the emergence of these perceptions is that the
terms, rather than the procedures, of WTO accession are not well defined.Paradoxically for a rules-based organization, the WTO has no clear rules governing

WTO ACCESSION
233
the “price” of membership. Article XII of the Marrakesh Agreement, the legalinstrument covering the accession process, merely states that new members mayjoin the WTO “on terms to be agreed.” This sparse guidance leaves the door wideopen for an expedited, hassle-free accession or a drawn-out, decade-long, andburdensome one. The latter occurs more often. The time required to complete theWTO accession process has steadily grown over the past decade (figure 1). Recentlyacceded countries have needed approximately a decade to negotiate their WTO entry.9
Turning to the price of accession, it is important to distinguish between the twobroad types of commitments made by acceding countries: those relating directly tomarket access and commitments on rules.
With respect to market access for agricultural and nonagricultural (i.e.,manufacturing) products, there is clear evidence that the price ofaccession—expressed in terms of the concessions made by accedingcountries—has grown over time. Separating out the accession of LDCs (whichhappen to be the last two countries to join the WTO) from other accedingdeveloping countries, a clear pattern emerges (figures 2a and 2b). For bothagricultural and nonagricultural goods the average tariff binding allowed to accedingcountries has fallen over time, standing now at levels well below those agreed bydeveloping countries in the Uruguay Round.10 From a mercantile perspective,
Number of months
Figure 1. The lengthening process of WTO accessionCountries in order of accession to WTO
Source:Compiled by the authors on WTO data (2004a).Note: All 20 countries in question are those identified in Annex 2.
0
20
40
60
80
100
120
140
160
180
200
Ecuad
or
Bulga
ria
Mon
golia
Panam
a
Kyrgy
z Rep
ublic
Latv
ia
Eston
ia
Jord
an
Geo
rgia
Alban
ia
Om
an
Cro
atia
Lith
uania
Moldo
va
China
Taiw
an, C
hina
Armen
ia
FYR M
aced
onia
Nep
al
Cam
bodia
First Most Recent
0
20
40
60
80
100
120
140
160
180
200
Ecuad
or
Bulga
ria
Mon
golia
Panam
a
Kyrgy
z Rep
ublic
Latv
ia
Eston
ia
Jord
an
Geo
rgia
Alban
ia
Om
an
Cro
atia
Lith
uania
Moldo
va
China
Taiw
an, C
hina
Armen
ia
FYR M
aced
onia
Nep
al
Cam
bodia
First Most Recent

TRADE, DOHA, AND DEVELOPMENT: A WINDOW INTO THE ISSUES
234
Figure 2a. Recent WTO members face tighter commitments onagricultural products
Countries in order of accession to WTOAverage tariff bindings
0
10
20
30
40
50
60
Ecuad
or
Bulga
ria
Mon
golia
Panam
a
Kyrgy
z Rep
ublic
Latv
ia
Eston
ia
Jord
an
Geo
rgia
Alban
ia
Om
an
Cro
atia
Lith
uania
Moldo
va
China
Taiw
an, C
hina
Armen
ia
FYR M
aced
onia
Nep
al
Cam
bodia
LDCs
First Most Recent
0
10
20
30
40
50
60
Ecuad
or
Bulga
ria
Mon
golia
Panam
a
Kyrgy
z Rep
ublic
Latv
ia
Eston
ia
Jord
an
Geo
rgia
Alban
ia
Om
an
Cro
atia
Lith
uania
Moldo
va
China
Taiw
an, C
hina
Armen
ia
FYR M
aced
onia
Nep
al
Cam
bodia
LDCs
0
10
20
30
40
50
60
Ecuad
or
Bulga
ria
Mon
golia
Panam
a
Kyrgy
z Rep
ublic
Latv
ia
Eston
ia
Jord
an
Geo
rgia
Alban
ia
Om
an
Cro
atia
Lith
uania
Moldo
va
China
Taiw
an, C
hina
Armen
ia
FYR M
aced
onia
Nep
al
Cam
bodia
LDCs
First Most Recent
Source: Compiled by the authors on WTO (2004a).
Figure 2b. …and on manufacturing products
0
10
20
30
40
50
Ecuad
or
Bulga
ria
Mon
golia
Panam
a
Kyrgy
z Rep
ublic
Latvia
Eston
ia
Jordan
Geo
rgia
Alban
ia
Oman
Croat
ia
Lithua
nia
Moldo
va
China
Taiw
an, C
hina
Armen
ia
FYR M
aced
onia
Nep
al
Cam
bodia
LDCs
First Most Recent
0
10
20
30
40
50
Ecuad
or
Bulga
ria
Mon
golia
Panam
a
Kyrgy
z Rep
ublic
Latvia
Eston
ia
Jordan
Geo
rgia
Alban
ia
Oman
Croat
ia
Lithua
nia
Moldo
va
China
Taiw
an, C
hina
Armen
ia
FYR M
aced
onia
Nep
al
Cam
bodia
LDCs
0
10
20
30
40
50
Ecuad
or
Bulga
ria
Mon
golia
Panam
a
Kyrgy
z Rep
ublic
Latvia
Eston
ia
Jordan
Geo
rgia
Alban
ia
Oman
Croat
ia
Lithua
nia
Moldo
va
China
Taiw
an, C
hina
Armen
ia
FYR M
aced
onia
Nep
al
Cam
bodia
LDCs
First Most Recent
White bars = Nepal and Cambodia.
Average tariff bindings

WTO ACCESSION
235
therefore, the relative price of WTO accession is high in comparison to UruguayRound commitments made by peer nations—and it is growing over time.
The picture that emerges concerning services commitments under the GeneralAgreement on Trade in Services (GATS) tells a similar story. Taking the number ofservices subsectors (of the 160 identified in the WTO’s classification list) committedby countries as a proxy for the price of becoming a WTO member, one observes thatLDCs that were founding members of the WTO committed on average 20 subsectors.The averages for founding members in the developing and developed categorieswere 44 and 108. Countries in all categories that have acceded since 1995, bycontrast, have committed an average of 104 subsectors.11 This figure is a crudemeasure of the services-related price of accession because it does not captureeither the depth (for example, the extent of explicit limitations) or the breadth (modesof delivery) of the commitment. Still, it is illustrative that countries that went throughthe WTO accession process typically committed a much higher number ofsubsectors than did GATT contracting parties at a similar level of development inthe Uruguay Round negotiations (1986–94).12
Turning to rules commitments that countries have made when joining theWTO, the picture is more mixed. With the exceptions of China and Taiwan (China),accession countries signed around 25 such commitments related to a wide range ofstate measures, some of which are not obviously trade-related. Bulgaria, for example,made commitments with respect to domestic price controls, the privatization ofstate-owned enterprises, and excise taxes on alcohol, as well as many other measuresrelated to trade policy.
A controversial question is whether these commitments go beyond thoseagreed during the Uruguay Round (so-called WTO+ commitments) or require anaccession country to forgo rights available to other WTO members (so-calledWTO–commitments). Whether an accession commitment goes beyond an existingWTO agreement depends in large part on how the latter is interpreted, and so itshould not be surprising that disagreement is rife on the extent ofWTO+ commitments. Some WTO+ obligations may involve no more thanconsultation with, or reporting to, existing WTO members and thus are of limiteddevelopmental significance. Others may be more fundamental, such as Jordan’scommitment that if any of its laws or state acts are subsequently found to contradictinternational treaties (not just WTO agreements), then the latter will haveprecedence. WTO–commitments are easier to identify, such as Ecuador’scommitment to eliminate all subsidies before the date of accession and its commitmentnever to introduce them afterwards. China’s acceptance of product-specifictransitional safeguard provisions, which can be more easily triggered than regularWTO safeguards, provides another example. WTO+ and WTO–commitmentsdifferentiate WTO members and could be interpreted as contributing to a multi-tier

TRADE, DOHA, AND DEVELOPMENT: A WINDOW INTO THE ISSUES
236
multilateral trade system. Also of concern are the adverse developmental effectsthat may result from these commitments.13
In sum, there is evidence that the accession process is becoming moredemanding in terms of market access commitments. WTO’s “July package”(WTO 2004c) recognizes as much by stating that new members should be grantedmore flexibility in market access negotiations under the Doha Round in considerationof the extensive commitments already made in the WTO accession process. Whetherthere are trends in WTO+ or WTO–commitments is unclear, but the very fact thatexisting WTO rules allow for them is a source of concern.
Any evidence of trends should be interpreted with care in view of the possibilityof an adverse-selection bias in the sample of recently acceded countries. After all,most of these countries were transition economies with highly distorted tradingregimes. It could be argued that the higher demands of WTO members reflect thisreality rather than a systemic trend.
Tough love or power plays?The critical question, however, is not whether the price of WTO accession isrising, but whether the price is worth paying given the developmental impact ofWTO membership. If it is, then the demands made by existing WTO membersmight be characterized as “tough love.” Otherwise, the WTO accession processmay be seen as a one-sided power play in which current WTO members wringcommercial advantage out of weaker economic partners.
When considering the developmental impact of WTO accession, two importantpoints should be borne in mind. The first is that a comprehensive evaluation ofWTO accession should examine post-accession performance on many metricsand should consider the state measures taken before and after WTO accession. Atpresent, few accession countries have five or more years of post-accession data touse in identifying the effect of WTO accession, so the available evidence isnecessarily limited. Second, most of the country-specific studies on WTO accessionrelate to China and involve predictions of the likely effects of its accession, ratherthan evaluations of actual impact.
Much of the available evidence concerns the impact of WTO accession onnational exports and imports. This evidence is useful for assessing whetheraccession really does help integrate developing countries into the world’strading system. There are two main strands of recent literature analyzingaggregate studies of trade flows and the role of the WTO/GATT in influencingthem. In a series of papers, Andrew Rose (2003 is a prominent example) hascalled into question whether membership in the GATT/WTO has actuallyincreased trade above the levels expected from the “standard gravity”determinants of bilateral trade.14 Analyzing the same data in a different way,Subramanian and Wei (2003) find that GATT/WTO membership has been

WTO ACCESSION
237
associated with a significant increase in the imports of industrialized countries,although the same cannot be said for developing country members.
There is little reason, however, to expect that exporters in acceding countriesrespond similarly to the different opportunities created by their nation’s WTOaccession—an assumption implicit in the above two analyses. Recentcountry-by-country estimates of the impact of WTO accession on imports andexports vary a great deal, probably because national experience varies a greatdeal.15 For example, after stripping out the effects of nontrade policy determinantson its trade, Ecuador’s manufacturing imports fell after its WTO accession in 1996.This apparently surprising finding is easy to understand when one notes thatEcuador raised its applied tariffs across the board in the years after WTO accession,something that was possible in view of the binding overhang of its WTO tariffcommitments. Another problem with these aggregate studies is that they do notshed light on the mechanisms by which WTO accession influences national tradeflows. For example, did accession bolster sales of traditional exports to existingmarkets or did it encourage entry into new markets?
Disaggregated product-line studies of Ecuador’s and Bulgaria’s exports to theindustrialized Quad countries shed some light on whether the incentives created byWTO accession are working or not.16 Kennett, Evenett, and Gage (2005) found that,once other determinants of market entry were controlled for, sales of long-standingexports to new markets were not helped by WTO accession. In contrast, sales oflong-standing products to existing foreign markets were found to rise after WTOaccession, suggesting that Bulgarian and Ecuadorian exporters responded positivelyto the incentives created by WTO accession.
Modest supply-side responses to WTO accession may be due to two potentialfactors. First, foreign barriers faced by some exporters in countries that joined theWTO may have changed little after accession. Second, exporters may have beenunaware or unable to take advantage of improved market access abroad. This couldbe due to a lack of information, to expensive and inefficient infrastructure in theacceding country, or to a lack of experience in shipping goods abroad. In short,whether joining the WTO bolsters a nation’s exports depends not only on thechanges in market access that are supposed to follow from accession (in terms ofgreater predictability), but also on the steps taken by the government and firms inthe applicant country.
To summarize, when comparing the grand objectives of nations that seek tojoin the WTO with the available empirical evidence on what happened to thosecountries after they joined, there is an evident mismatch. Although odd at firstglance, this may not be surprising given the short-time elapsed since WTOaccession occurred. The apparent mismatch certainly has not stopped manycountries from applying for WTO membership. In addition, it is important to keep inmind that WTO accession can induce reforms that promote transparency and that

TRADE, DOHA, AND DEVELOPMENT: A WINDOW INTO THE ISSUES
238
strengthen domestic policies to cope with balance-of-payments crises and thelike—important additional benefits for developing countries.17 Over the past 12months more information has come to light as to how nations can successfullymake the most of WTO accession, a subject to which we now turn.
Making the most of the WTO accessionDeveloping countries need not see themselves as being at the mercy of existingWTO members during the accession process. Concrete steps have been taken bygovernments in developing countries before, during, and after accession to pushthe ratio of costs to benefits in a pro-development direction. Moreover, many donoragencies and international development institutions offer programs to build trade-related capacity and expertise. The overriding goal is to choose the mix of nationaland international initiatives that best meets the applicant’s development objectives.The following remarks, based on developing country experiences, are offered withthis goal in mind.18
As early as possible in the WTO accession process, it is desirable to identifyprecisely how binding commitments before the WTO can further reform and helpattain national priorities. Cambodia, for example, identified textiles, clothing, andtourism as sectors that could benefit from reform and developed its negotiatingpriorities accordingly. Identification of goals, analysis of economic options, andformulation of negotiating priorities and fallback positions are required at this point.Binding commitments can influence the behavior of importers, foreign investors,and regulators, and knowing the likely economic and social impact of different legalcommitments will help an acceding country to determine which legal commitmentsare priorities. Such reasoning will involve matters far beyond the typical reach ofthe ministry of trade, and ideally the national government should come to a collectiveview of the appropriate strategy with respect to WTO accession. Accession shouldnot be treated as a technocratic negotiating exercise controlled by a small numberof officials in the trade ministry.
Another important step is for applicant countries to form realistic expectationsof what the WTO accession process involves. Applicants should expect the processto take at least five years. Given ministerial and staff turnover, a broad base ofgovernment, civil society, and private sector support for the accession initiative isrequired. This is possible only with broad consultation and a clear sense of thecosts, benefits, and priorities of WTO accession.
On the basis of recent accession experience, current and future developingcountry applicants can expect to have their agricultural tariffs bound at an averagerate well below 20 percent and nonagricultural goods below 10 percent. (Leastdeveloped countries appear to have been given more lenient treatment.) Theimplications of these market access commitments for import-competing sectorsshould be considered.

WTO ACCESSION
239
Applicants can also expect to sign around 25 rules-related commitments, someof which will have implications for sensitive policies such as protection of intellectualproperty rights. With respect to this class of commitments, applicants ought todevelop the capacity to document and demonstrate why a proposal from an existingWTO member is against the applicant’s development goals. Identifying nationalpriorities is not enough. Being able to respond effectively to the negotiatingproposals of other nations is important if flexibility is to be preserved. If pressed toaccept expensive rules-related commitments, applicants should at a minimum insiston technical assistance to mitigate the implementation costs.19
Given the duration, complexity, and wide-ranging scope of the WTO accessionprocess, accession countries should develop, in partnership with the providers oftechnical assistance, a road map that identifies the different types of assistancerequired at each stage of the accession process. The diagnostic tools associatedwith the Integrated Framework—successfully applied in Cambodia, for example,and currently being used in Ethiopia’s accession—provide a comprehensiveassessment of national needs. In this regard it is also important to avoid overlookingpost-accession implementation needs, as deficits here can undermine the ability ofthe private sector to capitalize on any export opportunities created by joining theWTO.
Officials in developing countries have benefited from the experience of expertsin other developing countries that have recently acceded to the WTO. Such so-called South–South learning can be very valuable. Jordan, for example, offersexpertise to countries in the Middle East and North Africa that are seeking to jointhe WTO.
Shrewd officials from applicant countries have also sought to optimize thevalue of the technical assistance they receive by playing an active role in draftingthe terms of reference for international consultants and participating in the processof selecting such consultants. It is also important to ensure that workshops andconsultant visits are tailored to country-specific circumstances and involve follow-up. Picking the right officials to attend workshops and promoting the learning inofficial WTO languages contributes positively as well.
Concluding remarksThe first 20 completed WTO accessions have raised systemic concerns that oughtto be of interest to existing WTO members as well as to applicants. The first is thatthe growing price of WTO accession is creating a multi-tiered world trading systemin which recently acceded countries have more obligations and fewer rights. This,in turn, is manifesting itself in demands from some recent applicants to be treateddifferently in liberalization efforts under the Doha Development Agenda. Someobservers have called for applicants to pay a price for accession that is bothcommensurate with their level of development and with the obligations of existing

TRADE, DOHA, AND DEVELOPMENT: A WINDOW INTO THE ISSUES
240
WTO members at the same level of development.20 The need to calibrate the processby level of development has been partially recognized by the WTO membershipand was manifested in the WTO General Council’s guidelines for the accession ofleast developed countries in December 2002.21 To date, however, the call for parity,has been rejected by WTO members.
At a time when the world trading system is supposed to be taking the interestsof developing countries more seriously, the lengthening of the time required tonegotiate accession and the uncertainty created by the lack of a clear legal definitionof the price of WTO accession are issues that merit attention. One has to askwhether it is reasonable to expect developing country’s officials and civil society tosustain interest in a process that could take a decade and involve considerablecomplexity in return for uncertain and deferred rewards. Protracted negotiationsgive opponents of trade and investment reforms opportunities to exaggerate thenegative and undermine support for the accession process. Leaders with anythingbut the longest time horizons are unlikely to support seriously an accession effortthat may not begin to pay off for a decade. It is also worth noting that the WTO isprobably the only international economic organization that asks nations to stick toa program of such length. Developmental needs and the necessity of sustaininginitial support for joining the WTO should drive the design and operation of theWTO accession process and associated technical assistance. Failure to do so riskscreating a growing group of disgruntled participants in the world trading systemwhose support for further trade reform is likely to be tepid.
Finally, it is important to recognize that the WTO accession process can play auseful role in the political economy of trade reform. Governments that are able toclearly identify their reform objectives ex ante are in a much better position to usethe process to their own advantage, leveraging the multilateral process to advancedomestic reform.
Notes1. This paper was written by Simon J. Evenett, Professor of International Trade and Eco-
nomic Development at the University of St. Gallen and a nonresident Senior Fellow of theEconomic Studies Program at the Brookings Institution, and Carlos A. Primo Braga, SeniorAdviser, International Trade Department, World Bank. Comments and assistance from U.Dadush, C. Fink, B. Hoekman, A. Hussain, P. Low, K. Lucenti, F. Maertens, W. Martin, P.Reichenmiller, P. Schuler, and C. Tully are gratefully acknowledged.
2. The working party on the accession of Vanuatu concluded its work in 2001. Vanuatu has not,however, completed its domestic ratification procedures. If one includes Vanuatu in the list ofcountries and custom territories pursuing accession to the WTO, the total number is 31.
3. Throughout this paper we define developing countries as encompassing low- and middle-income economies, according to World Bank definitions. Developing country status in theWTO, in turn, is determined by self-selection. Another country grouping used in the paper—and

WTO ACCESSION
241
recognized by the WTO—is the UN classification of least developed countries (LDCs).4. See list of suggested readings and the references provided in this chapter.5. These studies are part of a project entitled “Preparing For and Evaluating WTO Accessions”
that was funded by the International Development Research Centre (IDRC) of Canada.6. Iran’s request to initiate accession procedures, first presented in 1996, was blocked 21 times
by the United States for reasons unrelated to trade. It was finally accepted by the WTO GeneralCouncil on May 26, 2005.
7. See WTO (1995, 2004a and 2004b) for details about the accession process.8. Any current member of the WTO can join the Working Party established to consider the
accession of a new member.9. If one considers only the time taken from the submission of the Trade Memorandum until
the completion of the process in the case of new WTO members, the time required falls toroughly five years.
10. The following figures provide useful comparators. According to Finger and others (1996)the average bound MFN tariff rate on imports of all merchandise goods by a group of 26 low- andmiddle-income countries was 25.2 percent. For industrial goods the comparable average boundMFN tariff rate was 20 percent. Anderson and Martin (2005) point out that by 2001, theaverage weighted agricultural import tariffs were 48 percent for developing countries (WTOtaxonomy) and 78 for LDCs.
11. Nepal and Cambodia, the two LDCs that have joined the WTO since 1995, committed to76 and 93 subsectors, respectively, in contrast to the average of 20 subsectors that LDCs hadcommitted to during the Uruguay Round. For further details about services commitments in theGATS see Marchetti (2004).
12. Grynberg, Ognivtsev, and Razzaque (2002) came to a similar conclusion. They summarizetheir findings as follows: “At the most aggregate level, while WTO members have on averagetaken up some kind of commitment in six sectors out of a maximum of 12, the comparablefigures for acceding countries is ten. At the 2-digit level, acceded countries took commitmentsin 36 sectors compared to only 17 taken by WTO members. Finally, at the most disaggregatedlevel, acceding countries have commitments almost two and a half times bigger—103 as against42. The accession negotiations have resulted in countries undertaking commitments that appar-ently bear no relationship to their level of economic development as reflected in per capitaincome” (page vii).
13. Another example of systemic change in the accession process from the GATT-era to theWTO years concerns the nonapplication provision, which allows a member not to apply theGATT as a whole or its schedule of concessions to an acceding member. In the GATT years, acontracting party could not invoke this provision after it had entered into bilateral negotiationswith the acceding party. Under WTO rules, however, this provision can be invoked even afterbilateral negotiations have started.
14. These determinants are the national incomes of the two trading partners and the geo-graphical distance between them. Other determinants that are usually included in such analysesinclude proxy variables to pick up the effect of two nations sharing a common language and acommon border and their respective memberships in regional trading agreements.
15. See, for example, Kennett, Evenett, and Gage (2005).16. That is, to Canada, the members of the European Union, Japan, and the United States.
Given the delays in the availability of international trade data, in 2004 Bulgaria and Ecuadorwere the only medium-sized nonlandlocked countries to join the WTO for which five years ofpost-accession trade data were available. The choice of these countries was, therefore, notarbitrary.
17. See, for example, Bacchetta and Drabek (2002).18. The experiences of six developing countries in organizing for WTO accession can be found

TRADE, DOHA, AND DEVELOPMENT: A WINDOW INTO THE ISSUES
242
in Evenett (2005a). Evenett (2005b) summarizes the interventions of several developingcountry participants on this subject at a joint World Bank-GTZ workshop held in November2004. See Zarcone, Fink, and Primo Braga (2005).
19. It is said that certain developing countries have successfully used this approach in theirWTO accession negotiations.
20. See, for example, Michalopoulos (2002) and Kennett, Evenett, and Gage (2005).21. These Guidelines call on existing members to exercise restraint in seeking concessions on
trade in goods and services from acceding LDCs. See WTO (2002).
ReferencesAnderson, Kym, and W. Martin. 2005. “Agricultural Trade Reform and the Doha Development
Agenda.” Unpublished paper, World Bank, Washington, DC.Bacchetta, Marc, and Zdenek Drabek. 2002 “Effects of WTO Accession on Policy-Making in
Sovereign States: Preliminary lessons from the Recent Experience of Transition Countries.”Staff Working Paper ERSD-2002-02, WTO, Geneva.
Evenett, Simon J. (ed.). 2005a. “Preparing for WTO Accession: Insights from DevelopmentCountries.” Unpublished manuscript. Research project sponsored by the InternationalDevelopment Research Centre.
———. 2005b. “Summary of Participants’ Remarks and Recommendations.” Prepared after aJoint World Bank-GTZ workshop on WTO accession matters, Berlin, November 17-19,2004. Unpublished manuscript. Deutsche Gesellschaft für Technische Zusammenarbeit (GTZ)
Finger, J. Michael, Melinda D. Ingco, and Ulrich Reincke. 1996. The Uruguay Round: Statisticson Tariff Concessions Given and Received. Washington, DC: World Bank.
Grynberg, Roman, Victor Ognivtsev, and Mohammad A. Razzaque. 2002. “Paying the Price forJoining the WTO: A Comparative Assessment of Service Sector Commitments by WTOMembers and Acceding Countries.” Economic Paper 54, Commonwealth Secretariat, London.
Kennett, Maxine, Simon J. Evenett, and Jonathan Gage. 2005. “Evaluating WTO Accessions:Legal and Economic Perspectives.” Unpublished manuscript. Research project sponsored bythe International Development Research Centre.
Marchetti, Juan A. 2004. “Developing Countries in the WTO Services Negotiations,” StaffWorking Paper ERSD-2004-06, WTO, Geneva.
Michalopoulos, Constantine. 2002. “WTO Accession.” In Development, Trade, and the WTO:A Handbook, ed. Bernard M. Hoekman, Philip English, and Aaditya Mattoo. Washington, DC:World Bank.
Rose, Andrew. 2003. “Which International Institutions Promote International Trade?” CEPRDiscussion Paper no. 3764. London, Centre for Economic Policy Research. http://www.cepr.org/pubs/dps/DP3764.asp.
Subramanian, Arvind, and Shang-Jin Wei. 2003. “The WTO Promote Trade, Strongly ButUnevenly.” IMF Working Paper WP/03/185, International Monetary Fund, Washington, DC.
WTO (World Trade Organization). 1995. “Accession to the World Trade Organization.” WT/ACC/1. Geneva.
———. 2002. “Accession of Least Developed Countries.” WT/COMTD/LDC/12. Geneva.———. 2004a. “Technical Note on the Accession Process.” WT/ACC/10/Rev. 2. Geneva.———. 2004b. “Technical Note on the Accession Process: State of Play and Information on
Current Accessions.” WT/ACC/11/Rev. 4. Geneva.———. 2004c. “Doha Work Programme.” WT/L/579. Geneva.Zarcone, Fabrizio, Carsten Fink, and Carlos A. Primo Braga. 2005. “Technical Assistance and
WTO Accession: Lessons from Experience.” Prepared after a Joint World Bank-GTZ workshopon WTO accession matters, Berlin, November 17-19, 2004. Draft manuscript.

WTO ACCESSION
243
Further ReadingBhattasali, Deepak, William Martin, and Li Shantong (eds.). 2004. China and the WTO: Accession,
Policy Reform, and Poverty Reduction Strategy. New York: World Bank and Oxford UniversityPress.
Goldstein, Judith, Douglas Rivers, and Michael Tomz. 2003. “How Does the Trade RegimeAffect International Trade?” Unpublished paper, Department of Political Science, StanfordUniversity.
Hamada, Koichi. 2004. “China’s Entry into the WTO and Its Impact on the Global EconomicSystem.” In Doha and Beyond: The Future of the Multilateral Trading System, ed. MikeMoore. Cambridge: Cambridge University Press.
Lissovolik, Bodgan, and Yaroslav Lissovolik. 2004. “Russia and the WTO: The ‘Gravity’ ofOutsider Status.” Working Paper WP/04/159, International Monetary Fund, Washington, DC.
Rose, Andrew. 2002b. “Do WTO Members Have More Liberal Trade Policy?” NBER WorkingPaper 9347. National Bureau of Economic Research, Cambridge, MA.
Rose, Andrew. 2004. “Do We Really Know That the WTO Increases Trade?” American EconomicReview 94 (March): 98-114.

TRADE, DOHA, AND DEVELOPMENT: A WINDOW INTO THE ISSUES
244
Annex 1. Countries currently seeking accession to the WTO (withapplication date)
Russia Algeria Vietnam Sudan* Bhutan* Bahamas(June 1993) (Jun. 1987) (Jan. 1995) (Oct. 1994) (Sep. 1999) (May 2001)
Belarus Saudi Arabia Tonga Seychelles Afghanistan*
(Sep 1993) (Jun. 1993) (Jun. 1995) (May 1995) (Dec. 2004)
Ukraine Lebanon Vanuatu*(a)
(Nov 1993) (Jan. 1999) (Jul. 1995)
Uzbekistan Yemen* Lao PDR* Ethiopia*(Dec 1994) (Apr. 2000) (Jul. 1997) (Jan. 2003)
Kazakhstan Libya Samoa*
Sao Tome and
Principe*
(Jan 1996) (Jun. 2004) (Apr. 1998) (May 2005)Azerbaijan Iraq (June 1997) (Dec. 2004)
Iran(May 2005)
Andorra(July 1999)
Tajikistan (May 2001)
Serbia (b)
(Feb 2005)Montenegro(Feb 2005)
Latin America and
the Caribbean
Middle East and North
AfricaEast Asia and
PacificSub-Saharan
Africa South Asia
Europe and
Central Asia
Cape Verde*
(Nov. 1999)
Bosnia-Herzegovina (May 1999)
Note: a. The Working Party on the Accession of Vanuatu concluded its work on 29 October2001. Vanuatu has not, however, followed up on its accession.b. Serbia and Montenegro made a joint application on January 2001. In February 2005 theywithdrew that application and replaced it with two individual applications.* = least developed country.Source:Compiled by the authors on WTO data (2004a).

WTO ACCESSION
245
Annex 2. Chronological list of countries that have acceded to theWTO
No. New member Date of membership1 Ecuador Jan. 19962 Bulgaria Dec. 19963 Mongolia Jan. 19974 Panama Sep. 19975 Kyrgyz Republic Dec. 19986 Latvia Feb. 19997 Estonia Nov. 19998 Jordan Apr. 20009 Georgia Jun. 2000
10 Albania Sep. 200011 Oman Nov. 200012 Croatia Nov. 200013 Lithuania May. 200114 Moldova Jul. 200115 China Dec. 200116 Taiwan, China Jan. 200217 Armenia Feb. 200318 FYR Macedonia Apr. 200319 Nepal Apr. 200420 Cambodia Oct. 2004
Source:Compiled by the authors on WTO data (2004a).


Regional Trade Agreements:Designs for Development
Richard Newfarmer
20
Regional trade agreements (RTAs) are fundamentally altering the world tradelandscape.1 The number of agreements in force, now more than 200, hasrisen sixfold in just two decades (figure 1). Today, more than one-third of
global trade takes place between countries that have some form of reciprocal RTA.The European Union and United States are playing a prominent role in this prolif-eration (figure 2). The Central American Free Trade Agreement is only the latest ofmore than a dozen U.S. RTAs.2 The European Union, through its Economic Partner-ship Agreements, is using RTAs to restructure trading relations with the African,Caribbean, and Pacific countries that benefited from Cotonou preferences.
This chapter addresses two questions:• What characteristics of RTAs strongly promote—or hinder—development for
member countries?• Does the proliferation of RTAs pose risks to the multilateral trading system? If
so, how can those risks be managed?
Identifying what works: open regionalismRTAs are often one component of a larger political effort to deepen economicrelations with neighboring countries.3 As such, they can create opportunities toexpand trade through joint action to overcome barriers to trade, both institutionaland policy-related. But the growth in RTAs also reflects the relative ease of makingreciprocal reductions in border barriers when the participants are fewer andpolicymakers feel more in control of outcomes. RTAs also offer the flexibility topursue trade-expanding policies not addressed well in global trading rules. RTAstherefore usually go beyond slashing tariffs to reduce trade impediments associatedwith standards, customs and border crossings, and regulations affecting trade inservices—as well as broader rules that improve the overall investment climate.
Because RTAs often form cornerstones of larger economic and political effortsto increase regional cooperation, RTAs can help motivate and reinforce broaderreforms in domestic policy; they can be designed to contribute to a politicalenvironment that is more conducive to stability, investment, and growth.
Not all RTAs create new trade and investment. Those with high external borderprotection may actually reduce members’ trade overall even as trade within thegroup rises, a phenomenon known as trade diversion. When regional agreementsconsolidate high levels of external protection (figure 3), regional trade may expand,but at the expense of trade with lower cost suppliers. Figure 4 shows the effects of
247

TRADE, DOHA, AND DEVELOPMENT: A WINDOW INTO THE ISSUES
248
Source: WTO data and WTO staff.
Figure 1. South-South RTAs boom in number...
Number of RTAs
0
50
100
150
200
250
1990 1996 2002
USUS
South-South
EUEU
Source: World Trade Organization.
Figure 2. …but the EU and U.S. lead in trade coverage
Percent of world trade covered
0
5
10
15
20
25
30
35
1990 1996 2002
USUS
South-South
EUEU

REGIONAL TRADE AGREEMENTS
249
various agreements, controlling for country size, income, proximity, and other factors,on trading patterns of member; agreements with relatively low external protection,such as those in the top half of figure 4 tend to increase all trade; those with higherlevels of protection increased regional trade, but at the expense of more efficienttrade with the world. A statistical analysis based on findings from econometricstudies suggests that many agreements cost the economy more in lost trade revenuesthan they earn, because they discriminate against efficient, low-cost suppliers innonmember countries. This finding does not take into account the potential dynamicgains, the positive effects associated with services liberalization, or any of thebenefits from adopting new regulations. But it does underscore the point thatregional agreements carry risks.
As agreements proliferate, a single country may become a member of severaldifferent agreements. The average African country, for example, belongs to fourdifferent agreements, and the average Latin America country belongs to seven. Theresult is a spaghetti bowl of overlapping arrangements (figure 5), each with differingrules of origin, tariff schedules, and periods of implementation. Those differencesdelay the passage through customs of goods covered by preferential arrangements,and longer processing times drive up the cost of trade.
Impact on tradeSo what characteristics of RTAs lead to expanded trade and development? Aprerequisite for the success of any trade policy is that it be part of a sound domesticpolicy framework. It is virtually impossible for entrepreneurs to take advantage ofnew opportunities—whether they originate in market access through an RTA, amultilateral agreement, or other sources—in the absence of macroeconomic stability,basic property rights, and adequate infrastructure regulation. Conversely, tradeagreements can reinforce positive elements in the domestic reform program byanchoring policy to the agreement itself. But an RTA cannot substitute for sounddomestic policies.
With prerequisites in place, the RTAs most likely to increase national incomesover time are those designed with:• Low external most-favored-nation (MFN) tariffs• Few sectoral and product exemptions• Nonrestrictive rules-of-origin tests that build toward a framework common to
many agreements• Measures to facilitate trade• Large ex-post markets• Measures to promote new cross-border competition, particularly in services• Rules governing investment and intellectual property that are appropriate to
the development context• Schedules of implementation that are put in effect on time.

TRADE, DOHA, AND DEVELOPMENT: A WINDOW INTO THE ISSUES
250
Note: Tariffs are import-weighted at the country level to arrive at PTA averages.Source: UN TRAINS, accessed through WITS.
Figure 3. Some agreements have much higher levels of external pro-tection than others
Average tariffs
0 5 10 15 20 25
SAPTA
ECOWAS
COMESA
MERCOSUR
EAC
SADC
AFTA
NAFTA
Source: World Bank, 2004.
Note: In the chart above, the bars show the magnitude of the dummy variables, capturingrespectively the extent to which intraregional trade, overall imports, and overall exports differfrom the “normal” levels predicted by the gravity model on the basis of economic size, proximity,and relevant institutional and historical variables, such as a common language.
COMESAWAEMU
EACCIS
SAPTASADC
MercosurCEMAC
ANDEANAFTAGCC
ECOWASCACM
ECNAFTASACU
-4 -2 0 2 4 6 8 10
Intra-regional trade
Overall exports
Overall imports
COMESAWAEMU
EACCIS
SAPTASADC
MercosurCEMAC
ANDEANAFTAGCC
ECOWASCACM
ECNAFTASACU
-4 -2 0 2 4 6 8 10
Intra-regional trade
Overall exports
Overall imports
Figure 4. Intraregional trade may grow at the expense of extraregional trade

REGIONAL TRADE AGREEMENTS
251
Low external tariffs and wide coverage minimize the risks of trade diversion,while nonrestrictive rules of origin promote increased trade. The practice of excludingmany agricultural products is common, but it can limit development payoffs. Tradefacilitation measures, though worthwhile in and of themselves, receive more attentionfrom policymakers when they are embedded in an RTA, and they often have positivetrade-creating effects for all trade partners.
Well-designed agreements are of limited value if they are not implemented, andmany RTAs have more life on paper than in reality. South–South agreements, inparticular, are often poorly implemented. Monitoring mechanisms may be weak ornot receive the sustained, high-level political attention necessary to drive institutionalimprovements related to tariff schedules, customs, and border crossings.
Against these benchmarks of success, it is difficult to give universally highmarks to any single category of agreement. But in general, North–South agreementsscore better on implementation than South–South agreements.
Because North–South agreements can integrate economies with distincttechnological capabilities and other differences in factor proportions, and becausethey usually result in larger post-agreement markets, their potential gains are usuallygreater. However, tighter rules of origin, more restrictive exclusions for particularsectors (such as agriculture), and a preoccupation with rules not calibrated todevelopment priorities can undercut those benefits (figure 6).
North–South agreements, particularly those with the United States, have beenmore effective in locking in liberalization in services trade; they have pressedintellectual property rights beyond World Trade Organization (WTO) rules; andthey have expanded the sphere of investment protections; but they contain fewprovisions to liberalize the temporary movement of labor.
South–South agreements sometimes outdo North–South deals at focusing onmerchandise trade, minimizing exclusions, adopting less restrictive rules of origin,and lowering border costs. For example, the Caribbean Community (CARICOM)and the Common Market of Eastern and Southern Africa (COMESA) have reducedsome border costs. But most South–South agreements have not adhered toimplementation schedules, and they suffer from their small market size and economicsimilarity. And like the North–South agreements, South–South agreements rarelyprovide for the temporary movement of labor.
Consequences of RTAs for the multilateral systemThe development consequences of RTAs are not limited to their effects on mem-bers; they also extend to the multilateral system. In one sense, RTAs are a steptoward greater openness in the global trade system, in that they promote trade andgenerate new domestic constituencies with an interest in openness. Moreover,some regional trade policies—such as measures to improve customs, speed uptransactions at ports or border crossings, and open services markets—can be

TRADE, DOHA, AND DEVELOPMENT: A WINDOW INTO THE ISSUES
252
Figure 5. RTAs can complicate customs administration
Source: Schiff and Winters (2003).
IOC
AlgeriaLibyaMorocco MauritaniaTunisia
AMU
GhanaNigeria Cape Verde
Gambia
ECOWAS
Benin NigerTogo Burkina FasoCote d’Ivoire
Conseil de L’Entente
Guinea-Bissau
WAEMU
Liberia Sierra Leone
ManoRiver Union
CLISS
CameroonCentral African Rep.GabonEquat. GuineaRep.Congo
Chad
Sao Tomé & Principe
ECCASCEMAC
Angola
Burundi*Rwanda*
Egypt
DR Congo
DjiboutiEthiopiaEritreaSudan
Kenya*Uganda*
Somalia
Tanzania*
EAC
S. A.Botswana
Lesotho
Namibia*Swaziland*
Mozambique
SACU
Malawi*Zambia*Zimbabwe*
Mauritius*Seychelles*
Comoros*Madagascar*
Reunion
*CBISADC
COMESANile River Basin IGAD
MaliSenegal
Guinea
Note: Higher values of the index equals to more restrictive rules of origin.Source: Derived from Estevadeordal and Suominen (2004).
Figure 6. Rules of origin in North-South agreements are morerestrictive than in South-South agreements
0
1
2
3
4
5
6
NAFTA EU-Mexico
EU-Chile SADC Chile-CACM
AFTA COMESA ECOWAS
Index of restrictiveness

REGIONAL TRADE AGREEMENTS
253
beneficial in a nondiscriminatory way. Such measures can complement unilateraland multilateral policies.
However, this view overlooks the effects that RTAs can have on excludedcountries. The fact is that preferences for some countries mean discriminationagainst others, whereas the General Agreement on Tariffs and Trade (GATT), bornout of the sad experience of discrimination in the prewar years, is based on theprinciple of nondiscrimination.
Today, the adverse consequences for the excluded countries are much lesssevere than at GATT’s inception, because tariffs and other barriers have comedown sharply worldwide, mitigating the exclusionary effects of regionalarrangements. (The exception—and it is not trivial—is agriculture.) Anothermitigating factor is that many countries excluded by trade agreements between theUnited States and the European Union enjoy some degree of preferential accessthrough voluntary preference schemes, such as the Generalized System ofPreferences (GSP), the U.S. African Growth and Opportunity Act (AGOA), and theEU’s Everything But Arms (EBA) program. To be sure, these programs lack thecertainty of market access that MFN agreements and RTAs provide, becausepreferences are voluntary and subject to political whim, but they do mitigate theeffects of exclusions for selected low-income countries. A third mitigating factor isthat some developing countries—the spokes in the hub-and-spoke analogy—aresigning bilateral agreements with each other and with other hubs.
Inevitably some countries get left out of trade agreements because they arenot favored politically, because they cannot afford the costs of many separatenegotiations, or because their region is less open. Countries as diverse as Bolivia,India, Mongolia, Pakistan, and Sri Lanka do not enjoy the same level of access tothe United States or the EU as Chile, Jordan, and Mexico. When bilateral agreementsare signed, they see their trade diminished.
RTAs can also undercut the incentives of governments to press for furthermultilateral trade liberalization. There is little evidence that major players in thecurrent WTO negotiations have changed their negotiating positions or retreatedfrom the multilateral process, even as they avail themselves of regional trade deals.However, as the discussions become politically difficult, the risk is ever presentthat they will abandon multilateralism in favor of regional agreements that are “goodenough.” The risk for smaller players, especially poor ones, is different. Oneconsequence of the spread of regional agreements is that many poorer developingcountries have diverted scarce negotiating resources to regional negotiations atthe expense of more active participation in the Doha Round of global tradediscussions. The average developing country belongs to five separate RTAs and isnegotiating more. To protect hard-won market access under regional agreements,countries may choose to fight multilateral liberalization or even oppose furtherregional liberalization. A few small developing countries are indeed likely to lose

TRADE, DOHA, AND DEVELOPMENT: A WINDOW INTO THE ISSUES
254
advantages in preferential markets with further multilateral liberalization and mayseek to scuttle global talks if their legitimate concerns are not addressed.
The importance of the Doha Round to “open regionalism”The policy solution to these twin concerns—the need to design regional agreementsthat create trade and for regional agreements that have minimal exclusionary effects—comes together in the form of further reductions in MFN tariffs and other borderbarriers. An agreement that lowers border protection around the world promotesopen regionalism by mitigating trade diversion. At the same time, it would diminishthe exclusionary effects of discriminatory preferences built into regional agreements.The first order of business for the international community, therefore, is to accelerateprogress on the Doha Agenda and to fill in the blanks of the July 2004 FrameworkAgreement with reductions in protection, especially for products produced by theworld’s poor.
For developing countries, a three-part strategyDeveloping countries wishing to harness trade to their development strategy shouldsee regional integration as one element in a three-pronged strategy that includesunilateral liberalization, multilateral liberalization, and regional liberalization.
Historically, unilateral liberalization, which is usually linked to a broader programof domestic reform, has accounted for most reductions in border protection. Mostcomprehensive trade reforms undertaken by large countries (Argentina, Brazil, andChina in the early 1990s and, more recently, India) began as unilateral reformsdesigned to increase the productivity of the domestic economy. Many small countries,too, have adopted similar reforms. Of the 21 percentage point cut in average weightedtariffs of all developing countries between 1983 and 2003, unilateral reformsaccounted for almost two-thirds. Tariff reductions associated with the multilateralcommitments in the Uruguay Round accounted for about 25 percent, and theproliferation of regional agreements amounted to about 10 percent (figure 7).
Autonomous liberalization promotes global competitiveness by lowering costsof inputs, increasing competition from imports to drive productivity growth, andintegrating the national economy into the global economy. In the presence of RTAs,autonomous trade reform loses none of its importance, because low border barriersminimize the risks of trade and investment diversion. They also promote trade inworld markets, which is highly correlated with increases in intraregional trade,whether or not an RTA is in place.
Multilateral liberalization has the effect of translating domestic reforms intoincreased market access around the world. Collectively, developing countries standto gain much more in the WTO arena than in any smaller regional market. Moreover,the multilateral forum is the only one in which developing countries, workingtogether, can press for more open markets in agriculture and can seek disciplines on

REGIONAL TRADE AGREEMENTS
255
trade-distorting agricultural subsidies and contingent protection (i.e. anti-dumpingmeasures and the like).
Some argue that RTAs are a good alternative to multilateral liberalization. Theyare not. Gains for all developing countries from RTAs, even under the most generousassumptions, are usually only a fraction of those from full multilateral liberalization.The appearance of benefits derives from the fact that countries signing early tradeagreements with a high-income, large-market economy may benefit substantially,particularly if most other countries are excluded from preferential access. But thosebenefits wither as new countries sign additional agreements. In fact, developingcountries would collectively lose if they were all to sign preferential agreementswith the Quad (Canada, the European Union, Japan, and the United States) (figure8) (see World Bank, 2004, Chapter 6). On balance, developing countries have apowerful collective interest in a successful Doha Round—even as they scramble togain preferential market access to the Quad.
Forging policies on open regionalism is the third component of trade policystrategy. Desirable as multilateral liberalization is, the Doha Round is likely to realizeonly part of its development potential. For some types of policy, collective regionalactions may be the first, best course and may result in effective nondiscriminatorybenefits.4 For example, RTAs can reduce regional political tensions, take advantage
Source: World Bank (2004).
Figure 7. Source of total tariff reduction, by type of liberalization, 1983–2003
Uruguay Round25%
Regional Agreements
10%
Autonomous Liberalization
65%

TRADE, DOHA, AND DEVELOPMENT: A WINDOW INTO THE ISSUES
256
of scale economies in infrastructure provision, and lead to joint programs to improveborder crossings related to liberalization in services.
But countries should sign on with their eyes wide open. The lessons of thestudy on which this note is based (and others before it)5 are that—as with unilateralor multilateral policies—design and implementation determine the ultimate effects.It is important, therefore, to use trade policy to leverage domestic reforms thatpromote growth. It is essential that South–South agreements focus on somecombination of full trade liberalization behind low external border protection, greaterservices deregulation and competition, and proactive trade facilitation measuresthat together benefit both intra- and extra-regional trade.
High-income countries and developmentHigh-income countries, in order to realize their broad development objectives, mustintensify their efforts to realize the development promise of the Doha Agenda.Doing so has the potential to open up trade, particularly in agriculture, in a way thatwould benefit low-income groups around the world. Because the high-incomecountries are the most powerful players in the system, they have a special interestin—and responsibility for—using effective multilateral reforms to discipline thediscretionary aspects of the regional agreements. And if developing countries areto be convinced to concentrate scarce negotiating resources on the multilateralagenda the high-income countries may have to slow their efforts at expandingRTAs.
High-income countries should consider the following basic notions when de-signing agreements to promote development. First, the extensive exclusions foragriculture should be reversed. Doing so would bring income gains in rural areas ofparticipating developing countries. Second, rules of origin should be more consis-tent and less restrictive across agreements to reduce the administrative barriersthat increase the burden on customs administration and so often undermine agree-ments. Third, new regulations affecting investment and intellectual property shouldbe appropriate to the level of development to reduce risks of undue enforcementcosts.
Finally, trade-related technical assistance should be provided, not only in theimplementation phase but also in the negotiating phase, to promote greater liberal-ization of services and lower MFN tariffs.
Acting collectively to mute the effects of discriminationTo minimize the discriminatory effects of RTAs at the multilateral level, all countriesmust assume greater responsibility for maintaining the multilateral system. Theinternational community, working through the WTO, should revisit Article XXIV ofits charter. If the stated disciplines cannot be enforced in the near term for collectivepolitical reasons, then increasing transparency and information should become a

REGIONAL TRADE AGREEMENTS
257
priority. At present, the WTO collects little or no information on the implementationof specific provisions—and on the trade consequences of those actions. It evenfails to take advantage of extant public monitoring efforts in specific regions, whichcould inform its data collection effort. Collecting and publishing specific informationon RTAs would allow members that find themselves excluded to challenge theseagreements in the court of public opinion. Even the more modest goal of transparencywill require building a new consensus and providing the staff of the WTO withmore resources than are currently available. WTO members also should considerenhancing the existing rules to ensure that regional agreements have positivedevelopment and systemic outcomes. Enhancements (requiring only a modesttightening of current practice) might include setting quantitative indicators thatdefine the term “substantially all trade.” They might also include efforts to simplify andharmonize the rules of origin that are applied to both developed and developingcountries. These items are on the Doha Agenda and may be ready for action.
Note: Global refers to the global merchandise trade reform scenario, JBIL corresponds to thesimulation where all developing countries sign bilateral agreements with the Quad-Plus, andBILAT corresponds to the simulation where the bilateral agreements are signed individually.Results un-weighted regional averages.Source: World Bank reflect simulations with the Linkage model and GTAP release 6.04.
Figure 8. Multilateral liberalization is far more beneficial than RTAsPercent change in real income in 2015
-1.5 -1.0 -0.5 0.0 0.5 1.0 1.5 2.0
Quad+
Developing
Low-income
Middle-income
Bilateral FTAs (single)
Multilateral
Bilateral FTAs (all)
-1.5 -1.0 -0.5 0.0 0.5 1.0 1.5 2.0
Quad+
Developing
Low-income
Middle-income
Bilateral FTAs (single)
Multilateral
Bilateral FTAs (all)

TRADE, DOHA, AND DEVELOPMENT: A WINDOW INTO THE ISSUES
258
Notes1. This note draws from Global Economic Prospects 2005, Washington, DC: World Bank.2. Negotiated as bilateral or multicountry treaties, regional trade agreements grant members
assured preferential market access, usually at zero tariffs for eligible products. Following WTOconvention, the term “regional trade agreement” includes both reciprocal bilateral free trade orcustoms areas and multicountry (plurilateral) agreements. These are distinct from nonreciprocalvoluntary agreements, such as the generalized system of preferences (GSP). Also, for statisticalpurposes, unless otherwise noted, intra-EU trade is excluded from quantitative trade analysis.The EU is defined as including the 15 countries that belonged to the union before its enlargementin 2004.
3. See Devlin and Estevadeordal (2004) and Schiff and Winters (2003), among others.4. See Robert Lawrence (1997), who develops the idea of subsidiarity as applied to regional
agreements.5. See Schiff and Winters (2003).
ReferencesDevlin, Robert, and Antoni Estevadeordal. 2004. “Trade and Cooperation: A Regional Public
Goods Approach.” In Regional Public Goods: From Theory to Practice, ed. AntonioEstevadeordal, Brian Frantz, and Tam Robert Nguyen. Washington, DC: Inter-AmericanDevelopment Bank.
Lawrence, Robert. 1997. “Preferential Trading Arrangements: The Traditional and the New.”In Regional Partners in Global Markets: Limits and Possibilities of the Euro-Med Agree-ments, ed. Ahmed Galal and Bernard Hoekman. London: CPER/ECES.
Schiff, Maurice, and L. Alan Winters. 2003. Regional Integration and Development. Washing-ton, DC: World Bank.
World Bank. 2004. Global Economic Prospects 2005: Trade, Regionalism, and Development.Washington, DC: World Bank.
Further ReadingHoekman, Bernard, and Maurice Schiff. 2002. “Benefiting from Regional Integration.” In
Development, Trade and the WTO: A Handbook, ed. Bernard Hoekman, Aaditya Mattoo, andPhilip English. Washington, DC: World Bank.
Inter-American Development Bank. 2002. Beyond Borders: The New Regionalism in LatinAmerica, Economic and Social Progress in Latin America. Washington, DC: World Bank
Krumm, Kathy, and Homi Kharas, 2004. East Asia Integrates: A Trade Policy for SharedGrowth. Washington, DC: Oxford University Press and World Bank.
United Nations Economic Commission for Africa. 2004. Assessing Regional Integration inAfrica. Addis Ababa: Economic Commission for Africa.
World Bank. 2003. Trade, Investment, and Development in the Middle East and North Africa:
Engaging with the World. Washington. DC: World Bank.

NAFTA at 10 Years: Lessons for Development
Daniel Lederman, William F. Maloney and Luis Servén21
The North American Free Trade Agreement (NAFTA) has raised Mexico’sstandard of living and helped bring the country closer to the levels ofdevelopment of its NAFTA partners. Between 1994 and 2002, NAFTA made
Mexico richer than it would have been without the agreement by about 4 percent ofits gross domestic product (GDP) per capita (Lederman, Maloney, and Servén 2005).Statistical analyses suggest that the treaty resulted in a doubling of Mexico’sglobal exports and an increase of 40 percent in foreign direct investment (FDI). Asa result of the agreement, the amount of time required for Mexican manufacturers toadopt U.S. technological innovations was cut in half. Trade seems to be partiallyresponsible for the moderate declines in poverty observed during the period andhas likely had a positive effect on the number and quality of jobs. Nonetheless,NAFTA is not enough to ensure economic convergence among North Americancountries and regions because of limitations in its design and the need for crucialdomestic reforms. These conclusions follow from careful empirical analysis ofNAFTA’s 10-year history.
Identifying NAFTA’s effects is difficult for various reasons. First, only arelatively short time has elapsed since implementation of the agreement. Second,Mexico’s post-NAFTA years started with the dramatic setback of the Tequila crisisin 1994–95, making it hard to disentangle the effects of the treaty on the Mexicaneconomy. Third, care must be taken when extrapolating the NAFTA experience tothe Central American Free Trade Agreement (CAFTA) or other FTAs in Latin Americabecause of the considerable diversity of Latin American and Caribbean countries.The key priorities, necessary preparatory measures, and likely effects of accessionthus differ considerably across countries.
The content of NAFTANAFTA eliminated most import tariffs and other restrictions to trade among
Canada, Mexico, and the United States over its first 10 years. Mexico made the mostsubstantial reforms, cutting average tariffs from about 12 percent in 1993 to 1.3percent in 2001. U.S. tariffs on Mexican imports fell from 2.0 to 0.2 percent. In someinstances, however, market access for Mexican exports remains inhibited by rulesof origin, which set product- or sector-specific criteria for products to be consideredas originating in a NAFTA country.
Like most trade agreements, NAFTA did not remove all trade distortions. Whilemost agricultural imports from Canada and the United States have entered the
259

TRADE, DOHA, AND DEVELOPMENT: A WINDOW INTO THE ISSUES
260
Mexican market duty free, Mexico’s import-competing agriculture has benefitedfrom income transfers and subsidies. Moreover, all member countries have continuedto use anti-dumping and countervailing duties (AD/CVDs), and NAFTA allows theuse of temporary safeguard duties when sudden import surges disrupt domesticproduction. For example, since 2003 Mexico has imposed temporary taxes on poultryimports from the United States. The agreement established various mechanisms tosettle disputes related to the use of safeguards and AD/CVDs as well as otherissues related to foreign investment and trade.
Beside trade-related measures, NAFTA includes a variety of provisions affectinginvestment flows, financial and other services, government procurement, and theprotection of intellectual property rights. A full review of all these provisions wasbeyond the scope of the analysis upon which this note is based, but it is noteworthythat the agreement did not fully liberalize the financial system. In banking, theagreement allowed FDI to penetrate only up to a maximum of 25 percent of thebanking system’s aggregate capital. Although NAFTA did codify an open capitalaccount for cross-border financial services, Mexico had already unilaterallyliberalized its capital account prior to the implementation of the agreement in 1994.
The analytical challenge: identifying the impact of NAFTAMexican economic performance since 1980 has fluctuated widely, which partiallyexplains the degree of controversy in the debate over NAFTA’s impact on theMexican economy. On the one hand, trade and FDI as shares of GDP were higher inthe post-NAFTA period than in the previous years. But these rising trends alsowere evident during Mexico’s unilateral trade reforms of the late 1980s. Moreover,trade grew quickly in the 1990s all over the world, and FDI rose in many otheremerging markets. On the other hand, the growth of Mexican GDP per capita andreal wages was unremarkable after NAFTA’s implementation, and estimated povertyrates declined only after 1996. Of course, an important reason why growth andwages did not perform more favorably was the macroeconomic and financial crisissparked by the devaluation of the peso in December 1994. Indeed, the evidenceshows that trade and FDI cannot be blamed for the lackluster performance of wages,since wages in Mexico tended to be higher in sectors and regions that were andremain exposed to international competition and foreign investment.
Economic convergence in North America after NAFTAOur research shows that trade liberalization has significantly benefited Mexico’seconomy, including the poor. NAFTA, along with the unilateral trade reforms of the1980s, helped Mexico enter a process of economic convergence with respect to theUnited States, increasing trade, FDI, and growth. Real wages have recovered rapidlyfrom the 1995 collapse, and the poverty rate has similarly improved. After 1995, the

NAFTA AT 10 YEARS
261
gap in per capita GDP between Mexico and the United States has evolved morefavorably than for other Latin American and Caribbean economies.
However, NAFTA is not enough to ensure economic convergence in NorthAmerica. Mexico still suffers from important deficiencies in institutions and ineducation and innovation policies that constrain its long-run ability to catch upwith its northern neighbors. In fact, econometric analysis indicates that the gap inthe quality of public institutions is the biggest single factor behind the income gapbetween the two countries. Furthermore, the combined influences of all other factorsthat determine income in the long run—principally Mexico’s status as an oilproducer—actually suggest that Mexicans would be richer than their northernneighbors were it not for the institutional gap. The importance of institutions,which are not the primary focus of trade agreements, in determining income puts inperspective the economic benefits that should be expected from such treaties.
For the rest of Latin America and the Caribbean, the situation is very similar:institutional gaps are the biggest obstacle to income convergence with the UnitedStates. Institutional reforms, especially those intended to improve the rule of lawand fight corruption, are therefore critical for the future economic development ofthe region.
While Mexico’s institutions improved after NAFTA’s implementation,improvements were observed throughout the region, and especially in Chile andCentral America. This indicates that institutional improvements are not automaticby-products of North–South free trade agreements. Substantial unilateral effortswill be required to revamp Latin American and Caribbean institutions and quickenincome convergence in the Americas.
Macroeconomic synchronization and policy coordinationIn addition to long-run effects on per capita income and wages, trade agreementsalso have potentially major implications for macroeconomic fluctuations in membercountries and, therefore, for the design of their macroeconomic policies. Throughincreased economic integration, the macroeconomic cycles of partner countriesmay become more closely synchronized—although this need not be the case,especially if the countries involved are very different. In the post-NAFTA years,fluctuations in the United States have accounted for an increasingly large fractionof the variation in Mexico’s GDP growth.
Trade integrationMexico’s trade liberalization under NAFTA followed closely the unilateral reformsbegun in 1986, after the country joined the General Agreement on Tariffs and Trade(GATT). Trade negotiations among Canada, Mexico, and the United States beganinformally in 1990, and more formally in 1991 after the United States administrationobtained “fast track” authority from its legislature. It is therefore difficult to separate

TRADE, DOHA, AND DEVELOPMENT: A WINDOW INTO THE ISSUES
262
the effects of NAFTA on Mexico’s volume and composition of trade from those ofthe unilateral reforms, especially given that the mere announcement of NAFTAtalks could have had an impact on economic outcomes. Whatever the cause, in the1990s Mexico’s trade volume as a share of GDP became one of the highest in theregion. Since catching up with Chile in this indicator of economic integration Mexicois fast approaching the high trade shares (around 100 percent of GDP) that aretypically found among smaller economies, such as Costa Rica.
But the rapid expansion of Mexico’s trade began just prior to NAFTA, around1993. That expansion was accompanied by a marked change in the composition oftrade, indicating that structural changes had occurred before the trade agreement.(For example, Mexico became a net exporter of machinery in 1992–93.) Thosestructural changes may have been delayed effects of the unilateral reforms of themid-1980s; they may also reflect enhanced credibility and confidence resultingfrom the anticipated passage of NAFTA. In any case, econometric evidence suggeststhat NAFTA did not significantly (in the statistical sense) affect aggregate exportsand imports between the United States and Mexico, while Mexico’s global exportsdid increase significantly after NAFTA. Consequently, it seems that NAFTA helpedconsolidate ongoing trends by removing Mexico’s longstanding policybiases against trade.
AgricultureContrary to some predictions, NAFTA has not had a devastating effect on Mexico’sagriculture. In fact, both domestic production (measured in metric tons) and trade inagricultural goods rose during the post-NAFTA years. The expected negativeconsequences did not occur for at least three reasons. First, aggregate demand inMexico and the United States grew in the latter half of the 1990s, thus allowing forsimultaneous increases in Mexican production and imports. Second, some segmentsof Mexican agriculture experienced increases in land productivity. (This was the casefor irrigated lands, but not for rain-fed lands.) Third, whereas the total amount ofsubsidies and income support for traditional agriculture did not rise during the NAFTAperiod, Mexico’s unilateral reforms improved the efficiency of such subsidies. Inparticular, the Programa para el Campo (PROCAMPO), which became the mainsource of income support provided by the government for farmers who had historicallyproduced import-competing crops such as maize and other grains, delinked the amountof public support from current and future production decisions.
Antidumping and countervailing dutiesNAFTA’s Chapter 19, which provides a panel-review mechanism for assessingwhether AD/CVD decisions by the competent national agencies have been properlyapplied, has had no significant impact on U.S. AD/CVD activity against Canada orMexico. U.S. AD/CVD actions against Canada and Mexico have been infrequent in

NAFTA AT 10 YEARS
263
the last ten years, as they were before NAFTA. On the other hand, the UnitedStates has traditionally been a major focus of Mexican antidumping cases; sincethe implementation of NAFTA, Mexico has significantly reduced its antidumpingactivity against both the United States and Canada. Nonetheless, all three countriesshould review their AD/CVD practices and move toward a system that relies moreon the use of safeguard actions rather than AD/CVD investigations since NAFTAprovisions themselves have not reduced the use of AD/CVD investigationsby the United States.
Trade diversion resulting from NAFTAWhen NAFTA was being negotiated in the early 1990s, many countries voicedconcern that their exports to the United States (and, to a lesser extent, to Canadaand Mexico) would be displaced by intra-NAFTA trade, even though many producersin those countries were more competitive than NAFTA producers. We find littleevidence of trade diversion at the aggregate level, a conclusion that agrees withprevious studies of NAFTA reviewed in the book (Lederman, Maloney and Servén2005). The absence of trade diversion is also suggested by the fact that Mexico’sexport share in non-NAFTA markets rose as much as, or even more than, its sharein NAFTA markets. Likewise, the U.S. market shares of exports from other LatinAmerican and Caribbean economies were not systematically affected during thepost-NAFTA period.
Although NAFTA may have reduced Asian imports of textiles and apparel intothe U.S. market, trends in apparel trade provide no solid evidence that neighboringcountries lost market share because of NAFTA preferences. Although all countriesin Central America and the Caribbean faced the same change in U.S. preferencesrelative to those enjoyed by Mexico, their post-NAFTA performances showedconsiderable diversity. Most Central American countries managed to raise theirexport share in NAFTA apparel markets; Caribbean economies fared less well. Thissuggests that factors other than NAFTA preferences are responsible for much ofthis diverse post-NAFTA performance.
Among such factors, export incentives granted by several countries in exportprocessing zones (EPZs) may have played an important role. It isthus possible—although hard to verify—that the upward trend in the region’sapparel export shares might have been achieved at significant costs, such as forgonefiscal revenues and other potential distortions often associated with EPZs.
CapitalIn addition to increasing trade, an FTA may deepen the degree of financial integrationof member countries, prompting a substantial rise in foreign investment. Indeed,higher FDI is often one of the main benefits that prospective members expect fromupcoming trade agreements with the United States. Mexico’s experience with NAFTA

TRADE, DOHA, AND DEVELOPMENT: A WINDOW INTO THE ISSUES
264
appears to validate these expectations: aggregate FDI flows to Mexico did risesignificantly after the agreement was signed, and econometric analysis suggeststhat the agreement played an instrumental role in the rise. On the whole, however,Mexico’s FDI performance in the post-NAFTA period was not significantly abovethe Latin American norm, except in the years immediately following passage, thussuggesting that the impetus for FDI was positive but transitory. A separate statisticalanalysis, however, suggests that the accumulated effect of NAFTA on FDI intoMexico was such that overall FDI would have been about 40 percent lower by theyear 2000 without NAFTA.
There is little evidence that increased investment in Mexico came at the expenseof other countries in the region—that is, that NAFTA led to investment diversion.The neighboring countries of Central America and the Caribbean, which stood tolose the most from a redirection of FDI flows to Mexico, did not suffer generally asinvestment hosts after NAFTA.
LaborThe lessons on labor markets emerging from Mexico are necessarily tentative, butthe overall evidence warrants cautious optimism. There is some evidence ofconvergence toward U.S. wage levels, but inference is made very difficult by thecollapse of Mexican real wages following the Tequila crisis. Although manufacturingwages increased after unilateral liberalization and rose sharply in the years followingNAFTA, there is no strong evidence that this was substantially affected by increasedtrade. On one hand, wages are higher and have grown faster in states with moretrade, FDI, and maquilas. On the other hand, the apparently tighter integration ofwages along the border, in traded and nontraded industries alike, suggests animportant role for migration in driving the limited convergence seen so far. Chileprovides a longer-run precedent: after its very similar version of the Tequila crisisfollowing unilateral liberalization in the early 1980s, the country generated impressivereal wage growth of 3.2 percent a year from 1986 to the present, with large declinesin poverty rates.
Despite popular perception, there is little ground for concern that NAFTA, orFTAs in general, will have a detrimental effect on the availability or quality of jobs.In Mexico and throughout the region, there is little indication of higherunemployment, increased volatility of the labor market (after the initial adjustments),or increased informalization associated with trade liberalization. As is true of firmsof the region generally, Mexican firms that are more exposed to trade tend to payhigher wages (adjusted for skills), are more formal, and invest more in training. The(probably temporary) widening of the wage gap between skilled and unskilledworkers observed throughout the region can be seen as reflecting a welcome increasein the demand for skilled workers by new and upgrading firms.1

NAFTA AT 10 YEARS
265
When NAFTA was signed, the Mexican labor market was characterized byfluctuations in real wages, which partly accounts for the low levels of unemploymentduring periods of sectoral reallocations and the 20-year low reached by 1999. Evenduring the Tequila crisis, Mexico kept unemployment low by allowing inflation toerode pact-guided wages. Arguably, this flexibility in real wages is the criticaldifference from countries such as Argentina and Colombia, where relatively rigidreal wages contributed to high and sustained unemployment during macroeconomiccrises in the 1990s. The experience of Mexico and other industrialized countriessuggests that neither prolonged spells of unemployment nor degradation of jobquality are necessary or even likely results of increased trade or an FTA, andadjustments to trade-related or other shocks can be facilitated by higher degrees ofnominal wage flexibility.
This discussion raises two questions about side agreements on labor issues.First, given that Latin American labor legislation is generous by industrialized countrystandards, would it not be better for agreements to facilitate the transition to systemsthat both protect workers better and promote dynamic growth, rather than to insist onthe enforcement of archaic structures? Second, and more fundamental given theincreasing evidence that foreign and trade-oriented firms offer higher wages andbetter working conditions, should not the effort to improve labor standards focus onall sectors of the economy and be freestanding (perhaps coordinated by an organizationlike the International Labour Organization) rather than linked to particular tradeagreements? In light of the potential for protectionist abuse of side agreements, bothquestions merit careful debate as other FTAs go forward.
Notes1. The regionwide trends in the quality and availability of jobs, as well as the skill premium
and its determinants, are amply documented in reports from the World Bank’s Latin Americaand the Caribbean Region (World Bank 2001 and 2002).
ReferencesLederman, Daniel, William Maloney, and Luis Servén. 2005. Lessons from NAFTA for Latin
America and the Caribbean. Palo Alto, CA: Stanford University Press.U.S. International Trade Commission. 1997. The Impact of the North American Free Trade
Agreement on the U.S. Economy and Industries: A Three-Year Review. Publication 3045.Washington, DC.
World Bank. 2001. From Natural Resources to the Knowledge of Economy. Latin American andCaribbean Studies, Washington, DC: World Bank.
———. 2002. Closing the Gap in Education and Technology. Latin American and CaribbeanStudies, Washington, DC: World Bank.


Beyond Cotonou: Economic PartnershipAgreements in Africa
Lawrence Hinkle, Mombert Hoppe, and Richard Newfarmer
22
In 2000, the Cotonou Agreement between the European Union and the formercolonies that make up the Africa, Caribbean, and Pacific (ACP) countries laidout the framework for a new trade and development relationship, called Economic
Partnership Agreements (EPAs). The trade component of the 1975 Lomé convention,which offered ACP countries preferential access to EU markets, discriminated againstother developing countries and thus was not WTO-compatible. (Lomé had beensustained only because other WTO members granted two waivers on theunderstanding that its preferences would be phased out.) Cotonou laid the basisfor new, reciprocal, and WTO-consistent trading agreements between the EuropeanUnion and six groupings of ACP states by 2008, the date of expiration of the waiver.The EPAs would replace the Lomé system of unilateral trade preferences with morecomprehensive, modern, free trade agreements that would be legal under ArticleXXIV of the General Agreement on Tariffs and Trade (GATT).
The negotiations, proceeding fitfully but with increasing intensity for threeyears, have propelled to the surface serious concerns about the designof EPAs—among them loss of tariff revenues and diversion of trade anddevelopment resources, the latter because of commitments on the so-calledSingapore issues.1 Indeed, a poorly structured EPA could undermine developmentfor all countries in the ACP group. At the same time, they also represent anopportunity for the ACP countries to harness the power of the trade negotiations topromote their internal regional development and gain additional access to Europeanmarkets. To capitalize on that opportunity, however, both the ACP countries andthe European Union will need to take steps to create a pro-development EPA. TheACP countries must develop negotiating strategies to harness the EPAs to theirdomestic reform program; the European Union must be willing to provide greatermarket access through nonrestrictive rules of origin, to expand “aid for trade,” andto defer its own preferences in ACP markets until important MFN liberalization hasoccurred in the regions.
Recasting the EU-ACP trade and development relationshipThe ACP countries have enjoyed a special relationship with the European Unionfor half a century. Since 1963, two Yaoundé and four Lomé conventions (I–IV)granted preferential access to the European market. The Yaoundé conventionsdealt with development assistance through the European Development Fund (EDF),whereas the Lomé conventions introduced preferential trade access for ACP
2673

TRADE, DOHA, AND DEVELOPMENT: A WINDOW INTO THE ISSUES
268
countries to the (expanding) European Union. The Cotonou Agreement broadenedthe relationship between the two groups of countries by strengthening the politicaland development dimensions.
The EPAs are intended to replace the European Union’s present unilateralpreferences with the ACP group with six reciprocal free trade agreements. Takentogether those agreements will constitute a comprehensive approach to development(including aid for trade), covering trade in goods and services, investment,competition, trade facilitation (the four Singapore issues), and some aspects ofintellectual property rights. They will allow for some differentiation between LDCsand non-LDCs, primarily during the phasing-in of reforms of external tariffs andother regulatory measures. To be consistent with WTO Article XXIV, the preferentialfree trade agreements are to be based on the principle of reciprocity in “substantiallyall trade,” which, although nowhere defined, is widely understood to mean about 90percent of the current bilateral EU–ACP trade flows.
The division of the 79 ACP countries into six negotiating groupings2 was notbased solely on negotiating convenience. The creators of the Cotonou Agreementsaw the potential of forming larger regional units from states too small to producemany goods and services competitively. Larger units would also be able to providethe government regulatory services necessary to support growth. (The averagepopulation of the nations in the ACP group was about 9.4 million in 2002, with aGDP of about $5.6 billion.) The concept was to create “North–South–South”agreements linking the European Union, the world’s largest customs union, withaspiring customs unions in the South. At the moment, all six groupings consist of partiallyoverlapping free trade areas, customs unions, and nonaffiliated countries (table1).3
Negotiating issues and obstaclesThe negotiations will have to deal soon with five related sets of problems, theresolution of which will determine the effectiveness of any EPA:• Poorly integrated regional markets for products.• Regional groupings with varying levels of MFN protection, and tariff peaks.• Losses in tariff revenues associated with EPA agreements.• Unintegrated—and in some cases unliberalized—services markets, and the
Singapore issues.• Infrastructure and aid for trade.
Regional integration of product marketsWithin Sub-Saharan Africa, intraregional trade is limited. Only 15 percent ofmerchandise exports go to other countries in the region, and only 10 percent ofmerchandise imports originate in the region.4 Even though regional agreementshave proliferated, significant barriers to trade remain, mostly because of imperfectimplementation of agreements, high border costs, restrictive rules of origin even

BEYOND COTONOU
269
within customs unions, and poor infrastructure. None of the four free tradeagreements involved in the EPA negotiations has unimpeded commerce among itsmembers.5 The existing customs unions are far from perfect; all, save the SouthAfrican Customs Union (SACU), still collect tariffs on internal trade and maintainother barriers to intraregional trade. Moreover, agreements on the reduction ofintraregional barriers—as well as on implementation of common external tariffs(CETs)—are rife with product exceptions and long “transition” periods.
Other internal barriers stem from the absence of common standards and systemsof certification and from inconsistent (and inconsistently applied) tax policies. Animportant internal agenda includes reaching agreement on product standards,mechanisms to ensure compliance and resolve disputes, mutual recognition oftrade policies, and adopting internally consistent rules of origin. All are prerequisitesfor effective regional integration.
Crucial role of MFN tariffsThe average tariffs of some countries of Sub-Saharan Africa are still two to threetimes higher than tariffs in the most competitive developing countries. Furthermore,because of (often prohibitive) peak tariff rates in many countries and the proclivityto apply these rates to all imports that compete with domestically produced goods,the protective effects of tariffs in the region are substantially greater than averagetariff rates suggest. High levels of protection mean that the European Union retainsmarket share despite higher costs—because of preferences.
Moving toward a CET is difficult in any political context—especially wherelarge differences in applied tariffs exist among members of the group. In the Easternand Southern African Region (ESA) group, average tariffs range from Madagascar’s4.6 percent to more than 20 percent for Burundi, the Seychelles, and Sudan (table 1).While tariffs are relatively similar for most of the ECOWAS countries, Nigeria’s arenearly three times those of (Union Économique et Monétaire Ouest Africaine)UEMOA. Moreover, Nigeria applies several bans on imports.
Differences emerge even more starkly when one looks at the structure of thetariffs that protect different categories of goods. Nigeria’s and Ghana’s unweightedtariff averages in several categories are compared to those of the UEMOA countriesin figure 1. On average Ghana’s tariffs exceed UEMOA’s by 1 percent, whereasNigeria’s tariffs exceed UEMOA’s by 17.8 percent. Figure 1 also shows that relativeprotection (protection on a particular category relative to average protection) differssignificantly between UEMOA, Nigeria, and Ghana, the three largest economies inECOWAS. In the Caribbean, tariff rates in the Bahamas are usually much higherthan in other countries (figure 2).
These patterns will complicate the introduction of a CET, for not only mustaverage tariff levels converge, but the structure of tariffs must converge as well.Defining a common list of sensitive products to be excluded from the negotiations

TRADE, DOHA, AND DEVELOPMENT: A WINDOW INTO THE ISSUES
270
Note: Names of least developed countries are printed in roman type: non-LDCs are initalics.a. Sao Tome is not a member of CEMAC.b. Mauritania is not a member of ECOWAS.Source: UNSD COMTRADE and UNCTAD TRAINS data for most recent years available,except as follows. Data for Djibouti, Fiji, Guinea, Rwanda, and the Solomon Islands arefrom WTO IDB. Data for The Gambia, Sierra Leone, and South Africa are from WTOTrade Policy Review. Data for Kenya, Tanzania, and Uganda are from EAC Secretariat.
Table 1. Tariffs in ACP countries by EPA constellationsSimple average
Simple average
CEMAC18.0 Antigua and Barbuda 9.6
Dominica 9.9Grenada 10.5
Sao Tome and Principe a) n.a. St. Kitts and Nevis 9.4St. Lucia 8.9St. Vincent and the Gren. 9.8
Bahamas, The 30.6UEMOA Barbados 13.1
12.0 Belize 10.5Guyana 11.0Haiti n.a.
Cape Verde n.a. Jamaica 7.2The Gambia 12.7 Suriname 17.5Ghana 13.1 Trinidad and Tobago 7.9Guinea 6.5 Dominican Republic 8.5Liberia n.a.Nigeria 30.0Sierra Leone 14.9 Cook Islands n.a.Mauritania b) 10.9 East Timor n.a.
Fiji 7.3Kiribati n.a.Marshall Islands n.a.
EAC Micronisia n.a.Kenya, Uganda 12.3 Nauru n.a.
Burundi 23.4 Niue n.a.Comoros n.a. Palau n.a.Djibouti a) 30.8 Papua New Guinea 6.0Congo, Dem. Rep. 12.0 Samoa n.a.
Eritrea 7.9 Solomon Islands 22.2Ethiopia 18.8 Tonga n.a.Madagascar 4.6 Tuvalu n.a.Malawi 13.1 Vanuatu 13.8Mauritius 18.4Rwanda 17.4Seychelles 28.3 SACUSudan 24.5 11.4Zambia 14.0Zimbabwe 16.4 Angola 8.8
Mozambique 12.1Tanzania (also EAC) 12.3
OECS
Benin, Burkina Faos, Côte d'Ivoire , Guinea-Bissau, Mali, Niger, Senegal, Togo
Cameroon , Central African Republic, Chad, Congo (Rep.), Gabon , Equ. Guinea
ECOWAS Group
Central African Group CARIFORUM Group
ESA Group
SADC Group
Pacific Group
Botswana , Lesotho, Namibia, Swaziland, South

BEYOND COTONOU
271
with the European Union will involve complex negotiations because protectiondiffers from country to country.6
Falling tariff revenueTariff revenues average 1 percent of GDP and 7–10 percent of government revenuein Sub-Saharan Africa, a heavy level of dependence. A few governments (includingthose of The Gambia and Cape Verde) count on tariffs for up to 20 percent of theirrevenue.
With EU products representing 40 percent of total imports in the region,eliminating all tariffs on EU imports would considerably lower tariff revenues—insome cases by as much as 15–20 percent of government revenue. The net effect onbudgets depends on the change in import structure and some additional factors.Trade diversion from external to EU suppliers would further increase the loss oftariff revenues, as the share of EU imports is expected to rise by 9 percent in themedian West African country (Busse and others 2004).7 Revenue losses as a shareof total government revenue in West Africa would be 5 percent or less in fivecountries, 5–10 percent in another five, and 10 percent or greater in four (Busse andothers 2004). Expected revenue losses differ by region. In SADC they would be lessthan 2.5 percent of total government revenue; in East Africa, between 0.7 and 11.8percent (table 2).
NigeriaGhana
-5 0 5 10 15 20 25 30 35 40
agriculture
minerals
chemicals, plastics
hides and skins
textiles, clothing
stone, ceramics
metals
machinery
miscellaneous
Percentage point difference in average tariff rates compared to UEMOA
Figure1. Nigeria’s tariffs are higher than Ghana’s or UEMOA’s
Source: UNCTAD TRAINS data base accessed through WITS; World Bank staff calculations.

TRADE, DOHA, AND DEVELOPMENT: A WINDOW INTO THE ISSUES
272
Although significant for a few countries, the revenue loss problem is easilyoverstated. First, the granting of tariff exemptions is widespread in Sub-SaharanAfrica. Eliminating those exemptions would limit revenues losses. Busse, Borrmann,and Grossmann (2004) find that on average tariff collections are 70 percent or less ofpotential tariff revenues for ECOWAS countries; collection efficiency was below 30percent in Ghana and below 40 percent in Guinea-Bissau. These figures suggestthat improvements in tariff administration could dampen the effect of reduced tariffrates. Second, the revenue effect of eliminating tariffs on imports from the EuropeanUnion could be limited by excluding from preferential liberalization those importsfor which the tariffs yield the most revenue. Third, to the extent that countries donot currently levy value-added tax (VAT) and excises on imports, they could imposethem (or improve the administration of existing taxes or raise them). Fourth, theimplementation period of the EPAs is likely to be 12 years or longer; with assistancein the form of aid for trade, there should be a reasonable amount of time forstrengthening other components of the public revenue system to offset reductionsin tariff revenues. Finally, the transition from a revenue system heavily dependentupon tariffs to one that is more broadly based and diversified is a necessary step forall countries integrating into the global economy. The aid for trade component ofthe EPAs could provide the opportunity to make the necessary transition withgreater technical and financial assistance than is normally available.
Bahamas
BarbadosJamaica
Dominican Republic
0 5 10 15 20 25 30 35 40
agriculture
minerals
chemicals, plastics
hides and skins
textiles, clothing
stone, ceramics
metals
machinery
miscellaneous
Average tariff rates by category (percent)
Source: UNCTAD TRAINS data base accessed through WITS; World Bank staff calculations.
Figure 2. Tariff peaks differ in CARIFORUM

BEYOND COTONOU
273
Services and the Singapore issuesTrade-related services are less efficient in Sub-Saharan Africa than in other regions.Fifty-two percent of firms report unreliable electricity supply as a constraint,compared with 42 percent in South Asia and 24 percent in East Asia and LatinAmerica (World Bank 2005). The Economic Report on Africa 2003 (UNECA 2003)comes to a similar conclusion: electricity and transport costs are seen by 65 percentof surveyed businesses as restrictively high. Charges for electricity,telecommunications, transport, and water are often higher in low-income countriesthan elsewhere, and access is limited. Prices are high and access low for othertrade-related services, as well—including financial and transport services. InBotswana and Zimbabwe, for example, charges for both air and sea freight are50–100 percent higher than in neighboring South Africa; telecommunicationscharges in Kenya and Botswana are 80 percent higher; and electricity charges in
Notes: a. Estimations using medium scenario of Busse and others (2004).b. Karingi and others (2005) report revenue shortfalls for all regions in monetary terms.Estimations provided here are expressed as a share of government revenue using most recentrevenue figures from IMF International Financial Statistics.Source: UNECA (2005), Nielsen (2005), Busse et al. (2004), Kaningi et al. (2005), UNECA(2004), Khandelwal (2004); IMF IFS.
Table 2: Revenue loss as a share of total government revenue as aresult of EPAs
UNECA (2005)
Nielsen (2005)
Busseet al.
(2004) a)
Karingi et al.
(2005)
UNECA
(2004)Khandelwal
(2004)ECOWAS ESA
Benin 6.7 9.7 8.6 Burundi 6.9Burkina Faso 6.1 4.2 5.6 Comoros 6.3Cape Verde 21.2 19.8 Kenya 7.7Cote d'Ivoire 5.6 8.1 4.6 Madagascar 1.9Gambia 16.7 21.9 Malawi 3.3Ghana 19.2 7.7 10.3 Mauritius 11.8Guinea 6.2 4.9 Rwanda 10.2Guinea-Bissau 19.4 4.1 5.6 Uganda 0.7Mali 4.5 8.1 3.8 Zambia 4.0Mauritania 7.1 6.3 SADCNiger 7.6 6.8 3.6 Angola 2.4Nigeria 2.3 3.3 2.5 Botswana 0.2Senegal 6.0 7.4 10.7 Lesotho 0.0Sierra Leone 8.5 Mozambique 1.5Togo 12.5 16.7 7.4 Namibia 0.5
CEMAC b) Swaziland 0.4Cameroon 10.6 Tanzania 2.3 1.1Congo 11.7Chad 13.6

TRADE, DOHA, AND DEVELOPMENT: A WINDOW INTO THE ISSUES
274
Botswana are 300 percent higher than in South Africa. Access to telephone servicesremains low, with the number of mobile phone subscribers averaging 58 per 1,000inhabitants in 2002 (and ranging from 0.2 in Niger to 447 on the Seychelles).
Regional integration can help overcome these problems. In some regions,markets are too small to realize full economies of scale in network services and theirregulations. Already the ECOWAS countries, for example, are exploring a powerpooling arrangement. Second, regions can establish a regulatory framework thatallows for greater potential competition, with positive effects on prices and efficiency.But implementation of regional programs has been fitful. EPAs, properly designed,might help bring them to fruition.
Related to services, the Cotonou Agreement envisages that investment,competition, transparency in government procurement, and trade facilitation—theso-called Singapore issues—will be included in EPAs. Trade facilitation is broadlyaccepted, but there is little agreement yet between the European Union and theACP countries on how to approach the other three in the EPA negotiations. Severalgovernments in Africa have taken the position that because they have been droppedfrom the global agenda, they should also be left off the EPA agenda.
Infrastructure and institutions: aid for tradeA significant constraint to export expansion evident in all diagnostic studies of theACP countries is the inadequacy of roads, railroads, ports, and trade-relatedinstitutions. These inadequacies saddle exporters with high costs of inputs, hightransport costs, and costly delays in reaching global markets. Increased donordevelopment assistance can alleviate these supply-side constraints.
The European Union has pledged an additional €300 million annually in aid fortrade, bringing its annual giving to €1 billion. However, it has steadfastly insistedthat additional assistance should not be discussed in the EPA negotiations for fearof turning a discussion of policies into a negotiation over money. While this concernis understandable, the tactic has left negotiators from the EPA groups with diminishedincentives to engage in the process and without the certainty that an EPA agreementwill contain provisions to address supply-side constraints.
Risks of a poorly structured EPA—and alternatives to anagreementBecause tariffs are relatively high and internal barriers within groupings still prevalent,enacting EPAs without prior action on these issues could result in a hub and spokepattern of trade integration, trade diversion, and, in a worst-case scenario, netlosses of income. Karingi and others (2005) estimate that the amount of tradediversion would be significant if undertaken without modifications to existing MFNtariff structures even though, on balance, more trade would be created. (The authorspoint out that their estimations are partial and exclude services, so the results must

BEYOND COTONOU
275
be treated with caution). Without action on external and internal barriers, giving EUfirms preferential access to ACP markets could well divert trade to EU producersfrom more efficient producers based, say, in Asia, nearby African countries, andeven the United States. If there is insufficient competition among EU suppliers,liberalizing trade with the European Union might not lead to lower consumer pricesbut rather to a transfer of tariff revenue to EU producers. This risk is aggravated bythe fact that many national markets in Africa are small and costly to reach.Competition for such markets, which are often dominated by a single externalsupplier, is not likely to increase after the implementation of the EPAs. Therefore, incases where external tariffs are still high, ACP countries will need to reduce thosetariffs on an MFN basis before implementing preferential reductions in tariffs onimports from the European Union.
Out of 46 African countries, 33 are least developed countries (LDCs) thatqualify for preferences under the European Union’s Everything But Arms (EBA)program. This initiative grants duty-free, quota-free access to the EU market, leavingthe LDCs with little incentive to join the EPAs. For the non-LDCs, signing EPAswould maintain access to EU markets or increase it to include those products notcovered by the Cotonou Agreement (a total of 919 tariff lines in sensitive sectors).Without an EPA, non-LDC countries would revert to GSP preferences, whichgenerally have narrower product coverage and lower preference levels. The effecton economic growth when switching from Cotonou-type to the General System ofPreferences (GSP), however, is not likely to be large for most non-LDCs. Hinkle andNewfarmer (2005) find that the value of the tariff savings under Cotonou as comparedto GSP was substantial for only three non-LDC countries in 2002. Those valueswere 16 percent for the Seychelles (fish), 20 percent for Mauritius (sugar and knitgarments), and 39 percent for Swaziland (meat). Moreover, because senior EU officialshave indicated that no ACP country would see its market access reduced if theCotonou preferences were to expire without an EPA being signed, the EuropeanUnion may look for other ways to maintain open markets rather than revert to theGSP. Nonetheless, reversion to the GSP could inhibit diversification to the extentthat new product exports did not automatically qualify for the GSP. If the alternativeto concluding an EPA were simply a (temporary) return to GSP or EBA preferences,the ACP countries would lose relatively little in terms of market access.
However, if governments were to opt out of the EPA negotiation process, theywould miss a potentially valuable opportunity to spur regional integration and togain greater access to the EU.
A spur to regional integration—and integration with the worldAn important contribution that EPAs could make to ACP development would be tospur adoption of policies that speed both regional integration and integration withthe global economy. To achieve this objective, policy-makers in the various regional

TRADE, DOHA, AND DEVELOPMENT: A WINDOW INTO THE ISSUES
276
groupings have to adopt a comprehensive strategy that harnesses the EPA processto domestic reforms needed to promote integration, improve competitiveness, andaccelerate growth. This requires that the regional groupings work together informulating programs of outward-oriented regional integration, and then forgingthis into a strategy that links these to the EPA timetable. This strategy would allowgovernments to lever domestic reforms to the cause of greater market access to theEU.
EPAs and market accessEPAs can offer ACP countries two important improvements in market access overthe EBA-plus-GSP alternative: more favorable rules of origin and certainty ofaccess. The European Union has long posited that the goal of the demanding rulesof origin under both the Cotonou Agreement and the European Union’s GSP (andhence EBA) is industrial development and integration in beneficiary countries. Buttwo decades of restrictive rules of origin have not induced integrated industrialdevelopments in ACP countries or contributed to more dynamic export performance.They have not led to the emergence of an efficient ACP-wide textile industry, despitethe presence of cotton producers in the ACP group. Generally the penalty for usingeligible inputs (lower quality, higher prices) often exceeds the benefits of EUpreferences, while the small size of most ACP markets makes vertical integrationuneconomic. Even when it is economically feasible to comply with the productionrequirements of the European Union’s rules of origin, problems in proving origindue to weak customs controls and costly documentation requirements have stoppedexporters from taking advantage of preferential access. As a result of this and otherfactors, exports of ACP countries have remained concentrated in few, mainlyunprocessed products.
If EPA groups could obtain more favorable rules of origin under EPAs, theycould markedly improve their access to the EU market. Moreover, even the prospectof change would encourage both LDCs and non-LDCs to pursue EPA negotiations,since less restrictive rules could, among other things, facilitate the export of clothing,as the U.S. African Growth and Opportunity Act (AGOA) has done. A uniformcriterion of 10 percent value added—as proposed by the Blair Commission forAfrica—or a simple change-of-tariff-heading rule could significantly increase exportopportunities for ACP countries. Allowing global cumulation from all otherdeveloping countries, including ACP neighbors outside the EPA, would furtherspur exports.8
EPAs can also provide greater certainty of market access than can voluntarypreferences. Enrollment of a product in the positive lists under the GSP is subject toperiodic review and withdrawal, creating uncertainty that deters the privateinvestment needed to diversify export production in the ACP countries. AlthoughEBA preferences last for as long as a country remains an LDC, successful exporting

BEYOND COTONOU
277
countries can, as experience has shown, quickly graduate from LDC status andthus to the less favorable GSP.
Eight elements of a pro-development EPA strategyTo realize these twin objectives of accelerated integration and greater market accessto the EU, a pro-development EPA could be structured around the following eightelements, all fundamental to the development strategies of the countries involved:• A 10 percent value-added rule as a nonrestrictive rule of origin. If the value-
added requirement is higher, cumulation rules should be global to allow ACPproducers maximum access to the world’s lowest-cost inputs and to avoidputting regional suppliers outside the EPA group at a disadvantage.
• Additional aid for trade. This should take the form of a program of technicaland financial assistance for trade facilitation, sanitary and phytosanitarystandards, and other supply-side measures (such as infrastructure). Puttingadditional aid for trade on the table as part of an EPA negotiation could increasethe incentive of all countries to enter into an arrangement.
• MFN reductions in external tariffs. MFN reductions in external tariffs shouldbe phased in, consistent with regional development programs.
− Phases 1 and 2: Promote internal trade by progressively eliminating allinternal barriers within customs unions and, for free trade agreements,adopt common nonrestrictive rules of origin.− Phases 1 and 2: Reduce MFN peak tariffs to the average levels topromote intra-African and other efficient trade with third parties.− Phases 2 and 3: Reduce to East Asian levels average levels of MFNtariffs within the EPA grouping.− Phase 3: Enact EU preferences. Making this the final step lessens therisks of trade diversion and hub-and-spokes development.
• Reform of tax administration and intraregional tax policy. A program toharmonize tax structures through gradual but purposeful reform of taxadministration and intraregional tax policy would promote regional integrationand replace lost tariff revenues. Such a program could complement tariff andcustoms reforms at the regional level, with support through new aid for trade.
• Liberalized trade in services. A phased, region-specific program of servicesliberalization could expand access to efficient trade-related services, such astelecommunications, electricity, and transport. To avoid entrenchingmonopolies, liberalization should be done on an MFN basis.
• Trade facilitation. A program of trade facilitation measures—for example,improvements in customs, ports, border posts—should be linked to intraregionalprograms to lower the costs of trading, with special attention to lowering thetransit costs of landlocked countries. The program, a high priority for all regions,

TRADE, DOHA, AND DEVELOPMENT: A WINDOW INTO THE ISSUES
278
should include specific benchmarks for implementation.• Temporary movement of persons. The temporary movement of persons to supply
services (mode 4 of the General Agreement on Trade in Services), although notpart of the current EPA negotiations, may be easier to deal with in regionalarrangements than in multilateral talks.
• Rules on investment and intellectual property rights (IPR). EPAs could includenew IPR rules and rules on investment, but these should be calibrated inaccordance with a region’s capacity to implement them—and to benefit fromthem. Agreements could include competition policies consistent with nationaldevelopment strategies and in accordance with a region’s implementationcapacity.
ConclusionThe European Union and the ACP countries will have to work hard to achieve pro-development EPAs. Time is short, and much remains to be done. To succeed, theEuropean Union must subordinate narrow commercial interests to its broaderinterests in supporting economic growth and regional integration in the ACPcountries. It must be willing to provide greater market access through nonrestrictiverules of origin, to expand aid for trade, and defer its own preferences in ACP marketsuntil important MFN liberalization has occurred there. Strong cooperation betweentrade negotiators and development experts of the EU would help to put developmentat the center of the EPAs and increase coherence of EU development policies. Fortheir part, each EPA grouping must use the negotiating process to put forwardinternal reforms to promote their own competitiveness, regional integration, andgrowth, and to be willing to lock-in a program of implementation consistent with itsown development priorities and pace of reform.
Notes1. Investment, competition, transparency in government procurement, and trade facilitation
have become known as the “Singapore issues.”2. Four of the ACP countries, Cuba, East Timor, Somalia, and South Africa, will not sign any
EPA agreement.3. There are some still unresolved issues concerning the EPA country groupings, especially
among the two groupings in southern and eastern Africa. Several countries are members of boththe Common Market of Eastern and Southern Africa (COMESA) and the Southern AfricanDevelopment Community (SADC). Tanzania withdrew from COMESA in 2000 and elected tojoin the SADC EPA group. However, it also entered into the East African Community (EAC), acustoms union with Kenya and Uganda, both of which elected to join the ESA EPA group. Unlessthe key provisions of the SADC and ESA EPAs turn out to be identical, Tanzania will either haveto withdraw from EAC or switch to the ESA EPA grouping. The latter step is apparently underconsideration and is strongly encouraged by the European Commission and the EAC secretariat.

BEYOND COTONOU
279
In addition, South Africa’s existing free trade agreement with the European Union complicatesEPA arrangements in southern Africa. Four (Botswana, Lesotho, Namibia, and Swaziland) of theseven member of the SADC EPA group also belong to the South African Customs Union (SACU)along with South Africa. South Africa is not eligible for an EPA under the Cotonou Agreementbecause its economy is larger and more advanced than those of the other countries of Sub-Saharan Africa. However, the EU–South Africa free trade agreement applies de facto to the fourother members of SACU, which share the SACU common external tariff with South Africa. Thatagreement cannot be amended without the consent of South Africa. It appears that special, adhoc EPA arrangements will need to be made for the SACU countries.
4. Aggregated COMTRADE data, available through WITS.5. The four are COMESA, SADC, the Economic Community of West African States (ECOWAS),
and Central African Economic and Monetary Union (CEMAC).6. An analysis of MFN tariff rates for Nigeria and the UEMOA at the six-digit level indicates
that while the correlation of tariff rates is high (0.61), correlation of tariffs for those tariff lineswhere either of the two countries has an above-average tariff is very close to zero (–0.01)—andonly 0.10 for those tariff lines where UEMOA exceeds its average tariff rate. This indicates thatthe two schedules protect different goods. Correlation coefficients for the protected tariff linesin the ESA grouping are very low, ranging from 0.14 to 0.7, with most around 0.5. TheSeychelles have a particularly low correlation coefficient with all other countries, at about 0.25.Analysis of the SADC region leads to similar results. Tariff data for all countries is available for4,618 six-digit tariff lines; correlation coefficients are 0.47 (Angola/SADC), 0.59 (Mozambique/SADC), and 0.52 (Tanzania/SADC). For the Caribbean, they are generally higher, with theexception of the Bahamas, which shows negative coefficients with all other countries. There areonly 46 tariff lines where all countries have tariff peaks, while in 90 percent of all tariff lines atleast one country has a tariff peak. In the four African EPA groupings, there is little overlap inhigh-tariff products that member countries wish to exclude from liberalization (Stevens andKennan 2005). These divergences indicate that negotiations for the common list of products tobe excluded for each EPA grouping will be tough.
7. However, lower tariffs will translate into lower consumer prices only if EU suppliers operatein reasonably competitive markets, an assumption that cannot be taken for granted. If con-sumer prices of imports from the European Union do not fall, the demand for nonpreferentialimports will remain unchanged. In that case, trade diversion will not occur, and there will be noadditional loss of tariff revenues.
8. For more on rules of origin, see “Enhancing Trade Preferences for LDCs: Reducing theRestrictiveness of Rules of Origin” in this volume.
ReferencesBrenton, P. 2003. “Integrating the Least Developed Countries Into the World Trading Sys-
tem—The Current Impact of EU Preferences Under Everything But Arms.” Journal of WorldTrade 37(3): 623–46.
Busse, M., A. Borrmann, and H. Großmann. 2004. “The Impact of ACP/EU Economic Partner-ship Agreements on ECOWAS Countries: An Empirical Analysis of the Trade and BudgetEffects.” Institut für Wirtschaftsforschung, Hamburg.
Castro, L., Ch. Kraus, and M. de la Rocha. 2004. “Regional Trade Integration in East Africa:Trade and Revenue Impacts of the Planned East African Customs Unions.” Africa RegionWorking Paper 72. World Bank, Washington, DC.
Hinkle, L. E., and R. Newfarmer. 2005. “Risks and Rewards of Regional Trading Arrangementsin Africa: Economic Partnership Agreements (EPAs) Between the EU and SSA.” Develop-ment Economics Department, World Bank, Washington, D.C.
Hinkle, L. E., and M. Schiff. 2004. “Economic Partnership Agreements Between Sub-Saharan

TRADE, DOHA, AND DEVELOPMENT: A WINDOW INTO THE ISSUES
280
Africa and the EU: A Development Perspective.” World Economy 27(9): 1321–33.Karingi, S., R. Lang, N. Oulmane, R. Perez, M. Sadni Jallab, and Hakim Ben Hammouda. 2005.
“Economic and Welfare Impacts of the EU-Africa Economic Partnership Agreements.”ATPC Work in Progress 10, United Nations Development Program, New York.
Khandelwal, P. 2004. “COMESA and SADC: Prospects and Challenges for Regional TradeIntegration.” WP/04/227, International Monetary Fund, Washington, DC.
Munalulu, T., C. Cheelo, S. Kamocha, and Nkanga Shimwandwe. 2004. “Revenue Impacts of theEconomic Partnership Agreement Between the European Union and Eastern and SouthernAfrican Countries.” Second draft of unpublished paper. COMESA, Lusaka, Zambia.
Nielsen, L. 2005. “ECOWAS—Fiscal Revenue Implications of the Prospective Economic Part-nership Agreement with the EU.” Unpublished paper, International Monetary Fund, Wash-ington, DC.
Stevens, C., and J. Kennan. 2005. “EU-ACP Economic Partnership Agreements: The Effect ofReciprocity.” IDC Briefing Paper, Institute of Development Studies, University of Sussex.
UNECA. 2004. “The EU-SADC Economic Partnership Agreement: A Regional Perspective.”Unpublished paper. Trade and Regional Integration Division, Addis Ababa.
———. 2005. “Assessment of the Impact of the Economic Partnership Agreement between theECOWAS Countries and the European Union.” ECA/TRID/EPAS/49/05, Addis Ababa.
World Bank. 2005. World Development Report 2005—A Better Investment Climate For Every-one. Washington, DC.

Enhancing Trade Preferences for LDCs: Reducing theRestrictiveness of Rules of Origin
Paul Brenton
23
The 2001 Doha ministerial declaration reaffirmed WTO’s commitment to theleast developed countries (LDCs) through trade preferences and trade-relatedtechnical assistance. The declaration lays down the objective of “duty-free,
quota-free market access for products originating from LDCs” and pledges to“consider additional measures for progressive improvements in market access forLDCs” (paragraph 42). How the terms in the first objective are defined and enforcedis crucial in determining how much market access preferences actually provide. TheEuropean Union’s Everything But Arms agreement (EBA) provides an example.EBA offers duty- and quota-free access to LDCs.1 But the rules that it imposes2 todefine whether a product in fact originates in an LDC and is therefore eligible forpreferences are very restrictive. Other preference schemes have similarly restrictiverules of origin. A move to less restrictive rules would bring significant improvementsin market access for LDCs.
Here we concentrate on the rules of origin for EU preferences, which are currentlybeing reviewed. The review offers an opportunity for the European Union to enhancethe preferences that it offers to developing countries, especially the least developed.However, there is plenty that other developed countries can do to improve theirtrade preference schemes. For example, the U.S. generalized system of preferences(GSP) excludes a wide range of products of relevance to LDCs. The African Growthand Opportunity Act (AGOA) includes some of these products, such as clothing,while excluding others—among them textiles and certain agricultural products—aswell as all products from LDCs not covered by AGOA. Thus there is still much thatthe United States could do to achieve the objective set forth in the 2001 Dohaministerial declaration, starting with a review of the rules of origin applied in theGSP and AGOA.
The nature of the rules of originRules of origin ensure that only products from beneficiary countries are grantedtrade preferences by preventing trade deflection, whereby products fromnonbeneficiary countries are transshipped through the beneficiary (with minimalprocessing) so as to avoid the payment of tariffs. Avoiding trade deflection is in theinterest of the country that grants the preference as well as the one that receives it.However, rules of origin for trade preferences are set by the preference-grantingcountry, and are often manipulated to achieve other objectives, such as protectingdomestic producers. When domestic interests are allowed to influence the scope
281

TRADE, DOHA, AND DEVELOPMENT: A WINDOW INTO THE ISSUES
282
and terms of rules of origin, the outcome tends to be far more restrictive than isnecessary to prevent trade deflection. Too often, the result is that market access forthe beneficiaries is limited, and the objective of promoting developing-countryexports is undermined. In practice, products that are important for many developingcountries—such as textiles, clothing, and processed agricultural products—areoften excluded from preference schemes (pointing to the need for duty-free accessfor all products). When preferences are made available for sensitive products, theyare usually accompanied by particularly restrictive rules of origin.
When a product is produced in a single stage or is wholly obtained in thebeneficiary country then its origin is relatively easy to establish. In all other casesrules of origin must specify the methods to be used in ascertaining that the producthas undergone sufficient working or processing or been subject to a substantialtransformation in the beneficiary country. Such tests are designed to determinethat products have not been transshipped from a nonqualifying country or beensubject to only minimal processing. The higher the level of working that is requiredby the rules of origin, the more difficult they are to satisfy and the more theyconstrain market access (relative to what would be required simply to prevent tradedeflection).
For many products, and for almost all sensitive products, the current EU rulesof origin link the implied definition of ”substantial transformation” to the sourcingof raw materials.3 Thus, a clothing producer in Africa who imports fabrics from Asiamay not receive preferences. A cannery may not use fish originating from outsidethe preferred jurisdiction. A producer of bakery products may not use importedflour. In effect, the rules of origin deny producers in developing countries freedomto choose the source of their inputs, which often means that production capacitiesthat could have had a substantial economic and development impact are deniedpreferential access to the European Union. In some cases it may mean that investmentin such capacities may not take place.
If needed inputs are competitively produced by local firms, exporters will alwayssource locally to avoid transport and other trade-related costs. However, if the rightinputs are not available locally at a competitive price, then producers must look tooverseas suppliers. When rules of origin prohibit the use of imported inputs theymay force exporters to use materials of higher cost, thus undermining their ability tocompete in global markets. The aim of trade preferences, of course, is to stimulateexports and export diversification in beneficiary countries and so to provide aboost toward achieving global competitiveness and sustainable economic activity.That objective can be completely undermined by rules of origin that dictate the useof high-cost inputs.

ENHANCING TRADE PREFERENCES FOR LDCs
283
The opportunity for reform in the European UnionThe reform of rules of origin currently being considered by the European Union isa critical opportunity to support exporters in the LDCs. EU trade preferences wouldbe considerably enhanced if producers in small developing countries were allowedto choose freely the source of the inputs they require, a freedom denied by thecurrent rules. The opportunity to give meaning to existing preferences will be lost,however, if protectionist interests succeed in maintaining or even increasing therestrictiveness of the rules of origin
The current EU rules of origin are product-specific, sometimes complex, andoften restrictive. Their restrictiveness is reflected (a) in low utilization rates ofpreferences and (b) the significant expansion of exports under other preferenceschemes that have more liberal rules. They are particularly restrictive with respectto products of comparative advantage for Africa and low-income countries, namely,processed agricultural products and clothing.
Restrictive rules of origin lead to underutilization of preferencesFor those LDCs that are eligible for the EBA but for no other EU preference scheme,4
less than 50 percent of the available EBA preferences are utilized. The principalexport of Bangladesh to the European Union is clothing, yet exporters requestpreferences for only half of their clothing exports. Why? Because to be competitivethey must use the cheapest and most appropriate fabrics. The best source of suchfabrics may be China, but EU rules of origin disqualify from preferences clothingmade from Chinese fabrics.
Utilization rates for certain ACP countries, which may choose between GSP/EBA and the Cotonou Agreement, can be higher. However, these data can bemisleading. The EU’s restrictive rules of origin for key products such as clothingcan be prohibitive for small, low-income countries, keeping them out of the marketaltogether. Utilization rates show the share of actual exports that are eligible forpreferences but do not request them. They do not capture the potential exportcapacities stifled by restrictive rules of origin. The differential supply responses inAfrica to U.S. and EU preferences for clothing illustrate this principle. Liberal rulesof origin have strongly stimulated U.S. imports of clothing from African LDCs,while EU imports have stagnated because of strict rules of origin (figure 1).
Restrictive rules of origin constrain export diversificationClothing can be a key sector for export diversification, and thus for development.By manufacturing clothing, developing countries can exploit their comparativeadvantage in low-labor-cost operations. Advanced technology is not required,start-up costs are comparatively small, and scale economies are not important— allof which favor production in locations with low labor costs. Current EU rules forclothing, however, prohibit the use of imported fabric. To obtain preferences, clothing

TRADE, DOHA, AND DEVELOPMENT: A WINDOW INTO THE ISSUES
284
producers must use local or EU fabrics (or fabrics from countries with whichcumulation is permitted). They may not use fabrics from the main fabric-producingcountries in Asia and still qualify for EU preferences—a binding restriction, sincefew countries in Africa have competitive fabric industries.
Since 2000, with the passage of AGOA, the United States has offered preferenceson imports of clothing from African countries under much more liberal rules oforigin: making up fabric into clothing is sufficient to confer origin. The U.S. ruleallows African clothing manufacturers flexibility in sourcing fabrics.5 In the face ofrestrictive rules of origin, EU imports of clothing from African LDCs are lower in2004 than they were in 1996, while U.S. imports have flourished, increasing 10 foldsince 1996 and are now almost four times greater than the value of EU imports ofclothing from African LDCs (see figure 1).
The rapid increase in exports from African LDCs to the United States has hada negligible impact on the U.S. market, where African LDCs still account for littlemore than 1 percent of total U.S. imports of clothing and a much smaller proportionof total U.S. consumption of clothing products. Even so, the United States does notoffer comparable access to all LDCs; those in Asia are still excluded. Further, thethird-country fabric rule of AGOA is due to be removed in 2007, before manycountries in Africa have had the opportunity to benefit and with detrimental impacton those that have been able to do so. The general rule of origin for the U.S. GSPand AGOA is a value-added requirement of 35 percent, which is likely to be verydifficult for many small developing countries to meet in the absence of rulescomparable to the AGOA third-country fabric rule, because the higher the
0100200
300400500600
700800900
1996 1997 1998 1999 2000 2001 2002 2003 2004
EU Imports of clothing from African LDCs
US Imports of clothing from African LDCs
Figure 1. With liberal rules of origin, US clothing imports surge
Source: USITC Dataweb and EUROSTAT.
US $ million

ENHANCING TRADE PREFERENCES FOR LDCs
285
value-added requirement, the more difficult it is for low labor cost countries tosatisfy the rule relative to countries with higher labor costs.
If the full market-opening opportunities of EBA and the EU’s GSP are to berealized, a significant relaxation of EU rules of origin will be required. Recognizingthat rules of origin have constrained the developmental impact of the GSP, theEuropean Commission has proposed a value-added rule to define origin for allproducts. A preferable alternative, would be to give developing countries, especiallyLDCs, the flexibility of satisfying either a value-added rule or achange-of-tariff-heading requirement. At what level should the value-addedrequirement be set and what degree of cumulation should be allowed? The BlairCommission proposed a value-added requirement on all products of no more than10 percent, which would allow African exporters the flexibility to source inputs andto exploit their comparative advantage in labor-intensive products.
The issue of cumulationCumulation is an instrument that allows producers to import materials from a specificcountry or regional group of countries without undermining the origin of theirproduct. In so doing, it offsets the restrictiveness of a particular set of rules oforigin. However, as long as the most efficient producer of the required inputs isexcluded from the area of cumulation then the offset will be partial and may well beworthless. We have no strong empirical evidence of the importance of cumulationprovisions, but the information we do have does not suggest a strong impact.6
If the value-added requirement is low enough, there is no need for cumulation.If it is high, then the rules must allow for global cumulation if LDCs are to be able toexploit their comparative advantage. With global cumulation, inputs from anydeveloping country, including China, would count as qualifying content. CurrentEU proposals for limited regional cumulation are likely to do little to mitigate therestrictiveness of high value-added requirements. Global cumulation, by contrast,would allow sourcing of inputs from regional partners and help promote regionalintegration; by not limiting cumulation to the region, it also would avoid excludingthe lowest-cost source of inputs.
However, a low value-added requirement (10 percent) common across allproducts would be more transparent, simpler for firms to satisfy, and easier toadminister by customs and other agencies. Setting a high value-added requirement(such as 40–50 percent) and allowing limited regional cumulation is most unlikely toprovide for a substantial easing of the rules of origin. It could even make themmore restrictive.
Fears that a low value-added requirement or global cumulation would benefitmainly China are overstated. In fact, the benefits to China probably would be verysmall. Many producers in developing countries already choose to use Chineseinputs, because the cost penalty of not using the least expensive inputs is often

TRADE, DOHA, AND DEVELOPMENT: A WINDOW INTO THE ISSUES
286
greater than the tariff preference. Restrictive rules of origin and limited cumulationwill not induce these producers to use other sources of inputs. By contrast, a lowvalue-added requirement (or global cumulation) will allow developing-countryproducers that have chosen for competitive reasons to use Chinese inputs toreceive preferences and, in principle, realize higher returns for their exports. Ifcompetitive inputs are available locally they will always be used. Global cumulationwill benefit China only in cases where producers previously sourced inputsdomestically or from a country in an area of cumulation solely for the purpose ofreceiving preferences.
ConclusionsReform of the rules of origin governing preferences offers the European Union acrucial opportunity to improve market access for LDCs and other developingcountries and to enhance the value of their trade preferences.
Current EU rules of origin severely limit the ability of producers in smalldeveloping countries to source inputs on a global basis and still receive preferences.Trade preferences should be designed to help countries reach global competitivenessin industries in which they have a comparative advantage. In the globalized economysuch competitiveness must be based on the freedom to source inputs from the mostsuitable and least expensive location. The global market exacts a high penalty onproducers that use inappropriate or high-cost inputs.
The U.S. experience with AGOA shows that a bold approach to rules of origincan provoke substantial supply responses from developing countries and helpthem build a more diversified export base.
By reforming the rules of origin for LDCs to provide a value-added requirementof no more than 10 percent across all products in the EBA (with the alternative ofsatisfying either the value-added rule or a change-of-tariff-heading requirement),the European Union would widen access to its market in a manner consistent withthe Doha process and with the ongoing adjustment to the expiration of quotas ontextile and clothing products. If a beneficiary country feels that this is notcommensurate with its development objectives they should be allowed to petitionfor a permanent derogation of more restrictive rules on their exports to the EuropeanUnion.
Similar arguments apply to Japan and the United States, which could enhancethe preferences they offer by broadening product and country coverage to provideduty- and quota-free access for all products produced by all LDCs, and also byreviewing the effectiveness of their rules of origin in stimulating the exports ofLDCs.

ENHANCING TRADE PREFERENCES FOR LDCs
287
Notes1. The vast majority of products exported by LDCs to the European Union were already
eligible for duty- and quota-free access under existing provisions of the GSP.2. There are no multilateral rules or disciplines on preferential rules of origin. An attempt was
made in the Uruguay Round to harmonize nonpreferential rules of origin, which define origin forpurposes of basic trade-policy measures such as the application of tariffs, the marking of goods,and the collection of statistics, and for use in contingent protection (such as antidumping,countervailing, and safeguard measures). Some progress has been made on these rules, but thenegotiations have bogged down, and several deadlines for the completion of the work programhave been missed.
3. Block and Grynberg (2005) draw this out very clearly for processed fish.4. Afghanistan, Bangladesh, Bhutan, Cambodia, Laos, Maldives, Nepal, Yemen.5. Initially, South Africa and Mauritius were excluded from the more liberal rule of origin. They
faced a far more restrictive NAFTA-type rule requiring production from fiber. Mattoo andothers (2004) show how the more liberal rules for clothing could increase the gains to theseexcluded countries by as much as a factor of five. Mauritius subsequently lobbied hard to becomeeligible for the less-restrictive rule.
6. See, for example, UNCTAD and Commonwealth Secretariat (2001).
ReferencesBlock, L and R. Grynberg. 2005. “EU Rules of Origin for ACP Tuna Products” HS Chapter
16.04). mimeo. Commonwealth Secretariat, London.Mattoo, A., D. Roy, and A. Subramanian. 2002. “The African Growth and Opportunity Act and
Its Rules of Origin: Generosity Undermined?” World Economy 26: 829–51.UNCTAD (U.N. Conference on Trade and Development) and Commonwealth Secretariat.
2001. “Duty and Quota Free Market Access for LDCs: An Analysis of Quad Initiatives.”London and Geneva: UNCTAD and Commonwealth Secretariat. http:/192.91.247.38/tab/otherpubs.asp.


Tightening TRIPS: Intellectual Property Provisions of U.S. Free Trade Agreements
Carsten Fink and Patrick Reichenmiller
24
Over the past few years, the United States has pursued bilateral and re-gional free trade agreements (FTAs) in different parts of the world (table 1).This has marked a considerable shift in U.S. international trade diplomacy.
While the U.S. Government entered into regional trade agreements in the past—notably in the case of the North American Free Trade Agreement (NAFTA)—itrelied mostly on the multilateral trading system to advance the progressive openingof world markets and to create legally enforceable trading rules.1
Prominent in the recent set of bilateral FTAs are strong rules for the pro-tection of intellectual property rights (IPRs), a key market access interest of theUnited States—supported by private sector constituents who derive significantrevenues from exports of intangible assets. Indeed, the trade promotion authority,under which these agreements were negotiated aims explicitly to promote intellec-tual property rules that “reflect a standard of protection similar to that found inUnited States law.”2 U.S. trading partners generally have more defensive negotiat-ing interests in intellectual property, but they are willing to commit to strongerintellectual property rules as a quid pro quo for concessions in other areas—notably preferential access to U.S. markets for agricultural and manufactured goods.
This note offers an overview of key elements of recent U.S. FTAs that gobeyond multilateral standards on intellectual property as set forth in the Agreement
Table 1. Recent U.S. free trade agreements
a. The U.S. bilateral agreement with Vietnam is not a free trade agreement, but a bilateralagreement intended to establish normal trade relations under U.S. trade law. It is included inthis note for purposes of comparison. The United States has signed similar agreements withother countries, such as Cambodia and Laos.
Signed and approved by U.S. Congress
Signed but not yet approved by U.S.
Under negotiation
Vietnam (2001) a Andean countries (Bolivia, Colombia, Ecuador, Peru)
Jordan (2001) ThailandSingapore (2003) PanamaChile (2003) Southern African Customs UnionMorocco (2004) Free Trade Area of the AmericasAustralia (2004)DR-CAFTA (Dominican Republic, Costa Rica, El Salvador, Guatemala, Honduras, Nicaragua) (2005)
Bahrain
289

TRADE, DOHA, AND DEVELOPMENT: A WINDOW INTO THE ISSUES
290
on Trade-Related Aspects Intellectual Property Rights (TRIPS). It also offers aperspective on the intellectual property bargain in trade agreements, outlines keyeconomic and social implications from the adoption of new intellectual propertystandards, and discusses several lessons learned.
Where do U.S. FTAs go beyond the TRIPS standards?The IPR chapters of recent U.S. FTAs include provisions that affect all types ofintellectual property instruments and the mechanisms available to administer andenforce exclusive rights. Although the detailed provisions differ from agreement toagreement, there are certain common obligations which go beyond the TRIPSstandards (table 2).
Protection of patents and pharmaceutical test dataAs in TRIPS, all of the FTAs listed in table 1 provide for a patent term of 20 years.However, they also require that the patent term be extended in the event of delayscaused by regulatory approval processes, such as obtaining approval for marketinga new drug. In addition some agreements call for extensions for delays in thegranting of the patent itself.
Three agreements (U.S.–Australia, U.S.–Morocco, U.S.–Bahrain) extend thescope of patentability by mandating that patents must be available for new uses ofknown products. All bilateral agreements go beyond TRIPS in enhancing patentprotection for plants and animals. The strongest agreement in this regard isU.S.–Morocco, which explicitly mandates patent protection for life forms. Othersdo not exempt plants and animals from patentability, an option provided underTRIPS. The weakest agreement is the one with the Dominican Republic and sixCentral American countries (U.S.–DR–CAFTA), which simply calls for “reasonableefforts” to provide for patentability of plants.3
In the area of medicines, the bilateral agreements contain provisions that limitthe ability of governments to introduce competition from generic producers. First,to override the market exclusivity of patent holders, governments must grant so-called compulsory licenses to generic manufacturers. TRIPS allows the use ofcompulsory licenses without specifying the grounds for issuing them. Four of thebilateral agreements (with Australia, Jordan, Singapore, and Vietnam) limit the useof compulsory licensing to emergency situations, antitrust remedies, and cases ofpublic noncommercial use.4
Second, to make effective use of compulsory licenses, generic drugmanufacturers must be able to obtain regulatory permission to enter the market.Provisions in the bilateral agreements impose an obstacle in this respect. All buttwo agreements (those with Jordan and Vietnam) prohibit the signatories fromapproving the marketing of a generic drug during the patent term without theconsent of the patent holder—an issue on which TRIPS imposes no obligation. In

TIGHTENING TRIPS
291
other words, compulsory licenses may become ineffective in introducing competitionfrom generic drug makers.
Third, obtaining marketing approval for drugs requires the submission of testdata on a drug’s safety and efficacy to regulatory authorities. Such data is protectedby separate legal instruments that differ from country to country. The TRIPSagreement requires only that test data be protected against “unfair commercialuse.” By contrast, most of the bilateral agreements mandate exclusivity of test data,as under U.S. law. Once a company has submitted original test data, no competingmanufacturer may rely on those data for a period of five years to support a requestfor approval for its own drug.5 The compilation of new test data by competingmanufacturers may take several years and be prohibitively expensive. For thatreason, test-data exclusivity may pose a second obstacle for governments to makeeffective use of compulsory licensing.
Several of the bilateral agreements go further on data exclusivity. Whenpharmaceutical companies seek marketing approval for previously unapproveduses of drugs already registered, regulatory authorities typically require thesubmission of “new” clinical information. The agreements with Morocco and Bahrainprovide for an additional three years of data exclusivity whenever new clinicalinformation is presented. Drugs benefiting from this type of marketing exclusivityinclude not only newly patented products, but also older generic products forwhich the patents have expired (though generic competition for previously approveduses of such drugs would remain unaffected).
Sometimes drug regulatory authorities recognize the marketing-approvaldecisions of foreign regulators in making decisions to approve the same product athome. The intellectual property chapter of the U.S.–Singapore Agreement mandates,in this regard, that foreign data exclusivity also applies at home. In other words, nocompeting manufacturer is allowed to rely on the test data submitted to a foreignregulator when seeking marketing approval at home.
The agreements with Australia, Bahrain, and the DR-CAFTA countries reacheven farther. Even if regulatory authorities do not recognize foreign marketingapprovals, competing manufacturers are prevented from using test data submittedto a drug regulatory agency in another territory. In other words, test-data exclusivityapplies automatically in all FTA jurisdictions once a company submits test data toa drug regulator in one territory—even outside the FTA area.
A fourth aspect of intellectual property regulations affecting the supply ofmedicines is the permissibility of parallel importation of pharmaceutical productsthat have been placed on the market in foreign countries. Parallel importation can bea means of exerting downward pressure on prices of pharmaceuticals that are soldmore cheaply abroad. The TRIPS agreement affords World Trade Organization(WTO) members flexibility in determining whether to permit parallel importation ofpatented drugs.6 By contrast, the U.S. agreements with Australia, Morocco, and

TRADE, DOHA, AND DEVELOPMENT: A WINDOW INTO THE ISSUES
292
Tab
le 2
. In
tell
ec
tua
l p
rop
ert
y p
rov
isio
ns
of
rec
en
t U
.S.
bil
ate
ral
an
d F
TAs
th
at
go
be
yo
nd
U.S
.–V
ietn
amU
.S.–
Jord
anU
.S.–
Sing
apor
eU
.S.–
Chi
leU
.S.–
Mor
occo
U.S
.–A
ustr
alia
U.S
.–D
R-C
AFT
AU
.S.–
Bah
rain
Pate
nt te
rm
Seco
nd-u
se p
aten
tsN
o sp
ecifi
c pr
ovis
ion.
Sam
e as
U.S
.–A
ustr
alia
.
Pate
ntin
g of
life
form
sC
erta
in p
lant
s an
d an
imal
s m
ay
not b
e ex
clud
ed
from
pate
ntab
ility
.a
Exp
licit
oblig
atio
n to
pro
vide
pa
tent
pro
tect
ion
for p
lant
s an
d an
imal
s.
Exc
lusi
ons
only
allo
wed
for m
oral
, hea
lth
and
safe
ty re
ason
s.‘R
easo
nabl
e ef
forts
’ ha
ve to
be
unde
rtake
n to
pr
ovid
e fo
r pa
tent
abili
ty o
f
plan
ts. c
Expl
icit
oblig
atio
n to
pro
vide
pa
tent
pro
tect
ion
for p
lant
s, b
ut
anim
als
can
be e
xclu
ded.
Com
puls
ory
licen
ses
Sam
e as
U.S
.–Si
ngap
ore.
Link
age
betw
een
pate
nt s
tatu
s an
d dr
ug m
arke
ting
appr
oval
No
spec
ific
prov
isio
n.Pa
tent
ow
ner m
ust b
e no
tifie
d w
hen
mar
ketin
g ap
prov
al is
sou
ght
duri
ng th
e pa
tent
term
.
Test
dat
a pr
otec
tion
for
phar
mac
eutic
al p
rodu
cts
Dat
a ex
clus
ivity
fo
r a
‘rea
sona
ble’
pe
riod,
nor
mal
ly
not l
ess
than
5
year
s.
TRIP
S st
anda
rds
appl
y.
In a
dditi
on, l
engt
h of
pr
otec
tion
shou
ld b
e th
e sa
me
as in
the
orig
inat
or’s
cou
ntry
.
Dat
a ex
clus
ivity
for 5
ye
ars.
In a
dditi
on, w
here
dr
ug re
gula
tors
rely
on
fore
ign
mar
ketin
g ap
prov
als,
dat
a ex
clus
ivity
app
lies
auto
mat
ical
ly a
t hom
e.
Dat
a ex
clus
ivity
for
5 ye
ars.
Dat
a ex
clus
ivity
for 5
yea
rs.
Add
ition
al 3
yea
r dat
a ex
clus
ivity
trig
gere
d by
‘new
cl
inic
al in
form
atio
n’.
Para
llel i
mpo
rts o
f pat
ente
d pr
oduc
tsN
o sp
ecifi
c
prov
isio
n.d
TRIP
S st
anda
rds
appl
y.Pa
tent
hol
ders
may
lim
it pa
ralle
l im
ports
of
phar
mac
eutic
al p
rodu
cts
thro
ugh
licen
sing
co
ntra
cts.
TRIP
S st
anda
rds
appl
y.
Side
lette
rs o
n pu
blic
hea
lth?
No
No
No
No
Yes
No
Yes
Yes
Exte
nsio
n gi
ven
for d
elay
s ca
used
by
regu
lato
ry a
ppro
val p
roce
ss.
Ext
ensi
ongi
ven
ford
elay
sca
used
byre
gula
tory
appr
oval
proc
ess.
Inad
ditio
n,ex
tens
ion
give
nw
hen
ade
lay
inth
egr
antin
gof
the
pate
ntex
ceed
s4
year
sfr
omth
efi
ling
ofth
eap
plic
atio
n (5
yea
rs fo
r U.S
.–C
hile
) or 2
yea
rs a
fter a
requ
est f
or e
xam
inat
ion
(3 y
ears
for U
.S.–
Chi
le).
No
spec
ific
prov
isio
n.O
blig
atio
n to
pro
vide
pat
ents
for n
ew u
ses
of k
now
n pr
oduc
ts.
Mar
ketin
gap
prov
alof
age
neri
cdr
ugis
proh
ibite
ddu
ring
the
pate
ntte
rm,u
nles
sau
thor
ized
byth
epa
tent
owne
r.In
addi
tion,
the
pate
ntho
lder
mus
tbe
notif
ied
ofth
eid
entit
yof
the
gene
ric
com
pany
requ
estin
g m
arke
ting
appr
oval
.
Dat
aex
clus
ivity
for
5ye
ars.
Inad
ditio
n,da
taex
clus
ivity
appl
ies
inal
lFT
Am
embe
rco
untri
es,
once
first
obta
ined
inan
othe
rte
rrito
ry.
Inth
eca
seof
U.S
.B
ahra
in,
addi
tiona
l3
year
data
excl
usiv
itytr
igge
red
by‘n
ewcl
inic
alin
form
atio
n’(w
itheq
uiva
lent
prov
isio
nson
cros
s-bo
rder
appl
icat
ion)
.
Pate
nt h
olde
rs m
ay li
mit
para
llel i
mpo
rts th
roug
h lic
ensi
ng c
ontra
cts.
TRIP
S st
anda
rds
appl
y.
No
gene
ral e
xclu
sion
of p
lant
s an
d an
imal
s fr
om p
aten
tabi
lity.
b
Com
puls
ory
licen
ses
limite
d to
nat
iona
l em
erge
ncie
s, a
s an
titru
st
rem
edy,
and
for p
ublic
non
-com
mer
cial
use
.TR
IPS
stan
dard
s ap
ply.
TRIP
S st
anda
rds
appl
y.
Prot
ectio
n of
pat
ents
and
pha
rmac
eutic
al te
st d
ata

TIGHTENING TRIPS
293
Tab
le 2
. In
telle
ctu
al p
rop
erty
pro
visi
on
s o
f rec
ent U
.S. b
ilate
ral a
nd
FTA
s th
at g
o b
eyo
nd
TR
IPS
sta
nd
ard
s(c
on
tin
ued
)
U.S
.–V
ietn
amU
.S.–
Jord
anU
.S.–
Sing
apor
eU
.S.–
Chi
leU
.S.–
Mor
occo
U.S
.–A
ustr
alia
U.S
.–D
R-C
AFT
AU
.S.–
Bahr
ain
Term
of c
opyr
ight
pro
tect
ion
Sam
e as
TRI
PS
if de
term
ined
by
life
of a
utho
r, 75
–100
yea
rs
hi
Sam
e as
TRI
PS.
Tech
nolo
gica
l pro
tect
ion
mea
sure
sN
o sp
ecifi
c pr
ovisi
on.
‘Ade
quat
e’ p
rote
ctio
n an
d ‘e
ffect
ive’
rem
edie
s ag
ains
t act
s of
circ
umve
ntio
n. B
an o
n ci
rcum
vent
ion
devi
ces.
Liab
ility
of I
nter
net s
ervi
ce
prov
ider
s
Burd
en o
f pro
of in
cas
e of
co
pyrig
ht in
fring
emen
tN
o sp
ecifi
c pr
ovisi
on.
Para
llel i
mpo
rtatio
n of
co
pyrig
hted
wor
ksN
o sp
ecifi
c pr
ovisi
on.e
Copy
right
hol
der h
as
right
to b
lock
par
alle
l im
ports
.
Copy
right
hol
der h
as ri
ght t
o bl
ock
para
llel i
mpo
rts.
Insti
tutio
nal f
lexi
bilit
y in
IPR
s en
forc
emen
tN
o sp
ecifi
c pr
ovisi
on.
Sam
e as
U.S
.–Ch
ile.
Sam
e as
U.S
.–Si
ngap
ore.
Bord
er m
easu
res
App
ly to
im
porte
d an
d ex
porte
d go
ods.
Scop
e of
bor
der
mea
sure
s not
spec
ifica
lly
defin
ed.
App
ly o
nly
to im
porte
d go
ods (
simila
r to
TRIP
S).
Civi
l and
adm
inist
rativ
e pr
oced
ures
Crim
inal
pro
cedu
res a
nd
rem
edie
sSi
mila
r to
TRIP
S.Sc
ope
of c
rimin
al
proc
edur
es a
nd re
med
ies
not s
peci
fical
ly d
efin
ed.
TRIP
S sta
ndar
ds a
pply
.TR
IPS
stand
ards
app
ly.
Copy
right
pro
tect
ion
Life
of a
utho
r plu
s 70
year
s. If
deci
ded
on a
bas
is ot
her t
han
the
life
of th
e au
thor
, the
term
is 7
0 ye
ars f
rom
the
publ
icat
ion
or c
reat
ion
of th
e w
ork.
‘Ade
quat
e’pr
otec
tion
agai
nst
acts
ofci
rcum
vent
ion.
Ban
onci
rcum
vent
ion
devi
ces.
Civi
llia
bilit
yin
case
ofw
illfu
lin
fring
emen
t.Cr
imin
allia
bilit
yin
case
ofw
illfu
lin
fring
emen
tfor
com
mer
cial
purp
oses
.Exe
mpt
edar
eno
npro
fitlib
rarie
s,ar
chiv
es,e
duca
tions
insti
tutio
ns,a
sw
ella
sac
tsre
late
dto
reve
rse
engi
neer
ing,
troub
lesh
ootin
g,pr
otec
tion
of m
inor
s, co
mpu
ter o
r net
wor
k se
curit
y, a
nd la
wfu
lly a
utho
rized
gov
ernm
ent a
ctiv
ities
.
No
spec
ific
prov
ision
.Li
mite
d lia
bilit
y of
Inte
rnet
serv
ice
prov
ider
s on
the
cond
ition
that
they
blo
ck in
fring
ing
cont
ent u
pon
notif
icat
ion
by th
e co
pyrig
ht h
olde
r.e
Obl
igat
ion
to fi
ne in
fring
ers o
f cop
yrig
ht a
nd tr
adem
ark
right
s irre
spec
tive
of th
e in
jury
suffe
red
by ri
ghts
hold
ers.
Sim
ilar t
o TR
IPS.
In a
dditi
on, c
rimin
al
proc
edur
es a
pply
in c
ase
of w
illfu
l in
fring
emen
ts, n
ot o
nly
for a
fina
ncia
l ga
in.
Sim
ilar t
o TR
IPS.
In a
dditi
on, c
rimin
al p
roce
dure
s app
ly in
cas
es o
f will
ful i
nfrin
gem
ents,
not
onl
y fo
r a fi
nanc
ial g
ain,
and
sp
ecifi
cally
for k
now
ing
traffi
ckin
g in
cou
nter
feit
labe
ls af
fixed
to c
erta
in c
opyr
ight
ed w
orks
(e.g
., CD
s, so
ftwar
e).
Enfo
rcem
ent o
f int
elle
ctua
l pro
perty
righ
tsN
o sp
ecifi
c pr
ovisi
on.
Reso
urce
con
strai
nts c
anno
t be
invo
ked
as a
n ex
cuse
for n
ot c
ompl
ying
w
ith sp
ecifi
c en
forc
emen
t obl
igat
ions
.e
App
ly to
impo
rted,
exp
orte
d, a
nd tr
ansit
ing
good
s.Sa
me
as U
.S.–
Chile
.
Burd
en o
f pro
of p
lace
d on
the
defe
ndin
g pa
rty to
show
that
wor
ks a
re in
the
publ
ic d
omai
n. H
owev
er, c
opyr
ight
ow
ners
still
hav
e to
pro
ve in
fring
emen
t.

TRADE, DOHA, AND DEVELOPMENT: A WINDOW INTO THE ISSUES
294
Singapore allow patent holders to prevent parallel importation through contractualmeans.
Are the provisions on marketing approval during the patent term, test-dataexclusivity, and parallel importation at odds with the Doha Declaration on TRIPSand Public Health? That declaration—issued at the WTO ministerial meeting inDoha, Qatar, in 2001—recognized the gravity of the public health problems besettingmany developing and least developing countries. Among other things, it reaffirmedthe right of WTO members to use the flexibilities of TRIPS in the realm of compulsorylicensing and parallel importation to “promote access to medicines for all.”6 Moreover,in August 2003, WTO members created a special mechanism under the TRIPSagreement that allows countries with insufficient manufacturing capacity to makeeffective use of compulsory licenses by importing generic drugs (Fink 2005).Technically, the Doha Declaration and the August 2003 decision do not addresstest-data exclusivity or marketing approval during the patent term. However, therelevant provisions of the FTAs appear to be at odds with the spirit of thesemultilateral accords, to the extent that they preclude the effective use of compulsorylicenses.
In side letters to the agreements involving Bahrain, Morocco, and the DR-CAFTA countries, the respective governments shared understandings that theintellectual property chapters did not affect their ability to “take necessary measuresto protect public health by promoting medicines for all.”8 In a recent letter to a
Table 2. Intellectual property provisions of recent U.S. bilateral andFTAs that go beyond TRIPS standards
(Continued)Source: This overview table is based on the texts of the FTAs, available athttp://www.ustr.gov, and legal analyses by Abbott (2004) on the U.S.–DR-CAFTA andU.S.–Morocco agreements and Roffe (2004) on the U.S.–Chile Agreement.Notes: a. Specifically, the agreement foresees that “[t]he exclusions for plant and animalvarieties (as defined in Article 1 of UPOV Convention 1991) shall not apply to plant oranimal inventions that could encompass more than one variety.”b. In the case of U.S.–Chile, the agreement does not explicitly oblige protection of life formsunder the patent system, but mandates “reasonable efforts” to develop legislation related topatent protection for plants within four years from entry into force of the agreement.c. In addition, member countries are required to accede to the International Convention forthe Protection of New Varieties of Plants (1991) (UPOV Convention 1991) by 2006 (2007for Costa Rica; 2010 for Nicaragua). However, if a member country already provides patentprotection for plants, accession to UPOV 1991 is not a requirement.d. The question of intellectual property rights exhaustion, which determines the permissibilityof parallel importation, is not addressed in the U.S.–Vietnam agreement.e. In the case of U.S.-Morocco, a side letter specifies the form in which notifications in caseof alleged copyright infringement must be made.

TIGHTENING TRIPS
295
member of the U.S. Congress on the U.S.–Morocco FTA, the general counsel of theUnited States Trade Representative (USTR) provided further clarification:
“ “If circumstances ever arise in which a drug is produced undera compulsory license, and it is necessary to approve that drug toprotect public health or effectively utilize the TRIPS/health solution,the data protection provision in the FTA would not stand in the way....
As stated in the side letter, the letter constitutes a formal agree-ment between the Parties. It is, thus, a significant part of the interpre-tive context for this agreement and not merely rhetorical. According toArticle 31 of the Vienna Convention on the Law of Treaties, whichreflects customary rules of treaty interpretation in international law,the terms of a treaty must be interpreted “in their context,” and that“context” includes “any agreement relating to the treaty which wasmade between all the parties in connection with the conclusion of thetreaty.” ”9
At the same time, the U.S. government does not view the side letters as creat-ing an exemption that would allow parties to the FTAs to ignore obligations in theagreements’ intellectual property chapters.10 The side letters merely signal the be-lief of the signing governments that the intellectual property rules of the FTAs willnot interfere with the protection of public health.11
Copyright protectionTRIPS requires that copyright be protected for the life of the author plus 50 years.Except for the agreements with Jordan and Vietnam, the bilateral FTAs of the UnitedStates extend this term by an additional 20 years.
Most bilateral FTAs include obligations against circumventing so-calledtechnological protection measures—devices and software developed to preventunauthorized copying of digital works. This issue is not covered under TRIPS. Itcame to prominence only with advances in information and communicationtechnologies that greatly facilitated the copying of literary or artistic works indigital form. The U.S. Digital Millennium Copyright Act of 1998 strengthenedstandards on circumventing technologies designed to prevent unauthorized copyingof digital content. Those standards found their way to varying degrees into sevenof the bilateral agreements. Related provisions in six of the FTAs define the liabilityof internet service providers when infringing content is distributed through theirservers and networks. Again, these provisions are based on standards found in theU.S. Digital Millennium Copyright Act.
In copyright infringement cases, all of the bilateral agreements—except for theone with Vietnam—place the burden of proof on the defending party to show that

TRADE, DOHA, AND DEVELOPMENT: A WINDOW INTO THE ISSUES
296
works are in the public domain. TRIPS does not impose any such obligation. TheFTAs thus strengthen the position of copyright holders, as artistic and literaryworks should generally be considered protected—unless they obviously belong inthe public domain.
As in the case of pharmaceutical products, TRIPS does not mandate any ruleon the permissibility of parallel imports of copyrighted works—such as books ormusical Compact Disks (CDs)—that have been lawfully sold in foreign markets.Some countries, such as New Zealand, have permitted parallel importation of certaincopyrighted products as a way to stimulate price competition. By contrast, the U.S.bilateral agreements with Jordan and Morocco give copyright holders the right toblock parallel importation.
Enforcement of intellectual property rightsThe TRIPS agreement—for the first time in an international agreement on intellectualproperty—introduced detailed obligations on the enforcement of IPRs. Certainly,without judicial enforcement of intellectual property laws, rules on patents, copyright,and other forms of protection could be seriously undermined. However, recognizingthe institutional limitations of the institutions in many developing countries, TRIPSdoes not create any obligation “with respect to the distribution of resources asbetween enforcement of intellectual property rights and the enforcement of law ingeneral.”12
The agreements with Australia, Jordan, and Vietnam do not explicitly allow forthe same institutional flexibility. In these cases, it may therefore be difficult todefend derogations from the specific enforcement provisions of the agreements’IPR chapters with inherent institutional constraints, such as limited budgetary orhuman resources. The agreements with Bahrain, Chile, Morocco, Singapore, andthe DR-CAFTA countries go further, spelling out that resource constraints cannotbe invoked as an excuse for not complying with the agreements’ specific enforcementobligations.13 Indeed, some of the specific enforcement requirements of the FTAsseem to create additional institutional obligations. For example, as in the case ofTRIPS, the FTAs require customs authorities to stop trade in counterfeit and piratedgoods. But TRIPS requires such measures only for imported goods, whereas mostFTAs mandate border measures for imported and exported goods and, in somecases, even transiting goods.
Finally, the enforcement rules of the bilateral agreements mandate a strongerdeterrent against IPR infringement. For example, TRIPS requires only the impositionof fines adequate to compensate IPR holders for the monetary damages they suffered.In the case of copyright piracy and trademark counterfeiting, all of the FTAs requirethe imposition of fines irrespective of the injury suffered by IPR holders. TRIPSmandates criminal procedures only in cases of willful trademark counterfeiting orcopyright piracy on a commercial scale. Many FTAs go beyond this broad standard

TIGHTENING TRIPS
297
and define more explicitly the scope of acts of infringement subject to criminalprocedures—including, for example, copyright piracy with a significant aggregatemonetary value, but not necessarily for financial gain. Thus, certain forms of end-user piracy may be considered a criminal offense.
Intellectual property rights and investment rulesIn addition to the rules contained in the intellectual property chapters of the FTAs,IPRs are subject to separate investment disciplines. Six of the bilateral agreementshave separate chapters on investment (table 2). The U.S.–Bahrain and U.S.–JordanFTAs do not have one, but the respective governments have negotiated bilateralinvestment treaties (BITs) with similar provisions.14 As no multilateral agreement oninvestment exists at the WTO or elsewhere, these bilateral investment rules breaknew ground.
A common element of the investment chapters and BITs is that intellectualproperty rights are explicitly listed in the definition of what is considered aninvestment. Thus, the agreements’ specific investment disciplines apply, in principle,to government measures affecting the intellectual property portfolios of foreigninvestors. This, for example, raises the question of whether granting a compulsorylicense could be considered an act of expropriation. Five of the FTA investmentchapters explicitly remove compulsory licenses from the scope of expropriation, aslong as such licenses comply with the obligations of the TRIPS agreement and theintellectual property chapter of the respective FTA. But the U.S.–Vietnam FTA andthe two BITs with Bahrain and Jordan lack a comparable safeguard. Thus, if Vietnam,for example were to issue a compulsory license in case of a national emergency,could the patent holder challenge such a decision as an act of investmentexpropriation?
Questions like this may be important, as these investment agreements providefor direct dispute settlement between investor and state, going beyond the more
Table 3. Intellectual property rights and investment disciplines
Source: This overview table is based on the text of the relevant investment chapters andBITs, available at http;//www.ustr.gov and http://www.tcc.mac.doc.gov.
U.S.–Jordan, U.S.–Bahrain
U.S.–Vietnam U.S.–Singapore, U.S.–Chile,
U.S.–Australia
FTA chapter or previous BIT? Previous BITExpropriation
Investor-state dispute settlement No recourse to investor-state arbitration
Separate FTA chapter on investmentNo explicit exemption. Compulsory license and
revocation/limitation of intellectual property right not considered expropriation, if in compliance with multilateral and bilateral trade rules.
Investors have recourse to investor-state arbitration procedures.

TRADE, DOHA, AND DEVELOPMENT: A WINDOW INTO THE ISSUES
298
traditional state-to-state dispute settlement procedures in most trade agreements.An exception is the investment chapter of the U.S.–Australia FTA, which allowsonly for the possibility that investor-to-state dispute settlement procedures mightbe negotiated in future. Investor-to-state dispute settlement may be more attractiveto foreign investors, who can seek arbitration awards for uncompensatedexpropriation. By contrast, state-to-state dispute settlement can typically authorizeonly the imposition of punitive trade sanctions.
Notwithstanding these considerations, the reach of investment agreementsinto the intellectual property domain is still untested and remains in many wayslegally uncertain (Correa 2004).
A good bargain?Whether an FTA’s package of commitments produces net welfare gains to all partiesis an empirical question. However, FTAs with stronger rules on intellectual propertycomplicate an assessment of economic benefits and costs—for three reasons.
First, the traditional logic that economists apply to mercantilist trade bargainingdoes not extend straightforwardly to intellectual property. While reduced importprotection is seen as a concession by trade negotiators, it is generally regarded asa welfare-enhancing policy change by trade economists. Nonetheless, economistshave supported mercantilist bargaining, as it helps governments make a strongercase for import liberalization: exporters that gain from improved access to foreignmarkets can become a political counterweight to firms that would lose out frommore intense import competition.
From an economic perspective, IPRs are different. Put simply, they imply atrade-off between incentives for innovation and competitive access to newtechnologies.15 To balance these trade-offs, governments limit the length and scopeof the market exclusivity conferred by IPRs, according to national policy objectives.In particular, there is no assurance that stronger intellectual property rules willalways be welfare-enhancing, and the direction and size of the welfare effect willdepend on a country’s level of economic development. While there is undoubtedlya market-access dimension to IPRs, subjecting standards of protection to mercantilistbargaining cannot be viewed in the same light as subjecting import barriers to suchbargaining.
Second, improved access to U.S. markets for agricultural and manufacturedgoods is of a preferential nature. Preferences are time-bound, because they will beeroded once the United States reduces remaining tariffs and quotas on a nondis-criminatory basis in the current or future multilateral trading rounds (or once itsigns additional FTAs). By contrast, a commitment to stronger IPR rules is perma-nent and likely to be implemented on a nonpreferential basis. Even if preferentialtreatment in the area of IPRs were technically feasible, it would likely be inconsis-tent with the TRIPS agreement, which mandates most-favored-nation (MFN) treat-

TIGHTENING TRIPS
299
ment of IPRs holders.16 In contrast to the WTO’s agreements on trade in goods andtrade in services, the TRIPS agreement does not provide for an exception to theMFN principle for FTAs.
Third, it is inherently difficult to quantify the implications of changingintellectual property standards, let alone to compare them in monetary values to thegains derived from improved market access abroad. As will be explained furtherbelow, certain effects of stronger IPRs are conceptually not well-understood. Buteven where they are, the direction and size of net welfare changes depend on futuredevelopments that are difficult to predict—such as the nature of future innovationsand their relevance to the country concerned.
Economic and social implicationsAs just pointed out, evaluating the social and economic implications of the U.S.FTAs in the area of intellectual property is a difficult task. First of all, it requires anunderstanding of the changes in laws and regulations required by obligations inthe FTAs that do not reflect current legal practice in the countries concerned. Forexample, both Morocco and the United States had legislation in place prohibitingparallel imports of pharmaceutical products before they signed the FTA. To be sure,trade agreements are still relevant even if they do not require changes in laws,because they make it difficult for countries to change their minds and amend laws.Indeed, in the specific case of parallel importation many countries—including theUnited States—reexamine from time to time existing policies, sometimes deciding tochange course.17 Certainly, if policy changes were inconceivable, there would be noneed to lock policy into trade agreements.
A full economic assessment of the new intellectual property obligations in theFTAs would require in-depth study in each of the affected countries, an effort thatfar exceeds the scope of this note. Still, we may ask, what are some of the generalbenefits and costs that may come with the new intellectual property standardsoutlined above?
A commitment to stronger intellectual property protection may send a welcomingsignal to foreign investors, contributing to a country’s increased participation ininternational commerce. The empirical evidence on this question is mixed, however.Fink and Maskus (2004) review studies undertaken to gauge the link between thestrength of intellectual property protection and the attraction of foreign directinvestment flows. They conclude that countries that strengthen their IPR regimeare unlikely to experience a sudden boost in inflows of foreign investment. Otherfactors account for most of the variation across countries in the activity ofmultinational enterprises. At the same time, the empirical evidence does point to apositive role of IPRs in stimulating cross-border licensing activity, which affectsformal technology transfers.

TRADE, DOHA, AND DEVELOPMENT: A WINDOW INTO THE ISSUES
300
Moving on to sector-specific implications, the role of patent protection in thepharmaceutical industry is conceptually well-understood. Patents create an incentiveto invest in pharmaceutical research and development (R&D), but the marketexclusivity they confer leads to prices above marginal production costs—asillustrated by sharp price drops when patents expire and generic competition emerges.The benefits and costs associated with protecting pharmaceutical patents differfrom country to country. Among other things, they depend on the relevance ofdrug discoveries to national disease patterns, the purchasing power of patients,and the availability of health insurance programs that cover drug expenses. Asalready pointed out, insufficient flexibility in overriding drug patents can have adetrimental impact on the protection of public health. The need for such flexibilityhas not been widespread so far, as generic sources for most medicines have stillbeen available. However, it is likely to become more important in the future, as theimplementation of TRIPS obligations will lead newly invented drugs to be protectedby patents in most developing countries that host generic pharmaceuticalindustries.18
The benefits and costs of stronger and new copyright protection standardsare less clear cut. Most countries have industries that rely on copyright protectionand that may benefit from strengthened protection. And new technologies thatgreatly facilitate the copying of digital works pose challenges that policymakersneed to address. At the same time, copyright laws have historically sought to strikea balance between the interests of copyright producers and the interests of thegeneral public. So-called fair-use exemptions allow the copying of protected worksfor educational and research purposes. There are concerns that new rules on theterm of protection, technological protection measures, the liability of Internet servicesproviders, and the burden of proof in cases of copyright infringement could diminishthe rights of consumers and the general public (CIPR 2002).
Such concerns have been voiced from within the United States, not only byconsumer rights advocates and academic institutions, but also by computermanufacturers and communications service providers that distribute copyrightedworks. For example, proposed amendments to the Digital Millennium Copyright Actwould permit the circumvention of technological protection measures if it did notresult in an infringement of a copyrighted work.19 Ensuring fair use of copyrightedmaterial seems particularly important for accessing educational material. Theopportunities and gains from the use of digital libraries, Internet-based distance-learning programs, and online databases would be limited if access to such toolswere unaffordable or otherwise restricted by copyright law.
Finally, strengthening the enforcement of intellectual property rights can be acostly exercise—both in terms of budgetary outlays and the employment of skilledpersonnel. For developing countries that face many institutional deficiencies, acritical question is whether stronger enforcement of IPRs would draw financial and

TIGHTENING TRIPS
301
human resources from other development priorities.
Lessons learnedThe United States continues to negotiate FTAs, mostly with developing countries(see table 2), and still other negotiations are likely to be launched. Given the importanceof intellectual property to the United States, it will be difficult for U.S. tradingpartners to avoid negotiating new IPR rules. What lessons can they learn from therecently signed agreements?
First, while there are common elements in the eight intellectual property chaptersdiscussed here, there are also important differences (see table 2). With varyingdegrees of success, U.S. trading partners were able to advance their own, generallydefensive interests. Of particular importance is the preservation of flexibilities toprotect public health. Indeed, the United States is obligated by its own tradepromotion authority “to respect the Declaration on the TRIPS Agreement and PublicHealth, adopted by the World Trade Organization at the Fourth MinisterialConference at Doha.”20
Second, the intellectual property chapters of the eight FTAs discussed heremostly reflect proposals put forward by the United States. It may be possible tochange the negotiating dynamics in future FTAs, if U.S. trading partners put forwardtheir own proposals on new intellectual property rules and related incentivemechanisms. These may pertain to policy areas in which developing countries haveoffensive interests, such as the protection of biodiversity and traditional knowledge.But they may also consist of alternative mechanisms of addressing the problemsthat new intellectual property rules are intended to fix.21
Finally, countries need to carefully assess the economic and social effects oftightened IPR standards, ideally before new agreements are negotiated. As pointedout above, these effects are multifaceted and depend on country-specificcircumstances. An assessment should therefore involve consultations with relevantministries, the private sector, consumer groups, and other stakeholders.
Notes1. Comments by Federick Abbott, Carlos Braga, Jean-Christophe Maur, Richard Newfarmer,
Lorenzo Pupillo, Pedro Roffe, Philip Schuler, Rudolf Van Puymbroek, as well as James Medenhalland other staff from the Office of the USTR are gratefully acknowledged.
2. See the Bipartisan Trade Promotion Authority Act of 2002, available at http://www.tpa.gov.3. At the same time, the U.S.–DR–CAFTA Agreement requires countries that already provide
patent protection for plants to maintain such protection.4. The TRIPS provisions on compulsory licensing require a government first to make efforts
to obtain a voluntary license from the patent holder, although this requirement may be waivedin emergency situations or for public noncommercial use. The obligations of bilateral agreementsare similar or identical in this respect.
5. In the case of agrochemical products, most of the bilateral agreements require data exclusivityfor 10 years.

TRADE, DOHA, AND DEVELOPMENT: A WINDOW INTO THE ISSUES
302
6. The permissibility of parallel importation is governed by rules on the exhaustion of patents.A system of international exhaustion is associated with free parallel trade, while patent holderscan restrict parallel importation if patent rights exhaust only nationally. TRIPS Article 6 doesnot mandate a particular exhaustion regime, as long as its application is nondiscriminatory.
7. See paragraph 4 of the Doha Declaration on TRIPS and Public Health, availableat http://www.wto.org.
8. The side letters also clarify that the intellectual property chapters of the FTAs do notprevent the effective utilization of the August 2003 decision by WTO members described in thetext.
9. See the letter from USTR General Counsel John K. Veroneau to Congressman Levin datedJuly 19, 2004, available at Inside U.S. Trade.
10. As clarified by USTR staff in correspondence with World Bank staff.11. The agreements with DR–CAFTA, Chile, Australia, and Jordan contain provisions affirming
the rights and obligations of member countries under the TRIPS agreement. To some extent,these provisions may be interpreted as preserving the flexibilities of the TRIPS agreement.However, the value of these non-derogation clauses in bilateral disputes is legally uncertain(Abbott 2004).
12. See Article 41.5 of the TRIPS Agreement, available at http://www.wto.org.13. The U.S.–Chile and U.S.–DR–CAFTA agreements have language similar to that of the
TRIPS agreement, acknowledging that no obligation is created regarding the distribution of lawenforcement resources. But the fact that resource constraints may not be invoked as an excusefor not meeting the agreements’ specific enforcement obligations appears to significantlyweaken this flexibility.
14. These bilateral investment treaties entered into force in 2001 (U.S.–Bahrain) and 2003(U.S.–Jordan).
15. From an economic perspective, trademarks and geographical indications are differentintellectual property instruments. They primarily seek to remedy asymmetries of informationbetween buyers and sellers of goods and do not entail a trade-off between innovation andcompetitive access. See Fink and Maskus (2004).
16. It is worth noting that Vietnam is not a member of the WTO and therefore not bound bythe TRIPS disciplines. However, Vietnam is in the process of acceding to the WTO and musttherefore bring its intellectual property system into compliance with the TRIPS Agreement.
17. For example, Australia removed parallel import restrictions for CDs in 1998. The EuropeanUnion considered in 1999 to free parallel importation of trademarked goods from countriesoutside the Union, but in the end decided to maintain its existing regime. Legislation to allowparallel importation of prescription drugs into the United States has been extensively debated inthe U.S. Congress, but no decision has been taken as of October 2005.
18. Least developed countries are not required to protect pharmaceutical patents until 2016,with a possibility of a further extension (see Fink 2005).
19. See the proposed Digital Media Consumers’ Rights Act, introduced in the U.S. House ofRepresentatives (http://www.house.gov/boucher/internet.htm). Companies supporting theproposed legislation include computer manufacturers such as Gateway and Sun Microsystems;component manufacturers such as Intel; and telecommunications companies such as Verizon,Qwest, and BellSouth. For a full list, see http://www.house.gov/boucher/docs/107supporters.htm.
20. See the Bipartisan Trade Promotion Authority Act of 2002, available at http://www.tpa.gov.21. For example, in the area of data protection, instruments other than data exclusivity exist
to protect test data against unfair commercial use (CIPR 2002).
ReferencesAbbott, Frederick. 2004. “The Doha Declaration on the TRIPS Agreement and Public Health

TIGHTENING TRIPS
303
and the Contradictory Trend in Bilateral and Regional Free Trade Agreements.” OccasionalPaper 14, Quaker United Nations Office.
CIPR (Commission on Intellectual Property Rights). 2002. “Integrating Intellectual PropertyRights and Development Policy.” Report of the Commission on Intellectual Property Rightsestablished by the U.K. Secretary of State for International Development.
Correa, Carlos M. 2004. “Bilateral Investment Agreements: Agents of a New Global Standard forthe Protection of Intellectual Property Rights?” Available at http://www.grain.org/briefings/?id=186.
Fink, Carsten. 2005. “Intellectual Property and Public Health: Putting the WTO’s August 2003Decision into Perspective.” Reprinted in this volume. World Bank, Washington, DC.
Fink, Carsten, and Keith Maskus. 2004. “Intellectual Property and Development: Lessons fromRecent Economic Research.” New York and Washington, DC: Oxford University Press andWorld Bank.
Roffe, Pedro. 2004. “Bilateral Agreements and a TRIPS-plus World: the Chile-USA Free TradeAgreement.” TRIPS Issue Paper 4. Quaker International Affairs Programme, Ottawa.


Compensating Lost Revenue in RegionalTrade Agreements
Peter Walkenhorst
25
.The proliferation of free trade agreements and customs unions since the early1990s has been remarkable. Today most countries are party to one or moreregional trade initiatives (World Bank 2004). Economic integration at the
regional level allows the members to reap benefits from specialization whileaccommodating the particular needs and adjustment capacities of the countriesinvolved. Structural and fiscal adjustment cannot be avoided entirely, however, andin some cases special provisions to contain adverse impacts on countries andfoster coherence among members have been devised. One type of provisioncompensates for losses of government revenue from intraregional tariff reductions.1
Multilateral or regional trade liberalization does not necessarily lead torevenue losses. If tariff reductions (to levels above zero) trigger a more-than-proportional increase in trade flows, government revenues from trade taxes may infact rise. Moreover, revenues from taxes on value-added (sales) and income taxesare likely to grow because of higher domestic consumption arising from lowerprices of tradables, as well as higher growth resulting from the improved allocationof resources in the economy. If revenue shortfalls occur, however, countries withsound administrative capacity will often be able to recover the losses bystrengthening domestic indirect taxes, broadening the tax base, and increasing theefficiency of raising funds for the government (Keen and Ligthart 2001).
However, low-income countries, and particularly the least developed countries(LDCs), frequently lack adequate administrative capacity and a well functioningdomestic tax system. They tend to rely heavily on trade taxes as sources ofgovernment revenue. Lowering or eliminating tariffs on trade with regional partners,therefore, can constitute a significant risk to a country’s fiscal position (Baunsgaardand Keen 2005). For example, estimates of the prospective impact of the EconomicPartnership Agreement between the European Union and the Economic Communityof West African States (ECOWAS) indicate that some of the participating Africancountries could lose more than 20 percent of their government revenues as a resultof preferential tariff reductions (Busse and Grossmann 2004).
To alleviate such potentially important fiscal effects, revenue loss compensationarrangements (RLCAs) have been introduced into some regional integrationinitiatives (RIIs). Most RLCAs involve the establishment of a compensation fundfrom which payouts for tariff revenue losses are made. Several examples can befound in RIIs in Africa (table 1). However, lack of progress in the underlying schemeshas often hampered implementation. For example, in ECOWAS a minority of members
305

TRADE, DOHA, AND DEVELOPMENT: A WINDOW INTO THE ISSUES
306
have yet to implement their trade liberalization commitments or pay their contributionsto the compensation fund. The RLCAs in the Common Market of Eastern andSouthern Africa (COMESA) and the Economic Community of Central African States(ECCAS) appear even further away from effective implementation. By contrast, therevenue sharing funds in the Southern African Customs Union (SACU) and theWest African Economic and Monetary Union (WAEMU) have been operational forseveral years.
RLCAs differ in their design and implementation characteristics, particularlywith respect to their duration and their handling of resource mobilization and payoutcriteria. We will discuss each of these features in turn before describing an operationalRLCA, SACU’s revised Common Revenue Pool.
Resource mobilizationThere are many ways to raise resources to compensate for revenue losses. Theresource mobilization schemes in existing RLCAs can be classified according towhether they rely on existing or new revenue sources, and again according towhether they are based on domestic or trade taxes.• Existing (or new) domestic and trade taxes. Contributions are paid from general
government revenues. A (nonoperational) example is ECCAS, where the
Source: World Bank staff.
Table 1. Characteristics of revenue sharing and compensationarrangements in regional integration
Allocation criteriaCaribbean Community (CARICOM) Common market 14 (0) Imposition of intra-
regional tariffs.Retention of revenues from intraregional tariffs.
Temporary, according to decision by Council for Trade and Economic Development.
Upon application by less-developed members to Council for Trade and Economic Development.
Common Market for Eastern and Southern Africa (COMESA)
Preferential/free trade agreement
19 (12) To be determined in protocol.
To be determined in protocol.
RSA protocol in development.
Economic Community of Central African States (ECCAS)
Cooperation agreement
11 (8) Saved tariff expenditure on intraregional exports.
Lost tariff revenue on intraregional imports.
RSA not implemented.
Economic Community of West African States (ECOWAS)
Preferential trade agreement
15 (11) Community levy of 0.5 percent on imports from third countries.
Lost tariff revenue from intraregional imports, according to customs declaration.
Four years (from January 2002), degressive compensation.
RSA not operational.
Southern African Customs Union (SACU)
Customs union 5 (1) Common revenue pool of all customs and excise duties.
Combination of projected intraregional import shares and gross domestic product.
Not determined. Portion of funds raised is used for other purposes.
West African Economic and Monetary Union (WAEMU)
Economic and Monetary union
8 (7) Community solidarity surcharge of 1 percent on imports from third countries.
Lost tariff revenue from intraregional imports, according to customs declaration.
Six years (from January 2000), degressive compensation.
Portion of funds raised is used for other purposes than revenue loss compensation.
Period of operation RemarksAgreement
Stage of integration
No. of members (of which
LDCs)Financing
mechanism

COMPENSATING LOST REVENUE
307
contributions of members to the compensation fund are determined accordingto the saved tariff expenditures on intraregional exports.
• Existing trade taxes. Customs duty revenues are allocated to a compensationor revenue sharing fund. An example is the customs component in SACU’sCommon Revenue Pool.
• New trade taxes. Tariffs on imports are increased to raise revenues for use ascompensation. For example, ECOWAS and WAEMU apply surcharges to thirdcountry imports, while the Caribbean Community and Common Market(CARICOM) allows its less developed members to apply for the temporary(re)introduction of intra-RII tariffs in order to overcome tariff revenue shortfalls.All existing RLCAs are based at least partly on trade taxes, and many on newly
introduced ones. Import duties have the advantage of being relatively easy toadminister. They represent, however, one of the most economically costly forms oftaxation (Clarete and Whalley 1987). Moreover, in order to minimize distortions inthe economy, it is generally desirable to first try to enhance revenue collection bybroadening the tax base, e.g. by curtailing tax or import duty exemptions, beforeincreasing tax rates.
Designated taxes are used in all existing RLCAs, except ECCAS, as theinstruments to raise funds for compensation. This earmarking of revenue sourcesprotects the compensation fund largely from annual budget discussions in membercountries. On the other hand, it tends to expose the fund to volatility in the underlyingrevenue source, to which other funding arrangements, such as those based on therelative economic size of partner countries, would not be subject.
Payout criteriaRLCAs also differ in how payments from compensation funds are allocated. Thecriteria used in existing RLCAs to determine the payouts to beneficiary countriesare based on intraregional trade shares or incurred revenue losses.• Trade shares. The funds available for compensation or revenue sharing are
distributed among member countries in proportion to their shares in totalintraregional imports. SACU’s customs component payout is an example of atrade share–based compensation scheme.
• Incurred revenue loss. Compensation is paid on the basis of submitted customsdeclarations on intra-RII trade for the period under consideration and the loss inrevenue associated with the nonapplication of most-favored-nation (MFN) tar-iffs to partner country trade. Such a scheme is operated, for example, by WAEMU(and envisaged by ECCAS and ECOWAS). The compensation payments aredetermined by multiplying MFN tariff rates by intraregional trade flows afterremoval of intra-RII tariffs. This method overestimates the loss of tariff revenue,as the liberalization of intraregional trade will trigger an increase in the exchangeof goods among partner countries. A scheme based on historical intraregional

TRADE, DOHA, AND DEVELOPMENT: A WINDOW INTO THE ISSUES
308
trade flows (that is, flows before establishment of the RII) would avoid thisestimation bias, but it would not take into account changes in intraregional tradeflows that might occur for reasons other than regional integration.The administration and monitoring of a payout scheme becomes more
demanding depending on the degree of precision the partner countries require inthe calculating and tracking the tariff revenue losses. Schemes based on historicaltrade patterns or aggregate intraregional trade shares are much less cumbersome tohandle than those centered on shipment-specific customs declarations, for example.Although customs operations in many countries are intensifying their use ofcomputers and, hence, becoming more capable of treating large amounts of dataquickly and reliably, considerable scope for error in handling RLCA-relevantinformation remains.
The establishment of RLCAs has often been propelled by concerns that thebenefits from regional integration might be unequally distributed and accentuatedisparities in development levels within the region, with the stronger, largereconomies gaining at the expense of weaker, smaller countries. In addition to beinginstruments of compensation for lost tariff revenues, therefore, RLCAs may beseen as vehicles of economic solidarity weighted in favor of the poorer countries inthe group. For that reason many compensation funds also have a role in supportingdevelopment and cohesion. For example, the development component of SACU’sCommon Revenue Pool is distributed among member countries in inverse proportionto their per capita income, thus favoring less-developed members.
Duration of arrangementsAs intraregional liberalization leads to expanded trade, revenues from domesticvalue-added, excise, and income taxes can be expected to increase, reducing thenecessity for revenue redistribution over time. Many RLCAs, though not all, aretherefore of a temporary nature.• Fixed duration. The period of operation for the RLCA may be limited to a
certain number of years. For example, for ECOWAS the duration of thearrangement is four years; for WAEMU, six years.
• Duration determined by administrative decision. The period of operation ofthe RLCA may be decided case by case. Such an arrangement exists inCARICOM, where the Council for Trade and Economic Development acceptsapplications for the revenue safeguard fund from less-developed members.
• Duration not determined. The duration of the RLCA may be open-ended.Such an arrangement exists in SACU.The compensation payments in ECOWAS and WAEMU are scheduled to be
scaled down over time before the RLCA expires. A similar development might occurin SACU, as further bilateral or multilateral trade liberalization reduces customsrevenues and hence the funds available to compensate for revenue losses. The

COMPENSATING LOST REVENUE
309
scaling down of RLCA payouts over time gives countries an incentive to pursuetheir fiscal reform processes and strengthen nontrade sources of governmentrevenue.
The example of SACU’s Common Revenue PoolIn October 2002, the members of SACU (Botswana, Lesotho, Namibia, South Africa,and Swaziland) signed a new agreement that revised the union’s revenue sharingarrangements, the purpose of which is to increase members’ fiscal stability. Thearrangement stipulates that all customs, excise, and additional duties collected inthe common customs area are to be paid into a Common Revenue Pool. The pooledrevenues are then categorized into components for distribution purposes. SACUmembers agreed that their respective shares during any financial year would becalculated from each of three distinct components, net of the budgeted costs offinancing the administration of the arrangement.• The customs component, consisting of all customs duties actually collected, is
distributed on the basis of each country’s percentage share of total intra-SACU imports, excluding reexports. As South Africa currently has a large tradesurplus with its SACU partner countries, its share in total intra-SACU importsis relatively small, and its payout from the customs component is less thanproportional to the country’s relative economic size. Conversely, the four less-developed SACU members receive a share of total customs revenues thatexceeds their relative size.
• The excise component, consisting of all excise duties actually collected ongoods produced in the common customs area (net of the developmentcomponent), is allocated on the basis of each country’s share in total SACUgross domestic product (GDP). The inclusion of excise duties in the commonpool was motivated by the difficulty of administering separate excise regimesin a region with porous borders. Payouts from the excise component currentlydo not have a marked redistributional effect.
• The development component is funded initially from 15 percent of the totalexcise component and distributed on the basis of each country’s GDP percapita, with lower income countries receiving a larger than proportional shareof the payouts.The revenue shares of each component was supposed to be calculated from
audited data on trade, GDP, and GDP per capita, as well as agreed customs andexcise forecasts, with possible adjustments in the ensuing two years to reflectactual collections (Kirk and Stern 2003). The distribution of revenues is approximateand implicit, thereby avoiding a cumbersome handling of customs declarations inthe compensation process. The flexible and symmetric setup also facilitates thepossible expansion of customs union membership to other countries in the region.However, in practice the revenue sharing formula has provided countries with

TRADE, DOHA, AND DEVELOPMENT: A WINDOW INTO THE ISSUES
310
incentives to overstate their intra-SACU imports in order to obtain larger payouts,so that it has been very difficult –if not impossible– to reach agreement on the basefor revenue distribution.
Policy implicationsFor countries that have weak domestic tax administrations and rely heavily on tradetaxes for government finances, lowering or eliminating tariffs on trade with regionalpartners can pose a significant fiscal risk. To pursue regional integration despitethat risk, provisions on revenue sharing have been added to several RIIs, althoughnot all are operational. Analysis of existing arrangements suggests several desir-able design features for RLCAs—among them the use of domestic tax revenuesinstead of economically more costly trade taxes as the preferred means of raisingrevenues for compensation. Moreover, simple payout criteria, possibly historicallybased, facilitate the monitoring and administration of the mechanism. And finally,limited periods of duration and a reduction of compensation payments over time areconsistent with the revenue-enhancing effect of trade-induced growth and pre-serve the incentive for governments to pursue fiscal reforms.
As our survey of RLCAs showed, there are very few examples of operationalarrangements; even these are generally of a temporary nature. This means thatmost regional trade agreements do not foresee or implement provisions for revenuesharing or revenue loss compensation. Hence, countries that are confronted withmarkedly adverse impacts on their fiscal balance as a result of preferential liberaliza-tion can not rely on designated resources from regional partners but must copewith the revenue shortfalls domestically through complementary policy reforms. Insome cases, improvements in customs collection through better compliance withexisting regulations may be sufficient to offset the revenue losses. In others, morecomprehensive reform measures to broaden the tax base and shift revenue genera-tion away from trade taxes will be required. Such fiscal reforms are not easy todesign and implement, but they are often necessary to complement trade reformsand reap the full benefits of economic integration.
Notes1. This chapter was prepared by Peter Walkenhorst, Senior Economist, International Trade
Department, World Bank.
ReferencesBaunsgaard, T., and M. Keen, 2005. Tax Revenue and (or?) Trade Liberalization. Working
Paper WP/05/112. International Monetary Fund, Washington, DC.Busse, M., and H. Grossmann. 2004. Assessing the Impact of ACP/EU Economic Partnership
Agreement on West African Countries. HWWA Discussion Paper 294. Hamburgisches Welt-

COMPENSATING LOST REVENUE
311
Wirtschafts-Archiv, Hamburg.Clarete, R., and J. Whalley. 1987. “Comparing the Marginal Welfare Costs of Commodity and
Trade Taxes.” Journal of Public Economics 33: 357–62.Keen, M., and J. Ligthart. 2001. “Coordinating Tariff Reductions and Domestic Tax Reform.”
Journal of International Economics 56: 407–25.Kirk, R., and M. Stern. 2003. The New Southern African Customs Union Agreement. Africa
Region Working Paper Series 57. World Bank, Washington, DC.World Bank. 2004. Global Economic Prospects 2005: Trade, Regionalism, and Development.
Washington, DC: World Bank.


Regionalism vs. Multilateralism?
Dominique van der Mensbrugghe, Richard Newfarmer andMartha Denisse Pierola
26
Though few would argue that regionalism is an alternative to multilateralism,the rapid proliferation of regional trade arrangements (RTAs)1 contrastsvividly with the slow pace of multilateral liberalization. It is worthwhile,
therefore, to assess the projected benefits of both approaches to get a sense ofwhat would happen if the Doha Round should whither on the vine. And, as developingcountries pursue RTAs, it is worth exploring what types of arrangements—andunder what circumstances—produce the greatest benefits.2
The major conclusion of the simulations reported here is that developingcountries would be worse off under a complex system of overlapping bilateral andregional agreements: they would suffer losses averaging 0.4 percent in real income(and 1 percent for low-income countries alone). When the simulations are appliedto selected North–South and South–South agreements, the gains obtained aresignificantly lower than those that could be obtained from a multilateral arrangement.All in all, multilateralism produces the most development friendly outcomes.
The prospect of obtaining first-mover advantages by signing bilateral tradeagreements with major trading partners before others can do so has been one ofthe main reasons for preferring regionalism over multilateralism. But the days offirst-mover advantages are probably over. The proliferation of RTAs around theworld has already eliminated the possibility of obtaining the quick gains countriessought from regional deals. In addition, the profusion of RTAs is leading to theformation of trading blocs, a scenario in which weak economies can easily bemarginalized.
The landscape of national policy strategies: current trendsSince the early 1990s there has been a significant acceleration in the number ofRTAs signed around the world. As of January 2005, 312 RTAs had been notified tothe GATT/WTO, 170 of which are currently in force (Crawford and Fiorentino 2005).The increase in the number of RTAs was pronounced after 1993 (figure 1).
Crawford and Fiorentino (2005) identified the following trends in the formationof RTAs:• The formation of RTAs is a phenomenon observed across countries. In fact,
regionalism is, for an increasing number of countries, the main element oftheir trade policy.
313

TRADE, DOHA, AND DEVELOPMENT: A WINDOW INTO THE ISSUES
314
• Today’s RTAs are broader in coverage than in the past. In that sense, theyare becoming more complex. They contain provisions applicable to subjectsthat go beyond those negotiated at the level of the WTO—among theminvestment, competition, environment, and labor, among other topics.
• Reciprocal preferential North–South agreements are increasing in number.There is also a significant emergence of South–South partnerships.
• RTAs are expanding and consolidating across regions and withincontinents. Most countries today belong to at least one RTA. Indeed, a“spaghetti bowl” of multiple and overlapping RTAs around the globe hasemerged.3
As far as typology of RTAs is concerned, Free Trade Agreements (FTAs) arethe most common type (84 percent at all RTAs in force vs. 8 percent for CustomUnions and 8 percent for Partial Scope Agreements). As for the configuration ofRTAs, bilateral agreements account for more than 75 percent of all RTAs notifiedand in force, and for almost 90 percent of those under negotiation.
Most RTAs are between transition economies (29 percent), followed by North–South agreements (26 percent) and South–South agreements (21 percent) (figure2). Among the North–South agreements, those involving the states of the EuropeanUnion and those of the European Free Trade Association (EFTA) together account
0
20
40
60
80
100
120
140
160
180
1948 1952 1956 1960 1964 1968 1972 1976 1980 1984 1988 1992 1996 2000 2004
Figure 1. The number of RTAs has strongly increasedCumulative number of RTAs by date of entry into force
Note: We use the term RTA to refer to agreements signed either by pairs of trading partnersor by a group of countries.Source: World Trade Organization (WTO) (http://www.wto.org/english/tratop_e//region_e/eif_e.xls).

REGIONALISM VS. MULTILATERALISM
315
for more than half. The number of South–South agreements has increasedsignificantly in recent years. Trade within RTAs covered a third of world trade in2002; however, if MFN rates of zero are excluded, the RTA share declines to 20percent (World Bank 2005).
Why have countries favored bilateral or regional trade strategies overmultilateralism? There are three major reasons. First, countries may hope to maximizetheir benefits through so-called first-mover advantages. That is, they focus on thegains they could obtain from signing an agreement with a large trading partnerbefore competing countries do so. Or they may seek to preempt other countries,by denying them first-mover advantages. The validity of this argument will beanalyzed in the next section. Second, countries may seek to guarantee permanentaccess to particular markets. Signing an agreement bilaterally or regionally may bethe quickest and easiest way of achieving that goal. Third, a bilateral agreementmay be used as leverage to facilitate domestic reforms, particularly in areas that arenot dealt with multilaterally, such as investment, competition, and environmentaland labor standards.
Is regionalism better than multilateralism? Results from simulationsIn this section we evaluate the gains and losses that a country might expect torealize by pursuing a bilateral or regional trade strategy instead of multilateralism.The methodology used in our simulations is based on the database of the Global
Figure 2. RTAs: Everybody is doing it
Transition-Transition
29%
Developing-Developing
21%Developed-Developing
26%
Developed-Developed
13%
Developed-Transition
6%
Developing-Transition
5%
Note: Notified RTAs in goods by type of partner (as of February 2005).Source: Crawford and Fiorentino (2005).

TRADE, DOHA, AND DEVELOPMENT: A WINDOW INTO THE ISSUES
316
Trade Analysis Project (GTAP), headquartered at Purdue University. The GTAPdatabase is widely used to assess the global, regional, and country implications ofalternative trade liberalization scenarios. The database used to obtain the resultshas 2001 as its base year and takes preferential trade access into account.
To assess the relative impacts of various RTAs, we performed a benchmarksimulation on a global reform scenario in which all merchandise trade distortions,domestic distortions in agriculture,4 and import quotas in the textile and clothingsectors are removed. Services reform is left out for lack of sufficient data. Under thisscenario, the ultimate outcome of successful multilateralism, global gains in 2015amount to $263 billion, or an increase of 0.8 percent in baseline income.5
In addition to the benchmark, three scenarios were simulated:• All developing countries sign a bilateral agreement with Quad-plus countries:
Canada, European Union, Japan, and the United States, plus Australia andNew Zealand.
• Developing countries minus large countries—Brazil, China, and India—sign abilateral agreement with Quad-plus countries.
• Individual developing countries or regions sign an a bilateral agreement withthe Quad-plus countries, while other developing countries do not.6
The results from the first simulation show that, as a group, developing countriesare substantially worse off than with a multilateral agreement.7 Instead of gaining$109 billion from global reform, they lose $22 billion relative to a baseline scenario,with no change in protection (Table 1).8 Looking at countries separately, the resultsare similar. Only a handful of developing countries—for example, Brazil andChina—would gain more from a system of bilateral agreements. High-incomecountries, too, would generally lose from this set of bilateral agreements comparedwith global reform, yet the impact is not uniform.9 Both, the United States and theEuropean Union (the most aggressive advocates of bilateral deals) would appearto benefit more from pursuing bilateral agreements with all developing countriesthan from global reform ($7 and $27 billion respectively). Although they wouldhave to open up their agricultural markets to some extent (assuming exemptionswere disallowed), they would not have to dismantle domestic support programs.In agriculture, the Quad-plus agricultural exporters—Australia, Canada, and NewZealand—would prefer multilateralism, because the gains from access to European,Japanese, and American markets and from the dismantling of distortionaryagricultural support programs would be highly beneficial for their farmers.
In the second simulation, many developing regions still lose in absolute termscompared with the baseline scenario. They also lose relative to the benchmarkglobal reform scenario, although in some cases (Indonesia, rest of Latin Americaand Caribbean, and rest of world), the gains from bilateral agreements approachthose in the global reform scenario. The gains for the high-income countries are

REGIONALISM VS. MULTILATERALISM
317
significantly lower when the large developing countries are excluded—notsurprising given their weight in global trade with the Quad countries. Finally, theimpact on the excluded countries is mixed: Brazil and China, which would gainaccording to the results obtained from the first simulation, lose when excluded.The other excluded regions—India, Mexico, Russian Federation, rest of East Asia,and rest of South Asia—would see a dampening of their losses.
With the results from the third simulation, in which each developing countryor region signs an agreement with the Quad-plus countries while no other countryor region does so, we address the question of first-mover advantages, one of thechief reasons for preferring a bilateral or regional strategy over a multilateral one.The results from the simulation support the notion of first-mover gains: about halfof the developing regions would be better off with a bilateral agreement than witha global agreement (Appendix 1).10 In some cases, however, this conclusion doesnot hold: the rest of the Sub-Saharan Africa region could suffer losses from abilateral agreement with the Quad because this region already has relatively freeaccess to the Quad markets. Permitting greater imports from the Quad would worsentheir terms of trade and negate gains from the bilateral agreement. The RussianFederation and the Middle East are dependent on energy exports, which face lowtariffs in industrial countries (even if energy is heavily taxed), so these regionshave little to gain from additional market access.
Table 1. Comparison of bilateral scenarios to global trade reform
Change in real income in 2015 compared to baseline
Source: World Bank simulations.
Global merchandise trade reform
All developing sign bilateral with Quad-
plus
All developing (minus large
countries) sign bilateral with Quad-
plus
(1) (2) (3)US$ billions
High-income countries 154.4 133.6 46.9Low-income countries 16.6 –19.0 –1.9Middle-income countries 92.2 –2.6 –4.7All developing countries 108.8 –21.5 –6.6World total 263.2 112.0 40.3
PercentHigh-income countries 0.6 0.5 0.2Low-income countries 0.9 –1.0 –0.1Middle-income countries 1.2 0.0 –0.1All developing countries 1.2 –0.2 –0.1World total 0.8 0.3 0.1

TRADE, DOHA, AND DEVELOPMENT: A WINDOW INTO THE ISSUES
318
The chief reservation about the third simulation, of course, is that it is starklycounterfactual. The idea that a single developing country or region would be ableto sign an exclusive agreement with the Quad countries without competition fromother developing countries is unrealistic. The increase in the number of agreementsover the last decade means that a sizable portion of any first-mover advantagealready has been eroded.
ConclusionsDeveloping countries could gain an (unweighted) average of 1.7 percent in realincome from a global agreement. However, if all developing countries signed bilateralagreements with the Quad, creating a complex system of bilateral and regionalagreements, developing countries would suffer losses averaging 0.4 percent (1percent for the low-income countries). Virtually all developing countries would beworse off than at present,
While some individual developing countries might have gained from enteringexclusive agreements with Quad countries, the proliferation of RTAs probably hasalready eliminated that first-mover advantage.
In general terms, multilateralism is the most development friendly outcome.This conclusion is highlighted if we extend the simulation to several
hypothetical North–South and South–South regional trading blocks (figures 3and 4).11 Several of these (a broad free trade region in East Asia, for example) offersignificant gains, but not as great as the gains from global merchandise tradereform. The difference can be much more pronounced in the case of South–Southagreements, where the multilateral alternative clearly dominates the regional one.Forming North–South regional blocks individually always produces higher gainsthan forming them simultaneously.
The potential benefits of RTAs are now well understood. They can be easierto negotiate because they involve fewer partners; they can help consolidate adomestic reform agenda; they usually extend beyond the reduction of tariffs toinclude other cross-border issues; and they can confer political benefits, such asstrengthening regional relations.
Also well understood are the characteristics of the most successful andsustainable RTAs:• Low external MFN tariffs
• Few sectoral and product exemptions
• Nonrestrictive rules-of-origin tests that build toward a framework common to
many agreements
• Measures to facilitate trade
• Large ex post markets• Measures to promote new cross-border competition, particularly in services

REGIONALISM VS. MULTILATERALISM
319
Figure 3. Global reform dominates North–SouthChange in real income in 2015 relative to the baseline in percent
Note: Multilatera refers to the global merchandise trade reform scenario, Individual Blocks iswhen the North/South regional blocks are formed individually and Block in all Regionsis whenthe North/South regional blocks are implemented simultaneously.Source: World Bank simulations
0.0
0.2
0.4
0.6
0.8
1.0
1.2
1.4
1.6
East Asia Europe The Americas
Multilateral
Individual Blocks
Blocks in all Regions
Figure 4. …and South–South agreements
Change in real income in 2015 relative to the baseline in percent
Note: Multilateral refers to the global merchandise trade reform scenario, and IndividualBlocks is when the South/South regional blocks are formed in isolation.Source: World Bank simulations.
0.0
0.5
1.0
1.5
2.0
2.5
3.0
LAFTA AFTA CIS SSA M NA SAFTA
Multilateral
Individual Blocks

TRADE, DOHA, AND DEVELOPMENT: A WINDOW INTO THE ISSUES
320
• Rules governing investment and intellectual property that are appropriate tothe development context.The simulations reported here confirm the contention that to create trade and
exert the fewest possible exclusionary effects, regional agreements must have lowMFN tariffs and mild border barriers, so their impact gets closer to that of a globalreform scenario. The best way to ensure that regional agreements have thesecharacteristics is to accelerate progress on the Doha Round and to fill in the blanksof the July 2004 Framework Agreement with multilateral reductions in protection,especially for products produced by the world’s poor.
Notes1. We use the term RTA to refer to agreements signed eiether by pairs of trading partners or by
a group of countries.2. Note based on chapter 6 in Global Economic Prospects 2005.3. Of all the WTO member countries, only Mongolia is not engaged in an RTA. Eleven
nonmembers of WTO are not party to an RTA.4. The distortions included are input and output subsidies, direct payments, and export subsi-
dies.5. The results described herein were produced using the GTAP V6.01 database. Using the most
recent version of the database, the gains from global merchandise trade reform amount to $287billion, but these minor differences in outcomes have little bearing on the overall findings.
6. Under the bilateral agreements, domestic distortions are not removed because they are notspecific to any individual trading partner.
7. All scenarios overstate bilateral and multilateral effects because they assume that no sectorsare exempt and that rules of origin are not restrictive.
8. A detailed table of effects is provided as Appendix 1.9. Note that some of the high-income Asian countries—for example Republic of Korea and
Singapore—are excluded from the bilateral agreements and therefore tend to lose, in part,because of trade diversion.
10. According to this scenario, the winners (relative to global liberalization) are: China,Indonesia, Mexico, Southern African Customs Union, rest of South Asia, and EU accessioncountries. Among the losers: Brazil, India, Russian Federation, Vietnam, rest of East Asia, rest ofEurope and Central Asia, Middle East and North Africa, rest of Sub-Saharan Africa, and rest ofLatin America and the Caribbean.
11. The three North–South agreements include a broad East Asia region that encompassesboth the high-income and developing countries, the FTAA in the Western Hemisphere, and abroad free trade area centered on the European Union, including the new accession countries andextending to the Middle East and North Africa and Sub-Saharan Africa. The South–Southagreements include a Latin American–wide RTA (LAFTA), a developing East Asian RTA (AFTA),a Europe and Central Asia RTA that excludes the EU accession countries (CIS), a Sub-SaharanAfrican RTA (SSA), the Middle East and North Africa (MNA), and a South Asian RTA (SAFTA).

REGIONALISM VS. MULTILATERALISM
321
Further readingCrawford, Jo-Ann, and Roberto V. Fiorentino. 2005. “The Changing Landscape of Regional
Trade Agreements.” WTO Discussion Paper 8. World Trade Organization, Geneva.World Bank. 2005. Global Economic Prospects: Trade Regionalism, and Development 2005.
Washington, DC: World Bank.

TRADE, DOHA, AND DEVELOPMENT: A WINDOW INTO THE ISSUES
322
Ch
an
ge
in
re
al
inco
me
in
20
15
co
mp
are
d t
o b
ase
line
Sour
ce:
Wor
ld B
ank
Sim
ulat
ions
Ap
pe
nd
ix
1.
Co
mp
ari
so
n o
f b
ila
tera
l a
gre
em
en
ts w
ith
glo
ba
l tr
ad
e r
efo
rm
Glo
bal
mer
chan
dise
tr
ade
refo
rm
Bil
ater
al
agre
emen
ts
betw
een
Qua
d-pl
us a
nd a
ll
dev
elop
ing
coun
trie
s
Bil
ater
al
agre
emen
ts b
etw
een
Qua
d-pl
us a
nd
deve
lopi
ng
coun
trie
s ex
clud
ing
larg
e co
untr
ies
Bil
ater
al
agre
emen
ts
betw
een
Qua
d-pl
us
and
each
de
velo
ping
cou
ntry
Glo
bal
mer
chan
dise
tr
ade
refo
rm
Bil
ater
al
agre
emen
ts
betw
een
Qua
d-pl
us a
nd
all
deve
lopi
ng
coun
trie
s
Bil
ater
al
agre
emen
ts b
etw
een
Qua
d-pl
us a
nd
dev
elop
ing
coun
trie
s ex
clud
ing
larg
e co
untr
ies
Bil
ater
al
agre
emen
ts
bet
wee
n Q
uad-
plus
an
d ea
ch
deve
lopi
ng c
ount
ry
(1)
(2)
(3)
(4)
(5)
(6)
(7)
(8)
Aus
tral
ia, C
anad
a, a
nd N
ew Z
eala
nd8.
46.
00.
50.
70.
50.
0U
nite
d St
ates
24.9
32.3
10.7
0.2
0.3
0.1
Eur
opea
n U
nion
with
EF
TA
55.0
82.4
33.6
0.7
1.1
0.4
Japa
n29
.725
.04.
80.
90.
80.
1K
orea
and
Tai
wan
(C
hina
)26
.4–9
.8–2
.32.
6–1
.0–0
.2H
ong
Kon
g (C
hina
) an
d S
inga
pore
9.8
–2.4
–0.3
2.8
–0.7
–0.1
Bra
zil
8.0
1.5
–1.7
7.3
1.4
0.3
–0.3
1.3
Chi
na14
.19.
7–7
.221
.80.
60.
4–0
.31.
0In
dia
4.3
–10.
0–3
.12.
10.
5–1
.2–0
.40.
2In
done
sia
3.6
–2.3
3.0
5.1
1.4
–0.9
1.2
2.1
Mex
ico
0.3
–1.5
–1.3
2.6
0.0
–0.2
–0.2
0.3
Rus
sian
Fed
erat
ion
2.9
–1.7
–1.3
0.8
0.8
–0.5
–0.3
0.2
Sou
th A
fric
an C
usto
ms
Uni
on2.
5–0
.30.
83.
71.
8–0
.20.
52.
6V
ietn
am2.
4–0
.20.
60.
95.
0–0
.51.
31.
9R
est o
f E
ast A
sia
19.6
–5.0
–2.8
7.4
4.7
–1.2
–0.7
1.8
Res
t of
Sout
h A
sia
0.4
–3.2
–1.1
1.2
0.2
–1.3
–0.4
0.5
EU
acc
essi
on c
ount
ries
0.8
–2.0
–0.5
0.9
0.2
–0.4
–0.1
0.2
Res
t of
Eur
ope
and
Cen
tral
Asi
a2.
3–3
.3–1
.30.
40.
5–0
.7–0
.30.
1M
iddl
e E
ast
6.1
–2.7
–0.1
1.3
0.9
–0.4
0.0
0.2
Nor
th A
fric
a19
.11.
94.
35.
76.
70.
61.
52.
0R
est o
f Su
b-Sa
hara
n A
fric
a2.
9–3
.0–2
.5–0
.21.
1–1
.2–1
.0–0
.1R
est o
f L
atin
Am
eric
a an
d C
arib
bean
16.3
0.9
6.4
9.6
1.6
0.1
0.6
0.9
Res
t of
wor
ld3.
0–0
.31.
24.
01.
3–0
.10.
61.
8H
igh-
inco
me
coun
trie
s15
4.4
133.
646
.90.
60.
50.
2L
ow-i
ncom
e co
untr
ies
16.6
–19.
0–1
.90.
9–1
.0–0
.1M
iddl
e-in
com
e co
untr
ies
92.2
–2.6
–4.7
1.2
0.0
–0.1
All
deve
lopi
ng c
ount
ries
108.
8–2
1.5
–6.6
1.2
–0.2
–0.1
Wor
ld to
tal
263.
211
2.0
40.3
0.8
0.3
0.1
Bil
lions
of
doll
ars
Per
cent

Aid for Trade
Julia Nielson27
Many poor countries have been unable to use trade as an engine for growth.Some lack the necessary infrastructure—roads, ports,telecommunications—to link their producers to global markets. Others
have inefficient institutions—for customs, tax, and product standards—that driveup the costs of trading. Or producers may lack knowledge about market opportunitiesand how to access them. For countries that have such problems, market access isnot the major challenge; many are unable to use their existing—and oftenpreferential—access to large markets for lack of transport facilities or the ability tomeet high standards in export markets.
A second set of constraints is rooted in the political economy of domesticpolicy. Some poor countries are reluctant to undertake trade-policy reforms thatmay be in their long-term interest because of concerns about short-term adjustmentcosts. They may be reluctant to cut tariffs, for example, for fear of losing governmentrevenue. Trade reforms typically create winners and losers, and many poor countriesface considerable challenges in providing safety nets, retraining, and other meansof adjustment for affected groups.
More recently, the potential costs of adjusting to liberalization by other countrieshave raised similar concerns. Some countries fear the erosion of their preferentialmarket access as trading partners reduce their tariffs on a nondiscriminatory basis.Some net food importers are concerned about the impact of rising food pricesfollowing reform of agricultural subsidies in rich countries.
Against this background, many poor countries see more threats thanopportunities in the current trade talks. With little confidence that they will be ableto benefit from further market opening, and amid concerns about the potentialadjustment costs of their own and others’ liberalization, many of the poorest countrieshave adopted a defensive position across the board in the Doha Round, therebythreatening the success of the talks.
There is thus a compelling case, from the perspectives of development andtrade, for helping countries overcome the constraints that prevent or discouragethem from taking advantage of new market openings. The development case is themost important: countries that are unable to integrate into global markets miss outon important sources of sustainable growth and poverty reduction. But the tradecase is important, too: additional assistance is essential to encourage the poorestcountries to support an ambitious outcome from the Doha Round, and thus tomaintain a strong and effective multilateral trading system—both very much in the
323

TRADE, DOHA, AND DEVELOPMENT: A WINDOW INTO THE ISSUES
324
interests of poor countries. Additional assistance is thus a key complement to, butnot a substitute for, ambitious trade liberalization under the Doha Round.
This is the reasoning behind the current push to increase “aid for trade.”
What is “aid for trade”?In practical terms, aid for trade encompasses five main activities:• Technical assistance: the provision of technical assistance, advice, and exper-
tise to assist countries confronted with the complexities of modern trade.• Capacity building: building the capacity of developing countries to deal with
trade issues, for example, through the training of government officials.• Institutional reform: helping to create a framework of sound and well-func-
tioning institutions for trade—in customs, quality assurance, and other areas.• Infrastructure: improving roads and ports to link the poor and the goods they
produce to markets through investment in infrastructure.• Assistance with adjustment costs: fiscal support and policy advice to help
countries cope with any transitional adjustment costs from liberalization.Successful aid-for-trade projects generally combine most of these elements.
For example, the World Bank is working with Vietnam on a project for comprehensivecustoms reform, encompassing capacity building, simplification of clearanceprocedures, modernization of the legal framework, and improved information andcommunication technology. Likewise, the Standards and Trade Development Facility,initiated by the World Bank and the World Trade Organization (WTO), uses amixture of financing, technical assistance, and donor coordination to build thecapacity of developing countries to meet international standards in food andagricultural exports.
In this sense, aid for trade is not new—mechanisms aimed at increasing thesupply-side capacity of developing countries and easing adjustment concernshave been part of development programs for some time (box 1).
The purpose of the current push on aid for trade is to significantly scale up thisaid and to make it more effective. This is timely for a number of reasons:• First, annual development aid is expected to increase by $50 billion by 2010, if
recent promises are kept. The increase will bring greater scrutiny of the extentto which aid contributes to sustained growth. Important new agreements havealso been reached on increasing aid effectiveness through a greater focus oncountry ownership, donor coordination, and harmonization of aid policies.
• Dealing with the real currency appreciation from increased aid will requiregreater attention to trade liberalization, facilitation, and internationalcompetitiveness.
• Recent international initiatives on debt relief should be complemented by actionto increase the trade capacity of the poorest countries if they are to avoid
future unsustainable debt.

AID FOR TRADE
325
Box 1. Rwandan coffee: challenges, opportunities, and therole of aid for trade
Coffee is a key export crop in Rwanda. In 2003, an aggressive strategywas developed to increase total exports of coffee and move the industry intothe high-quality, specialty end of the market. The strategy will require anestimated investment of $69 million: $24.75 million from donors and NGOs,$23 million from the private sector, and $21.25 million from the Rwandangovernment.
Major efforts are needed to achieve a reputation for Rwanda as a qualityproducer through international exhibitions, demonstrations, andcontests—and strict quality control. Two long-term, donor-funded projectshave been assisting producers in developing buyer–seller relationships andhelping growers raise quality. Aid projects have also helped farmers to formcooperatives to meet the requirements of “fair trade” coffee and to experi-ment with organic and shade-grown coffees, all of which command asubstantial premium over ordinary coffee.
Increased access to washing stations has increased farmers’ incomes byup to 55 percent. Washing and grading the coffee cherries has made itpossible to obtain higher prices for products of higher quality, givingfarmers an incentive to increase quality. At one aid-for-trade project,washing stations track the output from individual farmers so that if aparticular batch is sold at an exceptional price, part of the revenue flowsback to the individual farmer. Regulatory reform has also allowed individualRwandan cooperatives and private owners to negotiate directly withspecialty roasters in the United States and Europe, enabling them to sell tospecialty markets at more than twice the market rate.
The quality and the image of Rwandan coffee have improved markedly as aresult of these efforts. However, the industry still faces challenges, for whichfurther aid for trade is needed. Those challenges include: access to finance(donors are already providing some help in steamlining rural finance amongproducers’ organizations); access to low-cost transport (the cost of transport-ing coffee from the farm gate to the port is 80 percent of the amount receivedby the coffee farmer, and major upgrading of transport infrastructure isneeded); access to training (half a million Rwandan farmers need extensivetraining in all aspects of coffee production, but there are few agronomists);and developing associations and cooperatives (technical assistance isneeded to strengthen coffee farmers’ cooperatives and to form an overallindustry association, along with reform of unclear government regulations).
Source: World Bank-IF 2005.

TRADE, DOHA, AND DEVELOPMENT: A WINDOW INTO THE ISSUES
326
• Finally, the critical juncture of the Doha Round provides a political focus foraid for trade. Global, nondiscriminatory trade liberalization under the WTO hassome of the characteristics of a global public good—that is, a good from whicheveryone benefits but to which not everyone has sufficient incentive tocontribute. All countries benefit from one country’s trade reforms and trade-related investments, and benefits are increased when undertaken by severalcountries concurrently. However, the full benefits of reform are not necessarilycaptured by the country itself, which may lead to underinvestment in reform.Aid for trade is one way to ensure the provision of this global public good.
Steadily increasing aid for tradeRecent trends form a strong basis on which to build. Data compiled jointly by WTOand the Organization for Economic Cooperation and Development/DevelopmentAssistance Committee (OECD/DAC) indicate that resources devoted to trade-relatedcapacity building and technical assistance increased significantly in 2003, afterbeing static between 2001 and 2002 (figure 1).
Commitments for trade policy and regulations increased from about $660million per year in 2001–02 to almost $1 billion in 2003. These sums support effectiveparticipation in multilateral trade negotiations, analysis and implementation ofmultilateral trade agreements, trade-policy mainstreaming, development of technicalstandards, trade facilitiation (including tariff structures and customs regimes),regional trade agreements, and human-resource development in trade.
0.5
0.8
1.0
1.3
1.5
1.8
2.0
Trade policy and regulations Trade development activities
2001 - 2002
2003
0.5
0.8
1.0
1.3
1.5
1.8
2.0
Trade policy and regulations Trade development activities
2001 - 2002
2003
Source: OECD-DAC/WTO database.
Figure 1. Trade assistance is expanding…
Trade-related technical assistance in U.S. $ billions, all donors

AID FOR TRADE
327
Commitments for trade development activities increased from $1.35 billion peryear in 2001–02 to $1.8 billion in 2003. This covers business development andactivities aimed at improving the business climate, access to trade finance, andtrade promotion in the productive sectors (agriculture, forestry, fishing, industry,mining, tourism, services) including at the institutional and enterprise level. TheOECD/DAC database does not include activities to enhance infrastructurenecessary for trade (roads, storage, communications, energy) due to difficulties inassessing the extent to which they are related to international trade, as opposed tothe general economic climate of the country.
The World Bank has been rapidly expanding its support for trade throughenhanced investments in infrastructure and support for trade facilitation. (Detailsof the Bank’s activities, projects and lending related to trade are outlined in chapter5.) Additionally, the Bank has a major program of trade research and a growingprogram of trade capacity building. It also is committed to incorporating trade-expanding projects into its country programs as a crucial step toward higher long-term growth. To that end, the Bank has been deeply involved in the IntegratedFramework for Trade-Related Technical Assistance (box 2).
But despite these and other initiatives by donors and internationalorganizations, demand for aid for trade continues to outstrip supply, and manypoor countries have the capacity to absorb significantly more assistance. Moreneeds to be done, and there is presently a window of opportunity to move forward.
What more can be done?In February 2005, the G-7 Finance Ministers called on the World Bank and Interna-tional Monetary Fund to develop proposals for additional assistance to countriesto ease adjustment to trade liberalization and to increase their capacity to takeadvantage of more open markets. The call was reinforced by the Bank’s 184shareholders in April and again by the G-8 in July. Following extensive consulta-tion, the Bank and Fund put forward a package of three proposals that receivedstrong endorsement from ministers at the joint Bank-Fund annual meetings inSeptember 2005. Work is now under way on their implementation.
Consultations held by the Bank and Fund revealed a sharp difference over thebest way forward. For some, aid-for-trade needs would be best met by the estab-lishment of a dedicated multilateral fund, as the only way to ensure that sufficient,additional resources were made available. Trade, they argue, is never likely torank high enough among a country’s priorities to receive funding via regularchannels—particularly for poor countries with pressing demands in basic ser-vices such as health, and education. Countries should not have to choose be-tween meeting basic needs now and investing in future growth; the “market fail-ure” on trade should be addressed by a separate fund.

TRADE, DOHA, AND DEVELOPMENT: A WINDOW INTO THE ISSUES
328
Box 2. The Integrated Framework and the least developedcountries
The Integrated Framework for Trade-Related Technical Assistance (IF)brings together multilateral agencies (the International Monetary Fund,International Trade Centre, U.N. Conference on Trade and Development,U.N. Development Programme, World Bank, and WTO) and bilateral donorsto assist least developed countries (LDCs). It has two objectives: (i) tointegrate trade into national development plans such as poverty reductionstrategies; and (ii) to assist in the coordinated delivery of trade-relatedtechnical assistance in response to needs identified by the LDC. The IF isbuilt on the principles of country ownership and partnership.
The first step in the application of the IF to a given country is preparationon a diagnostic trade integration study (DTIS). The DTIS specifies the mainelements of a policy framework for national trade integration and an actionmatrix that maps out the delivery of trade-related technical assistance whileidentifying trade-related investment needs. A special facility created in May2003 finances small, priority technical assistance and capacity buildingprojects of up to $1 million per country.
By the end 2005, DTISs will have been completed in 21 countries; sevenmore LDCs have started the process and nine more have applied to join theIF. At the end of May 2005, 22 projects had been approved in 12 countries,amounting to $8 million, covering many areas—among them buildingcapacity for trade negotiation (Cambodia, Ethiopia, Madagascar), export-related information gathering and dissemination (Yemen), and sector-specificinstitutional and technical support (Burundi, Ethiopia, Senegal). Some 17donors had pledged $30.2 million to the trust fund that finances the IF.
Notwithstanding the mismatch between its highly ambitious objectivesand very modest resources, the IF has produced some good results. It hasprovided concrete capacity building projects (with just $8 million); madesolid progress in the difficult task of coordinating donors and internationalagencies; contributed to greatly increased understanding of the constraintsfacing poor countries; and brought IF governments to the table on trade.

AID FOR TRADE
329
For others, such dedicated funds interfere with countries’ ability to set theirown priorities for donor financing; an ability that is a cornerstone of internationallyagreed principles of aid effectiveness. Dedicated funds, it is argued, risk skewingpriorities toward areas where external funding is available. Programs determinedsimply by the availability of funding tend to be insufficiently owned, and thus lesslikely to succeed. And, in any case, it is very difficult to know when funding is trulyadditional; creation of a new multilateral fund is no guarantee that funds have notbeen reallocated from other areas. The debate will continue.
So what’s on the agenda for aid for trade?
Enhancing the Integrated Framework (IF)The key initiative is enhancing the IF. Built on sound principles—country ownership,donor coordination, and mainstreaming of trade into national developmentstrategies—the IF already has shown achievements to date, but it has lacked thescale to bring about real transformations at the national level. Challenges haveincluded weak in-country capacity, lack of systematic follow-up at the countrylevel, insufficient and uncertain financing, and variable donor response to prioritiesidentified in the diagnostic trade integration study that provides the road map fornational action under the IF.
Recent enhancements to the IF address those issues. They include a significant,multiyear expansion of resources for technical assistance and capacity building,and for strengthened governance and increased ownership at the country level.The main objective is still to mainstream trade into national development strategiesto ensure policy coherence, increase donor coordination, and maximize financing oftrade-related projects through bilateral and multilateral channels. Key features ofthe enhanced IF are:• Increased resources: predictable, multiyear financing on the order of $200–
$400 million, to be disbursed to participating LDCs over an initial five-yearperiod, and taking the form of grants, not loans. Additional resources are alsorequired for more effective governance at both the country and global levels.
• Strengthened in-country structures: increased up-front resources to helpcountries implement the IF at the national level—for example, by establishingimplementation units within or closely linked to key economic ministries anddeveloping coherent trade strategies. Involvement of the private sector andcivil society in consultative bodies and project delivery has increased. Ongoingfunding allocations are subject to performance.
• Strengthened governance: a lean and effective governance structure to ensurerapid and accountable disbursement of funds, with a professional, fully fundedsecretariat.
• Improved links to donor processes: stronger links between identified large-

TRADE, DOHA, AND DEVELOPMENT: A WINDOW INTO THE ISSUES
330
scale needs (such as trade-related infrastructure) and donor funding throughproject-preparation studies in areas of priority. An essential corollary to theincreased resources of the IF is increased donor willingness to fund aid fortrade in the poverty reduction strategy (PRS) process. Several bilateral donorshave already indicated their intention to devote more resources to aid fortrade.
• Multiyear programs of technical assistance and capacity building: relatedto, for example, trade policy and strategy, strengthening of core trade-relatedinstitutions and functions, administrative and regulatory reforms,intragovernmental coordination, and private sector capacities and initiatives.1
• Possibility of extended coverage: while the IF has traditionally been a programfor LDCs, consideration could be given to extending it to other low-incomecountries on the understanding that benefits for LDCs should not be diminished.With thorough and meaningful implementation, the enhanced IF should address
most aid-for-trade needs through countries’ increased capacity to build trade needsinto the PRS process, and through donors’ increased willingness to make fundsavailable for aid for trade in that context. This approach provides greater certaintythat funds will be available to meet key needs, while preserving the centrality ofcountry priorities determined in the PRS process, in line with agreed principles ofaid effectiveness.
Regional and cross-country issuesWhile country priorities should be taken into account by the enhanced IF, sometrade-related issues may not be sufficiently addressed in the PRS process—forexample, regional issues. Cross-country issues may be particularly important forsmall, very poor, or landlocked countries that are dependent on action by neigh-bors for whom the issue may not be a high priority. For example, the roads thatRwanda requires to reach the ports of Mombasa and Dar es Salaam require thecooperation of Kenya, Tanzania and Uganda, but for those countries, roads in thehinterland may be a low priority. With 20 landlocked countries in the low-incomegroup, there is a need to ensure that these issues do not fall through the gaps.
Small, very poor, or landlocked countries are also likely to face competingdemands for existing resources. It may make sense for them to consider cost-effective regional machinery for trade, such as regional laboratories for standardstesting or even regional infrastructure or regulatory frameworks to support liber-alization in services such as electricity or telecommunications.
In the coming months, the Bank and Fund will examine the extent to whichregional and cross-country needs are being met by existing mechanisms andwhether there is a need for new ones. Possible new mechanisms to be exploredinclude the opportunities offered by the enhanced IF, the scope for extendingexisting World Bank instruments, and a dedicated multilateral fund to provide grant

AID FOR TRADE
331
cofinancing for regional projects in close coordination with other multilateral devel-opment banks and relevant agencies. Rather than cutting across country priorities,a fund in this instance could fill the gap left by the country-focused PRS process,addressing public goods among countries where all stand to gain.
Smoothing adjustments to trade liberalizationTrade liberalization creates adjustment problems for some countries; in some cases,the adjustment can be considerable. Countries suffering adjustment shocks fromtrade liberalization, including the Doha Round, need to be assured of transitionalsupport from the international community.
A first step is identifying the countries affected. The Bank and Fund plan toassess the nature and magnitude of adjustment needs of countries that present aprima facie case of significant adjustment shocks. That group is likely to include,for example, countries negatively affected by the end of textile quotas and bypreference erosion, net food importing countries, and countries undertaking majorprograms of trade reform.
Assessing the impact of adjustment shocks requires consideration of a widerange of factors, including: the possibility of offsetting lost tariff revenue throughcustoms reform and more efficient collection of tariffs; the likely time frame foradjustment; the extent to which existing preferences were used (theoretical accessdoes not always translate into actual exports because of strict rules of origin); theextent of liberalization undertaken by trading partners on products subject topreferences; and the characteristics of affected industries and groups.
On the basis of these assessments, the international agencies will work withcountries to design policies to help manage adjustment impact. They also willidentify opportunities to provide assistance through instruments such as structuraladjustment loans from the World Bank and the IMF’s Trade Integration Mechanism.2
Where a country is suffering particularly severe adjustment costs, they willcoordinate with other donors to marshal additional assistance.
An investment in the futureImplementation of these initiatives, coupled with increased aid-for-trade resourcesin bilateral assistance programs, form a sound basis for exploiting the developmentpotential of trade. The investments required now may seem large, but aid for tradeis an investment in the future—one that promises a high rate of return by supportinghigher growth in poor countries. Aid for trade should thus be seen as anothercomponent of stepped-up international efforts—greater overall aid, debt relief, andtrade liberalization under the Doha Round—to help the poorest countries achievethe Millennium Development Goals.

TRADE, DOHA, AND DEVELOPMENT: A WINDOW INTO THE ISSUES
332
Notes1. Projects depend on country needs and priorities but may include: trade policy capacity,
customs (computerization, risk management), standards (training, surveillance, and accredita-tion), development of export and investment promotion agencies, sectoral support (productdevelopment, supply chain upgrading), and development of regulatory frameworks to supportservices liberalization.
2. The Trade Integration Mechanism is designed to assist member countries to meet bal-ance-of-payments difficulties that might result from trade liberalization by other countries.Two countries have taken advantage of it to date—Bangladesh ($78.03 million) and theDominican Republic ($32.03 million).
ReferencesWorld Bank-IF. 2005. Rwanda: Diagnostic Trade Integration Study. Washington, DC: World
Bank.
Further ReadingBhagwati, J. 2004. In Defense of Globalization. Oxford University Press.Finance and Development, March 2005. Volume 42, Number 1. IMF.Prowse, S. and B. Hoekman. 2005. Economic Policy Responses to Preference Erosion: From
Trade as Aid to Aid for Trade, World Bank Working Paper 3721 available at http://econ.worldbank.org.
World Bank and IMF. 2005. The Doha Development Agenda and Aid for Trade, paper for theDevelopment Committee DC 2005 - 00016, available at www.worldbank.org.
Zedillo, E., P. Messerlin and J. Nielson. 2005. Trade for Development: Report of the Task Forceon Trade to the Millennium Project, available at http:// www.ycsg.yale.edu/focus/index.html.

Preference Erosion: The Terms of the Debate
Bernard Hoekman, Will Martin, Carlos A. Primo Braga28
Nondiscrimination is the cornerstone of the multilateral trade system. Asexpressed in the most-favored-nation (MFN) clause embodied in Article Iof the General Agreement on Tariffs and Trade (GATT), it was the defining
principle of the trading system that emerged in the post–World War II era—largelyas a reaction to the folly of protectionism and preferential trading arrangements thathad contributed to the global economic depression of the 1930s. However, GATTallowed for exemptions to the MFN rule: reciprocal preferential agreements andunilateral preferences granted to developing countries.1
The rationale for grants of preferential access to the markets of industrializedcountries emerged from arguments in favor of special and differential treatment(SDT) for developing countries under GATT. The underlying justification for SDT,in turn, reflected development thinking in the early 1960s, notably the theory ofimport-substitution industrialization. That theory was premised on the argumentthat developing countries needed to foster industrial capacity both to reduce importdependence and to diversify away from traditional commodities that were subjectto declining terms of trade over the long term (and often also affected by short-termprice volatility). The practical expression of that argument was the policy of erectingtrade barriers to protect infant industries. At the same time it was recognized thatexports were important as a source of foreign exchange and that the local marketmight be too small for local industry to be able to capture economies of scale. Thesecond plank of the SDT agenda, therefore, was preferential access—a generalsystem of preferences that would give developing countries better treatment in themajor markets of the world. The Generalized System of Preferences (GSP), theframework for providing such preferences, was established in 1968 under theauspices of the United Nations Conference on Trade and Development (UNCTAD).
Trade preferences are a central issue in ongoing efforts to negotiate furthermultilateral trade liberalization in the Doha Round. Middle-income countries areincreasingly concerned about the discrimination they confront in OECD markets asa result of the better access granted to preferred countries, whether developing orother industrialized countries covered under regional free trade agreements.Conversely, the least developed countries (LDCs) and non-LDC countries in theAfrica, Caribbean, and Pacific (ACP) group worry that general, MFN-basedliberalization of trade will erode the value of the preferential access they presentlyenjoy. Matters are compounded by the fact that for many of the poorest countries
333

TRADE, DOHA, AND DEVELOPMENT: A WINDOW INTO THE ISSUES
334
preference programs have become more valuable at the margin as OECD countrieshave granted duty- and quota-free access for a larger number of products (andsometimes all products). Preference-receiving countries are also concerned thatmultilateral liberalization may affect their terms of trade and raise the price of importsthat currently are subsidized in OECD markets.
The value of preferencesBut how valuable are the preferences available to developing countries? OECDpreference programs explicitly differentiate between developing countries (by re-gion, level of development, and export capacity) and impose significant “condition-ality” in the determination of eligibility and product coverage, including rules oforigin and nontrade requirements. In addition to the GSP, high-income countriesmaintain a variety of schemes. The European Union has preferences for ACP mem-bers as well as a separate program for the LDCs (Everything But Arms). The UnitedStates has maintains several regional schemes (for example, for the Caribbean andAfrica). This plethora of preferences makes empirical assessments of their effectsdifficult, a task further complicated by the difficulty of identifying the specificimpact of preferences as opposed to other factors. The observed growth rate ofexports from recipients to the countries granting trade preferences, for example, isnot informative without controlling for other factors.
The policy literature has tended to rely on descriptive indicators to assess theimpact of preferences. Four indicators are particularly common:• Preference margins: the difference between MFN and preferential tariffs for
products• Potential coverage: the ratio between products covered by a scheme and the
dutiable imports originating in beneficiary countries• Utilization: the ratio between imports that actually receive preferential treat-
ment and those that are in principle covered• Utility: the ratio of the value of imports that get preferences to all dutiable
imports from that exporter (the lower this number, the less generous the prefer-ence scheme).Such indicators provide at best a partial perspective of the economic value of
preferences. To get a more precise estimate of the value of preferences one has totake into account: (i) the cost of compliance with documentary requirements; (ii) theeconomic costs of rules of origin insofar as these require sourcing inputs from moreexpensive sources; (iii) other limitations and constraints embodied in preferentialschemes; and (iv) the distribution of any rents that are created (part of these rentsmay be captured by importers).
The average estimate in the recent empirical literature is that documentaryrequirements imply costs of some 3–5 percent of the value of processed goods.This means that MFN tariffs must be about 4 percent higher than preferred rates, on

PREFERENCE EROSION
335
average, for preferential access to be meaningful. Given that the average MFN tariffin the OECD is close to 4 percent, preferences can only matter where there are tariffpeaks or quotas.
The simplest measure of the transfers generated by a preferential regime is tocalculate the difference between the applied tariffs facing a country and the MFNtariffs that would otherwise have applied. This measure is an upper bound on thevalue of the transfers, since many countries receive preferences. Thus, the truepreference margins for a country should be adjusted for the preferences beingreceived by other countries. Unfortunately, the literature does not currently providea number of estimates of these “true” preference margins. We therefore focus onthe simpler, traditional, margin of preference as an indication of the overall per unitvalue of preferences (table 1).
There are some important conceptual differences among the various measures
presented in table 1. Those calculated by Brenton and Ikezuki (2005) give the mar-
gin relative to the overall value of exports from the country to the granting market.
By contrast, Low, Piermartini, and Richtering (2005) refer to the margin only on
those exports for which there is a nonzero duty and a positive apparent preference.
Despite these methodological differences, table 1 suggests substantial consis-
tency across alternative measures. The average margins tend to be higher in Eu-
Beneficiary countries EU U.S. Japan Canada Australia
Quad + Australia
6.6a 3.2a 2.6a
4.1d 2.6d 10.9d
Sub-Saharan Africa
4.0b 1.3b 0.1b — — —
African LDCs 2.3b 2.1b 0.4b — — —LIX 3.8c 0.5c — — — —
3.8a 2.6a 2.0a
3.4d 2.6d 3.4dAll 1.6d 1.5d 3.4d
Granting Countries
LDCs 4.2d 3.6d 4.6d
— No data.Note: LDCs = United Nations’ list of least developed countries. LIX = World Bank low-income countries excluding India. GSP = all potential recipients of GSP. Quad = Canada,European Union, Japan, United States.Sources: a. IMF (2003: 8); b. Brenton and Ikezuki (2005: 27); c. van der Mensbrugghe(2005).; d. Low, Piermartini, and Richtering (2005).
Table 1. Nonreciprocal preference margins for developing countryexporters(percent)

TRADE, DOHA, AND DEVELOPMENT: A WINDOW INTO THE ISSUES
336
rope relative to the other markets, while average preference margins are lower in
Japan than in the European Union or the United States. There are surprisingly small
gaps between the preference margins granted to LDCs and to developing countriesas a whole under the GSP in the European Union, the United States, and Japan. Incontrast, Canada and Australia appear to give substantially higher margins of pref-erence to the LDCs. A similar result was found in World Bank and IMF (2005) usinga measure of the overall tariff equivalent of trade policies. The latter measure in-cludes nontariff measures such as health and safety standards (sanitary andphytosanitary measures) applied by the OECD countries—policies that are notaffected by preference programs.2
A measure of the overall value of preferences corresponding with the preferencemargin numbers in table 1 can be obtained by multiplying the margins by the valueof imports to which they apply. Table 2 reports such figures, using the margins andassociated trade numbers of Low, Piermartini, and Richtering (2005), because thatstudy uses disaggregated and up-to-date estimates of the imports subject topreferential treatment. Of the total of $587 million in estimated potential value ofpreferences to LDCs, $287 million, or almost half, is provided by the EuropeanUnion. The United States is the next largest provider, at $131 million per year.Japanese preferences amount to almost $50 million per year, while Canada andAustralia are much smaller at $14 million and $0.4 million per year. The comparisonof the preferences received by LDCs and other developing countries shows thatthe bulk of preferences accrue to non-LDCs, reflecting the small share of LDCs istotal developing-country exports.
Independent of their estimated aggregate value, preferences have been animportant factor in stimulating diversification into manufactures for certaindeveloping countries, as illustrated by the case of apparel. For example, the U.S.African Growth and Opportunity Act (AGOA) has led to substantial increases in
Table 2. Estimates of the value of preferences to LDCs and alldeveloping countries(US$ million)
EU U.S. Japan Canada Australia Quad+
LDCs 287 131 49 14 0.4 587All 4,945 3,953 743 215 46 11,565Note: Quad = Canada, EU, Japan and U.S. Quad + = Quad + AustraliaSource: Authors’ compilations based on data from Low, Piermartini, and Richtering (2005).

PREFERENCE EROSION
337
imports from a number of Sub-Saharan Africa countries. However, the scope forpreferences to facilitate diversification into the apparel sector is limited by the lackof consistency across the different preference schemes. Manufactured productsfrom a country that can enter under one preference scheme often will not be ableenter under another due to differences in rules of origin. Harmonization of preferentialschemes around liberal rules of origin—in effect moving back to the idea of oneumbrella framework for preferences as originally envisaged by the GSP—wouldhelp enhance the value of preference programs.3
The magnitude of potential preference erosionPreference erosion is not a new concern. Until recently, however, it was not aparticularly strong constraint on MFN-based reforms because GSP programstypically offered a preference, and not duty- or quota-free access. Thus, even ifMFN rates were lowered, it was possible to maintain a given preference margin bylowering the preferential tariff or expanding the coverage of the scheme. But newprograms such as EBA and AGOA feature duty- and quota-free access for virtuallyall products; therefore any reductions in MFN tariffs lower the preference margin.
Using a partial equilibrium framework, IMF (2003) examined the potential overallimpact on the exports of LDCs of preference erosion arising from a 40 percent cut inprotection by the Quad. Assuming that LDCs have free access to these markets (astrong assumption given the evidence on rules of origin and other constraints), thestudy concludes that the potential loss at the aggregate level amounts to 1.7 percentof total LDC exports. Individual LDCs may suffer a more significant loss frompreference erosion if their exports consist chiefly of products that enjoy deeppreferences. By this measure, Malawi, Mauritania, Haiti, Cape Verde, and São Toméand Príncipe are the most vulnerable to preference erosion. Malawi would experiencea loss of 11.5 percent of total exports from the hypothetical cut in Quad protection.The next four countries would suffer a loss of between 5 and 10 percent. Another 10countries would lose between 3 percent to 5 percent. The total (aggregate) value oflost export revenue would be around $530 million (two-fifths accounted for byBangladesh alone). Note that these are small numbers from a macroperspective—equivalent to only 1 percent of annual official developmentassistance—but they may mean substantial adjustment for some of the economiesinvolved.
Alexandraki and Lankes (2004) complement this analysis by focusing on middle-income economies, including in their analysis of sugar, textiles, and bananas. Theirstudy, as well as that of Stevens and Kennan (2004), suggests that the potentialerosion problem is heavily concentrated in small island economies that are dependenton quota-type preferences and the associated rents in these sectors (sugar, beef,and bananas). The problem is therefore also commodity-specific—concentrated in

TRADE, DOHA, AND DEVELOPMENT: A WINDOW INTO THE ISSUES
338
areas where OECD protection and preference margins are the highest—includingbananas and sugar. As the sugar and banana regimes are reformed in the EuropeanUnion, such countries will have to adjust.
Grynberg and Silva (2004) report that the losses in income transfers for producersof sugar, beef, bananas, and textiles and clothing in economies dependent on tradepreferences would come to $1.7 billion per year. These estimates are heavilyinfluenced by the weight of disappearing quota rents associated with the phaseoutof the Agreement on Textiles and Clothing which account for $1.1 billion of the lossestimate and was a consequence of the Uruguay Round, rather than of potentialfuture negotiation outcomes.
Computable general equilibrium (CGE) estimates of the value of preferenceerosion provide additional insights. CGE techniques make it possible to account for
Table 3. Estimates of losses from tariff preference erosion
—No data.Note: a. Because the elasticity of supply of exports is 1.0, the real income effect is exactlyhalf the change in the value of exports.Source: Hoekman, Ng, and Olarreaga (2002); Alexandraki and Lankes (2004); Grynberg and
Silva (2004); Francois, Hoekman and Manchin (2005); van der Mensbrugghe (2005).
Exports Real income
Hoekman, Ng, and Olarreaga (2002)
Developing countries
Quad Tariff peak elimination
–71 — Partial equilibrium
IMF (2003) LDCs Quad 40% cut in tariffs
–530 –265a Partial equilibrium
Alexandraki and Lankes (2004)
Middle-income
Quad 40% cut in preference
–914 –457 Partial equilibrium
Grynberg and Silva (2004)
Developing countries
Quad Elimination of preferences
— –570 Partial equilibrium
Francois, Hoekman and Manchin (2005)
African LDCs
EU liberalization
Full MFN liberalization
— –458 General equilibrium
Ibid. African LDCs
OECD Full MFN liberalization
— –110 General equilibrium
Ibid. African, Asian LDCs
OECD Full MFN liberalization
— –198 General equilibrium
van der Mensbrugghe (2005)
East Asia All Full MFN liberalization
— 12,000 General equilibrium
Ibid. South Asia All Full MFN liberalization
— 500 General equilibrium
Ibid. Middle East and N.Africa
All Full MFN liberalization
— 4,800 General equilibrium
Ibid. Sub-Saharan Africa
All Full MFN liberalization
— 2,200 General equilibrium
Ibid. Latin America
All Full MFN liberalization
— 8,200 General equilibrium
Change, US$ millions How measured?
Authors Affected countries
Granting countries
Reform

PREFERENCE EROSION
339
terms-of-trade effects, better market-access for nonpreferential trade followingMFN liberalization, and the asymmetrical effects of preference erosion in differentmarkets (reflecting different hierarchies of preference in OECD markets, not onlybecause of different rules of nonreciprocal programs, but also the impact of freetrade agreements). In general, CGE analyses tend to provide lower estimates of thepreference-erosion effect. Francois, Hoekman, and Manchin (2005), for example,estimate that EU liberalization would translate into income losses of $460 millionfor African LDCs. That figure drops to $110 million when the experiment is extendedto include OECD-wide liberalization.
Key results from a number of recent studies of preference erosion are summarizedin table 3. The initial results associated with the nonreciprocal schemes alone generallyproduce results that are less than the full potential value of preference estimatespresented in table 2. The major exception is van der Mensbrugghe (2005), a study thatincludes the effects of reciprocal, as well as nonreciprocal, preferences. He adopts acounterfactual MFN-only scenario to estimate that current preferences generate anadditional $1.6 billion for low-income countries (excluding India). His results suggestthat the effects of reciprocal preferences are much larger than the nonreciprocalpreferences. Another important result shown in the table is that these preferencesreduce the benefits to be attained from further liberalization, but do not change thesign of such a movement. Liberalization still generates substantial gains for all regions.
These estimates are not strictly comparable, not only because of the differentmethodologies used (partial equilibrium versus CGE) and the differences in focus(welfare effects versus trade effects), but also because they tend to operate withdistinct liberalization scenarios to estimate the potential for preference erosion(Doha-related forecasts, full liberalization before the ATC phaseout, or fullliberalization after the ATC phaseout, and so on). It is also important to underscorethat these figures tend to overestimate the value of existing preferential regimesbecause they typically do not take into account the costs of compliance withpreferential regimes (an exception is Francois and others 2005).
These estimates do make clear, however, that preferences are very small, inaggregate, as a means of transferring revenues from industrial to developingcountries. Relative to the potentially enormous gains to developing countriesfrom comprehensive trade reform—estimated at $86 billion per year in Anderson,Martin and van der Mensbrugghe (2005)—the transfers in the order of $500 millionfrom nonreciprocal transfers estimated above pale into insignificance. The netbenefits to developing countries of these transfers are, of course, even smallersince a major share of these benefits comes at the expense of trade diversion fromother developing countries. However, as has been emphasized by many authors,including IMF (2003) and Alexandraki and Lankes (2004), the benefits of preferencesremain important for particular developing countries and products.

TRADE, DOHA, AND DEVELOPMENT: A WINDOW INTO THE ISSUES
340
Dealing with preference erosion: potential policy responsesTwo major approaches can be taken to address preference erosion losses—one withinthe World Trade Organization (WTO) (a “trade solution”) and the other outside theWTO (an “aid solution”). Potential trade-based solutions include the following:• Enhancing existing preference programs by widening access (for example, by
harmonizing preferential regimes around liberal rules of origin and reducingcompliance costs) or extending of their coverage, leveraging utilization rates,and increasing their effectiveness. Such enhancements could partiallycounterbalance the economic impact of preference erosion.
• Implementation of new preferential trade regimes by non-OECD importers.• Multilateral trade concessions designed to shield preference-dependent
countries (by delaying the liberalization schedules for “sensitive” products,for example) or to address negotiating priorities in other areas of the round(whether market access or rules).Solutions undertaken from within the trading system may impose a significant
opportunity cost from the perspective of global efficiency if they result in additionaldiscrimination and have the effect of substantially reducing the overall level ofambition of MFN reforms in the Doha Round. A trading system that continues torely on extensive discrimination in trade policy is not desirable. That said, there is acase for granting low-income countries preferential access to all OECD and largemiddle-income markets and pursuing an immediate and substantial simplificationand liberalization of rules of origin. Doing so would attenuate short-term lossesfrom preference erosion created by the Doha Round by maintaining for some periodeffective preference margins. However, as countries around the world continue toreduce levels of trade protection and conclude reciprocal trade agreements, it isunavoidable that the value of preferential access will be eroded. This suggests theneed to concentrate on improving productivity and lowering transaction costs inbeneficiary countries so as to enhance the competitiveness of their firms and farmsector. Here, much can and should be done through additional aid for trade.
Possible aid-based solutions for preference erosion include:• Relying on existing financial mechanisms for adjustment financing such as the
IMF’s Trade Integration Mechanism (IMF 2004); and• Establishing new stand-alone, grant-based compensation funds; and• Addressing preference erosion as part of a broader aid-for-trade effort.
The limited number and small size of most of the economies that could besignificantly affected by preference erosion suggest that measures to help mitigate theproblem should be targeted closely on the countries at risk. An appropriate responsemight be for the OECD countries to convert the implicit “preference transfers” (thevalue of current preferences) into equivalent development assistance. Aid transfershave the advantages of not distorting trade flows and being able to target the countriesconcerned.

PREFERENCE EROSION
341
The specific vehicle for any such compensating transfers must be negotiated.Each has advantages and disadvantages. The advantage of existing financialmechanisms is that the assistance will be placed in the context of a country’soverall macroeconomic and development policy framework. This may be beneficialas there are many other sources of shocks and adjustment pressures (in additionto preference erosion) that confront countries. However, the instrument used willgenerally be (concessional) loans as opposed to grants.
A specific compensation fund, as proposed by Grynberg and Silva (2004) andPage (2005), has the advantage of directly addressing the matter at hand but raisesquestions, notably ensuring that financing commitments are credible, that theassociated aid is additional to existing flows, and that it is used effectively toaddress the adjustment burden in recipient economies. In the case of farmers inbeneficiary countries who stand to lose from reforms in specific product areas(such as sugar and bananas), an option might to integrate them into OECD farmpolicies by extending decoupled income support to them as well as to national farmers.
Adjustment to MFN liberalization will affect many countries, not just thosethat have benefited from preferences. They, too, will require assistance to adjust.But in most cases the shocks that regularly confront countries can be expected toexceed those associated with preference erosion. The need to diversify is notunique to economies that have benefited from preferences but is common to manycountries. This suggests that funding for adjustment and to enhancecompetitiveness should be provided within the context of an overall countrydevelopment program. Doing so is particularly important for countries—includingmany of the poorest—that have proved unable to benefit much from preferenceprograms. The trade-related assistance these countries need is clearly much greaterthan any estimate of the value of current preferences.
Concluding remarksThe debate about how best to address preference erosion in the context ofmultilateral negotiations will continue to be an important component of thenegotiations on the development dimension of the Doha Round. While theoverall benefits of nonreciprocal preferences to developing countries are clearlysmall relative to the potential gains from trade reform, they are important for anumber of countries whose interests must be considered. Although the jury isstill out on the overall developmental impact of trade preferences, support isgrowing for delinking development assistance from trade policy by shiftingfrom “trade as aid” to “aid for trade” (Hoekman and Prowse 2005; IMF andWorld Bank 2005).
This growing consensus, however, is challenged by parallel efforts to deepenexisting preferential regimes and to introduce new ones. Multilateral tradenegotiations add additional ferment to the debate to the extent that they foster

TRADE, DOHA, AND DEVELOPMENT: A WINDOW INTO THE ISSUES
342
alliances between protectionist interests in OECD countries and preference-dependent industries in developing economies.
Notes1.Bernard Hoekman is Senior Advisor, Development Research Group and International Trade
Department, William J. Martin is Lead Economist, Development Research Group and Interna-tional Trade Department, Carlos A. Primo Braga is Senior Adviser, International Trade Depart-ment, The World Bank. This chapter relies extensively on papers prepared for the Interna-tional Symposium on “Preference Erosion: Impacts and Policy Responses” organized by theWorld Bank with the support of CIDA and DFID in Geneva, June 13-14. Comments andassistance from C. Tully are gratefully acknowledged.
2. Indeed, the analysis of overall OECD trade restrictiveness concludes that nontariff measuresaccount for more than half of total trade restrictiveness (World Bank and IMF, 2005), suggest-ing that they should receive greater policy attention. 3. For details see Brenton and Ozden (2005).
ReferencesAlexandraki, Katerina, and Hans Peter Lankes. 2004. “Estimating the Impact of Preference
Erosion on Middle-Income Countries.” IMF Working Paper, International Monetary Fund,Washington, DC.
Anderson, Kym, William Martin and Dominique van der Mensbrugghe. 2006. “Market andWelfare Implications of Doha Reform Scenarios.” In Anderson, K. and W. Martin eds.Agricultural Trade Reform and the Doha Development Agenda. Palgrave Macmillan and theWorld Bank, Washington, D.C.
Brenton, P., and T. Ikezuki. 2005 “The Impact of Agricultural Trade Preferences, with ParticularAttention to the LDCs.” In Global Agricultural Trade and the Developing Countries, eds.Ataman Aksoy and John Beghin, Washington DC: World Bank.
Brenton, Paul and Caglar Ozden (2005) “Trade Preferences for Apparel and the Role of Rules ofOrigin - The Case of Africa,” paper prepared for the International Symposim on “PreferenceErosion: Impacts and Policy Responses,” Geneva, June 13-14, processed.
Francois, J., Bernard Hoekman, and M. Manchin. 2005. “Quantifying the Magnitude of PreferenceErosion Due to Multilateral Trade Liberalization.” CEPR Discussion Paper 5153, Center forEconomic and Policy Research, Washington, DC.
Grynberg, Roman, and Sacha Silva. 2004. “Preference-Dependent Economies and MultilateralLiberalization: Impacts and Options.” Unpublished paper, Commonwealth Secretariat, London.
Hoekman, Bernard, Francis Ng and Marcelo Olarreaga. 2002. “Eliminating Excessive Tariffs onExports of Least Developed Countries,” World Bank Economic Review 16(1), pp. 1-22.
Hoekman, Bernard, and Susan Prowse. 2005. “Policy Responses to Preference Erosion: FromTrade as Aid to Aid for Trade.” Policy Research Working Paper 3721, World Bank, Washington,
DC.IMF (International Monetary Fund). 2003. “Financing of Losses from Preference Erosion,
Note on Issues raised by Developing Countries in the Doha Round.” Communication to theWTO from the International Monetary Fund, WT/TF/COH/14. 14 February.
———. 2004. “Fund Support for Trade-Related Balance of Payments Adjustments.” http://www.imf.org/external/np/pdr/tim/2004/eng/022704.pdf
IMF and the World Bank. 2005. “Doha Development Agenda and Aid for Trade.” Paperpresented to the Development Committee, September 25, Washington, DC.

PREFERENCE EROSION
343
Low, Patrick, Roberta Piermartini, and Jürgen Richtering. 2005. “Multilateral Solutions toPreference Erosion.” Paper prepared for the International Symposium on Preference Erosion:Impacts and Policy Responses. Geneva, June 13–14.
Page, Sheila. 2005. “A Preference Erosion Compensation Fund: A New Proposal to ProtectCountries from the Negative Effects of Trade Liberalization.” Overseas Development Institute(ODI) Opinions 35.
Stevens, Chris, and Jane Kennan. 2004. “Making Preferences More Effective.” Briefing paper,Institute of Development Studies, University of Sussex.
Van der Mensbrugghe, Dominique. 2005. “The Doha Development Agenda and PreferenceErosion: Modeling the Impacts.” Paper prepared for the International Symposium on PreferenceErosion: Impacts and Policy Responses. Geneva, June 13–14.
World Bank and IMF. 2005. Global Monitoring Report 2005, Washington DC: The World Bankand IMF.

From Marrakesh to Doha: Effects of Removing FoodSubsidies on the Poor
Donald Mitchell and Mombert Hoppe
29
If successful, the Doha Round may cut global subsidies to food production. Thevast majority of developing countries should benefit, but some will lose througha deterioration of their terms of trade. How great is their loss likely to be? What
will happen to poor consumers in those countries? What is the appropriatepolicy response?
In examining these questions, we find that:• The collective magnitude of the likely losses of net food importers is between
$300 million and $1.2 billion per year depending on the final agreement, anamount that could readily be financed by donors. This is less than 0.7 percentof total merchandise imports of these countries and even those losses willphase-in over a long period. The food price increases will be about half as largeas the annual year-to-year variations in food prices.
• Only 7 countries would see their net food import bills increase by more than 5percent of total export earnings. This number is relatively small, because theprojected increases in food prices are small and because many developingcountries would also benefit from increases in the prices of their exports.
• The international community has several instruments to help countries facedwith a terms-of-trade loss. The International Monetary Fund (IMF) can use itsCompensatory Financing Facility or its new Trade Integration Mechanism(TIM). The World Bank and bilateral donors can provide transitional adjustmentassistance for affected countries. The current discussions of “aid for trade” toassist countries overcome constraints to exports may result in additionalresources. On the other hand, certain approaches are not likely to work.Commodity stabilization funds, for example, have generally been ineffective instaving off long-term secular declines in prices, and hedging efforts haveproven costly and difficult to manage.
• The effects on poor people—as opposed to countries—also merit analysis.Many of the poor will gain because they are subsistence farmers, but somemay be net buyers of food. While each case must be managed on its own terms,one relatively easy response to help the poor is to lower tariffs that may keepdomestic prices above the international price. Lowering such tariffs will alsoimprove overall efficiency, although at some cost to government revenues. Ifthis is not possible, development assistance may have to provide sometransitional finance.
345

TRADE, DOHA, AND DEVELOPMENT: A WINDOW INTO THE ISSUES
346
BackgroundThe Marrakesh Ministerial conference that concluded the Uruguay Round in 1994adopted a decision on “Measures Concerning the Possible Negative Effects of theReform Program on Least Developed and Net Food Importing DevelopingCountries.” That decision, which has become known as the Marrakesh Decision,was adopted in response to fears that subsidy cuts imposed on food exportingcountries by the Uruguay Round Agreement on Agriculture (URAA) would havethe effect of raising prices of imported foods. The Marrakesh Decision requiresregular reviews of food-aid commitments and flows, the adoption of guidelines toensure that food aid is given in grant form or on concessional terms, and technicalassistance. But many food-importing countries remain concerned that food pricescould rise with the reduction or elimination of subsidies in exporting countries.That concern has hampered an agreement on agriculture during the Doha Round.This is unfortunate, because the benefits of such an agreement for developingcountries would greatly outweigh the negative impact of increases in the prices offood imports.
The Marrakesh Decision has become a catch-all for concerns about increasesin food import prices, whether or not those increases can be traced to multilateralpolicy reforms. For example, the rise in wheat prices in 1995–19961 led to a proposalby 16 countries, including some net-food-importing developing countries (NFIDCs),to establish a revolving fund to help meet the short-term needs of financing normallevels of commercial imports. The proposed countercyclical subsidy mechanismwould have triggered food and financial aid upon commodity price increasesstemming from agricultural trade liberalization agreed to under the URAA. Theproposal was motivated by the increases in wheat prices, despite the fact that littlereform had been agreed under the URAA and almost none implemented by 1995–96(Ingco 1995). Volatility is not unusual in world food prices, and a range of financialinstruments are available to mitigate its effects.
This note examines the historical food imports and trade balances of the leastdeveloped countries (LDCs) and NFIDCs, examines the impact of price increasesthat might result from policy reforms under the Doha Round, and discusses measuresthat could be taken to address the problems of variability in food prices, some ofwhich could be negotiated during the round. Of special note is the occasional banon food exports to which some countries have resorted during periods of priceincreases. These export restrictions are potentially more important to national foodsecurity than the increases in food prices that result from policy reform, becausethey limit access to exports at the time when they are most needed. The note beginswith a review of globally traded food prices.

FROM MARRAKESH TO DOHA
347
World food prices—lower and less volatile than during the 1970sPart of the concern over prices is based on the experience of the 1970s, wheninternationally traded food prices rose sharply, causing shortages in some countries.At that time, real food prices showed high variability associated with specific eventssuch as the emergence of OPEC and resulting higher oil prices, large grain purchasesby the former Soviet Union, crop failures, and significant structural changes in theworld economy. Since the mid-1970s, however, real food prices have trended lowerrelative to the index of manufactures and have generally exhibited loweryear-to-year variability (figure 1). The relative price stability of the past two decadesoccurred despite some equally dramatic changes, such as the collapse of the SovietUnion in the late 1980s, the increasing importance of China in the global economy,and the Asian financial crisis of the late 1990s.
Which developing countries are net food importers?The NFIDCs that are covered by the Marrakesh Decision include73 countries—the 50 LDCs plus an additional 23 developing countries: Barbados,Botswana, Cuba, Côte d’Ivoire, Dominica, Dominican Republic, Egypt, Honduras,Jamaica, Jordan, Kenya, Mauritius, Morocco, Namibia, Pakistan, Peru, Saint Kittsand Nevis, Saint Lucia, Saint Vincent and the Grenadines, Sri Lanka, Trinidad andTobago, Tunisia, and Venezuela (FAO 2005). Of 72 countries examined (data was
0
50
100
150
200
250
300
1970 1975 1980 1985 1990 1995 2000
Real food prices, 1970-2004 (index in 1990 constant dollars)
Figure 1. Productivity gains have made food cheaper
Note: This is the World Bank’s index for internationally traded food commodities weightedby world export shares and deflated by the manufactures unit-value index in dollar terms ofthe G-5 countries.Source: Development Prospects Group, the World Bank.

TRADE, DOHA, AND DEVELOPMENT: A WINDOW INTO THE ISSUES
348
a. “Three tiers” relates to reductions or elimination in export subsidies, a reduction in domestic support, and globaltariff reduction.b. The presented figures summarize three scenarios with the following parameters. An Amber Box reduction of 55percent; a 60 percent Amber Box and 50 percent Blue Box reduction; and a 100 percent Amber Box and 50 percent BlueBox reduction.c. Policy changes that result in the reported price increases were supposed to take place in 2002. The values differwidely for beef, pork, and poultry.d. This scenario assumes full OECD domestic subsidy removal and worldwide export subsidy removals.e. Price increase for livestock and products.f. Scenario assumes a 100 percent reduction in export subsidies and a 55 percent reduction in domestic support linkedto inputs and outputs, estimated effects on “world prices of developing countries trade.”g. Scenario assumes 50 percent cut in tariffs and export subsidy rates but allows for compensatory increase in domesticsupport.Source: BBDJ = Bouet and others (2004). USDA = USDA (2001). RST = Rae and Strutt (2003). FAPRI = Beghin andFabiosa (2002). DHK = Dimaranan et al (2004).Source: World Bank calculations and summary of results from Table 1.Table 2. Comparison of commodity price changesand simulated impacts of reforms (percent)
Table 1. Estimates of world price increases in percent for key food
Source Scenario Wheat Coarse grains
Meat Sugar Rice Oil-seeds Dairy
BBDJ 3 tiers a (100% export subsidy reduction)
2.3 3.1 1.6 2.8 9.4 9.7 2.7
RST 3 tiers b (45% export subsidy reduction)
4.0–6.3 4.3–7.0 2.0–4.3 1.2–1.4 2.8–4.5 3.9–4.3
FAPRI c Elimination of domestic farm programs and border measures
4.8 5.7 3.7–10.3 10.3 3.1 22.0–39.0
BBDJ 100% reduction in export support 0.1 0.1 0.1–1.5 5.6 0.1 0.0 2.3
USDA Global export subsidy removal 2.0 0.6 3.3 1.5 0.1
DHK 50% reduction in domestic support (OECD)
4.9 5.5 2.2 –0.6 0.3 3.5 –0.2
DHK 50% market price support reduction, re-
instrumentalization g0.8 1.0 –0.7 0.2 0.7 0.4 –0.2
Full liberalization scenarios
USDA 3 tiers with full domestic subsidy
removal d18.1 11.2
Partial liberalization
15.2 22.3 e 16.4 10.1

FROM MARRAKESH TO DOHA
349
Table 2. Comparison of commodity price changes and simulatedimpacts of reforms (percent)
Range of estimated price increases from
reforms
Average of estimated price increases from
reforms
Coefficient of variation of
prices 1990–2004
Average year-to-year percentage change of prices
1990–2004CommodityWheat 0.1 - 18.1 5.1 16.9 11.8Maize 0.1 - 15.2 4.6 17.2 10.1Beef 0.8 - 22.3 5.1 15.4 8.6Sugar 1.1 - 16.4 5.8 23.9 14.1Rice 0.1 - 10.6 5.5 19.6 11.8
Source: World Bank calculations and summary of results from Table 1.
not available for East Timor), 46 had a food-trade deficit and 38 had a trade deficit inprimary agricultural materials during 1998–2002.2 Of the countries with a food-tradedeficit 34 were LDCs. Among the countries with a deficit in agriculture trade, only 22were LDCs, leaving non-LDCs overrepresented (17 out of 23 had a deficit in thiscategory). Using COMTRADE data for the 72 countries, we found that countrieswith the highest net food imports per capita in this group were island economiesand countries in conflict or just emerging from conflict.
The most important food imports for LDCs and other NFIDCs in 2001 werewheat and wheat flour (21 percent), fruit and vegetables (11 percent), maize(10 percent), dairy products and eggs (9 percent), sugar (8 percent), rice (6 percent),soybeans and oil (6 percent), meat and preparations (4 percent), and palm oil(4 percent) according to the FAO.
Effects of a Doha Round AgreementWith slow progress in the Doha Round on an agreement to reduce agriculturalsubsidies and support, it is difficult to estimate how large the food price changesresulting from an agreement might be. However, quantitative estimates made inpreparation for the negotiations (table 1) can be used as estimates of such changes.The various estimates are not readily comparable, however, since agricultural tradeliberalization scenarios differ widely in their assumptions about (a) full or partialreduction of export subsidies in industrialized countries, (b) the reduction orelimination of schemes of domestic support, and (c) global tariff reductions. Theestimates also vary with regard to the time frame of analysis, however, price increasesgenerally assume full adjustment. The largest increases in food prices correspondto full liberalization which does not appear to be a likely outcome of the DohaRound at this time.

TRADE, DOHA, AND DEVELOPMENT: A WINDOW INTO THE ISSUES
350
The results of the various studies are summarized in table 2 and compared withhistorical variations in prices. The comparison shows that the average increase inprices of major food items under the various scenarios of reform are generally lessthan the coefficient of variation or average year-to-year percent price change ofthese foods (table 2). For example, the average increase in wheat prices from thevarious studies is 5.1 percent while the coefficient of variation for wheat prices was16.9 percent during 1990-2004 and the average year-to-year percent change was11.8 percent. The impact on net-food-importing developing countries’ import billsranges from about $300 million to $1.2 billion in the individual scenarios (table 3),and the actual increases in food import costs are likely to be toward the lower endof this range.
The average net food imports of NFIDCs totaled $3.85 billion per year for thefive year period from 1998–2002, with LDCs’ net imports averaging $2.63 billion andother NFIDCs net imports averaging $1.22 billion. These imports were 6.3 percent oftotal merchandise imports for LDCs and 1.2 percent of total merchandise imports forother NFIDCs. However, these aggregates do not reflect the situation in individualcountries who may need assistance to cope with higher food import costs. Forexample, the net food imports were 34 percent of total imports in the case of Haitiand 25 percent for Yemen. Net food imports exceeded 100 percent of export earningsin Eritrea, Haiti, Djibouti, Cape Verde, and Tuvalu, with the deficit financed by aidassistance. In some countries, higher food import costs may be offset by higherprices for their agricultural exports. For example, in Benin the share of net foodimports of total imports is 22.3 percent, while the net export balance in agriculturalproducts is 11.6 percent. Similar offsetting effects can be expected for Burkina Faso(22.6 percent and 26.4 percent), Chad (20.2 percent and 33.7 percent), the LaoDemocratic Republic (21.7 percent and 26.1 percent), Mozambique (6.8 percent and9.9 percent), and others. Some countries may also receive large food-aid importsand may not be as directly affected by food price increases. For example, Bangladeshis a large food importer with relatively small food exports. However, it is also a largerecipient of food aid.
To determine which countries are most at risk from higher food import costs,we consider changes in the costs of imports net of changes in exports with a partialequilibrium analysis of different scenarios for price increases following eliminationof export subsidies and domestic support. Using COMTRADE data as the valuesfor food imports and exports, we calculate the dollar increases in the net-food-import bills for all LDCs and NFIDCs under different assumptions for world pricechanges after the Doha Round.3 The effects of price increases for five main foodcommodities (rice, cereals, meat and meat products, oilseeds, and dairy products)are considered and then the analysis is repeated including a subset of other foodcommodities (vegetables and fruit, fish, live animals, beverages, animal and vegetablefats, animal feeds, sugar, and miscellaneous food products) to capture the broader

FROM MARRAKESH TO DOHA
351
impact on foods which would not be directly affected by reduced subsidies. Thiseffectively takes some net export commodities into account. Tropical exportcommodities such as coffee, tobacco, cotton, tea, and cocoa are excluded from theanalysis, but including them would improve the balance of payments for mostcountries—substantially for the group as a whole. Prices for these commoditieswould likely rise with food prices because agricultural commodity prices are highlycorrelated due to substitution possibilities in both production and consumption.The increases in food import costs (table 3) are small for LDCs and NFIDCs comparedwith the total expected gains from trade liberalization.4
Under a scenario that uses average predicted price increases, only 16 countrieswould see their net food import costs for the five main commodities increase bymore than 5 percent. A few countries would see larger increases, but the additionalfinancial burden still represents a small share of total imports. Summarizing theresults of our simulations, net food import costs as a share of the total food importbill are likely to rise by more than 5 percent for 13 countries (Benin, Chad, Comoros,Congo DR, Cote d’Ivoire, Cuba, Haiti, Jordan, Liberia, Senegal, St. Lucia, Tuvalu,and Yemen). The expected rise in food costs is not homogenous across simulationsfor all countries. Some of these countries and some other countries could see theirfood import costs rise more strongly. The increase in the cost of food imports as ashare of the total food bill exceeds 7.5 percent in at least one scenario for: Benin,Burkina Faso, Burundi, Central African Republic, Chad, Comoros, Congo DR, Cuba,Egypt, Eritrea, Ethiopia, Jordan, Liberia, Kiribati, Maldives, Senegal, St. Lucia, Tuvalu,Uganda, and Yemen. When looking at the wider set of food commodities and theaverage of the price increases in the simulations, only 8 countries experience anincrease in food import costs of 5 percent or more of their total food imports (Burundi,Central African Republic, Chad, Comoros, Congo DR, Eritrea, Jordan, and Tuvalu).
Higher world prices will lead to a supply responseFifty-five of the LDCs and other NFIDCs examined are net importers of goods ingeneral. It therefore does not suffice to analyze the static effect of price changes, asCline (2004) points out. Increased world-market prices for food can be expected toinduce an increase in food production in developing countries that enjoy acomparative advantage in food production (43 of the 72 analyzed) or agriculture(38 out of the 72 analyzed) according to Cline. 5 Over the long term, NFIDCs with acomparative advantage might become less dependent on food imports.
Price increases are likely to induce other changes, such as the distribution ofincome in developing countries. In parallel with rising world market prices, domesticprices will increase, though probably less than proportionally. Where the ruralpopulation is self-sufficient in food production, it will therefore not be adverselyaffected by higher food prices. To the degree that rural producers also supply thelocal market, they will gain from increasing food prices. With urban dwellers adversely

TRADE, DOHA, AND DEVELOPMENT: A WINDOW INTO THE ISSUES
352
Source: World Bank Staff estimates.
Note: Net imports calculated by country and commodity using 2003 mirror data from COMTRADE forAfghanistan, Angola, Bangladesh, Barbados, Benin, Bhutan, Botswana, Burkina Faso, Burundi, Cambodia, CapeVerde, Central African Republic, Chad, Comoros, Dem. Rep. Congo, Cote d’Ivoire, Cuba, Djibouti, Dominica,Dominican Republic, Egypt, Equatorial Guinea, Eritrea, Ethiopia, The Gambia, Guinea, Guinea-Bissau, Haiti,Honduras, Jamaica, Jordan, Kenya, Kiribati, Lao PDR, Lesotho, Liberia, Madagascar, Malawi, Maldives, Mali,Mauritania, Mauritius, Morocco, Mozambique, Myanmar, Namibia, Nepal, Niger, Pakistan, Peru, Rwanda, Samoa,Sao Tome and Principe, Senegal, Sierra Leone, Solomon Islands, Somalia, Saint Lucia, Saint Kitts and Nevis, andSaint Vincent and the Grenadines, Sri Lanka, Sudan, Tanzania, Togo, Trinidad and Tobago, Tunisia, Tuvalu,Uganda, Vanuatu, Venezuela, Yemen, and Zambia.Extra import costs calculated by multiplying the net trade balance of these countries by the estimated pricechanges. Results do not take forgone preferential market access into account.Key: BBDJ = Bouet and others (2004). USDA = USDA (2001). RST = Rae and Strutt (2003). FAPRI = Beghin andFabiosa (2002). DHK = Dimaranan et al (2004).a. Definitions for the five main commodities are according to SITC1: rice (042), other cereals (04-042), meat andmeat products (01), oilseeds (22), and dairy products (02).b. Adds vegetables and fruit, fish, life animals, beverages, animal and vegetable fats, animal feeds, sugar, andmiscellaneous food productsc. Does not add fish, animal and vegetable fats, and animal feedd. Adds only miscellaneous food productse. Excluding dairy productsf. Adds only sugar, live animals, vegetables and fruit, and miscellaneous food productsg. Does not add vegetables and fruit, fish, beverages, and animal feed
Table 3. Estimates of increased net food import costs for NFIDCs basedon various scenarios for reforms
Total extra cost of five main
commodities a
(millions of dollars)
As percentage of total imports
Percentage increase in net
food import bill for five main commodities
Extra cost for wider set of
commodities b
(millions of dollars)
Simulations
BBDJ, 3 tiers (100% export subsidy removal)
251 0.15 2.70 266 c
RST, 3 tiers (55% Amber box reduction and 45% export subsidy reduction)
329 0.20 3.60 327 d
FAPRI, Elimination of domestic farm programs and border measures (max/min)
1125 / 774 0.68 / 0.47 12.3 / 8.50 n.a.
USDA, 3 tiers, with full domestic subsidy removal
1236 e 0.75 13.50 1096 f
BBDJ, 100% reduction in export support 52 0.03 0.60 69 c
USDA, Global export subsidy removal 110 e 0.07 1.20 31 f
DRK, 50% reduction in OECD domestic support 610 0.19 3.40 342 g
DRK, 50% market price support reduction, re-instrumentalization 47 0.03 0.50 42 g
Partial liberalization scenarios
Full liberalization scenarios

FROM MARRAKESH TO DOHA
353
affected, income will be transferred from urban centers to rural areas, reducingpoverty rates in these areas. Cline (2004) comes to the conclusion that liberalizationin agricultural trade will lower rural poverty in most of the countries he analyzed.6
With price increases trickling down from world to national to rural markets, returnsto rural factors of production will increase, strengthening incentives for ruralproduction and leading to a better integration of rural and urban markets. Thiswould allow an increase in allocative efficiency in the long run.
These conclusions are supported by Anderson, Martin, and van derMensbrugghe (2005) who estimate that full trade liberalization would lead to anincrease in the volume of Sub-Saharan African net exports of agricultural andprocessed food products from $6 billion in 2001 to $27 billion in 2015. Net exportswould be $8 billion higher than under their baseline scenario with no further policychanges. Net export volumes increase despite an offsetting movement in the termsof trade. Assuming no supply capacity constraints, annual farm output growthbetween 2004 and 2015 would be 4.9 percent following full liberalization comparedto 4.5 percent in the baseline scenario. Output growth under the full liberalizationscenario exceeds the estimated growth rate resulting from trade liberalization withSpecial and Differential Treatment for non-agricultural goods for developingcountries (4.7 percent).
Freer trade can help feed the poorCountries can take unilateral actions to reduce the impact of higher food importprices on the poor such as lowering tariffs. Such tariffs are often used to protecthigh-costs domestic producers, but hurt poor consumers most because they spenda higher share of their income on food. Such tariffs often provide little support torural poor because they leave out two large groups among the rural poor: thosewho own no farmland, but pay higher prices as consumers, and those who ownfarmland, but do not produce commercially. Even commercial farmers may not benefit,because protectionism encourages them to continue planting low-value food cropsinstead of diversifying into nontraditional exports of higher value, a better way ofraising income and escaping poverty. In turn, the lack of export production reducesthe country’s ability to earn foreign exchange and undermines the structural capacityto import food and other products.Legitimate concern over temporary disruptions in food supplies caused by man-made or natural disasters is sometimes used to justify protectionist measures tostimulate domestic food production. However, the impact of such disruptions couldbe mitigated through other measures, such as reserves in cash or kind, betterdistribution channels, and reformed food-aid policies, all of which would be moreeffective and less costly than stimulating inefficient domestic food production. Tothe extent that disruptions are caused by export cutbacks or bans in times of highworld prices (figure 2), developing countries should act through the WTO to seek

TRADE, DOHA, AND DEVELOPMENT: A WINDOW INTO THE ISSUES
354
U.S. fob price in $/ton
to constrain such behavior in the Doha agreement.
Measures to deal with food-price shocksSeveral mechanisms are available to help developing countries deal with short-termfood-price shocks (Ingco, Mitchell, and Nash 2004). The IMF’s CompensatoryFinancing Facility (CFF) is specifically designed to help alleviate adverse effects ofcertain commodity-price movements that result in balance-of-payments problems.Commercial risk management instruments are also available to protect against short-term price movement. For example, options can be used to lock in a specific price orto ensure that prices will not be greater (or lower) than a specified level. Thesecould be used by large importers of food—in the public and private sectors—toprotect against a sharp increase in food import prices. They could also be used bygovernments to insulate safety nets from budgetary crises arising from foodprice increases. The World Bank offers commodity swaps to link debt-servicingcosts to movements in the price of a specific commodity or a basket of commodities.Food aid is available from the international community and unilateral donors to dealwith food emergencies and disruptions in domestic supplies. In addition, there arenew approaches to dealing with short-term price movements and food securityconcerns that could be developed and implemented. One proposal made in responseto the Marrakesh Decision is to establish a system to distribute food vouchers tothe needy when food prices rise. These could be redeemed through normal
0
100
200
300
400
1970 1973 1976 1979 1982 1985 1988 1991 1994 1997 2000 2003
U.S. Embargos Export Tax EU & Russia
Figure 2. Export restrictions during times of greatest need: Wheatprices and export restrictions
Sources: United States Department of Agriculture and World Bank.

FROM MARRAKESH TO DOHA
355
commercial market channels, thereby increasing the demand for food imports withoutdistorting domestic food markets. Another proposal involves an ex ante fund fortrade finance.
ConclusionAgricultural liberalization will stimulate growth and help raise the incomes of thepoor. It also may hurt a relatively few countries. The hurt should not be overstated:the predicted rise in prices will occur over several years and be considerably lessthan annual fluctuations associated with the business cycle and year-to-year yieldvariations. Still, both the international community and national governments shouldtake actions to mitigate the costs of adjustment. The international community shouldprovide aid for trade using the IMF’s Trade Integration Mechanism (TIM) and CFF,as well as resources to support reform programs. For national governments, thefirst order of business should be to lower trade barriers to keep prices from rising inthe local market. If that instrument is not available, governments should allow theexchange rate to depreciate to avoid passing on the full effect of price adjustmentsto the poor.
Notes1. Average annual wheat prices rose by 38 percent from 1994 to 1996 primarily in response to
low stocks caused by a poor harvest in the United States.2. Food is defined as the UN’s Standard International Trade classification codes SITC1 0-071-
074+1-12+22+4; agriculture as SITC1 0+1+2-27-28+4.3. We assume that the underlying trade quantities remain unchanged as the magnitude of trade
elasticities is debated and varies most probably strongly between countries, by category and evenwithin categories.
4. Nearly two-thirds of the potential gains from multilateral trade reforms stand to come inagriculture. However, achieving such gains will require WTO members to make very substantialcuts to their bound tariff rates and domestic farm subsidy commitments. If that is done, theglobal welfare gains from completely freeing merchandise trade over 2005–10 will be $287billion per year by 2015. Of that, $85.7 billion would go to the developing countries (Anderson,Martin, and van der Mensbrugghe 2005: table 12.4). Although the largest gains go to developedcountries, the developing countries gain twice as much as a percentage of their incomes.
5. A country is considered having a comparative advantage in food or agricultural production,if the ratio of food (agricultural) exports to food (agricultural) imports exceeds the same ratiofor non-food (non-agricultural) exports and imports.
6. Under the most likely scenario, rural worldwide poverty will decline by 255 million, whileurban poverty will increase by 54 million people.
ReferencesAnderson, Kym, Will Martin, and Dominique van der Mensbrugghe. 2005. “Market and Welfare
Implications of Doha Reform Scenarios.” Development Prospects Group, World Bank,Washington, DC.

Anderson, Kym, Will Martin, and Dominique van der Mensbrugghe. 2005. “Would MultilateralTrade Reform Benefit Sub-Saharan Africans?” World Bank Policy Research Working Paper3616, World Bank, Washington, DC.
Beghin, John C., and Jacinto F. Fabiosa. 2002. “The Doha Round of the WTO: AppraisingFurther Liberalization of Agricultural Markets.” FAPRI Working Paper 02-WP-317. Universityof Missouri, Columbia.
A Bouet, J. C. Bureau, Y. Decreux, and S. Jean. 2004. “Multilateral Agricultural TradeLiberalization: The Contrasting Fortunes of Developing Countries in the Doha Round.” IIISDiscussion Paper 60. Institute for International Integration Studies, Trinity College, Dublin.
Cline, William R. 2004. Trade Policy and Global Poverty. Washington, DC: Institute forInternational Economics.
Dimaranan, Betina, Thomas Hertel, and Roman Keeney. 2004. “OECD Domestic Support andDeveloping Countries.” In The WTO, Developing Countries and the Doha DevelopmentAgenda, ed. Basudeb Guha-Khasnobis. United Nations University.
Ingco, Merlinda, Donald Mitchell, and John Nash. 2004. “Food Security and Agricultural TradePolicy Reform.” In Agriculture and the WTO: Creating a Trading System for Development,ed. Merlinda D. Ingco and John D. Nash (chapter 9). Washington, DC: World Bank.
Ingco, M. 1995. “Agricultural Trade Liberalization in the Uruguay Round: One Step Forward,One Step Back?” World Bank Conference on the Uruguay Round and the Developing Countries,January 26–27, 1995, Washington, DC.
Nash, John, and Donald Mitchell. 2005. “How Freer Trade Can Help Feed the Poor: An Agendafor Easing Hunger Worldwide by Reducing Trade Protectionism.” Finance and Development,March.
Rae, A. N., and A. Strutt. 2003. Doha Proposals for Domestic Support: Assessing the Priorities,Draft paper presented at the Conference of the International Agricultural Trade ResearchConsortium, Capri, 24–26 June.
USDA. 2001. “The Road Ahead: Agricultural Policy Reform in the WTO—Summary Report.”Agricultural Economic Report 797, January.
Further reading:Aksoy, M. Ataman, and John C. Beghin (eds.). 2005. Global Agricultural Trade and Developing
Countries. World Bank. Washington, DC.Ingco, Merlinda D., and John D. Nash. 2005. Agriculture and the WTO: Creating a Trading
System for Development. World Bank. Washington, DC.
TRADE, DOHA, AND DEVELOPMENT: A WINDOW INTO THE ISSUES
352

Sanitary and Phytosanitary Regulation: OvercomingConstraints
Steve Jaffee
30
Increasingly stringent food safety and agricultural health standards inindustrialized countries pose major challenges for continued developing countrysuc-cess in international markets for high-value food products, such as fruit,
vegetables, fish, meat, nuts, and spices. Much of the literature casts sanitary andphytosanitary (SPS) standards as a barrier to trade, because some appear to bethinly disguised protectionist measures or discriminate against certain suppliers, orbecause of the high cost of compliance. Yet, in many cases, such standards haveplayed a positive role, providing the catalyst and incentives for the modernizationof export supply and regulatory systems and the adoption of safer and moresustainable production practices.
Much of the policy discussion pertaining to SPS standards and developingcountry trade centers on finding ways to increase the participation of developingcountries in international standard-setting bodies, or otherwise influencing thelevel and nature of the standards themselves. If the standards were the problem, itwould be logical to emphasize renegotiation of the rules of the game. But newfindings from the World Bank’s research program on SPS standards (appendix 1and World Bank 2005) suggest that adjustment of standards represents at best apartial solution, and that the challenges and opportunities posed by standards canbe better addressed by strengthening public and private capacities to manage foodsafety and agricultural health risks.1
According to the findings, developing countries faced with rising SPS standardsin their export markets can maintain and improve market access, position industriesfor long-term competitiveness, mitigate potential adverse effects on vulnerable groups,and improve domestic food safety and agricultural productivity by adopting a strategicapproach to food safety, agricultural health, and trade. For well-prepared countriesand suppliers, rising standards represent an opportunity; for those that are poorlyprepared, they pose risks related to safety and market access. Rather than adoptdifferential standards or procedures for suppliers from different countries, high-incomecountries should increase development flows to help developing countries buildtheir capacities to plan and execute the necessary strategies.
Growing trade in high-value food productsInternational trade in high-value food products has expanded enormously overthe last decades, fueled by changing consumer tastes and advances in production,transport, and other supply-chain technologies. Developing countries have
357

TRADE, DOHA, AND DEVELOPMENT: A WINDOW INTO THE ISSUES
358
successfully participated in this growing trade (figure 1). Fresh and processedfruits and vegetables, fish, meat, nuts, and spices now account for more than 50percent of the total agro-food exports of developing countries, while the share oftraditional commodities—such as coffee, tea, cocoa, sugar, cotton,and tobacco—continues to decline. Growing demand for differentiated productsfrom increasingly sophisticated consumers, along with the growth of integratedinternational supply chains, will provide continuing opportunities for competitivesuppliers of high-value foods by allowing them to target a market segment thatsuits their competitive profile.
Underpinning the growth in demand for high-value foods is the steady growthin the world’s population. Demand for food of all types will increase dramatically inthe next 20–30 years, as the world’s population grows by two billion people—mostlyin developing countries. Growing populations, increased wealth, and reduction oftraditional trade barriers (through the Doha Round and thereafter) will promoterapid expansion in trade in high-value products worldwide and among developingcountries—so-called South–South trade.
SPS standards have been important to the expansion of world trade in high-value perishable products because they have helped manage risks associated withthe spread of plant and animal pests and diseases and the incidence of microbialpathogens or contaminants in food. In recent years standards have been tightenedor extended into new areas in the wake of a spate of food scares in industrializedcountries (table 1) and in the face of increased scientific knowledge, official concerns
0
1020
3040
5060
7080
90
1980 1983 1986 1989 1992 1995 1998 2001
Horticulture
Fish
MeatSpices
US $ billionExports, 1980 - 2003
Figure 1. Developing countries move into high value foods
Source: FAOSTAT.

SANITARY AND REGULATION
359
over bioterrorism, and public concerns about the environment. The private sectorhas reacted to consumer concerns and official requirements by developing codesof practice and altering its product sourcing practices to emphasize limited sets of“preferred” or company-affiliated suppliers. While some efforts have been made toharmonize standards—at industry, regional, or international levels—the overalltrend is toward a proliferation of standards and an increasingly complex commercialand regulatory environment. In this rapidly changing context, developing countriesstrive to keep up.
Impact of standards on trade in high-value agro-food productsWhile there is general agreement that food safety and agricultural health measuresstrongly affect international agro-food trade, there is no consensus on the relativeimportance of individual measures in relation to other trade-distorting measures, oron the aggregate net effect of those measures. The absence of consensus is notsurprising, for testing the impact of such standards on trade presents enormousempirical difficulties. Consider these variables:• What assumptions are made about how the broad array of measures is actually
enforced and how enforcement deters or encourages potential export suppliers?Depending on the enforcement regime, the adjustments required of differentsuppliers may be significant or modest. This variable cannot be aggregatedbecause it differs from country to country and among different industries.
• Food safety and agricultural health requirements may have many secondaryand tertiary effects by provoking shifts in sourcing, affecting complementaryand competitive goods, and inducing changes in the measures taken by othercountries, to name just a few possibilities.
Table 1. Recent food safety events in industrialized countries
Source:World Bank (2005).
Year Event Country1987-1988 Beef hormone scare Italy/European Union1988 Poultry salmonella outbreak/scandal United Kingdom1989 Growth regulator scare for apples United States1993 E.Coli outbreak in fast-food hamburgers United States1996 Brain-wasting disease linked to BSE (mad cow
disease)United Kingdom
1996-1197 Microbiological contamination—berries United States, Canada1995-1997 Avian flu spreads to humans Hong Kong, Taiwan (China)
1999 Dioxin in animal feed Belgium2000 Large-scale food poisoning (dairy) Japan2001 Contaminated olive oil Spain2002-2004 Isolated but repeated incidents of BSE United States, Canada

TRADE, DOHA, AND DEVELOPMENT: A WINDOW INTO THE ISSUES
360
• Specific measures are frequently not a dominant determinant of observed tradeflows. There is a risk in ascribing to agro-food standards shifts in trade that aredriven by more fundamental economic or technical factors.
• Defining the counterfactual situation presents obvious problems. What wouldhave happened in the absence of the measure? Would trade have continuedunimpeded or might distributors and consumers have shifted to other suppliers?Might overall demand have declined for a product for which certain problemswere identified?
• Many food safety and agricultural health measures will affect domestic suppliersas well, producing shifts in the relative competitiveness and market share ofthe different players.Different methodologies have been used to estimate the impact of rising
standards on developing country trade. Several studies based on gravity or othereconometric models have tended to estimate very large losses in trade. In contrast,most industry case studies identify an array of competitive factors affecting trade(of which standards are one) and typically point to both winners and losers, ratherthan to an absolute decline in trade. For example, when Argentina encounteredinternational market-access problems in the wake of outbreaks of food-and-mouthdisease in its cattle herd in 2000 and 2001, the beef industry in Brazil stepped in withaggressive marketing and substantially increased its exports. When the Guatemalanraspberry industry faced official and private market-access problems in the late1990s after an outbreak of food-borne illnesses in North America was attributed toits products, many leading operators shifted their production base across the borderinto Mexico. That country’s raspberry exports have since blossomed. When U.S.beef is kept out of the Japanese market due to concerns about BSE, other countriesexpand their beef trade with Japan, and Japan increases its imports of nonbeefsources of protein.
Trade in high-value foods can be inhibited by interceptions of products atborder points or by outright restrictions on trade due to the presence of certainanimal diseases or plant pests or diseases in potential exporting countries. Weconsider these two possibilities in turn.
Some countries make available data on interceptions of food consignments forsafety reasons, but the data do not include the volume or value of the productsintercepted. Drawing on official data and consultations with private traders, Jaffeeand Henson (2004) provide an order-of-magnitude estimate of the impact of rejectionsat the border: in 2000–01, some $3.8 billion in world agro-food trade was affected,about 1 percent of all trade. Reflecting their dominant market share in certain productgroups for which the incidence of border detentions is relatively high (for example,meat and dairy products; processed fruit and vegetables), high-income countriesare estimated to account for 53 percent of rejected exports (and for some 63 percentof world agricultural and food product exports). The estimated value of developing

SANITARY AND REGULATION
361
country agro-food border rejections is $1.8 billion, three-fourths of which isaccounted for by middle-income countries.2
The proportion of agro-food trade that encounters official rejections is, formost food categories, probably substantially lower than the proportion of salessubjected to price discounts by private buyers because of quality defects, lack oftimeliness, and poor presentation. Further, only a small proportion of rejectedconsignments is actually destroyed at the point of import, while some (perhapssignificant) proportion of the product is reshipped, reconditioned, or otherwisemanaged for sale in the domestic market of the exporter or some other internationalmarket. And the products with the highest estimated proportion of rejections arealso among those that have seen the highest rates of growth in internationalagricultural trade.3
Based on these and other estimates, border rejections on grounds of foodsafety or related technical issues have probably had only a modest impact onoverall trade in agricultural and food products, notably that of developing countries.But border rejections probably represent only a small part of the constraint oninternational trade in agricultural and food products associated with food safetyand agricultural health measures. Far more inhibiting is the broad array of measuresthat render large numbers of countries ineligible to supply many livestock productsand food crops to other countries. Meat and dairy products are subject to thehighest level of rejections in global trade. Decades of traditional trade protectionsand trade-distorting subsidies in industrialized countries have kept these categoriesinsignificant for low-income countries and probably of secondary importance formost middle-income countries. But animal disease controls act to exclude manydeveloping countries from world markets for these products altogether.4 In part thisreflects the prevalence of endemic infectious animal diseases in many low andmiddle-income countries. The costs of establishing and maintaining disease-freeareas can be considerable and may be beyond the means of many of the poorestcountries. But even where there is no evidence that such diseases are present,many developing countries lack the capacity for surveillance and risk assessmentrequired to demonstrate that they do in fact have areas that are disease-free and tohave those areas recognized as such by the World Organisation for Animal Health,known by its French acronym OIE (Office International des Epizooties).5
Even where developing countries have established disease-free areas, theyface the risk that trade will be disrupted should outbreaks of disease occur.Restrictions applied to exports of poultry from Thailand and Vietnam after an outbreakof avian flu are just one example. In such cases exporters may be forced to divertproducts to domestic markets, causing a collapse of local prices. The overall impactof animal disease issues, therefore, is to enhance the risks associated with trade inlivestock products, placing a great onus on public authorities not only to invest in

TRADE, DOHA, AND DEVELOPMENT: A WINDOW INTO THE ISSUES
362
the establishment of disease controls, but also to ensure their continued efficacyover time.
Most low-income countries engaged in livestock trade have been unable tomeet importers’ food safety and agricultural health requirements pertaining tolivestock disease and hygiene. Most are restricted to trade in live animals ratherthan livestock products, for which hygienic slaughter in an abattoir, meat inspection,and refrigerated transport must be provided.6 Examples of the export of live animalsinclude intraregional trade in West Africa and supplies from East Africa to thecountries of the Persian Gulf. However, even if their capacity in the area of animaldisease and hygiene capacity could be enhanced, these countries would need tocompete with well-established livestock product exporters—notably Argentina andAustralia, reliable producers with fewer animal health problems and standardizedproduction (Upton 2001).
Similar issues arise with plant pests and diseases, which arguably have thegreatest impact on many developing countries, given the importance of trade infresh fruit and vegetables, grains, and nuts. For example, many Caribbean countriesface restrictions on the fresh fruits and vegetables that they can export to theUnited States because of the presence of various species of fruit fly. Jamaica, forexample, is unable to export mangos to the United States because of the presence ofWest Indian and Caribbean fruit fly. In some cases exports are prohibited altogether,whereas in others prescribed treatments are required. These treatments can involvefumigation or use of hot water to kill pests. Such treatments impose costs on theexporter and reduce shelf-life and lower product quality. Further, the costs ofestablishing such facilities can be considerable. In some cases the impact of plantdisease controls on trade in agricultural and food products can be mitigated throughcooperation between governments, for example, through the sharing of plant pestsurveillance data or the establishment of preclearance programs.
Rethinking the impact of stringent SPS standards—costs andbenefits, winners and losersThe cost of complying with food safety and agricultural health standards has beena major source of concern in the international development community and amongdeveloping countries. Many worry that SPS standards will work increasingly to thedisadvantage of developing countries that lack the administrative, technical, andother capacities to comply with new or more stringent requirements. However, theavailable evidence indicates that, in many instances, these challenges are manageableand the compliance costs a worthwhile investment, especially relative to the valueof exports and associated benefits.
Developing country suppliers rarely face all-or-nothing choices when determiningthe changes and investments needed to conform to emerging standards. Onlyoccasionally do SPS standards pose an absolute barrier to international market

SANITARY AND REGULATION
363
Box 1: Discrimination in the Application of SPS Standards?An Agreement on the Application of Sanitary and Phytosanitary Measures
(the SPS Agreement) was annexed to the 1994 Marrakech Agreement thatcreated the World Trade Organization. While the SPS Agreement sets outbroad ground rules for the legitimate application of SPS measures, it has noteradicated the differential application of standards—and it is unrealistic toexpect it to do so. Differentiation in the application of SPS measures is anecessary part of any risk-based food safety and agricultural health controlsystem. At the country, industry, and enterprise levels, the hazards to bemonitored and the control measures implemented must be prioritized to makethe best use of limited resources. An effective risk management system will gofurther, to differentiate explicitly between alternative sources of supply basedon differences in production conditions, past experience, and assessments ofrisk management capabilities in the supply chain. Many countries automati-cally detain imported products from countries with a history of noncompliancewith food safety or agricultural health requirements.
In circumstances in which regulators and others have wide discretion andwhere various forms of differentiation are required for cost-effective manage-ment of food safety and agricultural health, there remains ample scope foranticompetitive mischief. Yet separating legitimate differentiation fromillegitimate discrimination is problematic. It is even more difficult to prove thata given standard is wholly protectionist in intent. For example, in two widelycited cases where protectionism was assumed to have been an importantmotivating factor (involving restrictions on exports of Mexican avocadoes andArgentine citrus fruits to the United States), scientific justification wasproduced for the application of measures to prevent the spread of plantdiseases, although less restrictive measures could have been applied (Robertsand Orden 1997). In other cases, trading partners have differing perspectiveson the state of scientific knowledge or the need to make allowance foruncertainty. Perhaps the most prominent case is the dispute between theEuropean Union (EU) and United States over restrictions on exports of beefproduced with the use of hormones (Bureau and others 1998).
Among the many questions that remain about the use of food safety andagricultural health controls to discourage imports is whether foreignsuppliers must comply with higher requirements than domestic suppliers. Nosystematic research has been done on this subject. On the basis of generalimpressions and anecdotes, it would appear that many countries, bothindustrialized and developing, do have a lower tolerance for certain animaland plant health risks in imports than in domestic products. Some countrieshave restricted supplies from countries where a plant pest or animal disease

TRADE, DOHA, AND DEVELOPMENT: A WINDOW INTO THE ISSUES
364
access—and then usually in relation to animal diseases and plant pests. Barrierscreated by food safety standards are usually relative—that is, they favor suppliersthat can comply with the standards and tax those that cannot. Suppliers therefore needto weigh the costs and advantages associated with participating in different marketsegments. In some cases, they may have large and profitable opportunities to servicethe domestic market, the regional market, or market segments in industrialized countriesthat impose less stringent standards or allow more time to implement certain measures.
occurs, even though the pest or disease in question is prevalent domesti-cally. Similar observations can be made for some food safety controls. Forexample, the United States has long argued in trade forums that a broadarray of countries have a near zero tolerance for salmonella in importedpoultry products, yet this pathogen is widely present in their domesticsupply chains. Other cases of discriminatory practices have been brought tothe attention of the SPS Committee and addressed through bilateral ormultilateral discussions (Josling and others 2004).
A second question relates to whether the enforcement of food safety andagricultural health measures is more stringent for imports than for domesticsupplies. In discussions with high-value food exporters in developingcountries one frequently hears the accusation that the controls they face aremore rigorous than those imposed on domestic suppliers in certain industrial-ized countries. Frequently, however, this perception springs from the intensiveoversight and monitoring performed by private entities, especially supermar-kets and their buying agents, rather than from official systems of surveillanceand product monitoring. In other cases, the methods of control they face aremore visible than are domestic controls, in that compliance is assessed at theborder, and on this basis entry can be denied. Domestic suppliers, by contrast,are regulated through inspection of their processing facilities, with a focus onsystem-based controls or market surveillance. Conversely, anecdotal evidencesuggests that oversight for certain products and markets is more stringent ondomestic rather than imported supplies. For example, over a typical three-yearperiod the U.S. Food and Drug Administration (FDA) will undertake inspec-tions of all the domestic firms that produce low-acid canned foods, yet thesame inspections are conducted on just 3 percent of foreign facilities exportingsuch products to the United States. Even after substantially increasingresources for the inspection of food imports, the FDA still only inspectsbetween 1 and 2 percent of the more than six million consignments of food andcosmetic products imported each year.
Box 1. (continued)

SANITARY AND REGULATION
365
Even when targeting markets with relatively stringent standards, the level andrelative significance of compliance costs varies greatly from industry to industry,between different countries, and among different firms and farms within the sameindustry. Several factors contribute to this variability:• Typically there are several ways to meet a standard. Countries and firms that
have chosen to be proactive—that is, to prepare in advance to meet anticipatedstandards—are better able to weigh and compare various options and to adoptthose that are cost-effective. Entities that elect to delay compliance until aftera crisis has occurred are likely to have less flexibility and may need to adoptcostly measures simply to restore market access.
• Firms, industries, and countries operate from different starting points and withvarying assets obtained from past investments. For a relatively modern andmature industry, a change in standards may require only incremental changesby producers or exporters and perhaps some modest adjustment in publicsector oversight. However, for an underdeveloped supply chain, or wherethere is a lack of clarity on institutional roles, the new standard may requiremajor investments in infrastructure and significant legal or organizationalchange.
• Market factors often affect the level and distribution of certain benefits. Insome industries, price premiums are paid for products that can be labeled as“safe” or “sustainable,” or that bear other evidence of desirable attributes. Inother industries, competitive pressures have made such attributes the minimalnorm or driven down the value of such price premiums.Many of the potential benefits of complying with stringent SPS standards and
of improved SPS management by producers are long-term, intangible, or accrue tostakeholders that do not incur the associated costs (appendix 2). Benefits such asproductivity gains, reduced wastage, worker safety, environmental benefits, andeven the value of continued market access may be underestimated. This isunfortunate, because the perception that SPS compliance costs exceed the relatedbenefits discourages needed investments and deters proactive approaches, thusincreasing the likelihood of severe trade-related problems arising from adversefood safety or agricultural health events.
Many aspects of standards compliance do not require large investments orsophisticated technical or administrative capacities. The most significant challengeoften is building broad awareness about the need for proper SPS measures andfacilitating the broad adoption of good agricultural and manufacturing practices. Acoherent regulatory framework and a system to assess compliance and conformityare also needed. Even in very poor countries, these systems and capacities can bedeveloped if a proactive approach is adopted. Compared with the present andfuture volume of trade and other benefits, the costs of compliance usually arerelatively low.

TRADE, DOHA, AND DEVELOPMENT: A WINDOW INTO THE ISSUES
366
Although the overall trade of developing countries as a group has not beenadversely affected by the tightening of SPS standards, the different approaches tothis challenge and differences in underlying technical and administrative capacitieshave resulted in some relative winners and losers. Larger, incumbent suppliers tendto have an incremental advantage, because they can realize economies of scale,have better access to information, and benefit from well-established reputations(for example, with overseas inspectors). Small, poor countries and industries tendto be disadvantaged. Still, effective action can make a difference. There are examplesof well-organized industries and well-managed firms and supply chains in low-income countries that have maintained or even enhanced their competitivenessand market share during this period of more stringent standards.
Although compliance (and noncompliance) can bring about changes that havea negative impact on the poor, those who are able to participate in evolving supplychains may benefit. This can certainly apply to small farmers operating in suitablelocations with adequate infrastructure, including effective producer organizationsand long-term relationships with buyers. Also, the tightening of standards hassometimes increased off-farm employment opportunities, especially in productcleaning, handling, processing, and packing, and in a broad array of process controls.
Presently, among low- and (to a lesser extent) middle-income countries,weaknesses in food safety and agricultural health management, both in the privateand public sectors, constrain productivity and competitiveness. Such constraintsalmost certainly will take on greater importance in the coming years, given trends inconsumer attitudes and preferences, changes in supply-chain governance andmarket structures, and continued advances in science and technology. Interventionsto strengthen SPS management capacities can contribute to growth and povertyreduction by removing those constraints.
Using one’s room for maneuver—toward a proactive approach toSPS managementAs the demand for high-value food products grows rapidly over the coming decades,countries and individual producers that approach standards compliance as part ofan overall competitive strategy are likely to thrive. Certain developing countryindustries—Kenya’s horticulture sector, for example (box 2)—have succeeded inmeeting standards by adopting a proactive approach to compliance—staying abreastof shifting technical and commercial requirements in their chosen markets andanticipating future changes. These firms have pursued and used higher standardsto reposition themselves in remunerative market segments, sometimes by addingvalue to commodities.
More generally, a forward-looking approach requires certain national andindustry capacities, including those for channeling information and interpretinginternational regulatory and commercial trends, conducting risk analysis, undertaking

SANITARY AND REGULATION
367
hazard surveillance and monitoring, and applying contingency planning in SPSmanagement (appendix 3). A successful proactive campaign also requires thatpolicymakers, firms, and industry organizations adopt the perspective that effectiveSPS management is a core element of overall competitiveness. Failure to address
Box 2. Kenyan horticulture: high costs and high gains atthe top of the market
Kenya’s experience with fresh vegetable exports demonstrates that a well-organized industry in a low-income country can use standards forcompetitive gain. The leading firms in Kenya’s fresh produce industry chosein the early 1990s to “ride the tail” of British supermarkets, investing inproducts, internal systems, and supply chains to service the premium-quality end of the market, including the growing demand for salads andother semi-prepared vegetable products. These firms and their farmersuppliers bore most of the costs of compliance—and reaped most of thebenefits.
The costs of the tail-ridingstrategy have included the construction ofhigh-care processing facilities, investment in private laboratories, and thedevelopment of full supply-chain traceability. Leading companies haveupgraded and expanded their facilities, installing new lighting and watersanitation systems, advanced cold treatment and storage systems, facilitiesfor worker hygiene and quality management (such as hazard analysis andcritical control point systems).
Yet the benefits from these investments and of general compliance withthe requirements of upscale supermarkets also seem to have beensignificant. The net profit margins of large Kenyan exporters can be as highas 14 percent for “high-care” packaged goods, compared to 2 percent forbulk vegetables packed loose in cartons. Other benefits perceived by theexporters include regularity of demand, advance information fromsupermarket clients on market trends, certainty with respect to quality andhygiene specifications, and enhanced reputation.
The payoff on Kenya’s proactive investment has been great. Over thepast decade, as EU imports from nonmember countries were flat, Kenya wasable to increase the value of its fresh vegetable exports significantly, in largepart by shifting the product composition of its trade, meeting the higheststandards in EU markets, and achieving an upward shift in the unit value ofits exports. From 1991 to 2003, the value and volume of Kenya’s exports offresh vegetables increased five fold.

TRADE, DOHA, AND DEVELOPMENT: A WINDOW INTO THE ISSUES
368
SPS problems or concerns may undermine an industry’s access to remunerativeinternational markets. But where fundamental supply-side problems persist, theresolution of SPS constraints will not yield sustained export success.
The foregoing observations imply that many developing countries can profitby viewing strict standards as a stimulus for investments in supply-chainmodernization, providing incentives for the adoption of better safety and qualitycontrol practices in agriculture and food manufacturing, and clarifying theappropriate and necessary roles of government in food safety and agriculturalhealth management. Rather than degrading the comparative advantage of developingcountries, the compliance process can result in new forms of competitive advantageand contribute to more sustainable and profitable trade over the long term.
Moving ahead: a capacity-building agenda for developing countriesImproved SPS capacity is the key to a successful proactive approach to compliance.The proactive approach to standards compliance is most likely to succeed whensupported by adequate capacity in food safety and agricultural health control, andwhen policymakers have the confidence to voice their concerns about the standardsimposed by trading partners and buyers. Every new SPS standard, public or private,favors those market players that are able to anticipate it. Private producers musthave the capacity to target the right markets and to be ready to comply or makeother adjustments before standards are imposed and trade is disrupted. Policymakersmust draft sensible regulations; regulators must have the capacity to enforce thosemeasures. Standards can represent both an opportunity and a catalyst, but forthose poorly prepared or disinclined to take active steps, they will almost certainprove a barrier to trade. To make further progress in this domain:• Rich countries and pertinent technical agencies should increase and reorient
their assistance to developing countries for SPS capacity building, providing itbefore crises occur. Many past interventions have been triggered by emergencysituations, such as trade disruptions or disputes, rather than by the prospectof forging a strategic approach to SPS management and investment. Futurecapacity-building efforts should be geared toward maximizing the strategicoptions available to both government and the private sector in developingcountries faced with new or more stringent SPS standards.
• Industrial country governments should harmonize SPS product and processrequirements with those of other countries (and with established internationalnorms), where there is an identified benefit of doing so. Through memorandaof understanding, twinning arrangements, and other programs, they shouldwork closely with developing country trading partners to achieve mutualrecognition of SPS management systems and to ensure that the impact ondeveloping countries of proposed SPS measures is understood in advance.
• To reduce costs and ensure sources of supply, the private sector in industrial

SANITARY AND REGULATION
369
countries should harmonize or mutually benchmark the growing array ofoverlapping and competing private protocols on good agricultural andmanufacturing practices, and other process standards. It should consultdeveloping country suppliers when developing or revising standards so as tomake their implementation more user-friendly and cost-effective. Supply chainleaders should consider joining with governments and donor agencies to providetechnical assistance to suppliers to enable them to meet emerging requirements.
• Developing country governments should move beyond control functions tobuild awareness about SPS management and to facilitate individual andcollective action by private companies, farmers, and others. Adopting a long-term, strategic approach to managing SPS standards and international marketaccess obliges policymakers and technical administrators to work closely withthe private sector to identify emerging challenges and opportunities, makeappropriate regulatory changes, and choose suitable strategies and neededinvestments. Clear distinctions should be made between food safety andagricultural health challenges. Many of the former can be addressed byindividual company actions, whereas many of the latter require systemicapproaches or controls that extend beyond the sphere of individual firms orsupply chains.
• The private sector in developing countries should incorporate current andexpected requirements related to SPS and other standards into business plans,including considerations of product-market combinations, customer and supplyrelationships, production technology, logistics, and investments in processingand marketing facilities. It should work through industry organizations toadvocate for effective public sector support and to implement programs tobuild awareness, encourage adoption of good practices and codes of practice,and otherwise strengthen food quality and SPS management within theirindustries.

TRADE, DOHA, AND DEVELOPMENT: A WINDOW INTO THE ISSUES
370
Appendix 1. The World Bank’s research program on sanitary andphytosanitary (SPS) measuresThe World Bank’s research program on sanitary and phytosanitary (SPS) measureswas designed to improve understanding of an emerging set of policy and commercialissues in the area of food safety and agricultural health. It does not cover otherstandards, such as labor, environmental or animal welfare requirements. The programhas involved a series of case studies covering selected commodity supply chainsin nine low- and middle-income countries—Ethiopia, India, Jamaica, Kenya, Morocco,Nicaragua, Senegal, Thailand, and the countries of Latin America’s Southern Cone.The commodity chains are those related to fish, horticulture, livestock products,nuts, and spices. They were chosen because the products involved have posedSPS compliance challenges for a significant number of developing countries andhave been the subject of many recent food safety events or crises in industrializedcountries. Countries were selected to capture regional diversity, varied marketorientations, and a range of experiences, from emerging to long-standing industries.Complementary “buyer studies” were also carried out, involving representativeimporters and retailers of shrimp and selected fruits and vegetables in the EuropeanUnion, Japan, and the Untied States.
The major themes and questions addressed in the research program have been:• Overall context and prominence. How difficult are the challenges posed by
rising private and public SPS standards for developing country suppliers?What is the relative significance of these challenges, compared with otherfactors affecting competitiveness?
• Dynamics and differences in standards. What are the similarities and distinctivefeatures of the evolving standards for different product groups and in relation todifferent industrial country destination markets? What are the main driving forcesbehind the newer standards? What can be expected in the future?
• Strategies to comply with or influence standards. What strategies have beenused and have worked to meet the emerging requirements or influence theirapplication? What are some key factors influencing the viability andsustainability of different approaches?
• Costs and benefits of compliance. What is the nature, magnitude, and overallsignificance of costs and benefits associated with supplier (and country)compliance with external market standards?
• Structural and distributional implications. What are the implications ofstandards-related barriers and compliance for market structures and for theparticipation of small-scale farmers and firms in export-oriented supply chains?
• Lessons from donor-supported programs. What have been the patterns ofcapacity-building assistance in this field in recent years? What lessons can bedrawn about the timing, institutional features, effectiveness, and sustainabilityof capacity-building programs?

SANITARY AND REGULATION
371
Table A1. Country and commodity case studies in the World Bank’sresearch program
Fish, shrimp, and fish products India, Jamaica, Kenya, Nicaragua, Senegal, ThailandFruits and vegetables Jamaica, Kenya, Morocco, ThailandAnimals/animal products Ethiopia (live animals), Latin America’s Southern
Cone (beef and Foot-and-mouth Disease (FMD) control)
Nuts and spices India (spices), Senegal (groundnuts)Source: World Bank (2005).
Table A2. Costs and benefits of complying with SPS standards
Source: World Bank (2005).
Costs—Investment: 0.5–5 percent of the multiyear value of trade; Recurrent: 1–3 percent
of annual salesBenefits—Often hard to compute
• Upgrade of laboratory infrastructure • Crisis containment, as when traceability system prevents an alert from becoming a crisis
• Upgrade of processing facilities • Increased attention to overall efficacy of controls
• Investments in farm-level facilities to comply with GAP requirements
• Access to more remunerative markets and supply chains
• Reduced investment in new product development
• Greater efficiency, thus lower costs
• Reduced investment in domestic food safety controls
• Less waste in production processes
• Collection and analysis of laboratory tests • Reduced incidence of product inspection and detention abroad
• Additional costs for ‘certified’ raw materials • Enhancement of product quality
• Additional costs for implementing hazard analysis and critical control point system
• Higher morale of inspection and production staffs
• Reduced flexibility in production processes • Improved reputation of firm and/or country
• Reduced domestic food safety enforcement • Improved worker safety and reduced environmental degradation

TRADE, DOHA, AND DEVELOPMENT: A WINDOW INTO THE ISSUES
372
Fish products Horticultural products Animal health
Inadequate legislation relating to hygiene controls in fish processing
Weak regulatory systems relating to the import, production, and sale of pesticides.
Weak systems to monitor emerging regulatory changes related to animal disease controls on imports in existing or potential export markets
Poorly defined administrative responsibilities for approval and inspection of processing facilities and certification of exports
Lack of capacity to undertake pest-risk analyses
Inadequate legislation and undocumented procedures relating to animal health controls
Weak inspection systems for processing facilities, including lack of documented procedures, insufficient inspection staff, limited skills and weak reporting
Weak controls relating to plant pests and diseases at borders
Weak controls relating to animal diseases at borders
Weak laboratory testing capacity for microbiological and chemical contaminants and for residues of antibiotics
Low capacity to implement quarantine measures and enforce pest-free areas
Weak capacity to implement quarantine or control/eradication measures in the event of a disease outbreak
HACCP systems not widely implemented in fish-processing plants and not extending to fishery capture and production
Limited farmer knowledge of alternative pest-management approaches and appropriate use of pesticides
Weak capacity to undertake disease surveillance and risk assessments
Limited application of HACCP principles by fresh vegetable packers/exporters (especially SMEs)
Weak laboratory testing capacity related to the diagnosis of animal diseases and monitoring programs
Limited systems for fresh-produce traceability
No incentive to divulge or publicize outbreaks of animal diseases
HACCP = Hazard analysis and critical control point
Table A3. Common food safety and agricultural health managementdeficiencies in selected sectors
Source: World Bank (2005).

SANITARY AND REGULATION
373
Notes1 This note is based primarily on the report “Food Safety and Agricultural Health Standards:
Challenges and Opportunities for Developing Country Exports” (Washington, DC: World Bank,2005), http://www.worldbank.org/trade/standards.
2 Jaffee and Henson (2004) estimate the value of agro-food exports from low-income coun-tries rejected at the border of importing countries at $275 million, slightly less than 1 percentof the agro-food exports of those countries. Fish and fishery products probably account formore than one-half of this affected trade.
3 Although the overall impact of border rejections on trade may not be very significant, thecosts may be considerable for individual suppliers (or countries), both in terms of the value oflost products and adverse effects on the supplier’s reputation.
4 For example, the United States currently permits imports of beef from only 33 countries andimports of chicken from only four countries.
5 Currently, the OIE recognizes only 57 countries as being totally free of foot-and-mouthdisease without vaccination, of which 26 are developing countries and only 3 are low-incomecountries.
6 Indeed, widespread cases of both new and well-established animal diseases have led to height-ened concerns about the role of international trade in the spread of such diseases. In the case ofBSE, widespread restrictions have been applied to trade in live animals, meat, animal feed, andan array of by-products used in cosmetics, pharmaceuticals, and other industries.
ReferencesBureau, J., S. Marette, and A. Schiavina. 1998. “Non-Tariff Trade Barriers and Consumers’
Information: The Case of the EU-US Trade Dispute over Beef.” European Review ofAgricultural Economics 25: 437–462.
Jaffee, S. 2003. “From Challenge to Opportunity: Transforming Kenya’s Fresh Vegetable Tradein the Context of Emerging Food Safety and Other Standards in Europe.” Agriculture andRural Development Discussion Paper 2. World Bank, Washington, DC.
Jaffee, S., and S. Henson. 2004. “Standards and Agri-Food Exports from Developing Countries:Rebalancing the Debate.” Policy Research Working Paper 3348. World Bank, Washington, DC.
Josling, T., D. Roberts, and D. Orden. 2004. Food Regulation and Trade: Toward a Safe andOpen Global System. Washington, DC: Institute for International Economics.
Orden, D., and D. Roberts. 1997. “Determinants of Technical Barriers to Trade: The Case ofU.S. Phytosanitary Restrictions on Mexican Avocadoes.” In Understanding Technical Barriersto Agricultural Trade, ed. D. Orden and D. Roberts. International Agricultural Trade ResearchConsortium, University of Minnesota.
Upton, M. 2001. Trade in Livestock and Livestock Products: International Regulations andRole for Economic Development. Rome: Food and Agricultural Organization.
World Bank. 2005. Food Safety and Agricultural Health Standards: Challenges and Opportunitiesfor Developing Country Exports. Washington, DC: World Bank.
Further ReadingBuzby, J., ed. 2003. “International Trade and Food Safety: Economic Theory and Case Studies.”
Agricultural Economic Report 828. U.S. Department of Agriculture, Washington, DC.ITC (International Trade Centre). 2003. Influencing and Meeting International Standards:
Challenges for Developing Countries. Geneva.OECD. 2003. “Trade Effects of the SPS Agreement.” Directorate for Food, Agriculture, and
Fisheries, Paris.

TRADE, DOHA, AND DEVELOPMENT: A WINDOW INTO THE ISSUES
374
Unnevehr, L., ed. 2003. Food Safety in Food Security and Food Trade. Washington, DC:International Food Policy Research Institute.
World Trade Organization. 2005. World Trade Report 2005, Exploring the Links Between Trade,Standards, and the WTO. Geneva.


