TRADE, FDI AND INDUSTRIAL TRANSFORMATION IN INDIA KUNAL SEN IDPM SCHOOL OF ENVIRONMENT AND DEVELOPMENT UNIVERSITY OF MANCHESTER, UK ABSTRACT This paper examines the effects of trade and FDI inflows on India’s industrial transformation, particularly since the onset of economic reforms in the 1980s and early 1990s. Examining the evolution of the Indian manufacturing sector since the mid 1970s, we find that after a period of stagnation in the 1970s, Indian manufacturing showed consistent growth in all indicators from the early 1980s to the mid 1990s. We find that trade reforms in India have had a strong positive impact on total factor productivity. However, the impact of trade in the net creation of jobs in the manufacturing sector has been relatively small. There has been a strong growth in inward FDI since the early 1990s, though mostly to capital-intensive manufacturing. Our analysis suggests that foreign firms in India in the post-reform period are more productive and exhibit greater export orientation than domestic firms, but do not show stronger growth , higher investment rates and higher R and D intensity. The overall finding is that while trade and FDI have had major positive effects on efficiency in Indian manufacturing, they may not have had similar positive effects with respect to equity outcomes, especially in contributing to the growth of a labour-intensive export-oriented segment of the manufacturing sector. PAPER PREPARED FOR RESEARCH WORKSHOP ‘EMERGING TRENDS AND PATTERNS OF TRADE AND INVESTMENT IN ASIA’, NINTH GLOBAL DEVELOPMENT NETWORK CONFERENCE, BRISBANE, AUSTRALIA, 2008
Transcript
TRADE, FDI AND INDUSTRIAL TRANSFORMATION IN INDIA
KUNAL SEN
IDPM SCHOOL OF ENVIRONMENT AND DEVELOPMENT
UNIVERSITY OF MANCHESTER, UK
ABSTRACT This paper examines the effects of trade and FDI inflows on India’s industrial transformation,
particularly since the onset of economic reforms in the 1980s and early 1990s. Examining the
evolution of the Indian manufacturing sector since the mid 1970s, we find that after a period of
stagnation in the 1970s, Indian manufacturing showed consistent growth in all indicators from the
early 1980s to the mid 1990s. We find that trade reforms in India have had a strong positive impact on
total factor productivity. However, the impact of trade in the net creation of jobs in the manufacturing
sector has been relatively small. There has been a strong growth in inward FDI since the early 1990s,
though mostly to capital-intensive manufacturing. Our analysis suggests that foreign firms in India in
the post-reform period are more productive and exhibit greater export orientation than domestic firms,
but do not show stronger growth , higher investment rates and higher R and D intensity. The overall
finding is that while trade and FDI have had major positive effects on efficiency in Indian
manufacturing, they may not have had similar positive effects with respect to equity outcomes,
especially in contributing to the growth of a labour-intensive export-oriented segment of the
manufacturing sector.
PAPER PREPARED FOR RESEARCH WORKSHOP ‘EMERGING TRENDS AND
PATTERNS OF TRADE AND INVESTMENT IN ASIA’, NINTH GLOBAL DEVELOPMENT NETWORK
CONFERENCE, BRISBANE, AUSTRALIA, 2008
TRADE, FDI AND INDUSTRIAL TRANSFORMATION IN INDIA
KUNAL SEN
1. INTRODUCTION
In the middle of the 1970s, the trade and foreign direct investment regime pertaining to the Indian
manufacturing sector was one of the most restrictive in the world. By this time, the Indian government
had devised a licensing system that governed almost all aspects of firm behaviour in the industrial
sector, controlling not only entry into an industry and expansion of capacity, but also technology,
output mix, capacity location and import content (Bhagwati 1993, Bhagwati and Desai 1970). The
objectives of the policy regime with respect to the manufacturing sector were to channelise
investments in ‘socially desirable directions’, consistent with the Five Year Plans of the Government
of India, and to build up a self-reliant and diversified industrial base (Bhagwati and Srinivasan 1975).
It is widely recognised that the policy regime was a key contributing factor to the industrial stagnation
observed in the Indian economy, especially from 1966 to 1980, though the policies towards self-
reliance led a diversified industrial base (Ahluwalia 1991, Mookherjee 1995).
A process of gradual reform was initiated in the late 1970s, quickened in pace in the 1980s,
culminating in 1991 in a radical set of reforms that dismantled much of the import licensing system
and removed most restrictions on foreign direct investment. In this paper, we assess the impact of the
reforms on trade flows between India and the rest of the world and foreign inward investment flows to
India, focusing on the Indian manufacturing sector. We also examine the implications of the trade
reforms for productivity and employment growth in the Indian manufacturing. Finally, we make some
preliminary inferences on the characteristics of inward FDI in post-reform India, and discuss the
possible effects of FDI on market structure, exports, technological development and productivity in
Indian industry.1
1 For reasons of space and due to the fact that we are interested in tracing out the effects of changes in the foreign direct investment on industrial transformation in India, we confine ourselves in this paper to inward FDI. However, it should be noted that outward FDI is increasingly becoming more important in India, with the flow of outward FDI rising from an annual average of 121 US million dollars in 1990-2000 to 9676 US million dollars in 2006. There is an emerging literature which examines the causes and implications of this recent phenomenon – see Aykut and Goldstein (2006), Nayyar (2006), and Kumar (2007).
1
The rest of the paper is in six sections. In the next section, we briefly describe the changes in the
policy regime with respect to trade and FDI in India. In Section 3, we describe the evolution of the
Indian manufacturing sector, examining the trends and patterns in employment, wages, and output.
Section 4 provides the salient features of trade flows and FDI inflows to India. In Section 5, we
analyse the effects of the trade reforms on productivity and employment in the Indian manufacturing
sector. In Section 6, we discuss the possible effects of FDI on industrial development in India, as have
found in the literature and in our own estimates. Section 7 concludes.
2. TRADE AND FDI – THE POLICY REGIME IN INDIA
Trade Policy: An Overview
The import and exchange rate regime that Indian policy-makers followed since independence was
aimed at the comprehensive, direct control over foreign exchange utilisation, with an overwhelming
reliance on quotas rather than tariffs (Bhagwati and Srinivasan 1975). Import licenses allocated
reflected two major criteria: (1) the principle of “essentiality”; and (2) the principle of “indigenous
non-availability”. Thus, imports, in terms of both magnitude and composition, were to be permitted
only the firm in question certified to the government that they were “essential” (as inputs or equipment
for production). At the same time, the government had to clear the imports from the viewpoint of
indigenous availability: if it could be shown that there was domestic production of the imports
demanded, then the imports were not permitted (regardless of cost and quality considerations). Nearly
all imports were subject to discretionary import licensing or were “canalised” by government
monopoly trading organisations. The only exceptions were commodities listed in the Open General
License (OGL) category. Capital goods were divided into a restricted category and the OGL category.
While import licenses were required for restricted capital goods, those in the OGL could be imported
without a license subject to several conditions. Intermediate goods were also classified into the
banned, restricted and limited permissible categories plus an OGL category. As these names suggest,
the first three lists were in order of import licensing stringency. OGL imports of intermediate goods
were also governed by the “actual user” condition. The import of consumer goods was, however,
banned (except those which were considered “essential” and could only be imported by the designated
government canalizing agencies).
Beginning with the export-import policy of 1977-78, there was a slow but sustained relaxation of
import controls. Several capital goods that were not allowed to be imported without an import license
2
were steadily shifted to the OGL category. The number of capital goods on the OGL list increased
from 79 in 1976 to 1170 in April 1988. These changes were made with the intention of allowing
domestic industries to modernize. Moreover, during the 1980s the import licensing of capital goods in
the restricted list were administered with less stringency (Pursell 1992). As a consequence, the import
penetration ratio in the capital goods sector increased from 11 per cent in 1976-77 to 18 per cent in
1985-86 (Goldar and Renganathan 1990). In the case of intermediate goods too, there was a steady
shift of items from the restricted and limited permissible categories to the OGL category. However, in
practice a capital or an intermediate good was placed in the OGL list only if it was not being
domestically produced. Thus, import liberalisation during this period may have led to some degree of
competition to established producers of intermediate and capital goods in India (though in several
instances, the goods that were allowed to be imported were imperfect substitutes of domestically
produced goods). Furthermore, there was an increase in tariff rates across all commodities, and in
particular, on capital goods. By 1987/88, the unweighted average of tariffs on manufactured goods
was 147 per cent, with most tariff lines for manufacturing clustered around a range of 140-160 per
cent.
The pace of the trade reforms - in particular, the shift from quantitative import controls to a protective
system based on tariffs - initiated in the mid-seventies were considerably quickened by the new
government (led by Rajiv Gandhi) that came into power in November 1985. Restrictions on the import
of capital goods were further eased to encourage technological modernisation. Also, beginning in the
mid-eighties, there was a renewed emphasis by the new administration on export promotion. The
number and value of incentives offered to exporters were increased and their administration
streamlined. The allotment of REP licenses - tradable import entitlements awarded to exporters on a
product-specific basis - became increasingly generous (Agrawal et al. 1995). Finally, the duty
exemption scheme for imported inputs was extended to cover all imported inputs for both direct and
indirect exporters.
In 1991, as a part of the comprehensive economic reform programme initiated that year, there was a
significant liberalization of the trade regime with respect to capital goods. Import licensing was
virtually abolished with respect to the imports of most machinery and equipment and manufactured
intermediate goods (Ahluwalia 1999). There was also a significant cut in tariff rates, with the peak
tariff rate reduced from 300 per cent to 150 per cent and the peak duty on capital goods cut to 80 per
cent.2 Import-weighted custom duty rates fell from an average of 97 per cent in 1990-91 to 29 per cent
2 As Joshi and Little (1997) argue, the concentration of emphasizing an early reduction in tariffs on capital goods in the reform process was probably intended to avoid discouraging investment because of the expectation of a later reduction in tariffs.
3
in 1995-96. There was, however, little change in trade policy with respect to consumer goods which
remained in the “negative” (banned) list.
The radical reforms of the trade regime in 1991 coincided with an equally significant set of reforms in
industrial policy. Prior to 1991, there was a system of industrial licensing of private industry in place
which governed almost all aspects of firm behaviour in the industrial sector, controlling not only entry
into an industry and expansion of capacity, but also technology, output mix, capacity location and
import content. In 1991, previous piecemeal efforts towards liberalization of controls were
consolidated in a comprehensive wave of domestic deregulation. Industrial licensing was abolished
altogether, except for a list of environmentally sensitive industries. Along with this was the removal of
restrictions on large business groups to merge or expand, and the opening up of several industries to
the private sector, which had been previously reserved for the public sector.
Trends in Measures of Trade Restrictiveness
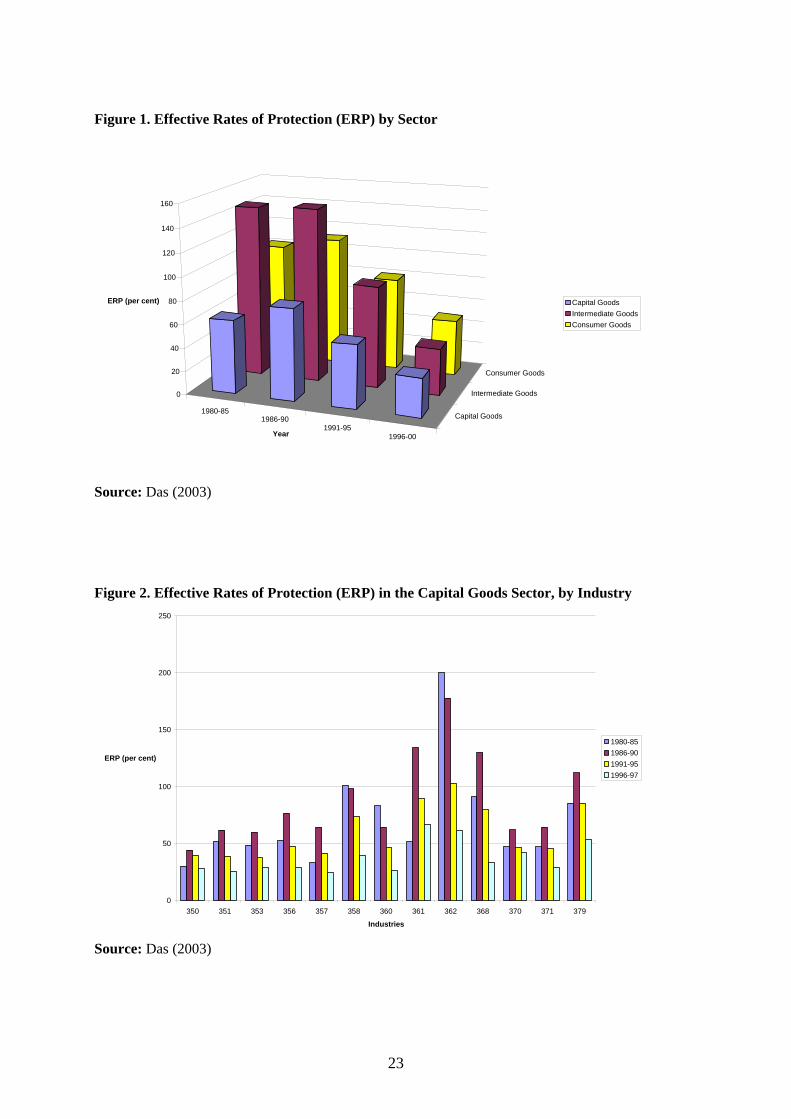
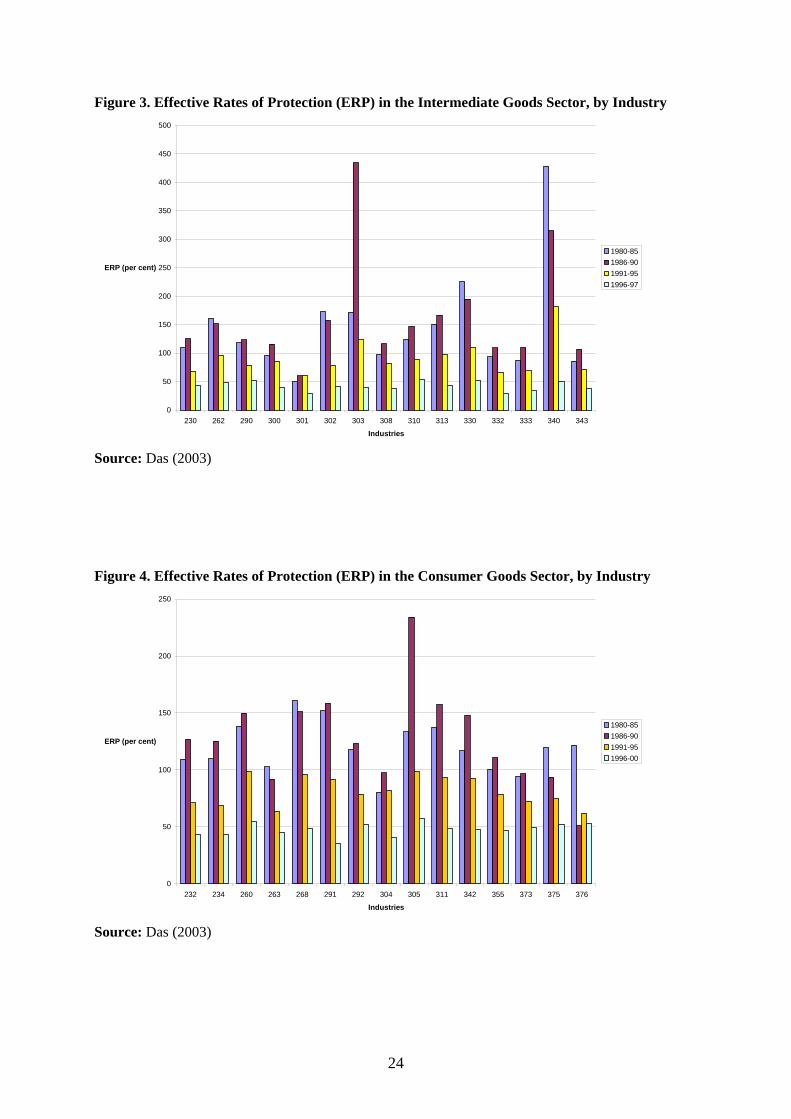
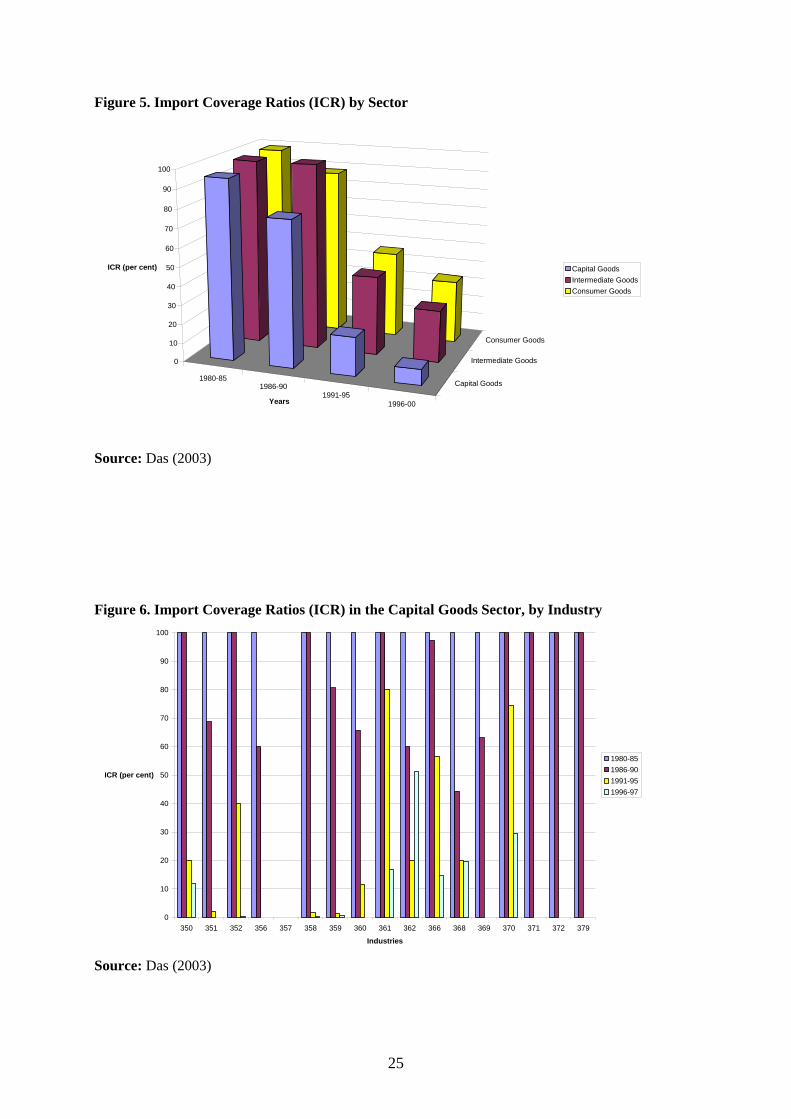
We present estimates of Effective Rates of Protection (ERP) obtained from Das (2003) for the period
1980-1999 for the three major sectors in India – capital goods, intermediate goods and consumer
goods in Figure 1. The most protected sector with respect to tariff protection in the beginning of the
1980s was the intermediate goods sector, where the average ERP was 147 per cent. The ERPs for the
capital goods and consumer goods sectors for the same period were 63 and 102 per cent respectively.
There was little change in ERPs in the 1980s, as the gradual relaxation of import licensing over this
decade coincided in most instances with an increase in tariffs. However, since the 1991 trade reforms,
there have been a clear decrease in ERPs across all three sectors. In fact, by the end of the 1990s, the
average ERP for the intermediate goods sector at 40 per cent was actually less than the average ERP
for the consumer goods sector at 48 per cent. However, the least protected sector in the late 1990s was
the capital goods sector with an average ERP at 33 per cent.
While the intermediate goods sector may have been the most protected and the capital sector the least
protected in the aggregate with respect to tariff protection, there are clear differences in the degree of
protection within each sector. This is evident from Figures 2, 3 and 4 where we provide ERPs for
individual industries in the capital goods, intermediate goods and consumer goods sectors respectively
(industry classifications are in NIC 3 digit codes – see Data Appendix). Within the capital goods
sector, an industry such as agricultural machinery (Industry Code: 350) has an ERP of 30 per cent in
1980-1985 as compared to an ERP of 200 per cent for batteries (Industry Code: 362) in the same
period. Similarly, in the intermediate goods sector, fabricated metal products (Industry Code: 340) has
an ERP of 428 per cent in 1980-1985 compared to fertilisers and pesticides (Industry Code: 301)
which has an ERP of 51 per cent in 1980-1985. Finally, in the consumer goods sector, waterproof
textile fabrics (Industry Code: 268) has an ERP of 161 per cent in 1980-1985 compared to drugs and
medicines (Industry Code: 304) which has an ERP of 80 per cent in 1980-1985. However, by the late
4
1990s, there is significantly lower variation of ERPs within each sector, with the rationalisation of
tariffs and the move to a more uniform tariff rate across industries.
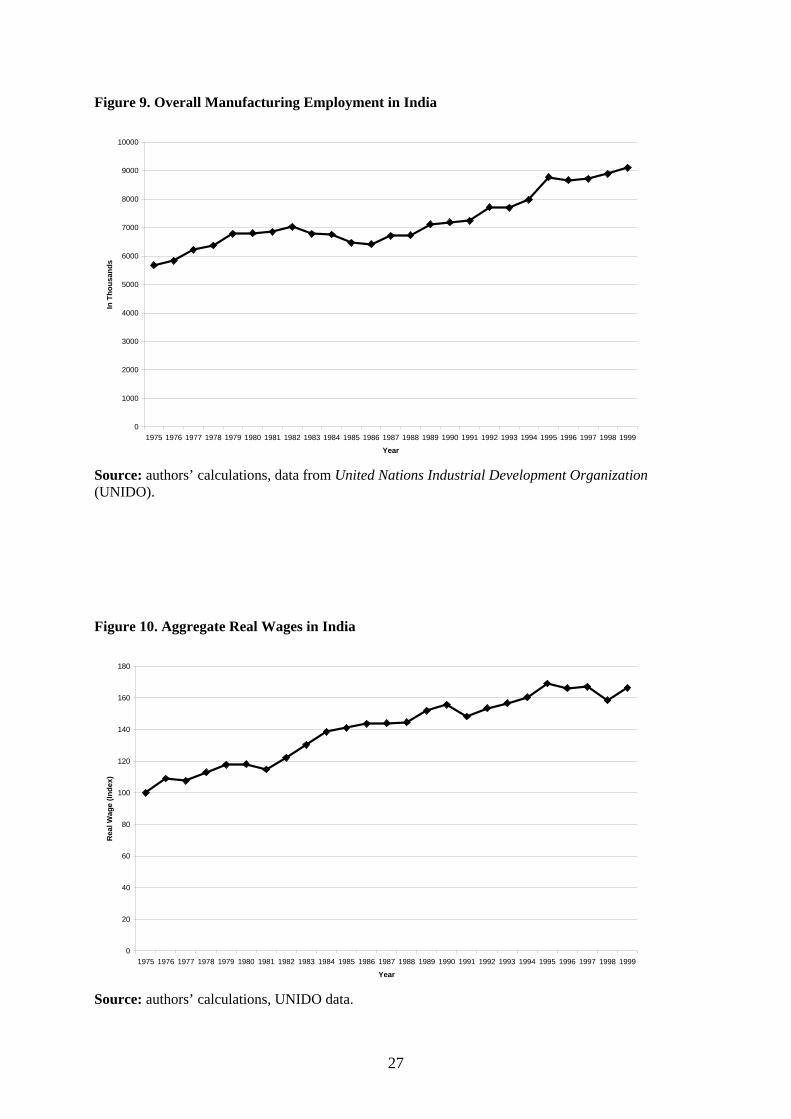
Effective rates of protection may not adequately measure protection in Indian industry, given the
extensive use of nontariff barriers in Indian trade policy. A more accurate measure of the
restrictiveness of trade policy in this case is the import coverage ratio (ICR), which is the share of
imports subject to non-tariff barriers. We find that the use of ICRs as a measure of the restrictiveness
of trade policy suggests that all the three sectors were equally protected by the use of NTBs in the
early 1980s, and that NTBs covered almost all manufacturing goods. The average ICR by sector was
at 95 per cent or more in 1980-1985 (Figure 5). However, by the late 1990s, the most spectacular
decline in NTBs was in the capital goods sector, where the ICR fell to 8 per cent. The ICRs in the case
of intermediate goods and consumer goods sectors were 28 and 33 per cent in 1996-1999 respectively.
When we examine the presence of NTBs at the individual industry level, we find that for the whole of
the 1980s, in most industries, the ICRs stood at 100 per cent, indicating the widespread use of quotas
in Indian trade during this period (Figures 6, 7, and 8). However, there were a few industries where no
NTB was applied – these are machine tools (Industry Code: 357), leather tanning (Industry Code:
290), and cotton textiles (Industry Codes: 232, 233 and 234). In the 1990s, there is a significant
decline in ICRs across most industries, and in the case of intermediate goods and capital goods sectors,
in several industries, the ICR falls to zero, as quotas are completely removed in these industries. This
is not the case, however, in the consumer goods sector, where NTBs still remain, though with much
reduced coverage.
The Policy Regime with respect to FDI
The Indian policy regime with respect to foreign direct investment was fairly liberal till the mid 1960s.
In the late 1960s, the industrial policy regime became increasingly restrictive with the enactment of
the Monopolies and Restrictive Trade Practices (MRTP) Act in 1969. The MRTP Act stipulated that
all firms with a capital base of over Rupees 20 million were to be classified as MRTP firms and were
permitted to enter only selected industries and that too on a case by case basis. In addition to industrial
licensing, all investment proposals by these firms required separate approvals from the Department of
Company Affairs. Amidst increasing concerns about the foreign exchange costs of repatriated profits,
the government introduced a new clause in the Foreign Exchange Regulation Act (FERA) in 1973,
that required firms to dilute their foreign equity holdings to 40 per cent if they wanted to be treated as
Indian companies (Athreye and Kapur 2001). The FERA provided the regulatory framework for
commercial and manufacturing activities of branches of foreign companies in India and Indian joint-
stock companies with a foreign equity holding of over 40 per cent. The Act specified a list of
industries where such firms would be allowed to operate and all new investments and substantial
5
expansions required separate approval from the Department of Company Affairs. In addition to
restrictions on foreign investment, there were new restrictions on technology imports, with technology
acquisition allowed mostly through licensing rather than through financial collaboration (ibid.).
In line with the incremental reforms that occurred with respect to the trade regime in the 1980s, there
was an attempt to liberalise the regulatory regime with respect to FDI in the same period. In order to
boost manufacturing exports, firms which produced primarily for the export markets were granted
exemptions from the standard FERA restrictions on foreign equity ownership. Along with a more
liberal regime with respect to capital goods imports, restrictions on technology transfers and royalty
payments were somewhat relaxed in an attempt to modernise the manufacturing sector, which was
seen to have become stagnant and technologically obsolescent by the early 1980s.
More radical reforms had to wait till 1991, when the Indian government significantly liberalised the
policy regime with respect to FDI, which was allowed in sectors (such as infrastructure and services)
where previously it had been excluded. The limit on foreign equity participation was raised to 51 per
cent in most of these sectors, and FDI proposals were automatically approved in many of these sectors.
For most manufacturing industries, 100% fully foreign owned firms were allowed (Kumar 2005). The
restriction on FDI that it had to provide specific benefits in terms of technology transfer and exports
was also removed.
3. GROWTH AND TRANSFORMATION IN INDIAN INDUSTRY
In this section, we describe the evolution of the Indian manufacturing sector from the mid 1970s
onwards to the late 1990s.3 We begin with an overview of India’s economic growth and the
contribution of the manufacturing sector to it. We then examine the behaviour of employment, wages
and output in the Indian manufacturing sector.
3 The reason we end our analysis in the late 1990s (and do not extend the analysis to the 2000s) is due to constraints with the data. We use the detailed industry-level data available from the Central Statistical Organisation’s Annual Survey of Industries for the econometric analysis in the next section. For assessing the impact of trade policy on productivity, the use of disaggregated industry data at the ISIC 4 digit (corresponding to the NIC 3 digit codes available in the ASI) is essential for meaningful analysis, since trade policy in India differed widely across ISIC 3 digit categories (see Chand and Sen 2002). This data is available from 1973/74 to 1997/98 for comparable industry classifications, with the Central Statistical Organisation radically changing the industry classification from 1998. Thus, the industries in the new NIC 3 digit classification of the post-1998 data is virtually impossible to match with the industries at the NIC 3 digit level in the pre-1998 data.
6
The Contribution of Manufacturing to India’s Economic Growth
In the 1980s and 1990s, the Indian economy grew at a rate of 5.8 per cent per annum, considerably
higher than the rate of economic growth that was witnessed in the previous decades.4 It is also clear
that much of the higher economic growth of the 1980s was primarily due to the manufacturing sector,
which was the fastest growing sector in the 1980s (Table 1). The high growth of the manufacturing
sector was predominantly due to the registered manufacturing sector. In contrast, the unregistered
manufacturing’s share in total output remained more or less constant during the 1980s and 1990s.
Beginning in the mid-1980s, trade, hotels and restaurants along with financial services (TRFIN) also
became an important source of growth, and in the late 1990s, the infrastructural sector also grew
rapidly.
Employment and Wages
The behaviour of overall manufacturing employment is shown in Figure 9. After a period of increase
in the second half of the 1970s, there was stagnation in employment levels in the first half of the
1980s. From the second half of the 1980s, there has been steady increase in employment, with the
level of employment in 1999 standing at 9.1 million (as compared to 5.8 million in 1975).
Employment growth has been particularly strong in 1991-1995, at an annual average rate of growth of
4.2 per cent (Table 1).
Aggregate real wages have increased steadily since the early 1980s, with a 66 per cent increase in the
period 1975-1999 (Figure 10). However, the strongest growth in real wages has occurred in the second
half of the 1970s and the first half of the 1980s, when the annual rates of growth of real wages were
3.5 and 3.7 per cent respectively (Table 1).
After a period of stagnation in the 1970s, labour productivity has increased at a rapid rate since the
early 1980s (Figure 11). Labour productivity growth was the strongest in the period 1986-1995,
increasing at an annual rate of 7 per cent in this period (Table 1). The rapid increase in labour
productivity which has out-paced real wage growth has meant that unit labour costs has fallen steadily
in Indian manufacturing since the early 1980s (Figure 12). This has meant that the Indian
manufacturing sector has significantly increased its international competitiveness in the 1980s and
1990s, with both India’s manufacturing exports as a share of world manufacturing exports and India’s
manufacturing trade ratio (the ratio of manufacturing exports to manufacturing imports) showing
steady increases since the mid 1980s (Ganesh-Kumar, Sen and Vaidya 2003).
4 The rate of GDP growth for the period 1955-1979 was 3.6 per cent per annum.
7
Examining the distribution of employment across industries in the Indian manufacturing sector and the
changes in this distribution over time, we find that the relative ranking of industries in the share of
employment has stayed stable over time (Table 3.2). The two leading industries in terms of number of
workers employed are ISIC 311 – Food Manufacturing -and ISIC 321 – Textiles – over the period
1975-1999. These two industries comprised 32.3 per cent of total employment in 1996-1999.
Transport equipment (ISIC 384) moved to third place in 1996-1999, employing 10.4 per cent of the
manufacturing workforce in this period. Perhaps the most noteworthy finding is that the share of
industries which are conventionally defined as labour intensive – textiles, clothing and footwear (TCF)
– has fallen from 26.3 per cent in 1976-1980 to 21.1 per cent in 1996-1999. Therefore, the pattern of
employment in Indian manufacturing has been such that more workers are employed in the capital
intensive industries over time.
Though employment growth has been positive since the mid 1980s, the disaggregated growth rates
suggest that several industries have seen job losses, especially in 1996-1999. The fastest growing
industry in terms of employment has been ISIC 322 – Wearing Apparel – which has witnessed an
annual growth rate of 19.6 per cent in 1991-1995 alone. Other industries which have seen strong
employment growth, at least for part of the period under study, are ISIC 353 – Petroleum Refineries,
ISIC 356 – Plastic Products, and ISIC 372 – Non Ferrous Metals. Interestingly, textiles (ISIC 321– the
largest industry in terms of employment – has seen job contraction over the period 1975-1999.
Output
Real value added has increased at a rapid rate since the early 1980s, with annual growth rates of over 9
per cent for the period 1985-1995 (Table ?). Similar to what we have observed for employment, the
share of TCF industries in total production has decreased from 20.5 per cent in 1976-1980 to 11.0 per
cent in 1996-1999 (Table ?). However, the decline in share of output for the TCF industries has been
more rapid than the decline in the share of employment, suggesting that labour productivity levels
have been also been declining in TCF industries relative to non-TCF industries. The industry with the
highest share in output in 1976-80 – Textiles at 18.6 per cent – saw a decline in its relative importance
over the period. Its share in output in 1996-1999 was a mere 8.1 per cent. Industrial Chemicals (ISIC
351) and Electrical Machinery (ISIC 383) witnessed a significant increase in their shares in total
output in the period 1975-1999. The share of Industrial Chemicals increased from 7.7 per cent in
1976-1980 to 11.9 per cent in 1996-1999, while the share of Electrical Machinery increased from 7.4
per cent in 1976-1980 to 18.8 per cent in 1996-1999.
To summarise, it is clear that after a period of stagnation in labour productivity in the 1970s, there has
been strong growth in labour productivity and real value added since the early 1980s. After a period of
rationalisation when employment fell in the first half of the 1980s, there has been growth in
8
employment, especially in the first half of the 1990s. Real wages have also increased in this period,
though lagging behind labour productivity growth.
With respect to the structure of production and employment, there has been a gradual contraction of
the textile, clothing and footwear industries, which are the more labour intensive industries in the
manufacturing sector. The shift away from the key labour-intensive industries in the period of the
study is a disquieting feature of structural change in the Indian manufacturing from an employment
point of view. At the same time, the strong growth in labour productivity is one of the positive features
of manufacturing performance in the same period.
4. TRENDS AND PATTERNS IN TRADE AND FDI INFLOWS IN INDIA
Trends and Patterns in Trade Flows
The Indian economy has been increasingly open over the 1980s and 1990s. As is well-known, India
has been a major exporter of information technology services in recent years. This is reflected in the
larger increase in the ratio of exports plus imports of both goods and services to GDP as compared to
ratio of exports plus imports of only goods to GDP (Figure 13). However, both indicators have shown
a steady increase since the late 1980s, and the ratio of exports plus imports of goods to GDP stood at
around 25 per cent in 2003.
Manufacturing goods have comprised an increasing share of total exports and imports for the Indian
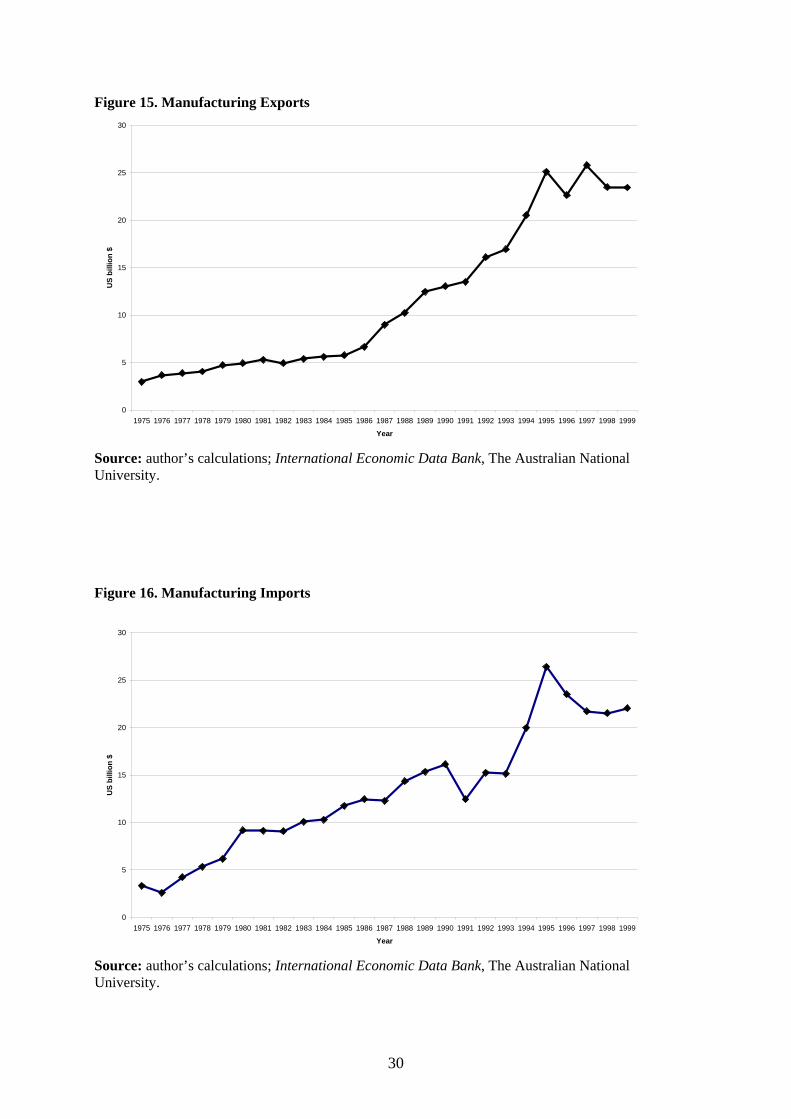
economy (Figure 14). This is particularly evident in the case of manufacturing exports which now
comprise around 75 per cent of all of India’s merchandise exports. There has been a significant
increase in manufacturing exports over the period 1975-1999. In 1975, manufacturing exports was 3.0
US billion dollars. In 1999, manufacturing exports had reached 23.5 US billion dollars. Much of the
increase occurred from the mid 1980 onwards (Figure 15). However, there seems to be a stagnation in
manufacturing exports in the period 1996-1999. Manufacturing imports also show a steady increase –
however, the increase in the case of manufacturing imports occurs from the mid 1970s as compared to
manufacturing exports, which show an increase only in the 1980s (Figure 16). Corresponding to the
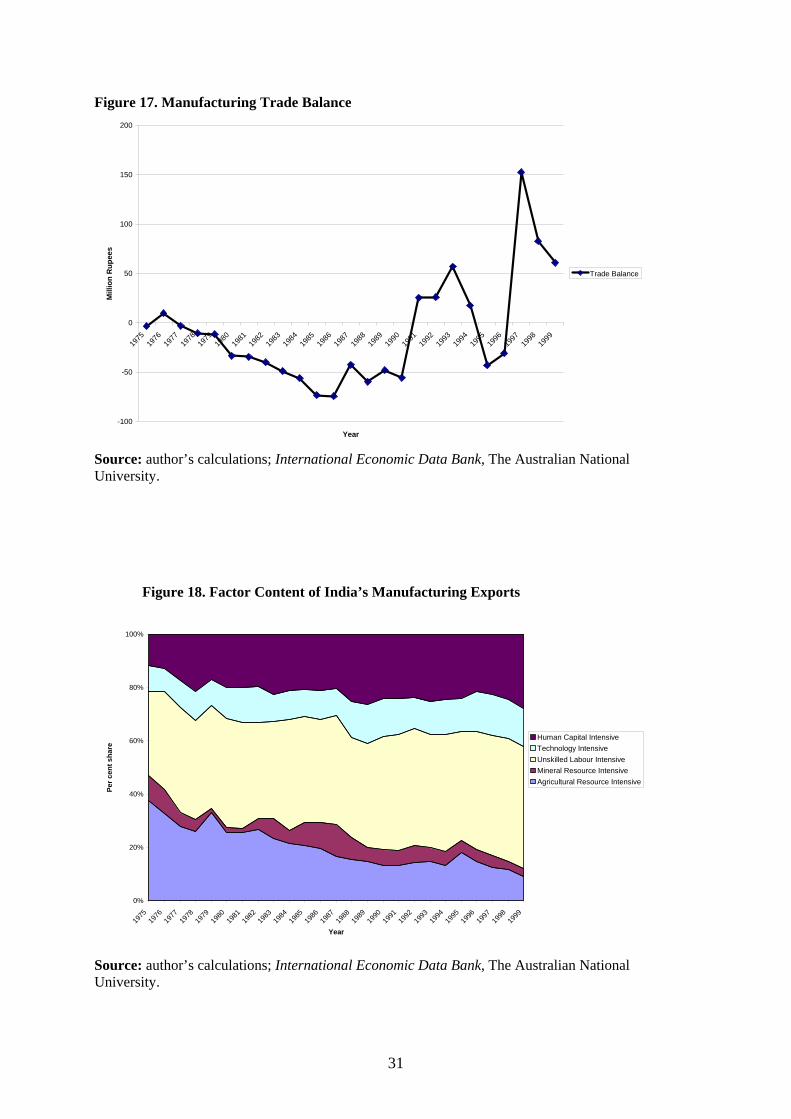
strong performance of manufacturing exports in the 1990s, the manufacturing trade balance shows an
increase in the 1990s, after persistent deficits in the 1980s (Figure 17). Along with the increase in the
importance of manufacturing goods in merchandise exports, this indicates the increasing importance
of manufacturing both in India’s economic activities and in the country’s relationship with the rest of
the world.
To examine changes in the composition of manufacturing exports and imports, we classify exports and
imports by factor content, distinguishing between natural resource intensive, labour intensive,
9
technology intensive and human capital intensive industries.5 The natural resource intensive
industries are further sub-divided into agricultural and mineral-based industries. Unskilled labour-
intensive industries are those with the lowest value added per worker. The remaining industries are
divided into technology intensive and human capital intensive, with the industries with a high ratio of
R&D to value added being classified as technology intensive.
We find that unskilled labour intensive commodities are the most important in India’s manufacturing
exports, comprising 45 per cent of total manufacturing exports in 1996-1999 (Figure 18). However,
while the share of unskilled labour intensive commodities in total manufacturing exports has increased
over the period 1975-1999, the increase has not been substantial, from 37 per cent in 1975-80. India’s
human capital intensive and technology intensive exports has also increased as a share of total
manufacturing exports over the period 1975-1999 from 10 and 17 per cent in 1975-1980 to 15 and 24
per cent in 1996-1999 respectively. On the other hand, India’s agricultural intensive exports as a share
of total manufacturing exports has fallen quite dramatically from 31 per cent in 1975-1980 to 12 per
cent in 1996-1999.
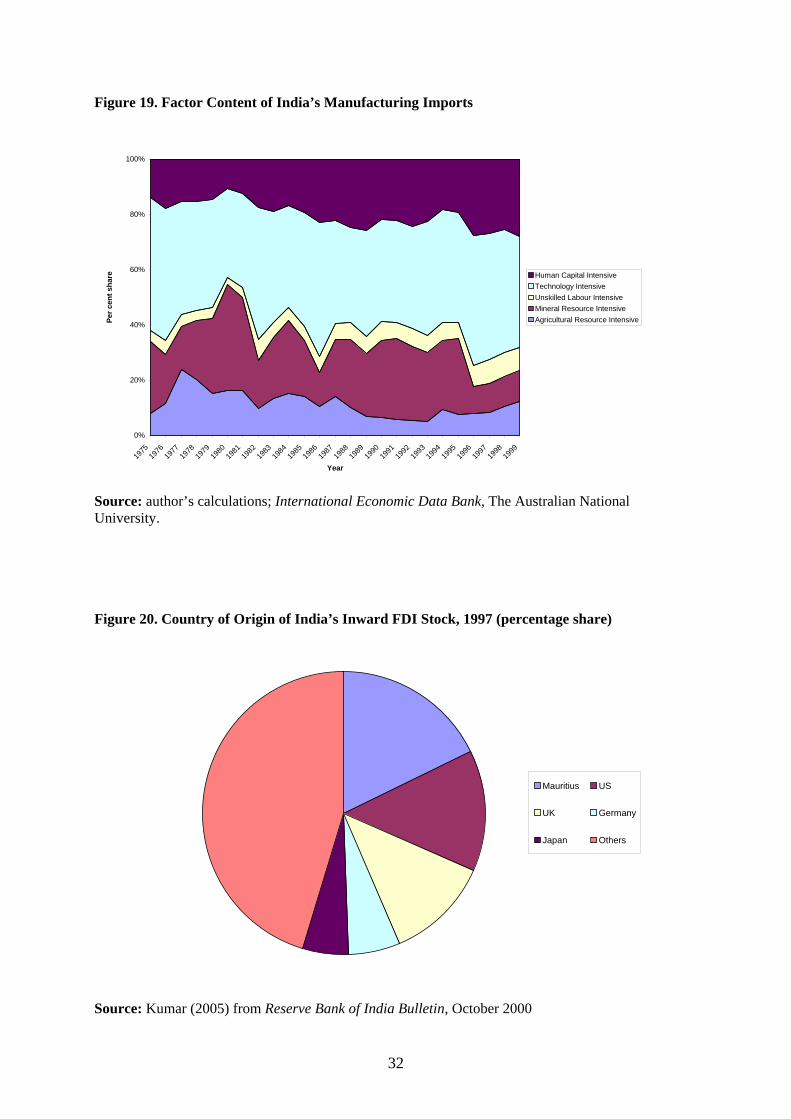
With respect to imports, technology intensive exports remain the dominant set of commodities in
India’s manufacturing import basket, followed by human capital intensive goods (Figure 19). There
has been a slight increase in the share of human capital intensive goods in India’s manufacturing
imports, with no significant change in the share of technology-intensive imports in total manufacturing
imports in spite of the trade liberalisations of the 1980s and 1990s which were mostly biased towards
import liberalisation of capital and intermediate goods.
Trends and Patterns in FDI Inflows There has been a significant increase in FDI inflows to India over the period 1990-2006. In 1990-
2000, the average inflow of FDI to India was US$ 1705 million (Table ?). This had increased to US$
16881 million in 2006. Inward FDI inflow to India as a percentage of gross fixed capital formation
(GFCF) increased from an average of 1.9 per in 1990-2000 to 8.7 in 2006. Since year on year FDI
flows are notoriously volatile, it is more appropriate to look at the behaviour of inward FDI stock to
discern long-term trends. The stock of inward FDI stock in India also shows a strong increase from
US$ 452 million in 1980 to US$ 50680 million in 2006. As a ratio of GDP, the FDI stock increased
from 0.5 per cent to 5.7 per cent in the same period. However, the increase in FDI in during this period
was not significantly higher than that for the South Asian region – in 1980, inward FDI stock as a
percentage of GDP was 1.2, with the corresponding figure in 2006 being 6.5. More importantly, FDI
inflows to India was about one-fourth times the corresponding amount (US$ 69468 million) for China
5 We apply the Krause’s (1982) classification of ISIC manufacturing industries according to their dominant factor input.
10
in 2006. Inward FDI stock as a percentage of GDP in China’case was 11.1 percent in 2006, close to
double to that for India.6 This suggests that notwithstanding the increase in FDI inflows to India since
the opening up of the economy in 1991, the magnitude of FDI flows to India are still modest in
comparison with China.
A large part of the increase in FDI has been due to mergers and acquisitions of foreign companies of
existing Indian firms rather than in form of new entry in the form of greenfield investments, with
nearly 40 per cent of total FDI inflow comprising mergers and acquisitions in the period 1997-1999
(Kumar 2005). Examining the sectoral distribution of FDI stock, around 85 per cent was in the
manufacturing sector in 1980 and 1990(Table 7). However, by 1997, this proportion had declined to
48 per cent, with an increase in FDI stock in services and in the infrastructural sectors (labelled
‘Others’ in Table 7), which together comprised around 50 per cent of total FDI stock in 1997.In the
manufacturing sector, most of the FDI inflow went to transport equipment, machinery and machine
tools, electrical goods and machinery and chemicals and allied products. Around 20 per cent of total
FDI stock in manufacturing was in food and beverages and textile products in 1997. Thus, most FDI
inflows to the manufacturing sector were to the capital-intensive sectors, with a small amount being
received by the labour-intensive sectors.
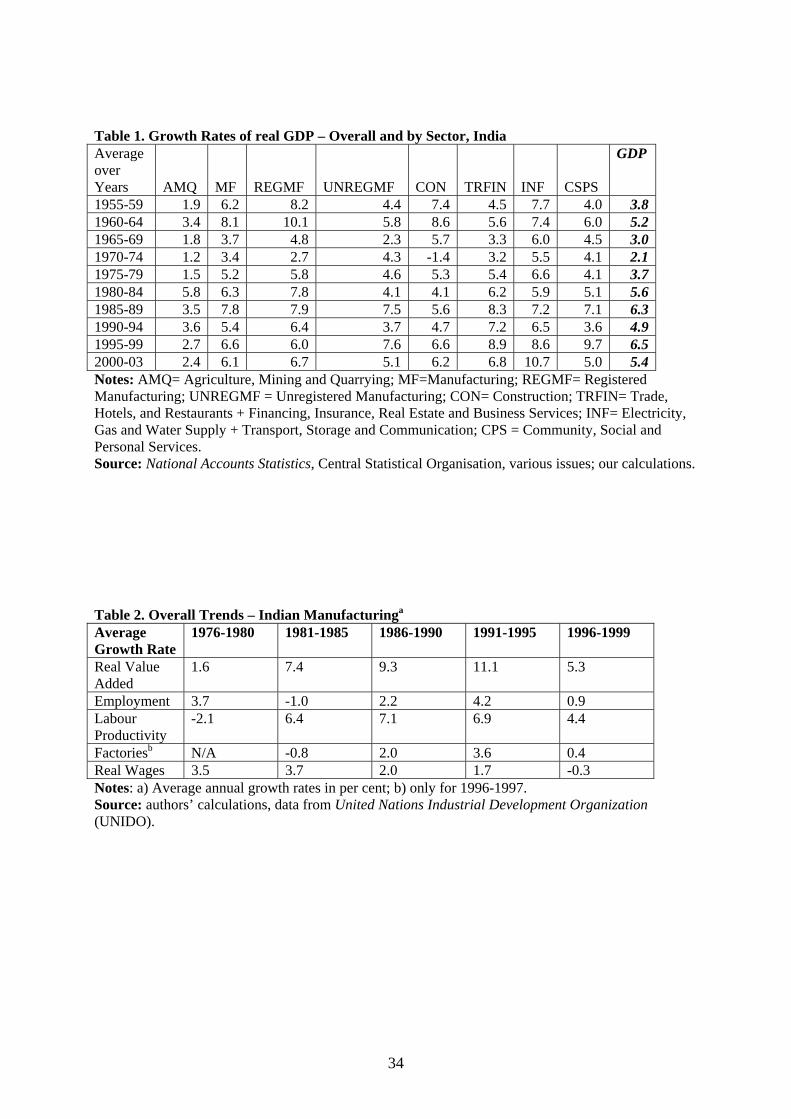
The five major source countries of FDI flows to India are Mauritius, USA, UK, Germany and Japan in
order of magnitude of the flows (Figure 20). However, it is believed that the emergence of Mauritius
as a major source of FDI for India can be explained by the Double Taxation Agreement signed
between the two countries during the 1990s that enabled foreign investors to minimise their tax
liabilities due to Mauritius’s tax haven status (Kumar 2005). Therefore, a large proportion of the FDI
inflows from Mauritius are essentially investments from other countries routed through Mauritius to
take advantage of the tax treaty.
While accurate information on the distribution of FDI stocks across states in India is not available, it is
possible to make a conjecture on the geographic spread of FDI flows based on data on FDI approvals
by state for 2001 (Figure 21). Not surprisingly, the five industrialised states of Delhi, Karnataka,
Gujarat, Maharashtra, and Tamil Nadu are the largest recipients of FDI inflows in India. In 1997, the
6 It should be noted that there are two problems in comparing data on FDI inflows to China and India. Firstly, Indian figures of inflows do not follow the IMF Balance of Payments Manual definition that is followed internationally. Indian figures count only the fresh inflows of equity and do not take into account the re-invested earnings of foreign affiliates in the country nor the intra-company loans provided by the parent company, while Chinese authorities adopt the IMF definition in computing FDI flows (Kumar 2005). Secondly, it is well recognised that a large share of FDI inflow in China represents ‘round—tripping’ – recycling of domestic saving via Hong Kong to take advantage of tax, tariffs and other benefits offered to non-resident Chinese, which are estimated to be in the range of 40-50 per cent of total FDI (Nagaraj 2003). Kumar (2005) estimates that with these adjustments, India’s FDI stock to GDP ratio is 1.7 as compared to China’s 2.0 per cent, when the original figures were 0.5 per cent in the case of India and 3.6 per cent in the case of China.
11
four states of Karnataka, Gujarat, Maharashtra, and Tamil Nadu contributed 54 per cent of total
industrial value added among the fifteen major states in the country.
5. THE EFFECTS OF TRADE ON PRODUCTIVITY AND EMPLOYMENT IN INDIA
In this section, we examine the impact of trade policy changes on total factor productivity in Indian
industry, along with an assessment of the contribution of international trade to manufacturing
employment growth in the period under consideration.
Productivity
We begin with period averages of total productivity growth by the major industrial groups and in the
aggregate in Table 7. We find that total factor productivity growth for the capital and intermediate
goods sectors were the highest in 1985-1990 and for the consumer goods sector, in 1973-1978. The
slight slowdown in aggregate total productivity growth in the 1990s has also been observed by other
authors – notably, Balakrishnan et al. (2002) and Das (2004).7
We examine the effects of trade policy on total factor productivity by estimating an augmented
production function of the form:
Ln Yit = a1 Lit + a2 Kit – a3 TPit + eit (1)
Where Y is real value added8 for industry I at time t, L and K are the labour and capital inputs for
industry I at time t, TP is the measure of trade policy for industry I at time t, and eit is the error term.
We use the two measures of trade policy discussed earlier – effective rates of protection (ERP) and
import coverage ratios (ICR). We have annual data for a panel of 60 industries over the period
1973/94-1997/98 (more details of the data are provided in the Appendix). The industries are at the
ISIC 4 digit level, which as we have argued in the introduction, is at the level of disaggregation where
we can be confident that we can correctly identify the true effect of trade policy on industrial
performance in India. We use the within-industry estimator that allows us to control for intrinsic
differences across industries with respect to the rate of technological progress. The results are
presented in Table 8.
7 It should be noted, however, that Milner et al. (2007) find an increase in total factor productivity growth in the 1990s as compared to the 1980s. 8 We use the double deflation method to calculate real value added as is the standard practice in most estimates of total factor productivity in India (Balakrishnan and Pushpangadan 1994).
12
We estimate equation (1) by first including the import coverage ratio as the measure of trade policy.
Col. (2) includes the effective rate of protection. The assumption of constant returns to scale is not
rejected in any of the augmented models, though the point estimates suggest increasing returns to
scale. Most of the coefficients have signs and significance that are in accord with the theoretical
priors. The estimate in Col. (1) suggests that an increase in quantitative restrictions as captured by an
increase in the ICR has a strong negative effect of total factor productivity (TFP). The coefficient on
ERP is positive, when we would expect a negative relationship between ERP and TFP. However, the
coefficient is not significant at conventional levels of significance. We also find that in all three
estimates, the fixed effects are significant (probability that u_i=0). In Cols (3) and (4), we impose the
statistically acceptable restriction of constant returns to scale on the parameters of K and L and
estimate equation (1) where a direct measure of TFP growth using the Tornquist index formula is used
as the dependent variable, with ICR and ERP included in turn. We do this to control for the
endogeneity of K and L arising out of their possible correlation with demand shocks included in the
error term. We find that in both estimates, there is no difference to our qualitative results with the
coefficients on the variables of interest retaining their correct signs and statistical significance. The
results indicate that trade reforms have led to a significant increase in total factor productivity in India.
Employment To assess the impact of trade on manufacturing employment, we compute the employment coefficients
of manufacturing exports and import-competing production. This is presented in Figure 22. We see
that the employment coefficients of exports and imports have consistently fallen over the period.
Moreover, the difference between the employment coefficient of exports and that of imports has
narrowed over time. The findings suggest that a unit increase in manufacturing exports matched by an
identical increase in manufacturing imports will lead a smaller positive effect on employment in
1996-1999 as compared to 1975-1980.
While the above suggest that the employment intensity of a unit increase in net exports has been
declining over time, it is possible that the increase in the manufacturing trade balance in the 1990s
may have led to an overall increase in employment in the manufacturing sector. The net effect of
international trade on manufacturing employment can be established by using a growth accounting
methodology which divides employment changes over a period of time into that attributable to
changes in domestic demand, exports, import penetration and productivity.9
9 One problem with the data that we encounter when implementing the growth accounting methodology to India is the large growth in exports and imports that has occurred in the same industry – which is jewellery and related industries (ISIC Code 3901). This is because Indian jewellery industry imports raw gems to be processed into jewellery for exports. Including this industry will overstate the effect of trade on employment since the growth accounting methodology treats all imports as necessarily substituting for domestic production in the same industry. Including Industry 3901 will give the inaccurate result that the increase in imports that occurred in this
13
Table 9 presents the results of the growth accounting methodology as applied to Indian manufacturing
data. Employment has increased in the period 1985-1999, following a decline in 1980-1985. Much of
this increase in employment has been driven by increases in domestic demand. Increases in labour
productivity all through the 1980s and 1990s have led to labour shedding for the entire 1980s and
1990s. The contribution of exports to employment growth has been greater in the period 1985-1995,
than in the preceding and ensuing periods. Import penetration has led to few jobs being lost for much
of the period under consideration. The overall finding is that international trade seems to have played
a minor role in employment changes in Indian manufacturing, especially in the late 1990s.
6. THE EFFECTS OF FDI ON INDIAN INDUSTRY
For many developing countries which have been late-comers to industrialisation, foreign direct
investment has played a crucial role in the industrial development of these countries by bringing in
technology, market know-how and modern management practices’ (Athukorala and Rajapatiratna
2002) to domestic firms in these countries. FDI has been a key factor behind the successful
transformation of many countries in East and South Asia from costly and technologically backward
import substitution to a more dynamic export oriented industrialisation. We have already noted that
after a severely restrictive policy regime with respect to FDI, Indian policy-makers have eased these
restrictions in a significant way since 1991. This has resulted in large inflows of FDI to the Indian
economy since the early 1990s, and an increase in the contribution of FDI to capital formation and
output especially since 2000. In this section, we summarise the available evidence on the effects of
FDI on market structure, export orientation, productivity and technology spill-overs in Indian industry
since the 1991 reforms. We also conduct new statistical analysis of our own using a recently compiled
data-set of firms operating in India to examine whether there are differences between foreign firms
and domestic firms with respect to export orientation, technological prowess and productivity. The
data-set we use is a survey of around 2000 firms in India conducted by the Confederation of Indian
Industry (CII) and the World Bank in 2002 as a part of the World Bank’s Investment Climate Survey.
The advantage of the data-set in comparision with others that are available in the public domain (e.g.
the Reserve Bank of India’s surveys of the finances of medium and large public limited companies and
the PROWESS data-set of the Centre for Monitoring the Indian Economy) is that the survey contains
data on employment, which allows calculations of labour and total factor productivity. However, a
limitation of the survey is that except for output and input variables, most observations are for the year
2002, which does not allow us to assess the changes in the characteristics of foreign firms relative to
industry has led to a large employment decline in the industry, which is not the case. Thus, we exclude industry 390 from our calculations.
14
domestic firms over time. We define a foreign firm as a firm where foreign ownership constitutes 25
per cent or more of total ownership. More information on the CII data-set is provided in the Data
Appendix.
Market Share What have been the long-run trends in the relative importance of foreign firms in Indian industry?
Athreye and Kapur (2001) find a decline in the market share of foreign firms in the 1990s as compared
to the 1980s. They estimate that foreign firms accounted for 26 per cent of total sales in manufacturing
in 1990-91, down from 31 per cent in 1980-81. However, more recent estimates of the share of foreign
firms in total value added and total sales over the 1990s finds that there has been an increase in the
former from 9.5 per cent in 1990 to 12.6 per cent in 2001 and in the latter from 11.3 per cent in 1990
to 13.8 per cent in 2001 (Kumar 2005).10 Clearly, the liberalisation of the FDI regime has led to a
higher market share of foreign firms in Indian industry over the 1990s.
Whether the increasing presence of foreign firms in Indian industry has led to increased competition in
domestic markets and lower prices for consumers is difficult to establish, in the absence of reliable
statistical evidence. India’s large domestic market has been the attraction for many new foreign
entrants into Indian industry. Examples of sectors where there have been significant new entry are
beverages, automobiles, washing machines, refrigerators and washing machines. In these sectors, there
have been examples of both price and non price competition; at the same time, there also have been
examples of possible increases in market structure concentration in other sectors, as for example, when
Coca Cola acquired the dominant domestic aerated drink producer, Parle Industries (maker of the
leading domestic brand – Thums Up), when Hindustan Lever Indian subsidiary of Unilever –acquired
its largest domestic rival and the second largest firm in the industry – TOMCO, along with the largest
cosmetics firm, Lakme (Nagaraj 2003). Athreye and Kapur (2001) also find that there is a positive
correlation between industrial concentration (as measured by the Herfindahl index) and the presence
of foreign firms across industrial sectors in India using firm-level data for India for 1994. Clearly,
more recent studies are needed to evaluate the effects of FDI on market structure, and on price and
non-price competition in India since the 1991 reforms.
Industrial Location
From the CII data-set, we find that there are significant differences between foreign and domestic
firms as to the industry of location (Table 10). Foreign firms are located mostly in drugs and
pharmaceuticals, electrical white goods, auto components and food processing. These are mostly
capital intensive sectors. Only 8.6 per cent of foreign firms are in garments, textiles and leather
10 Kumar (2005) does not state how a foreign firm is defined in his calculations, so it is difficult to compare Kumar’s estimates with those of Athreye-Kapur. The latter two authors use the Reserve Bank of India definition of a foreign firm – that 25 per cent or more of the firm’s equity is held by a single foreign investor.
15
products. In contrast, 31 per cent of domestic firms are in these three industries. Our findings reinforce
the point made earlier that FDI inflows to Indian manufacturing have mostly been to capital-intensive
sectors.
Export Orientation Earlier studies that have examined the export performance of foreign firms relative to domestic firms
in the pre-reform period have found no statistically different performance in export performance
(Kumar and Siddharthan 1994). More recent studies that look at the post-reform period find that
Indian affiliates of multinational corporations perform better than their domestic counterparts in export
orientation (Agarwal 2001, Kumar and Pradhan 2003).
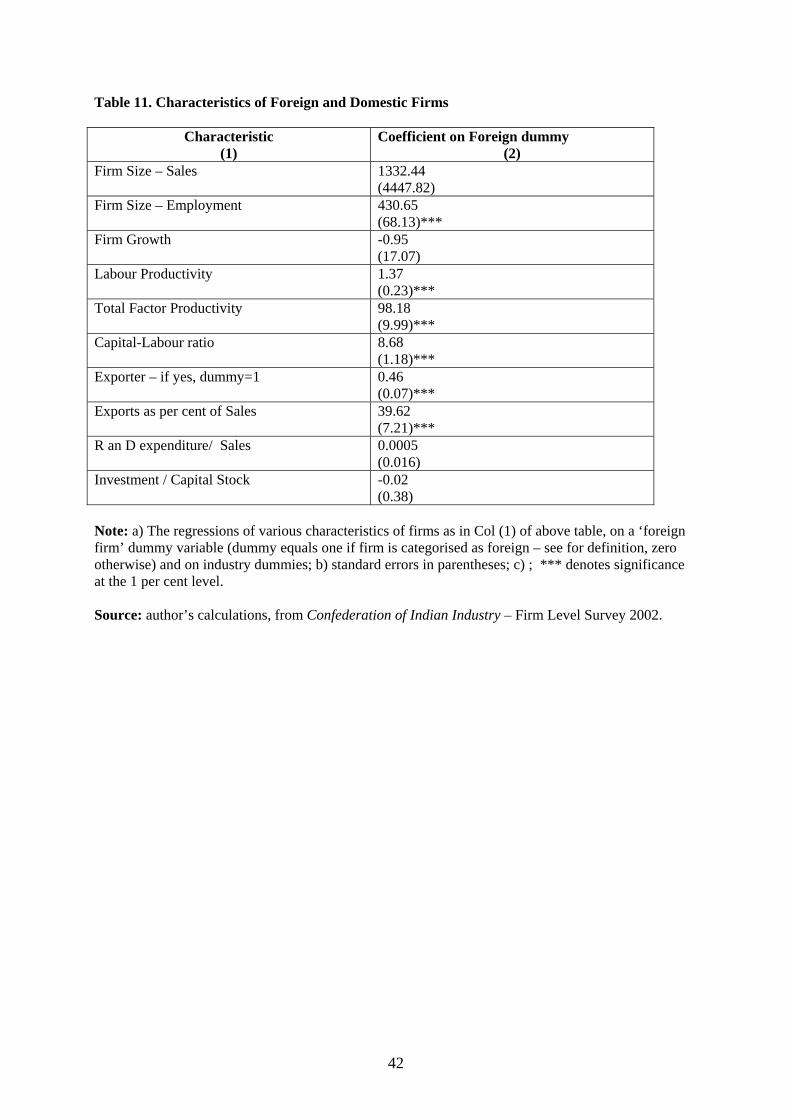
We examine whether foreign firms are more likely to be exporters than domestic firms. We find that
this is the case with the foreign firm dummy significant at the one per cent level when we regress the
exporter status dummy on the latter variable along with industry (Table 11) dummies, which control
for differences in exporting propensities across industries. We obtain a similar result when substituting
the export to sales ratio for the exporter status dummy.
Productivity It is generally believed that foreign firms are more productive than domestic firms, as they have
advantages in recruiting more able managers and skilled workers, given the salaries and wages they
pay. Afflilates of multinational corporations also have access to better technology from abroad
obtained from their parent company. In the Indian case, this certainly seems to be true – the
coefficients on the foreign firm variable is positive and statistically significant when we run
regressions of labour productivity and total factor productivity on this variable along with the industry
controls. Foreign firms are significantly more capital intensive than domestic firms, as evident by the
positive and significant coefficient on the foreign firm dummy, in regressions with the capital to
labour ratio as the LHS variable. However, we find that we do not obtain similar findings for other
indicators of firm performance, such as firm growth (defined as the percentage change in sales) and
the investment to capital ratio (Table 11). It is also not clear whether the higher productivity observed
in foreign firms is due to their larger size and therefore, their ability to reap economies of scale. A
regression of firm size as captured by total sales does not yield a positive and significant coefficient on
the foreign firm dummy once we control for industry differences, though it does when we use capture
firm size by total employment instead (Table 11).
16
Technology Spillovers and R and D intensity An important reason for attracting FDI to the manufacturing sector is that the presence of foreign firms
can have significant positive knowledge spillovers to domestic firms, and by doing so, increase
average productivity in the industrial sector. In the Indian case, using firm-level panel data from 1975
to 1988, Kathuria (2001) finds that there are positive spillovers to domestic firms by the presence of
foreign firms, but that the nature and type of spillovers depended on the industries to which domestic
firms belonged, with firms in more technology-intensive sectors more likely to benefit. Using more
recent data – from 1989 to 1996 – Kathuria (2002) finds that ‘scientific’ domestic firms benefited from
the presence of FDI, irrespective of which industry the domestic firm was located in, but that ‘non-
scientific’ domestic firms did not.
In the CII sample of firms, we do not find R and D intensity to be higher for foreign firms, controlling
for industry differences (Table 11). Kumar (2005) also finds that, while the gap between R and D
intensity of foreign and domestic firms to be positive in the early 1990s, this gap has reduced over
time. In summary, the evidence seems to be that there are no substantial knowledge spillovers from
foreign to domestic firms in the post-reform period, in part because foreign firms have not invested in
R and D more highly than domestic firms in this period.
7. CONCLUSIONS
The impact of international trade and foreign direct investment on a country’s economic development
has remained issues of considerable interest and controversy both in the academic literature and in
policy circles. In this paper, we examine the effects that trade and FDI may have had on India’s
industrial transformation, particularly since the onset of economic reforms in the 1980s and early
1990s. Examining the evolution of the Indian manufacturing sector since the mid 1970s, we find that
after a period of stagnation in the 1970s, Indian manufacturing showed consistent growth in all
indicators from the early 1980s to the mid 1990s. There has been strong growth in labour productivity
and real value added since the early 1980s. Employment too increased substantially, especially since
the mid 1980s. Real wages also has increased in this period, and unit labour costs fell as labour
productivity growth overtook real wage growth. Perhaps as a consequence, manufacturing exports also
increased in the same period, along with an increase in the manufacturing trade balance. However, an
apparent weakness in the pattern of growth has been the relative decline of the labour-intensive textile,
clothing and footwear industries since the mid 1970s. With respect to manufacturing exports, though
labour-intensive commodities comprise the bulk of the latter, there has been a relatively small increase
in the share of these commodities in total manufacturing exports, with human capital intensive exports
showing more dynamism.
17
Our empirical analysis shows that trade reforms in India have had a strong positive impact on total
factor productivity, and may have been an important contributing factor behind the strong growth of
the manufacturing sector witnessed since the 1980s. However, the impact of trade in the net creation
of jobs in the manufacturing sector has been relatively small in the 1980s and 1990s. Thus, the
evidence suggests that the Indian manufacturing sector’s increasing engagement with the world
economy has not led to a significant re-orientation from the capital intensive nature of production that
had been witnessed in the pre-reform period.
With respect to foreign direct investment, there has been a strong growth in inward FDI since the early
1990s from a relatively low base. However, India’s inward FDI flows and stocks are still below
China’s when scaled by gross investment and GDP respectively. The flow of FDI in the recent period
seems more to infrastructure than to manufacturing, and within manufacturing, to the capital-intensive
sectors. There also seems to be a geographic concentration of FDI flows, with a large share of inward
FDI going to only four Indian states. We do not have reliable econometric evidence of the effects of
FDI on different aspects of industrial performance. However, our preliminary statistical analysis along
with the findings obtained by other researchers suggest that foreign firms in India in the post-reform
period are more productive and exhibit greater export orientation than domestic firms. However,
foreign firms do not show stronger growth than domestic firms, nor higher investment rates or R and
D intensity. It is also not clear whether the increasing presence of foreign firms, along with the easing
of restrictions on technology acquisition, has led to widespread knowledge spillovers to domestic
firms in the post-reform period.
The overall finding of the paper is that both trade flows, and to a lesser extent, inward FDI flows, may
have had a significant positive impact on efficiency in Indian manufacturing, following the reforms of
the 1980s and 1990s. Therefore, the economic reforms may had the desired positive effect on Indian
manufacturing performance, enabling the manufacturing sector to break out of the stagnation
witnessed in the pre-reform period. At the same time, trade and FDI flows have not had led to a
significant change in the pattern of industrial growth towards labour-intensive commodities in which
India had a comparative advantage, given its favourable labour-land ratio. Thus, from the viewpoint of
equity, India’s post-reform manufacturing performance has been disappointing. While the reasons for
such an outcome is outside the scope of this paper, it is possible to argue that policy distortions that
still remain in the Indian economy such as restrictive labour laws and reservation policies towards the
small sector (weakened but still in place) may have led to strong impediments in the growth of labour-
intensive activities and created disincentives for foreign companies to enter the labour intensive
segment of the manufacturing sector.11
11 For an expansion of this argument, see Sen (2008).
18
References
Agarwal, P., Gokarn, S., Mishra, V., Parikh, K.S. and Sen, K. (1995) Economic Restructuring in East Asia and India: Perspectives on Policy Reform, Basingstoke: Macmillan. Agarwal, A. (2001), “Liberalisation, Multinational Enterprises and Export Performance: Evidence from Indian Manufacturing”, ICRIER Working Paper No. 69, New Delhi. Ahluwalia, I.J. (1991) Industrial Growth in India, New Delhi: Oxford University Press. Ahluwalia, I.J. (1999) ‘India’s Economic Reforms: An Appraisal’ in J.D. Sachs, A. Varshney and N. Bajpai (eds.) India in the Era of Economic Reforms, New Delhi: Oxford University Press.
Akyut, D. and A. Goldstein (2006), “Developing Country Multinationals: South-South Investment Comes of Age”, OECD Development Centre Working Paper No. 257. Athreye, S. and S. Kapur (2001), “Private Foreign Investment in India: Pain or Panacea?”, The World Economy, pp. 399-424. Athukorala, P. and S. Rajapatirana (2002), Liberalisation and Industrial Transformation: Sri Lank in International Perspective, Delhi: Oxford University Press. Balakrishnan, P. and K. Pushpangadan (1994), “Total Factor Productivity Growth in Indian Manufacturing: A New Look”, Economic and Political Weekly, Vol. 9 (31), pp. 2028-2035. Balakrishnan, P., Pushpagadan, K. and Suresh Babu, M. (2002) ‘Trade Liberalisation, Market Power and Scale Efficiency in Indian Industry’, Centre for Development Studies, Working Paper No. 336. Bhagwati, J.N. (1993), India in Transition: Freeing the Economy, Clarendon Press, Oxford. Bhagwati, J. and Desai, P. (1970) India: Planning for Industrialization, London: Oxford University Press. Bhagwati. J. and Srinivasan, T.N. (1975) Foreign Trade Regimes and Economic Development: India, New York: Columbia University Press. Chand, S. and Sen, K. (2002) ‘Trade Liberalisation and Productivity Growth: Evidence from Indian Manufacturing’, Review of Development Economics, 6(1):120–132. Das, D.K. (2003) Quantifying Trade Barriers: Has Protection Declined Substantially in Indian Manufacturing, ICRIER, Working Paper No. 105. Ganesh Kumar, A., Sen, K. and Vaidya, R.R. (2003) International Competitiveness, Investment and Finance: A Case-Study of India, London: Routledge UK. Goldar, B. and Rengananthan, V.S. (1990) ‘Liberalisation of Capital Goods Imports in India’, Working Paper No. 8, National Institute of Public Finance and Policy, New Delhi.
Joshi, V. and Little, I.M.D. (1997) ‘India: Reform on Hold’, Asian Development Review, 15(2):1–42. Kathuria, V. (2001), “Foreign firms, technology transfer and knowledge spillovers to Indian manufacturing firms: a stochastic frontier analysis”, Applied Economics, Vol. 33, pp. 625-642.
19
Kathuria, V. (2002), “Liberalisation, FDI and Productivity Spillovers: An Analysis of Indian Manufacturing Firms”, Oxford Economic Papers, Vol. 54, pp. 688-718. Krause, L.B. (1982) U.S. Economic Policy Towards the Association of Southeast Asian Nations: Meeting the Japanese Challenge, Washington DC: The Brookings Institution. Kumar, N. (2005), “Liberalisation, Foreign Direct Investment Flows and Development: Indian Experience in the 1990s”, Economic and Political Weekly, April 2, pp. 1459-1469. Kumar, N. (2007), India’s Emerging Multinationals, London: Routledge. Kumar, N. and N.S. Siddharthan (1994), “Technology, Firm Size and Export Behaviour in Developing Countries: The Case of Indian Enterprises”, Journal of Development Studies, Vol. 31(2), pp. 289-309. Kumar, N. and J.P. Pradhan (2003), “Export Competitiveness in Knowledge-based Industries: A Firm-level Analysis of Indian Manufacturing”, RIS Discussion Paper ~43/2003, New Delhi. Milner, C., Vencappa, D. and Wright, P. (2007) ‘Trade Policy and Productivity Growth in Indian Manufacturing’, The World Economy, 30(2):249–265. Nagaraj, R. (2003), “Foreign Direct Investment in India in the 1990s”, Economic and Political Weekly, April 26, pp. 1701-1712. Mookherjee, D. (1995), “Introduction”, in D. Mookherjee (ed.), Indian Industry: Policies and Performance, Oxford University Press. Nayyar, D. (2006), “The Internationalization of Firms from India: Investment, Mergers and Acquisitions”, SLPTMD Working Paper Series No. 004, Department of International Development, University of Oxford. Pursell, G. (1992) ‘Trade Policies in India’ in D. Salvatore (ed.) National Trade Policies, New York: Greenwood Press. Sen, K. (2008), Trade Policy, Inequality and Performance in Indian Manufacturing, London: Routledge.
20
Data Appendix
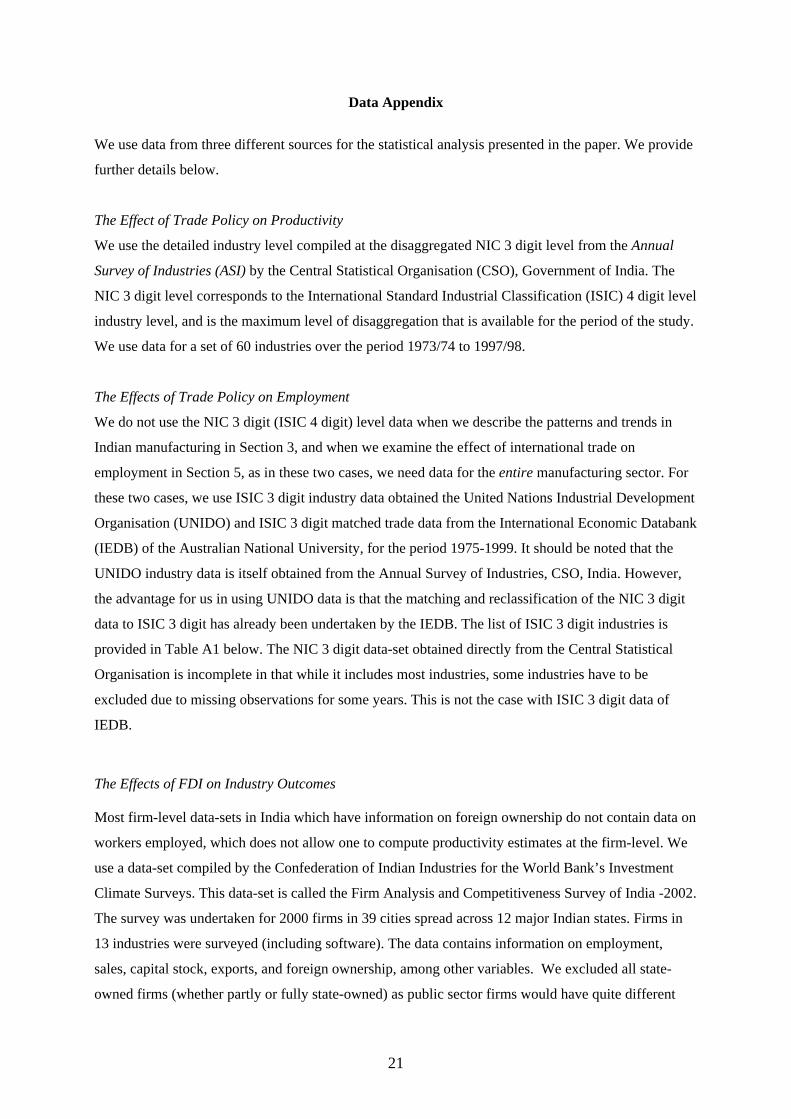
We use data from three different sources for the statistical analysis presented in the paper. We provide
further details below.
The Effect of Trade Policy on Productivity
We use the detailed industry level compiled at the disaggregated NIC 3 digit level from the Annual
Survey of Industries (ASI) by the Central Statistical Organisation (CSO), Government of India. The
NIC 3 digit level corresponds to the International Standard Industrial Classification (ISIC) 4 digit level
industry level, and is the maximum level of disaggregation that is available for the period of the study.
We use data for a set of 60 industries over the period 1973/74 to 1997/98.
The Effects of Trade Policy on Employment
We do not use the NIC 3 digit (ISIC 4 digit) level data when we describe the patterns and trends in
Indian manufacturing in Section 3, and when we examine the effect of international trade on
employment in Section 5, as in these two cases, we need data for the entire manufacturing sector. For
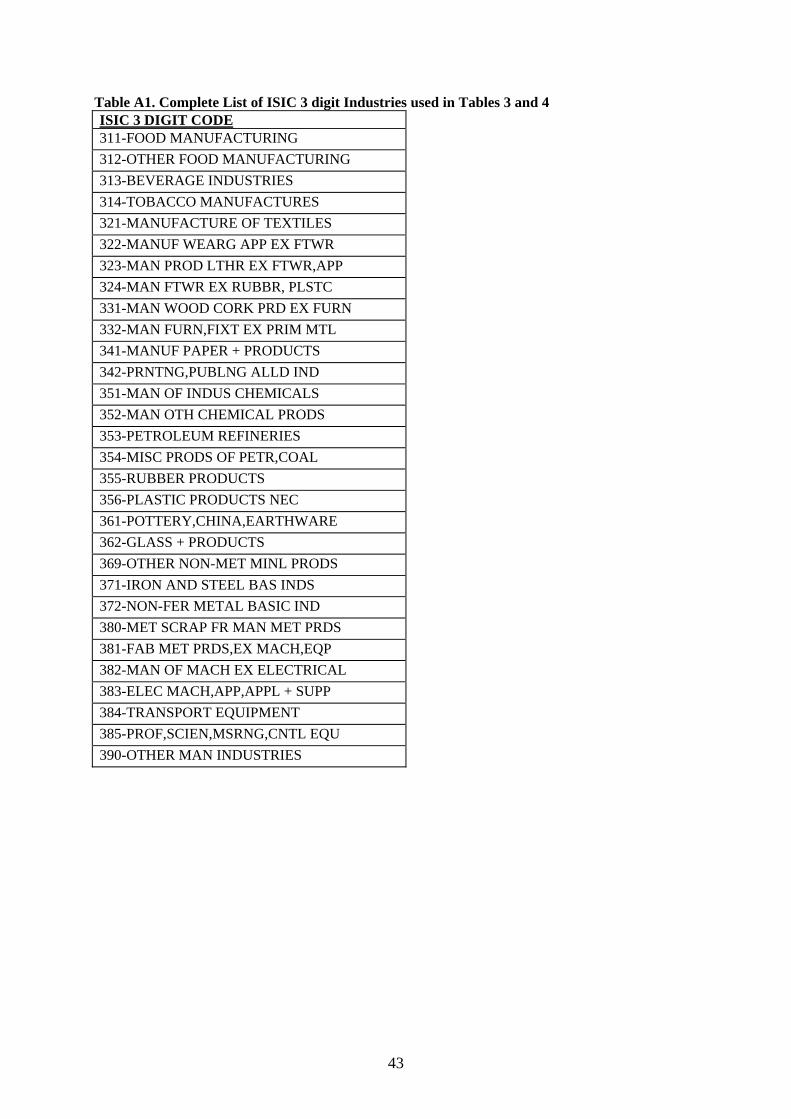
these two cases, we use ISIC 3 digit industry data obtained the United Nations Industrial Development
Organisation (UNIDO) and ISIC 3 digit matched trade data from the International Economic Databank
(IEDB) of the Australian National University, for the period 1975-1999. It should be noted that the
UNIDO industry data is itself obtained from the Annual Survey of Industries, CSO, India. However,
the advantage for us in using UNIDO data is that the matching and reclassification of the NIC 3 digit
data to ISIC 3 digit has already been undertaken by the IEDB. The list of ISIC 3 digit industries is
provided in Table A1 below. The NIC 3 digit data-set obtained directly from the Central Statistical
Organisation is incomplete in that while it includes most industries, some industries have to be
excluded due to missing observations for some years. This is not the case with ISIC 3 digit data of
IEDB.
The Effects of FDI on Industry Outcomes
Most firm-level data-sets in India which have information on foreign ownership do not contain data on
workers employed, which does not allow one to compute productivity estimates at the firm-level. We
use a data-set compiled by the Confederation of Indian Industries for the World Bank’s Investment
Climate Surveys. This data-set is called the Firm Analysis and Competitiveness Survey of India -2002.
The survey was undertaken for 2000 firms in 39 cities spread across 12 major Indian states. Firms in
13 industries were surveyed (including software). The data contains information on employment,
sales, capital stock, exports, and foreign ownership, among other variables. We excluded all state-
owned firms (whether partly or fully state-owned) as public sector firms would have quite different
21
characteristics and motivations for their managers as firms in the private sector. We also exclude firms
in the software sector, given that our focus is on the manufacturing sector in this paper. We define a
foreign firm as one that has at least 25 per cent foreign ownership, consistent with the Reserve Bank of
India’s definition. We have 35 foreign firms and 1722 domestic firms, which implies that foreign
firms are two percent of our total sample of firms. This is lower than the percentage of foreign forms
in the RIS data-base used by Kumar (2005) and other researchers, where the corresponding figure is 6
per cent. The RIS data-base is itself obtained by compiling information from the widely PROWESS
data-base, the dominant source of data for firm—level analysis in India. One reason why the share of
foreign firms in our sample is less than that in the RIS data-base is that the RIS/PROWESS firms are
those which are listed companies. Since unlisted companies are likely to mostly domestically owned,
the percentage of foreign firms in the CII data-set is likely to be less than that in the RIS/PROWESS
data-sets.
22
Figure 1. Effective Rates of Protection (ERP) by Sector
1980-851986-90
1991-951996-00
Capital Goods
Intermediate Goods
Consumer Goods
0
20
40
60
80
100
120
140
160
ERP (per cent)
Year
Capital GoodsIntermediate GoodsConsumer Goods
Source: Das (2003) Figure 2. Effective Rates of Protection (ERP) in the Capital Goods Sector, by Industry
Source: author’s calculations; International Economic Data Bank, The Australian National University.
30
Figure 17. Manufacturing Trade Balance
-100
-50
0
50
100
150
200
1975
1976
1977
1978
1979
1980
1981
1982
1983
1984
1985
1986
1987
1988
1989
1990
1991
1992
1993
1994
1995
1996
1997
1998
1999
Year
Mill
ion
Rup
ees
Trade Balance
Source: author’s calculations; International Economic Data Bank, The Australian National University.
Figure 18. Factor Content of India’s Manufacturing Exports
0%
20%
40%
60%
80%
100%
1975
1976
1977
1978
1979
1980
1981
1982
1983
1984
1985
1986
1987
1988
1989
1990
1991
1992
1993
1994
1995
1996
1997
1998
1999
Year
Per c
ent s
hare
Human Capital IntensiveTechnology IntensiveUnskilled Labour IntensiveMineral Resource IntensiveAgricultural Resource Intensive
Source: author’s calculations; International Economic Data Bank, The Australian National University.
31
Figure 19. Factor Content of India’s Manufacturing Imports
0%
20%
40%
60%
80%
100%
1975
1976
1977
1978
1979
1980
1981
1982
1983
1984
1985
1986
1987
1988
1989
1990
1991
1992
1993
1994
1995
1996
1997
1998
1999
Year
Per c
ent s
hare Human Capital Intensive
Technology IntensiveUnskilled Labour IntensiveMineral Resource IntensiveAgricultural Resource Intensive
Source: author’s calculations; International Economic Data Bank, The Australian National University. Figure 20. Country of Origin of India’s Inward FDI Stock, 1997 (percentage share)
Mauritius US
UK Germany
Japan Others
Source: Kumar (2005) from Reserve Bank of India Bulletin, October 2000
32
Figure 21. State-wise Distribution of FDI Approvals, 2001 – Top Five States (percentage share)
MaharashtraDelhiKarnatakaTamil NaduGujaratOther States
Source: Nagaraj (2003) from Government of India, Handbook of Industrial Policy and Statistics 2001. Figure 22. Employment Coefficients, Exports and Import-Competing Production
0
2
4
6
8
10
12
14
16
1975 1980 1985 1990 1995 1999
Year
Per M
illio
n R
upee
s
ExportsImport Competing
Source: author’s calculations; International Economic Data Bank, The Australian National University.
33
Table 1. Growth Rates of real GDP – Overall and by Sector, India Average over Years AMQ MF REGMF UNREGMF CON TRFIN INF CSPS
Employment 3.7 -1.0 2.2 4.2 0.9 Labour Productivity
-2.1 6.4 7.1 6.9 4.4
Factoriesb N/A -0.8 2.0 3.6 0.4 Real Wages 3.5 3.7 2.0 1.7 -0.3 Notes: a) Average annual growth rates in per cent; b) only for 1996-1997. Source: authors’ calculations, data from United Nations Industrial Development Organization (UNIDO).
NON TCF 73.7 76.0 77.8 78.9 78.9 Note: TCF = Textile, Clothing and Footwear; Industries 321, 322 and 324. See Table A1 for industry titles. Source: authors’ calculations, UNIDO data.
35
Table 4. Structure of Production (percentage shares) Industries 1976–1980 1981–1985 1986–1990 1991–1995 1996–1999
NON TCF 79.5 84.3 86.0 86.8 89.0 Note: TCF = Textile, Clothing and Footwear; Industries 321, 322 and 324. See Table A1 for industry titles. Source: authors’ calculations, UNIDO data.
36
Table 5. Foreign Direct Investment (FDI), Inward, Flows and Stocks, Selected Years 1990-2000
Notes: a) n.a: not available; b) figures in brackets are percentages of Gross Fixed Capital Formation; c) figures in brackets are percentages of Gross Domestic Product. Source: World Investment Report 2007, UNCTAD.
Source: Kumar (2005), from Reserve Bank of India Bulletins, various issues.
38
Table 7. Total Factor Productivity Growth in Indian Manufacturing
Consumer Goods
Intermediate Goods
Capital Goods
Average
1973-1977 6.8 5.0 6.7 6.11978-1984 3.9 4.9 6.0 4.71985-1990 5.6 7.0 7.5 6.51991-1997 5.1 5.7 5.7 5.2Note: Weighted average, weights are share of each industry in Gross Value Added; Price-Cost
Margins = (Gross Value Added - Wages)/Gross Value Added.
Source: authors’ calculations.
Table 8. The Impact of Trade Policy on Total Factor Productivity -Regression Estimatesa,b.c Variable Col. (1) Col. (2) Col. (3) Col. (4) Intercept 1.17***
(5.8) 1.07*** (5.3)
1603.3.*** (36.1)
1505.1*** (27.3)
Ln K 0.59*** (35.3)
0.60*** (38.2)
--- ---
Ln L 0.57*** (21.7)
0.56*** (22.2)
--- ---
ICR -0.001*** (3.59)
--- -10.6*** (17.3)
---
ERP --- 0.0003 (1.64)
--- -6.32*** (12.6)
R2 0.92 0.92 0.01 0.01 Probability that all u_i=0
43.5*** 40.8*** 71.9*** 67.6
Number of observations.
1094 1094 1092 1075
Number of industries
60 60 60 60
Notes: a) Dependent variable is Ln Real value added b) L = Labour; K = capital; ICR=Import Coverage Ratio; and ERP=Effective Rate of Protection; c) ; ***, ** and * denote significance at the 1, 5 and 10 per cent levels.
39
Table 9. Decomposition of Manufacturing Employment Changes
Source: author’s calculations; International Economic Database, Australian National University, and UNIDO.
40
Table 10. Distribution of Foreign and Domestic Firms by Industry (per cent) Industry Foreign Firms Domestic Firms Garments 2.9 14.8 Textiles 5.7 12.5 Drugs and Pharmaceuticals 31.4 9.9 Electronics 2.9 8.5 Electrical White Goods 11.4 7.1 Machine Tools 2.9 3.5 Auto Components 17.1 13.4 Leather Products 0.0 3.7 Sugar 5.7 0.7 Food Processing 11.4 9.5 Chemicals 8.6 10.6 Source: author’s calculations, from Confederation of Indian Industry – Firm Level Survey 2002.
41
Table 11. Characteristics of Foreign and Domestic Firms
Characteristic (1)
Coefficient on Foreign dummy (2)
Firm Size – Sales 1332.44 (4447.82)
Firm Size – Employment 430.65 (68.13)***
Firm Growth -0.95 (17.07)
Labour Productivity 1.37 (0.23)***
Total Factor Productivity 98.18 (9.99)***
Capital-Labour ratio 8.68 (1.18)***
Exporter – if yes, dummy=1 0.46 (0.07)***
Exports as per cent of Sales 39.62 (7.21)***
R an D expenditure/ Sales 0.0005 (0.016)
Investment / Capital Stock -0.02 (0.38)
Note: a) The regressions of various characteristics of firms as in Col (1) of above table, on a ‘foreign firm’ dummy variable (dummy equals one if firm is categorised as foreign – see for definition, zero otherwise) and on industry dummies; b) standard errors in parentheses; c) ; *** denotes significance at the 1 per cent level. Source: author’s calculations, from Confederation of Indian Industry – Firm Level Survey 2002.
42
Table A1. Complete List of ISIC 3 digit Industries used in Tables 3 and 4 ISIC 3 DIGIT CODE311-FOOD MANUFACTURING 312-OTHER FOOD MANUFACTURING 313-BEVERAGE INDUSTRIES 314-TOBACCO MANUFACTURES 321-MANUFACTURE OF TEXTILES 322-MANUF WEARG APP EX FTWR 323-MAN PROD LTHR EX FTWR,APP 324-MAN FTWR EX RUBBR, PLSTC 331-MAN WOOD CORK PRD EX FURN 332-MAN FURN,FIXT EX PRIM MTL 341-MANUF PAPER + PRODUCTS 342-PRNTNG,PUBLNG ALLD IND 351-MAN OF INDUS CHEMICALS 352-MAN OTH CHEMICAL PRODS 353-PETROLEUM REFINERIES 354-MISC PRODS OF PETR,COAL 355-RUBBER PRODUCTS 356-PLASTIC PRODUCTS NEC 361-POTTERY,CHINA,EARTHWARE 362-GLASS + PRODUCTS 369-OTHER NON-MET MINL PRODS 371-IRON AND STEEL BAS INDS 372-NON-FER METAL BASIC IND 380-MET SCRAP FR MAN MET PRDS 381-FAB MET PRDS,EX MACH,EQP 382-MAN OF MACH EX ELECTRICAL 383-ELEC MACH,APP,APPL + SUPP 384-TRANSPORT EQUIPMENT 385-PROF,SCIEN,MSRNG,CNTL EQU 390-OTHER MAN INDUSTRIES