34

TRADE IN COMMERCIAL SERVICES OUTLOOK IN ASIA AND THE PACIFIC
ASIA-PACIFIC TRADE AND INVESTMENT TRENDS 2020/2021 ii
The Economic and Social Commission for Asia and the Pacific (ESCAP) serves as the United Nations’ regional hub promoting cooperation among countries to achieve inclusive and sustainable development. The largest regional intergovernmental platform with 53 Member States and 9 Associate Members, ESCAP has emerged as a strong regional think-tank offering countries sound analytical products that shed insight into the evolving economic, social and environmental dynamics of the region. The Commission’s strategic focus is to deliver on the 2030 Agenda for Sustainable Development, which it does by reinforcing and deepening regional cooperation and integration to advance connectivity, financial cooperation and market integration. ESCAP’s research and analysis coupled with its policy advisory services, capacity building and technical assistance to governments aims to support countries’ sustainable and inclusive development ambitions.
* The designations employed and the presentation of material on this map do not imply the expression of any opinion whatsoever on the part of the Secretariat of the United Nations concerning the legal status of any country, territory, city or area or of its authorities, or concerning the delimitation of its frontiers or boundaries.

TRADE IN COMMERCIAL SERVICES OUTLOOK IN ASIA AND THE PACIFIC
ASIA-PACIFIC TRADE AND INVESTMENT TRENDS 2020/2021iii
ACKNOWLEDGEMENTS:
This Brief was prepared by Witada Anukoonwattaka, Economic Affairs Officer; and Richard Sean Lobo, research consultant, Trade Policy and Facilitation Section (TPFS, Trade, Investment and Innovation Division (TIID) of the United Nations Economic and Social Commission for Asia and the Pacific (ESCAP). Giacomo Fersini, ESCAP intern, provided research assistance. The Brief was developed under the supervision of Mia Mikic, Director, TIID; and Yann Duval, Chief, Trade Policy and Facilitation Section (TPFS), TIID. Cover design and editorial layout were carried out by Yaoling Liu, communications consultant, TIID.
Reference to dollars ($) are to United States dollars unless otherwise stated.
A space is used to distinguish thousands and millions.
The designations employed and the presentation of the material in this publication do not imply the expression of any opinion whatsoever on the part of the Secretariat of the United Nations concerning the legal status of any country, territory, city or area, or of its authorities, or concerning the delimitation of its frontiers or boundaries.
Where the designation “country or area” appears, it covers countries, territories, cities or areas.
Bibliographical and other references have, wherever possible, been verified. The United Nations bears no responsibility for the availability or functioning of URLs.
The views expressed in this publication are those of the authors or case study contributors and do not necessarily reflect the views of the United Nations.
The opinions, figures and estimates set forth in this publication are the responsibility of the authors and contributors, and should not necessarily be considered as reflecting the views or carrying the endorsement of the United Nations. Any errors are the responsibility of the authors.
Mention of firm names and commercial products does not imply the endorsement of the United Nations.
The Asia-Pacific Trade and Investment Trends reports and supporting online documents are the sole responsibility of the ESCAP secretariat. Any opinions or estimates reflected herein do not necessarily reflect the opinions or views of Members and Associate Members of the United Nations Economic and Social Commission for Asia and the Pacific.

TRADE IN COMMERCIAL SERVICES OUTLOOK IN ASIA AND THE PACIFIC
ASIA-PACIFIC TRADE AND INVESTMENT TRENDS 2020/2021 iv
Contents
Highlights �������������������������������������������������������������������������������1
1� Trade performance in 2020 ��������������������������������������������������3
2� COVID-19 pandemic and services trade trends: A closer look � 4
3� Trade trends in selected sectors in 2020-2021 ������������������������ 8
(a) Travel services ������������������������������������������������������������������������������8
(b) Transport services �������������������������������������������������������������������������9
(c) ICT services �������������������������������������������������������������������������������� 11
4� Longer-term prospects: Digitalisation and services trade ������� 13
(a) Changing nature of services trade ������������������������������������������������ 13
(b) Modernizing business services for e-commerce and digitalising servici-fication ���������������������������������������������������������������������������������������������� 14
(c) Increasing incentives for cross-border outsourcing, but rising regulato-ry barriers ������������������������������������������������������������������������������������������ 15
5� Summary and prospects ����������������������������������������������������� 18
References �����������������������������������������������������������������������������20
Supplementary note ���������������������������������������������������������������26

TRADE IN COMMERCIAL SERVICES OUTLOOK IN ASIA AND THE PACIFIC
ASIA-PACIFIC TRADE AND INVESTMENT TRENDS 2020/20211
Highlights
• The COVID-19 pandemic has had a devastating impact on trade in commercial services, turning it from weak growth in 2019 to a sharp contraction in 2020. Globally, commercial services trade value grew by only 2% in 2019. In the first six months of 2020, global exports and imports declined by 19.5% and 20.1%, respectively, compared to the same period in 2019. Commercial services trade in Asia and the Pacific performed even worse, moving from a 0.3% growth in 2019 to export and import declines of more than 22% in the first half of 2020. If this trend continues, the region’s shares in global commercial services trade will also edge down to 26.5% (exports) and 30.1% (imports) in 2020, from 27.8% and 31.5% a year earlier.
• Adverse impacts of the pandemic are uneven across services and economies. Travel and transport dependent economies tend to face more negative impacts than other countries. International tourist arrivals during the first eight months of 2020 decreased by 78.8% compared to the same period of 2019. These are linked to a massive 65.3% decline in international flights during the first eight months of 2020. In contrast, economies exporting information and communications technology (ICT) services as well as digitally enabled services have seen some new opportunities during the COVID-19 pandemic.
• Despite the overall decline of trade in services because of depressed economic activities, selected ICT services grew in 2020. Indicators of online activities in Asia-Pacific economies show that social networking and online collaborative platforms, in particular, are expected to grow between 17.3% and 31.3% across major Asia-Pacific economies, while public cloud services are also expected to display a positive trend in 2020. E-commerce services were also growing rapidly, with orders up 70% for the first five months of 2020.
• Trade in services, except travel services, recovered during the second half of 2020 when many regional economies partially lifted the virus-containment measures, supporting a rebound in economic activity. Global transport services and the global services Purchasing Managers’ Index have shown moderate improvements since the second quarter of 2020. Although trade in commercial services is not expected to fully return to pre-COVID-19 levels in 2021, a partial recovery of demand for commercial services – in particular transport services – is anticipated. Maritime transport services will benefit from the positive growth in merchandise trade volume. Additionally, air transport services and travel services will grow in 2021 from a very low base in the previous year. However, the partial recovery of demand will not generate significant upward pressures on prices except in selected sectors that may experience supply shortages because of business shutdowns during the pandemic. The recovery of cross-border travel services will be limited because of high restrictions on cross-border travels.

TRADE IN COMMERCIAL SERVICES OUTLOOK IN ASIA AND THE PACIFIC
ASIA-PACIFIC TRADE AND INVESTMENT TRENDS 2020/2021 2
• In the medium to long term, Asia-Pacific economies will see digitalisation, accelerated by the COVID-19 pandemic, redefine the nature of services trade. The trend of delivering services through digital means will stay after the pandemic, as the higher efficiency and productivity gains they can bring have been proven. Digitally-enabled services may substitute for some part of other services. For example, telemedicine and teleconference services, by reducing the need for person-to-person contact, may reduce demand for travel, including passenger air transport services. Similarly, COVID-19 pandemic related change in consumer behaviour has fast-forwarded e-commerce as a new normal. This may require developing countries in the region to adjust their development priorities and focus on acquiring the capacity to effectively engage in a rapidly digitalizing trade environment, especially hard and soft trade infrastructure.
• However, trade in digital services continues to be hindered by domestic regulations that are beyond the scope of trade policies, such as data protection, intermediary liabilities, filtering or blocking, and cybersecurity standards, among others. Also, since 2019, there have been increased restrictions on the usage of various mobile applications, perceived as potentially stifling national security, in certain countries. These recently emerged barriers appear to show uncoordinated and conflicting policy objectives in digital trade policy areas.

TRADE IN COMMERCIAL SERVICES OUTLOOK IN ASIA AND THE PACIFIC
ASIA-PACIFIC TRADE AND INVESTMENT TRENDS 2020/20213
1� Trade performance in 2020
After posting a mild 2% and 0.3% services trade expansion in 2019,1 global and regional commercial services trade plummeted in 2020. Globally, exports and imports declined by 19.5% and 20.1%, respectively, during the first half of the year (figure 1). In Asia and the Pacific, these drops were even steeper: exports and imports decreased by 22.5% and 22.1%, respectively, in the same period. Should there be no improvement in the second half of 2020, the decline in Asia and the Pacific commercial services trade would amount to an enormous US$759 billion year-on-year reduction. In addition, it would bring the region’s share in global commercial services down to 26.5% (exports) and 30.1% (imports) from 27.8% and 31.5%, respectively, in the previous period.
1 Following an economic and merchandise trade slowdown as well as rising trade tensions (ESCAP, 2019).
Figure 1. Global and Asia-Pacific commercial services trade performance, 2018-2020
(a) World
(US$ billion/% growth rate) (US$ billion/% growth rate)
(b) Asia and the Pacific
Source: ESCAP calculation, based on WTO data (accessed October, 2020). Note: ‘H2-2020 E’ values are estimates based on trade growth rates from the first half of 2020. Available data for the world in H1 2020 covers 98.4% of exports and 97.7% of imports. For Asia and the Pacific these figures are both 99.4%.
The drastic trade declines in 2020 are mainly due to the COVID-19 pandemic, which has disrupted trade in services more than in goods, through both demand and supply shocks. First, a substantial global merchandise trade contraction reduced
TRADE IN COMMERCIAL SERVICES OUTLOOK IN ASIA AND THE PACIFIC
ASIA-PACIFIC TRADE AND INVESTMENT TRENDS 2020/2021 4
the demand for services as an input for manufacturing industries in 2020 (so-called manufacturing services).2 These are considered to be indirect demand shocks passed through the servicification channel linked to GVCs. Second, a considerable drop in domestic consumption and imports of non-essential services, such as tourism services in particular, has caused significant economic damage within the region and beyond. These are direct demand shocks affecting services value chains3 and demand for services for final consumption. Third, delivery of the majority of services still requires some degree of physical proximity between (often multiple) suppliers and consumers. Accordingly, physical distancing practices and border closures have hit services trade hard. Services trade via Mode 2 (consumption abroad, e.g., tourism and travel services, and education), transport services as well as Mode 4 (movement of natural persons, e.g., in professional services such as nursing services) have been particularly affected. In addition, services trade via Mode 3 (commercial presence) have also been adversely affected by the closure, downsizing and delaying of foreign investment in service sectors. These are supply shocks emerging from social distancing and lockdown measures.
The first half of 2020 was particularly severe for commercial services trade. Indeed, globally, commercial service exports and imports contracted by 7.4% and 3.8% during the first quarter of the year, respectively. However, due to COVID-19’s initial surge in China, many regional economies were forced to impose travel restrictions and lockdown measures earlier than the rest of the world. As a result, Asia and the Pacific registered a more accentuated fall of 13.2% in exports and 10.9% in imports in that quarter, corresponding to a US$101 billion loss in trade value compared with Q1 in 2019 (figure 2). As COVID-19 spread globally, all economies were hit even worse, one after the other, in short sequence during the second quarter of 2020. In fact, global exports and imports declined 30.4% and 33.7%, respectively, while in Asia-Pacific the equivalent figures were 32.1% and 33%, respectively. This debilitating services performance represented an approximate US$275 billion reduction in Asia-Pacific’s services trade value, compared with Q2 in 2019.
2 See trends in manufacturing services in WTO (2020a). 3 For more details see Anukoonwattaka et al. (2017).
2� COVID-19 pandemic and services trade trends: A closer look

TRADE IN COMMERCIAL SERVICES OUTLOOK IN ASIA AND THE PACIFIC
ASIA-PACIFIC TRADE AND INVESTMENT TRENDS 2020/20215
(US$ billion/% growth rate)
Source: ESCAP calculation, based on WTO quarterly data (accessed October, 2020). Note: Available data for Asia and the Pacific in Q1 2020 cover 100% of regional exports and imports, while the equivalent figures for Q2 2020 are both 98.8%.
Figure 2. Commercial services trade in Asia-Pacific, Q1 2019 – Q2 2020
Due to China’s prominence in regional services trade, the economy’s performance has been the leading driver of the Asia-Pacific services contraction in 2020. As the largest exporter and importer of services in the region, China’s moderate 6.2% export decline and more pronounced 24.6% import fall represented 4.8% and 32.2%, respectively, of the total regional services exports and imports declines, in the first half of 2020 (figure 3).
Furthermore, as other Asia-Pacific economies heavily rely on China as the largest service importer – particularly for travel and tourism – weakening demand there considerably hurt partnering economies elsewhere. In descending order of their contribution, these include: Japan; Hong Kong, China; Thailand; Macao, China; and Singapore, which together accounted for more than half of the region’s decline in exports and which faced export drops of between 22.7% (Japan) and 75.4% (Macao, China). On the other hand, China, Singapore, India and Hong Kong; China, in that order, were responsible for a similar share of Asia-Pacific’s decline in imports, with individual imports falling by between 16.2% (Singapore) and 34.7% (Hong Kong, China).

TRADE IN COMMERCIAL SERVICES OUTLOOK IN ASIA AND THE PACIFIC
ASIA-PACIFIC TRADE AND INVESTMENT TRENDS 2020/2021 6
(a) Exports (b) Imports
Source: ESCAP calculation, based on WTO data (accessed October 2020). Note: The figure includes the contribution of each country towards overall Asia-Pacific growth in commercial services trade for January-June 2020. The top 10 economies contributing the most towards Asia-Pacific export and import declines were selected.
Figure 3. Selected economies’ commercial service trade growth and contribution to regional trade growth, January-June 2020
Sector-wise, global travel and transport services registered the most significant contractions in the first half of 2020, as a result of the limitations on the movement of goods and people as well as of the scant volume of merchandise trade for transport services (UNDESA, 2020). Global trade in travel and transport services shrank by 25.7% and 8.1%, respectively, in the first quarter of 2020, and then slipped further in the second quarter to 81.4% and 32.9%, respectively.
In Asia and the Pacific, these declines were even more accentuated. Travel service exports and imports plunged by 36.8% and 28.3% year-on-year in the first quarter, respectively, and again by 83% and 73.7% in the second quarter (figure 4). In total, travel services exports from Asia-Pacific region decreased by US$133 billion during the first half of 2020 alone, relative to the same period in 2019. Transport services – the second-most affected sector in terms of absolute trade value – faced export and import declines of 9.6% and 8%, respectively, in the first quarter of 2020, and 25% and 30.6%, respectively, in the second quarter. This half-year decline in transport service trade for 2020 amounts to a US$25.6 billion reduction in export revenue for regional economies, compared to the first half of 2019. Goods-related service trade in the region declined by 17.7% (US$10 billion) in trade value during the first six months of 2020. Finally, other subsectors4 declined relatively less at 2.8% due to some trade being conducted via electronic means (digitally-enabled services).
4 Other subsectors include construction services, insurance and pension services, financial services, charges for the use of intellectual property n.i.e, telecommunications, computer, and information services (ICT), personal, cultural and recreational services; and other business services.

TRADE IN COMMERCIAL SERVICES OUTLOOK IN ASIA AND THE PACIFIC
ASIA-PACIFIC TRADE AND INVESTMENT TRENDS 2020/20217
Figure 4. Asia-Pacific sectoral trade performance and growth, Q1-Q2 2020
Exports Imports
Source: ESCAP calculation, based on WTO data (accessed October 2020).
(US$ billion/% growth rate) (US$ billion/% growth rate)
A weak recovery occurred in the second half of 2020 when many regional economies partially lifted pandemic-containment measures. The recovery is, however, very limited for trade in travel services because cross-border travel has remained highly restricted throughout 2020 (IMF, 2020). According to the latest data from the WTO Global Services Trade Barometer, indicators related to global transport services and the global services Purchasing Managers’ Index (PMI) have shown moderate improvements since the second quarter (WTO, 2020b). Furthermore, China’s performance in the third quarter of 2020 is noteworthy. Indeed, the country’s exports during this period grew by 1% compared with the same period in 2019. Whether the recovery will continue remains uncertain, because China’s export growth fell again in October by 1% (WTO, 2020c).
In any case, global and regional commercial services trade is likely to remain at a significantly lower level than before the pandemic. In addition, demand recovery is still fragile, given the possibility of further COVID-19 waves. In fact, imports in China during the third quarter remained 26.2% lower compared to the same period of 2019. The year-on-year import growth decreased further by 24.7% in October. Reduced services demand from China has adversely affected other Asia-Pacific economies, such as Thailand, which heavily rely on travel and tourism demand from China.

TRADE IN COMMERCIAL SERVICES OUTLOOK IN ASIA AND THE PACIFIC
ASIA-PACIFIC TRADE AND INVESTMENT TRENDS 2020/2021 8
3� Trade trends in selected sectors in 2020-2021
The extent of the commercial services’ decline in Asia and the Pacific has varied significantly across sectors, depending on their main modes of supply and indispensability. This section explores trends affecting sectors that play an important role in the region’s services trade structure. These include travel, transport and ICT services, which together account for 59.4% of total regional services trade.
(a) Travel services
Travel restrictions following the COVID-19 outbreak hit travel, hotel and tourism-related services, which together accounted for about one-third of commercial services trade in Asia and the Pacific. Globally, the UNWTO (2020a) estimates that tourism receipts will fall by 60% to 80%, (between US$910 billion to US$1,200 billion), in 2020. Between January and August 2020, Asia and the Pacific saw a 78.8% decrease in international tourist arrivals, as 28 regional economies imposed complete border closures at some point during that period. The decline in tourist arrivals amounted to a staggering 96% drop in July and August from the same months a year earlier (UNWTO, 2020b and 2020c). The Asia-Pacific region is expected to see a drop of 76.3 million in international tourist arrivals in 2020 (UNWTO, 2020b).
Such a decline in travel services is putting tremendous pressure on many economies in the region. Indeed, exports of travel services, including tourism-related services, accounted for more than 4% of GDP in 19 regional economies and more than 70% of total services exports in eight of those economies (figure 5). It is important to note that a majority of the travel and tourism dependent economies are Countries with Special Needs (CSNs). These economies have suffered devastating impacts despite their often relatively lower number of COVID-19 cases. Based on UNWTO (2020a) estimates,5 Vanuatu, Samoa, Cambodia and Fiji are expected to face massive GDP declines, ranging from 10% to 17% solely due to reduced revenue from exports of travel and tourism services.
5 This is based on the scenario where international borders begin re-opening and travel restrictions are gradually eased from September 2020 onwards, predicted to result in a 70% decrease in international tourist arrivals (UNWTO, 2020a).

TRADE IN COMMERCIAL SERVICES OUTLOOK IN ASIA AND THE PACIFIC
ASIA-PACIFIC TRADE AND INVESTMENT TRENDS 2020/20219
Source: ESCAP calculation, based on WTO Data and World Bank WDI (accessed September 2020).Note: For brevity, only economies with travel exports exceeding 50% of total commercial service exports are shown. Decrease in travel exports (% of GDP) is based on a scenario with a 70% decrease in international tourist arrivals in 2020, resulting from gradual opening of borders from September 2020 (UNWTO, 2020a).
Figure 5. Travel exports dependence: Selected regional economies, 2019
(b) Transport services
Transport services is another key sector for commercial services trade in Asia and the Pacific, accounting for 18.6% and 25.1% of all regional commercial service exports and imports, respectively, in 2019. Unsurprisingly, as a result of travel restrictions and border closures as well as of the unprecedented contraction in merchandise trade (ESCAP, 2020), all three transport segments – i.e., maritime, air and inland – registered significant trade declines in 2020. However, as air and maritime transport accounted for the majority of trade in the sector, these segments dominated transport’s overall trade performance. In fact, air transport registered the most drastic decline of all. This is due to the fact that air transport – particularly passenger services – are tightly entwined with travel services. Indeed, air transport serves as the primary transportation mode for passenger arrivals in Asia and the Pacific.6
Looking more closely at air transport, it can be seen that passenger and cargo services performed markedly different. Data from the International Civil Aviation Organization
6 In 2018, 65% of all arrivals in Asia-Pacific were by air, according to the UNWTO Global Tourism Dashboard.
TRADE IN COMMERCIAL SERVICES OUTLOOK IN ASIA AND THE PACIFIC
ASIA-PACIFIC TRADE AND INVESTMENT TRENDS 2020/2021 10
(ICAO, 2020a) points to a massive 65.3% (1.3 million) drop in international passenger flights in Asia and the Pacific during the first eight months of 2020. In contrast, air cargo services actually grew during that period. Indeed, between February and August 2020 there was an expansion of the global active cargo fleet while commercial flights faced large declines (ICAO, 2020d). Similarly, Asia-Pacific has seen an 8.2% increase in the number of international cargo flights from the region compared with the same period in 2019 (ICAO, 2020a), which points to this trend. Nevertheless, owing to passenger transport dominance in the industry, regional airlines are expected to suffer an estimated US$29 billion loss by the end of 2020, which represents 34.4% of global losses in airline services; that is more than any other region (IATA, 2020a). However, these figures capture only the decline facing air carriers. Airport services – the key infrastructure service providers supporting commercial aviation – are also set to face staggering revenue declines, with data for the first eight months of 2020 showing a US$7.8 billion reduction in international travel revenue in Asia and the Pacific (ICAO, 2020b). Furthermore, air navigation service providers (ANSPs) in the region are reeling from a 57.6% decline in revenue, amounting to a US$2.2 billion loss compared with the same period in 2019 (ICAO, 2020c).
Looking ahead, in an optimistic scenario where travel restrictions and border closures are eased, 2021 is expected to bring a moderate recovery to air transport services trade. However, this will not be sufficient to restore it to pre-pandemic levels. In fact, IATA (2020b) has estimated that global passenger numbers will not pick up to reach 2019 levels until 2023, despite a vigorous 62% growth projected for 2021. On the other hand, air cargo transport is expected to maintain its enlarged contribution to the sector, with revenues in 2021 expected to reach record highs driven by a strengthened economic recovery (IATA, 2020a).
Maritime transport services also fell in 2020. This segment was affected by supply-chain disruptions during the first quarter of the year, and later by the sharp decline in global goods trade, 80% of which is transported by sea (ESCAP, 2020; UNCTAD, 2018). In the first quarter of 2020, 46% of scheduled departures on the key Asia-North Europe routes were cancelled (Knowler, 2020a). In the second quarter, this decline continued with the average number of container vessels arriving weekly at ports showing an 8.5% year-on-year drop as of June 2020 (UNCTAD, 2020b).
However, maritime transport indicators seem to have recovered in the second half of the year, linked to a revival of merchandise trade. Indicators such as the weekly container ship port calls, appear to be hinting that activity in the third quarter almost returned to 2019 levels in Asia and the Pacific. Container Trade Statistics data reveal that the container volume of trade between Asia and Europe rose for the first time since October 2019 by 2% year-on-year in July 2020 (Knowler, 2020b). As of August
TRADE IN COMMERCIAL SERVICES OUTLOOK IN ASIA AND THE PACIFIC
ASIA-PACIFIC TRADE AND INVESTMENT TRENDS 2020/202111
2020, economies in South-East Asia remained only 0.5% below their 2019 level while China and Hong Kong, China had surpassed their 2019 levels by 4.1%. The same indicator, however, shows maritime transport activities remained notably below the 2019 level for economies in South and South-west Asia (UNCTAD, 2020c). The Container Throughput Index, another proxy for maritime transport, paints a similar picture, pointing to world trade gaining momentum in the third quarter of 2020, with values for July 2020 falling only slightly below those of 2019, and cargo handling at Chinese ports reaching an all-time high (ISL, 2020).
Overall, trade in transport services showed signs of a potential second half of 2020 recovery from the historical low levels earlier in the year. This recovery was driven by maritime transport activity, which has returned to its 2019 level as a result of a positive uptick in global merchandise trade in the second half of 2020. However, high uncertainties are clouding this trend, with growing signs of the second wave of COVID-19 across important markets for Asia-Pacific exports. The threat of a recurrence of massive lockdowns is still adding major uncertainties to the prospects of a recovery in the second half of 2020 (Hollinger et al., 2020).
(c) ICT services
ICT services accounted for 10.7% and 5.7% of total commercial services exports and imports, respectively, in Asia and the Pacific in 2019, playing an important role in supporting economic activities. Driven mostly by demand shocks, trade in ICT services in Asia-Pacific appeared to decrease in 2020. Based on an IDC (2020) survey of regional economies, Asia-Pacific spending in the services sector is projected to record a 1.3% decline in 2020. The WTO Services Trade Barometer provides a similar perspective globally, with trade in ICT services performing well below trend for the first half of 2020.
Therefore, the ICT services sector is expected to face an overall decline in the Asia-Pacific region in 2020 because of economic downturns across the region. According to GlobalData (2020) surveys, overall ICT spending will decline across the region in 2020, for example Australia (5.9%), China (7.6%), India (7.2%), Indonesia (7.1%), Japan (5.3%), Malaysia (8.3%), the Republic of Korea (5.4%). The expected decrease in ICT spending in these economies in 2020 will result in an overall decline for the sector in the Asia-Pacific region, as this group comprises the largest economies in the region.7
TRADE IN COMMERCIAL SERVICES OUTLOOK IN ASIA AND THE PACIFIC
ASIA-PACIFIC TRADE AND INVESTMENT TRENDS 2020/2021 12
However, the COVID-19 pandemic has also created upward pressure on demand in selected subsectors of ICT services, especially computer and internet services. In the first and second quarters of 2020, there was a 75% and 32% surge, respectively, in internet traffic in the Asia-Pacific region (SES, 2020). This trend reflects the surge in internet usage to support remote work, online schooling and online activities during the lockdown periods.8 In general, social networking and collaborative platforms are expected to be the bright spot in the ICT service sector in 2020. This is supported by projections from GlobalData (2020) that indicate the market for enterprise social networking and collaborative platforms is expected to grow between 17.3% and 31.3% across major Asia-Pacific economies, including Australia (29.4%), China (23.7%), India (17.5%), Indonesia (31.3%), Japan (30.8%), Malaysia (29.7%), the Republic of Korea (30.1%) and Singapore (25.8%). In addition, public cloud services – another segment of the ICT service sector – is expected to display a positive trend through 2020. The subsector has tremendous potential to grow if regulatory bottlenecks in areas of data privacy, security and operational efficiency are addressed in Asia-Pacific economies.
7 One exception is the Philippines, the ICT market of which is expected to continue to grow in 2020, driven by the digital transformation initiatives taken by domestic enterprises. Indeed, it was found that 84% of Philippine enterprises increased their ICT budgets in 2020, compared with 66% in the previous year. Cloud-based communication and collaboration services were found to be a key technology area of interest, with 80% of enterprises planning to invest in these platforms during the next two years. Furthermore, Philippine enterprises have increased their share in total ICT spending for digital transformation, from 44% to 50% for 2020. This has been driven by the need for flexibility and scalability required to meet changing consumer expectations as well as increasing operational efficiency and customer satisfaction (GlobalData, 2020). This trend of increasing investment in ICT in the Philippines is not limited to the private sector; the government is planning to invest US$941 million to accelerate digital transformation during the pandemic, with nearly half of this being allocated to improving digital connectivity and access (Dharmaraj, 2020). 8 In Thailand, DTAC – a telecom service provider – reported an 828% and 215% rise in data traffic used for Zoom and Skype, respectively, between 1 January 2020 and 19 March 2020 (Techsauce, 2020). Similarly, in China, Tencent recorded a sharp jump in revenue during the first quarter of 2020, following the imposition of lockdown measures that increased use of its online services. In fact, the firm’s net profit rose 6% year-on-year, with revenue up 26% during this period – social networking, gaming, fintech and business services all reported positive figures (Waring, 2020). In addition, for India, more recent estimates for the second quarter of 2020 point to a massive 947% increase in data consumption for online video services between February and June 2020 (Kala, 2020).

TRADE IN COMMERCIAL SERVICES OUTLOOK IN ASIA AND THE PACIFIC
ASIA-PACIFIC TRADE AND INVESTMENT TRENDS 2020/202113
9 Digitalisation refers to, “the use of digital technologies and data as well as interconnection that results in new or changes to existing activities” (OECD, 2020b). While this process has been expedited by the onset of the COVID-19 pandemic, it is not a new trend. In fact, digitalisation has been well underway in the past decade. According to UNCTAD (2020d), globally between 2008 – when the first Apple and Android smartphones were launched – and 2019, the number of smartphone users has grown to a staggering 3.2 billion. During that period, the number of internet users also surged from 1.6 billion to 4.1 billion, while internet penetration increased from 23% to 54%. Data flows – proxied by global internet protocol – grew from 4,000 GB per second to 100,000 GB per second during that period. 10 With regard to telecommuting, the demand for these digital services has skyrocketed. Online-collaboration platform providers, such as Microsoft, Google, and Zoom, all reported drastic increases in usage during the first half of the year. Similarly, telemedicine has made immense progress during 2020 in the Asia-Pacific region. Between December 2019 and January 2020, multiple online medical platforms in China saw three-digit growth rates. Many governments in Asia-Pacific – which, prior to 2020, were uncertain about supporting digital health services – have quickly turned to the provision of these services since the onset of the pandemic, most notably Australia, Republic of Korea and Japan (Kapur and Boulton, 2020).Surveys show nearly a quarter of employees are in favour of continued flexible working structures (GWI, 2020) and nearly half of patients intend to embrace telemedicine in the long term (Emmanuelli et al., 2020)
4� Longer-term prospects: Digitalisation and services trade
In the medium to long term, accelerated by the COVID-19 pandemic, Asia-Pacific economies will see digitalisation9 redefine the nature of services trade. The trend of delivering services through digital means will stay after the pandemic, because of the higher efficiency and productivity they can bring. This implies that digitally-enabled services may substitute some part of other services. Similarly, COVID-19 has fast-forwarded e-commerce as a new normal. This may require developing countries in the region to adjust their development priorities and focus on acquiring the capacity to effectively engage in a rapidly digitalizing trade environment.
(a) Changing nature of services trade
The accelerated use of digital technology in service sectors has rapidly shifted services supply from in-person to online platforms. Telecommuting and telemedicine are two examples of such areas where communication infrastructure and digital technologies have allowed continued provision of services, despite strict lockdowns being implemented. The trend of moving away from supplying in-person services towards digitally enabled services delivery is likely to continue after COVID-19.10 This implies that there is a huge potential for trade in digitally-enabled services and it may affect expenditure on other services. For example, using digital technology to deliver teleconference services may reduce demand for travel and tourism as well as for

TRADE IN COMMERCIAL SERVICES OUTLOOK IN ASIA AND THE PACIFIC
ASIA-PACIFIC TRADE AND INVESTMENT TRENDS 2020/2021 14
11 Servicification refers to the increased use of services in manufacturing processes (Anukoonwattaka et al., 2015).12 For example, the total number of orders on Shopee – one of the largest online shopping platforms in South-East Asia – for the first quarter of 2020 were 111.2% higher than in the same period in 2019, driving up its gross merchandise value by 74.3% to US$6.2 billion. Moreover, Grocerdel, an online grocery firm in Cambodia, also reported a 165% increase in its sales since the onset of COVID-19, leading to a 50% increase in staffing (UNCTAD, 2020e). In China, online retail penetration increased from 23% to 28.2% from the first quarter of 2019 to 2020 (Loh, 2020). In addition, Chinese online retailer JD.com reported a 215% year-on-year growth in online grocery sales during a 10-day period between January and February 2020 (Cheung, 2020). The shifts towards e-commerce have also appeared in large manufactured products, like automobiles. Indeed, Tesla’s partnership with Alibaba may partially explain why Tesla’s sales in China increased two-fold between December 2019 and March 2020, while other firms in the automobile sector experienced a 50% drop during the same period (Emaunuelli et al., 2020).13 According to GlobalData (2020), credit/debit card payments in the Asia-Pacific region are expected to grow by 6.5% to reach US$20.3 trillion in 2020 and to increase further to US$27.4 trillion by 2023.
transport services. The importance of Mode 1 in cross-border commercial services may increase while that of Mode 2 (consumption abroad), Mode 3 (commercial presence) and Mode 4 (movement of natural persons) may decline. However, trade in digitally-enabled services remains below its potential because of restrictions on cross-border data flows such as on data-privacy protection and data localisation requirements. While specific to telemedicine, domestic regulations such as non-portability of health insurance and professional services regulations have not allowed for cross-border telemedicine practices (Gillson and Muramatsu, 2020).
(b) Modernizing business services for e-commerce and digitalising servicification11
As the only viable alternative to meet the demand for goods amid government-enforced lockdowns, e-commerce has flourished in Asia and the Pacific during 2020. This is evidenced by a 70% increase in e-commerce orders in the region for the first five months of 2020 (OECD, 2020c).12 The surge in e-commerce will also drive digitalisation in supporting services such as financial, post, storage, transport and logistics services. For example, the flourishing of e-commerce has highlighted the need for inclusive access and security of electronic payments in economies across the region.13
In addition, digital services have become an important part of manufacturing production. In fact, this digitalizing servicification had happened even before the COVID-19 pandemic. In 2015, ICT services (as a proxy for digital services), contributed about 2.5% of all regional manufacturing exports value – almost double that of the world (figure 6). Similarly, ICT services as inputs in other services exports were also more important regionally (3.4% of services exports) than globally (2.4%). In

TRADE IN COMMERCIAL SERVICES OUTLOOK IN ASIA AND THE PACIFIC
ASIA-PACIFIC TRADE AND INVESTMENT TRENDS 2020/202115
particular, India, Malaysia and the Philippines saw the digitalization of their services exports notably increase between 2000 and 2011 (OECD, 2018).
More recently, due to growing concerns about supply-chain disruptions, incentives for firms to adopt digital technologies to enable end-to-end visibility, responsiveness, agility and optimization in supply chains have grown stronger (Kilpatrick and Barter, 2020). For example, in transport services, real-time shipments tracking, route optimization and better last mile delivery have been among many important elements for GVC agility (Lacey et al., 2015).
Figure 6. Global and regional use of digital services as inputs in exports, 2015
(c) Increasing incentives for cross-border outsourcing, but rising regulatorybarriers
Digital technologies make outsourcing of services overseas cheaper and easier, thereby raising incentives for firms to do so. According to Lashitew and Erumban, (2020) and Baldwin (2018), the rolling out of 5G networks and widespread adoption of cloud computing technologies will allow firms to enjoy services-wage differentials, which can differ up to 10 times across economies. The pressure for cross-border outsourcing of services may increase post-COVID-19 to balance the higher costs
Source: ESCAP calculation, based on OECD TiVA data (accessed October 2020)
TRADE IN COMMERCIAL SERVICES OUTLOOK IN ASIA AND THE PACIFIC
ASIA-PACIFIC TRADE AND INVESTMENT TRENDS 2020/2021 16
caused by redundancy to minimize risks of supply-chain disruptions (ESCAP, 2020; Deloitte, 2020).
Although its importance is clear, trade in digital services continues to be hindered by policy restrictiveness. Barriers to digital services often come from domestic regulations that are beyond trade policies, such as data protection, intermediary liabilities, intellectual property rights (IPR) infringement, filtering or blocking, and cybersecurity standards, among others.
OECD’s Digital Services Trade Restrictiveness Index (DSTRI) shows that trade restrictiveness across Asia and the Pacific either remained stable or increased from 2014 to 2019 (box 1). Moreover, recent anecdotal evidence points to barriers emerging from uncoordinated and conflicting policy objectives in digital trade policy areas. For example, the absence of physical presence and the difficulty of quantifying assets, activities and types of income make it difficult to develop digital tax policies.
Similarly, the absence of information on value creation along digital value chains, such as social media platforms and online news, makes finding an optimal revenue-sharing scheme between the platforms (owning distribution channels) and the media firms (owning content) particularly challenging. Since 2019, there have been increased restrictions on the usage of various mobile applications, perceived as a potential threat to national security, in certain countries. In addition, countries have put in place a ban on certain foreign vendors providing equipment for their 5-G infrastructure projects. While these measures may be used for achieving legitimate public policy objectives, including national security concerns, their use for protectionist purposes remain a concern.
Box 1. Increased restrictiveness towards digital services tradeAlthough their importance is clear, restrictions continue to hinder trade in digital services. From 2014 to 2019, the average score for the overall Digital Services Trade Restrictiveness Index (DSTRI) among nine Asia-Pacific economies increased from 0.21 to 0.26 (figure 7), with ‘Infrastructure and connectivity’ and ‘Other barriers’ being the digital-services policy areas seeing the sharpest increases. Restrictiveness in ‘Infrastructure and connectivity’ captures regulations that could, de facto, undermine interoperability of ICT infrastructure services across economies, and restrict trade in communications service and cross-border data flows. An example of this is the requirements for data localisation. ‘Other barriers’ is a broad category that captures barriers to cross-border digital trade in multiple areas. Examples are policies for using local software, surrendering source codes, local presence requirements, and the lack of effective redressal mechanisms against anti-competitive practices online, among others (Ferenzc, 2019).

TRADE IN COMMERCIAL SERVICES OUTLOOK IN ASIA AND THE PACIFIC
ASIA-PACIFIC TRADE AND INVESTMENT TRENDS 2020/202117
Figure 7. Digital services trade restrictiveness in the Asia-Pacific region
A notable trend seen across Asia-Pacific economies is that their degree of restrictiveness towards trade in digital services remained or increased between 2014 and 2019 (figure 8). For most Asia-Pacific economies for which data are available, ‘Infrastructure and connectivity’ tends to be to the most restricted by regulations. Moreover, digital services tend to be the most restricted in large developing economies compared to developed ones. However, there are some differences between developing economies and developed ones in other areas. More specifically, ‘Electronic transactions’ is particularly restricted by regulations in developing Asia-Pacific economies. The data indicate that facilitating electronic transactions through improving electronic payment systems as well as ensuring harmonization with international security standards is particularly important in developing Asia-Pacific economies.
Source: OECD Digital Services Trade Restrictiveness Index database (accessed October 2020).Note: The DSTRI considers digital services to include services that can be supplied via electronic networks. The figure shows average values across nine Asia-Pacific economies: Australia, China, India, Indonesia, Japan, the Republic of Korea, New Zealand, the Russian Federation and Turkey.

TRADE IN COMMERCIAL SERVICES OUTLOOK IN ASIA AND THE PACIFIC
ASIA-PACIFIC TRADE AND INVESTMENT TRENDS 2020/2021 18
Figure 8. Asia-Pacific digital services trade restrictiveness, by economy
5� Summary and prospects
Over the course of 2020, COVID-19 has been responsible for a sharp contraction in global and regional commercial services trade. However, the Asia-Pacific region has suffered from a larger services trade decline than the rest of the world, with its exports and imports decreasing by 22.5% and 22.1%, respectively, – compared to 19.5% and 20.1% – during the first half of the year.
In particular, travel services trade has contracted the most of all sectors, with Asia and the Pacific registering a particularly acute downfall: travel services exports and imports fell by 59.3% and 51.1%, respectively, during the first half of 2020. For the remainder of 2020, the outlook for international travel remains bleak, even with movement restrictions being gradually eased into 2021. This is particularly relevant for countries with special needs, owing to the high reliance of those economies on travel services exports as a share of their GDP.
Trade in transport services in Asia-Pacific also suffered during the first half of 2020, with exports and imports in the region declining by 17.4% and 19.6%, respectively.
Source: OECD Digital Services Trade Restrictiveness Index database (accessed October 2020). Note: The DSTRI considers digital services to include services that can be supplied via electronic networks.

TRADE IN COMMERCIAL SERVICES OUTLOOK IN ASIA AND THE PACIFIC
ASIA-PACIFIC TRADE AND INVESTMENT TRENDS 2020/202119
Air transport services is expected to face the largest decline within the sector and – as with travel services – a bleak outlook for the remainder of the year. In fact, passenger flights are unlikely to pick up until mid-2021. In contrast, maritime transport appears to have already bounced back during the third quarter after a rough first half of the year. This is signalling a prospective recovery in the sector as well as in merchandise trade.
On the other hand, accelerated digitalisation is setting a solid path for commercial services trade in the longer term. Indeed, the use of digital technologies for the uninterrupted provision of goods and services during the COVID-19 crisis has proved to be pivotal. Furthermore, digitalisation is expected to redefine the nature of services trade in the region and globally. Expected trends in this regard involve shifting modes of service delivery in many sectors from in-person to online platforms, increasing businesses transition towards e-commerce, greater adoption of digital technology services and more outsourcing of services to reduce costs and maintain competitiveness in the fiercely competitive global trade environment. However, the more digitalisation increases its importance, the more important it is to address digital services trade barriers, which are currently on the rise.
These dynamics will put tremendous pressure on some developing economies, especially least developed countries (LDCs), since a majority of the populations in those economies remain unable to access the internet. In fact, only one in five people in LDCs use the internet, while more than 70% of people in certain ASEAN economies remain offline, leaving them unable to fully participate in the digital economy, with high-speed broadband being even more scarce (UNCTAD, 2020d; IMF, 2018). Most of those economies still have massive gaps in digital-tech infrastructure and human capital formation, which prevents them from connecting with the regional and global digital economy and utilizing digitalisation as a driver for sustainable development. Addressing these gaps as well as developing a conducive and harmonized digital-trade regulatory environment across the Asia-Pacific region and beyond, will need to be prioritized for the sustainable development goals to be achieved.

TRADE IN COMMERCIAL SERVICES OUTLOOK IN ASIA AND THE PACIFIC
ASIA-PACIFIC TRADE AND INVESTMENT TRENDS 2020/2021 20
Anukoonwattaka, W., M. Mikic and Y. Zhang (2017). Services and Global Value Chains: The Asia-Pacific Reality, Studies in Trade, Investment and Innovation, No. 89, ESCAP, Available at https://www.unescap.org/publications/services-and-global-value-chains-asia-pacific-reality-studies-trade-investment-and
Anukoonwattaka, W., M. Scagliusi and M. Mikic (2015). Servicification and industrial exports from Asia and the Pacific, ESCAP Trade Insights, No. 10. Available at https://www.unescap.org/resources/servicification-and-industrial-exports-asia-and-pacific-escap-trade-insights-issue-no10.
Baldwin, R. (2018). If this is Globalisation 4.0, what were the other three? VoxEU and CEPR. Available at https://voxeu.org/content/if-globalisation-40-what-were-other-three.
Cheung, M. (2020). Coronavirus’s impact on consumers and businesses in China, eMarketer, Available at https://www.emarketer.com/content/coronavirus-china-us-covid-19-impact-retail-travel.
Deloitte (2020). Global business services and shared services organizations moving forward – From pandemic to thriving. Available at https://www2.deloitte.com/content/dam/Deloitte/us/Documents/process-and-operations/us-covid-19-global-business-and-shared-services.pdf.
Dharmaraj, S. (2020). Philippine ICT Department proposes digital transformation budget. Available at https://opengovasia.com/philippine-ict-department-proposes-digital-transformation-budget/.
Dormido, H., B. Einhorn, S. Kwan, R. Frost, J. Sutherland and B. Scent (2019). Here’s how hard the protests are slamming Hong Kong’s economy. Bloomberg. Available at https://www.bloomberg.com/graphics/2019-hong-kong-protests-economic-impact/#:~:text=Ten%20straight%20weeks%20of%20anti,the%20U.S.%2DChina%20trade%20war.&text=Gross%20domestic%20product%20expanded%20just,recession%2C%20according%20to%20Bloomberg%20Economic.
Emmanuelli, C., N. Maechler, N, Jain, D. Malfara, S. Moritz, K. Neher, A. Nelson and A. Thomas (2020). Elevating customer experience excellence in the next normal. McKinsey & Company. Available at https://www.mckinsey.com/business-functions/operations/our-insights/elevating-customer-experience-excellence-in-the-next-normal.
References
TRADE IN COMMERCIAL SERVICES OUTLOOK IN ASIA AND THE PACIFIC
ASIA-PACIFIC TRADE AND INVESTMENT TRENDS 2020/202121
ESCAP (2019). Trade in goods outlook in Asia and the Pacific, 2019/2020. Available at https://www.unescap.org/resource-series/asia-pacific-trade-and-investment-trends.
______ (2020). Trade in goods outlook in Asia and the Pacific 2020/2021. Available at https://www.unescap.org/resource-series/asia-pacific-trade-and-investment--trends.
Ferenzc, J. (2019). The OECD Digital Services Trade Restrictiveness Index. OECD Trade Policy Papers, No. 221. Paris: OECD Publishing. Available at https://doi.org/10.1787/16ed2d78-en.
Gillson, I. and K. Muramatsu (2020). Health services trade and the COVID-19 pandemic. Trade and COVID-19 Guidance Note. Washington, D.C.: World Bank. Available at https://openknowledge.worldbank.org/bitstream/handle/10986/33716/Health-Services-Trade-and-the-COVID-19-Pandemic.pdf?sequence=1&isAllowed=y.
GlobalData (2020). Press releases, various issues. London: GlobalData. Available at https://www.globaldata.com/media/.
GWI (2020). GWI Coronavirus Research – Multi-market research wave 3. London: GlobalWebIndex. Available at https://www.globalwebindex.com/hubfs/1.%20Coronavirus%20Research%20PDFs/GWI%20coronavirus%20findings%20April%202020%20-%20Multi-market%20research%20(Release%209).pdf.
Hollinger, P., L. Abboud and A. Hancock (2020). European business braces for second wave. Financial Times, 9 October. Available at https://www.ft.com/content/67830b93-b4c9-4d8f-9032-d808d87cda38.
IATA (2020a). Industry losses to top $84 billion in 2020. Press Release No: 50. Geneva: International Air Transport Association. Available at https://www.iata.org/en/pressroom/pr/2020-06-09-01/.
______ (2020b). Recovery delayed as international travel remains locked down. Press Release No: 63. Geneva: International Air Transport Association. Available at https://www.iata.org/en/pressroom/pr/2020-07-28-02/.
ICAO (2020a). Operational impact on air transport. Flight among months including passengers – domestic & international. Available at https://data.icao.int/coVID-19/operational.htm.
______ (2020b). Airport revenue/losses by region of airports. Comparison of months 2019 vs. 2020. Available at https://data.icao.int/coVID-19/airports.htm.

TRADE IN COMMERCIAL SERVICES OUTLOOK IN ASIA AND THE PACIFIC
ASIA-PACIFIC TRADE AND INVESTMENT TRENDS 2020/2021 22
______ (2020c). Navigational charge losses by FIR regions and States. Comparison of months 2019 vs. 2020. Available at https://data.icao.int/coVID-19/ansp.htm.
______ (2020d). Active fleet comparisons by aircrafts types. Comparison of months 2019 vs. 2020. Available at https://data.icao.int/coVID-19/aircraft.htm. IDC (2020). IDC expects Asia/Pacific excluding Japan IT spending to decline by -1.3% in 2020 as COVID-19 continues to challenge markets. Singapore: International Data Corporation Asia/Pacific Pte Ltd. Available at https://www.idc.com/getdoc.jsp?containerId=prAP46309020.
IMF (2018). Chart of the Week: The Digital Divide in Asia. IMFBlog. Available at https://blogs.imf.org/2018/09/25/chart-of-the-week-the-digital-divide-in-asia-2/.
______ (2020). Navigating the pandemic: A multispeed recovery in Asia. Regional Economic Outlook, Asia and Pacific. Washington, D.C.: International Monetary Fund. Available at https://www.imf.org/en/Publications/REO/APAC/Issues/2020/10/21/regional-economic-outlook-apd.
ISL (2020). RWI/ISL Container Throughput Index: Revival of world trade continues. Bremen, Germany: Institute of Shipping Economics and Logistics. Available at https://www.isl.org/en/containerindex/july-2020.
Kala, R. R. (2020). COVID-19 lockdown boosts data demand: India’s data consumption on OTTs surges 947% between March to July. Financial Express. Available at https://www.financialexpress.com/industry/technology/covid-19-lockdown-boosts-data-demand-indias-data-consumption-on-otts-surges-947-between-march-to-july/2039148/.
Kapur, V. and A. Boulton (2020). Covid-19 accelerates the adoption of telemedicine in Asia-Pacific Countries. Singapore: Bain & Company. Available at https://www.bain.com/insights/covid-19-accelerates-the-adoption-of-telemedicine-in-asia-pacific-countries/.
Kilpatrick, J. and L. Barter (2020). COVID-19, managing supply chain risk and disruption. Deloitte Canada. Available at https://www2.deloitte.com/content/dam/Deloitte/ca/Documents/finance/Supply-Chain_POV_EN_FINAL-AODA.pdf.
Knowler, G. (2020a). Coronavirus impact raises red flags at European ports. Joc. Available at https://www.joc.com/port-news/coronavirus-impact-raises-red-flags-european-ports_20200219.html.

TRADE IN COMMERCIAL SERVICES OUTLOOK IN ASIA AND THE PACIFIC
ASIA-PACIFIC TRADE AND INVESTMENT TRENDS 2020/202123
______ (2020b). Asia–Europe trade records first volume growth of 2020. Joc. Available at https://www.joc.com/maritime-news/asia–europe-trade-records-first-volume-growth-2020_20200908.html.
Lacey, M., H. Lisachuk, A. Giannopoulos and A. Ogura (2015). Shipping smarter IoT opportunities in transport and logistics. Deloitte University Press. Available at https://www2.deloitte.com/content/dam/insights/us/articles/iot-in-shipping-industry/DUP1271_IoT_Transportation-and-Logistics_MASTER.pdf.
Lashitew, A., and A., Erumban (2020). Could services drive globalization in the post-COVID-19 world? Brookings. Available at https://www.brookings.edu/blog/future-development/2020/06/17/could-services-drive-globalization-in-the-post-covid-19-world/.
Loh, D. (2020). Coronavirus pandemic fuels Asia e-commerce boom. Singapore: Nikkei Asia. Available at https://asia.nikkei.com/Business/Retail/Coronavirus-pandemic-fuels-Asia-e-commerce-boom.
OECD (2018). Economic Outlook for Southeast Asia, China and India: Fostering Growth Through Digitalisation. Paris: OECD Publishing. Available at https://www.oecd.org/dev/SAEO2018_Preliminary_version.pdf.
______ (2020a). Services exported together with goods. OECD Trade Policy Papers, No. 236. Paris: OECD Publishing. Available at https://doi.org/10.1787/275e520a-en.
______(2020b). Understanding digital transformation, n Going Digital: Shaping Policies, Improving Lives. Paris: OECD Publishing. Available at https://www.oecd-ilibrary.org/sites/58ee7fe5-en/index.html?itemId=/content/component/58ee7fe5-en.
______ (2020c). Leveraging digital trade to fight the consequences of COVID-19. Available at https://www.oecd.org/coronavirus/policy-responses/leveraging-digital-trade-to-fight-the-consequences-of-covid-19-f712f404/.
Park, K. and Bloomberg (2020). Medicine, phones and strawberries: As passengers drop 90%, desperate airlines convert to cargo to stay afloat. Fortune. Available at https://fortune.com/2020/03/26/passengers-drop-desperate-airlines-cargo-coronavirus/.
SES (2020). Managing Network Capacity Amid Surging Demand in Asia-Pacific. Available at https://www.ses.com/managing-network-capacity-amid-surging-demand-asia-pacific.

TRADE IN COMMERCIAL SERVICES OUTLOOK IN ASIA AND THE PACIFIC
ASIA-PACIFIC TRADE AND INVESTMENT TRENDS 2020/2021 24
Techsauce (2020). dtac plans for network traffic surge amid COVID-19 outbreak. Bangkok:Techsauce. Available at https://techsauce.co/en/pr-news/dtac-work-from-home-covid-19.
UNCTAD (2018). Review of Maritime Transport 2018. UNCTAD/RMT/2018. Geneva: United Nations Conference on Trade and Development. Available at https://unctad.org/system/files/official-document/rmt2018_en.pdf.
______ (2020a). International Trade in Services 2020, Quarter 1. Available at https://unctad.org/system/files/official-document/gdsdsimisc2020d5_en.pdf.
______ (2020b). COVID-19: Shipping data hints to some recovery in global trade. Geneva: United Nations Conference on Trade and Development. Available at https://unctad.org/en/pages/newsdetails.aspx?OriginalVersionID=2466.
______ (2020c). Navigating through the coronavirus crisis and uncertainty: How maritime transport data can help. Geneva: United Nations Conference on Trade and Development. Available at https://unctad.org/en/pages/newsdetails.aspx?OriginalVersionID=2465.
______ (2020d). The Covid-19 crisis: Accentuating the need to bridge digital divides. Geneva: United Nations Conference on Trade and Development. Available at https://unctad.org/en/PublicationsLibrary/dtlinf2020d1_en.pdf.
______ (2020e). Cambodia’s digital startups help blunt economic impact of COVID-19. Geneva: United Nations Conference on Trade and Development. Available at https://unctad.org/news/cambodias-digital-startups-help-blunt-economic-impact-covid-19.
UNDESA (2020). World economic situation and prospects: September 2020 Briefing, No. 141. New York: United Nations Department of Economic and Social Affairs. Available at https://www.un.org/development/desa/dpad/publication/world-economic-situation-and-prospects-september-2020-briefing-no-141/.
UNWTO (2020a). International tourist numbers could fall 60-80% in 2020. Madrid: United Nations World Tourism Organization. Available at https://www.unwto.org/news/covid-19-international-tourist-numbers-could-fall-60-80-in-2020. ______ (2020b). World Tourism Barometer, vol. 18, No. 6., 6 October 2020. Madrid: United Nations World Tourism Organization. Available at https://www.e-unwto.org/doi/epdf/10.18111/wtobarometereng.2020.18.1.6.

TRADE IN COMMERCIAL SERVICES OUTLOOK IN ASIA AND THE PACIFIC
ASIA-PACIFIC TRADE AND INVESTMENT TRENDS 2020/202125
______ (2020c). COVID-19 Related Travel Restrictions: A Global Review for Tourism. Madrid: United Nations World Tourism Organization. Available at https://webunwto.s3.eu-west-1.amazonaws.com/s3fs-public/2020-09/200909-travel-restrictions.pdf.
Waring, J. (2020). Gaming surge drives Tencent growth, Mobile World Live. Available at https://www.mobileworldlive.com/asia/asia-news/gaming-surge-drives-tencent-growth.
WTO (2020a). World Trade Statistical Review 2020. Geneva: World Trade Organization. Available at https://www.wto.org/english/res_e/statis_e/wts2020_e/wts20_toc_e.htm.
______ (2020b). Services Trade Barometer. Geneva: World Trade Organization. Available at https://www.wto.org/english/news_e/news19_e/wtoi_12sep19_e.pdf.
______(2020c). Latest trends, December 2020. Available at https://www.wto.org/english/res_e/statis_e/latest_trends_e.htm.
Online databases
OECD Digital Services Trade Restrictiveness Index (DSTRI). Available at https://stats.oecd.org/Index.aspx?DataSetCode=STRI_DIGITAL.
OECD Services Trade Restrictiveness Index (STRI) database. Available at https://stats.oecd.org/Index.aspx?DataSetCode=STRI.
OECD Trade in value-added (TiVA) database. Available at http://www.oecd.org/sti/ind/measuring-trade-in-value-added.htm.
UNWTO Global Tourism Dashboard. Available at https://www.unwto.org/unwto-tourism-dashboard.
World Bank Integrated Trade Solution (WITS) database. Available at https://wits.worldbank.org/.
World Trade Organization databases. Available at https://data.wto.org/.
TRADE IN COMMERCIAL SERVICES OUTLOOK IN ASIA AND THE PACIFIC
ASIA-PACIFIC TRADE AND INVESTMENT TRENDS 2020/2021 26
Supplementary note
Structure and patterns of trade in Asia and the Pacific (2019)
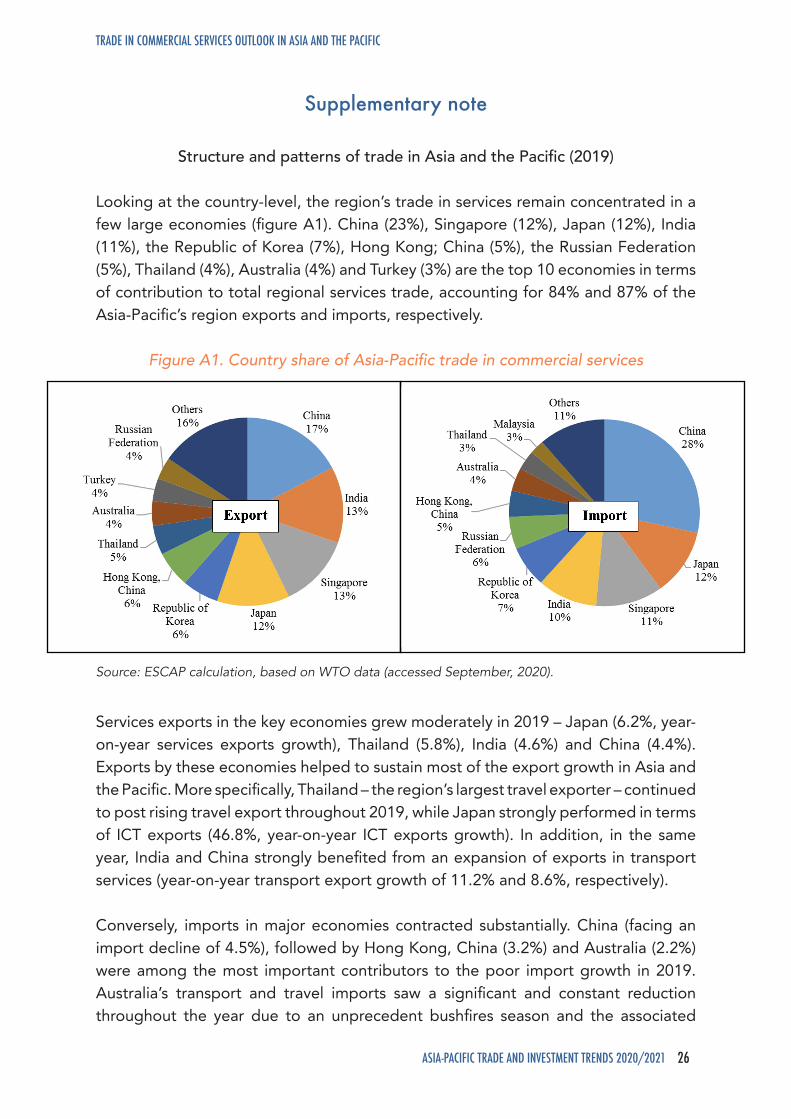
Looking at the country-level, the region’s trade in services remain concentrated in a few large economies (figure A1). China (23%), Singapore (12%), Japan (12%), India (11%), the Republic of Korea (7%), Hong Kong; China (5%), the Russian Federation (5%), Thailand (4%), Australia (4%) and Turkey (3%) are the top 10 economies in terms of contribution to total regional services trade, accounting for 84% and 87% of the Asia-Pacific’s region exports and imports, respectively.
Figure A1. Country share of Asia-Pacific trade in commercial services
Source: ESCAP calculation, based on WTO data (accessed September, 2020).
Services exports in the key economies grew moderately in 2019 – Japan (6.2%, year-on-year services exports growth), Thailand (5.8%), India (4.6%) and China (4.4%). Exports by these economies helped to sustain most of the export growth in Asia and the Pacific. More specifically, Thailand – the region’s largest travel exporter – continued to post rising travel export throughout 2019, while Japan strongly performed in terms of ICT exports (46.8%, year-on-year ICT exports growth). In addition, in the same year, India and China strongly benefited from an expansion of exports in transport services (year-on-year transport export growth of 11.2% and 8.6%, respectively).
Conversely, imports in major economies contracted substantially. China (facing an import decline of 4.5%), followed by Hong Kong, China (3.2%) and Australia (2.2%) were among the most important contributors to the poor import growth in 2019. Australia’s transport and travel imports saw a significant and constant reduction throughout the year due to an unprecedent bushfires season and the associated

TRADE IN COMMERCIAL SERVICES OUTLOOK IN ASIA AND THE PACIFIC
ASIA-PACIFIC TRADE AND INVESTMENT TRENDS 2020/202127
limitation in goods and people movements. The performance of China and Hong Kong, China mainly reflected the negative impacts of the Sino-American trade war and Hong Kong, China’s political turbulence on the travel sector (-8.3%, year-on-year travel imports growth) (Dormido et al., 2019).
Sector-wise, the transport and travel industries continued to play the most important role in terms of services trade contribution: 52% of all the Asia-Pacific region’s services trade refer to these two sectors alone (figure A2). In 2019, export growth was driven by ICT services (10.1% annual exports growth). On the other hand, the significant import slowdown in travel services and transport services, declining 3.6% and 3.3%, respectively, were the main contributors to import contraction in 2019.
The continued commercial services trade deceleration in Asia and the Pacific – particularly the import contraction – contributed to a moderate fall in the region’s share of global services trade. While the region’s global export participation remained stable at 27.7%, the region’s share in global services imports declined from 32.6% in 2018 to 31.5% in 2019. Due to the moderate growth of exports and significant contraction of imports, the region’s service trade balance improved. The region registered the lowest trade deficit since 2011 at US$119.4 billion in 2019. Nonetheless, the region still remains a net importer of commercial services and is placed as the second-largest exporter of services in contrast to its top position in global merchandise exports. Indeed, the region lags significantly behind Europe in terms of its contribution to global service exports; in 2019, Europe accounted for 47.3% of global services exports while the equivalent figure for the Asia-Pacific region was only 28.8%.
During the same period, the Asia-Pacific region also registered a higher level of restrictiveness compared to the rest of world in relation to services trade, highlighting the region’s preference for protecting its service industries from foreign competition (box A1). This approach has likely compromised the region’s ability to compete in global services exports, due to domestic firms being sheltered from conforming to global standards of operational efficiency. Therefore, these findings imply there is room for improvement by reducing regulatory barriers in order to enhance the region’s services trade share, which still lags behind the global average.

TRADE IN COMMERCIAL SERVICES OUTLOOK IN ASIA AND THE PACIFIC
ASIA-PACIFIC TRADE AND INVESTMENT TRENDS 2020/2021 28
Figure A2. Trade value by services sector and trade growth
Source: ESCAP calculation, based on WTO data (accessed September, 2020).
Box A1. Comparing services trade restrictiveness in Asia-Pacific with the rest of the world
Trade in services is also not immune to barriers, but the nature of those barriers can be different from those affecting trade in goods. One distinguishing feature of the trade in services is that it is predominantly affected by “behind the border” measures, which come from domestic regulations not necessarily related to trade policies. The OECD Services Trade Restrictiveness Index (STRI) provides data for 11 economies in the region up to 2019. The index evaluates five categories that hinder trade: (1) barriers to competition and public ownership; (2) regulatory transparency and administrative requirements; (3) restrictions on foreign ownership and other market entry conditions; (4) restrictions on the movement of people; and (5) other discriminatory measures and international standards. These categories are evaluated across 22 services sectors in 46 economies globally (11 of them in Asia and the Pacific). The STRI index is defined over 0 and 1, where 1 is most restrictive and 0 is least restrictive.
On that basis, the Asia-Pacific region’s services trade restrictiveness (overall score 0.36) is significantly higher than that of the rest of the world (0.24) (figure A3). Overall,

TRADE IN COMMERCIAL SERVICES OUTLOOK IN ASIA AND THE PACIFIC
ASIA-PACIFIC TRADE AND INVESTMENT TRENDS 2020/202129
this implies that there is room for reducing regulatory barriers to enhance the region’s services trade share, which still lags behind the global average.
Figure A3. Services trade restrictiveness index, Asia-Pacific region and globally, 2019
Source: ESCAP calculation, based on the OECD Services Trade Restrictiveness Index dataset (accessed October 2020).
Encouragingly, on average since 2014, the STRI score in Asia and the Pacific across all sectors has decreased by 2.41%, whereas in economies outside the Asia-Pacific region it has increased by 0.11% (figure A4). The decrease in restrictiveness has been mainly driven by regulatory transparency (a 10.3% decrease in Asia and the Pacific) and barriers to competition (an 8.4% decrease in Asia and the Pacific). The other discriminatory measures subcategory, however, saw the largest increase in restrictiveness in the region, increasing by 6.1%. Services sectors in the Asia-Pacific region that saw the highest reductions in restrictiveness include ‘sound recording’ (8.1% decrease), ‘motion pictures’ (7.0% decrease), and ‘engineering’ (6.6% decrease).
Figure A4. Average services trade restrictiveness change for all sectors, between 2014 and 2019, in the Asia-Pacific region and the rest of the world
Source: ESCAP calculation, based on the OECD Services Trade Restrictiveness Index dataset (accessed October 2020).