International Trade in Motion Picture Services Gordon H. Hanson University of California, San Diego and National Bureau of Economic Research Chong Xiang Purdue University January 2008 Abstract . In this paper, we present data on U.S. trade in motion pictures and examine the determinants of U.S. motion-picture exports to Europe. Publicly available data on trade flows in motion pictures, and other information services, appear to be of dubious quality. In Europe, U.N. Comtrade data on motion-picture trade vastly understate box office revenues earned by foreign films compiled from private industry sources. The motion picture industry is an attractive case to study because bilateral trade in the industry is easily measured at the point of consumption (movie cinemas, video rental stores, pay-TV operators). In European countries, U.S. movies account for 70% of box-office revenues, with the remaining share divided between domestic and non-U.S. foreign films. We use data from Screendigest.com to estimate a modified gravity model for trade in motion- picture services, the results for which indicate how market size and trade costs affect trade in the industry.
Transcript
International Trade in Motion Picture Services
Gordon H. Hanson University of California, San Diego
and National Bureau of Economic Research
Chong Xiang Purdue University
January 2008
Abstract. In this paper, we present data on U.S. trade in motion pictures and examine the determinants of U.S. motion-picture exports to Europe. Publicly available data on trade flows in motion pictures, and other information services, appear to be of dubious quality. In Europe, U.N. Comtrade data on motion-picture trade vastly understate box office revenues earned by foreign films compiled from private industry sources. The motion picture industry is an attractive case to study because bilateral trade in the industry is easily measured at the point of consumption (movie cinemas, video rental stores, pay-TV operators). In European countries, U.S. movies account for 70% of box-office revenues, with the remaining share divided between domestic and non-U.S. foreign films. We use data from Screendigest.com to estimate a modified gravity model for trade in motion-picture services, the results for which indicate how market size and trade costs affect trade in the industry.
1
1. Introduction
In the last dozen years, empirical research in international trade has blossomed.
There are now extensive bodies of work on testing the Heckscher-Ohlin trade model
(Davis and Weinstein, 2002), examining the impact of globalization on wages and
productivity (Feenstra and Hanson, 2002; Tybout, 2002), and estimating how trade flows
respond to trade costs (Anderson and van Wincoop, 2004), among other topics. These
strands of literature, however, are almost entirely about international trade in
manufactures. Due in part to a paucity of data on service trade flows, relatively few
papers address international trade in services (e.g., Freund and Weinhold, 2002, Amiti
and Wei, 2005, and Marvasti and Canterberry, 2005). Indicatively, Feenstra’s (2004)
recent graduate text on international trade includes no references to research on trade
involving service industries.
Yet, for the United States and other advanced countries it is services in which
their export strength increasingly lies. The 2004 Economic Report of the President touts
information services (internet publishing and service provision, motion pictures, printed
media, radio and TV programming, software, sound recordings, telecommunications) and
professional services (accounting, advertising, architecture, consulting, engineering, law,
R&D services) as sectors with the highest recent growth in U.S. net exports. In 2002,
U.S. exports and foreign sales of information services were $90 billion, relative to total
service exports of $295 billion and manufacturing exports of $627 billion (Siwek, 2004).
In 2003, information services were 5% of U.S. GDP (relative to 14% for manufacturing),
and exports of U.S. motion pictures accounted for 73% of box-office revenues in Europe
(Siwek, 2005).
2
Why are services such an important part of the U.S. tradables production? One
possibility is that the U.S. has a comparative advantage in tradable services, due to the
country’s abundant supply of workers (either native or foreign born) with advanced
degrees (computer scientists, engineers, lawyers, MBAs) or specialized skills (actors,
musicians, recording technicians, screenwriters), which information and professional
services use intensively. Reductions in trade costs – associated with improvements in
information technology or falling cultural barriers to trade – may have accentuated the
U.S. comparative advantage in services. A second possibility is that scale economies
may give service providers an incentive to locate in the large U.S. market (Rauch and
Trindade, 2006). For many information services, average costs decline sharply in output.
Where these services are provided in a specific language or cultural context, large
markets may be the optimal site for global production (Krugman, 1980; Helpman and
Krugman, 1985). So far, empirical literature has found evidence that large markets affect
trade only in manufacturing (Feenstra, Markusen, and Rose, 1998; Davis and Weinstein,
1999 and 2003; Head and Ries, 2001; Hanson and Xiang, 2004).
In this paper, we present data on U.S. trade in motion pictures and examine the
determinants of U.S. motion-picture exports using a modified version of the gravity
model. Our focus on motion pictures is warranted by the importance of information
services to the U.S. economy and their role in current debates about trade policy.
Information services embody large amounts of intellectual property, whose accumulation
appears to be important for economic growth but whose ownership rights are often
difficult to enforce across national borders (McCalman, 2004). Beyond the threat of
3
piracy, many governments aggressively restrict imports of motion pictures and sound
recordings, ostensibly to preserve domestic production of cultural goods (Janeba, 2004).
In section 2, we derive a gravity model of trade in which a country’s imports of
U.S. motion-picture services relative to its expenditure on domestically produced motion-
picture services depends on the country’s size relative to the U.S., proximity to the U.S.
in terms of geography and culture, and other trade costs. We measure cultural trade costs
using indicators of linguistic distance between countries in Dyen et al. (1992), Melitz
(2002), and Chiswick and Miller (2004), and policy trade barriers using data on the
motion-picture industry collected in Marvasti et al. (2005).
Given limited public data, empirical research on trade in services requires one to
assemble information from private sources. In section 3, we describe available data on
U.S. exports of motion pictures. The publicly available data on motion-picture trade
flows appear to be of dubious quality.1 The U.N. Comtrade database reports trade in
motion pictures in terms of the value of cinematographic film exposed or developed,
which is a commodity rather than a service. Importers appear to have considerable
discretion in reporting the value of physical film prints, as Comtrade trade flows are up to
two orders of magnitude smaller than foreign box office revenues for U.S. films compiled
by Screendigest.com, a private industry source. What makes motion pictures an
attractive case to study is that bilateral trade in the industry is easily measured at the point
of consumption (movie cinemas, video rental stores, pay-TV operators), which facilitates
their collection by private consultancies. We use data from Screendigest.com, as
reported in Hancock and Jones (2003), to estimate a gravity model of trade for the
1 The difficultly of measuring economic activity in services has been studied in much other work. On measurement issues related to services, see Hooper and Richardson (1991), Griliches (1992), Baldwin, Lipsey and Richardson (1998), and Berndt and Hulten (2007).
4
motion-picture industry, the results for which we report in section 4. The estimates
indicate how market size and trade costs affect trade in motion pictures.
Though information services are among the most dynamic sectors in the U.S.
economy, they have been the subject of little research by international economists. Key
to new research efforts will be the collection of data on service trade flows. Since service
trade rarely passes through ports, airports, or land borders, it is difficult to detect using
standard government methods for measuring imports and exports. A further problem is
that the channels through which firms export or import services change continually over
time. In the early 1990s, most foreign revenue on U.S. motion pictures was generated at
the box office. By the late 1990s, videos, DVDs, and pay-TV had become important
sources of foreign film distribution. Going forward, the internet may become the
dominant mode for film distribution. Given rapid change in the distribution of services,
and the slow speed with which government data collection strategies tend to change,
private-industry sources are likely to be the most useful data source for research on trade
in services in the near term.
2. Trade Theory and Trade in Information Services
We base our model of information services on Hanson and Xiang (2004), which
extends the monopolistic-competition model of trade (e.g., Helpman and Krugman, 1985)
to a continuum of industries. The setup has a large country and a small country, each
with one production factor, labor (though the extension to a many-factor setting is
straightforward). There are many industries, some of which are information services
(movies, music) and others of which are manufactures (cars, clothes). Production of each
5
good or service is subject to increasing returns to scale. Consumers have identical Cobb-
Douglas preferences. Each industry consists of many Dixit-Stiglitz-type varieties (action
movies, comedies), the number of which is endogenous. For industry m, let nm denote
the number of varieties and σm denote the elasticity of substitution between varieties,
where σm > 1. Each manufacturing industry is subject to an iceberg transport cost, τm>1.
Information services are subject to a cultural discount and perhaps a policy trade
barrier (in the form of a tariff or quantity restriction). For a consumer, one unit of a
domestic service brings as much satisfaction as 1/δ units of a foreign service, where 0 < δ
< 1. We expect δ to be higher the more similar are two countries’ culture and language.
Domestic and foreign varieties of an information service are symmetric in consumption.
For each information service i, σi > 1 is the elasticity of substitution between varieties.
Given increasing returns to scale and CES preferences, in equilibrium each
service firm and each manufacturing firm is monopolistically competitive and sets a price
that is a constant markup over marginal cost. Prices for a given variety of a good or
service produced in a given country vary across destination markets according to trade
costs.
Based on this framework, let Siuk and Sikk be total sales of information service i by
country u (the United States) to country k and by country k to itself. Exploiting the CES
structure of preferences, we obtain the following expression for relative sales:
( ) ( ) ( )11 1
1 11
( / )( / )
ii ii i
i
ik iu iuk iuk ikiuk iu iuiuk iuk
ikk ik ikik ik ikk ik
E n p PS n w tS n wE n p P
σσ σσ σ
σ
δδ
−− −− −
−
⎛ ⎞= = ⎜ ⎟
⎝ ⎠, (1)
where Eik is expenditure by country k on service i, Pik the CES price index in country k
for service i, and piuk is the delivered price (including customs, insurance, and freight
6
charges) in country k of service i produced by country u, wiu is marginal production cost
in service i and country u, and tiuk is the ad valorem trade cost on exports from country u
to country k. The second equality follows from solving for price in terms of marginal
cost. Expressing sales in relative terms removes the CES price index and domestic
expenditure from the expression, as shown in the second equality. In the estimation, we
will associate the cultural discount (δiuk) with linguistic distance and ad valorem trade
costs (tiuk) with geographic distance, import tariffs, and other policy trade barriers.
One can implement (1) empirically by taking a first-order Taylor approximation
of the equation that determines the relative number of product varieties produced in the
two countries, the derivation of which we do not show in the informal discussion in this
paper. For information services, the relative number of product varieties is increasing in
relative country size, given certain assumptions. Thus, we can replace the relative
number of varieties in (1) with a measure of relative country size, Yu/Yk.
The main empirical exercise is to estimate the effect of market size and the effects
of trade costs on information services, using the following specification:
where u is the United States, k is the importing country, Yu/Yk is the relative size of
countries u and k, GDuk is geographic distance between u and k, LDuk is linguistic
distance between u and k, Tluk is k’s ad valorem tariff on imports of product i from
country u, Wu/Wk is relative production costs in countries u and k, and εiuk is a disturbance
term associated with unobserved trade costs between country pair uk. Again, by
examining relative sales of U.S. and domestic films, we remove expenditure on motion
pictures as a determinant of trade flows in (2). In theory, the only role that relative
7
country size plays in determining relative sales is through its impact on the relative size
of the motion-picture industry in the two countries. A positive coefficient on relative
income would indicate that large countries are a relatively attractive site for motion-
picture production.
In estimating (2), we confront several important econometric and measurement
issues. These include measuring cultural trade costs and policy trade barriers, allowing
for the endogeneity of policy trade barriers, and incorporating the threat of piracy as a
source of trade frictions. Each of these is an important issue. In this paper, we will focus
on the first problem of measuring trade costs and leave accounting for their endogeneity
to future work. The empirical exercise in this paper should be seen as a preliminary
exploration of whether trade in information services obeys the laws of gravity.
3. Data and Empirical Application
In this section, we present data on international trade on motion pictures. We
begin by discussing relevant previous research on the motion-picture industry, proceed to
examine data sources on international trade in motion-picture services and on trade costs
that may be relevant for motion pictures, and conclude by using data from private
industry sources to describe U.S. exports of motion pictures to Europe.
3.1 Previous Literature on Trade in Motion Pictures
What has previous research discovered about trade in motion pictures? There
appears to be tremendous heterogeneity in the performance of movies. De Vany and
Walls (1999, 2004) and Walls (2005) find that the distributions of production cost, box-
office revenue and profits (box-office revenue minus production cost) have heavy right
8
tails. For example, the mean of production costs is the 62nd percentile of the distribution,
the mean of box-office revenues is the 71st percentile, and 78% of movies lose money
while 6% of movies account for 80% of total profits. Perhaps in response to the
uncertainty in movie revenues, Goettler and Leslie (2005) find that studios are more
likely to co-finance movies that account for a large fraction of their total annual
production budget. De Vany and Eckert (1991) and De Vany and Walls (1996)
emphasize that the difficulties with forecasting movie demand necessitate the use of
short-term, contingent contracts between distributors and exhibitors. Filson et al. (2005)
argue that these contracts have evolved to help distributors and exhibitors share risks and
overcome measurement problems, rather than to resolve information problems.
The attraction of individual films to consumers appears to be short-lived. De
Vany and Walls (1999) show that movies earn 66% of their box-office revenues during
their first 3 weeks of showing. De Vany and Walls (1997) show that a movie has less
than a 25% chance of lasting 7 weeks or more in the top-50 chart and less than a 15%
chance of lasting 10 weeks or more. In a similar vein, Elberse and Eliashberg (2003) find
that the U.S. movies with stronger domestic market performance tend to have higher
opening-week box-office revenues when they are released in the foreign markets (where
this correlation becomes weaker the longer the time lag between the movies’ U.S.
releases and foreign releases).
There is increasing interest in the protection of intellectual property in motion
pictures, either domestically or internationally. Byers et al. (2004) study successful
movie downloads from peer-to-peer file sharing networks. Of the successful downloads,
60% appeared on the peer-to-peer networks prior to the movies’ DVD release dates. Of
9
the movies that had been released on DVD as of the time of their study, only 5% first
appeared after their DVD release date on a network. Together, these facts suggest
consumer DVD copying is minor compared with insider leaks of DVDs. Turning to
trade, McCalman (2004) finds that while Hollywood studios are more likely to use
licensing in countries with moderate protection of intellectual property rights (IPR), they
tend to use more integrated governance structures in countries with both high and low
IPR protection. McCalman (2005) finds that while moderate IPR protection encourages
the spread of U.S. movies, either very weak or very strong IPR protections decrease the
speed with which U.S. movies are released abroad.
3.2 Data on Trade in Motion-Picture Services
Data on international trade in motion pictures or other information services are
very difficult to obtain. The U.S. Bureau of Economic Analysis (BEA) publishes limited
bilateral trade flows for the film industry. BEA surveys of U.S. multinational firms
provide some industry data on service trade flows (Kozlow and Borga, 2004), but only
for U.S. parent firms that own subsidiaries located abroad. The BEA Quarterly Survey of
Transactions in Selected Services and Intangible Assets with Foreign Persons does give
data on foreign receipts from film and television tape rentals, but does not list data on
foreign box-office revenues earned by U.S. motion pictures.
The U.N.’s Comtrade lists motion-picture trade as a commodity, Cinematographic
Film Exposed or Developed (SITC 883), which is the reported value of physical
shipments of exposed film across borders. The value of physical film shipments appears
to vastly understate film revenues. For instance, Comtrade reports 2000 U.S. exposed
film exports of $0.5 million to France, $0.5 million to Germany, and $6.5 million to the
10
U.K., while Screendigest.com reports 2000 box-office revenues for U.S. films of $513
million in France, $615 million in Germany, and $429 million in the U.K. (Hancock and
Jones, 2003).
We evaluate the demand for U.S. films, other foreign films, and domestically
made films using data on box-office revenues by country and year. Box-office revenues
are equivalent to the c.i.f. (customs, insurance, freight) value of motion-picture services
consumed in cinemas, plus retail markups. These revenues include import duties,
transport costs, and other trade costs incurred in delivering the service to the consumer, as
well as sales taxes and exhibition fees collected by cinemas. Box-office revenues are
consistent with the trade-cost-inclusive measure of sales in (1). Individuals may consume
motion-picture services through cinemas (for new movie releases) or through video
rentals, video purchases, or pay TV (for previous movie releases).2 Distributors tend to
release movies to cinemas first and to retail outlets and pay-TV operators later in time,
suggesting for a given film these services do not compete contemporaneously. Recently,
studios have experimented with releasing films in the U.S. market in cinemas and in
video format simultaneously, but this practice appears to be rare in foreign markets. As
of yet, the provision of motion-picture services through the internet accounts for a very
small share of global film revenues. In this paper, we limit our analysis to motion-picture
revenues earned through cinema exhibition (box-office revenues).
Data on box-office revenues for the period 1995-2004 are available from
Screendigest.com. For this paper, we use data on cinema exhibition and distribution in
19 European countries from Hancock and Jones (2003). In each country and year,
2 Data on DVD/video sales and rentals are very difficult to get. For example, Screendigest.com charges £5,000 for access to its Video and DVD Global Intelligence database. We are still in the process of acquiring such data.
11
Screendigest.com reports the number of films screened, total film attendance, and total
box-office revenues for films imported from the United States, films imported from other
major producing countries, and films produced domestically. The company also reports
attendance and revenue for each of the 10 top-grossing films by country and year and
other national market data. Screendigest.com compiles these data from government
agencies, national film bodies, film exhibitor and distributor associations, and company
spokespeople.
An important issue in using data on box-office revenues is how to classify the
nationality of a motion picture. Screendigest.com defines the origin country for a film by
the location of the company that produces the film. Production companies (e.g., 20th
Century Fox in the United States) oversee the writing or purchase of screenplays and
musical scores; casting; costume and set design; animation, filming, sound recording, and
editing; marketing and distribution; and financing.3
To consider how data on trade in motion pictures from Comtrade and
Screendigest.com compare, Figure 1a plots the value of total film imports reported by
Comtrade and box-office revenues for foreign films reported by Screendigest.com for 19
European countries for the period 1992-2002; Figure 1b shows a similar plot for film
imports from the United States and box-office revenues for U.S. films in Europe. For
either total imports or imports from the United States, box-office revenues greatly exceed
film imports reported by Comtrade. The magnitude of the differences are perhaps more
apparent in Table 1, which shows the Comtrade value of film imports and the
Screendigest.com value of box-office revenues for foreign films, by year for Europe.
3 Independent exhibition companies tend to oversee the screening of movies to consumers in destination markets.
12
Over the sample period, the average ratio of the former to the latter is 46.2. Table 2
shows averages over 1992-2002 by country for Comtrade film imports and
Screendigest.com foreign film box-office revenues. There appears to be little systematic
relationship between the two series. Over the sample period, the average ratio of box-
office revenues to film imports varies from a low of 20.7 in Austria to a high of 155.8 in
Italy. It appears that Comtrade data on film imports (at least for Europe) give no
meaningful indication of foreign sales of motion-picture services.
3.3 U.S. Exports of Motion Pictures
The data we use for our analysis is from Hancock and Jones (2003), which gives
information on U.S. exports of motion pictures to Europe. While the United States is by
far and away the dominant player in the European film industry, there is substantial
variation across countries in the share of the market held by U.S. studios. It is this
variation that we exploit in the gravity estimation in the following section.
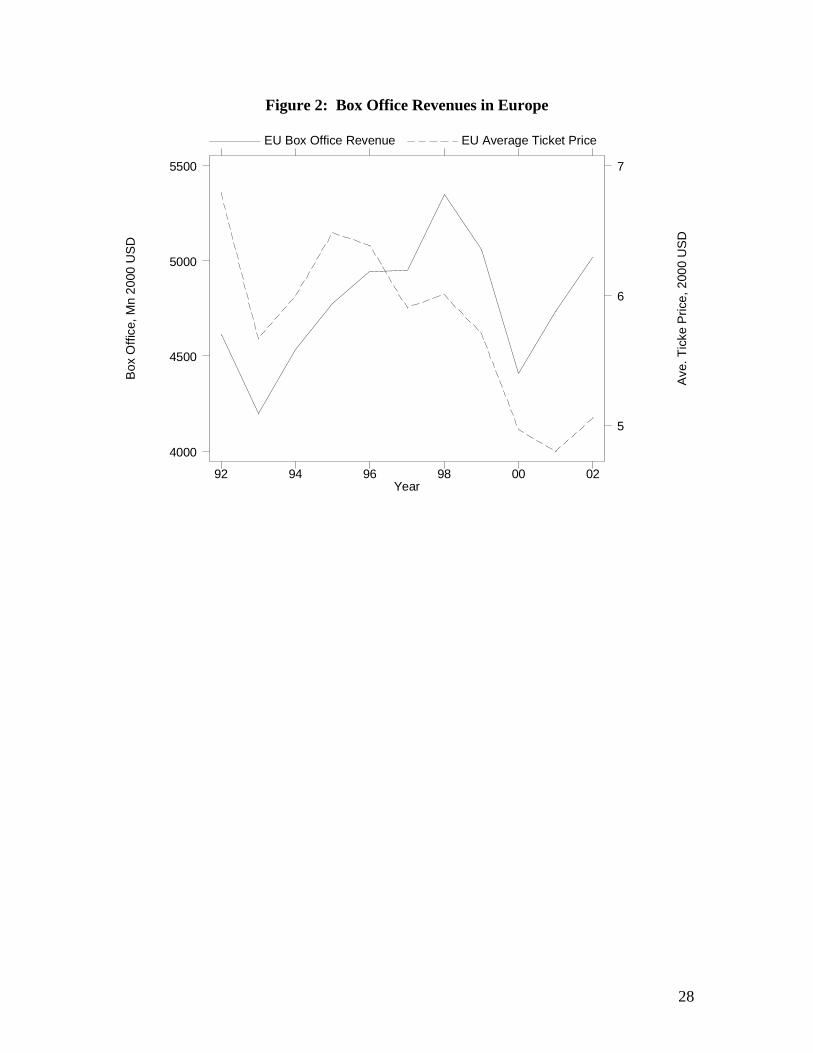
Figure 2 shows total box-office revenues and average ticket prices in the 19
European countries. Revenues grow modestly over the sample period, showing
considerable volatility. The surge in revenues in 1998 is associated with the movie,
Titanic, which at the time was the highest grossing movie in history. Ticket prices fall
over the sample period, due in part to a rising share in European film revenues of lower-
priced markets in central and eastern Europe. The importance of high-grossing films is
further evident in Figure 3, which shows the share of the top-10 films in total box-office
revenues. The top-10 share fluctuates considerably, reaching its height in 1998 with
Titanic, with an average of the period of 0.48.
13
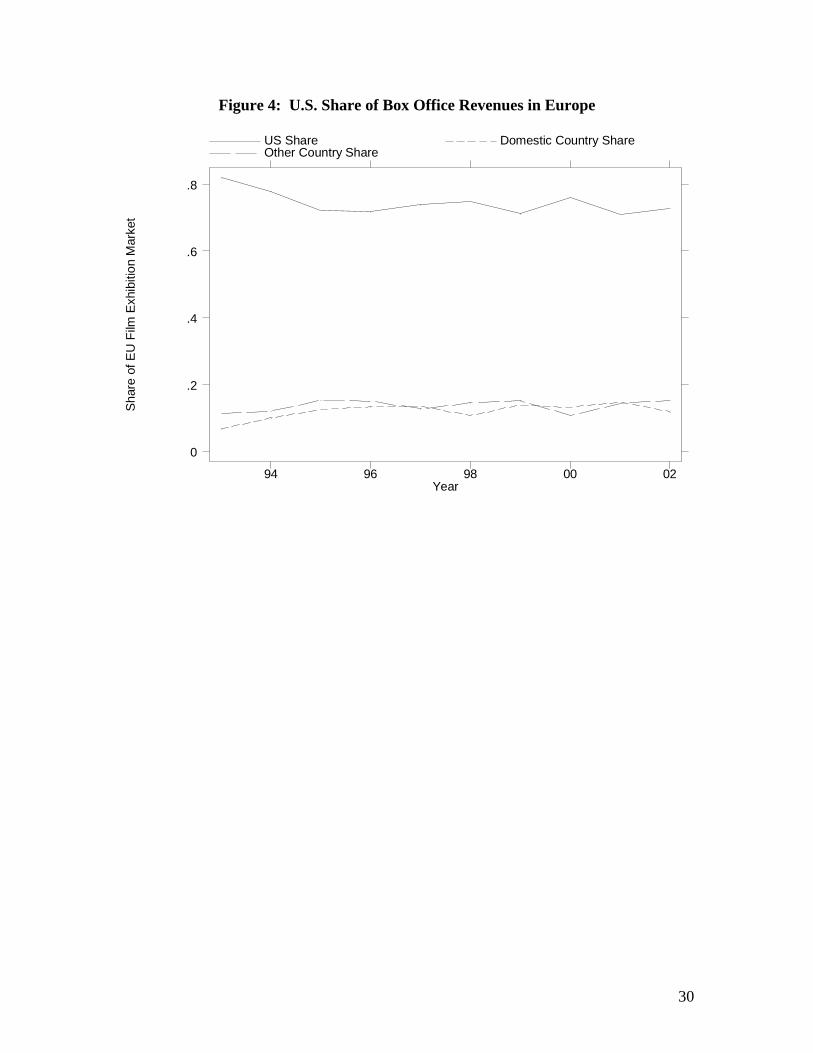
For Europe as a whole, the United States is the most important source of motion
pictures. Figure 4 shows the share of box-office revenues of U.S. films, domestically
made films, and other foreign films. Over the sample period, the U.S. revenue share
averages 0.69 and is quite stable. Revenue shares for domestic films and films from third
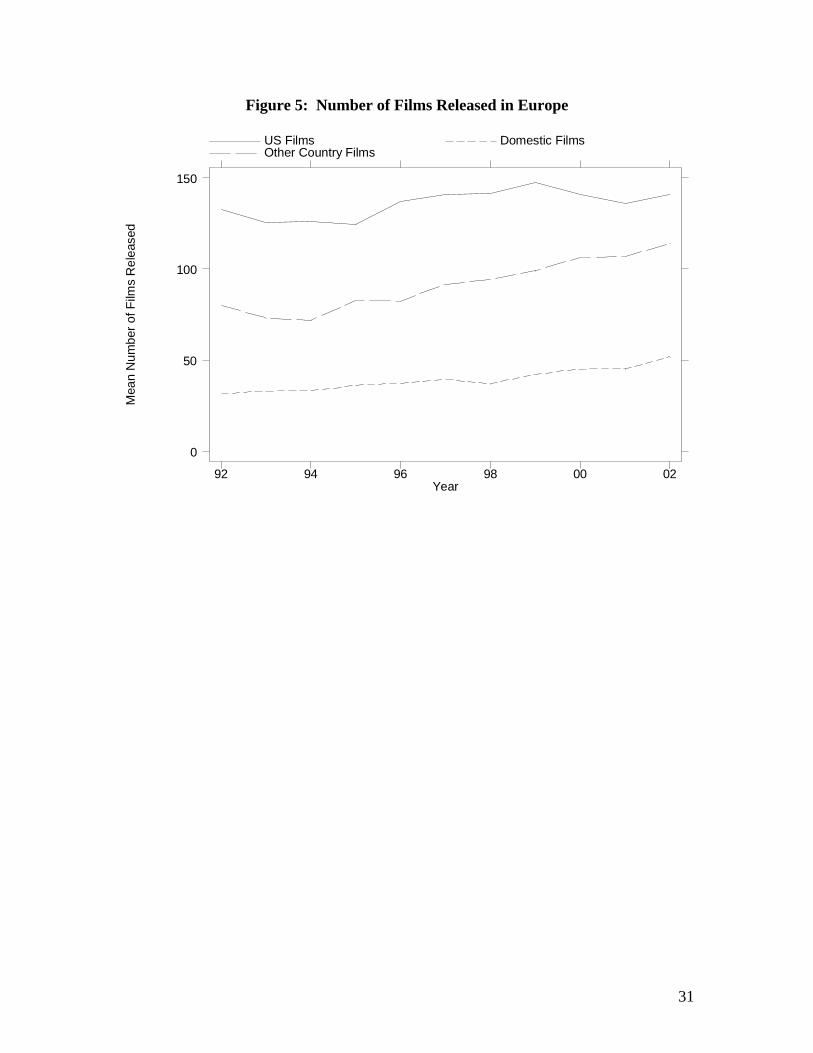
countries are roughly equal. The dominance of U.S. studios is due largely to a relatively
small number of high-grossing films. This is seen in Figure 5, which shows the average
number of films released in Europe by origin country or region. While the U.S. share of
box-office revenues is over twice that for domestic and non-U.S. foreign films combined,
the number of U.S. film releases is slightly smaller than the sum of domestic and non-
U.S. foreign releases. Domestic and non-U.S. foreign releases tend to have small gross
revenues.
Countries in Europe vary in the size of their domestic motion-picture industries.
Figure 6 shows the ratio of local box office revenues for U.S. films to local box office
revenues for domestically produced films by European country averaged over 1995-2002,
which is the period for which data on every country is available. The log of this ratio is
the dependent variable in equation (2). Relative U.S. film revenues range from over 50
times domestic film revenues in Belgium and Ireland to less than 5 times in France.
Differences in the size of national movie industries in part reflect differences in country
size. Relative U.S. film revenues are strongly positively correlated with the ratio of US
GDP to national GDP, with the log correlation between relative film revenues and
relative GDP a highly significant 0.45. Differences in trade costs vis-à-vis the United
States may also affect the size of national movie industries. As we discuss next,
14
countries in Europe vary both in their cultural proximity to the U.S. and in the protection
they afford their domestic motion-picture industries.
3.4 Trade Costs in Motion Pictures
Before turning to the estimation, we need to identify data on trade costs relevant
to motion pictures. We measure cultural trade costs between the United States and its
trading partners using indicators of the linguistic distance between English and other
countries’ primary languages.4 Distances between languages capture the extent to which
two countries share a common linguistic heritage, which may indicate how easily cultural
ideas flow between them. Linguists group languages according to family trees. English
belongs to the Indo-European language family, whose speech varieties have been
examined extensively. In a classic study, Dyen et al. (1992) measure the similarity
between 95 Indo-European speech varieties. They create a percentage cognate matrix,
which identifies for each pair of languages the fraction of words for 200 basic meanings
(e.g., all, and, father, ice) that can be traced back to a common ancestral word. In
Europe, the Dyen index for English ranges from a high of 0.60 for Dutch (indicating that
60% of English and Dutch words for the 200 basic meanings share a common ancestral
word) to 0.23 for Czech.5
As an additional indicator of linguistic distance, we use the relative ease with
which U.S. citizens learn foreign languages. After receiving a foreign job posting,
employees of the U.S. Department of State (DOS) undergo 24 weeks of foreign-language
training, at the end of which they are tested on their proficiency. Chiswick and Miller 4 Two countries in our sample, Belgium and Switzerland, do not have a single dominant language. For these countries, we calculate linguistic distance as the weighted average of the distance between English and their primary languages, using data in Melitz (2002) and Gordon (2005) to calculate language weights. 5 For other work on trade using the Dyen index, see Ginsburgh, Ortuno-Ortin, and Weber (2005).
15
(2004) use the average scores of DOS test takers by language in the early 1990s as a
metric of the distance between English and 43 other languages. The DOS index
encapsulates both linguistic differences between English and other languages and the
exposure of U.S. citizens to other cultures. U.S. citizens have an easier time learning
Spanish (average score of 2.25) than Japanese (average score of 1) in part because
Spanish is more similar to English and in part because U.S. citizens have been more
exposed to Spanish.6 A disadvantage of the DOS measure is that language tests are not
randomly assigned. DOS employees may be posted to particular countries based in part
on their perceived ability to learn a language. Thus, test takers may be selected into a
specific exam based on their unobserved ability, which could compress variation in DOS
exam scores. The correlation between the Dyen and DOS indices is 0.65.
To measure policy barriers on motion-picture trade, we use a country-level trade
barrier index (TBI) constructed by Marvasti et al. (2005) for 33 countries in the early
1990s. Their index is the average across six dummy variables for trade barriers in motion
pictures. These dummies capture the presence of tariffs on film imports, quantitative
restrictions on film imports, levies on imported video sales, subsidies to domestic film
producers, overall trade barriers on service imports, and obstacles in enforcing property
rights. In Europe, France and Italy have the most restrictive barriers on motion pictures,
followed closely by Spain. The Netherlands, Norway and Sweden have the least
restrictive barriers. Belgium, Germany, Switzerland, and the United Kingdom have
intermediate levels of trade barriers. Marvasti et al. (2005) find that their trade barrier
index is positively correlated with imports of U.S. motion pictures. However, they use a
gravity specification that does not control for multilateral resistance, contrary to the 6 The highest average score is 3 for both Afrikaans and Swedish.
16
estimation strategy suggested by Anderson and van Wincoop (2004). Using a
theoretically grounded gravity specification, as in (2), we find a negative correlation
between trade levels and trade costs in motion pictures.
4. Gravity Estimation Results
Table 3 reports estimates of equation (2). The dependent variable is the log ratio
of box-office revenues of U.S. films to box-office revenues of domestic films by country.
The independent variables are the log ratio of U.S. to domestic GDP; the log ratio of U.S.
to domestic average annual earnings for skilled labor in manufacturing (from the UNIDO
Industrial Database); log geographic distance to the United States; the log trade barrier
index from Marvasti and Canterbury (2005) and a dummy variable for whether the
country has no TBI data; the log Dyen index and a dummy variable for whether a
country’s primary language is non-Indo-European (for which the Dyen index is
undefined); and the log Department of State language exam index from Chiswick and
Miller (2004) and a dummy variable for whether a country’s primary language is English
(for which the DOS index is undefined). The specification also includes year dummies,
which are unreported. The sample is the 19 European countries included in Hancock and
Jones (2003) over the period 1992 to 2002. Since there are only 19 countries and the six
trade-cost variables do not vary across time, it is not feasible to include all trade cost
measures in the same regression. For some trade cost measures, the results are sensitive
to which other trade costs are included as regressors.
17
Relative U.S. film revenues are increasing in relative U.S. GDP.7 The U.S. has a
more dominant position in the motion-picture industries of smaller countries. These
results suggest that larger countries have an advantage as a production location in motion
pictures, consistent with results on market-size effects in the theoretical models in
Krugman (1980) and Helpman and Krugman (1985) and gravity results for differentiated
manufacturing industries in Feenstra, Markusen, and Rose (1998) and Hanson and Xiang
(2004). Given fixed costs in producing motion pictures and trade costs (associated with
language, culture, and trade policy) in delivering motion-picture services, studios appear
to have an incentive to situate production in large countries. As a result, the dominance
of U.S. studios is weakest in the larger European markets, including France, Germany,
Italy, Spain, and the United Kingdom, which is apparent in Figure 6.
U.S. film exports are smaller in countries where U.S. wages are relatively high.
This is consistent with higher production costs deterring U.S. exports. Trade costs appear
to affect the ability of U.S. studios to penetrate foreign markets. Relative U.S. film
revenues are decreasing in each of the trade cost measures.
The estimated coefficient on the trade barrier index is negative in two
specifications, as expected, but precisely estimated in only one case. There is an obvious
concern about the endogeneity of policy trade barriers. Countries whose unobserved
characteristics are associated with weaker domestic film industries may be more likely to
impose import protection for motion pictures, which would tend to introduce positive
bias in the coefficient estimate on the trade barrier index. A further problem is that we do
not observe trade barriers for all countries in the sample. Controlling for the endogeneity
7 The coefficients on GDP are not directly comparable to standard gravity model estimates (which are closer to one), since our dependent variable is not log trade but log trade relative to log domestic consumption.
18
of trade barriers and expanding the coverage of this measure to include additional
countries are important tasks for further research.
The coefficient on the Dyen index, which is the most precisely estimated trade-
cost parameter, indicates that, all else equal, moving from an English-speaking country
(Dyen index of 1) to a Czech- speaking country (Dyen index of 0.23) would reduce U.S.
film revenues relative to domestic film revenues by 72 log points, based on results in
column (3), which is a large effect. Relative U.S. film revenues are also substantially
lower in non-Indo-European-language countries, which in our sample include Finland,
Hungary, and Norway. Languages that belong to the same family share common
ancestral origins in their speech varieties. Countries whose languages belong to different
language families may have relatively few historical links between their cultures, which
could tend to dampen trade in cultural goods such as motion pictures.
The coefficient on the DOS language index is negative, again indicating that trade
is lower between countries that are more linguistically distant from the United States, but
is quite sensitive to which other regressors included in the estimation.
5. Summary
In this project, we develop a theoretical framework to examine international trade
in information services and apply this framework to an empirical study of trade in motion
pictures. Despite the growing importance of services, in general, and information
services, in particular, for U.S. trade, the export performance of these sectors has been the
subject of little empirical research.
19
The intellectual merit of our research comes from identifying the extent to which
the size of the U.S. market has contributed to the global concentration of the motion-
picture industry in the U.S. and using newly available measures of linguistic distance to
estimate the impact of cultural trade barriers on trade in motion pictures. Market size,
language, and trade are each important determinants of U.S. motion picture exports.
To date, the poor quality of published data on trade in services has hampered
research on the sector’s role in the global economy. However, poor data quality does not
mean the U.S. current account is mismeasured. Foreign revenues earned by U.S. motion
pictures still appear in the current account, either as exports or as investment income
(resulting from license agreements, royalties, or foreign sales by affiliates of U.S.
multinationals).
20
References Amiti, Mary, and Shang-Jin Wei. 2005. “Fear of Service Outsourcing: Is It Justified?”
Economic Policy, forthcoming. Anderson, James E. and van Wincoop, Eric. 2004. “Trade Costs,” Journal of Economic
Nicoud, Frederic. 2003. Public Policies and Economic Geography. Princeton: Princeton University Press.
Baldwin, Robert E., Robert E. Lipsey, and David Richardson. 1998. Geography and Ownership as Bases for Economic Accounting. Chicago: University of Chicago Press.
Berndt, Ernst, and Charles R. Hulten. 2007. Hard-to-Measure Goods and Services: Essays in Honor of Zvi Griliches. Chicago: University of Chicago Press.
Byers, Simon, Lorrie Faith Cranor, Eric Cronin, Dave Korman and Patrick McDaniel, 2004. “An Analysis of Security Vulnerabilities in the Movie Production and Distribution Process”. Telecommunications Policy. Special Issue Aug.-Sept. 2004, 28(7-8): 619-44
Chiswick, Barry, and Paul Miller. 2004. “Linguistic Distance: A Quantitative Measure of Distance between English and Other Languages,” IZA Discussion Paper No. 1246.
Council of Economic Advisors. 2004. Economic Report of the President. Washington, DC: U.S. Government Printing Office.
Davis, Donald R. and David E. Weinstein. 1999. "Economic Geography and Regional Production Structure," European Economic Review 43: 379-407.
Davis, Donald R., and David E. Weinstein. 2002. “The Factor Content of Trade.” in E. Kwan Choi and James Harrigan, eds., Handbook of International Trade, Blackwell.
Davis, Donald R. and David E. Weinstein. 2003. "Market Access, Economic Geography and Comparative Advantage: An Empirical Assessment,” Journal of International Economics, 59(1): 1-24.
De Vany, A.S. and R. D. Eckert, 1991. “Motion Pictures Antitrust: The Paramount Cases Revisited”, Research in Law and Economics, 14, 51-112.
De Vany, A.S. and D.W. Walls, 1996. “Bose-Einstein Dynamics and Adaptive Contracting in the Motion Picture Industry”. Economic Journal, 1493-1514.
De Vany, Arthur and David W. Walls, 1997. “The Market for Motion Pictures: Rank, Revenue, and Survival”. Economic Inquiry. October 1997, 35(4): 783-97.
De Vany, Arthur S., and W. David Walls. 1999. “Uncertainty in the Movie Industry” Journal of Cultural Economics, 23(4): 285-318.
De Vany, Arthur, and W. David Walls. 2004. “Motion Picture Profit, the Stable Paretian Hypothesis, and the Curse of the Superstar,” Journal of Economic Dynamics and Control, 28(6): 1035-57.
Dyen, Isidore, Joseph B. Kruskal, and Paul Black. 1992. “An Indoeuropean Classification: A Lexicostatistical Experiment,” Transactions of the American Philosophical Society, 82(5): 1-132.
Elberse, Anita and Jehoshua Eliashberg, 2003. “Demand and Supply Dynamics for Sequentially Released Products in International Markets: The Case of Motion Pictures”. Marketing Science. Summer 2003, 22(3): 329-54.
Fearon, James D. 2003. “Ethnic and Cultural Diversity by Country,” Journal of
21
Economic Growth, 8(2): 195-222. Feenstra, Robert C. 2004. Advanced International Trade: Theory and Evidence.
Princeton, NJ: Princeton University Press Feenstra, Robert C., and Gordon H. Hanson. 2002. “Global Production and Inequality:
A Survey of Trade and Wages,” in E. Kwan Choi and James Harrigan, eds., Handbook of International Trade, Blackwell.
Feenstra, Robert C., James R. Markusen, and Andrew Rose. 1998. “Understanding the Home Market Effect and the Gravity Equation: The Role of Differentiating Goods,” NBER Working Paper No. 6804.
Filson, Darren, David Switzer and Portia Besocke, 2005. “At the Movies: The Economics of Exhibition Contracts”, Economic Inquiry. April 2005, 43(2): 354-69.
Freund, Caroline, and Diana Weinhold. 2002. “The Internet and International Trade in Services,” American Economic Review, 92(2): 236-240.
Ginsburgh,Victor, Ortuno-Ortin, Ignacio, and Weber, Shlomo. 2005. “Disenfranchisement in Linguistically Diverse Societies: The Case of the European Union” Journal of the European Economic Association, 3(4): 946-965.
Goettler, Ronald L. and Phillip Leslie, 2005. “Cofinancing to Manage Risk in the Motion Picture Industry”, Journal-of-Economics-and-Management-Strategy. Summer 2005, 14(2): 231-61.
Gordon, Raymond G., Jr. (ed.). 2005. Ethnologue: Languages of the World, 15th Edition. Dallas, TX: SIL International.
Griliches, Zvi. 1992. Output Measurement in the Service Sectors. Chicago: University of Chicago Press.
Hancock, David, and Charlotte Jones, 2003. Cinema Distribution and Exhibition in Europe, 2nd Edition. London: Screendigest.
Hanson, Gordon H., and Chong Xiang. 2004. “The Home Market Effect and Bilateral Trade Patterns,” American Economic Review, September, 94: 1108-1129.
Head, Keith, and Ries, John. 2001. “Increasing Returns versus National Product Differentiation as an Explanation for the Pattern of US-Canada Trade,” American Economic Review, 91(4): 858-76.
Helpman, Elhanan. 1981. “International Trade in the Presence of Product Differentiation, Economies of Scale, and Monopolistic Competition: A Chamberlin-Heckscher-Ohlin Approach,” Journal of International Economics, 11(3): 305-40.
Helpman, Elhanan. 2005. “Trade, FDI, and the Organization of Firms,” mimeo, Harvard University.
Helpman, Elhanan and Krugman, Paul. 1985. Market Structure and Foreign Trade. Cambridge, MA: MIT Press.
Holmes, Thomas J. and Stevens, John J. 2002. “The Home Market and the Pattern of Trade: Round Three.” Federal Reserve Bank of Minneapolis Staff Report No. 304.
Hooper, Peter, and David Richardson. 1991. International Economic Transactions: Issues in Measurement and Empirical Research. Chicago: University of Chicago Press.
Hoskins, Colin, Stuart McFadyen, and Adam Finn. 1997. Global Television and Film. Oxford: Clarendon Press.
Janeba, Eckhard. 2004. “International Trade and Cultural Identity,” NBER Working Paper No. 10426.
22
Johnson, Norman L., Samuel Kotz, and N. Balakrishnan. 1994. Continuous Univariate Distributions. New York: John Wiley & Sons, Inc.
Kozlow, Ralph, and Maria Borga. 2004. “Offshoring and the U.S. Balance of Payments,” U.S. Bureau of Economic Analysis Working Paper 2004-05.
Krugman, Paul. 1979. “Increasing Returns, Monopolistic Competition and International Trade,” Journal of International Economics 9: 469-479.
Krugman, Paul. 1980. "Scale Economies, Product Differentiation, and the Pattern of Trade," American Economic Review 70: 950-959.
Marvasti, Akbar, and E. Ray Canterberry. 2005. “Cultural and Other Barriers to Motion Pictures Trade,” Economic Inquiry 43(1): 39-54.
McCalman, Philip. 2004. “Foreign Direct Investment and Intellectual Property Rights: Evidence from Hollywood's Global Distribution of Movies and Videos,” Journal of International Economics, 62(1): 107-23.
McCalman, Phillip, 2005. “International Diffusion and Intellectual Property Rights: An Empirical Analysis”. Journal of International Economics, in press.
Melitz, Jacques. 2002. “Language and Foreign Trade.” CEPR Discussion Paper No. 3590.
Melitz, Marc J. 2003. “The Impact of Trade on Intra-industry Reallocations and Aggregate Industry Productivity,” Econometrica, 71(6): 1695-1725.
Rauch, James E., and Trindade, Vitor. 2006. “Neckties in the Tropics: A Model of International Trade and Cultural Diversity”. Mimeo, UCSD and University of Missouri.
Siwek, Stephen E. 2004. “Copyright Industries in the U.S. Economy: The 2004 Report,” Economists Incorporated for the International Intellectual Property Alliance.
Siwek, Stephen E. 2005. “Engines of Growth: Economic Contributions of U.S. Intellectual Property Industries,” Economists Incorporate for NBC Universal.
Tybout, James R. 2002. “Plant and Firm-Level Evidence on ‘New’ Trade Theories,” E. Kwan Choi and James Harrigan, eds., Handbook of International Trade, Blackwell.
Walls,W. David, 2005. “Demand Stochastics, Supply Adaptation, and the Distribution of Film Earnings,” Applied Economics Letters. August 2005, 12(10): 619-23.
23
Table 1: Imports of Motion Pictures in Europe (millions of U.S. dollars)
Year Total Film Imports
(Comtrade)
Total Box Office Revenues for Foreign Films (Screendigest.com)
Notes: Column 2 reports total imports of SITC 8830 from Comtrade for 19 countries in Europe; Column 3 reports total box office revenues for foreign films in these countries (as reported by Hancock and Jones, 2003). The 19 countries are Austria, Belgium, Czech Republic, Denmark, Finland, France, Germany, Greece, Hungary, Ireland, Italy, Netherlands, Norway, Poland, Portugal, Spain Sweden, Switzerland, and the UK.
24
Table 2: Imports of Motion Pictures by Country (millions of U.S. dollars)
Country Mean Film Imports
(Comtrade)
Mean Box Office Revenues for Foreign Films (Screendigest.com)
Austria 4.1 85.5 Belgium 2.4 110.8
Czech Republic 0.6 15.5 Denmark 1.0 70.8 Finland 1.2 42.2 France 34.1 880.3
United Kingdom 9.7 822.9 Notes: Column 2 reports the average value of imports for SITC 8830 from Comtrade across the years 1992- 2002; Column 3 reports average box-office revenue for foreign films from Sceendigest.com across the years 1992-2002.
25
Table 3: Gravity Model Estimation Results for U.S. Exports of Motion-Picture Services
Notes to Table 3: The dependent variable is the log ratio of box-office revenues of U.S. films to box-office revenues of domestic films. The independent variables are the log ratio of U.S. to domestic GDP (ln Yus/Yk); the log ratio of U.S. to domestic average annual earnings for skilled labor in manufacturing (ln Wus/Wk); log geographic distance to the United States (ln Distance); the log trade barrier index from Marvasti and Canterbury (2005) and a dummy variable for whether the country has no TBI data (ln TBI, No TBI); the log Dyen index and a dummy variable for whether a country’s primary language is non-Indo-European (ln Dyen, Non Indo-Euro); the log Department of State language exam index from Chiswick and Miller (2004) and a dummy variable for whether a country’s primary language is English (ln DOS, English). The specification also includes year dummies, which are unreported. The sample is the 19 European countries (see Table 1) over the period 1992 to 2002.
27
Film Imports from Comtrade vs. Box Office Revenues of Foreign Films in Europe
050
010
00To
tal I
mpo
rts (C
OM
TRA
DE
)
0 500 1000Total Box Office Revenues
Figure 1a: Total Imports and Total Box Office Revenues
020
040
060
080
0Im
ports
from
US
(CO
MTR
AD
E)
0 200 400 600 800US Box Office Revenues
Figure 1b: Imports from US and US Box Office Revenues
28
Figure 2: Box Office Revenues in Europe
Box
Offi
ce, M
n 20
00 U
SD
Year
Ave
. Tic
ke P
rice,
200
0 U
SD
EU Box Office Revenue EU Average Ticket Price
92 94 96 98 00 02
4000
4500
5000
5500
5
6
7
29
Figure 3: Share of High Grossing Films in European Box Office Revenues
Rev
enue
Sha
re o
f Top
Ten
Film
s
Year92 94 96 98 00 02
0
.5
1
30
Figure 4: U.S. Share of Box Office Revenues in Europe
Sha
re o
f EU
Film
Exh
ibiti
on M
arke
t
Year
US Share Domestic Country Share Other Country Share
94 96 98 00 02
0
.2
.4
.6
.8
31
Figure 5: Number of Films Released in Europe
Mea
n N
umbe
r of F
ilms
Rel
ease
d
Year
US Films Domestic Films Other Country Films
92 94 96 98 00 02
0
50
100
150
32
Figure 6: Revenues of U.S. and Domestic Films in Europe, 1995-2002
0 10 20 30 40 50Revenue of US Films/Revenue of Domestic Films