Page 1
Trade in Value-AddedEast Asian Perspective■
□
■□
□■
■□■□
□■□■□■
■□■□■□
□■□■□■□■
■□■□■□■□■□ □■□■□■□■□■□■□ ■□■□■□■□■□■□■□■□ □■□■□■□■□■□■□■□■□■ ■□■□■□■□■□■□■□■□■□■□■□
Satoshi InomataIDE-JETRO
Page 3
2009年のiPhone
小売価格
=$500(Apple利益率64%)
$331$7
$162
International value distribution of iPhone
Retail price of iPhone in 2009
= $500(64% margin for
the Apple)
Page 4
Cost structure of parts for iPhone3GManufacturer Components Unit PriceToshiba (Japan) Flash Memory US$24.00
Display Module US$19.25Touch Screen US$16.00
Samsung (Korea) Application Processor US$14.46SDRAM-Mobile DDR US$8.50
Infineon (Germany) Baseband US$13.00Camera Module US$9.55RF Transceiver US$2.80GPS Receiver US$2.25Power IC RF Function US$1.25
Broadcom (US) Bluetooth/FM/WLAN US$5.95Numonyx (US) Memory MCP US$3.65Murata (Japan) FEM US$1.35Dialog Semiconductor(Germany)
Power IC Application ProcessorFunction
US$1.30
Cirrus Logic (US) Audio Codec US$1.15Others US$48.00
Page 5
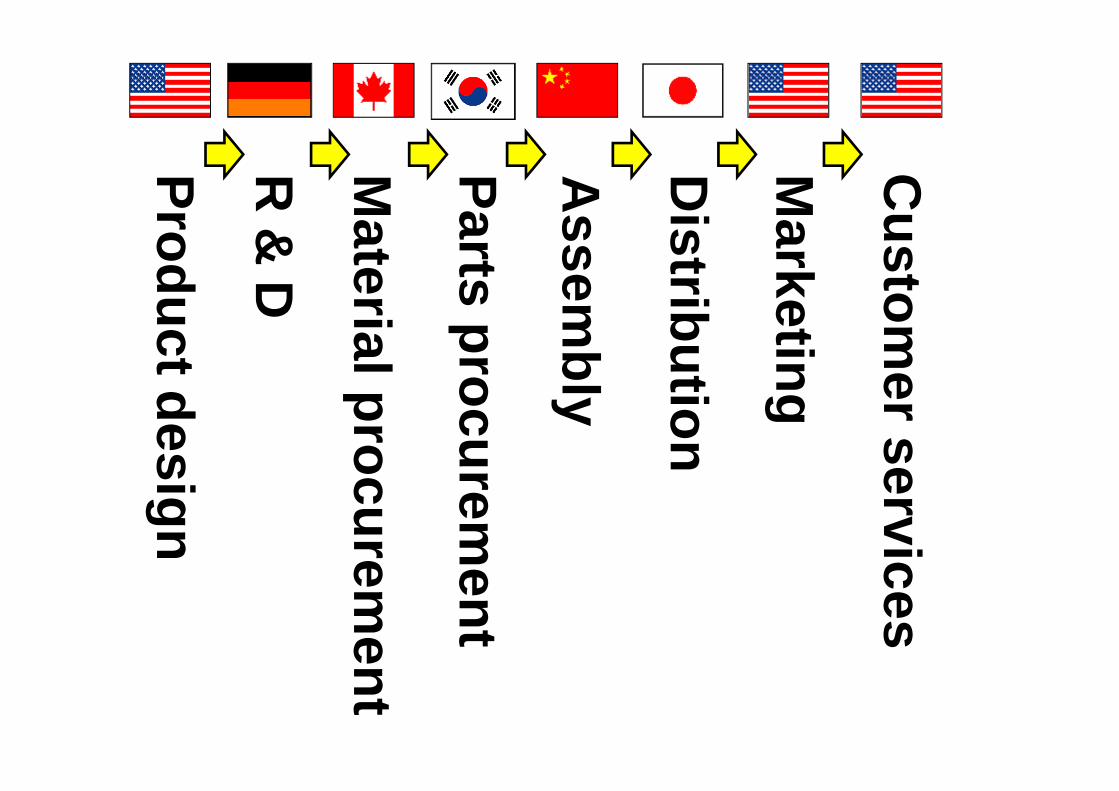
Product design
Assem
bly
Distribution
Marketing
Custom
er services
Material procurem
ent
R &
D
Parts procurement
Page 6
Value-added
Productionprocess
Productdesign
Assem
bly
Distribution
Marketing
Custom
erservices
Material
procurement
R &
D
Partsprocurem
ent
Page 7
2009年のiPhone
小売価格
=$500(Apple利益率64%)
$331$7
$162
International value distribution of iPhone
Retail price of iPhone in 2009
= $500(64% margin for
the Apple)
Page 8
The US trade deficits with China(1991=100)
Page 9
Traditional measurement Value-added measurement
2009 US trade balance in iPhones(million US$)
World
Of which:
ChinaJapan
KoreaGermany
Rest of World
Page 10
Value-addedTrade in goods and services
Page 11
Agri & Manu- Service Cons- Invest Export Import TotalMining fact'ing umption -ment Output
Agri & Mining 800 1800 200 600 400 300 -100 4000
Manufacturing1600 600 500 0 350 200 -250 3000
Service 400 300 900 350 50 0 0 2000
Wages 800 200 250
Profits 250 50 100
Depreciation 100 30 40
Taxes 50 20 10
Total Input 4000 3000 2000
Inte
rmed
iate
Tran
sact
ion
Valu
e A
dded
Intermediate Transaction Final Demand
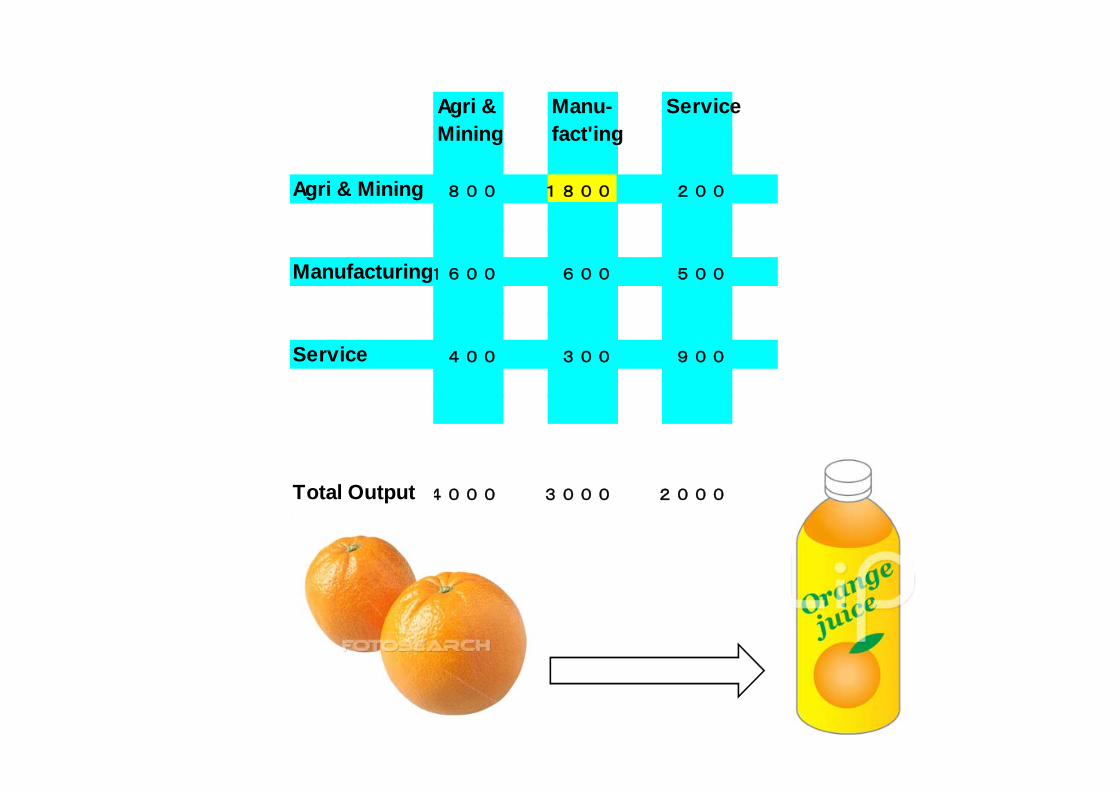
Input-Output Table (3 sectors)
Page 12
Agri & Manu- ServiceMining fact'ing
Agri & Mining 800 1800 200
Manufacturing1600 600 500
Service 400 300 900
Total Output 4000 3000 2000
Page 13
Agri & Manu- ServiceMining fact'ing
Agri & Mining 800 1800 200
Manufacturing1600 600 500
Service 400 300 900
Total Output 4000 3000 2000
Page 14
Automobiles(Y10 billion)
(Y260 m
Cold-finis(Y60 m
Steel s(Y20 m
Pa(Y17 m
Compos(Y30 m
Carbo(Y10 m
Silk and ra(Y10 m
Car chassis(Y650 million)
Tires and inner tubes
Glass products(Y130 million)
Internal-combustionengines
(Y1.52 billion)
InitialImpact
1st-roundImpacts
Value-added
Value-added
Value-addedValue-
added
Value-added
Value-added
Value-addedValue-addedValue-addedValue-added
Value-addedValue-addedValue-added
Value-added
Value-addedValue-addedValue-addedValue-added
Value-addedValue-addedValue-added
Value-added
Value-addedValue-addedValue-addedValue-added
Value-addedValue-addedValue-addedValue-added
Production spillover(car industry)
Page 15
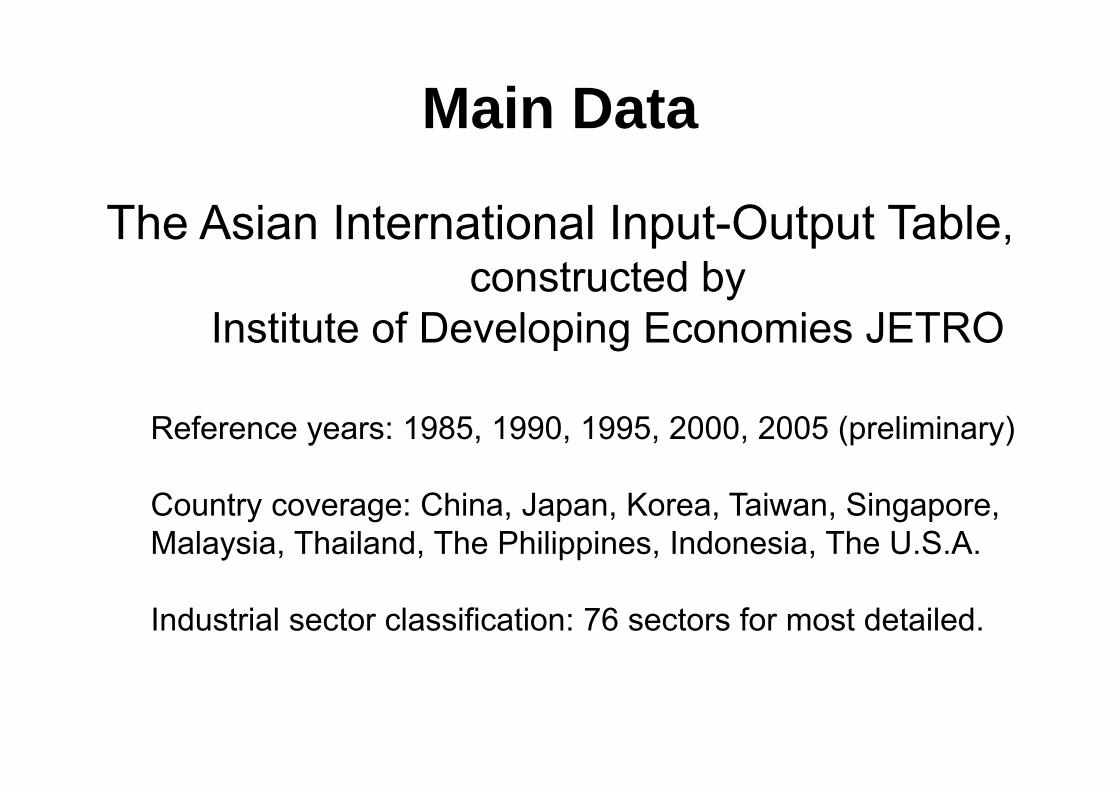
Main Data
The Asian International Input-Output Table,constructed by
Institute of Developing Economies JETRO
Reference years: 1985, 1990, 1995, 2000, 2005 (preliminary)
Country coverage: China, Japan, Korea, Taiwan, Singapore, Malaysia, Thailand, The Philippines, Indonesia, The U.S.A.
Industrial sector classification: 76 sectors for most detailed.
Page 16
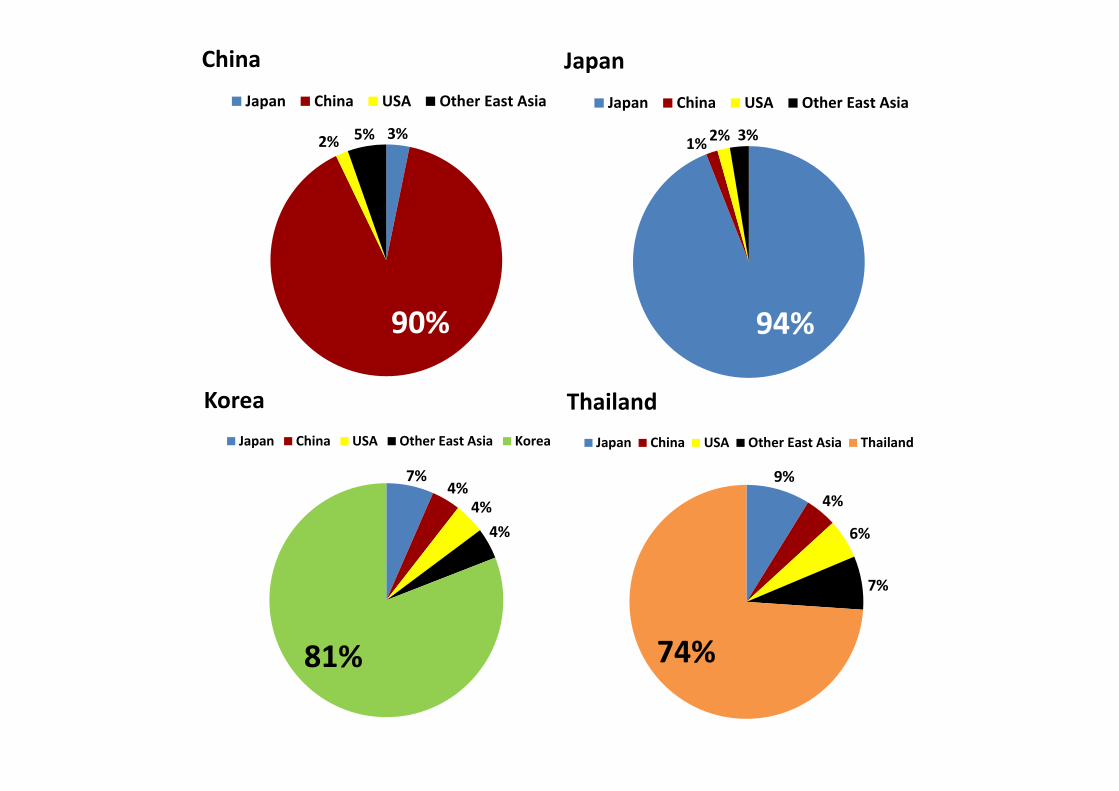
The origins of value-added embodied in
China’s export to the USA (2005)3%
90%
2% 5%
USA
Japan
China
Others
Page 17
3%
90%
2% 5%
ChinaJapan China USA Other East Asia
94%
1% 2% 3%
JapanJapan China USA Other East Asia
7%4%
4%4%
81%
KoreaJapan China USA Other East Asia Korea
9%4%
6%
7%
74%
ThailandJapan China USA Other East Asia Thailand
Page 18
US trade deficits with China
0 100 200 300
2000
2005
2008
Traditional approachTrade in value-added
-21%
-20%
-27%
BillionUS$
Page 19
international trade as a flow of values
rather than of products.
Trade in Value-addedmeasures
Page 20
Measuring trade in terms ofvalue-added allows us:
• To provide a more realistic view about bilateral trade in the light of international production sharing;
• To avoid multiple counting of trade flows when goods are transferred across borders;
• To univocally identify the origins of imported products, which helps to design trade policies like tax scheme.
Page 23
How to measure TiVACountry R’s export of value-added to country T
TiVART=ΣSVR·LRS·FST
=>Trade balance between R and T:TiVART-TiVATR
Where
VR : Vector of value-added ratios of country RLRS : Leontief inverse matrix for transaction between
country R and SFST : Final demand vector of country T for the
products of country S
Page 24
Deardorff (1998)
The splitting of a production process into two or more steps that can be undertaken in different locations but that lead to the same final product.
Fragmentation: A definition
Page 25
Boeing 787 is made in ???
Page 26
Agri- Manu- Services Agri- Manu- Services Cons- Invest Cons- Invest Exportculture facturing culture facturing umption -ment umption -ment to RoW
Agriculture
Manufacturing
Services
Agriculture
Manufacturing
Services
Agriculture
Manufacturing
Services
Wages
Profits
Depreciation
Taxes
LUW
Intermediate DemandU.S.A.
Final DemandU.S.A.
Final DemandCHINA
LCW
U.S
.A.
Intermediate DemandCHINA
CH
INA
VC
RES
T O
FTH
EW
OR
LDVa
lue-
adde
d
VU
Bilateral IIOT between
China and USA
Page 27
A schematic image of the Asian International Input-Output Table
Indo
nesi
a
Mal
aysi
a
Phi
lipp
ines
Sing
apor
e
Tha
ilan
d
Chi
na
Tai
wan
Kor
ea
Japa
n
U.S
.A.
Indo
nesi
a
Mal
aysi
a
Phi
lipp
ines
Sing
apor
e
Tha
ilan
d
Chi
na
Tai
wan
Kor
ea
Japa
n
U.S
.A.
Exp
ort
toIn
dia
Exp
ort
toH
ong
Kon
g
Exp
ort
toE
U
Exp
ort
toR
.O.W
.
Stat
isti
cal
Dis
crep
ancy
Tot
alO
utpu
ts
code (AI) (AM) (AP) (AS) (AT) (AC) (AN) (AK) (AJ) (AU) (FI) (FM) (FP) (FS) (FT) (FC) (FN) (FK) (FJ) (FU) (LG) (LH) (LO) (LW) (QX) (XX)
Indonesia (AI) AII AIM AIP AIS AIT AIC AIN AIK AIJ AIU FII FIM FIP FIS FIT FIC FIN FIK FIJ FIU LIG LIH LIO LIW QI XI
Malaysia (AM) AMI AMM AMP AMS AMT AMC AMN AMK AMJ AMU FMI FMM FMP FMS FMT FMC FMN FMK FMJ FMU LMG LMH LMO LMW QM XM
Philippines (AP) API APM APP APS APT APC APN APK APJ APU FPI FPM FPP FPS FPT FPC FPN FPK FPJ FPU LPG LPH LPO LPW QP XP
Singapore (AS) ASI ASM ASP ASS AST ASC ASN ASK ASJ ASU FSI FSM FSP FSS FST FSC FSN FSK FSJ FSU LSG LSH LSO LSW QS XS
Thailand (AT) ATI ATM ATP ATS ATT ATC ATN ATK ATJ ATU FTI FTM FTP FTS FTT FTC FTN FTK FTJ FTU LTG LTH LTO LTW QT XT
China (AC) ACI ACM ACP ACS ACT ACC ACN ACK ACJ ACU FCI FCM FCP FCS FCT FCC FCN FCK FCJ FCU LCG LCH LCO LCW QC XC
Taiwan (AN) ANI ANM ANP ANS ANT ANC ANN ANK ANJ ANU FNI FNM FNP FNS FNT FNC FNN FNK FNJ FNU LNG LNH LNO LNW QN XN
Korea (AK) AKI AKM AKP AKS AKT AKC AKN AKK AKJ AKU FKI FKM FKP FKS FKT FKC FKN FKK FKJ FKU LKG LKH LKO LKW QK XK
Japan (AJ) AJI AJM AJP AJS AJT AJC AJN AJK AJJ AJU FJI FJM FJP FJS FJT FJC FJN FJK FJJ FJU LJG LJH LJO LJW QJ XJ
U.S.A. (AU) AUI AUM AUP AUS AUT AUC AUN AUK AUJ AUU FUI FUM FUP FUS FUT FUC FUN FUK FUJ FUU LUG LUH LUO LUW QU XU
Freight and Insurance (BF) BAI BAM BAP BAS BAT BAC BAN BAK BAJ BAU BFI BFM BFP BFS BFT BFC BFN BFK BFJ BFU
Import from India (CG) AGI AGM AGP AGS AGT AGC AGN AGK AGJ AGU FGI FGM FGP FGS FGT FGC FGN FGK FGJ FGU
Import from Hong Kong (CH) AHI AHM AHP AHS AHT AHC AHN AHK AHJ AHU FHI FHM FHP FHS FHT FHC FHN FHK FHJ FHU
Import from EU (CO) AOI AOM AOP AOS AOT AOC AON AOK AOJ AOU FOI FOM FOP FOS FOT FOC FON FOK FOJ FOU
Import from the R.O.W. (CW) AWI AWM AWP AWS AWT AWC AWN AWK AWJ AWU FWI FWM FWP FWS FWT FWC FWN FWK FWJ FWU
(DT) DAI DAM DAP DAS DAT DAC DAN DAK DAJ DAU DFI DFM DFP DFS DFT DFC DFN DFK DFJ DFU
Value Added (VV) VI VM VP VS VT VC VN VK VJ VU
Total Inputs (XX) XI XM XP XS XT XC XN XK XJ XU * Each cell of A** and F** represents a matrix of 76 x 76 and 76 x 4 dimension, respectively.
Duties and ImportCommodity Taxes
Intermediate Demand (A) Final Demand (F) Export (L)
Page 28
Traditional measure (Béla Balassa, 1965) RCAiR = EXiR ∑ EXiRi⁄∑ EXiRR ∑ ∑ EXiRiR⁄
New measure based on the concept of TiVA (Meng, Yamano and Fang, 20 RCAD∙jr = TiVAD∙jr ∑ TiVAD∙jrj∑ TiVAD∙jrr ∑ ∑ TiVAD∙jrjr
RCAD∙jrs = TiVAD∙jrs ∑ TiVAD∙jrsj∑ TiVAD∙jrsr ∑ ∑ TiVAD∙jrsjr
Comparative advantagebased on value-added
Page 29
Revealed comparative advantage(Computers, OA equipment)
従来の比較優位指標 付加価値ベースの指標 従来の比較優位指標 付加価値ベースの指標Singapore 6.80 Ireland 9.55 Mexico 5.48 Singapore 7.93Ireland 5.27 Singapore 6.50 Singapore 4.49 Thailand 5.81Chinese Taipei 3.60 Chinese Taipei 3.21 Ireland 4.03 Mexico 4.84Mexico 3.16 Mexico 2.86 China 4.01 Hong Kong 4.65Japan 2.13 Poland 1.95 Thailand 3.88 Ireland 3.81United States 1.59 Japan 1.81 Hong Kong 3.71 China 2.66Hong Kong 1.49 United Kingdom 1.52 Czech Republic 1.91 Hungary 2.24United Kingdom 1.47 United States 1.52 Hungary 1.72 Philippines 1.92China 1.06 Hong Kong 1.47 Japan 1.26 Japan 1.24Poland 0.92 RoW 1.03 Philippines 1.04 United States 0.86Korea 0.83 France 0.97 Chinese Taipei 0.83 United Kingdom 0.67France 0.80 Korea 0.53 United States 0.69 Korea 0.55Canada 0.57 Australia 0.47 Korea 0.47 Germany 0.48Australia 0.46 Spain 0.47 United Kingdom 0.41 ChineseTaipei 0.48Spain 0.39 China 0.47 Germany 0.30 RoW 0.46Finland 0.33 Germany 0.42 India 0.30 India 0.39Netherlands 0.32 Netherlands 0.34 Netherlands 0.26 Czech Republic 0.35Italy 0.31 Romania 0.33 France 0.25 Sweden 0.31
1995年 2005年1995Traditional index Value-added index
2005Traditional index Value-added index


![SED322 - InVision - Software Engineering Dailysoftwareengineeringdaily.com/wp-content/uploads/2017/04/SED322-InVision.pdf · [0:06:11.4] BFJ: What we’re in the business of is digital](https://static.documents.pub/doc/80x56/5f4ee6cb1359033d582a8b71/sed322-invision-software-engineering-dailysoft-006114-bfj-what-weare.jpg)


