Trade negotiations with Australia and New Zealand Workshop proceedings Policy Department for External Relations Directorate General for External Policies of the Union PE 603.479 - June 2019 EN STUDY Requested by the INTA committee
Transcript
Trade negotiations with Australia and New Zealand
Workshop proceedings
Policy Department for External Relations Directorate General for External Policies of the Union
This paper will be published on the European Parliament's online database, 'Think tank'.
The content of this document is the sole responsibility of the author and any opinions expressed therein do not necessarily represent the official position of the European Parliament. It is addressed to the Members and staff of the EP for their parliamentary work. Reproduction and translation for non-commercial purposes are authorised, provided the source is acknowledged and the European Parliament is given prior notice and sent a copy.
Study: Trade negotiations with Australia and New Zealand 12
1 Introduction 13
1.1 Overall context - Australia 13
1.2 Overall context - New Zealand 15
2 The status quo 16
2.1 The trade context 16
2.2 Non-tariff barriers to trade 23
2.3 Investment 26
2.4 Public Procurement 29
3 The Australian and New Zealand trade policy context 30
3.1 Existing FTAs to which both Australia and New Zealand are party 30
3.2 Existing Australian FTAs and trade negotiations 31
3.3 Existing New Zealand FTAs and trade negotiations 31
4 Likely impacts of FTAs with Australia and New Zealand 33
4.1 Results of European Commission impact studies 33
4.2 Other studies of the FTAs 35
5 Trade and Sustainable Development (TSD) in the FTAs 38
5.1 The academic debate on TSD 38
5.2 EU policy context on TSD 39
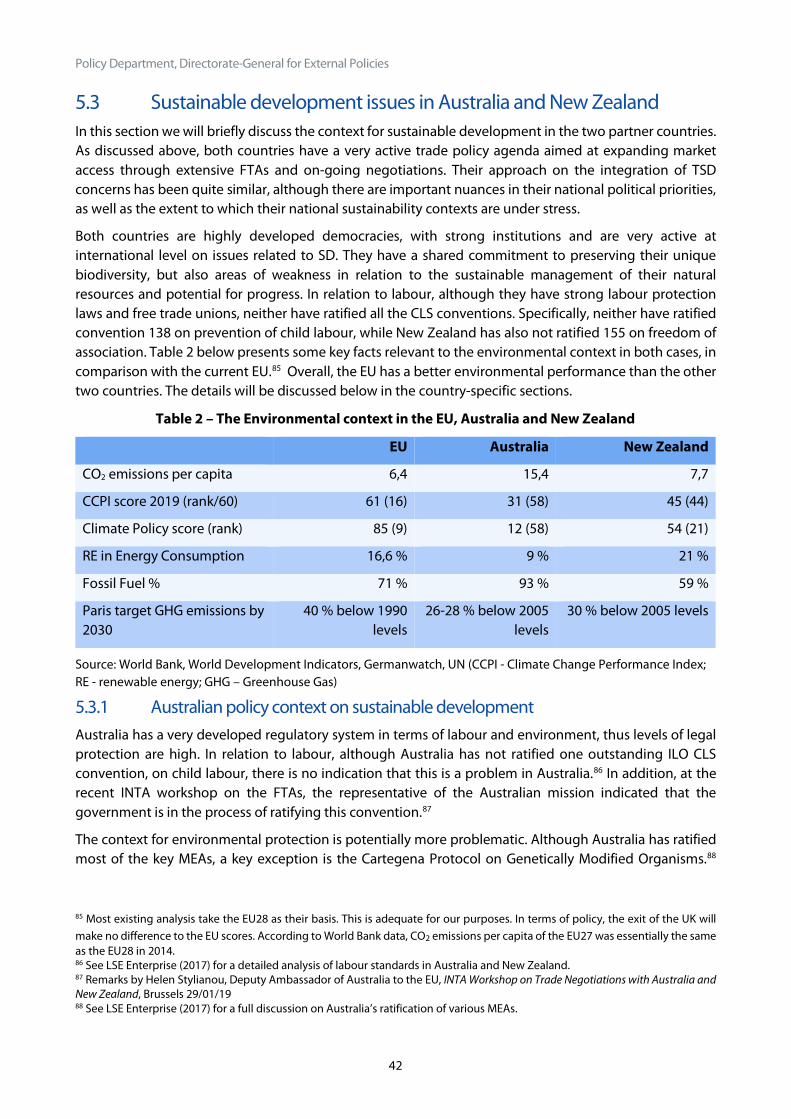
5.3 Sustainable development issues in Australia and New Zealand 42
5.4 Leveraging the EU’s FTAs with Australia and New Zealand for more sustainable trade 47
Policy Department, Directorate-General for External Policies
6 The wider impacts of EU FTAs with Australia and New Zealand 49
6.1 Supporting a robust and fair global trading system 49
6.2 Increasing EU integration with the Asia Pacific region 49
6.3 Increasing cooperation to tackle global challenges 50
7 Conclusions 51
Bibliography 52
List of abbreviations 53
Statistical annex 55
Annex A: Powerpoint presentation 74
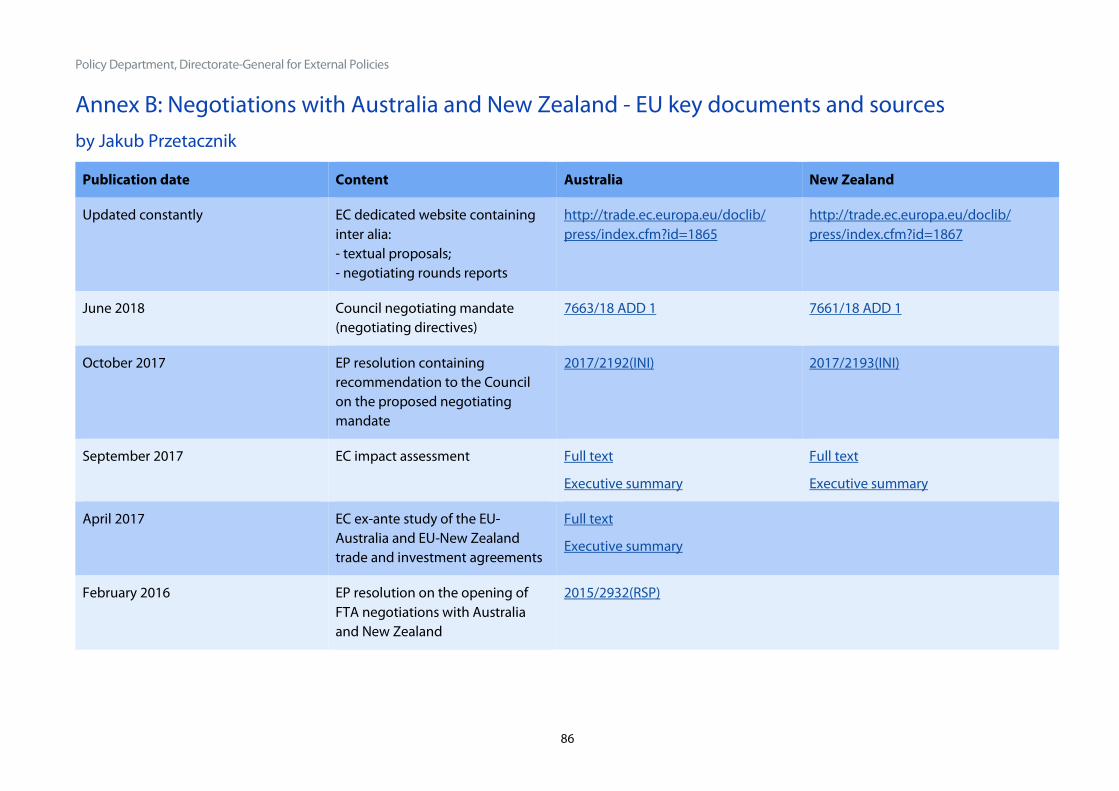
Annex B: Negotiations with Australia and New Zealand EU key documents and sources 86
Trade negotiations with Australia and New Zealand
5
Programme of the workshop
DIRECTORATE-GENERAL FOR EXTERNAL POLICIES
POLICY DEPARTMENT
For the Committee on International Trade (INTA)
WORKSHOP
Trade negotiations with
Australia and New Zealand
Tuesday, 29 January 2019 - 15.00-17.00
Brussels, Altiero Spinelli building (ASP), Room ASP A1G-2
PROGRAMME
15.00 Welcome and introductory remarks • Sorin Moisă, INTA Standing Rapporteur for Australia
15.15 Presentation on trade negotiations with Australia and New Zealand: presentation of
initial findings • Dr Louise Curran, Senior Lecturer, Department of Strategy, Entrepreneurship
and International Business at the Toulouse Business School 15.40 Reactions from the panel:
• Peter Berz, Head of Unit - Trade Relations with South Asia and South East Asia, Australia and New Zealand, European Commission, DG TRADE
• Pascal Kerneis, Member of the Steering Committee of the EU-Australia Leadership Forum and Managing Director of European Services Forum
• Daniel Azevedo, Director for Commodities and Trade, Copa-Cogeca 16.10 Exchange of views
• Discussion with participation of MEPs and stakeholders 16.55 Concluding remarks by the Chair
Policy Department, Directorate-General for External Policies
6
Workshop report Mr Sorin Moisă, Committee on International Trade Standing Rapporteur for Australia
Mr Moisă began the workshop with an overview of the European Parliament’s involvement to date in the trade deal negotiations with Australia and New Zealand. The Parliament has demonstrated strong support as well as interest in the negotiations and is following the developments closely. A resolution proposing the negotiations was adopted in February 2016 and was supported by a large majority. In September 2017, following the publishment of draft negotiating directives by the European Commission, the European Parliament adopted more detailed resolutions with specific requests on what should be included in the final mandates and negotiation outcomes.
The European Parliament emphasised several priorities in these resolutions, some of which included; the need to remove barriers and help EU firms (especially smaller ones) export more to these markets, and the need for a separate chapter to take into account the needs and interests of micro-enterprises and small and medium size enterprises (SMEs). Mr Moisă emphasised this point in particular and noted that free trade agreements (FTAs) generally help SMEs more than they help larger companies. Another objective, as outlined by the Parliament, is to put European companies on equal footing with other countries that already have preferential trade agreements with Australia and New Zealand, such as the Comprehensive and Progressive Agreement for Trans-Pacific Partnership (CPTPP).
The Parliament also requested the inclusion of a robust and ambitious sustainable development chapter with binding and enforceable conditions which are subject to a suitable dispute settlement mechanism. The Parliament also sought protection for geographical indications (GIs), increased access for European companies to government procurement and a balanced and ambitious outcome in the agricultural sector, respecting the fact that there are a number of sensitive products that require special protection. Lastly, the Parliament wanted ambitious provisions allowing for the full functioning of the digital eco-system and promoting cross-data flows, in full compliance with and without prejudice to the EU’s current and future data protection laws.
Two negotiating rounds had taken place prior to the workshop, both with Australia and New Zealand, and a next round will follow. As such, Mr Moisă stressed the need to look closer, with thorough academic input, at these negotiations.
Dr Louise Curran - Senior Lecturer, Department of Strategy, Entrepreneurship and International Business at Toulouse Business School
Dr Curran presented her initial findings on the trade negotiations with Australia and New Zealand. A full report forms the main part of this publication. The power point presentation used during the workshop can be found in the annex A. Dr Curran concluded her presentation by reiterating the importance of these FTAs for signalling to our partners and the rest of the world that Europe wants to engage with like-minded partners and to participate in a fair, rules-based trading system.
Following the presentation by Dr Curran, Mr Moisă strongly agreed that the positive signalling effects are crucial to supporting the rules-based order in a time of challenge from populist forces and doubts about globalisation. In his view, this should go in parallel with reforming it, for instance through trade and sustainable development measures, with a view to maintain social legitimacy and social support. Mr Moisa also highlighted that the current European Commission has made a lot of progress in adapting its trade policies to new realities.
Trade negotiations with Australia and New Zealand
7
Mr Peter Berz, Head of Unit for Trade Relations with South Asia and South East Asia, Australia and New Zealand, European Commission, DG TRADE
Mr Berz began his speech with an overview of the timeline of the negotiations and the processes which led to their commencement. It was noted that negotiations kept up a high pace. The EU proposals have been sent to both countries, and the discussions on the basis of previous preparatory works have already led to detailed and technical discussions. Mr Berz remarked that all parties are very committed, although there will be a short pause in negotiations because of elections taking place in Australia in May 2019.
Mr Berz highlighted that based on the two rounds of negotiations they have had so far, the EU is very optimistic that all parties can come to an agreement on a good deal in the short to medium term. This was further evidenced by recent visits to Brussels from the Prime Minister of New Zealand, Jacinda Ardern, and Minister for Trade of Australia, Simon Birmingham. All parties confirmed their commitment to partaking in ambitious, high quality trade negotiations.
Mr Berz also stressed that these negotiations need to be viewed within a geopolitical context. The EU has signalled that it is willing to negotiate FTAs, and to consolidate the EU‘s presence in the wider Asian region. This can be seen through the FTA in Korea, and now the FTA with Japan. The negotiations with Australia and New Zealand will demonstrate that like-minded, developed partners can negotiate high quality agreements that are mutually beneficial.
The negotiations aim overall to reduce barriers to trade, goods and services and procurement. While benefitting both consumers and companies, these reductions to barriers will also support sustainable development. . The Commission has been transparent in the process, publishing reports, the mandate and all EU textual proposals on their website.
The EU will promote the pillars of sustainable development in alignment with the Trade for All agenda and will seek an ambitious agreement, seeking to maximise trade, decent work and environmental protection, climate change and compliance with International Labour Organisation (ILO) conventions. The EU has recently launched the sustainability impact assessment, a tool used to assess FTAs impact on economic, social and environmental areas.
While Australia and New Zealand are small economies, Mr Berz cautioned against underestimating the economic benefits of a trade deal. There is potential for significant gain, as the EU will compete on a level playing field with other countries already having FTAs with Australia and New Zealand. In the case of Australia, the EU is the second biggest trading partner, and in New Zealand, the third biggest. Together, the trade volume with these countries is comparable to that with Canada. A large amount of trade is also in the digital economy and services sector, so this is an area that could be developed. Mr Berz claimed that the agriculture sector is a challenge which needs to be carefully handled in line with the mandate, but also the EU needs to take into account that we are aiming for a win-win deal. The Commission is looking forward to exchanging offers for market access in the coming rounds of negotiations – firstly in goods followed by services and procurement. This means that negotiations will move from a textual based phase towards market offers. A civil society dialogue is also envisaged. The Commission will then report on the progress in more detail and will combine this with discussions on the sustainability impact assessment. An online questionnaire has been established as well. The Commission is open to input from the EP, civil society and NGOs to all chapters.
Mr Pascal Kerneis, Managing Director of European Services Forum and Member of the Steering Committee of the EU-Australia Leadership Forum
Mr Kerneis noted that while it has been said before that Australia and New Zealand are small countries in terms of their economies; for trade and services this is certainly not the case. Mr Kerneis highlighted the political importance and large volume of the services trade: 42 % of Australian exports to the EU and over 40 % of EU exports to Australia are in services (in terms of the balance of payment). The volume of EU
Policy Department, Directorate-General for External Policies
8
service exports amounts to 23 billion EUR, with a benefit of 14 billion EUR. The services trade is important for New Zealand as well in terms of volume as 35 % of all NZ services are services to the EU. Mr Kerneis also highlighted that the majority of FDI going outside of the EU to these countries is in services, and 87 % of all inward investment for the EU is coming to service sectors. When considering trade value added, more than 30 % of all New Zealand and Australian export goods comprise services around products. The services around products should be taken into consideration, on the top of the current trade in services statistics. Mr Kerneis then noted that service sector exports provide many medium and high skilled jobs, adding that a recent report by the EU Commission highlighted that most of export related jobs are in the service sectors (around 61 %).
Mr Kerneis acknowledged that Brexit will have a significant impact on trade in services, for both the EU and Australia and New Zealand, because these countries have a very close relationship with the UK due to historical and cultural links. He argued that this is even more reason to have a very good deal, as a certain amount of the trade from Australia and New Zealand to the UK is done using the UK as a hub to gain access to the EU single market, and this will now have to change. The EU will need to give good conditions for these companies to open a second shop somewhere in the EU 27. In terms of investment, 40 % of the outward investment of the EU to Australia and NZ is coming from the UK (and even more the other way around).
Mr Kerneis then outlined some of the priorities of the services industry. He stressed that the European service industry want a very ambitious agreement, if only, as previous speakers stated, to send a signal, because Australia and New Zealand are very like-minded partners with the EU and are part of many of the same institutions (for instance OECD, WTO) and agreements. Australia for example has been very active in the soon to be launched WTO e-commerce negotiations for the digital chapter, and has been very active in domestic regulation activity in the WTO, which can be included in the EU agreements.
In terms of market access, the service industry wants at least the equivalent of the terms in the CPTPP, and even more in some sectors if possible. The service industry wants to remove as far as possible the use of investment screening processes in Australia and NZ, or if they have to keep them, to ensure that they are as transparent as possible, with clear criteria and the possibility for companies to make an appeal. The service industry would also like to have negotiations under a full negative list (which has been tested with Japan and Canada already), with the regional level committed also. This gives more transparency to businesses, who would know what is permitted, while regional level exclusion does not provide this certainty.
In terms of sectors, in Australia there are still localisation requirements for legal and accounting services. There is progress needed in postal and courier sectors as well. The EU, Australia and New Zealand are currently only committing at a General Agreements on Trade in Services (GATS) level, which is quite low, so the aim is to reach the CPTPP level. Financial services still face some restrictions and some further clarification is needed on the legislation. Australia also has some unusual restrictions on life insurance branches as well as significant restrictions in shipping services. While New Zealand is more open than Australia; legal, financial, and accounting services still have some localisation requirements, and the telecom sector also has some restrictions that need to be lifted.
In addition to market access, Mr Kerneis stressed that regulatory cooperation should be a part of the agreements. He also raised the issue of mobility of people. Australians already receive certain automatic benefits that are not reciprocated for EU citizens, who face visa and migration restrictions. For example, the possibility for spouses and partners of employees moving with a company, as in Canada and Japan, should be looked at. The services industry want to go further on mutual recognition of qualifications for professional services, among them lawyers, accountants and nurses.
Trade negotiations with Australia and New Zealand
9
Mr Kerneis also highlighted the need to remove the localisation requirement for cross-border data flow, make public procurement more accessible with rules concerning sub-federal level too, and perhaps test the disciplines of state owned enterprises. Regarding the trade and sustainable development (TSD) chapter, Mr Kerneis urged the committee not to forget that the first letter refers to trade; adding that environmental and labour rules must be linked to trade, as otherwise they have nothing to do with a trade agreement.
In response to a question from the chair regarding the existence of current localisation requirements in New Zealand and Australia, Mr Kerneis explained that they do exist in some sectors, sometimes in the form of the obligation to have a local partner sitting on the board of a company.
Mr Daniel Azevedo - Director for Commodities and Trade, Copa-Cogeca, organisation representing European farmers and European agri-cooperatives
Mr Azevedo began with an overview of the position of farmers on multilateral trade agreements and joint attempts by the EU, New Zealand and Australia to tackle some of the multilateral issues and keep the multilateral bodies working.
In terms of bilateral trade agreements, there are both challenges and opportunities. For trade deals to work for farmers, they need to have certain conditions and be balanced within the agriculture chapter. They need to include all the chain in agriculture, including processed products, they need to tackle species issues and need to take into account the accumulative impact of trade on sensitive sectors. Mr Azevedo stressed that all farmers are currently under pressure from trade challenges. Brexit in particular will have important consequences for farmers and should be taken into account on all trade negotiations. This should include what the EP provided in its resolution on the apportionment of tariff rate quotas included in the WTO schedule of the Union following the Brexit.
Mr Azevedo recognised that the EU, New Zealand and Australia have high standards regarding consumer protection and food safety and added that COPA-COGECA sees both negotiations as a part of the same trade agenda, as with Canada and Mexico. In this context, EU agricultural exports are ready to perform. It was added that trade deals must be mutually beneficial for all trade partners. Mr Azevedo expressed support for the Commission’s approach to treat the trade negotiations with Australia and New Zealand separately. With Australia, bilateral agricultural trade in food products has a growing surplus; the EU imports around 2 billion worth of agri-food exports from Australia, and exports around 2,9 billion. Certain sensitive sectors need special treatment because of cumulative trade impacts or seasonality, such as sheep meat, beef, sugar and rice. There are also some opportunities related to dairy, processed products, particularly tomatoes, wine, pig-meat and tackling non-tariff measures and GIs.
Regarding New Zealand, it is a small country that appreciates EU goods and trade is well developed between the two. The EU has a large deficit in agri-food trade with NZ and even doubling EU export potential would never cover this deficit. Farmers will need to see how some sectors perform in negotiations in order to contribute to the overall balance of the agreement (especially in dairy, beef, sheep, wine and some fruits and vegetables).
In both negotiations, the EU needs to keep in mind aspects such as tariff-quota management, recognition of the EU as a single entity, regionalisation, and GIs.
In his concluding remarks, Mr Azevedo underlined the need for a balanced agreement within the agriculture chapter; where concessions to sensitive sectors are minimised, taking into account the realities of market structures and seasonality. It was added that now it is up to the negotiators to come up with an outcome that COPA-COGECA can support.
Mr Moisă then noted that one interesting take away from the presentation is that the EU also has offensive interests in agriculture, in contrast to the perception that EU interests are purely defensive. For example,
Policy Department, Directorate-General for External Policies
10
there are areas such as dairy, processed agriculture products, wine and pig meat where the EU is offensive, and GIs remain crucial for the overall balance of things. Mr Moisă expressed his hope that parties can reach a balanced agreement, first within agricultural sector and then for entire deal.
Mr David Taylor, New Zealand's Ambassador to the European Union
Mr Taylor reiterated that New Zealand wants to work with the EU to ensure that a high quality, balanced, mutually beneficial trade agreement can be completed. He noted that the New Zealand Prime Minister Jacinda Ardern was in Brussels the previous week and in conversations with EU leaders, they made it clear that they wanted to work quickly with New Zealand to reach a conclusion to the negotiations for a trade agreement.
Mr Taylor raised the geopolitical points previous speakers made; acknowledging that it is a tough time for all of us in trade, and this agreement sends a positive signal and underlines the values and interests that we share. New Zealand may be far from Brussels, but in terms of values and interests, it aligns very closely with the EU.
Mr Taylor highlighted the progressive elements in the FTA, stating that New Zealand does believe in these and that there are trade elements that can be usefully incorporated in agreement to bring benefits to both sides. In this context, Mr Taylor noted also that negotiations are a careful balancing act to be dealt with by negotiators.
Mr Taylor reiterated that the point about offensive and defensive interests in agriculture is important. The demand for food globally is growing – the three partners [EU, New Zealand and Australia] will be important in feeding the world. However, New Zealand has a smaller production of agriculture in key sensitive commodities compared to Europe, and it markets products in over 100 countries around the world, so it won’t be bringing a whole lot more exports to Europe which hopefully will help reassure farmers. New Zealand buys more cars from Europe than it does anywhere else. It is not looking to compete within this industry. Therefore, regarding agriculture, it is important to look at the whole deal, not just individual areas. In response to the unratified conventions regarding freedom of association and elimination of child labour, Mr Taylor reiterated that New Zealand fully adheres to these principles and has no problems with these issues; it merely has some technical issues with how the ILO has interpreted some of these provisions. He also agreed that there was a lot of opportunities for more cooperation on services and better arrangements on investment.
Ms Helen Stylianou, Australia’s Deputy Head of Permanent Mission to the European Union
Ms Stylianou stressed that the political context for these negotiations is important and that collaboration between Australia and the EU is important across a number of international issues such as combatting terrorism, the non-proliferation of nuclear and conventional weapons, promoting peace, sustainable development and human rights. The deputy ambassador reiterated that the agreement sends a very important signal of what is possible in an international, rules-based system.
Ms Stylianou noted that Dr Curran’s report could be useful in some “myth busting” about Australia. For example, the deputy ambassador noted from the presentation that of the top ten Australian exports to the EU, only two of those were agricultural exports apart from wine. Agriculture comprises only 3 % of the Australian economy, and she also reflected that while there are 22 million farmers in the EU, there are only 25 million Australians altogether. Dr Curran’s presentation also showed how heavily both current trading goods and services are in favour of the EU – in part due to the fact that Australia has had very limited preferential access to the EU. Ms Stylianou stressed that Australian exports are at a big disadvantage because Australia is still trading under Uruguay round conditions which were established 20 years ago, while the EU has negotiated a number of trade agreements with Australia’s competitors in the meantime. Concerning services, Australian exporters want certainty and opportunity in key sectors such as education, financial and professional services. Australia wants a framework for the mutual recognition of professional
Trade negotiations with Australia and New Zealand
11
licensing and qualifications that will make it easier to do business across the EU market. They also want to explore rules and initiatives to support the digital economy, innovation and increased opportunities for high-tech start-ups.
Ms Stylianou minimised the impact of Brexit, noting that the EU will remain Australia’s second largest market and trading partner even after Brexit, and that almost two thirds of Australia trade with Europe is with the EU 27. The EU 27 will still be Australia’s second largest source of imports, and second largest services market. Ms Stylianou also stressed that the trade balance will continue to be very much in the EU27’s favour, demonstrated by the fact that for EUR 1 of exports, Australians buy EUR 3,25 of European imports.
In terms of the chapter on trade and sustainability development, Ms Stylianou reinforced the notion that Australia has extremely high international standards and commitments to the sustainable development field, including the Paris Agreement and all but one of the ILO conventions. Ms Stylianou clarified that the Australian Prime Minister Scott Morrison has said that Australia will stand on international commitments and will meet Paris Agreement targets. Ms Stylianou explained that Australia is in the domestic process to ratify the last ILO convention.
Concluding remarks
In his concluding remarks, Mr Moisă noted the important role that the UK plays in both the trade and investment relationships between the EU and Australia and New Zealand. This might be explained by the fact that companies use the UK as a launching pad to access the entire EU market. Nevertheless, Mr Moisă emphasised that the FTA negotiations will deepen ties between the EU27, Australia and New Zealand, and will produce a rapprochement in economic terms between them. He argued that these negotiations will remain extremely useful, important and relevant, irrespective of the outcome of Brexit and its potential hard or soft final form, thus regardless of whether the UK is covered by the final FTAs or not. He noted that there is trade diversion on both sides – all parties have preferential FTA agreements with other countries but not with each other, which is a potential difficulty thathas been stressed on the European side as well as from the Australian and New Zealand end. It was added that it is high time we no longer trade on a Most favoured nation (MFN) basis and instead have a preferential agreement between us.
The overall political and moral signal that engaging in these negotiations sends at a time of crisis in the international rules-based order was also taken to heart. The chair noted that there will definitely be progressive elements in both agreements. It was added that it is inherent that in the new trade policy of Europe, irrespective of the political nuances and biases, we now have a more progressive trade policy than the one we used to have, and this policy resonates well around the world in various ways. Additionally, consistent support for the Paris Climate Agreement and more generally for this trade regime that we seek to develop is also an important signal for Brussels.
In the final concluding remarks, Dr Curran reiterated that these are complex and multi-faceted negotiations which we are trying to develop and complete very quickly. As there are many opportunities and the negotiations are important for many reasons, Dr Curran stressed that this highlights the benefit of having good academic analysis behind the negotiations, and hoped that the report will be useful in this regard.
Policy Department, Directorate-General for External Policies
12
STUDY:
Trade negotiations with Australia and New Zealand
by Louise Curran
ABSTRACT
This study explores the context and potential of the FTA negotiations between the EU and Australia and New Zealand. Through an analysis of the status quo, as well as several academic and policy analyses, it highlights the main opportunities for the EU from the negotiations, as well as potential threats and obstacles to agreement. The study explores in detail the likely impacts of market opening on trade in goods and services, as well as the potential in other key areas, including public procurement and investment. It also highlights the current architecture of FTAs which Australia and New Zealand have established, especially the very recent Comprehensive and Progressive Trans Pacific Partnership (CPTPP), to which both are party. It explores how these agreements impact on the EU’s competitiveness in the Australian and New Zealand markets and how FTAs could be leveraged to improve EU integration with these partners and their broader region. The study also considers how trade and sustainable development (TSD) can be effectively integrated into the agreements, in line with the objectives of the EU’s ‘Trade for All’ strategy. Finally, several potential wider, more political impacts of the FTAs are underlined.
Trade negotiations with Australia and New Zealand
13
1 Introduction This study will explore key aspects of the current negotiations for Free Trade Agreements (FTAs) which the EU1 is undertaking with both Australia and New Zealand. It will provide a summary of the overall context in the two countries, as well as their existing trade policy architecture and address the following key issues:
• The likely impacts of these FTAs on trade in goods and services – highlighting those sectors where there are important opportunities for the EU, as well as those where market opening poses some risks of displacement for EU producers.
• The potential for these FTAs to create opportunities in other key areas covered by the agreements, including non-tariff barriers, investment and public procurement.
• In view of the importance attached to the issue of trade and sustainable development (TSD) by both countries, as well as the EU, the report will also explore how these issues can be effectively integrated into these FTAs.
1.1 Overall context - Australia Australia is a well-regulated, developed country of 24,6 million people, which has seen over two decades of uninterrupted growth. Its GDP is roughly equivalent to that of Spain and it has a GDP/capita which substantially exceeds that of the EU. Some key data comparing Australia, New Zealand and the EU28 and EU27 are provided in Table1. Although Australia is a relatively large market, it is also very far distant – around 15,000km. It is a very open economy, with low applied tariffs, where goods trade represents a third of GDP. In contrast to the EU, Australia has lower tariffs in agriculture than in manufactured goods, although, as discussed below, there are some tariff peaks in both sectors. Agricultural goods are important to the economy and Australia was a founding member of the ‘Cairns Group’ of agricultural exporters, which seeks to promote the liberalisation of agricultural products, especially in the World Trade Organisation (WTO).2 However, as discussed below, its export mix to the EU is more focused on fuel and metals. In addition, the Australian economy is increasingly service based, thus the traditional view of Australia as primarily an agricultural economy needs to be somewhat revised.
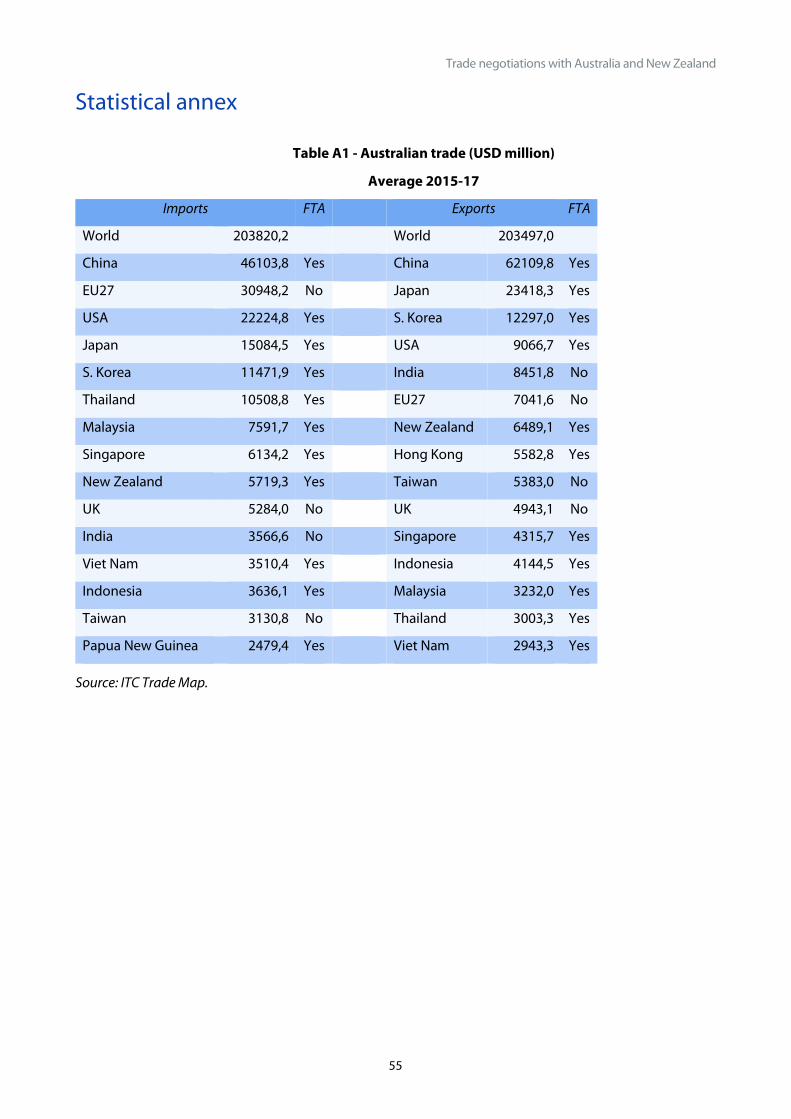
Australia’s trade is strongly oriented to the Asian region, with China its most important source and destination for goods. Nevertheless, the EU27 is important, being its second source of imports and sixth market. As indicated in the table, it is also by far the most important trade partner with whom Australia has not negotiated a Free Trade Agreement (FTA). This fact is clearly one key motivation behind the current negotiations from an Australian perspective.
1 Throughout this report when the terminology ‘EU’ is used, unless otherwise specified, the author is referring to EU28. EU27 refers to the EU after Brexit. 2 https://cairnsgroup.org/pages/default.aspx
Policy Department, Directorate-General for External Policies
14
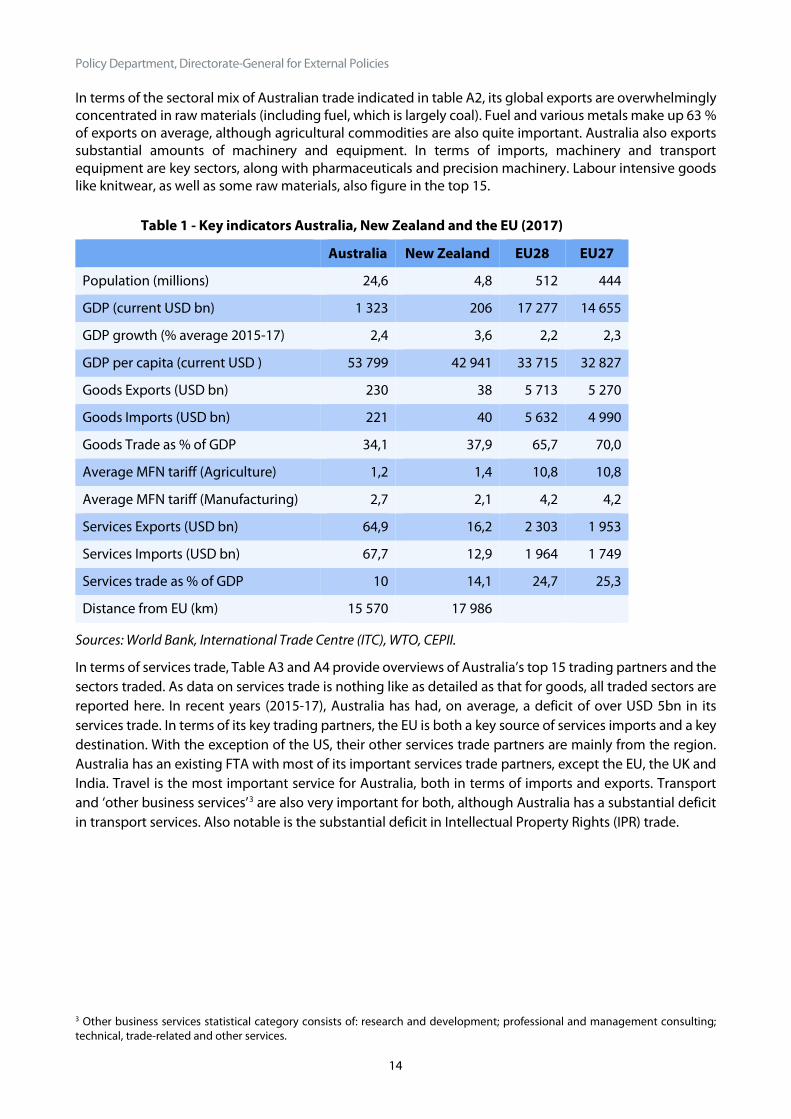
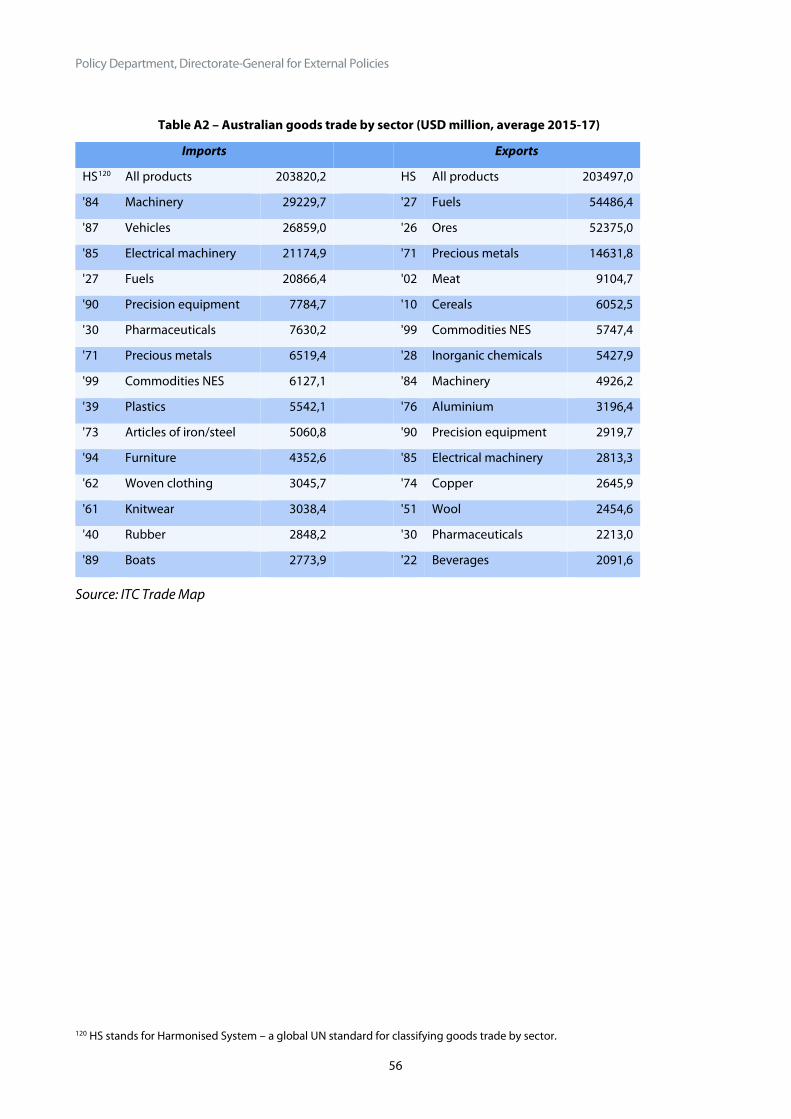
In terms of the sectoral mix of Australian trade indicated in table A2, its global exports are overwhelmingly concentrated in raw materials (including fuel, which is largely coal). Fuel and various metals make up 63 % of exports on average, although agricultural commodities are also quite important. Australia also exports substantial amounts of machinery and equipment. In terms of imports, machinery and transport equipment are key sectors, along with pharmaceuticals and precision machinery. Labour intensive goods like knitwear, as well as some raw materials, also figure in the top 15.
Table 1 - Key indicators Australia, New Zealand and the EU (2017)
Australia New Zealand EU28 EU27
Population (millions) 24,6 4,8 512 444
GDP (current USD bn) 1 323 206 17 277 14 655
GDP growth (% average 2015-17) 2,4 3,6 2,2 2,3
GDP per capita (current USD ) 53 799 42 941 33 715 32 827
Goods Exports (USD bn) 230 38 5 713 5 270
Goods Imports (USD bn) 221 40 5 632 4 990
Goods Trade as % of GDP 34,1 37,9 65,7 70,0
Average MFN tariff (Agriculture) 1,2 1,4 10,8 10,8
Average MFN tariff (Manufacturing) 2,7 2,1 4,2 4,2
Services Exports (USD bn) 64,9 16,2 2 303 1 953
Services Imports (USD bn) 67,7 12,9 1 964 1 749
Services trade as % of GDP 10 14,1 24,7 25,3
Distance from EU (km) 15 570 17 986
Sources: World Bank, International Trade Centre (ITC), WTO, CEPII.
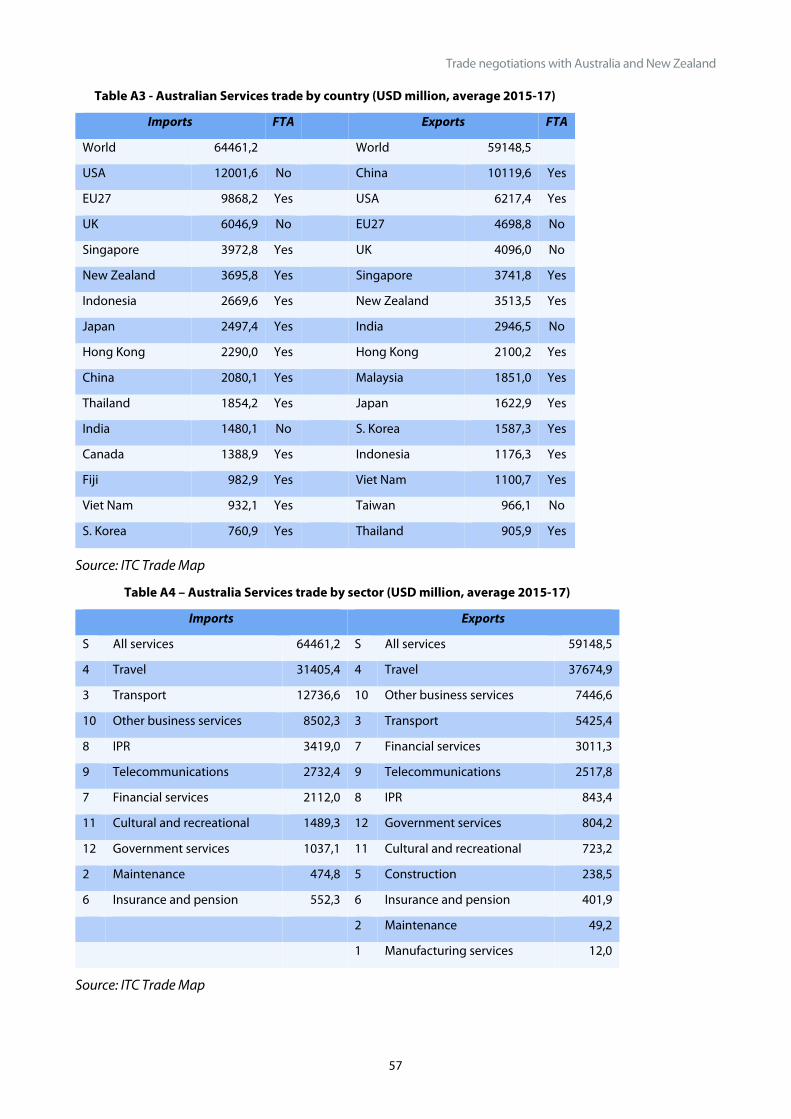
In terms of services trade, Table A3 and A4 provide overviews of Australia’s top 15 trading partners and the sectors traded. As data on services trade is nothing like as detailed as that for goods, all traded sectors are reported here. In recent years (2015-17), Australia has had, on average, a deficit of over USD 5bn in its services trade. In terms of its key trading partners, the EU is both a key source of services imports and a key destination. With the exception of the US, their other services trade partners are mainly from the region. Australia has an existing FTA with most of its important services trade partners, except the EU, the UK and India. Travel is the most important service for Australia, both in terms of imports and exports. Transport and ‘other business services’3 are also very important for both, although Australia has a substantial deficit in transport services. Also notable is the substantial deficit in Intellectual Property Rights (IPR) trade.
3 Other business services statistical category consists of: research and development; professional and management consulting; technical, trade-related and other services.
Trade negotiations with Australia and New Zealand
15
1.2 Overall context - New Zealand New Zealand is an economy of nearly 5 million people, about the same size as Ireland, in terms of population. Although not as rich as Australia, it also as a higher GDP/capita than the EU average. It is even more far distant from the EU, at nearly 18,000km. It is also a very open economy, with similar levels of tariffs on both manufacturing and agriculture to Australia. Like the latter, it was a founding member of the Cairns group and has consistently argued for greater liberalisation of agricultural markets. However, its economy is also evolving towards a stronger dependence on services trade.
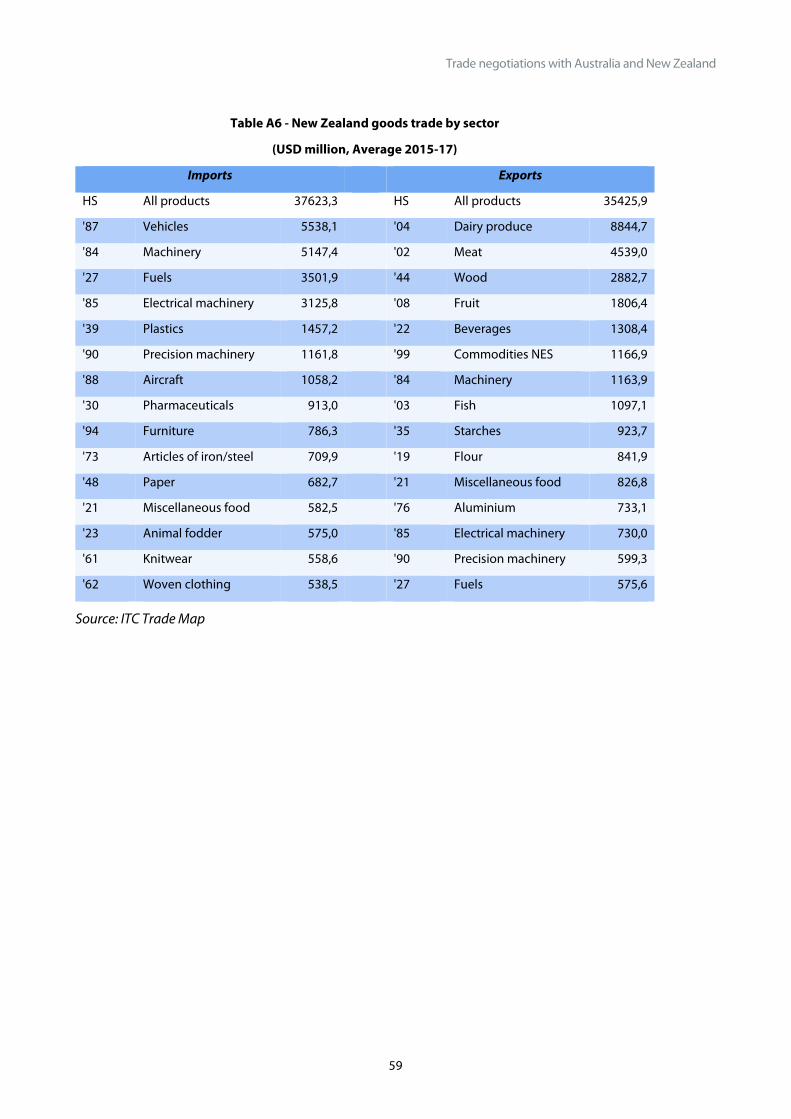
Table A5 and A6 in annex report New Zealand’s key goods trade partners and the sectoral mix of trade in recent years. China is its most important source of goods, with the EU27 the second most important supplier. With the exception of the US, most of the other key sources are in the region. In terms of its export markets, China and other key regional markets are dominant, with the EU27 being the 4th most important market. Like Australia, much of New Zealand’s trade is with its FTA partners, with the exception of the EU, but also the US. The Trans-Pacific Partnership (TPP) would have filled that particular gap in New Zealand’s trade agreements, however the withdrawal of the US from the agreement means that their bilateral relationship with the US is unlikely to evolve significantly in the near future.
The sectoral makeup of New Zealand’s imports is quite similar to that of Australia, with machinery, transport equipment, pharmaceuticals and labour-intensive goods being key sectors, although animal fodder and food imports are more important. On the export side, agricultural commodities are clearly key to New Zealand’s export performance, with meat, dairy and fruit making up 43 % of total exports, although fish, machinery and equipment also figure in the top 15.
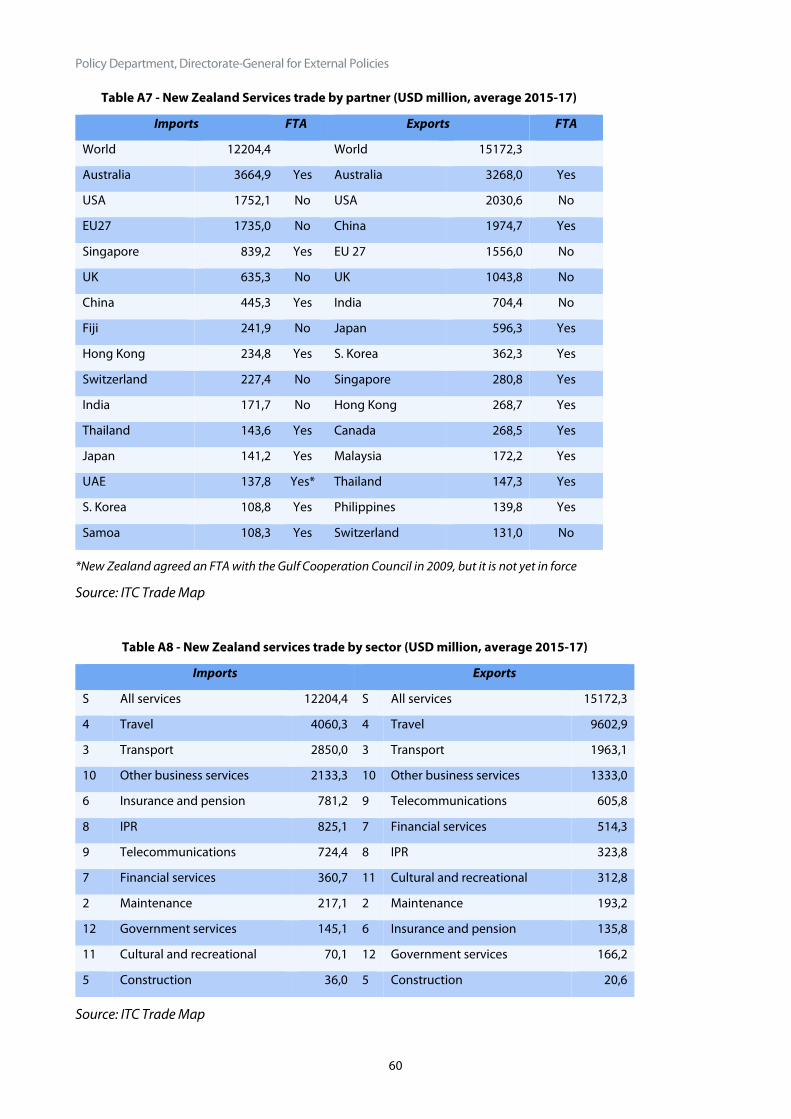
In terms of services trade, Table A7 and A8 provide overviews of the top 15 trading partners and the key sectors traded in recent years. Unlike Australia, New Zealand had a substantial surplus (nearly USD 3bn, on average) in its services trade over the period 2015-17. The most important sources of services for New Zealand in the period were Australia, the US and the EU27. These three are also very important destinations for exports. New Zealand has FTAs with fewer of its services trade partners than Australia, as there are no preferential agreements with either the EU or the US, while other important partners like India, Fiji and Switzerland are also not currently covered by any specific market access arrangements. Like for Australia, travel and transport are key to New Zealand’s services trade in both directions. There has been a substantial surplus (on average USD 5,5bn) in travel services in recent years.
Policy Department, Directorate-General for External Policies
16
2 The status quo 2.1 The trade context As is clear from the tables discussed above, the EU has a trade surplus with both countries in goods and services, although obviously the bilateral trade situation varies, depending on the commodity or service in question. This section will explore in detail the current situation in EU bilateral goods and services trade for both countries. It will firstly briefly consider the overall trends and the likely impact of Brexit on trade patterns, before analysing trade between the EU27 and both countries. It is important to consider the former issue when analysing trade with these two partners, not least because all the key prior analyses of the impact of these FTAs were conducted on the basis of data for the EU28.4
2.1.1 Trends in the EU’s trade in goods and services with Australia and the impact of Brexit
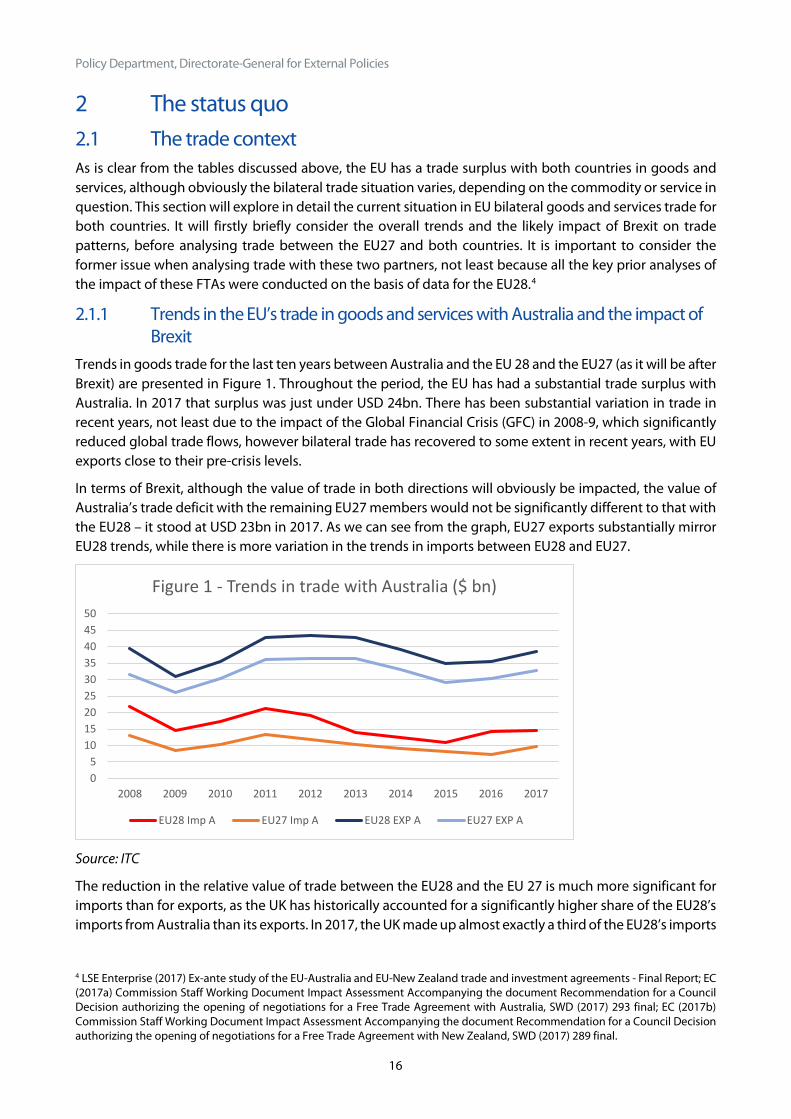
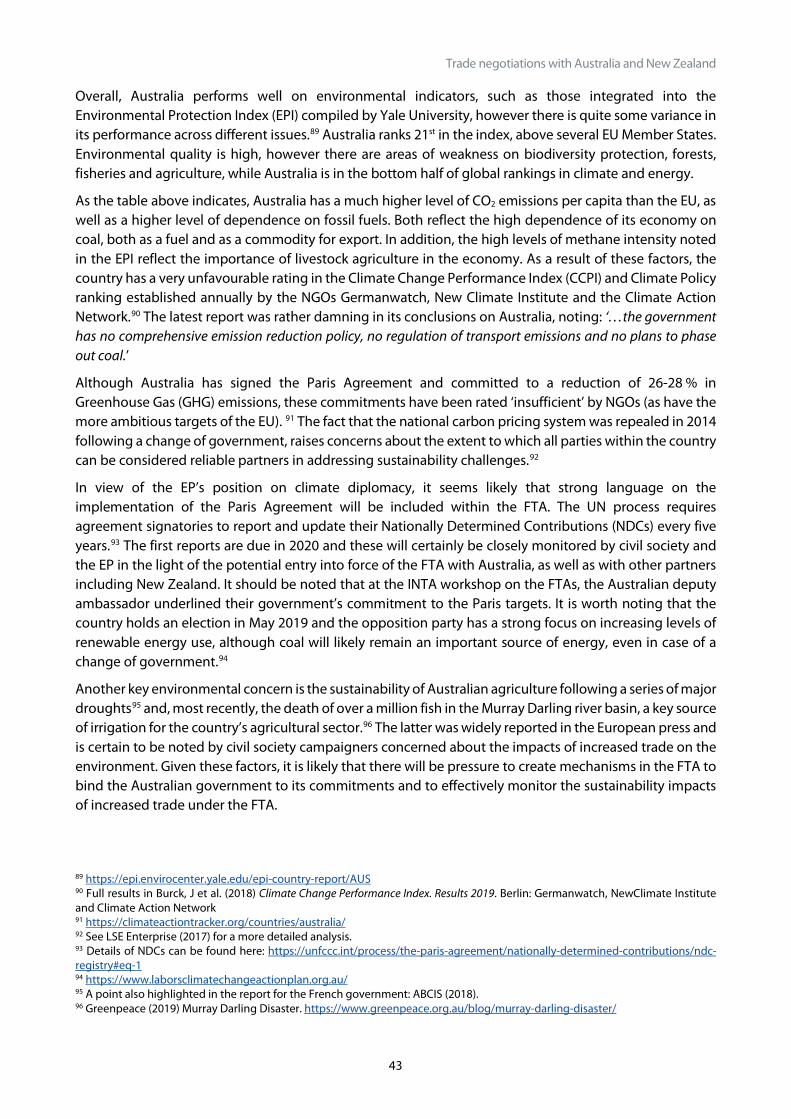
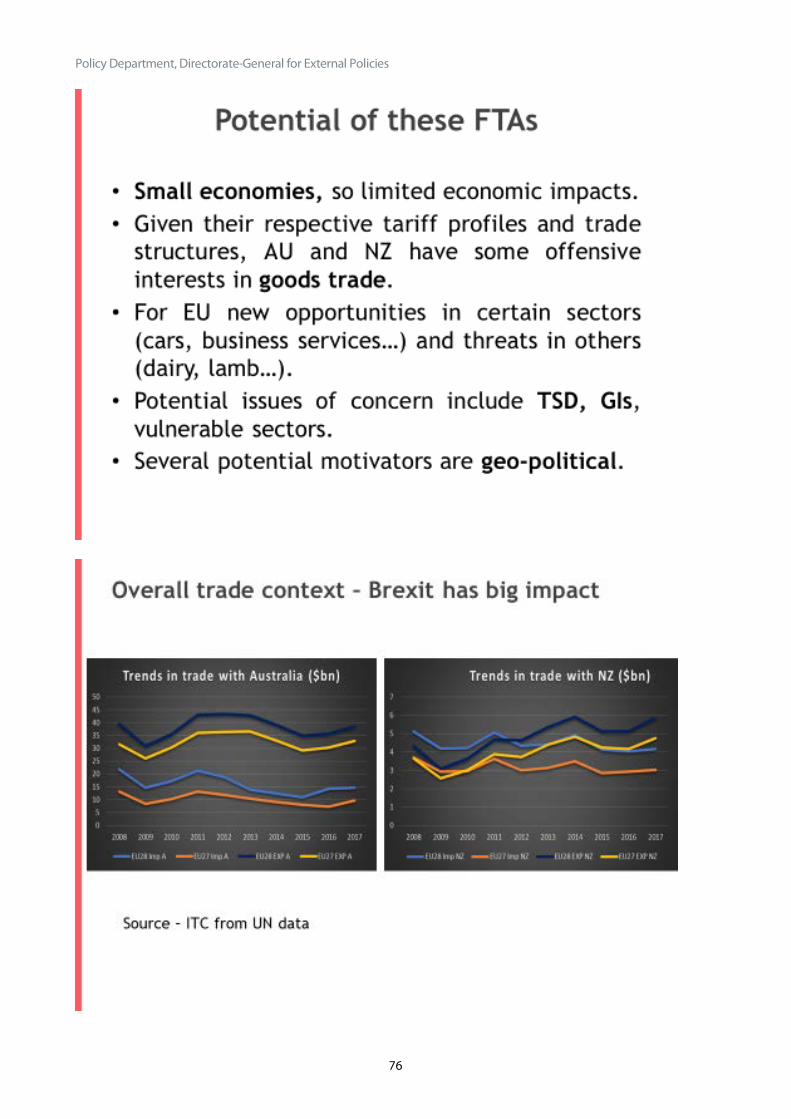
Trends in goods trade for the last ten years between Australia and the EU 28 and the EU27 (as it will be after Brexit) are presented in Figure 1. Throughout the period, the EU has had a substantial trade surplus with Australia. In 2017 that surplus was just under USD 24bn. There has been substantial variation in trade in recent years, not least due to the impact of the Global Financial Crisis (GFC) in 2008-9, which significantly reduced global trade flows, however bilateral trade has recovered to some extent in recent years, with EU exports close to their pre-crisis levels.
In terms of Brexit, although the value of trade in both directions will obviously be impacted, the value of Australia’s trade deficit with the remaining EU27 members would not be significantly different to that with the EU28 – it stood at USD 23bn in 2017. As we can see from the graph, EU27 exports substantially mirror EU28 trends, while there is more variation in the trends in imports between EU28 and EU27.
Source: ITC
The reduction in the relative value of trade between the EU28 and the EU 27 is much more significant for imports than for exports, as the UK has historically accounted for a significantly higher share of the EU28’s imports from Australia than its exports. In 2017, the UK made up almost exactly a third of the EU28’s imports
4 LSE Enterprise (2017) Ex-ante study of the EU-Australia and EU-New Zealand trade and investment agreements - Final Report; EC (2017a) Commission Staff Working Document Impact Assessment Accompanying the document Recommendation for a Council Decision authorizing the opening of negotiations for a Free Trade Agreement with Australia, SWD (2017) 293 final; EC (2017b) Commission Staff Working Document Impact Assessment Accompanying the document Recommendation for a Council Decision authorizing the opening of negotiations for a Free Trade Agreement with New Zealand, SWD (2017) 289 final.
05
101520253035404550
2008 2009 2010 2011 2012 2013 2014 2015 2016 2017
Figure 1 - Trends in trade with Australia ($ bn)
EU28 Imp A EU27 Imp A EU28 EXP A EU27 EXP A
Trade negotiations with Australia and New Zealand
17
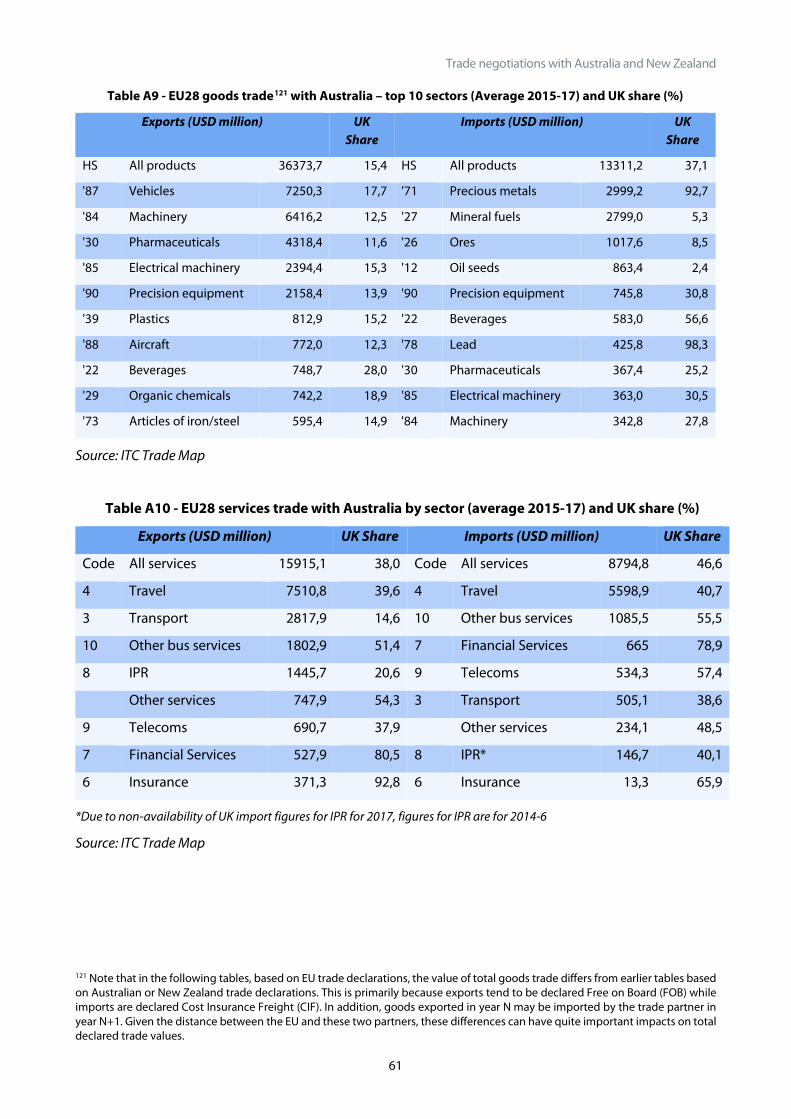
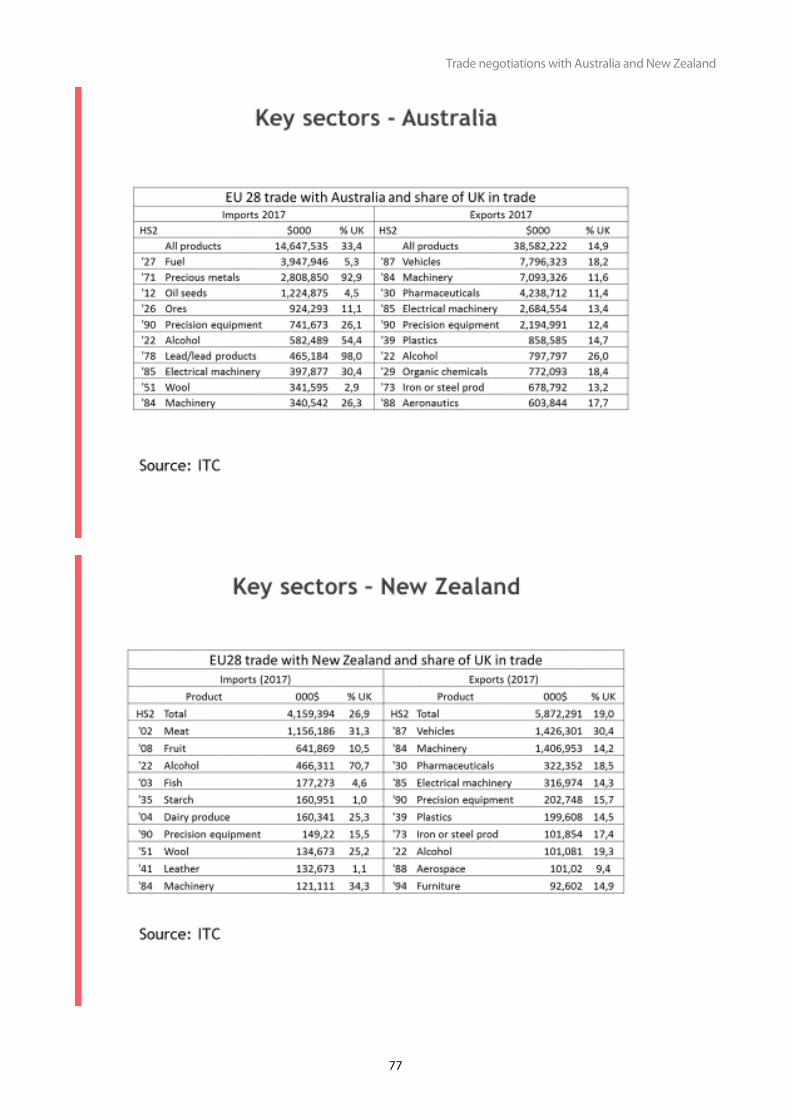
from Australia, whereas it represented just under 15 % of equivalent exports. The relative importance of the UK varies depending on the goods in question. Table A9 in the annex provides details of the top ten sectors of EU28 trade with Australia and the importance of the UK in each sector. As with the figures on overall trade above, the tables use three-year averages to give a longer-term perspective. In relation to exports, the UK is only significant in the beverages sector, where it represented, on average 28 % of exports in recent years. These exports are almost entirely made up of whiskey. In terms of EU imports, the UK accounts for the vast majority of EU28 imports in precious metals and lead and also accounts for above average amounts of beverages (mainly wine). The UK is relatively unimportant (less than 10 %) to EU28 imports in mineral fuels (mainly coal), ores and oil seeds. In the following section we will explore in more detail the trade flows between the EU27 and Australia.
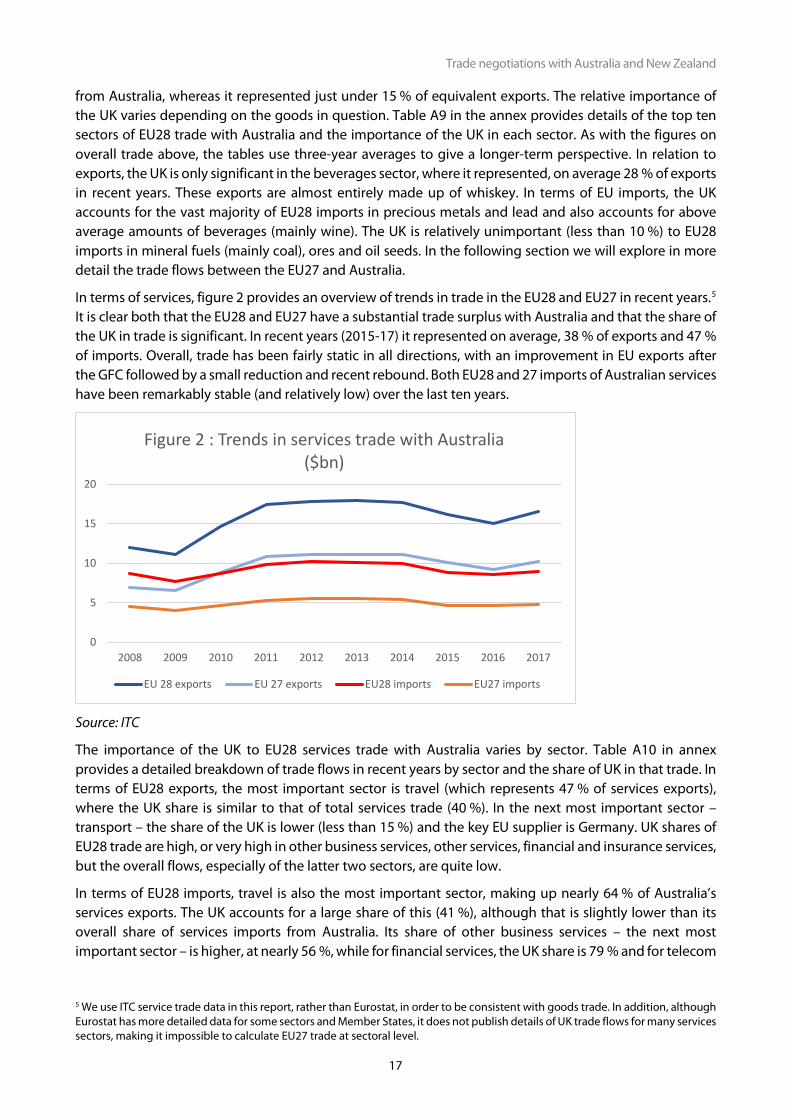
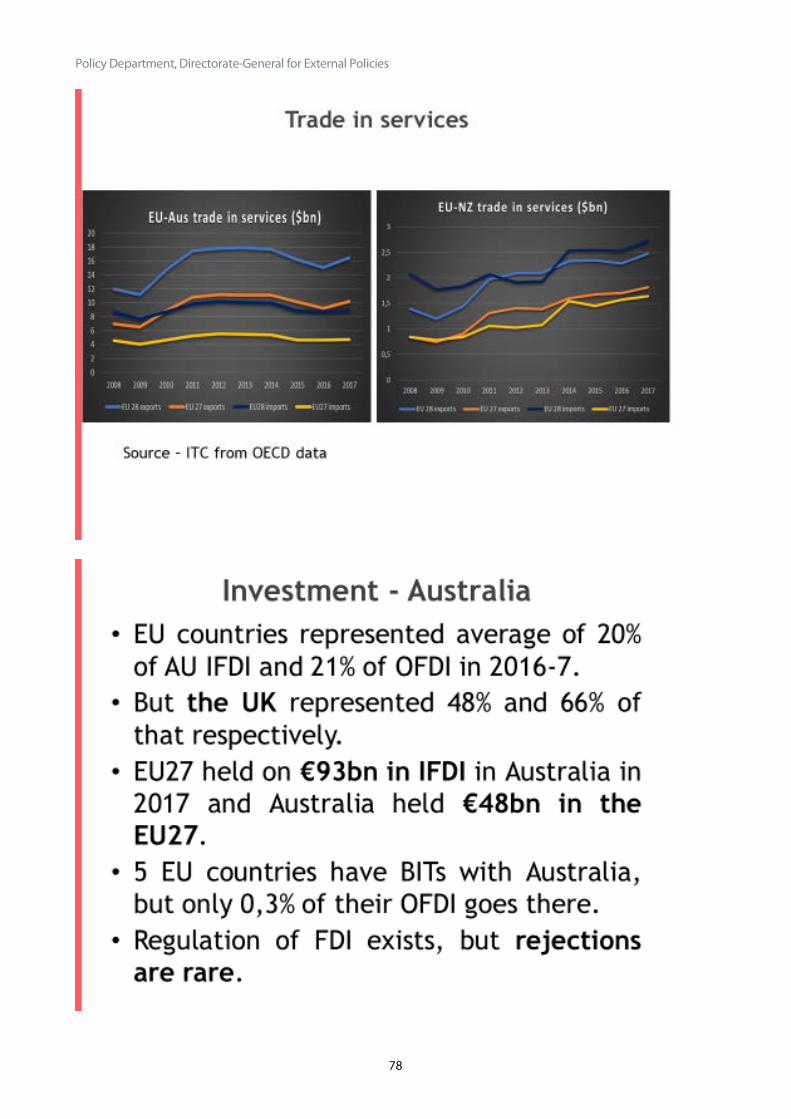
In terms of services, figure 2 provides an overview of trends in trade in the EU28 and EU27 in recent years.5 It is clear both that the EU28 and EU27 have a substantial trade surplus with Australia and that the share of the UK in trade is significant. In recent years (2015-17) it represented on average, 38 % of exports and 47 % of imports. Overall, trade has been fairly static in all directions, with an improvement in EU exports after the GFC followed by a small reduction and recent rebound. Both EU28 and 27 imports of Australian services have been remarkably stable (and relatively low) over the last ten years.
Source: ITC
The importance of the UK to EU28 services trade with Australia varies by sector. Table A10 in annex provides a detailed breakdown of trade flows in recent years by sector and the share of UK in that trade. In terms of EU28 exports, the most important sector is travel (which represents 47 % of services exports), where the UK share is similar to that of total services trade (40 %). In the next most important sector – transport – the share of the UK is lower (less than 15 %) and the key EU supplier is Germany. UK shares of EU28 trade are high, or very high in other business services, other services, financial and insurance services, but the overall flows, especially of the latter two sectors, are quite low.
In terms of EU28 imports, travel is also the most important sector, making up nearly 64 % of Australia’s services exports. The UK accounts for a large share of this (41 %), although that is slightly lower than its overall share of services imports from Australia. Its share of other business services – the next most important sector – is higher, at nearly 56 %, while for financial services, the UK share is 79 % and for telecom
5 We use ITC service trade data in this report, rather than Eurostat, in order to be consistent with goods trade. In addition, although Eurostat has more detailed data for some sectors and Member States, it does not publish details of UK trade flows for many services sectors, making it impossible to calculate EU27 trade at sectoral level.
0
5
10
15
20
2008 2009 2010 2011 2012 2013 2014 2015 2016 2017
Figure 2 : Trends in services trade with Australia ($bn)
EU 28 exports EU 27 exports EU28 imports EU27 imports
Policy Department, Directorate-General for External Policies
18
it is 57 %. Thus, for several key services sectors for Australia’s offensive interests, Brexit has a significant impact on the coverage of the FTA.
2.1.2 Trends in the EU’s trade in goods and services with New Zealand and the impact of Brexit.
Trends in goods trade for the last ten years between New Zealand and the EU 28 and EU27 are presented in Figure 3. Trends in imports have been relatively stable, although trending downward, while EU exports have been increasing, such that a trade deficit in 2008 has been turned into a surplus in recent years. In 2017 the EU28’s surplus was just over USD 1,7bn.
Source ITC
Although the value of trade in both directions will clearly be impacted by Brexit, the value of the EU27 trade surplus with New Zealand is almost exactly the same as that of the EU28. As for Australia, the reduction in the relative value of trade is more significant for imports than for exports. In 2017, the UK made up 27 % of the EU28’s imports from New Zealand, whereas it represented 17 % of equivalent exports.
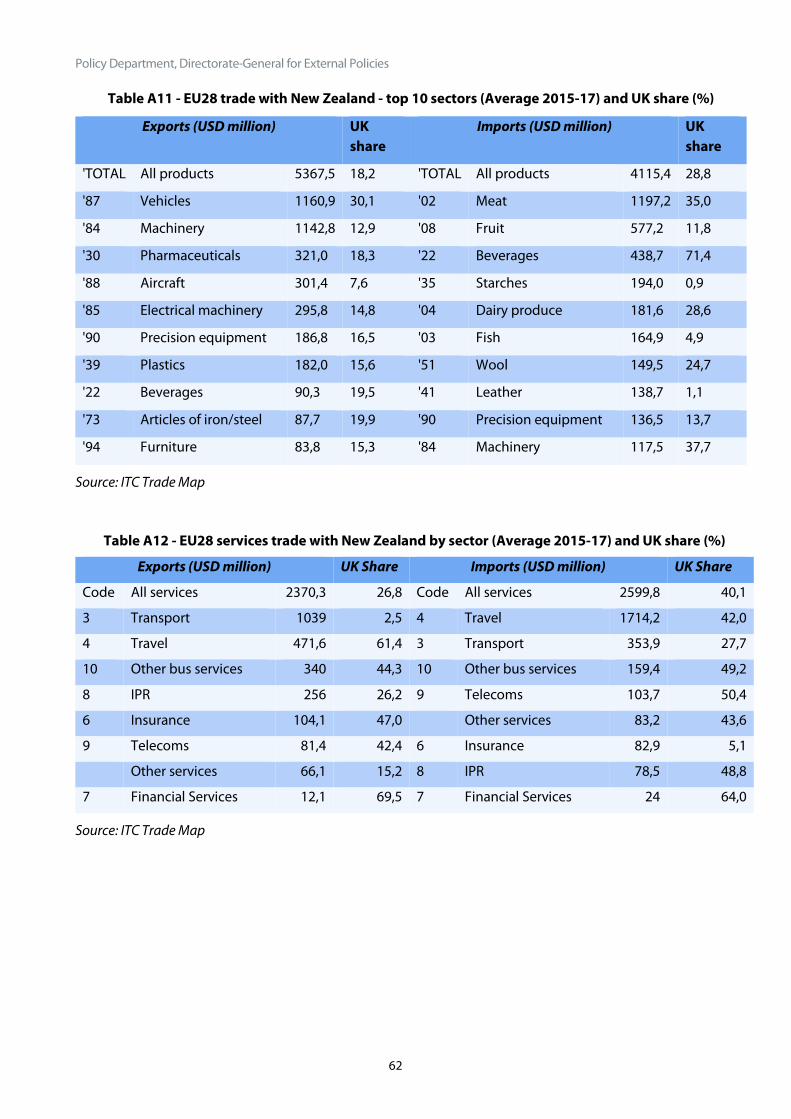
The relative importance of the UK varies depending on the goods in question. Table A11 in the annex provides details of the top ten sectors of EU28 trade (3-year average) with New Zealand and the importance of the UK in each sector. For EU exports, the UK is only significant in vehicles, where it represented, on average, 30 % of exports in recent years. In terms of EU imports, the UK accounts for the majority of EU28 imports in beverages (mainly wine) and above average levels of imports in meat and machinery. The UK is relatively unimportant (less than 10 %) to EU28 imports in starches, leather and fish. In the following section we will explore in more detail the trade flows between the EU27 and New Zealand.
Trade negotiations with Australia and New Zealand
19
Source: ITC
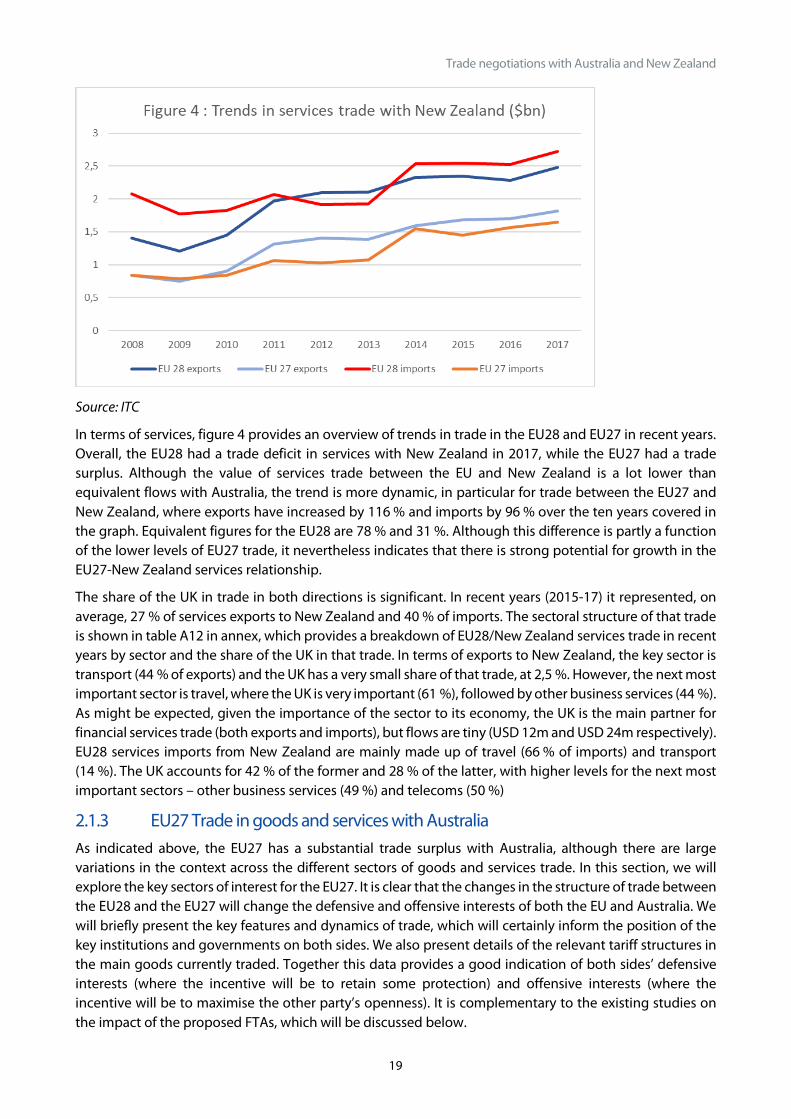
In terms of services, figure 4 provides an overview of trends in trade in the EU28 and EU27 in recent years. Overall, the EU28 had a trade deficit in services with New Zealand in 2017, while the EU27 had a trade surplus. Although the value of services trade between the EU and New Zealand is a lot lower than equivalent flows with Australia, the trend is more dynamic, in particular for trade between the EU27 and New Zealand, where exports have increased by 116 % and imports by 96 % over the ten years covered in the graph. Equivalent figures for the EU28 are 78 % and 31 %. Although this difference is partly a function of the lower levels of EU27 trade, it nevertheless indicates that there is strong potential for growth in the EU27-New Zealand services relationship.
The share of the UK in trade in both directions is significant. In recent years (2015-17) it represented, on average, 27 % of services exports to New Zealand and 40 % of imports. The sectoral structure of that trade is shown in table A12 in annex, which provides a breakdown of EU28/New Zealand services trade in recent years by sector and the share of the UK in that trade. In terms of exports to New Zealand, the key sector is transport (44 % of exports) and the UK has a very small share of that trade, at 2,5 %. However, the next most important sector is travel, where the UK is very important (61 %), followed by other business services (44 %). As might be expected, given the importance of the sector to its economy, the UK is the main partner for financial services trade (both exports and imports), but flows are tiny (USD 12m and USD 24m respectively). EU28 services imports from New Zealand are mainly made up of travel (66 % of imports) and transport (14 %). The UK accounts for 42 % of the former and 28 % of the latter, with higher levels for the next most important sectors – other business services (49 %) and telecoms (50 %)
2.1.3 EU27 Trade in goods and services with Australia As indicated above, the EU27 has a substantial trade surplus with Australia, although there are large variations in the context across the different sectors of goods and services trade. In this section, we will explore the key sectors of interest for the EU27. It is clear that the changes in the structure of trade between the EU28 and the EU27 will change the defensive and offensive interests of both the EU and Australia. We will briefly present the key features and dynamics of trade, which will certainly inform the position of the key institutions and governments on both sides. We also present details of the relevant tariff structures in the main goods currently traded. Together this data provides a good indication of both sides’ defensive interests (where the incentive will be to retain some protection) and offensive interests (where the incentive will be to maximise the other party’s openness). It is complementary to the existing studies on the impact of the proposed FTAs, which will be discussed below.
Policy Department, Directorate-General for External Policies
20
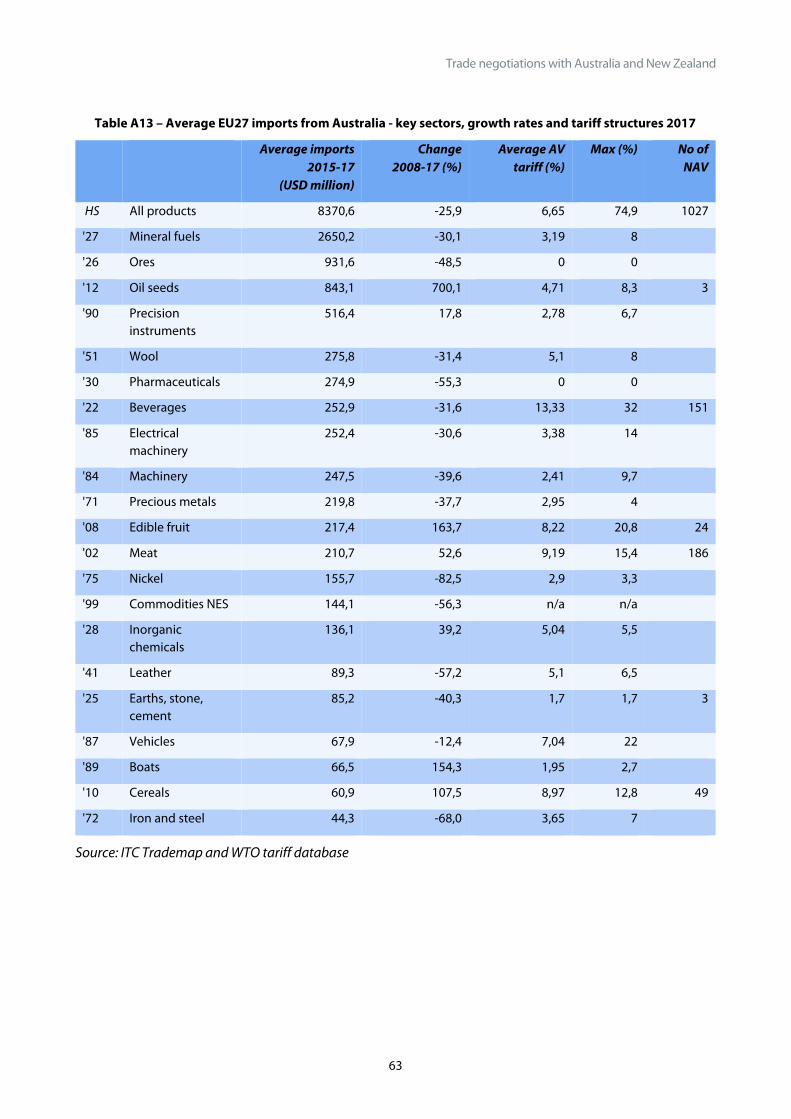
In terms of the EU27’s defensive interests, Table A13 provides details of the top twenty sectors for goods imported from Australia in recent years (2015-17), together with their growth rates over the last ten years and the average applied tariffs, as reported in the WTO database. The table shows that, as Figure 1 indicates, EU27 trade with Australia has not been dynamic in recent years. Overall imports have fallen by 26 %, although there are a few sectors where they have increased, notably oil seeds, fruit, boats and cereals.
The tariff figures presented in the table are averages for all dutiable tariff lines.6 They are trade weighted, but only report ad-valorem (AV) tariffs, i.e. those that are applied as simple percentages of the declared value of goods. Several key sectors for Australian exports to the EU, mainly in the agricultural sector, are also subject to non-ad-valorem (NAV) tariffs, usually fixed charges by weight or volume. The impact of these tariffs on trade is more difficult to quantify, although the modelling exercises discussed below seek to incorporate them into their simulations. These sectors are often the most sensitive for the EU and so it is likely that the most difficult negotiations will take place in relation to these goods.
However, even when focusing only on AV tariffs, as indicated in the table, there are tariff peaks in products of interest to Australia, which the negotiations will certainly seek to address. Key amongst these in the agricultural sectors are fruit, oil seeds and cereals, but also beverages and meat (where NAV tariffs will also be a key issue). In non-agricultural goods, there are tariff peaks in some sectors of interest to Australian exporters: raw materials (leather, Iron and steel), mechanical and electrical machinery and precision instruments.
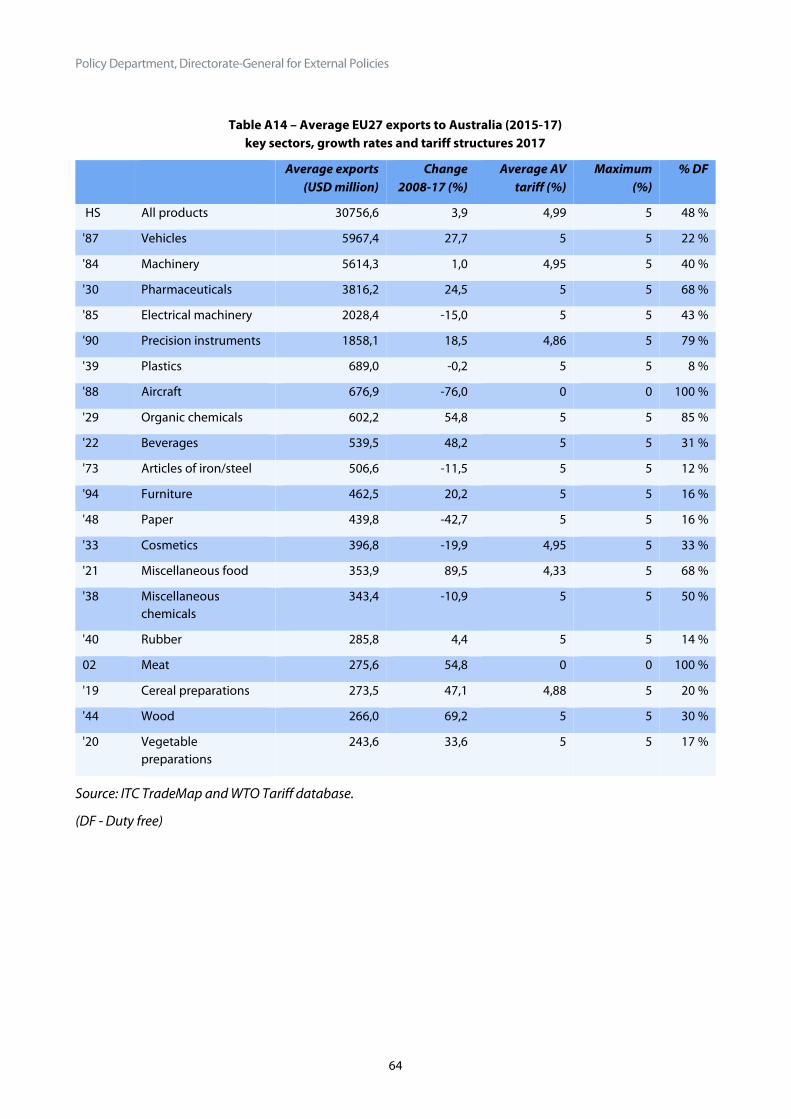
In terms of the EU’s offensive interests, Table A14 provides details of the top 20 sectors of goods exports in recent years (3-year averages), as well as growth rates, average applied tariffs on dutiable lines and the percentage of tariff lines that are duty free. EU27 exports are quite concentrated in a few sectors, with vehicles (mainly cars), mechanical machinery and pharmaceuticals making up half of trade in the three years to 2017. Growth rates have been unimpressive in overall trade, but in two of these sectors –pharmaceuticals and cars - growth has reached 25 % and 28 % respectively. Some of the more marginal export sectors for the EU have also seen strong growth – including organic chemicals, beverages, miscellaneous food, meat, wood and processed cereal or vegetable products.
It is evident from the table that the Australian tariff structure is very straightforward. Details of NAV tariffs are not included in the table, as there are only 9 recorded in the WTO database and none effect the products covered here. The applied tariff is 5 % for the vast majority of products which attract a tariff. Several sectors are completely duty free or have high percentages of duty free products – aerospace, meat, precision instruments and organic chemicals. Sectors of export interest where many products are subject to tariffs include vehicles, machinery, plastics, articles of iron and steel, beverages, furniture, paper, cosmetics, rubber and cereal and vegetable preparations. Across these sectors, the removal of tariffs would reduce costs and provide EU exporters with a level playing field vis a vis Australia’s existing FTA partners.
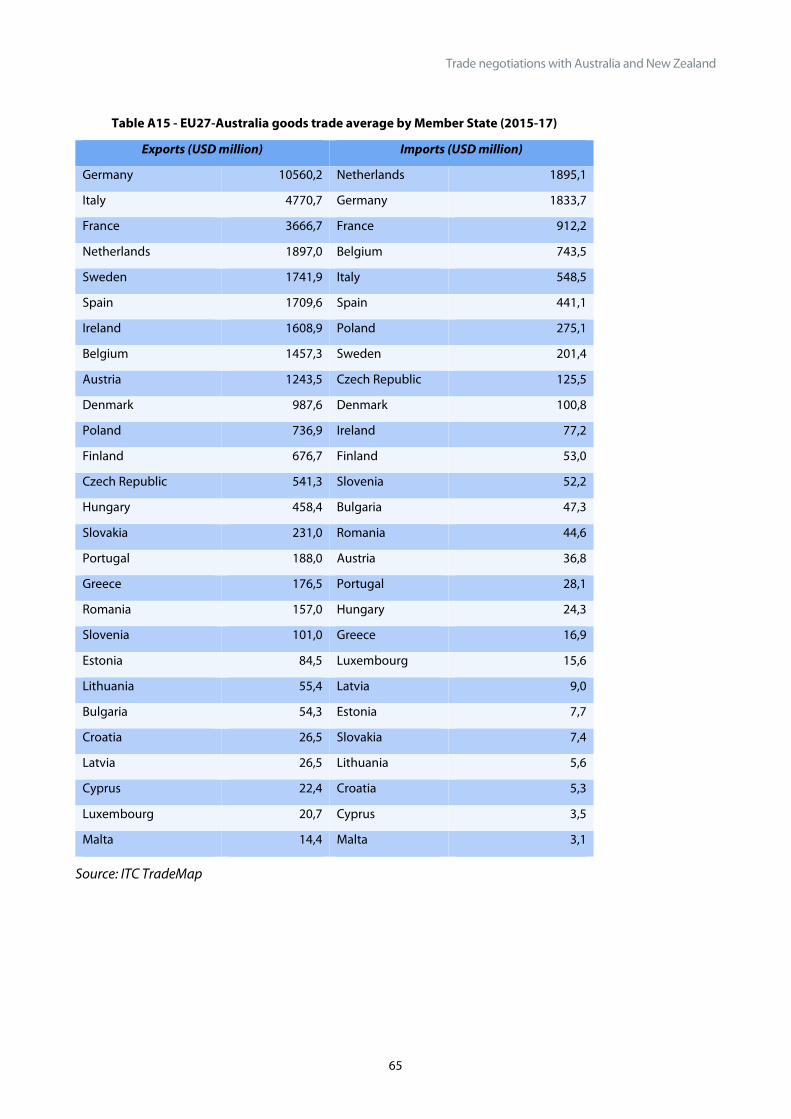
Finally, in terms of the structure of trade across the member states, Table A15 provides a summary of total trade flows in each direction by Member State. Most member states have a substantial trade surplus with Australia. The exception is the Netherlands, where imports are almost exactly the same as exports, although the latter may be inflated by declarations for goods ultimately destined for other EU markets.7 Of the smaller traders, Ireland is notable for its very large trade surplus (over USD 1,5bn) with Australia.
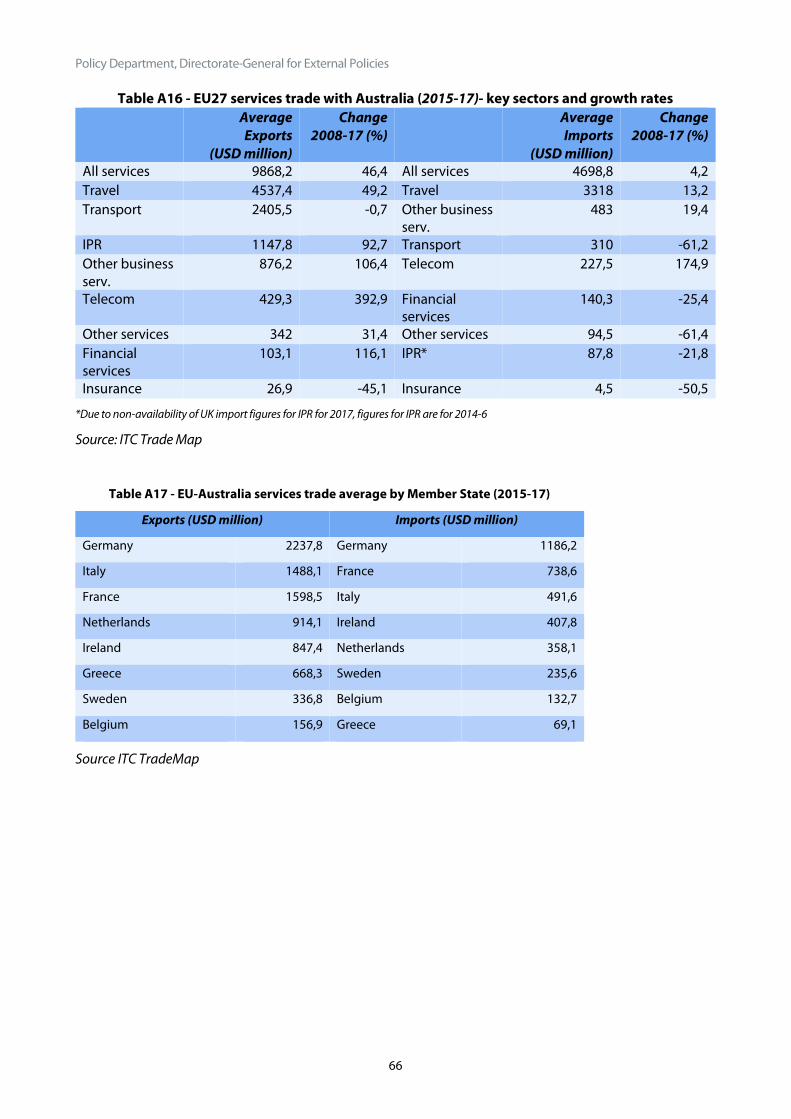
In terms of services trade, EU27 trade with Australia by sector is detailed in Table A16. Overall exports have grown by 46 % since 2008. The key export sectors are travel and transport, which together make up 70 % of trade. The former is very dynamic (with growth of nearly 50 % since 2008), while the latter has stagnated.
6 The figures tend to overestimate protection, as they don’t take into account the fact that there are no duties on many products. However, as negotiations will certainly focus on those sectors where protection persists, they give a better overview of the sectors most likely to be sensitive than using simple averages. 7 Often known as the ‘Rotterdam effect’.
Trade negotiations with Australia and New Zealand
21
Other important sectors show impressive growth, including IPR (93 %), other business services (106 %) and especially telecom (393 %). In terms of imports from Australia, growth has been very limited (only 4,2 % over the ten-year period). The key sector is travel, which represents over 70 % of the EU27’s imports from Australia. Growth there has been modest – 13 %. Other business services represent over 10 % of imports and these have also seen growth – 19 %. All other less important sectors have seen reductions in trade. The exception was telecom services which grew by 175 % since 2008, although it still represents a small share of services imports from Australia (less than 5 %).
Within the ITC database details of services trade are only provided with key partners. These are reported in table A17 in annex, where details are provided of flows between the main EU27 services trade partners and Australia. The main partners are Germany, Italy and France, although relatively small member states like Ireland, Greece and Sweden also figure in the table. All member states for which there is data have a services trade surplus with Australia, often a very substantial one.
2.1.4 EU27 Trade in goods and services with New Zealand In this section, we will explore the key sectors of interest for the EU27, in order to highlight the key likely defensive and offensive interests of both the EU and New Zealand. As for Australia, we will briefly present the key features and dynamics of trade and the relevant tariff structures in the key goods currently traded, which is complementary to the existing studies on the impact of the proposed FTAs, which will be discussed below.
To give an indication of the EU27’s defensive interests, Table A18 provides details of the top twenty EU goods imported from New Zealand in recent years (2015-17), together with their growth rates over the last ten years and the average applied tariffs, as reported in the WTO database. Like for Australia, EU27 imports from New Zealand have fallen in recent years, in this case by 18 %, although there are a few sectors where they have increased, notably in beverages (mostly wine), but also more marginal sectors like wood, plastics and organic chemicals.
It is notable that New Zealand-EU exports of dairy products, which, as indicated above, are their most important global export, have actually fallen by 60 % in value over the time period covered. This is certainly related to the relatively high levels of EU protection in the dairy sector, which is also reflected in the table. As for Australian trade above, the tariff figures presented in the table are average AV tariffs for all dutiable tariff lines. Several sectors, including dairy produce, as mentioned above, also have extensive NAV tariffs. Indeed, New Zealand exports are notable for the extent to which NAV tariffs are applied to sectors of interest – especially in dairy, beverages and meat. However, as we will discuss below, New Zealand does have more generous market access in the latter sector than Australia – specifically a significant tariff rate quota (TRQ) in lamb - which is not reflected in the general tariff rates provided in Table A18.
Focusing only on AV tariffs, as indicated in the table, there are tariff peaks in products of interest to New Zealand, which the negotiations will certainly seek to address. Key amongst these are the aforementioned agricultural sectors, but also fruit, vegetables and beverages. In non-agricultural goods, EU fish imports from New Zealand are significant and growing. This sector has a highly variable tariff structure, with some significant tariff peaks and some species facing very low or no tariffs.8 Thus, there are certainly fish products where New Zealand will have offensive interests. Other sectors with significant tariff peaks where New Zealand will have an interest in liberalisation include albuminoidal substances, modified starches, glues and enzymes - as well as machinery (especially electrical machinery), wood and aluminium.
8 For a detailed analysis of the EU’s trade regime for fish products see Curran, L., Nadvi, K. and Campling, L. (forthcoming) The Influence of Tariff Regimes on Global Production Networks, Journal of Economic Geography, https://academic.oup.com/joeg/advance-article-abstract/doi/10.1093/jeg/lby059/5258039
Policy Department, Directorate-General for External Policies
22
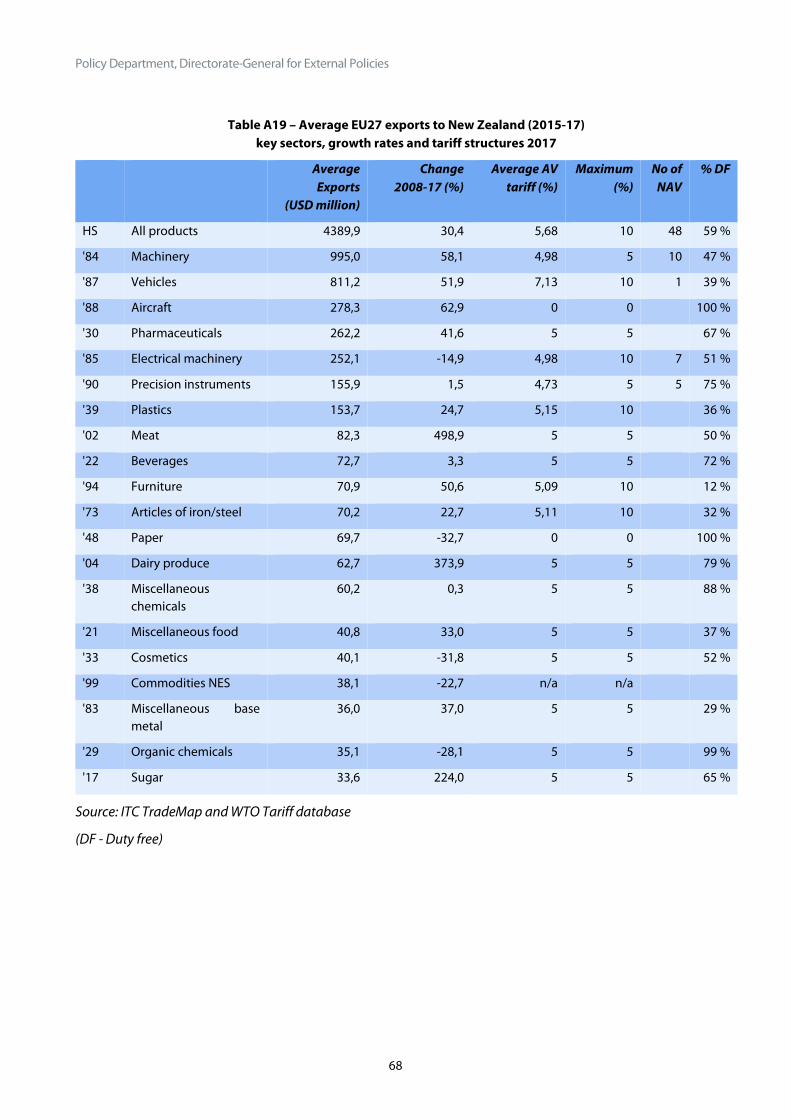
In terms of the EU’s offensive interests, Table A19 provides details of the top 20 sectors for goods export in recent years (3-year averages), as well as growth rates, applied tariffs, number of NAV tariffs and the percentage of tariffs that are duty free (DF). Like for Australia, EU27 exports are quite concentrated in a few sectors, with vehicles (mainly cars) and mechanical machinery making up over 40 % of trade in the three years to 2017. Growth rates in exports to New Zealand have been far more significant than to Australia, with overall trade growing by over 30 % and rates above 50 % in the top three sectors – machinery, vehicles and aircraft. The most impressive growth rates are in meat, dairy and sugar, although the trade flows are still relatively low. Pharmaceuticals and furniture also show relatively high growth.
It is evident from the table that, as for Australia, New Zealand’s tariff structure is very straightforward, although there are more NAV tariffs. Unlike the EU, these fixed duties are applied in manufactured goods. Liberalising these trade barriers will certainly be of interest to the EU. Otherwise, the applied tariff is 5 % for most products which attract a tariff, although there are tariff peaks of 10 % in some sectors. As indicated in the table, several sectors of interest to the EU are entirely (or almost entirely) duty free – aircraft, paper and organic chemicals. Key sectors where protection is most widespread are vehicles, plastics, furniture and articles of iron and steel.
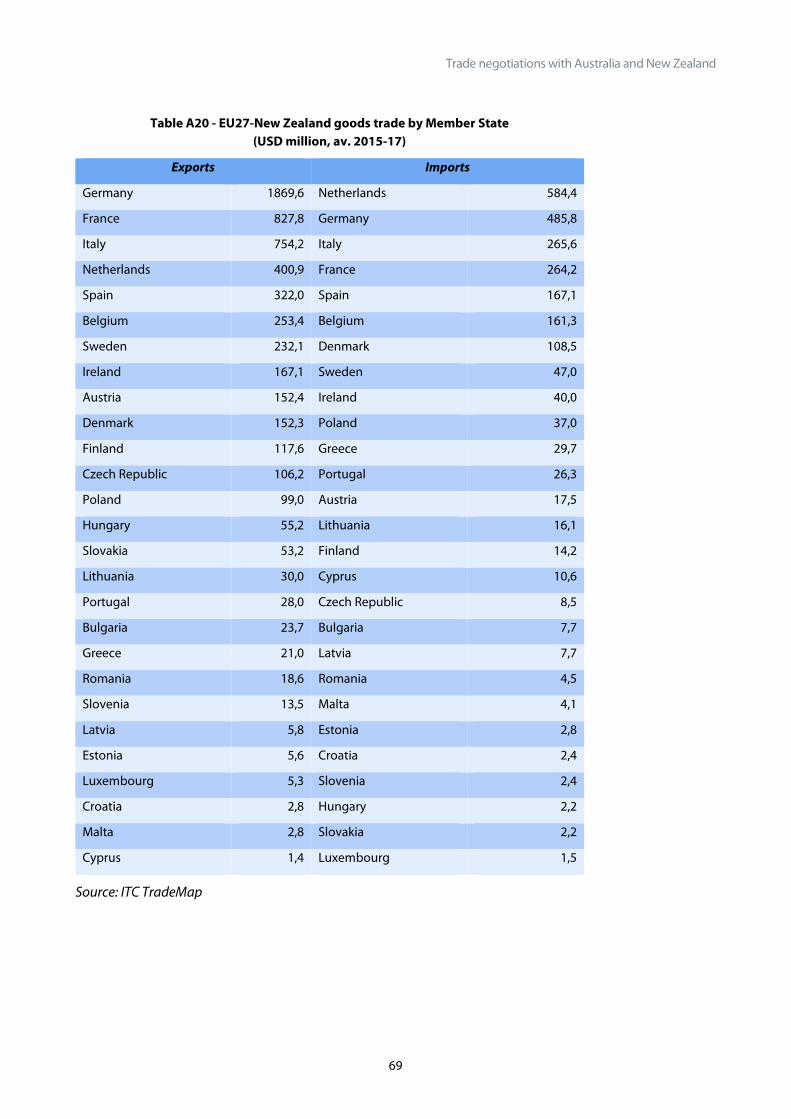
Finally, in terms of the structure of trade across the member states, Table A20 provides a summary of total trade flows in each direction by Member State. The majority of member states have a trade surplus with New Zealand, often a very substantial one, the key exception is the Netherlands, which has a USD 183m trade deficit, although, as for Australia, this may be inflated by declarations for goods ultimately destined for other EU markets. Several smaller traders also have trade deficits – this is the case for Greece, Latvia and Malta.
In terms of services trade, Table A21 provides details of the sectoral structure of EU27 trade with New Zealand and its evolution. Both imports and exports are very dynamic, far more so than with Australia, although the values are generally lower, reflecting the smaller market. EU exports are strongly oriented towards transport (58 % of exports in recent years), which has seen the same growth rates as all trade (116 % since 2008). Other business services, IPR and travel, all represent between 11-10,5 % of the total. Of these the most dynamic growth is in IPR (+155 %). Financial services flows are the only area that has seen exports fall and, in any case trade flows were very low. In terms of the EU27’s imports from New Zealand, they are heavily dependent on travel (almost 64 % of flows in recent years), which has seen an increase of over 82 % since 2008. Transport is also important, representing over 16 % of flows, although it has been less dynamic (+59 %). Business services (+125 %), telecom (+307 %) and financial services (+238 %) have all seen impressive growth, although flows are small, especially in the latter sector. There was no insurance trade reported in the database in 2008, although average flows in recent years were USD 78,6m, representing 5 % of flows.
In terms of the spread of services trade across the EU27 Member States, details of flows between the main trade partners and New Zealand are provided in table A22 in annex. The key importers are Germany, France, Denmark and the Netherlands and key exporters Germany, Denmark, the Netherlands and Ireland. Services trade with New Zealand is more balanced than with Australia, nevertheless several MS have substantial trade surpluses, most notably Denmark (nearly USD 300m) and Ireland (over USD 68m). France is the country with the biggest services trade deficit with New Zealand – over USD 183m.
Trade negotiations with Australia and New Zealand
23
2.2 Non-tariff barriers to trade In addition to the tariff barriers discussed in the last section, there are a variety of non-tariff barriers to trade with both Australia and New Zealand that should be addressed in the FTAs. This section will discuss these barriers, drawing on the analysis which have been done in preparation for the FTAs, as well as the inputs to the public consultation.9 It will focus, in particular, on those barriers which affect EU exports to the two trade partners, rather than the inverse, however, as the negotiating position of the partner countries will inevitably be impacted by a desire to reduce the key irritants and barriers to their exports to the EU market, we will also briefly address these issues where relevant. In the context of technical barriers to trade, it is important to note that Australia and New Zealand have a strong bilateral relationship on regulatory cooperation, most notably the Trans-Tasman Mutual Recognition Arrangement (TTMRA).10
2.2.1 Barriers to EU goods trade with Australia As indicated above, Australia is a rather open economy, with low tariffs and substantial shares of trade not subject to any duties. However, there are certain sectors which are subject to non-tariff barriers (NTBs) and other trade irritants. As noted in the Commission’s impact assessment,11 although there are mutual recognition agreements with Australia in several sectors, primarily cars, machinery and precision equipment,12 these do not cover all sectors of export interest and in any case, need to be updated for evolutions in the respective regulatory environments. Although the impact study of the FTAs undertaken for the EU13 noted that both Australia and New Zealand have lower overall levels of product market regulation than other FTA partners, like Canada and Korea, nevertheless there are sectors where inconsistencies between regulatory regimes act as trade barriers. The FTA negotiations provide the opportunity to address these issues.
In the agro-food sector, several trade barriers have been underlined in the impact assessment and inputs to the public consultation. These include overly stringent sanitary and phytosanitary (SPS) standards, especially in pork. In addition, the WTO’s trade policy review of Australia highlighted concerns on several SPS measures, including on beef imports, which remain very restricted, due to concerns following the BSE outbreak some years ago.14 Inadequate protection of Geographical Indications (GIs) is also an EU concern. On this latter point, although many EU wine appellations are protected under a specific Wine Agreement with Australia,15 the list of GIs is not exhaustive and, in any case, there are many other non-wine GIs which EU producers would like to protect, including in the dairy and meat sector, as well as non-wine beverages, like spirits.
Australia agri-business is worried that the FTA will require that they institute protection for many GIs which are widely used. Stakeholders have expressed concern about the negative impacts of such protection, including on third country markets16 and it is expected that Australia will be reluctant to extend GIs in the negotiations.17 In a recent interview the EU’s ambassador to Australia underlined that much of this concern
9 http://trade.ec.europa.eu/consultations/index.cfm?consul_id=195 10 See Mumford, P. (2018). Regulatory Cooperation in Drake-Brockman and Messerlin (2018) Potential Benefits of an Australian-EU Free Trade Agreement. Adelaide: University of Adelaide Press. for a more in-depth discussion on this issue. 11 EC (2017a) 12 http://ec.europa.eu/growth/single-market/goods/international-aspects/mutual-recognition-agreements_en 13 LSE Enterprise (2017) 14 WTO (2015). Trade Policy Review, Australia. WT/TPR/S/312. Geneva: WTO 15 EC (2009). Agreement between the European Community and Australia on trade in wine. Official Journal, 30.1.2009. 16 GA Research (2013) Proposal for an Australian-European Union Free Trade Agreement. Australian and European Stakeholder Preliminary Perceptions Research. Winemakers Federation of Australia (2016). Submission on Australia-European Union Free Trade Agreement. 17 Anderson, K. (2018). Agriculture and Food Policy. In Drake-Brockman, J and Messerlin, P. Potential Benefits of an Australian-EU Free Trade Agreement. Adelaide: University of Adelaide Press.
Policy Department, Directorate-General for External Policies
24
was based on misconceptions that the EU will want to protect common food names like mozzarella and ricotta, which is not the case.18 Indeed, not all EU GIs are protected in its FTAs and there are flexibilities. For example, in CETA, for certain commonly used names, like ‘feta’ and ‘gorgonzola’, companies that used them prior to the signing of the agreement can continue to do so, while it is permitted to use the terms accompanied by expressions like ‘kind’ or ‘type’.19 Nevertheless, the Australian trade minister recently acknowledged that ‘…GIs are a difficult issue for Australia’ and underlined that progress on this issue would be dependent on increased market access elsewhere.20
Although differences in food regulations between the two were noted by Australian stakeholders in consultations, there was little concern about difficulties in meeting EU standards, as the industry felt that their national standards were largely equivalent.21 Overall, however, these initial consultations in Australia found stakeholders to be unenthusiastic about the potential for an FTA in several agricultural sectors, although it was considered to have potential benefits in beef and sheepmeat.
A key issue in the negotiations from the Australian point of view will be reducing the non-ad-valorem duties in the agricultural sector, which mean that, in addition to tariffs, many products also face fixed duties per tonne or per litre. For example, lamb faces a tariff of 12,8 % and a fixed duty of EUR 171,3/tonne. The Australian side will be seeking better market access, either through the direct elimination of such barriers within the FTA (which is unlikely), or the provision of higher levels of market access through more generous tariff rate quotas (TRQs) and/or lower in quota tariffs.22 Australia has limited TRQ access to the EU market at present. This is an irritant for Australia, a point underlined by the deputy ambassador during the INTA workshop in the EP.23 Indeed, in the aforementioned lamb sector, they have a much smaller quota for sales to the EU than New Zealand and it is almost always filled.24
The division of TRQs between the UK and the EU27 after Brexit is already the subject of dispute in WTO, with Australia (and other exporters, including New Zealand) expressing concern, that the proposed division of EU28 market access between the two will not be in their interest.25 At the same time, the Australians also benefit from a TRQ for hormone free beef and there are concerns that EU negotiations with the US to increase the latter’s quota, could have the side effect of reducing the allocation available to Australia. The Australian trade minister referred to this possibility in his speech in Brussels in January 2019,26 noting that should the EU start the negotiations by reducing market access as a result of other bilateral discussions, this would be very badly perceived in Canberra. The issue is thus very salient for both Australia
18 Politico Brussels Playbook 4th March 2019. https://www.politico.eu/newsletter/brussels-playbook/politico-brussels-playbook-eus-diplomacy-bounces-back-in-washington-estonias-opposition-wins-election-orban-on-a-limb/ 19 See Article 20.21 and Annex 20-A of the CETA agreement. More detailed analysis can be found in: O’Connor, B. (no date) Geographical Indications in CETA, the Comprehensive Economic and Trade Agreement between Canada and the EU. https://www.origin-gi.com/images/stories/PDFs/English/14.11.24_GIs_in_the_CETA_English_copy.pdf 20 Birmingham, S. (2019). Rules based trading system and EU-Australia. http://bruegel.org/events/rules-based-trading-system-and-eu-australia/ 21 Hussey, K. and Tidemann, C. (2013). Opportunities for Australian agriculture from an EU-Oz FTA: perceptions from Australian industry. Presentation at Australian National University Conference ‘Bringing Australia and the EU Closer: Is an FTA the solution? http://politicsir.cass.anu.edu.au/centres/ces/projects/australia-european-union/events/bringing-australia-and-eu-closer-fta-solution 22 Under TRQs partner countries are afforded the right to export a given quota of a given good to the EU at low or zero tariffs. 23 Remarks by Helen Stylianou, Deputy Ambassador of Australia to the EU, at the INTA Workshop on the FTA negotiations with Australia and New Zealand, 29/01/2019. Brussels. 24 In 2018, New Zealand had a TRQ of 228,454 tons, of which only 142,581 was used. In contrast, Australia had a TRQ of 19,186 tons, 99,6 % of which was used. 25 For a more extensive discussion on this controversy see: Winters, L. A (2018) What difference does Brexit Make? In Drake-Brockman and Messerlin. 26 Birmingham, S. (2019).
and the EU. The potential effects of greater market access in such sensitive sectors will be further discussed below in the section on impact of the FTA.
2.2.2 Barriers to EU goods trade with New Zealand As for Australia, the EU has a mutual recognition agreement with New Zealand covering several sectors, although, unlike Australia, the agreement doesn’t cover the important automotive sector. In addition, negotiations to establish a Wine Agreement like that with Australia were unsuccessful, so there is limited protection of GIs in that sector. However, there is a bilateral agreement on sanitary measures applied to trade in live animals and animal products. Several inputs to the EU stakeholder consultation saw this agreement as useful in facilitating bi-lateral trade and, in general, barriers due to differences in SPS have been highlighted less often by stakeholders in relation to New Zealand. Overall, a recent analysis of the potential of EU FTA negotiations with New Zealand concluded that they should be more rapid to launch and conclude than those with Australia, partly because the regulatory differences were considered to be relatively low.27
In terms of New Zealand’s exports to the EU, stakeholders in New Zealand have expressed concern on several persistent barriers, as well as on efforts to extend GIs to what they see as ‘…generic food names, or so-called ‘traditional terms’…’28 They also mentioned the impact of private standards, such as those of supermarkets. While acknowledging that an FTA cannot address these barriers directly, they consider that the agreement could facilitate business dialogue to develop common approaches. Market access in agricultural goods will certainly be a key issue in the talks. As mentioned above, New Zealand has high levels of existing EU market access in lamb. However, it will be seeking to reduce the number of sectors covered by such limitations on market access and, in sectors where TRQs persist, will seek to maximise the quota and/or minimise the in-quota tariff.
2.2.3 Barriers to services trade Within the WTO context, the EU had been in negotiations with both Australia and New Zealand to secure market opening in services on a plurilateral basis, through the Trade in Services Agreement (TiSA). However, these negotiations are essentially blocked since the change in administration in the US. The FTAs have thus become the main means by which services trade can be liberalised between the three partners. The EU services sector is enthusiastic about the FTA, while both trade partners also see potential benefits for their services sectors.29 Overall, both Australia and New Zealand are relatively open to services trade. In most sectors, levels of trade restrictiveness are lower than the Organisation for Economic Cooperation and Development (OECD) average.30 The exceptions are courier services in Australia and cargo/logistics in New Zealand. Air-transport also has a relatively high score in both. Restrictions on foreign entry were the key reasons why these sectors scored relatively highly. This underlines the link between services trade and investment, which will be discussed in the next section. Clearly, given the need for many services sectors to establish a local presence in order to access services markets, a liberal investment climate is a key factor in securing market access.
Other issues which have been underlined as particularly relevant to services market access in both partners, are more open public procurement procedures (discussed below) and less restrictive requirements for
27 Lee-Makiyama, H. (2015). New Zealand: The EU’s Asia-Pacific Partnership and the Case for a Next Generation FTA. Brussels: European Centre for International Political Economy. 28 New Zealand International Business Forum (2015). Towards a New-Zealand- European Union FTA: A Business Perspective. 29 Comments by the European Services Forum, the New Zealand and Australian Embassy representatives in the INTA Workshop on the FTA negotiations with Australia and New Zealand, on 29/01/19 all underlined the importance of services to the economy of the partners and were supportive of the potential of market opening in services. 30 http://www.oecd.org/tad/services-trade/country-notes-services-trade-restrictiveness-index.htm
Policy Department, Directorate-General for External Policies
26
short term visas for services providers. The issue of facilitating business travel (in both directions) has been underlined in several business inputs to the negotiations, as has the related issue of mutual recognition of professional qualifications.31 Overall, the negotiations on services access within the FTA will be strongly linked to other aspects of the talks, while issues which could be addressed in the services context – like facilitating business travel and recognition of qualifications - could have positive impacts well beyond services.
Finally, in the important digital trade area, a key difference between the two is that New Zealand is one of only a few countries which have been recognised by the EU as ‘data adequate’, facilitating transfer of data between the two. Australia will certainly wish to address this issue in talks. However, the EU insists that data adequacy discussions are conducted in parallel with trade negotiations, rather than as part of the FTA, most recently in the case of Japan. In this case the data adequacy negotiations were conducted separately, although the decision was almost exactly concurrent with the entry unto force of the FTA.32
2.3 Investment Overall, both Australia and New Zealand have fairly open investment climates although, as already noted in the ex-ante study for the Commission, different indices provide rather different assessments of that climate. According to the OECD, both have relatively high investment restrictiveness indices, however, other indices like the World Bank ‘Ease of Doing Business’ index and UNCTAD’s Inward FDI potential index paint a far more favourable picture.33 As we will see, there are already substantial investment flows between the EU and these two trade partners. This section will explore these figures and underline areas for potential liberalisation. We will only analyse ‘classic’ FDI, that is investment by a foreign investor which intends to actively participate in the management of the business. This is because, in accordance with the EU Court of Justice’s judgement on the EU-Singapore FTA, non-direct investment (portfolio investment) is not an exclusive EU competence and therefore will not be covered by the FTA.34
In relation to both countries, as the figures below confirm, the UK is a very important destination for Outward FDI (OFDI) from these countries into the EU. However, it is important to note that at least part of that FDI was premised on the UK’s full access to the Single European Market (SEM). Thus, after Brexit there will certainly be lower overall FDI levels between the EU27 and both partners, compared to the EU28 baseline. However, there will also be new opportunities, as companies from both countries seek to establish new hubs within the EU27 from which to develop their business throughout the region. This was a point highlighted in a recent media interview by the EU’s ambassador to Australia,35 who noted a recent increase in Australian interest in investment opportunities in the EU27, as well as vice versa, as both sides realise that the use of the UK as a hub for commercial relations needs to be revised post-Brexit. The combination of Brexit and new FTAs securing investment opportunities will certainly simulate increased investment flows in both directions.
31 GA Research (2013); NZIBF (2015); Kerneis, P (2015). Comments at INTA Public hearing on Trade Relations with Australia & New Zealand, 1 December 2015; CITCSA (2016) Australia-European Union Free Trade Agreement Submission. Adelaide: Council for International Trade and Commerce South Australia. 32 http://europa.eu/rapid/press-release_MEMO-19-422_en.htm 33 LSE Enterprise (2017) 34 For a detailed analysis of the impact of the ECJ decision on the negotiations with Australia see Kerneis, P. (2018) Limits to European Union negotiating competence, in Drake-Brockman and Messerlin (2018). 35 Politico (2019)
2.3.1 EU-Australia investment and potential barriers Australian statistics36 indicate that Australian FDI in the EU reached nearly AUD 118bn (approximately EUR 80bn37) in 2017, however 71 % of that was to the UK, such that Outward FDI (OFDI) stocks in the EU27 were AUD 34bn (EUR 23bn), representing under 6 % of total Australian OFDI. Figures indicate that portfolio investments to the EU (AUD 270bn - EUR 169bn) are substantially larger than these direct investments while ‘other investments’ (some of which might constitute FDI as covered by the FTA), amounted to over AUD 100bn (EUR 62bn). The UK represented lower shares of these investment stocks at 34 % (portfolio investments) and 63 % (other investments). Individual FDI flows are not available for most EU countries, but of those that were published, investment in the Netherlands - AUD 6,9bn (EUR 4,65bn), France - AUD 2,4bn (EUR 1,65bn) and Luxembourg - AUD 2,3bn (EUR 1,55bn) were important. Overall investment in Germany was significant - AUD 74bn (EUR 50bn) but this was not broken down between portfolio and FDI.
In terms of EU investments in Australia, these are substantially larger than in the other direction and the EU27 is relatively more important to investments. Total Inward FDI (IFDI) to Australia from the EU28 reached nearly AUD 190bn (EUR 119bn) in 2017. The UK represented 44 % of that IFDI, such that the figure for the EU27 was AUD 106bn (EUR 72bn), which accounted for 12 % of all Australian IFDI. As for OFDI, figures for many EU countries are not reported, however of those that are, the most significant flows are from the Netherlands - AUD 54bn (EUR 36bn), Germany - AUD 24bn (EUR 16bn) – Luxembourg – AUD 9,6bn (EUR 6,5bn) and France – AUD 6,3bn (EUR 4,3bn). Clearly, despite any existing investment barriers, Australia remains an attractive destination for EU investors.
A key barrier which emerges in analyses of FDI into Australia is the fact that foreign presence is limited in certain sectors, such as those services sectors mentioned above. Another key irritant is the need to submit FDI over a certain threshold to oversight by the relevant authorities. In Australia such investment is screened by the Foreign Investment Review Board (FIRB). The FIRB provides a helpful table on the various thresholds for screening, which makes it clear that EU business is at a relative disadvantage.38 At the time of writing, the threshold for investment oversight for non-FTA partners was AUD 266m (EUR 166m), whereas for FTA partners, the equivalent figure was AUD 1,154m (EUR 721m). In a reflection of the sensitivity of the agricultural sector in Australia, non-FTA partners, as well as most FTA partners, face a threshold of AUD 58m (EUR 36m) for investment in agribusiness. The exceptions are Chile, the US and New Zealand, where the threshold is the same as for all investments. There are also a series of other ‘sensitive sectors’ where thresholds are lower for FTA partners (AUD 266m - EUR 166m), while for the media sector there is no threshold for investments from any foreign country. Clearly, the EU will be seeking equivalence with the most favoured FTA partners in this context.
Although these investment screenings may add delays, costs39 and administration to investment deals, they only rarely result in the blocking of the investment. As the recent ex-ante study noted,40 rejections are extremely rare, with none reported in the year 2014-5. More recently, three rejections were noted in the latest FIRB report (covering 2017), of which two related to the proposed investment in a regional electricity grid by a Hong Kong private company and a Chinese State-Owned Enterprise (SOE).41 The report also notes, however, that more investments are being approved with conditions, such that 40 % of the number of investments and 70 % by value were made subject to conditions by the FIRB. The report notes ‘This
36 Australian Bureau of Statistics. 53520 - International Investment Position, Australia: Supplementary Statistics, 2017. May 2018. 37 Throughout this document, when converting from AUD to EUR, the average conversion rates of the relevant years are used. For most recent data, the average rate over the year to date was used. This was EUR 1=AUD 1,6. 38 http://firb.gov.au/exemption-thresholds/monetary-thresholds/ 39 Fees vary from AUD 2 000-103 400 (EUR 1 250-64 625) depending on the sector and value of the investment. 40 LSE Enterprise (2017) 41 FIRB (2018). Foreign Investment Review Board, Annual Report 2016-17.
Policy Department, Directorate-General for External Policies
28
highlights the increasing use of conditions to manage national interest factors arising in large and complex acquisitions.’ Thus, the screening process has real impacts on FDI and enabling EU companies to secure higher thresholds to avoid the process would certainly be welcomed by business.
The overwhelming majority of EU investment in Australia currently takes place in the absence of any formal government to government agreements. Only five EU member states – Czech Republic, Hungary, Lithuania, Poland and Romania – have a Bilateral Investment Treaty (BIT) with Australia and these countries represent less than 1 % of total stocks of Australian investment in the EU. There is thus the potential to increase the security of current and future investment flows by setting clear and reciprocal commitments for both sides within the context of this FTA.
2.3.2 EU-New Zealand investment and potential barriers Statistics from Stats New Zealand provide detailed information on FDI stocks to and from its key EU partners.42 Total declared investments by EU member states in New Zealand in 2017-18 amounted to NZD 78,4bn (EUR 47,8bn43), however nearly 84 % of that was from the UK. Investments by EU27 countries totalled NZD 12,8 (EUR 7,8bn). However, unlike Australia, New Zealand does not publish an aggregate figure for the whole EU and data is not published for all member states. Thus, the true figure for EU27 IFDI is certainly higher, although the dominance of the UK is not likely to change significantly. In terms of those countries for which data is published, the key investor is the Netherlands - NZD 8,7bn (EUR 5,3bn), followed by Germany - NZD 1,6bn (EUR 9,9bn) and France - NZD 1bn (EUR 630m).
Investments by New Zealand companies in the EU28 were substantially lower than in the other direction, at NZD 41,2bn (EUR 25,2bn). However, the share of the UK is also lower, at 48 %. Overall, therefore, New Zealand investment in the EU27 is higher than the inverse, at NZD 22,8bn (EUR 13,9bn). The key destination countries are the same as for IFDI, that is the Netherlands - NZD 8,5bn (EUR 5,2bn), Germany - NZD 6,6bn (EUR 4bn) and France - NZD 5,5bn (EUR 3,3bn). Thus, these three countries clearly have relatively strong investment relationships with New Zealand. The next most important destination for New Zealand investment in the EU27 is Ireland, with over NZD 2bn (EUR 1,3bn).
Like Australia, New Zealand has an investment screening process, whereby the Overseas Investment Office (OIO) must approve all investments over NZD 100m (approximately EUR 59m at 2018 exchange rates). The process is regulated under the 2015 Overseas Investment Act and is particularly restrictive in terms of investment in land, specifically land deemed ‘sensitive’ in the schedules of the Act (which now essentially covers most land), as well as fishing quotas. As noted in the ex-ante report,44 rejections have been rare over the years. Only two rejections were noted in 2017 and three in 2018. However, as the office itself acknowledged, these figures may be artificially low: ‘The OIO advises applicants if it intends to decline (or recommend decline) their application. Applicants often withdraw their application rather than have it declined.’45 In any case, the procedure is time and resource consuming and the potential to secure higher thresholds would certainly be welcomed by EU companies. Currently they are at a disadvantage compared to Australian investors (with a threshold of NZD 477m (EUR 280m), as well as other FTA partners. For example, for the CPTTP countries, the threshold for screening investments will be NZD 200m (EUR 118m).
Beyond the screening process, the other key barrier to investment in New Zealand is the existence of foreign ownership limits in several sectors, primarily in the services sector, including telecommunications and air transport. Market access in these sectors is likely to be addressed in the services negotiations. In terms of existing inter-governmental investment agreements, New Zealand has no BITs with any EU
42 Annual figures are provided from March-March. Thus 2017-18 figures concern the year up to 31.03.18 43 Throughout this report, when converting from NZD to EUR we use the average exchange rates for the years in question. For recent data, we use the average for the year up to time of writing, which was EUR 1=NZD 1,7. 44 LSE Enterprise (2017) 45 https://www.linz.govt.nz/overseas-investment/decision-summaries-statistics/2018-12
countries. Indeed, the country only has two stand-alone BITs, with China and Hong Kong, although the country is party to several FTA agreements with investment provisions, discussed below.
2.4 Public Procurement Public procurement (PP) is an important market in both countries and increased access would certainly create opportunities for EU companies. The current context differs between the two in that New Zealand is a member of the plurilateral Government Procurement Agreement (GPA) in WTO and therefore already bound by the requirements for openness within that agreement. Australia is still in the process of acceding to GPA – the negotiations in WTO are concluded and the text was tabled in the Australian Parliament at the end of 2018. In both cases, the EU will be seeking ‘GPA+’ commitments within the FTAs. Such commitments could include lower threshold limits for the opening of tenders to EU companies and/or the extension of market access to a wider number of sectors/government entities.
2.4.1 Public Procurement in Australia Public Procurement (PP) in Australia is an important market. In 2017-8 total central government procurement was AUD 71,1bn (approx. EUR 44,4bn). 46 Most contracts were relatively small, with almost 95 % below AUD 1m (EUR 0,62m), although those above that figure represented over 70 % of the overall value of government spending. Overseas suppliers represented under 5 % of the number of contracts, but almost 25 % of the value, at AUD 17,6bn (EUR 11bn). The potential of the Australian market for EU firms has recently been underlined with the confirmation of a AUD 50bn (EUR 31bn) contract with the French company Naval Group for twelve new submarines. Australian regional governments also represent an important market. Although exact spending figures are not available, a recent review estimated them to be at least as large as those for central government.47 Figures from the OECD indicate that Australian government spending represents 36,2 % of GDP,48 putting it in the lower levels of spending within the OECD.
Under the GPA, Australia will open its PP market at national level above a threshold of SDR 130 000 (approx. EUR 160 000) for goods and services and SDR 5m (EUR 6,2m) for construction services. Regional entities and certain national entities (for example in the media, health, veterinary sectors) are subject to higher thresholds for goods and services – SDR 355 000 (EUR 437 000) and 400 000 (EUR 492 000) respectively. Certain sectors, including health and R&D, are excluded and there are carve outs from the agreement for preferences for SMEs and indigenous people. Indeed, the government has targets for participation in PP of 10 % for SMEs and 3 % for indigenous enterprises.49 Australia’s accession to the GPA will, in and of itself, increase EU companies market access, even before the FTA is negotiated.
2.4.2 Public Procurement in New Zealand New Zealand government agencies report spending approximately NZD 41bn (approx. EUR 24bn) or 18 % of GDP,50 however they provide less detailed data on the structure of spending and the outcome of the bidding process than Australia. Under the GPA, most central New Zealand government entities have the same thresholds for opening calls for tender as those reported above for Australia. Sub-national entities and certain national entities, especially the trade and tourism sector, have a threshold of SDR 200 000 (EUR 246 000) and 400 000 (EUR 492 000) respectively for goods and services. As for Australia, there is a carve out for preferences for indigenous people and certain sectors are excluded, including R&D, health and education. For the EU, the key potential benefits of the inclusion of PP in the FTA would come from
46 All figures are from: https://www.finance.gov.au/procurement/statistics-on-commonwealth-purchasing-contracts/ 47 Hoekman, B. (2018). Government Procurement. In Drake-Brockman and Messerlin. 48 https://data.oecd.org/gga/general-government-spending.htm 49 LSE Enterprise (2017) provides more details about the operation of PP in Australia and New Zealand and the potential barriers. 50 https://www.procurement.govt.nz/about-us/
Policy Department, Directorate-General for External Policies
30
GPA+ commitments, such as the extension of the coverage to sub-national entities and/or a lowering of thresholds for market access.
3 The Australian and New Zealand trade policy context This section will explore the trade policy context in the two partner countries, in particular, their existing FTAs and those in negotiation. It will start with an analysis of those FTAs to which both are a party, before considering each country’s other FTAs. The discussion is complemented by tables A23-A25 in annex, which provide a full overview of the coverage of the FTAs of each party. Clearly a key backdrop to negotiations with both entities is the Comprehensive and Progressive Trans Pacific Partnership (CPTPP), the most recent and comprehensive agreement to which both are signatories.
3.1 Existing FTAs to which both Australia and New Zealand are party Table A23 provides details of the coverage of the FTAs to which both countries are party. The first such agreement is their Closer Economic Relations (CER) bilateral FTA. Since its inception in 1983 it has created a highly integrated trans-Tasman market for goods and services, including through the creation of a Single Economic Market, which has similar objectives to the Single European Market (SEM). The agreement includes extensive mutual recognition arrangements, including in professional qualifications, free movement of people and common food standards. As it is a relatively old agreement, it does not include issues like digital trade or environmental and labour standards, however these are covered in the Comprehensive and Progressive Agreement for Trans Pacific Partnership (CPTPP), discussed below.
The other important regional FTA to which both are party is the ASEAN-Australia-New Zealand FTA (AANZFTA). Signed in 2010, this agreement covers trade in goods and services, but also IPR, SPS and TBT, as well as e-commerce. There are no labour or environmental chapters. More recently the two countries are also signatories to PACER plus – an update of an earlier agreement (PACER) - with their Pacific neighbours. It was signed in April 2017 by Australia, Cook Islands, Kiribati, Nauru, New Zealand, Niue, Samoa, Solomon Islands, Tonga, Tuvalu and Vanuatu. This agreement covers most of the standard issues in FTAs, including SPS, TBT and e-commerce, but not labour and environmental standards. However, it contains a chapter on ‘development and economic cooperation’.
Finally, the most recent and most significant FTA to which both are a party is the CPTPP.51 Linking eleven countries across the greater Pacific Region, this revision of the Trans-Pacific Partnership (TPP) essentially retained most of the original agreement, while dropping some of the more controversial issues which had been included at the insistence of the US, like extensions of IPR.52 The agreement covers an extensive range of issues, including those that have become standard in modern FTAs, like e-commerce, competition and IPR, but also labour and environment chapters, as well as chapters on regulatory coherence, SOEs, SMEs, capacity building, anti-corruption, business facilitation and development. There are also sector-specific chapters on telecoms, financial services and textiles.
CPTPP creates an integrated market in trade and services across the Pacific. The member countries represent over 13,3 % of world GDP - a total of USD 10,6 trillion. It gives key traders like Japan, Malaysia, Canada and Mexico a distinct advantage on the Australian and New Zealand markets compared to EU members. Its ‘non-trade’ chapters are extensive and potentially establish standards on which the two countries will base their negotiating positions in the EU talks. This is particularly relevant for the labour and
51 CPTPP agreement was signed between Australia, Brunei Darussalam, Canada, Chile, Japan, Malaysia, Mexico, New Zealand, Peru, Singapore and Vietnam. 52 For a summary of the differences between CPTPP and the original TPP agreement, please see https://www.mfat.govt.nz/en/trade/free-trade-agreements/free-trade-agreements-in-force/cptpp/understanding-cptpp/tpp-and-cptpp-the-differences-explained.
environment chapters, which will be discussed in more detail below in the section on Trade and Sustainable Development (TSD), but also for issues, like e-commerce and competition.
3.2 Existing Australian FTAs and trade negotiations In addition to the above agreements, Australia has several other existing FTAs, some of which duplicate the CPTPP. This is the case for Singapore, Chile, Malaysia and Japan. Table A24 provides an overview of the content of these agreements. This shows that all of Australia’s FTAs include chapters on trade in goods, services, investment, e-commerce, SPS and TBT. Most also include public procurement, professional mobility and competition. A notable exception is the lack of coverage of professional mobility in the US FTA (where there is a specific exchange of letters clarifying that nothing in the agreement prevents the partners from enforcing immigration controls). In addition, the FTA with China doesn’t cover competition, or indeed SOEs. Labour and environment chapters are only included in the FTA with the US (the first agreement to cover such issues) and that with Korea. In Malaysia, the issues are covered in side letters and they are not addressed at all in the FTAs with Japan or China. Australia has three FTAs that were agreed in 2018, but are not yet in force, and for which the full text was not yet public at time of writing. These are with Hong Kong, Indonesia and Peru. The latter is the only FTA where labour and environmental issues are specifically addressed, although as Peru is a member of CPTPP, these issues would already be covered in that agreement in any case.
In terms of other on-going negotiations, in addition to their talks with the EU, Australia is also in negotiations with the Gulf Cooperation Council (GCC), India and the Regional and Comprehensive Economic Partnership (RCEP), as well as with the Pacific Alliance of Chile, Colombia, Mexico and Peru. Of these, RCEP is clearly the largest and most significant. It is made up of countries representing half the world’s population, over 30 % of world GDP and includes inter alia both China and India.53 Launched in 2012, the negotiations have proved substantially more difficult than CPTPP, however, were they to conclude successfully, they would of course create a major trading block. This would be a stronger pull for Australian trade and investment than the current patchwork of FTAs with most (but not all) RCEP members. Early estimates of the impact of RCEP on Australia suggested it could increase GDP by up to 1,27 %.54
3.3 Existing New Zealand FTAs and trade negotiations New Zealand has a number of FTAs, in addition to those to which both New Zealand and Australia are a party. Full details of their coverage are provided in Table A25 in annex. Several involve countries which are also party to CPTPP – this is the case for Chile, Brunei, Singapore and Malaysia – or the AANZFTA –the latter three countries plus Thailand. China and Korea are the key New Zealand FTA partners not covered by other agreements. The NZ-China FTA, which entered into force in 2008, was the first that China signed with a developed country. It is not as extensive as that with Australia, in that it doesn’t include chapters on PP, e-commerce or competition. There are side agreements on labour and environment, as well as a side letter on PP, which states that the two sides will commence negotiations on PP once China has acceded to the GPA (which is not yet the case).
In relation to Korea, the FTA covers similar issues to the Korea-Australia FTA, which was negotiated two years earlier. However, there is no e-commerce chapter in the FTA with New Zealand, while it includes a chapter on agriculture, forest and fisheries cooperation. As with Australia, the NZ-Korea FTA has specific chapters on labour and the environment. This is also the case with New Zealand’s FTA with Taiwan. In other FTAs these issues are covered in side agreements, not only in that with China, as mentioned above, but
53 RCEP negotiations include Australia, New Zealand, China, India, Japan and South Korea and the 10 ASEAN countries: Brunei Darussalam, Myanmar/Burma, Cambodia, Indonesia, Laos, Malaysia, Philippines, Singapore, Thailand and Vietnam. 54 CEPEA. 2009. Phase II Report of the Track Two Study Group on Comprehensive Economic Partnership in East Asia. https://dfat.gov.au/international-relations/regional-architecture/eas/Documents/cepea-phase-2-report.pdf
Policy Department, Directorate-General for External Policies
32
also with Hong Kong and Malaysia. These agreements will be discussed in more detail in the section on TSD.
New Zealand’s FTA with Taiwan is quite comprehensive, covering standard FTA chapters, but also indigenous issues, film and TV co-production and air transport services. The other FTA worth noting is the P4 – with Chile, Singapore and Brunei, which went into force in 2006. This didn’t include investment, e-commerce or labour and environment, but as these countries are all in CPTPP, these issues are now covered elsewhere. In terms of FTAs not yet in place, New Zealand negotiated an FTA with the GCC in 2009, covering a rather limited range of issues – goods, services, investment, SPS and TBT - but it has not been ratified.
Overall, the coverage of New Zealand FTAs is slightly less extensive than those of Australia. PP and e-commerce are not included in several. This may be partly a reflection of the fact that many are now relatively old agreements. Business regulation/coherence is only covered in one – that with Singapore. Thus, New Zealand’s main commitments on business regulation are within the bilateral FTA with Australia and the CPTPP. However, transparency in regulation is included in all FTAs. This is also the case for Australia.
In parallel to New Zealand’s negotiations with the EU, it is also undertaking negotiations in the context of RCEP. As discussed above in relation to Australia, these negotiations could create a potentially important trading block and would have significant impacts on their economy, with forecasts of an increase of up to 2 % of GDP.55 There are also on-going negotiations between New Zealand and India, as well as the Pacific Alliance, while the NZ-China FTA is currently being upgraded. Negotiations had also been on-going with the Russia/Belarus/Kazakhstan Customs Union. However, they are currently suspended.
55 CEPEA phase II report
Trade negotiations with Australia and New Zealand
33
4 Likely impacts of FTAs with Australia and New Zealand In this section, we will explore the likely impacts of the FTAs, drawing on several existing studies both for the Commission and in other contexts. In general, the impacts forecast in these studies are coherent with the picture of the trade and investment context which emerges from the analysis in section 2. Before discussing them in detail, it is important to note that economic studies provide quite accurate indications of the likely impacts of changes in tariff rates and fixed duties on goods trade. These barriers are quite easy to model, in that they have a direct, quantitative effect on trade costs. Non-tariff barriers to trade are much more difficult to integrate into economic models. Thus, the forecast impacts of other aspects of the negotiations, like the liberalisation of access to services markets, the elimination of non-tariff barriers, or the opening of public procurement markets are, by definition, based on a wider set of assumptions about the interaction between these various factors and business decision making. This limitation is particularly problematic in the case of Australia and New Zealand, as their relatively low tariff barriers mean that the impact of the FTAs on EU goods exports is unlikely to be hugely significant. Much of the gains therefore emerge from the creation of business opportunities in contexts where the effects are more difficult to measure.
Finally, the studies discussed below were, quite naturally, all undertaken based on the assumption that the agreement would be with the EU28. As indicated in the Commission’s impact assessments, providing detailed results by member state is complicated for methodological reasons. It is therefore not possible to disaggregate these results for the EU27. However, what is evident is that the forecast impacts are higher than will be the case for a final agreement without the UK. Accepting these caveats, this section will summarise the existing quantitative and qualitative analysis of the effects of the agreements.
4.1 Results of European Commission impact studies The most comprehensive impact studies are those undertaken by the Commission, which were the basis for their impact assessments of the two FTAs and the ex-ante study by external consultants.56 This analysis was undertaken on the basis of a Computable General Equilibrium (CGE) model - the Global Trade Analysis Project (GTAP). This is the most extensive international model of trade and is widely used to assess the impacts of trade policy change. The base data is from 2011 and the time horizon modelled was 2030. The analysis remains the most in-depth of the existing studies in terms of its coverage and the variety of scenarios assessed. In this section, for reasons of space, we will only summarise the key findings. The interested reader should refer to the full studies for the sectoral details.
The study on the impact of the proposed FTAs modelled several scenarios, most notably the status quo versus two FTA scenarios. These were a ‘conservative’ scenario, where the EU retains protection in certain sensitive products, primarily in agriculture and a full liberalisation scenario, where all products are liberalised. It is assumed that in the conservative scenario, there will also be no change in the NTBs to trade with Australia and New Zealand that have been highlighted in the various studies and stakeholder consultations, whereas in the full liberalisation scenario these are cut by 10 %. In reality, the likely ‘landing zone’ for the agreement will be somewhere between these two. The EU will certainly retain protection in key agricultural sectors, providing increased market access through TRQs, while it will also certainly seek to address some of the trade partners’ NTBs. Thus, the likely impacts are between the two figures quoted in the studies. In the following analysis, unless stated otherwise, we quote the range between the ‘conservative’ and ‘full liberalisation’ scenario. Several results are quoted for the two FTAs together. Thus, the Commission’s analysis finds that the impact of the two FTAs on the EU would be an increase of between 0,01-0,02 % of GDP (EUR 2,1-4,9bn) and welfare gains of between EUR 2,6-4,8bn.
56 EC (2017a + b); LSE Enterprise (2017).
Policy Department, Directorate-General for External Policies
34
4.1.1 Analysis of the FTA with Australia The impact of the FTAs on Australia is estimated at between 0,13-0,2 % of GDP (EUR 2,7-4,2bn). EU exports to Australia are expected to increase by between 16,4-33,3 %, while Australia exports to the EU would increase by between 6,9-11,1 %. The sectoral impact varies across the two scenarios, with bigger impacts in the full liberalisation scenario. Overall, for the two FTAs combined, EU export and output growth are positive in vehicles, machinery, chemicals and services and negative for fruit and vegetables (conservative scenario) and ruminant meat and sugar (full liberalisation). Projected export growth to Australia in key sectors was 7-20 % in chemicals, 38-52 % in transport vehicles, 21-61 % in machinery, 48-49 % in dairy and 7 % in services.
Key sectors where EU imports from Australia are expected to rise include some industrial sectors, but the level of trade is low, so these impacts are unlikely to be significant. Impacts are more likely in the agricultural sector, where expected import growth is also higher. It is important to keep in mind that the higher end forecasts are for full liberalisation, which even the most optimistic proponents of an FTA do not foresee as a likely outcome. With this caveat, the projected increases in imports are highest in ruminant meat (sheep and beef), sugar and dairy (0-539 %, 0-124 % and 1-87 %, respectively, all from a low, or very low, base), fruit and vegetables (20 % in both scenarios). Increases in wine imports are projected to be moderate and have essentially no impact on EU output.
The study also modelled the impacts of the changes in trade flows and output on workers and the environment. It found that CO2 emissions would increase in the partners – by between 0,03-0,04 % in the EU and 0,12-0,38 % in Australia. However, as the increases in bilateral trade flows mainly occur at the expense of other trading partners, through a process of trade substitution, the overall impact on global CO2 emissions will be lower. Land use intensity is expected to increase by 1 % in Australia, due to the expansion of production in those sectors where trade is expected to increase. Although this impact is small, the recent drought in Australia and, especially the large-scale fish deaths in the Murray-Darling basin, have caused some environmentalists to question the sustainability of its agricultural sector.57 Increased land use will certainly increase pressure not only on land, but agricultural inputs, especially water. We will return to this question in the chapter on TSD.
In terms of the effect on workers, these are reported for the combination of the two FTAs. The agreements are expected to have a very minor, but positive, effect on EU wages of between 0,02-0,05 %, although effects are higher in Australia. The model also simulated the reallocation of labour, although not the potential effect on the number of jobs, which is projected to stay the same in CGE models of trade policy change. In line with the impacts on sectoral output, labour is expected to be reallocated towards the car sector (in both scenarios), with reductions in fruit and vegetables (between 0,19-0,2 %), as well as sugar (-0,23 %) and, especially, ruminant meat (-1,21 %) in the full liberalisation scenario.
4.1.2 Analysis of the FTA with New Zealand Given the smaller relative size of the New Zealand economy, both compared to the EU and compared to Australia, the impacts on the EU will be, almost by definition, smaller, while the impacts on New Zealand are larger. Increases of 0,28-0,52 % of GDP (EUR 0,7-1,3bn) are forecast, with welfare gains of EUR 0,4-0,6bn. EU exports are expected to increase by between 14,2-32,4 %, while imports from New Zealand are forecast to increase by between 10,5-22,2 %.
As for Australia, the sectoral impact varies across the two scenarios, with larger impacts in the full liberalisation scenario. Overall, the sectoral impacts of the two FTAs are indicated above, however the relative weight of New Zealand in these forecasts can be accessed to some extent by the expected impacts
on their output and trade. Sectors where EU exports to New Zealand were forecast to grow were chemicals (9-27 %), transport vehicles (23-44 %), machinery (19-62 %), dairy (27-29 %) and 7-8 % in services, as well as pork, although figures were not provided for this sector.
Like for Australia, EU imports from New Zealand are expected to rise in some industrial sectors, but these impacts are unlikely to be significant, given the level of trade flows. Impacts are more likely in the agricultural sector, where forecast import growth is also higher. Again, it is important to keep in mind that the higher end forecasts are for a full liberalisation scenario, which is very unlikely. In addition, the forecast impacts on the important ruminant meat sector for New Zealand (25 % in the full liberalisation scenario) contrast with the current situation where they have a very significant duty free TRQ for lamb, which is not fully exploited. The FTA is thus unlikely to significantly change the level of market access in this important sector for New Zealand, putting into question forecast increases. In other agricultural sectors, imports are currently more restricted, thus projected increases are more credible. These are highest in dairy (0-134 %) and fruit and vegetables (38-39 %). Increases in wine imports are projected to be moderate and have essentially no impact on EU output.
The study found that CO2 emissions would increase by between 0,29-0,64 % in New Zealand, higher than in the other partners, partly because of the larger transport distances involved, while land use would increase by 1 %. The effects of the FTAs on jobs reallocation in the EU will mainly be seen in increases in the motor equipment and gas (full liberalisation) sectors and in ruminant meat (in the case of full liberalisation) and fruit and vegetables in New Zealand. In reflection of the way the CGE model works, other sectors, mechanically, see a reduction in jobs.
4.2 Other studies of the FTAs In addition to the analysis which was undertake by the Commission, there are several other studies of trade liberalisation with Australia and/or New Zealand either alone, or in combination with other FTAs. None has undertaken an in-depth cross-sectoral analysis covering the whole scope of the agreement. Nevertheless, the findings of these other studies are informative. In general, they are consistent with the Commission’s own study, although the extent of proposed sectoral impacts may vary.
Several studies have focused on the agricultural sector, including one by the Joint Research Centre (JRC) of the European Commission.58 This latter study used a combination of a CGE model with a model which allows more detailed product specific analysis (called a Partial Equilibrium model) to forecast the cumulative impact of 12 FTAs which the EU was negotiating in 2016. Importantly this group included the USA, as well as Mercosur. They also modelled partial and high (though not total) liberalisation scenarios. This study forecast net losses in EU trade in beef, sheep and poultry and net gains in dairy and pork. The detailed impacts varied across FTA partners and Australia and New Zealand were not those where the greatest impacts were forecast. However, there are obviously cumulative effects across the different trade agreements which are a concern for the EU agricultural industry. This point was underlined in the recent workshop on the Australia and New Zealand FTAs.59
In terms of the impacts on EU trade with Australian and New Zealand, overall increases in agri-food commodities trade were forecast to be between EUR 258-742m and EUR 230-569m respectively in imports and EUR 38-80m and EUR 10-18,5m in exports. Key sectoral impacts included a large increase in the trade deficit with New Zealand in dairy products from EUR 213m to between EUR 399-743m (almost no net effect was expected with Australia) and a large increase in the beef and sheep trade deficit with Australia from EUR 394m to between EUR 596-899m (almost no net effect was expected with New Zealand). Very little
58 Boulanger, P., Dudu, H., Ferrari, E., Himics, M., and M'barek, R (2016). Cumulative economic impact of future trade agreements on EU agriculture. European Commission, Joint Research Centre. 59 Comments by D. Azevedo, Copa-Cogeca, at the INTA Workshop on the FTA negotiations with Australia and New Zealand, Brussels, 29/01/19.
Policy Department, Directorate-General for External Policies
36
change was expected in the trade balance in poultry or arable crops, including rice and sugar, while small increases in the deficit for fruit and vegetables were expected, especially for New Zealand (an increase of between EUR 10-22m). In the beverages sector, the EU trade deficit with Australia was expected to fall from EUR 109m to between (EUR 105-61m).
The French government commissioned a recent study of the impact of the FTAs on the livestock sector.60 The report argues that multi-sector impact analysis doesn’t effectively take account of the specificities of the sector and it thus undertakes a detailed analysis. Like the other studies above, the report concludes that the FTAs pose few risks to pork and poultry, but raise concerns in lamb, beef and dairy. It provides an exhaustive analysis of the current structure of market access to the EU market of the two partners, which makes it clear that it is often very limited. It notes, for example, that some TRQs are little, if ever used, as a result of high in-quota duties.
Although it is a highly detailed and helpful input to the debate, its conclusions are rather alarmist. In particular it considers that increased market access would create the risk of ‘…opportunistic, destabilizing and even crisis-boosting shipments for New Zealand sheep meat and Oceania dairy ingredients…’ (p. 3). This seems quite a low risk scenario, especially for sheepmeat, where New Zealand doesn’t currently fill its duty-free quota, as the report itself notes. Concerns about surges in this sector are based on the potential for new barriers to block exports from Australia and New Zealand to other important Asian markets, which would likely lead to trade deviation to the EU market. Although of course this is possible, in sheepmeat there is already plenty of potential for New Zealand to increase in-quota exports to the EU, should other markets be closed. Thus, the FTA is unlikely to change the situation radically. In addition, given the entry into force of the CPTPP and the fact that both countries have FTAs with China, the potential for Asian markets to suddenly restrict access to both or either source is limited.
In the dairy sector concerns seem more well-founded, given the lower cost of production, especially in New Zealand (20 % lower than in France, according to the report), the important growth in production (which has doubled in New Zealand in the last 20 years) and the limited market access currently enjoyed by both countries to the EU market. The important role of Fonterra – a key actor in New Zealand, responsible for 84 % of milk processing – is also noted. It is a truly global player exporting to over 100 markets. However, in Fonterra’s submission to their government’s consultation on their ‘Trade for All’ strategy, the EU did not figure as a particularly important priority for future FTAs, but rather as a competitor in several key markets.61 Thus, although supportive of the FTA with the EU, the company has many other priority markets, mainly in the Asian region. Overall, although there is certainly a need to remain vigilant about the impacts of increased market access on dairy, as well as the other livestock sectors highlighted, the extent of market opening within the FTAs can be limited through TRQs and EU negotiators will certainly make maximum use of these possibilities.
The Dutch government also commissioned a study relevant to these FTAs,62 although like the JRC study it addressed several different FTAs simultaneously – specifically it looked at FTAs with Chile, Mexico, Indonesia and the Philippines in addition to Australia and New Zealand. The report finds the highest positive effects on the Dutch economy (in terms of increased exports, employment and wages) from the proposed FTAs with Australia and Indonesia. The report uses a different methodology to that used by the European Commission to assess the impacts of liberalisation63 and uses the agreement with Canada
60 ABCIS (2018). Étude Risques et opportunités pour les filières animales françaises et européennes dans la perspective d’accords de libre-échange UE/Nouvelle-Zélande et UE/Australie, Study for the Ministère de l’agriculture et de l’alimentation (MAA). 61 Fonterra (2018). Trade For All, Fonterra Submission to MFAT. October 2018. 62 Oomes, N et al. (2016). Impact of Six Free Trade Agreements on the Dutch Economy. https://www.rijksoverheid.nl/documenten/rapporten/2017/02/07/impact-of-six-eu-free-trade-agreements-on-the-dutch-economy Accessed on 18/02/19 63 Specifically, it uses a Gravity Model rather than a CGE model and thus models impacts on trade, rather than the economy. They model the economic impact in a second step.
(Comprehensive Economic and Trade Agreement - CETA) as the basis for the likely negotiating outcome. It is thus a useful comparison.
The study finds that an FTA with Australia and New Zealand would result in an increase of Dutch exports by 175 % and 163 % respectively, with imports increasing by 117 % and 121 %. Given that the Netherlands has a trade surplus with Australia, the overall effect would be to increase that surplus. For New Zealand they have a trade deficit and the FTA would result in little change in the trade balance. The increase in Dutch GDP forecast from the FTAs is 0,16 % and 0,01 % for Australia and New Zealand respectively. The biggest employment effects of both FTAs are seen in the transport, R&D, agriculture and retail sectors. The Australian FTA was forecast to create in the region of 15,000-13,000 Full Time Equivalent (FTE) jobs over a ten-year period (so 1,500-1,300 per year), while for New Zealand the figures were 1,132-1,128 FTE. Although the study obviously reflects the specific characteristics of the Dutch economy, it nevertheless provides interesting and, overall, positive results.
Finally, one study which helps shed some light on how Brexit will affect the outcome is the recent study of the EU-Japan FTA by the Ifo Institute.64 Unlike the older studies quoted above, which pre-dated the UK vote, it explored the question of how Brexit affected the impact of the FTA. Although obviously the findings are specific to the EU-Japan context, some elements are useful to understanding the key differences between the impact studies above and FTAs with the EU27. Unsurprisingly, the study finds that Brexit makes the agreement less valuable for Japan, although, somewhat counter-intuitively, it slightly increases the EU’s gains. Certain Member States would benefit more from the FTA in a post-Brexit scenario. This is the case for Germany, where the fact that their car makers would have a competitive advantage over those in the UK increases their gains from the FTA. This effect is also likely to hold in the case of the Australia and New Zealand FTAs. Other Member States would gain less, especially those which tend to export goods through the UK, by providing key inputs to UK value chains. These include France, Spain and Italy. Depending on the structure of the various value chains, the rules of origin applied and the level of UK inputs, such losses in potential welfare effects, compared to an EU28 deal, are likely to also be an issue in relation to the FTAs with Australia and New Zealand.
64 Ifo (2017) On the Economics of an EU-Japan Free Trade Agreement. Study on behalf of the Bertelsmann Foundation.
Policy Department, Directorate-General for External Policies
38
5 Trade and Sustainable Development (TSD) in the FTAs In this section, we will explore how trade and sustainable development (TSD) issues could be dealt with in the FTAs with Australia and New Zealand. This issue has become increasingly salient in recent years, as civil society has more actively engaged in the debate on trade and the EP has extended its role in trade policy making. This section will set the context, briefly discussing the very extensive academic debate on the interaction between trade policy and sustainable development, before highlighting the key factors likely to impact on talks on TSD in these FTAs – in terms of the EU’s policy context, but also that of the partner countries. Both partners are highly developed countries, with effective consultation mechanisms on trade policy making. TSD issues have been widely aired in their national debates on trade and several of their existing FTAs include chapters on labour and the environment. We will explore these national policy contexts in turn, before discussing how TSD issues might be effectively addressed in these FTAs.
5.1 The academic debate on TSD Within the academic community the issue of the interaction between trade and sustainable development objectives has long been the subject of intense debate. It is beyond the scope of this report to address all the aspects of this discussion. Rather we highlight the most relevant in the context of EU FTA negotiations. This relates to the question of how trade policy tools can be effectively used to promote positive change within the global value chains where much of the worlds goods and services are created. Much research has focused on how positive impacts for workers and their wider communities from trade can be maximised, while avoiding negative impacts on the environment.
A key issue, which has attracted a lot of attention, is the question of whether ‘promotional’ or ‘conditional’ approaches to linking trade and sustainable development are more effective in securing policy change within partner nations. The linkage which has attracted the greatest amount of research is probably that between labour standards and market access, but this work is also relevant for other aspects of sustainable development, like the protection of the environmental or human rights. The very brief summary which follows is complementary to a much more in-depth report on TSD in FTAs which was published in 2018, further to an INTA workshop on that topic.65
There are varying approaches to linking market access with broader sustainable development (SD) objectives, both within the EU and globally. In the EU context, the link between trade and sustainable development is explicit, not just in FTAs, but also at the unilateral level, through the Generalised System of Preferences (GSP). Specifically, in the EU’s GSP, market access can be revoked due to violation of fundamental human and labour rights, while higher levels of market access can be secured by ratifying and effectively implementing a series of key SD conventions (GSP+). The US has a more ‘conditional’ approach to the inclusion of labour standards in their FTAs, where, for example, ratification of key International Labour Organisation (ILO) conventions is required before entry into force of FTAs and market access can be revoked for non-compliance. These varying approaches have provided quite a rich terrain for researchers to explore the impacts of different policies.66
Overall, researchers tend to find that, firstly, it is very difficult to identify the exact link between market access conditionality and policy change, as there are so many other factors at work when a sovereign
65 Raess, D. Schmieg, E. and Voituriez, T. (2018). The future of sustainable development chapters in EU free trade agreements. EP Directorate General for External Policies. Policy Department. 66 See Harrison, J. et al (forthcoming). Labour Standards Provisions in EU Free Trade Agreements: Reflections on the European Commission's Reform Agenda. World Trade Review, 1-23. doi:10.1017/S1474745618000204 for a recent review of the literature on the link between labour standards and FTAs. On the effectiveness of conditionality in GSP see, for example, Orbie, J. and Tortell, L. (2009). The New GSP+ Beneficiaries: Ticking the Box or Truly Consistent with ILO Findings? European Foreign Affairs Review, 14: 663–681 and Berik, G. and Van der Meulen Rodgers, Y. (2010). Options for Enforcing Labour Standards: Lessons from Bangladesh and Cambodia. Journal of International Development, 22: 56-85.
Trade negotiations with Australia and New Zealand
39
government decides to upgrade labour standards, or address corruption. What is clear is that making market access conditional on the ratification of certain international conventions does improve their adoption, although it cannot secure their effective implementation. Even when market access can be withdrawn for non-respect of certain standards, the difficulty in demonstrating cause and effect means that real effects are often limited. In the case of the US FTAs, where, in theory, non-respect for labour rights can result in reneging of market access, there has only ever been one case that went all the way to a panel judgment and that went against the US, as the link to trade could not be demonstrated. However, several academics argue that the threat of potential sanctions is enough to secure real policy change, or at least avoid negative roll back. Whatever the approach taken to TSD, there is quite wide consensus that there is no single best solution and that dialogue, monitoring and financial support for projects addressing the effective protection of workers or the environment, have a key role to play.
5.2 EU policy context on TSD The EU has included sustainable development objectives in its trade policy for many years, starting, as mentioned above, with its unilateral market access schemes under the GSP. It has undertaken Sustainable Impact Assessments (SIAs) of its future FTAs since the early 2000s, starting with the Chile FTA. Around the same time, references to cooperation on labour and the environment started to be systematically included in FTAs.67 Over time, these references have expanded into entire chapters and the role of civil society, which had been limited to information and consultation, has evolved into a formal role in the Domestic Advisory Groups (DAGs) which accompany each FTA.
Currently, trade policy making is guided by the overarching principles defined in 2015 in the ‘Trade for All’ (TfA) strategy,68 which explicitly acknowledged that EU trade policy is not just about interests, but also about values. The strategy highlights the importance of leveraging FTA negotiations to promote European values, including sustainable development. In its 2017 report on the implementation of the TfA strategy the Commission underlined the progress on these issues, including the fact that ‘Comprehensive, binding sustainable development provisions are now part of all FTA negotiations…’ 69 and highlighted the importance attributed to sustainable development in recent negotiations, including with Canada and Japan.
Nevertheless, the EU has been criticised for its more promotional and consensual approach to TSD and the EP has consistently called for more binding clauses on TSD.70 There is a perception that the existing system does not enable abuses by trade partners to be adequately addressed. For example, in the context of the EU-Korea FTA, following labour unrest in 2015-6, the EU trade union movement, and civil society more widely, expressed strong concerns about the lack of respect for fundamental labour rights in Korea. The evaluation of the implementation the FTA undertaken shortly afterwards noted their frustration about a perceived lack of action by the EU to address these concerns.71 Partly as a reaction to such criticisms, the Commission launched a consultation in 2017 on the EU approach to TSD.72 They received a wide range of
67 In the Chile FTA, for example, Article 28 addresses cooperation on the environment and Title V covers Social Dialogue 68 EC (2015) Trade for All – Towards a more responsible trade and investment policy. Brussels: European Commission. 69 EC (2017c) Report on the Implementation of the Trade Policy Strategy Trade for All - Delivering a Progressive Trade Policy to Harness Globalisation. Brussels: European Commission. 70 See European Parliament resolution of 12 September 2017 on the impact of international trade and the EU’s trade policies on global value chains (2016/2301(INI)) 71 Civic and Ifo (2017). Evaluation of the Implementation of the Free Trade Agreement between the EU and its Member States and the Republic of Korea. Interim Technical Report Part 1: Synthesis Report. Report for DG Trade. Brussels. Commission of the European Communities. 72 EC (2017d). Non-paper of the Commission services Trade and Sustainable Development (TSD) Chapters in EU Free Trade Agreements (FTAs) http://trade.ec.europa.eu/doclib/docs/2017/july/tradoc_155686.pdf .
Policy Department, Directorate-General for External Policies
40
inputs, summarised in a non-paper, which also proposed a series of actions to move the agenda forward, while concluding that there was no consensus on the EU moving to a ‘sanctions-based’ approach.73
Finally, although not directly related to the FTA negotiations, developments in the conditionality of market access in the EU’s GSP are relevant to the wider debate on TSD. There has been rising criticism of lack of respect for human and labour rights in several GSP recipient countries, especially Least Developed Countries (LDCs) who get very high levels of access under the Everything But Arms (EBA) initiative. The EP sent a mission to Bangladesh following the Rana Plaza disaster and concerns were expressed, not only about safety at work, but also freedom of association and freedom of expression,74 while the Commission and the EEAS recently sent a delegation to Cambodia to investigate reports of human and labour rights abuses.75 Further to the latter, the Commission is in the process of reneging preferential market access for Cambodia, while concerns in Myanmar, especially on human rights, may result in a similar process.76 These developments signal an increasing willingness by the EU to enforce conditionality in their unilateral market access, which could spill over into bilateral agreements.
The negotiations with Australia and New Zealand therefore take place in a context where the legitimate concerns of civil society about potential negative impacts of trade and the ineffectiveness of current structures has led to a reassessment and an openness to make the system more effective. This does not necessarily imply that sanctions should be included in the TSD chapters of these FTAs. As several key experts on the subject have recently convincingly argued,77 presenting the debate as a simple dichotomy between sanctions and non-sanctions based approaches ignores many other important potential TSD linkages. The Australia and New Zealand negotiations provide an opportunity for upgrading and strengthening the EU’s approach to TSD. Indeed, the recent report to the EP highlighted that the negotiations with New Zealand, in particular, provide an opportunity for a common approach to TSD, including in their relations with common FTA partners, like Korea.78 Vietnam will also soon be a common FTA partner and labour issues will certainly be important in that trilateral relationship.
5.2.1 TSD in existing EU FTAs As discussed above, the issue of labour, environment and other SD issues like human rights and corruption, started to be incorporated in the EU’s FTAs in the early years of this century. Since then the EU’s approach has evolved quite rapidly, partly in response to pressure from the EP and civil society. Rather than looking at all the EU’s FTAs, we will here highlight the key aspects of the most recent agreements with developed countries which are broadly comparable to Australia and New Zealand – those with Canada and Japan.79
In CETA there are three chapters of relevance. Chapter 22 covers TSD issues overall, while Chapters 23 and 24, cover Labour and Environment, respectively. The aims of the three chapters are highlighted in Article 22.1.3, where five of the paragraphs start with the objective to ‘promote’ while one talks of ‘enhancing enforcement’. It is this language which many civil society actors find too weak. In terms of the institutional structure, a Committee on TSD is established between the administrations, as well as a Civil Society Forum,
73 EC (2018). Feedback and way forward on improving the implementation and enforcement of Trade and Sustainable Development chapters in EU Free Trade Agreements http://trade.ec.europa.eu/doclib/docs/2018/february/tradoc_156618.pdf 74 EP (2016a). Mission Report following the ad-hoc delegation to Bangladesh (Dhaka) from 15 to 17 November 2016. EP INTA. PE597.400v01-00. 75 EC and EEAS (2018). Cambodia: EU mission assesses human rights and labour situation Press Release. 12 July 2018 76 Malmström, C (2018a). On Myanmar and Cambodia. Blog Post, 5 October 2018. https://ec.europa.eu/commission/commissioners/2014-2019/malmstrom/blog/myanmar-and-cambodia_en 77 See Harrison, J. et al. (forthcoming). 78 Raess et al. (2018). It is not clear why New Zealand in particular was highlighted in the report. Other bilateral relationships like that with Australia, but also Canada and Japan, would provide similar opportunities. 79 For a more detailed comparison of the EU-Japan FTA with other recent EU FTAs, see Chowdhry, S. Sapir, A. and Terzi, A (2018) The EU-Japan Economic Partnership Agreement. Study for the EP Directorate General for External Policies. Policy Department.
while the parties commit to consulting existing Sustainable Development Domestic Advisory Groups (DAGs) or convening new ones if they do not exist, on the issues in these chapters.
Chapter 23 reaffirms the parties’ commitment to ratify and implement the ILO’s Core Labour Standards (CLS).80 Canada has ratified all 8 conventions, although two (98 & 138) only in the last three years. The text includes commitments to effectively implement respective labour laws and desist from lowering labour standards. It also commits the parties to cooperate in their international relations, including with their respective FTA partners. Specifically, they commit to: ‘dialogue and information-sharing on the labour provisions in the context of their respective trade agreements, and the implementation thereof;’ and ‘the exploration of collaboration in initiatives regarding third parties’. These commitments open the possibility of the kind of coordination of approaches to common FTA partners suggested in the recent report to the EP on TSD, although they are specific to the labour chapter, rather than TSD more broadly.81 Finally, the chapter includes a procedure for consultations on issues of concern. If the issues are not resolved satisfactorily through consultations, a panel of experts can be established. The panel reports on the issue of concern and provides recommendations which are monitored by the SD Committee.
Chapter 24 on trade and environment commits the parties to implement the multilateral environmental agreements (MEAs) to which they are party, but, unlike for labour, there is no list of MEAs that should be ratified, partly because there is no equivalent in global environmental governance to the CLS of the ILO. There are specific articles on encouraging trade in environmental goods and services,82 as well as trade in sustainable forestry and fishery products. As in Chapter 23, a consultation and panel procedure has been created to deal with any conflicts.
In the agreement with Japan, TSD is covered in a single Sustainable Development chapter – Chapter 16. Although it is a shorter and more mutualised text, much of the commitments are the same as for CETA. In relation to labour, Japan has not ratified two ILO CLS conventions – 105 on forced labour and 111 on discrimination. The FTA requires that parties make ‘continued and sustained efforts on its own initiative’ to ratify all core conventions. On environment, the key difference with CETA is that there is a specific reference to the Paris Agreement in the text where: ‘The Parties reaffirm their commitments to effectively implement the UNFCCC and the Paris Agreement…’83. Like CETA, the chapter establishes a Committee on TSD and a DAG, as well as a Joint Dialogue with civil society. Dispute resolution under the chapter is essentially the same as CETA.
The fact that Japan withdrew from the International Whaling Commission (IWC) and announced that it would resume commercial whaling within days of the EU-Japan FTA being approved by the EP will certainly increase pressure for environmental issues to be covered more comprehensively in the EU’s future FTAs. The EP had requested that whaling be addressed in the EU’s bilateral relations with Japan: ‘with a view to abolishing the practice’,84 however whaling is not mentioned in the TSD chapter.
80 These are the Conventions covering Freedom of Association and Collective Bargaining (Conventions 87 & 98), Elimination of Forced Labour (29 & 105), Child Labour (138 & 182) and non-discrimination (100 & 111). 81 Raess et al. (2018). 82 This is something which both parties, along with Australia and New Zealand, have tried to achieve at WTO level through the still incomplete negotiations for an Environmental Goods Agreement (EGA) 83 The EP has underlined that both ratification and implementation of the Paris Agreement should be a precondition for future FTAs. See European Parliament resolution of 3 July 2018 on climate diplomacy. http://www.europarl.europa.eu/sides/getDoc.do?pubRef=-//EP//TEXT+TA+P8-TA-2018-0280+0+DOC+XML+V0//EN 84 EP (2016b). European Parliament resolution of 6 July 2016 on Japan’s decision to resume whaling in the 2015-2016 season. P8_TA(2016)0313
Policy Department, Directorate-General for External Policies
42
5.3 Sustainable development issues in Australia and New Zealand In this section we will briefly discuss the context for sustainable development in the two partner countries. As discussed above, both countries have a very active trade policy agenda aimed at expanding market access through extensive FTAs and on-going negotiations. Their approach on the integration of TSD concerns has been quite similar, although there are important nuances in their national political priorities, as well as the extent to which their national sustainability contexts are under stress.
Both countries are highly developed democracies, with strong institutions and are very active at international level on issues related to SD. They have a shared commitment to preserving their unique biodiversity, but also areas of weakness in relation to the sustainable management of their natural resources and potential for progress. In relation to labour, although they have strong labour protection laws and free trade unions, neither have ratified all the CLS conventions. Specifically, neither have ratified convention 138 on prevention of child labour, while New Zealand has also not ratified 155 on freedom of association. Table 2 below presents some key facts relevant to the environmental context in both cases, in comparison with the current EU.85 Overall, the EU has a better environmental performance than the other two countries. The details will be discussed below in the country-specific sections.
Table 2 – The Environmental context in the EU, Australia and New Zealand
Source: World Bank, World Development Indicators, Germanwatch, UN (CCPI - Climate Change Performance Index; RE - renewable energy; GHG – Greenhouse Gas)
5.3.1 Australian policy context on sustainable development Australia has a very developed regulatory system in terms of labour and environment, thus levels of legal protection are high. In relation to labour, although Australia has not ratified one outstanding ILO CLS convention, on child labour, there is no indication that this is a problem in Australia.86 In addition, at the recent INTA workshop on the FTAs, the representative of the Australian mission indicated that the government is in the process of ratifying this convention.87
The context for environmental protection is potentially more problematic. Although Australia has ratified most of the key MEAs, a key exception is the Cartegena Protocol on Genetically Modified Organisms.88
85 Most existing analysis take the EU28 as their basis. This is adequate for our purposes. In terms of policy, the exit of the UK will make no difference to the EU scores. According to World Bank data, CO2 emissions per capita of the EU27 was essentially the same as the EU28 in 2014. 86 See LSE Enterprise (2017) for a detailed analysis of labour standards in Australia and New Zealand. 87 Remarks by Helen Stylianou, Deputy Ambassador of Australia to the EU, INTA Workshop on Trade Negotiations with Australia and New Zealand, Brussels 29/01/19 88 See LSE Enterprise (2017) for a full discussion on Australia’s ratification of various MEAs.
Trade negotiations with Australia and New Zealand
43
Overall, Australia performs well on environmental indicators, such as those integrated into the Environmental Protection Index (EPI) compiled by Yale University, however there is quite some variance in its performance across different issues.89 Australia ranks 21st in the index, above several EU Member States. Environmental quality is high, however there are areas of weakness on biodiversity protection, forests, fisheries and agriculture, while Australia is in the bottom half of global rankings in climate and energy.
As the table above indicates, Australia has a much higher level of CO2 emissions per capita than the EU, as well as a higher level of dependence on fossil fuels. Both reflect the high dependence of its economy on coal, both as a fuel and as a commodity for export. In addition, the high levels of methane intensity noted in the EPI reflect the importance of livestock agriculture in the economy. As a result of these factors, the country has a very unfavourable rating in the Climate Change Performance Index (CCPI) and Climate Policy ranking established annually by the NGOs Germanwatch, New Climate Institute and the Climate Action Network.90 The latest report was rather damning in its conclusions on Australia, noting: ‘…the government has no comprehensive emission reduction policy, no regulation of transport emissions and no plans to phase out coal.’
Although Australia has signed the Paris Agreement and committed to a reduction of 26-28 % in Greenhouse Gas (GHG) emissions, these commitments have been rated ‘insufficient’ by NGOs (as have the more ambitious targets of the EU). 91 The fact that the national carbon pricing system was repealed in 2014 following a change of government, raises concerns about the extent to which all parties within the country can be considered reliable partners in addressing sustainability challenges.92
In view of the EP’s position on climate diplomacy, it seems likely that strong language on the implementation of the Paris Agreement will be included within the FTA. The UN process requires agreement signatories to report and update their Nationally Determined Contributions (NDCs) every five years.93 The first reports are due in 2020 and these will certainly be closely monitored by civil society and the EP in the light of the potential entry into force of the FTA with Australia, as well as with other partners including New Zealand. It should be noted that at the INTA workshop on the FTAs, the Australian deputy ambassador underlined their government’s commitment to the Paris targets. It is worth noting that the country holds an election in May 2019 and the opposition party has a strong focus on increasing levels of renewable energy use, although coal will likely remain an important source of energy, even in case of a change of government.94
Another key environmental concern is the sustainability of Australian agriculture following a series of major droughts95 and, most recently, the death of over a million fish in the Murray Darling river basin, a key source of irrigation for the country’s agricultural sector.96 The latter was widely reported in the European press and is certain to be noted by civil society campaigners concerned about the impacts of increased trade on the environment. Given these factors, it is likely that there will be pressure to create mechanisms in the FTA to bind the Australian government to its commitments and to effectively monitor the sustainability impacts of increased trade under the FTA.
89 https://epi.envirocenter.yale.edu/epi-country-report/AUS 90 Full results in Burck, J et al. (2018) Climate Change Performance Index. Results 2019. Berlin: Germanwatch, NewClimate Institute and Climate Action Network 91 https://climateactiontracker.org/countries/australia/ 92 See LSE Enterprise (2017) for a more detailed analysis. 93 Details of NDCs can be found here: https://unfccc.int/process/the-paris-agreement/nationally-determined-contributions/ndc-registry#eq-1 94 https://www.laborsclimatechangeactionplan.org.au/ 95 A point also highlighted in the report for the French government: ABCIS (2018). 96 Greenpeace (2019) Murray Darling Disaster. https://www.greenpeace.org.au/blog/murray-darling-disaster/
Policy Department, Directorate-General for External Policies
44
5.3.2 Integration of sustainable development concerns in Australian trade policy Overall, the objectives of Australia’s trade policy are underlined in its Foreign Policy White Paper published in 2017. The paper highlights ‘defending an open global economy’ and ‘securing opportunity globally’ as two of the four key elements in its ‘Agenda for Opportunity’. In relation to the former, the paper underlines the Australian commitment to the WTO, but is pragmatic about the fact that new market opportunities are more likely to emerge from FTAs. This policy area is developed in relation to the second objective of ‘securing opportunity’, through a series of new and deep FTAs. In relation to the EU, and the possibility of an FTA with the UK, the paper indicates: ‘These prospective FTAs will advance our commercial interests, especially in investment, services and agriculture. They will also signal the commitment of Australia, the European Union and the United Kingdom to a strong global trading system.’ 97 Any references to standards within the document are mainly in the context of their harmonisation to facilitate trade and the references to labour within the text are overwhelmingly in relation to balancing labour mobility with immigration control. There is no indication in the text that Australia sees FTAs in terms of values, as indicated in the EU’s TfA strategy. Indeed, in an initial stakeholder survey on the FTA a government representative is quoted as saying ‘A FTA should focus on trade and not be about values. Keep value judgments out of it.’98
Nevertheless, as discussed above, Australia has not ignored the issues of labour and environment in its trade policy and has already included TSD provisions in trade agreements, starting with the FTA with the US in 2005. However, as indicated in Table A24, these issues are not addressed in most of its bilateral FTAs.99 The only recent bilateral FTA where labour and environment chapters were included was that with Korea, which entered into force in 2014.
There are two relevant chapters in that FTA – Chapter 16 on labour and chapter 17 on environment. Chapter 16 refers to the commitment of both parties to ‘endeavouring to adopt or maintain’ the ILO CLS (although Korea has not ratified four CLS and Australia one), while in chapter 17 both parties recognise the important role of the MEAs to which they are party. On both labour and environment, the text recognises the right to regulate, but commits both sides to not lowering standards in order to stimulate trade. Institutionally each party establishes a contact point, consultations can be requested and an ad-hoc committee can be established, if needed. Overall neither party undertook significant commitments within the FTA and the structures for cooperation and institutions for oversight are considerably lighter than those habitually used in EU FTAs.
5.3.3 New Zealand policy context on sustainable development New Zealand, like Australia, is a developed, democratic and well-regulated country, where environmental and labour standards are generally high. As indicated above, New Zealand hasn’t ratified two CLS conventions, on child labour and freedom of association, although, as with Australia, there is no indication that either are a problem in New Zealand.100 In the INTA workshop on the FTAs, the Ambassador indicated that these conventions had not been ratified for purely technical reasons and that New Zealand remained strongly committed to maintaining and promoting high labour standards.101 ILO analysis indicate that the failure to ratify convention 87 on freedom of association is related to concerns about the requirement to
97 Australian Government (2017). Foreign Policy White Paper p. 61 98 GA Research (2013) 99 The exception was the FTA with Malaysia, which has side letters on both environment and labour which indicate that these issues were not addressed in the FTA, in view of the fact that they were included in the on-going TPP negotiations. 100 See LSE Enterprise (2017) for a fuller discussion on this issue. 101 Intervention by David Taylor, Ambassador of New Zealand to the EU, INTA Workshop on Trade Negotiations with Australia and New Zealand, Brussels 29/01/19.
Trade negotiations with Australia and New Zealand
45
legalise so-called ‘sympathy strikes’, while the regulation of ‘light work’ is a concern in relation to the convention on child labour.102
Like for Australia, the issue of environmental protection is potentially more problematic for New Zealand, although overall it performs well on many measures. Its ranking in the EPI is 17th among nations, although it has weaknesses, especially in agriculture where it is ranked 106, while its performance in air pollution and climate change is mediocre.103 The latter result is very much linked to high methane emissions from agriculture. New Zealand has ratified all the key MEAs and its performance on all the indicators in table 2 is better than Australia. It performs less well than the EU, although the difference in CO2 emissions per capita is low. This is partly because, unlike Australia, New Zealand relies heavily on hydro power for electricity. Its most carbon intensive sector is therefore transport, not energy. It underperforms on the above climate change performance indicators because a perceived lack of policy efforts to reduce GHG emissions and further expand renewable energy.104 Overall, however, New Zealand often performs better than many EU countries in the various indicators used for the EPI, thus, although there are certainly areas where improvements are needed, it is a country where environmental concerns are on the political agenda and where commitment to the Kyoto Protocol and the Paris Agreement have not been seriously questioned.
5.3.4 Integration of sustainable development concerns in New Zealand trade policy New Zealand, like Australia, has a very active trade policy agenda. Recently they have launched a new trade policy agenda – called Trade for All.105 Within this context, it was proposed that New Zealand’s trade policy agenda should address a wide range of concerns including, environmental issues, health, labour rights, gender equity, rights of indigenous peoples and SME participation. A public consultation was launched on the proposals, which confirmed that there was widespread support for this aspect of the agenda. The summary report concluded: ‘Using trade to deliver sustainable development was a significant theme that emerged from the consultation process’. 106
Like Australia, New Zealand has not systematically included environmental and labour issues in its recent FTAs, although the coverage of these issues in their FTAs is more extensive. New Zealand does not have an FTA with the US, thus the first time TSD issues were included within an FTA was in that with Taiwan (2013), followed by that with Korea (2016). However, there are side agreements in the FTA with China and Hong Kong, as well as the FTA with Malaysia (2016). In the latter case these go much further than the side letters agreed within the context of the Australia FTA and include institutional structures – specifically joint Labour and Environment Committees – and the potential for consultations. Although institutional mechanisms in the China and HK side agreements are lighter, they also include the potential for consultation.
In the NZ-Korea FTA, Labour and Environment are included in Chapter 15 and 16 respectively. The text is quite similar to that included in the side agreements with Malaysia, however the fact that they are within the text of the FTA obviously gives them more weight. The integration of civil society in these chapters (and the side agreements) is not systematic, rather the parties can invite their participation and input, should they see fit. The environment chapter also includes an annex detailing an extensive list of potential areas for cooperation, including in relation to MEAs and in the WTO.
102 See ILO (2012) General Survey on the fundamental Conventions concerning rights at work in light of the ILO Declaration on Social Justice for a Fair Globalization, 2008 p. 51 and p. 379. https://www.ilo.org/wcmsp5/groups/public/---ed_norm/---relconf/documents/meetingdocument/wcms_174846.pdf 103 See https://epi.envirocenter.yale.edu/epi-country-report/NZL the performance in agriculture is linked to the country’s poor performance on sustainable nitrogen management. 104 Germanwatch et al. (2017). 105 https://www.mfat.govt.nz/en/trade/nz-trade-policy/trade-for-all-agenda#Principles 106 https://www.mfat.govt.nz/assets/Uploads/Trade-for-All-Summary-of-Feedback.pdf p. 4
Policy Department, Directorate-General for External Policies
46
5.3.5 Sustainable Development issues in the CPTPP In addition to their bilateral FTAs with various partners, both countries are also party to the CPTPP, a very extensive agreement covering 30 chapters. Chapter 19 covers Labour and 20 Environment. These chapters are substantially longer than those included in the respective bilateral FTAs. For example, the CPTPP chapter on labour is 14 pages long compared to 5 pages for the equivalent chapter in the NZ-Korea FTA and 3 pages in that between Korea and Australia. They are not only longer than the equivalent chapters in bilateral agreements, they also contain more substantial commitments, including stronger language on the adoption of CLS – ‘Each Party shall adopt and maintain in its statutes and regulations…’, the creation of a Labour Council, the requirement to establish a civil society advisory body and the recourse to dispute settlement.
Although this latter aspect is a key difference to EU practice, as noted above, cases of actual recourse to dispute settlement under such chapters are rare. The extent to which members of CPTPP will use this possibility remains to be seen, however its existence could have a positive effect on labour rights in that it creates a disincentive for member governments to renege on commitments or fail to properly implement their laws. In any case, Vietnam was concerned enough about the potential implementation of the chapter to agree side letters with several countries, including Australia, New Zealand and Canada, specifying that they will not suspend trade benefits for Vietnam based on the chapter for a period of three years after the entry into force of the agreement. For non-respect of labour rights, the period is five years.
The environment chapter of the CPTPP is extensive. It is 26 pages long, compared to 5 pages for the chapter in the NZ-Korea FTA and 3 pages for the chapter in the Australia-Korea FTA. The text includes the usual commitments to enforce environmental law and not reduced protection in order to encourage trade. However, it goes into far more detail than any of the other FTAs to which Australia and New Zealand (or indeed the EU) are party on the issues which should be addressed by the partners and the areas where they will cooperate. It makes a specific reference to enforcing the Montreal Protocol on Ozone depletion, as well as the Convention on International Trade in Endangered Species (CITES). In addition, it has articles on the protection of the marine environment from ship pollution, as well as protection of biodiversity, the promotion of sustainable fisheries and the encouragement of voluntary initiatives on both CSR and broader environmental objectives.
In terms of institutional structures, the text establishes an Environment Committee between the parties and requires them to establish national advisory committees of civil society organizations to input to the agreement. There are several different levels of consultation stipulated in the text before recourse to dispute settlement which, like for labour, is ultimately the same as for other aspects of the agreement. There are no side letters on environment in the CPTPP, thus, in principle, it is immediately applicable to all parties, although obviously it is an open question whether any will decide to initiate dispute settlement proceedings. In theory the Australian, New Zealand, or other governments could use the institutions within CPTPP to challenge the recent decision by Japan to resume commercial whaling. However, although they have condemned the move, there is no indication that this will be the case. For example, in the joint ministerial statement by the Australian Foreign and Environment ministers, although they indicated that they were ‘extremely disappointed’ and urged Japan to reverse their decision and return to the IWC, there was no reference to launching consultations under the CPTPP.107
107 Australian Foreign Ministry (2018) Japan to exit from International Whaling Commission and cease Southern Ocean whaling. Press Release. 28/12/18 https://foreignminister.gov.au/releases/Pages/2018/mp_mr_181226.aspx
5.4 Leveraging the EU’s FTAs with Australia and New Zealand for more sustainable trade
The inclusion of a chapter on TSD – or a series of chapters on TSD, labour and environment – in these two FTAs should not be controversial. All parties have already included such chapters in FTAs, although the EU is the only party where the inclusion is systematic. In addition, the entry into force of the CPTPP means that both Australia and New Zealand have signed up to high levels of commitments in an FTA, beyond those which the EU habitually includes. This is particularly the case in relation to dispute resolution, where lack of respect for the engagements in the labour and environment chapters are, in theory, open to sanctions.
As indicated above, there is quite some debate on whether the recourse to sanctions within FTAs is effective in eliciting policy change. In the recent debate on TSD chapters, the Commission concluded that there was no consensus in the EU on moving to a sanctions-based regime, but nevertheless indicated that there were several areas where the system could be improved, including more assertive enforcement. There are already indications that the EU is becoming more assertive in its unilateral market access provision. In addition to greater assertiveness, there are other ways in which the TSD chapters could be made more effective in achieving their objective of ensuring that increased trade flows don’t negatively impact on sustainable development. These could usefully be integrated into the Australia and New Zealand FTAs.
Increased pre-ratification conditionality – The fact that the EU now requires partners in FTA negotiations to have ratified the Paris Agreement is a step forward in using the leverage of FTAs to encourage policy change before agreements are finalised, although monitoring of enforcement should also be linked to the FTA. A similar approach could be used with other core MEAs and indeed labour standards, such that partner nations would be required to have signed up to several conventions before the FTA is concluded. Such an approach could be developed in the Australian and New Zealand FTAs, by expanding conditionality beyond the Paris Agreement. This should not be very controversial with these two partners, as they are already parties to most of the key conventions that would be of concern to the EU. This approach could then provide a useful blueprint for future FTAs. Exactly which conventions to prioritise will be a matter for the EU to decide. One option, proposed by the NGO Transport and Environment, is to use an approach similar to that used in the EU’s GSP+ scheme, where partner countries are required to adopt, and implement, a list of international conventions, including on labour and environmental protection.108
Involve civil society more systematically in discussions throughout the FTA – Within the revised Mexico FTA, the DAGs will already have the capacity to provide input throughout the FTA and not just of the TSD chapter.109 This practice should certainly be continued in these FTAs. This innovation was proposed by the Commission further to the recent debate on improving the TSD chapters.110 The Commission indicated that civil society could have useful inputs on issues like technical barriers to trade, or sanitary and phytosanitary standards. However, they could also provide useful input on other issues like investment provisions and public procurement. Opening DAG discussions to a wider range of issues and creating clearer guidelines and working procedures for these institutions should help to facilitate constructive dialogue and build trust with civil society across the FTA partners.
Link post-hoc impact assessments, DAG inputs and Globalisation Adjustment Fund (GAF) spending – A key criticism of trade is that, while it may bring gains for an economy as a whole, certain sectors will suffer from increased competition, with negative impacts on workers and the affected communities. In the TfA Strategy, the Commission committed to making the EU’s funding mechanism for supporting adjustment to negative trade shocks - the Globalisation Adjustment Fund (GAF) - more flexible and effective in
108 Transport and Environment (2017). Trade and Sustainable Development: A chance for innovative thinking. 109 See draft texts of the revised agreement published here: http://trade.ec.europa.eu/doclib/press/index.cfm?id=1833 110 EC (2018).
Policy Department, Directorate-General for External Policies
48
supporting workers who lose their jobs as a result of globalisation pressures. A key factor in making the GAF more effective, will be the early identification of workers at risk from trade-related pressures. Post-hoc economic impact assessments could be linked with inputs from the DAGs and from civil society more widely, to ensure that vulnerable communities are rapidly identified and that funds to support adjustment are mobilised.
Concerns about job losses as a result of trade liberalisation are not confined to the EU. Our trade partners are also concerned about the negative impacts of increased openness to highly competitive EU products. For example, Australian business expressed concerns in their input to the public consultation on the EU FTA. They noted: ‘Negotiating a FTA with the EU, an economic region significantly larger than Australia, heralds potential risks to Australia’s economic independence and prosperity’ and asked for a ‘safety net’ approach to avoid negative impacts.111 In New Zealand, this issue came up in the ‘Trade for All’ consultation, where their Trade Unions expressed concern about potential job losses from trade. They note ‘Trade policy must therefore encompass support for people through the change it continues to bring…’112 Negotiations with these partners could usefully address how all sides could more effectively anticipate negative impacts and cooperate to support affected communities and workers.
Widen TSD chapters to address the facilitation of cooperation and trading opportunities for a wider range of disadvantaged communities – Linked to the last point, certain communities and investors tend to be particularly well placed to benefit from trade agreements, while others are economically disadvantaged. All partners in these negotiations are aware of this and both Australia and New Zealand are particularly concerned to ensure that their indigenous communities can access trading opportunities. There is widespread support for addressing indigenous issues within these countries. Indeed, New Zealand has already included a chapter on Indigenous issues in its Economic Cooperation agreement with Taiwan and the New Zealand International Business Forum, a business group, underlined its support for active measures within FTAs to support capacity building to help indigenous groups to benefit from trade.113 The same group also supports greater efforts to support female entrepreneurs and this objective is a priority for the New Zealand government. Thus, these FTAs provide the opportunity for cooperation with like-minded countries as well as innovative thinking on facilitating trade opportunities for economically disadvantaged sectors of the community.
111 CITCSA (2016). Australia-European Union Free Trade Agreement Submission. Adelaide: Council for International Trade and Commerce South Australia. 112 NZCTU (2018) Submission of the New Zealand Council of Trade Unions Te Kauae Kaimahi to the Ministry of Foreign Affairs and Trade on the “Trade for all” agenda. Wellington. p. 5 113 NZIBF (2018). New Zealand International Business Forum Submission to the Ministry of Foreign Affairs and Trade. ‘Trade for All Consultation’. September 2018.
Trade negotiations with Australia and New Zealand
49
6 The wider impacts of EU FTAs with Australia and New Zealand
This report has highlighted the many economic impacts which can be expected from the liberalisation of trade through FTAs with both partners. In this final section we will briefly discuss the wider impacts of these FTAs. These do not emerge from classic impact studies which tend to focus, quite naturally, on the economic aspects, which are relatively easy to measure. However, like all bilateral agreements, these FTAs are about more than economics. They create institutions which foster dialogue and approaches to bilateral relations which, over time, also impact on other relationships. Most obviously, there is strong path dependency in trade relations, thus innovations in these FTAs, especially if they work effectively, would likely feed into the future relations of all parties. How these impacts will play out over time is very difficult to predict, however there are several ways which these FTAs can have a wider impact, both on the parties and on the wider global system of governance.
6.1 Supporting a robust and fair global trading system The three partners in these negotiations are also key actors in the global trading system and the WTO. They have consistently sought to defend a rules-based system in trade and other areas of international cooperation. At a time when the WTO and multilateralism in general is under threat, the FTA negotiations provide an opportunity for these ‘like-minded’ nations to send a signal that they favour cooperation and engagement over unilateralism and protectionism. This was a message underlined by Commissioner Malmström in a speech in Wellington in June 2018114 and in Brussels in January 2019 by the Prime Minister of New Zealand, Jacinda Ardern115 and the Australian Trade Minister, Simon Birmingham.116 At the INTA workshop on these FTAs the same month, this point was stressed by most speakers, including the representatives of the EU and the two partners countries.
Thus, the wider political importance of these agreements is well understood. Successfully concluding these negotiations, further to the EU’s agreements with Canada, Japan and Vietnam and the successful re-negotiation of the CPTPP Agreement, despite US withdrawal, will be significant. The latter has helped to create a positive integration momentum in the Asia Pacific region, based on a common understanding of respect for key rules. Adding Australia and New Zealand to the EU’s FTAs will secure further links between this region and the EU. In this context it is particularly important that the FTAs are seen to support a fair, inclusive, rules-based trading system. In this context, the parties should use these negotiations to strengthen key factors like the inclusion of civil society, effective integration of ‘safety nets’ for displaced workers and mechanisms to effectively monitor partners commitments to environmental and social protection. In doing so, they can provide model structures for future FTAs, while addressing some of the criticisms of trade agreements more generally. These political impacts could be significant and durable side effects of the agreements.
6.2 Increasing EU integration with the Asia Pacific region Australia and New Zealand are countries with strong historic links to the EU and substantial shares of their populations have European heritage. Yet they are strongly anchored in the Asia Pacific, both by geography and through extensive political efforts over the years to cooperate and integrate with their neighbours in the region. By strengthening the EU’s links with these countries, the FTAs will naturally increase the EU’s integration with that region. The increased business linkages which they facilitate should increase
114 Malmström, C (2018b). EU and New Zealand: Partners in Global Trade Wellington, 21 June 2018 Speech by the European Commissioner for Trade. 115 https://www.politico.eu/event/politicos-interview-with-jacinda-ardern-prime-minister-of-new-zealand/ 116 http://bruegel.org/events/rules-based-trading-system-and-eu-australia/
Policy Department, Directorate-General for External Policies
50
knowledge and understanding of the Asia-Pacific amongst EU businesses. If the FTA facilitates investment into Australia and New Zealand from the EU, clearly these European businesses would benefit from both countries’ extensive market access in the region and their anchoring in regional value chains.
However, access to Australia and New Zealand markets through FTAs will not change market access for EU goods to either’s FTA partners, because the Rules of Origin (RoO) in their various FTAs would usually prevent goods mainly made in Europe from being traded duty free between Australia or New Zealand and their regional FTA partners. RoO are a key tool by which trade policy impacts on the structure of global value chains and those agreed in FTAs can have significant consequences for business.117 Indeed, one of the key aims of the CPTPP was to harmonise RoO within the region, where the large number of competing and overlapping existing FTAs had created confusion and incoherence.118
In this context, it is important for the EU to consider its FTAs in the region in a holistic manner during these negotiations. The EU needs to decide whether and how the RoO in these agreements can help EU companies to leverage their existing FTAs in the region, such as those with Vietnam and Japan, to create more effective and efficient global value chains. RoO enabling cumulation between the EU and the countries with whom both parties have FTAs in the region would be one way to achieve this. Whether such ‘extended cumulation’ would be feasible or desirable will vary by sector and there will certainly be intense debates on these issues. Key sectors which are likely to be particularly sensitive and complex are cars, processed fish and textiles. The EP will certainly need to debate these issues and seek a pragmatic compromise which maximises the potential of EU-centred value chains, while recognising the advantages which emerge from linking them with those in the Asia-Pacific region.
6.3 Increasing cooperation to tackle global challenges As highlighted above, the multilateral system is under threat from unilateralism and protectionism at a time when global problems are extensive and urgent. Facilitating dialogue with the Australian and New Zealand governments, but also their civil society, on a range of issues, including climate change, workers’ and human rights and protecting biodiversity on land and at sea, should help to build consensus on how to effectively address these major global issues. Of course, the EU already cooperates with both actors in multilateral fora, however creating new institutions for regular exchange and dialogue will increase the opportunities for building such common action.
Another way that these FTAs could potentially have a wider impact is through cooperation across FTA structures. As discussed above all parties have extensive FTA networks across the world, many of which have chapters, or side agreements on sustainable development, labour and environment. If there are concerns about lack of respect for the bilateral commitments of one of their partners, both the EU and Australia and/or New Zealand could benefit from discussing together how they could leverage their different agreements to secure positive change. This would certainly be more effective and efficient than each party working in parallel bilaterally. As indicated above, such cooperation is already envisaged in the EU’s FTA with Canada.
Co-operation in promoting responsible business conduct in key trading partners could also be envisaged. For example, the EU has indicated that it is also developing a EUR 9m project on responsible supply chains through its Partnership Instrument with the ILO and the OECD.119 The focus is on supply chains in its key Asian partners. As many of the target partners are members of CPTPP, or have FTAs with Australia and New Zealand, involving the latter in this type of promotional activity could create useful synergies.
117 For a full discussion on the importance of RoO to EU production structures see Curran, L. Nadvi, K and Campling, L. (forthcoming) 118 Uruta, S. (2013). Constructing and Multilateralizing the Regional Comprehensive Economic Partnership: An Asian Perspective. Tokyo: Asian Development Bank Institute. Helbe, M. (2017). Salvaging the Trans-Pacific Partnership: Building Blocks for Regional and Multilateral Trade Opening? Tokyo: Asian Development Bank Institute. 119 EC (2018)
Trade negotiations with Australia and New Zealand
51
7 Conclusions This report has highlighted the key potential opportunities, as well as issues of concern, for the EU from FTAs with Australia and New Zealand. These are rich, highly developed countries with similar systems of government and outlook to the EU. Overall, given their size, distance from Europe and relatively open tariff structures, the economic impacts on the EU will not be huge (an increase in GDP of between EUR 2,1bn-4,9bn), although there will be important sectoral benefits in terms of ensuring a level playing field with key competitors, while certain EU sectors are vulnerable to increased competition. The key sectors likely to benefit from increased trade in goods are motor vehicles, machinery, dairy products and chemicals. Sectors vulnerable to increased competition are mainly in agriculture – sheep and beef, dairy, fruit and vegetables. The EU will certainly make maximum use of TRQs and similar mechanisms for providing limited market access in such sectors. At the same time these FTAs would create new opportunities, as well as potential competition, in services trade, investment and public procurement, while securing increased protection of IPR, especially for certain GIs. In addition, given the pro-trade, broadly progressive agenda of both countries, the FTAs represent an opportunity to develop innovative provisions on TSD and more inclusive trade, which could potentially provide the blueprints for other future trade agreements.
Brexit will inevitably change the nature of the relationship between the EU and these two countries. Most notably the levels of trade and investment with the EU27 will be substantially lower than the EU28. Nevertheless, much of the previous analysis of the FTAs undertaken by the Commission and others, reported above, remains broadly valid in terms of the sectors most effected, although the magnitudes will obviously be smaller. In addition, the need to create a new hub for relations with the EU27 for many companies from these two partners will create new investment flows and business relationships.
Overall, as underlined in the last section, these agreements will be as important for the political signals that they send, as for their economic impacts. In a global context where many governments are questioning the benefits of trade, they provide the opportunity to demonstrate the benefits of trade liberalisation which is framed by clear rules and commitments to fairness. Against the backdrop of Brexit, they enable the EU to cement its future relations with important like-minded countries from the anglophone world. Of course, these political objectives shouldn’t obscure concern about certain potential negative consequences and negotiators will certainly need to remain vigilant. However, overall, these countries have the potential to be important allies in creating a more effective and inclusive system of global trade governance.
Policy Department, Directorate-General for External Policies
52
Bibliography Drake-Brockman, J. and Messerlin, P. (2018). Potential Benefits of an Australian-EU Free Trade Agreement. Adelaide: University of Adelaide Press. https://www.adelaide.edu.au/press/titles/eu-trade/
EC (2017a) Commission Staff Working Document Impact Assessment Accompanying the document Recommendation for a Council Decision authorizing the opening of negotiations for a Free Trade Agreement with Australia, SWD (2017) 293 final. https://ec.europa.eu/transparency/regdoc/rep/10102/2017/EN/SWD-2017-293-F1-EN-MAIN-PART-1.PDF
EC (2017b) Commission Staff Working Document Impact Assessment Accompanying the document Recommendation for a Council Decision authorizing the opening of negotiations for a Free Trade Agreement with New Zealand, SWD (2017) 289 final. https://ec.europa.eu/transparency/regdoc/rep/10102/2017/EN/ SWD-2017-290-F1-EN-MAIN-PART-1.PDF
EC (2017d). Non-paper of the Commission services Trade and Sustainable Development (TSD) Chapters in EU Free Trade Agreements (FTAs) http://trade.ec.europa.eu/doclib/docs/2017/july/tradoc_155686.pdf
EC (2018). Feedback and way forward on improving the implementation and enforcement of Trade and Sustainable Development chapters in EU Free Trade Agreements http://trade.ec.europa.eu/doclib/docs/2018/february/tradoc_156618.pdf
EP (2019). INTA Workshop on the FTA negotiations with Australia and New Zealand, European Parliament, Brussels, 29/01/19. http://www.europarl.europa.eu/ep-live/en/committees/video?event=20190129-1500-COMMITTEE-INTA
GA Research (2013). Proposal for an Australian-European Union Free Trade Agreement. Australian and European Stakeholder Preliminary Perceptions Research. http://www.eabc.com.au/wp-content/uploads/2013/11/Proposal-for-an-Australia-European-Union-FTA.pdf
Harrison, J. et al (forthcoming). Labour Standards Provisions in EU Free Trade Agreements: Reflections on the European Commission's Reform Agenda. World Trade Review, 1-23. doi:10.1017/S1474745618000204 http://wrap.warwick.ac.uk/102064/
Lee-Makiyama, H. (2015). New Zealand: The EU’s Asia-Pacific Partnership and the Case for a Next Generation FTA. Brussels: European Centre for International Political Economy. https://ecipe.org/publications/new-zealand-eus-fta/
LSE Enterprise (2017) Ex-ante study of the EU-Australia and EU-New Zealand trade and investment agreements - Final Report. https://publications.europa.eu/en/publication-detail/-/publication/50b71887-92b2-11e7-b92d-01aa75ed71a1/language-en;
Raess, D. Schmieg, E. and Voituriez, T. (2018). The future of sustainable development chapters in EU free trade agreements. EP Directorate General for External Policies. Policy Department. http://www.europarl.europa.eu/RegData/etudes/IDAN/2018/603877/EXPO_IDA(2018)603877_EN.pdf
'73 Articles of iron/steel 595,4 14,9 '84 Machinery 342,8 27,8
Source: ITC Trade Map
Table A10 - EU28 services trade with Australia by sector (average 2015-17) and UK share (%)
Exports (USD million) UK Share Imports (USD million) UK Share
Code All services 15915,1 38,0 Code All services 8794,8 46,6
4 Travel 7510,8 39,6 4 Travel 5598,9 40,7
3 Transport 2817,9 14,6 10 Other bus services 1085,5 55,5
10 Other bus services 1802,9 51,4 7 Financial Services 665 78,9
8 IPR 1445,7 20,6 9 Telecoms 534,3 57,4
Other services 747,9 54,3 3 Transport 505,1 38,6
9 Telecoms 690,7 37,9 Other services 234,1 48,5
7 Financial Services 527,9 80,5 8 IPR* 146,7 40,1
6 Insurance 371,3 92,8 6 Insurance 13,3 65,9
*Due to non-availability of UK import figures for IPR for 2017, figures for IPR are for 2014-6
Source: ITC Trade Map
121 Note that in the following tables, based on EU trade declarations, the value of total goods trade differs from earlier tables based on Australian or New Zealand trade declarations. This is primarily because exports tend to be declared Free on Board (FOB) while imports are declared Cost Insurance Freight (CIF). In addition, goods exported in year N may be imported by the trade partner in year N+1. Given the distance between the EU and these two partners, these differences can have quite important impacts on total declared trade values.
Policy Department, Directorate-General for External Policies
62
Table A11 - EU28 trade with New Zealand - top 10 sectors (Average 2015-17) and UK share (%)
Exports (USD million) UK share
Imports (USD million) UK share
'TOTAL All products 5367,5 18,2 'TOTAL All products 4115,4 28,8