Paper to be presented at the 35th DRUID Celebration Conference 2013, Barcelona, Spain, June 17-19 TRADEMARKING VERSUS PATENTING: THE EFFECTS OF MARKET STRUCTURE, CUSTOMER TYPE AND VENTURE CAPITAL FINANCING Enrico Pennings Erasmus University Rotterdam Applied Economics [email protected]Joern Block University of Trier [email protected]Geertjan De Vries Erasmus University Rotterdam [email protected]Abstract We analyze the initial IP rights of 4,703 start-up entrants in the US, distinguishing between trademark- and patent applications. Results show that start-ups are more likely to file a trademark instead of a patent when entering more competitive market structures. Further, we find that start-ups with a focus on distribution, serving end-consumers, are more prone to file a trademark, and that start-ups operating upstream, selling to other businesses are more likely to file for patents. Lastly, external influences on the start-up?s management, such as the involvement of a venture capitalist (VC), affect IP applications. The increased incentive of VC-backed start-ups to become operational on the market makes them more likely to file initial IP in the form of a trademark rather than a patent. Among other things, we control for the R&D- and advertising intensity in the industry, and distinguish between more technical- versus more service driven industries. Jelcodes:O34,L10
Transcript
Paper to be presented at the
35th DRUID Celebration Conference 2013, Barcelona, Spain, June 17-19
TRADEMARKING VERSUS PATENTING: THE EFFECTS OF MARKET
STRUCTURE, CUSTOMER TYPE AND VENTURE CAPITAL FINANCINGEnrico Pennings
AbstractWe analyze the initial IP rights of 4,703 start-up entrants in the US, distinguishing between trademark- and patentapplications. Results show that start-ups are more likely to file a trademark instead of a patent when entering morecompetitive market structures. Further, we find that start-ups with a focus on distribution, serving end-consumers, aremore prone to file a trademark, and that start-ups operating upstream, selling to other businesses are more likely to filefor patents. Lastly, external influences on the start-up?s management, such as the involvement of a venture capitalist(VC), affect IP applications. The increased incentive of VC-backed start-ups to become operational on the market makesthem more likely to file initial IP in the form of a trademark rather than a patent. Among other things, we control for theR&D- and advertising intensity in the industry, and distinguish between more technical- versus more service drivenindustries.
Jelcodes:O34,L10
1
TRADEMARKING VERSUS PATENTING: THE EFFECTS OF
MARKET STRUCTURE, CUSTOMER TYPE AND VENTURE
CAPITAL FINANCING
ABSTRACT
We analyze the initial IP rights of 4,703 start-up entrants in the US, distinguishing
between trademark- and patent applications. Results show that start-ups are more likely
to file a trademark instead of a patent when entering more competitive market
structures. Further, we find that start-ups with a focus on distribution, serving end-
consumers, are more prone to file a trademark, and that start-ups operating upstream,
selling to other businesses are more likely to file for patents. Lastly, external influences
on the start-up’s management, such as the involvement of a venture capitalist (VC),
affect IP applications. The increased incentive of VC-backed start-ups to become
operational on the market makes them more likely to file initial IP in the form of a
trademark rather than a patent. Among other things, we control for the R&D- and
advertising intensity in the industry, and distinguish between more technical- versus
Wortman, Spann, & Adams, 1989). When deciding to invest, a VC sets milestones that the
start-up needs to achieve in order to receive subsequent funding rounds. In early stages, such
milestones are likely to be directed towards market orientation, making the product more
consumer-friendly, and to localizing initial consumers that are willing to buy the product
(Berkery, 2008). Accordingly, the involvement of a VC investor is likely to shorten a start-
up’s time-to-market, and speeds up the professionalization of marketing activities compared
to non-VC funded start-ups (Hellman & Puri, 2000; 2002). VCs only have a limited time
period to turn a start-up in a functioning company that can either conduct an IPO, or that can
be sold to an industrial firm. The VC seeks to bring a product to the market as early as
possible. The filing of a trademark is likely to be one of the initial steps taken in the
commercialization process, securing the brand name of the start-up, and protecting a start-
up’s future marketing efforts (Sandner & Block, 2011). Hence, we derive the following
hypothesis:
Hypothesis 3. VC-backed start-ups are more likely to file initial IP in the form of a
trademark rather than in the form of a patent.
DATA AND VARIABLES
Data sources
13
We analyze the influence of market competition, the start-up’s customer type, and the
engagement of VC investors on a start-up’s type of initial IP application, distinguishing
between trademarks and patents. We used several data sources but restricted our data
searches to the Unites States. VC funded start-ups were taken from the VentureXpert
database of Thomson Reuters. Using the six-digit NAICS industry classification codes
available in VentureXpert, we merged R&D- and advertising intensity measures calculated
from COMPUSTAT, and competition intensity data accessed through the US Census Bureau.
In a next step, patent and trademark filing records were matched manually to the start-up’s
name and former aliases reported in VentureXpert.
Sample and NAICS data
From VentureXpert, we selected US-based start-ups that received VC funds in the period of
1998 to 2007, resulting in a sample of 11,808 start-ups. We focussed on start-ups with a valid
reported NAICS classification, foundation date, and amounts of VC funds received. We were
unable to take into account data beyond 2007 because of the lengthy process surrounding
patent applications and the successive granting of international patent protection. Patent
filings are kept secret for 18 months, after which it may take several more years to secure
international protection (Greenhalgh & Rogers, 2010).
We define the market niche in which a start-up is operating by the six-digit NAICS code
available in VentureXpert. For each NAICS classification we used the COMPUSTAT
database in order to calculate three year averages of R&D- and advertising intensity over our
sample period (1998-2007). COMPUSTAT data is commonly used in previous works to
calculate such measures (e.g., Chauvin & Hirschey, 1993; Waring, 1996). We were able to
determine R&D- and advertising intensity measures for the market niches of 11,582 start-ups.
Next, we obtained competition intensity data published by the US Census Bureau, which is
14
published every 5 years. Competition data provided by the US Census bureau is reliable, as
each firm in the US is required by law to respond to the US Census survey (see Ali, Klasa, &
Yeung, 2009 for a review).2 Competition intensity data was available for the market niches of
9,678 start-ups. Finally, we gathered US trademark- and patent data for this sample.
Trademark and patent data
IP searches were done via a manual process. Trademark applications were obtained from the
United States Patent and Trademark Office (USPTO) (see also Graham, Hancock, Marco,
Myers; 2013). US Patent applications were accessed through the PATSTAT database. The
extent of IP activities could be determined for 8,247 of the remaining start-ups (85.2%). A
start-up was excluded when its name or one of its former aliases did not give a unique search
result. Imperfect matches were verified via industry and location records available from
VentureXpert. We selected the start-ups that filed a first IP application in the period of 1998
to 2007, leading to a final sample of 4,703 start-ups, which are active in 333 separate NAICS
classes.
Variables
Our dependent variable is the binary variable trademark or patent, indicating whether a start-
up filed its first IP application in the form of a trademark (=1) or a patent (=0). We used the
application dates because they relate to the point in time at which the start-up made the
strategic decision to obtain a specific type of IP. The publication date is less suitable to
determine this point in time because the length of the application procedure may vary from
case to case, and is generally more complicated and lengthy for patents (WIPO, 2011).
2 US Census concentration measures are also used by the Federal Trade Commission when taking decisions on anti-trust cases.
15
Because our dependent variable is binary, we use logistic regression models. As our main
independent variables, we measure competition intensity by the C4 ratio, which is the sum of
the market share of the four largest firms that are active within a particular NAICS class.3
The C4 ratio is widely accepted as a measure of competition intensity (e.g., Domowitz,
Hubbard, & Peterson, 1986; Harris, 1998). As noted above, competition data is published
every 5 years by the US Census Bureau. Accordingly, we use the C4 ratio published in 1997
for the start-ups in our sample that applied for initial IP up until 2002. We use the C4 ratio
published in 2002 for start-ups that filed initial IP up until 2007. Further, we measure the
effect of a VC investor on start-up IP strategy with the VC dummy variable, indicating
whether the start-up has received any VC funds up until the point in time of its first IP
application. The start-up’s customer type is captured by the Business to consumer dummy,
indicating whether the start-up is serving consumers (=1) or other businesses (=0).
Information on the start-up’s customer type was reported in VentureXpert at the time of
receiving VC funding. Of the 1,895 VC-backed start-ups in our sample, 1,438 start-ups were
defined as serving either consumers or other businesses. Our hypothesis addressing the
relation between the start-up’s customer type and its initial IP application will therefore be
analyzed via this subsample. In order to capture other factors that may influence the initial IP
application of a start-up we use the following control variables.
We control for the average R&D intensity and the average advertising intensity,
calculated for each individual market niche in COMPUSTAT. We calculated the average
R&D- and advertising intensity within the market niche over the 3 years prior to the start-ups
initial IP application. Start-ups operating in research intensive market niches are more likely
3 The Herfindahl index was also available from the US Census Bureau, but is only published for manufacturing sectors. We used the four-firm-ratio because it was available for a broader range of industries. The correlation between the Herfindahl index and the four-firm-ratio was 0.93. Also, previous works suggest that there are no substantial differences between the two measures (e.g. Scott, 1993).
16
to file patent applications (Griliches, 1984; 1998). Similarly, a higher advertising intensity
within a market niche may be related to a more trademark orientated IP strategy (Malmberg,
2005; Mendonça et al., 2004).
Further, we calculated start-up age in years at the point in time of a start-up’s first IP
application. To control for time trends in trademark or patent applications, we use 10
application year dummies indicating the year in which the start-up applied for first IP. Time
related shifts in environmental, management, or legal conditions may affect IP applications
(Kortum & Lerner, 1999). We distinguish between six industry dummies, categorized by
VentureXpert, which are “biotechnology”, “communications and media”, “computer related”,
“medical/health/life science”, “non-high-technology”, and “semiconductors/other
electronics”. IP protection regimes may vary across different industry types (Dushnitsky &
Shaver, 2009). Lastly, possible regional influences are controlled for by 17 US region
dummies. The type and degree of regional technology orientation (e.g., Silicon Valley, New
England) may affect IP behavior (Audretsch & Feldman, 1996).
RESULTS
Descriptive results
Table 1 shows descriptive statistics across industries. As can be expected, patents are more
likely to be filed as a first IP right within technology based industries such as the biotech-,
semiconductors-, and medical/life science industries. Having a trademark as a first IP right is
more likely in non-high-tech-, communications-, and computer related industries.4
Concerning the start-ups customer type, we see that start-ups are most likely to sell to
consumers in the Medical/ life science industry (37.8%) and in the non-high tech industry
(35.1%). Start-ups supply to other businesses most frequently in the Semiconductors industry
4 Computer related start-ups were mainly engaged in computer software, services, and internet related activities.
17
(98.4%). This seems in line with the suggestion that start-ups serving other businesses are
more likely to operate under the technical- or product differentiation strategy. Further,
average R&D intensity (NAICS based) is highest for markets related to biotech (on average
44.2% of sales), where advertising intensity is highest in computer related- and
semiconductor industries (on average 1.6% of sales). Lastly, the C4 ratio reveals that
competition is least intensive in more technical, patent driven markets such as
semiconductors (C4 of 50.2%) and biotech (C4 of 41.3%). This is in line with previous works
that underscore the role of patents as powerful exclusion rights (Besanko et al., 2010;
Greenhalgh & Rogers, 2010).
Table 2 presents the descriptive statistics for our full sample. Of the start-ups in our
sample, 61% filed for a trademark first instead of a patent. This can be explained by the
slightly broader applicability of a trademark, being potentially relevant in both technology-
and service related markets, whereas patents are especially relevant in technology based
markets (Greenhalgh & Rogers, 2006a). Further, we see that different types of competition
intensity are represented in our sample. The average C4 ratio of the market niches entered is
36.4% (median 34.9%). Interestingly, the most competitive market niche is dental services
with a C4 ratio of 0.7% (NAICS classification = 621210). In contrast, the least competitive
market niche is the manufacturing of space vehicles with a C4 ratio of 91.6% (NAICS
classification = 336414). With regard to VC financing, we observe that 40% of the start-ups
in our sample had received VC funding before applying for their first IP right. Further, the
market niches show on average a higher R&D (14.2% of sales) than advertising intensity
(1.4% of sales). Both measures are right-skewed (e.g., maximum of R&D intensity =
2,456.7%, mean = 14.2%). In the additional analysis section, we correct for this by taking
only NAICS sectors into account for which we have R&D and advertising intensity
information of at least 5 firms (this resulted in a mean R&D intensity of 11.5%, and a
18
maximum value of 38.9%). Lastly, the average start-up’s age when applying for a first IP
right was 2.3 years. We use the logarithm of start-up age in our regression analysis.
Table 3 shows the correlations and variance inflation factors (VIFs). The reported
correlations are in line with our hypothesized effects. The VIFs in our regressions models are
well below the critical level of 10, indicating that multicollinearity is not a problem in our
models (see also Neter, Wasserman & Kutner, 1985; Hair, Black, Babin, Anderson, &
Tatham, 2006).
--------------------------------------------- Insert Tables 1, 2 and 3 about here
---------------------------------------------
Multivariate results
Table 4 shows logistic regression results for our dependent variable trademark or patent.
Model 1 only includes our control variables, but still excludes the industry dummy variables.
Interestingly, log(start-up age) shows that relatively younger start-ups are more likely to file
for patents first. This seems intuitive as R&D and product development activities tend to take
place in an earlier stage as compared to marketing, which regards the commercialization of
an already sellable product. This effect is also in line with existing work showing that start-
ups tend to be overly focused on their invention rather than on market orientation within early
stages (Hisrisch, 1989; Wortman et al., 1989). In the subsequent models we test our
hypothesized effects. Model 2 includes the C4 ratio, which is close to being significant at the
5% level with a p-value of 0.053 (two-sided test). Its coefficient indicates that an increase in
competition is likely to lead to a higher likelihood of filing the first IP right in the form of a
trademark rather than a patent. More specifically, a decrease in the C4 ratio of 1% is likely to
lead to a 1.2% increase in the likelihood of filing a trademark first. Further, Model 2 shows a
19
negative and significant coefficient for R&D intensity, indicating a positive effect of this
variable on filing for a patent. The effect of advertising intensity is positively significant at
the 10% significance level, indicating a positive effect of this variable on filing for a
trademark. In Model 3, we introduce the VC dummy variable, of which the coefficient shows
that VC-backed start-ups are more likely to file their first IP right in the form of a trademark
rather than a patent (p<0.01). This provides support for our third Hypothesis. Next, Model 4
includes both the VC dummy and the C4 ratio, revealing that the C4 ratio is significant at the
5% significance level when also controlling for the influence of VC investors on start-up
management. This provides support for our first Hypothesis. Finally, Model 5 checks the
robustness of our results when introducing the industry dummy variables. Because the
industry dummies capture variance in competition, the coefficient of the C4 ratio decreases,
and becomes significant at the 10% level. The VC dummy variable remains highly significant.
Table 5 presents results with regard to a start-up’s customer type (Hypothesis 2). We
analyze the subsample of 1,438 VC-backed start-ups for which we have customer type
information. Model 1 is a baseline model, also including the C4 ratio (p<0.01), which is
again negative and significant. Model 2 includes the Business to consumer dummy. Its
positive coefficient indicates that start-ups selling to consumers are more likely to file initial
IP in the form of a trademark, where start-ups selling to other businesses are more likely to
file initial IP in the form of a patent. When including the industry dummy variables in Model
3, the business to consumer dummy remains significant (p<0.05). The C4 ratio, constructed
on a sector level, is no longer significant when including industry dummies. This is likely to
be related to the lowered statistical power by focusing on the VC-backed subsample.
------------------------------------------ Insert Tables 4 and 5 about here
------------------------------------------
20
Additional analyses and robustness checks
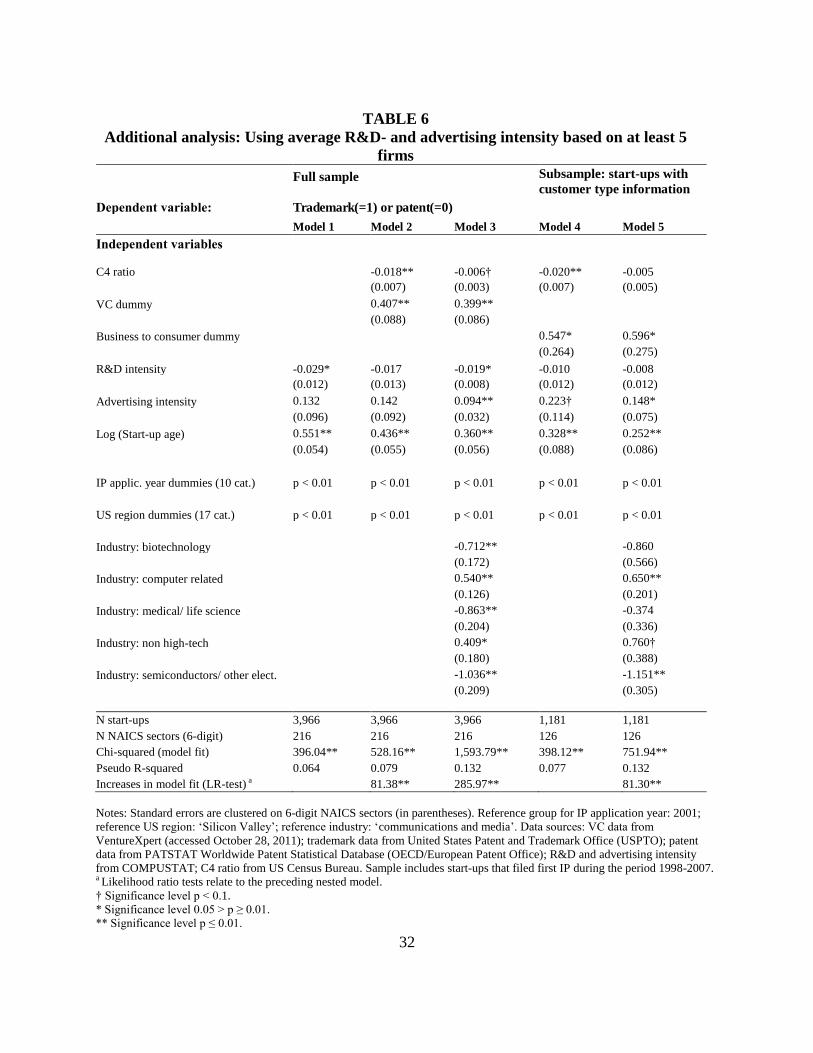
We conducted several additional analyses. A first robustness check is related to the R&D-
and advertising intensity measures, which are rightly-skewed. As noted, these measures are
calculated for each NAICS class based on COMPUSTAT data. For some sectors, however,
the COMPUSTAT data holds information for only a few individual firms. We corrected for
this by using only the average R&D- and advertising intensity measures which are based on
sectors holding at least 5 firms, reducing the volatility of these measures. This reduced our
sample to 3,966 start-ups active in 216 different NAICS classifications. The regression results
are presented in Table 6, showing a more intuitive coefficient for the R&D intensity (e.g. -
0.001 in Model 1, Table 4 versus -0.029, in Model 1, Table 6). Table 6 shows similar results
for our hypothesized effects.
As a second robustness check, we excluded the start-ups in our sample for which the
dates of the first patent- and trademark application were recorded within 6 months of each
other. Given that these start-ups applied for both types of IP within a short period of time,
there may be no clear preference for either a trademark or a patent. Further, by excluding
these start-ups we reduce the possibility that our dependent variable is incorrect due to errors
or delays in the recording of the application dates, or due to differences between the filing
systems of patents and trademarks. This step reduced our sample to 3,819 start-ups active in
319 NIACS sectors. The results of our hypothesized effects remain similar as compared to
the results from our main analysis. The only difference is that within this subsample, the C4
ratio is significant also on a 5% level when including the industry dummy variables.5
Thirdly, it could be that our results are driven by large numbers of start-ups being active
in the same NAICS class. Overall, our sample holds 4,703 start-ups that are active in 333
5 The result of this robustness check and subsequent regressions are available upon request.
21
separate NAICS classes. As the C4 ratio, and also R&D- and advertising intensity are
measured per NAICS category, the variance in our sample becomes limited when many start-
ups are active within the same NAICS classes. The distribution of start-ups over NAICS
classes is highly skewed (1,267 start-ups were active in the most prominent NAICS class,
followed by 441 start-ups in the second most prominent NAICS class). We checked for the
impact of the sector distribution by excluding the NAICS classes that held more than 50 start-
ups. We found similar results with regard to our hypothesized effects. Shifting the cut-off
point regarding the number of start-ups per NIACS class further down, for example excluding
NAICS classes with more than 25 start-ups, also led to similar results.
Finally, the VentureXpert database, reporting VC investments, contains additional
information on the start-ups in our sample which may be relevant to control for. We
conducted a subsample analysis, considering only the start-ups that have received VC funds
when applying for their first IP right.6 For these start-ups, we are able to control for more
information that we gathered from the reported funding round in VentureXpert. VCs
categorize a start-up as being in a specific stage, differentiating whether a start-up is still
working on its first proto-type, or if it is already in a later stage, working on initial sales,
expanding its market share, or ultimately, looking for an exit. Furthermore, we are able to
control for the funding stage (round number), the amount of VC funds received, the number
of investors involved, the VCs’ experience and maturity levels, and the different types of VC
investors (VC firms, business angel, corporate investor, financial institution, governmental
investors). Each specific VC actor type operates under a different set of incentives, and may
therefore influence the start-up’s management in a different manner (Dushnitsky & Shapira,
2010; Sorenson & Stuart, 2008). Controlling for these additional factors, we find similar
6 40 percent of the start-ups received VC funds before their first IP application.
22
effects for the C4 ratio (ß = –0.016, p<0.01) and the Business to consumer dummy (ß = 0.650,
p<0.01).
----------------------------------------- Insert Table 6 about here
-----------------------------------------
DISCUSSION
Our work is the first to analyze determinants of IP orientation distinguishing between patent
and trademarks applications. We examine the initial IP direction (a trademark, or a patent) of
4,743 start-up entrants in the US between 1998 and 2007. Our findings contribute to several
literature streams.
Firstly, we extend the literature on market structure and IP rights. Previous studies have
focused mainly on the relations between market structure and patenting (e.g. Arora, 1997;
& Gupta, 2003), and its probability of surviving (Manigart, Baeyens, & Van Hyfte, 2002).
Our findings add to this that VCs are likely to influence the IP management of start-ups,
increasing the likelihood of filing initial IP in the form of a trademark rather than a patent.
LIMITATIONS AND FURTHER RESEARCH
Although we provide novel contributions, our paper contains a number of limitations leading
to several suggestions for future research. First, our analysis only considers the very first IP
application filed by start-up firms. Though early stage entrants have the advantage of not
being likely to influence market structure (as measured by the C4 concentration index), we
have to be careful in drawing conclusions regarding the IP strategies of later stage, more
mature companies. Future research could analyze interactions of IP strategies and market
structure over time, taking into account the causality issues discussed in the patent-market
structure literature (Cohen & Levin, 1989). Second, our dataset containing information on
market dynamics and start-up firm level characteristics had to be constructed from several
data sources. With regard to the IP data, the matching process relied on the manual creation
of company name patterns used to extract information on trademark and patent filings. This
method proved to be highly reliable and was individually checked with the records in the
USPTO trademark register. Still, we cannot completely rule out possible mismatches or the
failure to include relevant IP applications in our dataset (IP data could be identified for 85.3%
of the start-ups taken from VentureXpert). Third, we have only limited information with
regard to the background of the entrepreneurs involved in the start-up. For example, venture
25
founding teams with a more technical background might be more focused on patenting in
early stages, where founders with more previous experience in the marketing field may be
more likely to recognize the relevance of trademarks (see also Munari & Toschi, 2010;
Wright, Lockett, Clarysse, & Binks, 2006). As our work employs solely publicly available
data sources, survey-based data could help us understand IP decisions more thoroughly at the
firm-level.
As we expect that trademarks play a relevant, potentially powerful role especially in
combination with patents in the protection of innovative assets, we encourage future work to
help us understand IP strategies at a portfolio level, and into later company stages.
CONCLUSIONS
Analyzing the initial trademark- and patent applications of 4,703 start-up entrants, we find
that market structure, the start-up’s customer type, and the involvement of a VC investor have
a significant influence on the start-ups initial IP direction. Our findings show that as market
competition intensifies, entering start-ups will be more likely to file initial IP in the form of a
trademark and less likely in the form of a patent. Our results further show that trademarks are
of a greater priority for start-ups that serve end-consumers, as compared to patents, which are
more likely to be filed by start-ups operating more upstream. Lastly, we find that the
ambition of VC investors to bring a start-up’s product to the market leads to a greater
likelihood of filing initial IP in the form of a trademark.
26
REFERENCES
Abernathy WJ, Clark KB. 1984. Innovation: mapping the winds of creative destruction. Research Policy 14 (1): 3-22.
Abimbola T. 2001. Branding as a competitive strategy for demand management in SMEs. Journal of Research in Marketing & Entrepreneurship 3 (2): 97-106.
Acs ZJ, Audretsch DB. 1987. Innovation, market structure, and firm size. The review of Economics and Statistics 69 (4): 567-574.
Ali A, Klasa S, Yeung E. 2009. The limitations of industry concentration measures constructed with compustat data: implications for finance research. Review of Financial Studies 22 (10): 3839-3871.
Amara N, Landry R, Traoré N. 2008. Managing the protection of innovations in knowledge-intensive business services. Research Policy 37 (9): 1530-1547.
Arora A. 1997. Patents, licensing, and market structure in the chemical industry. Research Policy 26 (4-5): 391-403.
Arrow K. 1962. Economic welfare and the allocation of resources for invention. In: Nelson, R. (Eds.), The Rate and Direction of Inventive Activity. Princeton University Press, Princeton.
Audretsch DB, Feldmann MP. 1996. R&D spillovers and the geography of innovation and production. The American Economic Review 86 (3): 630-640.
Audretsch DB, Bönte W, Mahagaonkar P. 2012. Financial signaling by innovative nascent ventures: the relevance of patents and prototypes. Research Policy 41 (8): 1407-1421.
Baum JAC, Silverman BS. 2004. Picking winners or building them? Alliance, intellectual, and human capital as selection criteria in venture financing and performance of biotech start-ups. Journal of Business Venturing 19 (3): 411-436.
Beamon BM. 1998. Supply chain design and analysis: models and methods. International Journal of Production Economics 55 (3): 281-294.
Berkery D. 2008. Raising venture capital for the serious entrepreneur. McGraw-Hill, New York.
Besanko D, Dranove D, Shanley M, Schaefer S. 2010. Economics of Strategy. Wiley: New York.
Block JH, De Vries AGB, Schumann J, Sandner PG. 2012. Trademarks and early-stage venture capital valuation. Working paper. Available at: http://papers.ssrn.com/sol3/papers.cfm?abstract_id=2064508
Carter NM, Stearns TM, Reynolds PD, Miller BA. 1994. New venture strategies: theory development with an empirical base. Strategic Management Journal 15 (1): 21-41.
Caves RE, Porter ME. 1977. From entry barriers to mobility barriers: conjectural decisions and contrived deterrence to new competition. The Quarterly Journal of Economics 91 (2): 241-262.
Cao J, Hsu PH. 2011. The informational role of patents in venture capital financing. Working paper. Available at: http://papers.ssrn.com/sol3/papers.cfm?abstract_id=1678809.
Chaganti R, Chaganti R, Mahajan V. 1989. Profitable small business strategies under different types of competition. Entrepreneurship Theory and Practice 13 (3), 21-35.
Chauvin KW, Hirschey M. 1993. Advertising, R&D expenditures and the market value of the firm. Financial Management 22 (4): 128-140.
Christensen CM, Bower JL. 1996. Customer power, strategic investment, and the failure of leading firms. Strategic Management Journal 17 (3): 197-218.
Cohen WM, Levin RC. 1989. Empirical studies of innovation and market structure. In: Schmalensee R., Willig RD. (eds), Handbook of Industrial Organization. Elsevier.
Davies LN. 2009. Leveraging trademarks to capture innovation returns. Working paper. Available at: http://www2.druid.dk/conferences/viewpaper.php?id=5655&cf=32
Davila A, Foster G, Gupta M. 2003. Venture capital financing and the growth of startup firms. Journal of Business Venturing 18 (6): 689-708.
DeYong R, Örs E. 2004. Advertising and pricing at multiple-output firms: evidence from US thrift institutions. Working paper. Federal Reserve Bank of Chicago.
Domowitz I, Hubbard RG, Peterson BC. 1986. Business cycles and the relationship between concentration and price-cost margins. The RAND Journal of Economics 17 (1): 1-17.
Dushnitsky G, Shapira Z. 2010. Entrepreneurial finance meets organizational reality: comparing investment practices and performance of corporate and independent venture capitalists. Strategic Management Journal 31 (9): 990-1017.
Dushnitsky G, Shaver JM. 2009. Limitations to interorganizational knowledge acquisition: the paradox of corporate venture capital. Strategic Management Journal 30 (10): 1045-1064.
Economides N. 1988. The economics of trademarks. Trademark Reporter 78: 523-539.
Engel D, Keilbach M. 2007. Firm-level implications of early stage venture capital investment – An empirical investigation. Journal of Empirical Finance 14 (2): 150-167.
Fitza M, Matusik SF, Mosakowski E. 2009. Do VCs matter? The importance of owners on performance variance in start-up firms. Strategic Management Journal 30 (4): 387-404.
Flikkema MJ, De Man AP, Wolters M. 2010. New trademark registration as an indicator of innovation: results of an explorative study of Benelux trademark data. Working paper, available at: ftp://zappa.ubvu.vu.nl/20100009.pdf
Gompers PA, Lerner J. 2004. The venture capital cycle. Cambridge, MA: MIT Press.
Graham SJH, Hancock G, Marco AC, Myers AF. 2013. The USPTO trademark case files dataset: descriptions, lessons, and insights. Working paper, available at: http://papers.ssrn.com/sol3/papers.cfm?abstract_id=2188621
Graham S, Somaya D. 2004. Complementary uses of patents, copyrights and trademarks by software firms: evidence from litigation. Working paper, available at: http://zinc.zew.de/pub/zew-docs/div/IKT04/Paper_Graham.pdf
Greenhalgh C, Rogers M. 2006a. The value of innovation: the interaction of competition, R&D and IP. Research Policy 35 (4): 562-580.
Greenhalgh C, Rogers M. 2006b. Trade marks and market value in UK firms. Melbourne Institute Working Paper Series. Available at: http://economics.ouls.ox.ac.uk/13545/1/Item.pdf.
Greenhalgh C, Rogers M. 2007. Trade marks and performance in UK firms: evidence of Schumpeterian competition through innovation. Discussion Paper. Department of Economics, University of Oxford. Available at: http://economics.ouls.ox.ac.uk/13545/1/Item.pdf.
Greenhalgh C, Rogers M. 2010. Innovation, intellectual property, and economic growth. Princeton University Press.
Griliches Z. 1984. R&D, patents and productivity. Chicago: University of Chicago Press.
Griliches Z. 1998. R&D and productivity: the econometric evidence. Chicago: University of Chicago Press.
Haeussler C, Harhoff D, Muller E. 2009. To be financed or not: the role of patents for venture capital financing. Working paper. Available at: http://epub.ub.uni-muenchen.de/8970/1/Haeussler_et_al_VCPat_Jan2009LMU_WP_Reihe.pdf
Hair J, Black WC, Babin B, Anderson RE, Tatham RL. 2006. Multivariate data analysis (6th ed.). Prentice Hall. Englewood Cliffs.
Harris MS. 1998. The association between competition and managers’ business segment reporting decisions. Journal of Accounting Research 36 (1): 111-128.
Harland, C.M. 1996. Supply chain management: relationships, chains and networks. British Journal of Management 7, Special Issue, S63-S83.
Hellman T, Puri M. 2000. The interaction between product market and financing strategy: the role of venture capital. Review of Financial Studies 13 (4): 959-984.
Hellman T, Puri M. 2002. Venture capital and the professionalization of start-up firms: empirical evidence. The Journal of Finance 57 (1): 169-197.
Helmers C, Rogers M. 2010. Innovation and the survival of new firms in the UK. Review of Industrial Organization 36 (3), 227-248.
Henderson R. 1993. Underinvestment and incompetence as response to radical innovation: evidence from the photolithographic alignment equipment industry. The RAND Journal of Economics 24 (2): 248-270.
Hill CWL, Rothaermel FT. 2003. The performance of incumbent firms in the face of radical technological innovation. Academy of Management Review 28 (2): 257-274.
Hills GE. 1984. Market analysis and marketing in new ventures: venture capitalists’ perceptions. Frontiers of Entrepreneurship Research: 167-182.
Hills GE, Hultman CM, Miles MP. 2008. The evolution and development of entrepreneurial marketing. Journal of Small Business Management 46 (1): 99-112.
Hisrich RD. 1989. Marketing and entrepreneurship research interface, in: Hills G, LaForge RW, Parker BJ. (eds), Research at the marketing/ entrepreneurship interface: 3-17. Chicago, University of Illinois.
Hsu DH, Ziedonis RH. 2007. Patents as quality signals for entrepreneurial ventures. Working paper. Available at: http://www2.druid.dk/conferences/viewpaper.php?id=1717&cf=9.
Kong Y, Seldon JR. 2004. Pseudo-generic products and barriers to entry in pharmaceutical markets. Review of Industrial Organization 25 (1): 71-86.
Kortum S. 1993. Equilibrium R&D and the patent – R&D ratio: US evidence. The American Economic Review 83 (2): 450-457.
Kortum S, Lerner J. 1999. What is behind the recent surge in patenting? Research Policy 28 (1): 1-22.
Lambert DE. 2004. Supply chain management: processes, partnerships, performance. Sarasota, FL: Supply Chain Management Institute.
Lerner J. 1994. The Importance of Patent Scope: An Empirical Analysis. The Rand Journal of Economics 25 (2): 319-333.
Levin RC, Cohen WM, Mowery DC. 1985. R&D appropriability, opportunity, and market structure: new evidence on some Schumpeterian hypotheses. The American Economic Review 75 (2): 20-24.
Li H. 2001. How does new venture strategy matter in the environment – performance relationship? Journal of High Technology Management Research 12 (2): 183-204.
Loury GC. 1979. Market structure and innovation. The Quarterly Journal of Economics 93 (3): 395-410.
Malerba F, Orsenigo L. 2002. Innovation and market structure in the dynamics of the pharmaceutical industry and biotechnology: towards a history-friendly model. Industrial and Corporate Change 11 (4): 667-703.
Malmberg C. 2005. Trademark statistics as innovation indicator – a micro study. Working paper No 2005/17, Centre for innovation, Research and Competence in the Learning
Economy. Available at: http://www.circle.lu.se/upload/CIRCLE/workingpapers/200517_Malmberg.pdf.
Manigart S, Baeyens K, Van Hyfte W. 2002. The survival of venture capital backed companies. Venture Capital – An International Journal of Entrepreneurial Finance 4 (2): 103-124.
Mann RJ, Sager TW. 2007. Patents, venture capital, and software start-ups. Research Policy 36 (2): 193-208.
McAfee RP, Mialon HM, Williams MA. 2004. What is a barrier to entry? The American Economic Review 94 (2): 461-465.
McGee JE, Dowling MJ, Megginson WL. 1995. Cooperative Strategy and new venture performance: the role of business strategy and management experience. Strategic Management Journal 16 (7), 565-580.
Mendonça S, Pereira TS, Godinho MM. 2004. Trademarks as an indicator of innovation and industrial change. Research Policy 33 (9): 1385-1404.
Miles R, Snow C. 1978. Organizational strategy, structure, and process. New York: McGraw-Hill.
Miller D. 1986. Configurations of strategy and structure: towards a synthesis. Strategic Management Journal 7 (3): 233-249.
Miller D. 1991. Generalists and specialists: two business strategies and their contexts. In Shrivastava P, Huff A, Dutton J. (eds), Advances in Strategic Management. JAI Press, Greenwich, CT, 7, 3-41.
Munari F, Toschi L. 2011. Do venture capitalists have a bias against investment in academic spin-offs? Evidence from the micro- and nanotechnology sector in the UK. Industrial and Corporate Change 20 (2): 397-432.
Neter J, Wasserman W, Kutner MH. 1985. Applied linear statistical models: regression analysis of variance, and experimental design. Richard Irwin, Inc., Homewood, IL.
Onkvisit S, Shaw JJ. 1989. Service marketing: image, branding, and competition. Business Horizons 32 (I): 13-18.
Porter ME. 1980. Competitive strategy – techniques for analyzing industries and competitors. Free Press, New York.
Ramello GB. 2006. What’s in a sign? Trademark law and economic theory. Journal of Economic Surveys 20 (4): 547-565.
Ramello GB, Silva F. 2006. Appropriating the signs and meaning: the elusive economics of trademark. Industrial and Corporate Change 15 (6): 937-963.
Sahlman WA. 1990. The structure and governance of venture capital organizations. Journal of Financial Economics 27 (2): 473-521.
Sandner PG, Block JH. 2011. The market value of R&D, patents and trademarks. Research Policy 40 (7): 969-985.
Schefczyk M, Gerpott TJ. 2001. Management support for portfolio companies of venture capital firms: an empirical study of german venture capital investments. British Journal of Management 12 (3): 201-216.
Scherer FM. 1984. Innovation and growth. Schumpeterian perspectives. Cambridge MIT Press, MA.
Schmalensee R. 1978. Entry deterrence in the ready-to-eat breakfast cereal industry. Bell Journal of Economics 9 (Autumn): 305-327.
Scott J. 1993. Purposive diversification and economic performance. Cambridge University Press, Cambridge, UK.
Schrader R, Siegel DS. 2007. Assessing the relation between human capital and firm performance: evidence from technology-based new ventures. Entrepreneurship Theory and Practice 31 (6): 893-908.
Schumpeter JA. 1950. Capitalism, Socialism, and Democracy. New York: Harper & Row.
Sorenson O, Stuart TE. 2008. Bringing the context back in: settings and the search for syndicate partners in venture capital investment networks. Administrative Science Quarterly 53 (2): 266-294.
Sutton J. 2007. Sunk Costs and Market Structure. Cambridge MIT Press, MA.
Tan TC. 2001. A framework of supply chain management literature. European Journal of Purchasing & Supply Management 7 (1): 39-48.
Teece DJ. 1986. Profiting from technological innovation: implications for integration, collaboration, licensing, and public policy. Research Policy 15 (6): 285-305.
Wagner S, Cockburn I. 2010. Patents and the survival of internet-related IPOs. Research Policy 39 (2), 214-228.
Waring GF. 1996. Industry differences in the persistence of firm-specific returns. The American Economic Review 86 (5), 1253-1265.
WIPO. 2004. WIPO intellectual property handbook: policy, law and use. Available at: http://www.wipo.int/about-ip/en/iprm/
WIPO. 2011. Intellectual property – some basic definitions. Available at: http://www.wipo.int/about-ip/en/studies/publications/ip_definitions.htm.
Wortman MS, Spann MS, Adams M. 1989. The interface of entrepreneurship and marketing: concepts and research perspectives, in: Hills G, LaForge RW, Parker BJ. (eds), Research at the marketing/ entrepreneurship interface: 117-137. Chicago, University of Illinois.
patent: 69.1 Business: 98.4 Notes: N = 4,703 start-ups (Customer type is based on 1,438 start-ups). Data sources: VC data from VentureXpert (accessed October 28, 2011); trademark data from United States Patent and Trademark Office (USPTO); patent data from PATSTAT Worldwide Patent Statistical Database (OECD/European Patent Office); R&D and advertising intensity from COMPUSTAT; C4 ratio from US Census Bureau. Sample includes start-ups that filed first IP during the period 1998-2007.
TABLE 2 Descriptive statistics
Variables Mean S.D. Median Min. Max. Skewness
Trademark or patent 0.61 1 0 1
C4 ratio 36.4 18.0 34.9 0.7 91.6 0.3
VC dummy 0.40 0 0 1
Business to consumer dummy 17.0 0 0 1
R&D intensity 14.2 73.0 11.7 0 2,456.7 25.3
Advertising intensity 1.4 1.7 1.2 0 32.4 4.6
Start-up age (in years) 2.3 4.8 1.0 0 86.1 6.8 Notes: N = 4,703 start-ups (Business to consumer dummy regards 1,438 start-ups). Data sources: VC data from VentureXpert (accessed October 28, 2011); trademark data from United States Patent and Trademark Office (USPTO); patent data from PATSTAT Worldwide Patent Statistical Database (OECD/European Patent Office); R&D and advertising intensity from COMPUSTAT; C4 ratio from US Census Bureau. Sample includes start-ups that filed first IP during the period 1998-2007.
29
TABLE 3 Correlations
Variables 1 2 3 4 5 6 7 8 9 10 11 12 VIFs a
1. Trademark or patent
2. C4 ratio -0.094* 1.14
3. VC dummy 0.133* 0.024 1.20
4. Business to consumer dummy 0.049* -0.104* -0.072* 1.17
13. Industry: semicond/ other elect. -0.198* 0.248* -0.014 -0.142* -0.009 0.037 -0.073* -0.085* -0.131* -0.311* -0.117* -0.110* 1.59 Notes: N = 4,703 start-ups (Business to consumer dummy regards 1,438 start-ups). Data sources: VC data from VentureXpert (accessed October 28, 2011); trademark data from United States Patent and Trademark Office (USPTO); patent data from PATSTAT Worldwide Patent Statistical Database (OECD/European Patent Office); R&D and advertising intensity from COMPUSTAT; C4 ratio from US Census Bureau. Sample includes start-ups that filed first IP during the period 1998-2007. * Significance level p ≤ 0.01 a VIFs relate to Model 5, Table 4; VIF of Business to consumer dummy is reported from Model 3, Table 5.
30
TABLE 4 The effect of market structure and VC funding on start-up’s initial IP (Hypothesis
1 and 3)
Dependent variable: Trademark(=1) or patent(=0) Model 1 Model 2 Model 3 Model 4 Model 5
Independent variables
C4 ratio -0.012† -0.012* -0.005† (0.006) (0.006) (0.003)
IP applic. year dummies (10 cat.) p < 0.01 p < 0.01 p < 0.01 p < 0.01 p < 0.01 US region dummies (17 cat.) p < 0.01 p < 0.01 p < 0.01 p < 0.01 p < 0.01
Industry: biotechnology -0.982** (0.159) Industry: computer related 0.481** (0.130) Industry: medical/ life science -0.887** (0.214) Industry: non high-tech 0.439** (0.160) Industry: semiconductors/ other elect. -1.110** (0.174)
Increases in model fit (LR-test) a 44.22** 30.33** 46.98** 365.83** Notes: Standard errors are clustered on 6-digit NAICS sectors (in parentheses). Reference group for IP application year: 2001; reference US region: ‘Silicon Valley’; reference industry: ‘communications and media’. Data sources: VC data from VentureXpert (accessed October 28, 2011); trademark data from United States Patent and Trademark Office (USPTO); patent data from PATSTAT Worldwide Patent Statistical Database (OECD/European Patent Office); R&D and advertising intensity from COMPUSTAT; C4 ratio from US Census Bureau. Sample includes start-ups that filed first IP during the period 1998-2007. a Likelihood ratio tests relate to the preceding nested model. † Significance level p < 0.1. * Significance level 0.05 > p ≥ 0.01. ** Si gnificance level p ≤ 0.01. Two-sided tests are used.
31
TABLE 5 Subsample analysis: Effect of customer type on start-up’s initial
IP (Hypothesis 2)
Dependent variable: Trademark(=1) or patent(=0) Model 1 Model 2 Model 3
Independent variables
C4 ratio -0.015** -0.014* -0.004 (0.006) (0.006) (0.003)
Business to consumer dummy 0.579* 0.608* (0.247) (0.251)
IP applic. year dummies (10 cat.) p < 0.01 p < 0.01 p < 0.01 US region dummies (17 cat.) p < 0.01 p < 0.01 p < 0.01
Industry: biotechnology -1.068* (0.522) Industry: computer related 0.568** (0.189) Industry: medical/ life science -0.486 (0.334) Industry: non high-tech 0.576 (0.328) Industry: semiconductors/ other elect. -1.203** (0.294)
N start-ups 1,438 1,438 1,438 N NAICS sectors (6-digit) 174 174 174 Chi-squared (model fit) 269.06 275.11** 559.29** Pseudo R-squared 0.069 0.074 0.129 Increases in model fit (LR-test) a 9.00** 96.29** Notes: Standard errors are clustered on 6-digit NAICS sectors (in parentheses). Reference group for IP application year: 2001; reference US region: ‘Silicon Valley’; reference industry: ‘communications and media’. Data sources: VC data from VentureXpert (accessed October 28, 2011); trademark data from United States Patent and Trademark Office (USPTO); patent data from PATSTAT Worldwide Patent Statistical Database (OECD/European Patent Office); R&D and advertising intensity from COMPUSTAT; C4 ratio from US Census Bureau. Sample includes start-ups that filed first IP during the period 1998-2007. a Likelihood ratio tests relate to the preceding nested model. † Significance level p < 0.1. * Significance level 0.05 > p ≥ 0.01. ** Significance level p ≤ 0.01. Two-sided tests are used.
32
TABLE 6 Additional analysis: Using average R&D- and advertising intensity based on at least 5
firms
Dependent variable:
Full sample Trademark(=1) or patent(=0)
Subsample: start-ups with customer type information
Model 1 Model 2 Model 3 Model 4 Model 5
Independent variables
C4 ratio -0.018** -0.006† -0.020** -0.005 (0.007) (0.003) (0.007) (0.005)
IP applic. year dummies (10 cat.) p < 0.01 p < 0.01 p < 0.01 p < 0.01 p < 0.01 US region dummies (17 cat.) p < 0.01 p < 0.01 p < 0.01 p < 0.01 p < 0.01
Industry: biotechnology -0.712**
-0.860 (0.172)
(0.566)
Industry: computer related 0.540**
0.650** (0.126)
(0.201)
Industry: medical/ life science -0.863**
-0.374 (0.204)
(0.336)
Industry: non high-tech 0.409*
0.760† (0.180)
(0.388)
Industry: semiconductors/ other elect. -1.036**
-1.151** (0.209)
(0.305)
N start-ups 3,966 3,966 3,966 1,181 1,181 N NAICS sectors (6-digit) 216 216 216 126 126 Chi-squared (model fit) 396.04** 528.16** 1,593.79** 398.12** 751.94** Pseudo R-squared 0.064 0.079 0.132 0.077 0.132 Increases in model fit (LR-test) a 81.38** 285.97** 81.30** Notes: Standard errors are clustered on 6-digit NAICS sectors (in parentheses). Reference group for IP application year: 2001; reference US region: ‘Silicon Valley’; reference industry: ‘communications and media’. Data sources: VC data from VentureXpert (accessed October 28, 2011); trademark data from United States Patent and Trademark Office (USPTO); patent data from PATSTAT Worldwide Patent Statistical Database (OECD/European Patent Office); R&D and advertising intensity from COMPUSTAT; C4 ratio from US Census Bureau. Sample includes start-ups that filed first IP during the period 1998-2007. a Likelihood ratio tests relate to the preceding nested model. † Significance level p < 0.1. * Significance level 0.05 > p ≥ 0.01. ** Significance level p ≤ 0.01.