34
TRADING PAST THE MARKET NOISE

TRADING PAST THE MARKET NOISE
One of the biggest issues facing investors in the financial markets is the problem of market ''noise'' or what is commonly called
"market chop". When is a ''buy signal'' a ''trend move'', or a good swing trade move,
and when is it just market "white noise" as defined by market statisticians?
Understanding the "white noise" was first put forward by Louis Jean-Baptiste Alphonse Bachelier 1870 -1946.
He was a French mathematician at the turn of the 20th century.
He is credited with being the first person to model Brownian Motion, “white noise", which was part of his
PhD thesis The Theory of Speculation, (published 1900).
.

Bachelier's pioneering analysis of the markets contained several ideas of enormous value in both finance and probability.
In particular, the theory of Brownian motion, one of the most important mathematical discoveries
of the twentieth century, was initiated and used for the mathematical modeling of price movements
and the evaluation of contingent claims in financial markets.
Benoit Mandelbrot believes that the modern theory of finance relies on five men: Louis Bachelier, Harry Markowitz, William Sharpe,
and Fisher Black and Myron Scholes. According to Mandelbrot, the foundations of the Capital Asset Pricing Model,
Modern Portfolio Theory and Black-Scholes all sit on the theoretical foundation
laid by Bachelier a century ago".
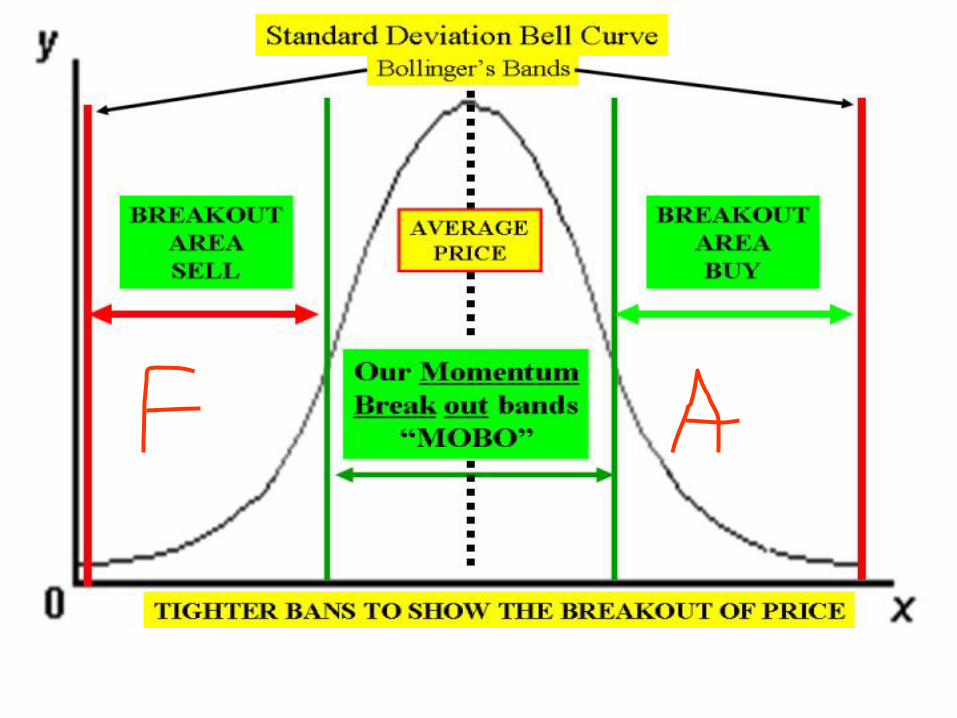
"Random noise" is what defined the normal behavior of markets. The move outside the zone of random noise is what is identified as
trend moves and sometimes large market spikes.

In the Firstwave club we have understood and identified this "white noise" issue by employing a ‘standard deviation band’ of
10 days and .8 standard deviations. Our buy and sell signals occur
when the prices move outside the predicted standard deviation noise level bands.
We have called these ''''noise'''' bands MOBO, for "momentum breakout bands" for price.
Since the markets have been identified as fractal we can use these settings on any time frame, tick chart, or volume setting.
Positive statistical results of this method were published by Rick Martinelli in the June 2006 issue of Stock and Commodities Magazine.
He published the results of his tests on 28 stocks over one to two years. Martinelli came up with a standard deviation noise level for GM at .727.
Close enough to our MOBO band settings we have been using of .8 standard deviations for the last 7 years.
He also found that this system has a 56% statistical advantage over those trading a buy and hold system.
Additional methods I have used to help find larger predictive breakouts of "noise bands" is to also incorporate
the use of Simple moving average breakouts. Statistically the 50 SMA has had a 94% to 96% successful price
movement when coupled to the MOBO band breakout.
When a stock has broken out of MOBO it still exhibits the market noise concept of random price movement while in an up trend, or in a down trend.
MOBO bands will allow one to maintain a longer term trading position with the expanding and contracting bands that are reading the
"Brownian motion," for each stock, index, and futures. Longer term time periods of 2 and 3 days expand the bands as well as their
ability to hold a stock in a longer trend move in spite of the ''''noise'''' of the price movement within that trend.
In the financial markets this method of using standard deviation bands, MOBO, adjusted for the
''''white noise'''' can provide a superior trend following system than just
using a moving average that ignores the laws of Brownian motion.

B
Brownian Noise
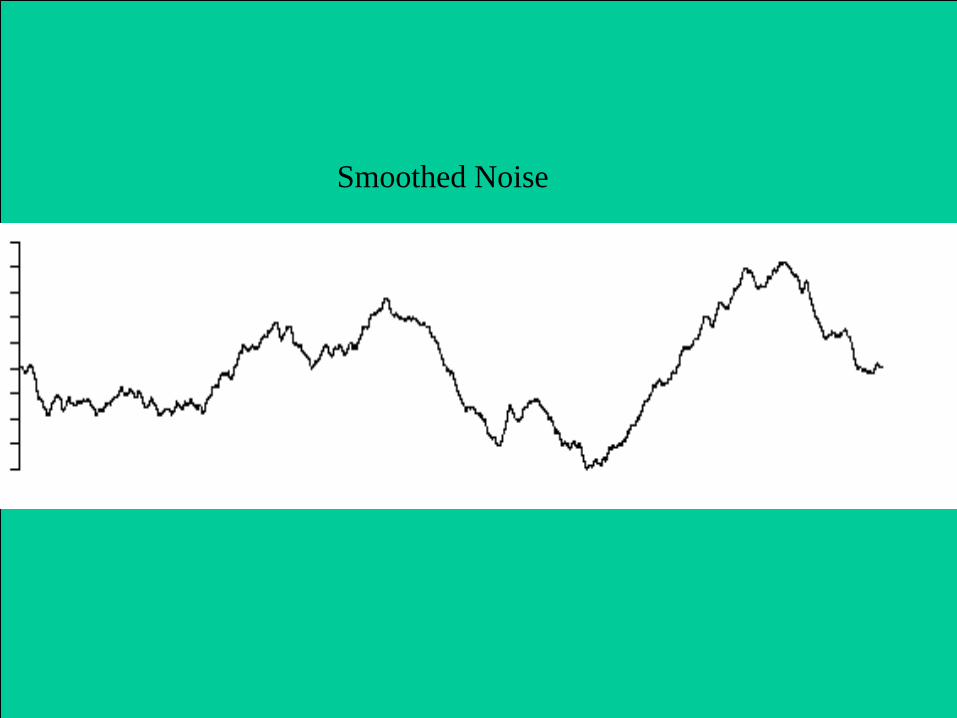
Smoothed Noise
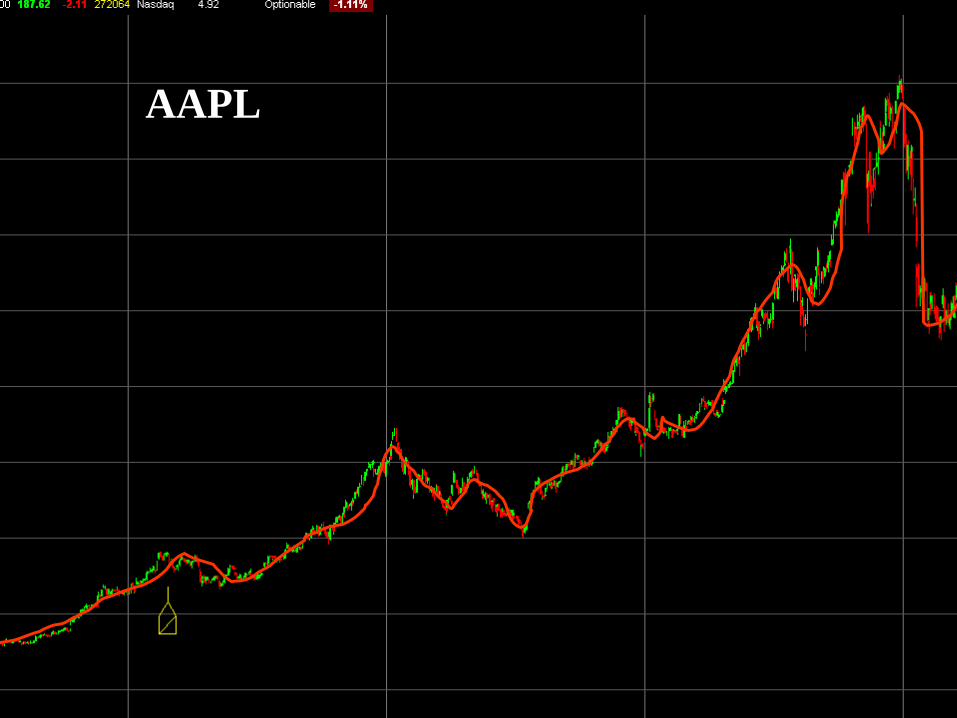
AAPL

AAPL BOLLINGER BANDS
Daily

AAPL BOLLINGER BANDS
Daily
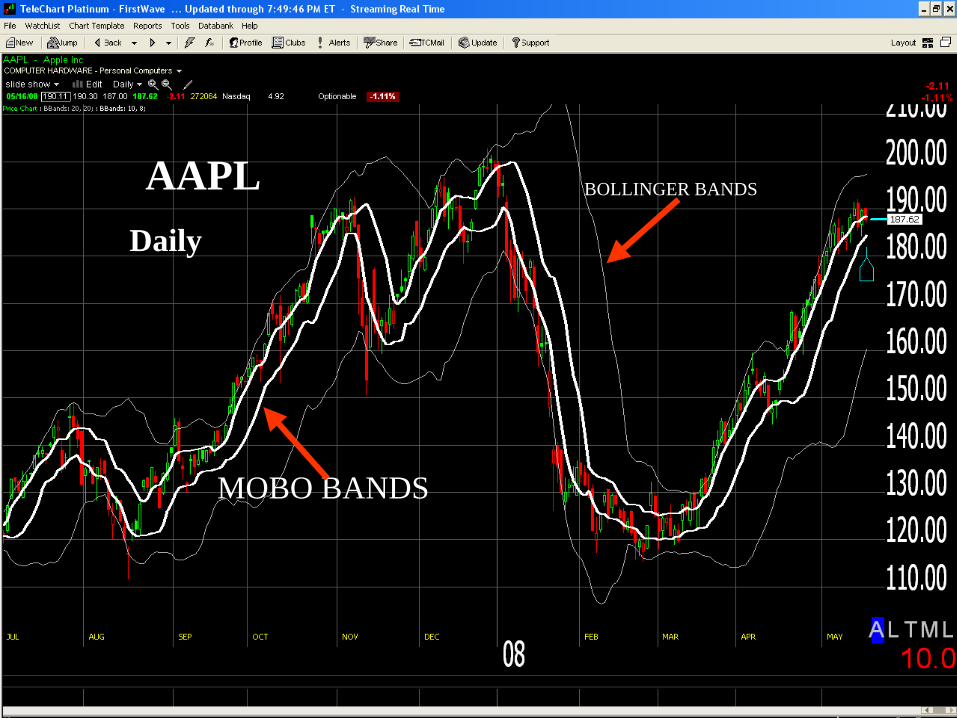
BOLLINGER BANDS
MOBO BANDS
AAPL Daily

BOLLINGER BANDS
MOBO BANDS
AAPL DAILY CHART
AAPL
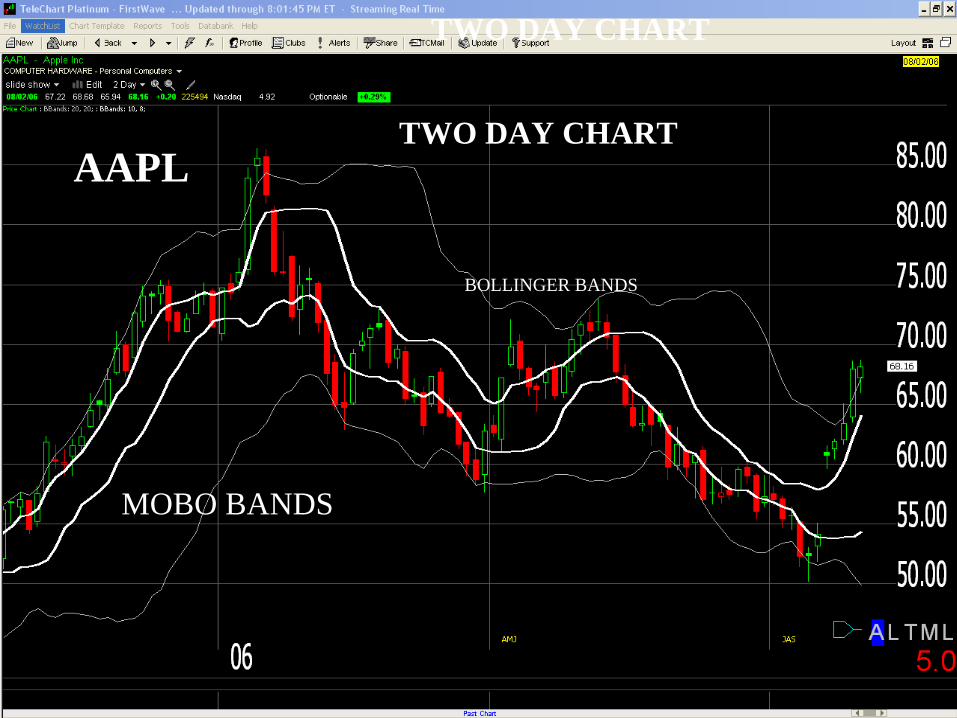
BOLLINGER BANDS
MOBO BANDS
TWO DAY CHART
TWO DAY CHART

AAPL WEEKLY CHART
BOLLINGER BANDS
MOBO BANDS

WEEKLY CHARTAAPL
MOBO BANDS
50 SMA WEEKLY
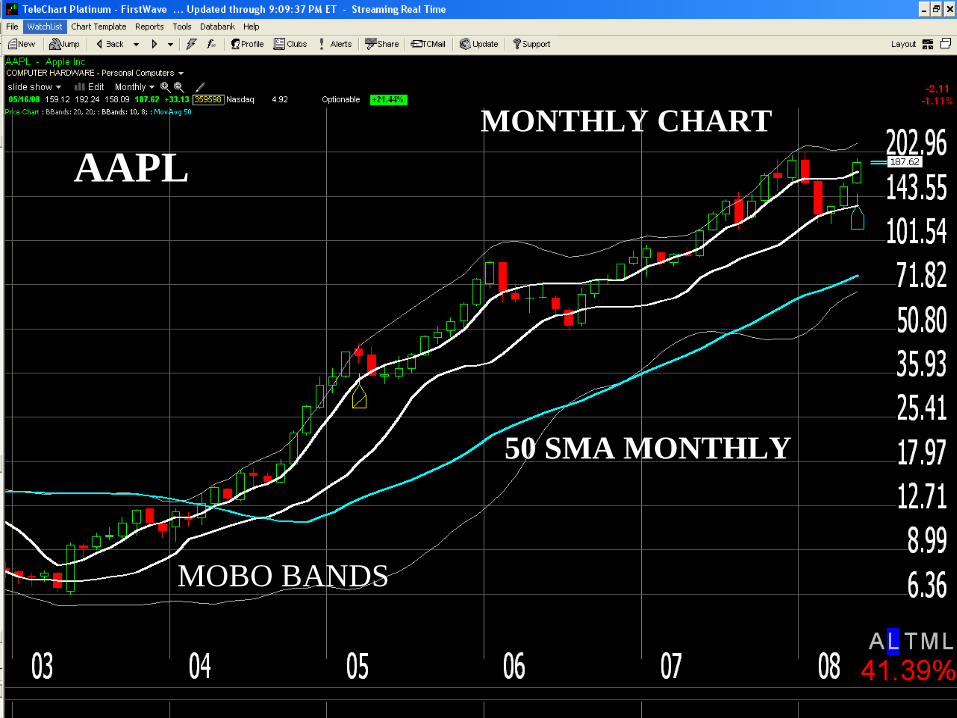
MONTHLY CHARTAAPL
MOBO BANDS
50 SMA MONTHLY
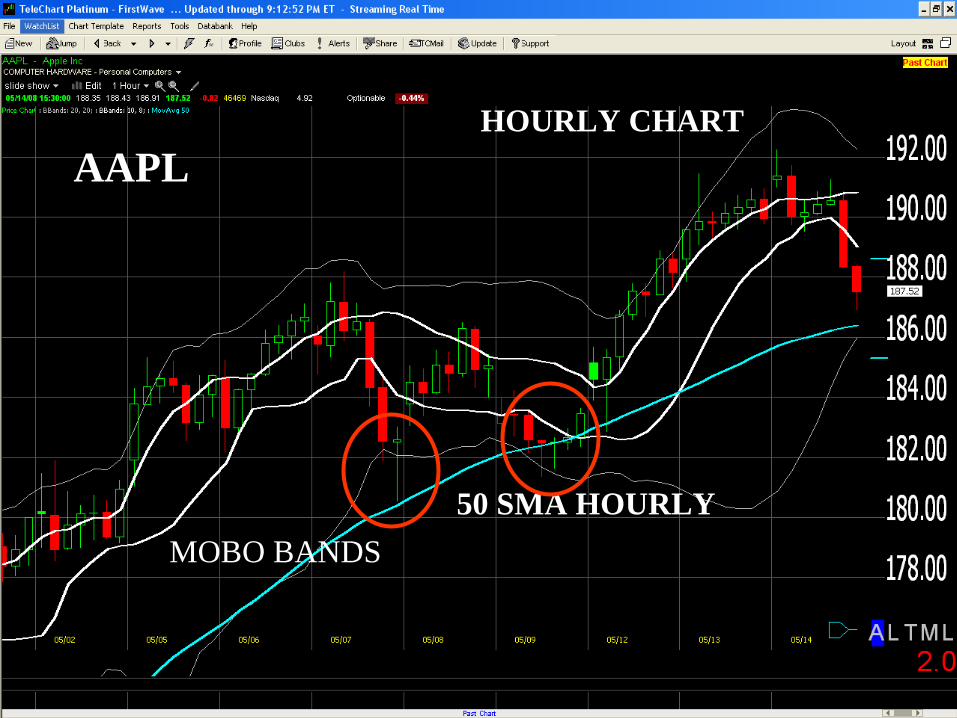
AAPL
50 SMA HOURLY
HOURLY CHART
MOBO BANDS
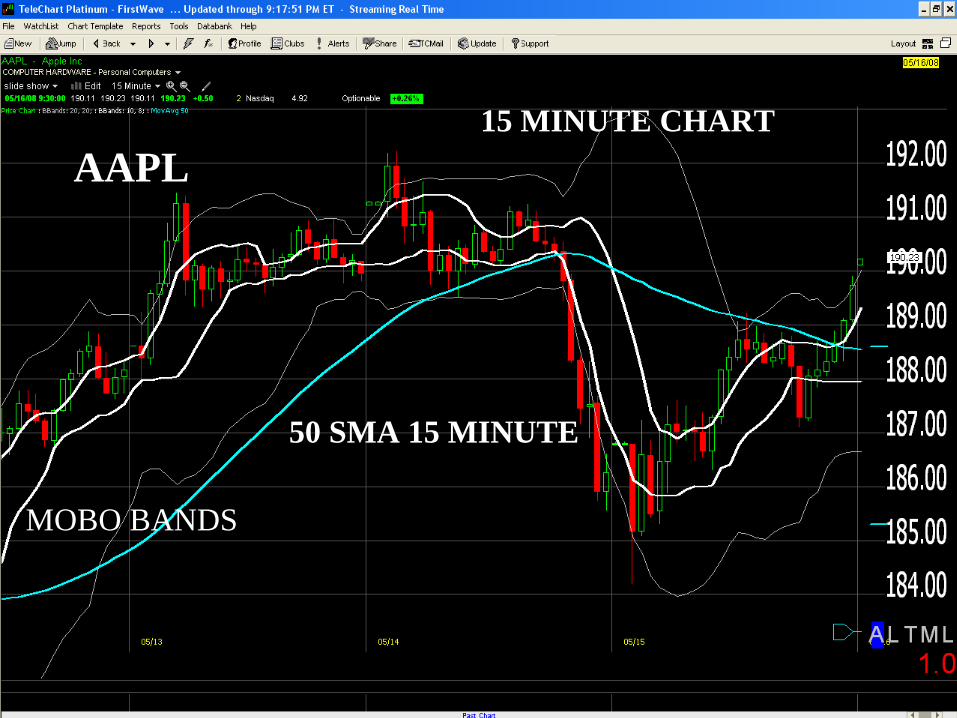
AAPL 15 MINUTE CHART
50 SMA 15 MINUTE
MOBO BANDS

MOBO BANDS 50 SMA 5 MINUTE
AAPL 5 MINUTE CHART

1 MINUTE CHARTAAPL
MOBO BANDS50 SMA 1 MINUTE

DJ-30 DAILY CHART
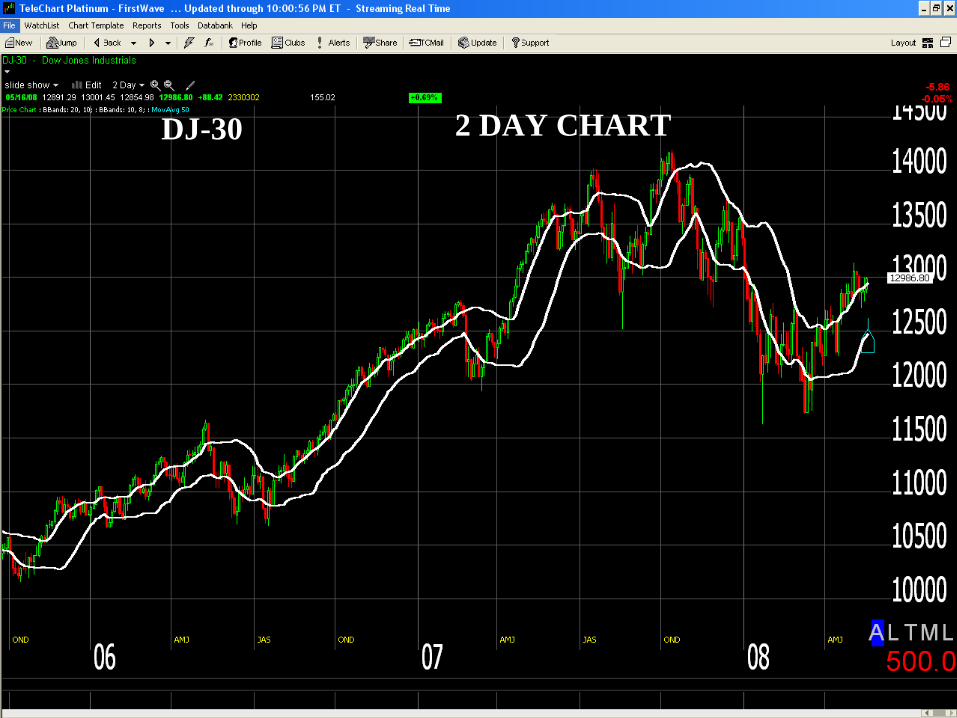
2 DAY CHARTDJ-30
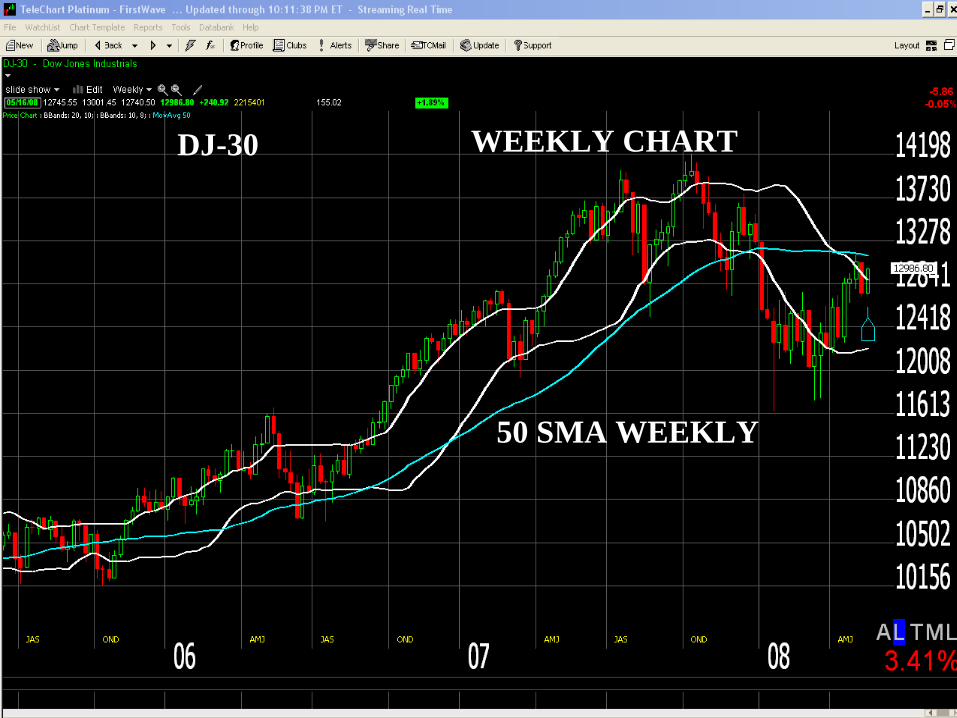
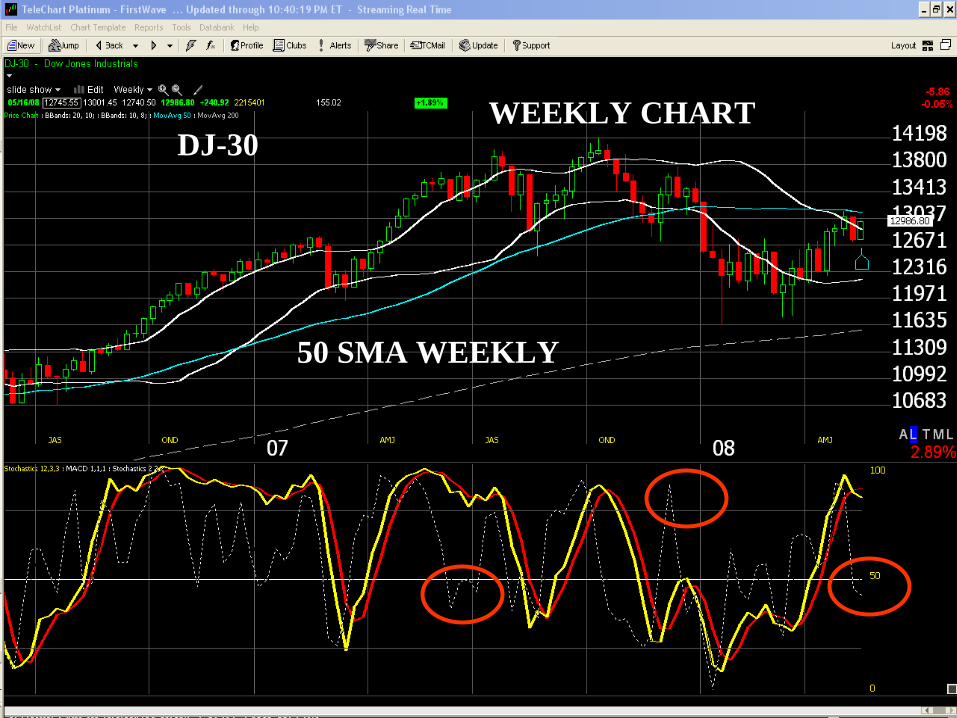
DJ-30 weekly CHARTDJ-30 WEEKLY CHART
50 SMA WEEKLY
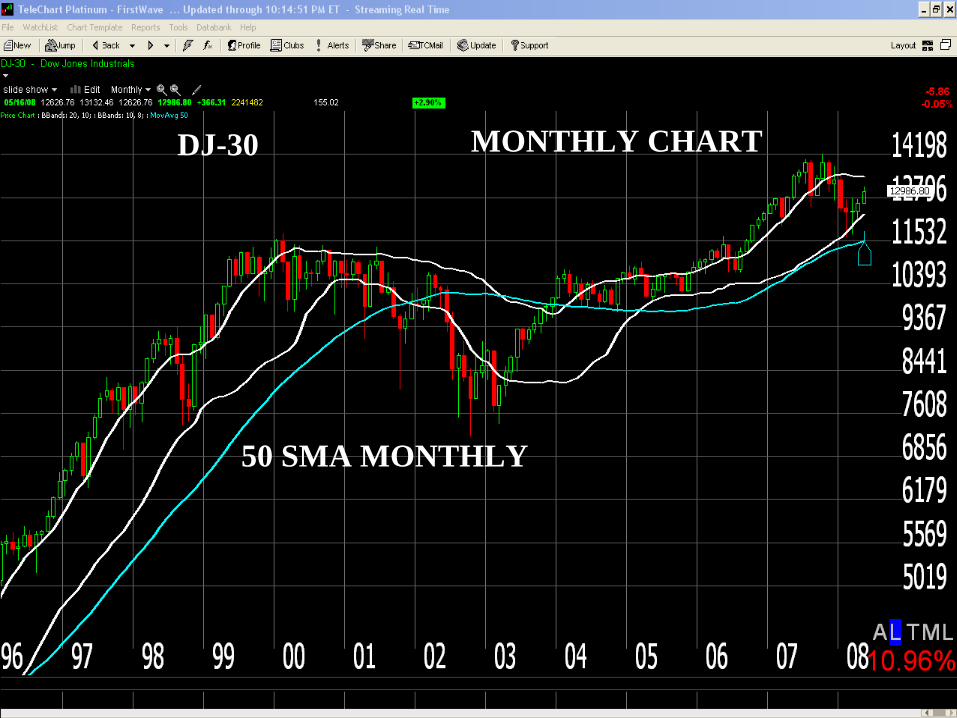
DJ-30 MONTHLY CHART
50 SMA MONTHLY

MONTHLY CHARTDJ-30
50 SMA MONTHLY
50 SMA WEEKLY
DJ-30WEEKLY CHART
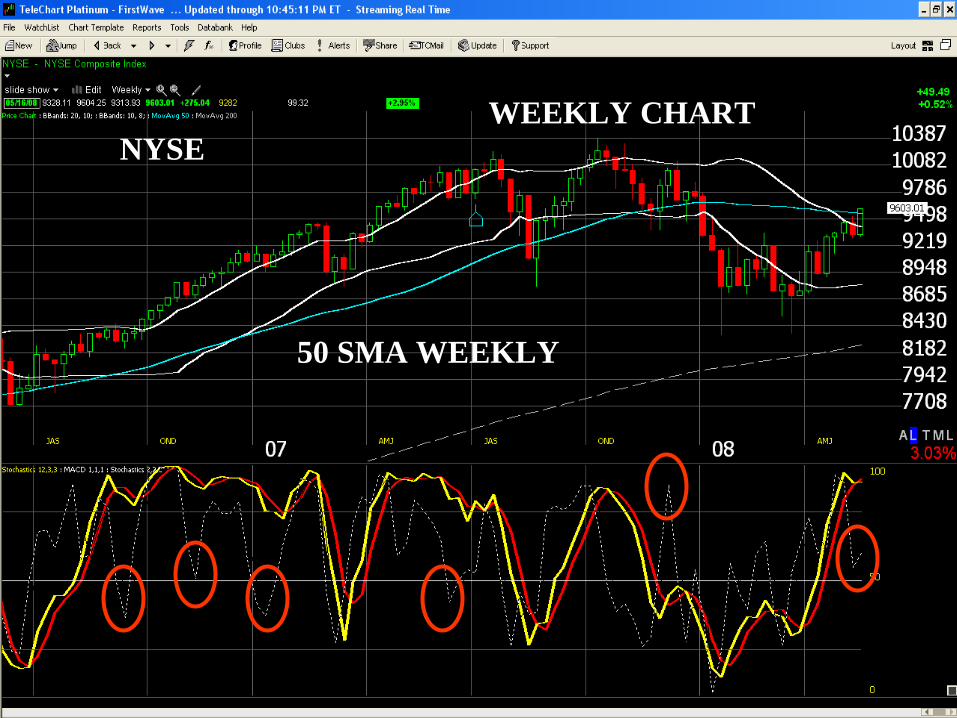
NYSEWEEKLY CHART
50 SMA WEEKLY

MARKET INTERNALSNYSE ADVANCE / DECLINE
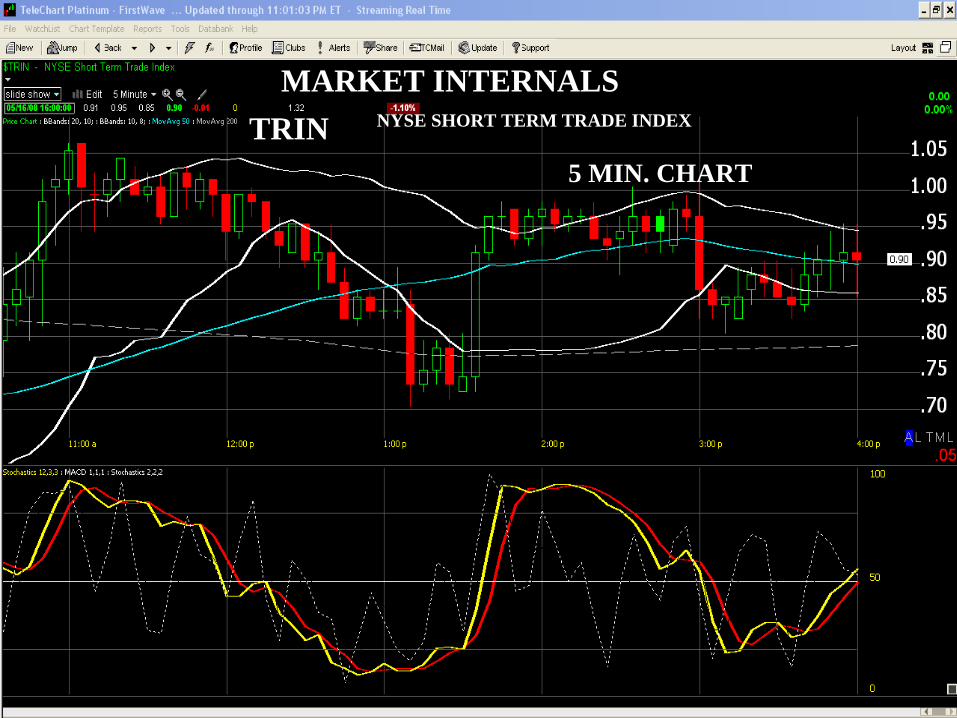
5 MIN. CHART
5 MIN. CHART
MARKET INTERNALSTRIN NYSE SHORT TERM TRADE INDEX

Natural Gas IndexDaily chart

LIGHT SWEET CRUDE
DAILY
CHARTS COURTESY
WORDEN BROTHERS PLATINUM SOFTWARE


