Trading With Candles Bearish engulfing lines This candlestick chart pattern is strongly b earish if it occurs after a significant up-trend (i.e., it acts as a reversal pattern). It occurs when a small bullish (empty) line is engulfed by a large bearish (filled-in) line. Engulfing Lines are one of the most important and powerful candle patterns. To form the pattern, Current bar's range encloses or “engulfs'' the prior bar's range, thereby indicating great market strength in the direction of Current bar's close. From a p sychological perspective, Engulfing Lines indicate that the market opened in the same direction as the prior ba r, but then reversed sentiment to close strongly in the opposite direction, overcoming and reversing previous bar's assumption regarding value.An engulfing candle often warns of the approaching reversal of a Minor, or short-term, trend. The Minor trend typically lasts between three and 15 bars. When an engulfing candle appears around this time, it often signals the beginning of a reversal. The engulfing candle must completely "consume" the real body of the previous candle. The power of the engulfing candle is increased by two factors -- the size of the candle and the volume on the bar it occurs. The bigger the e ngulfing candle, the more significant it is likely to be. A large bearish engulfing says the bears have taken command after an u ptrend. Also, if volume is above normal on the bar when the signal is given, this increases the power of the message.
Trading With Candles Bearish engulfing linesThis candlestick chart pattern is strongly bearish if it occurs after a significant up-trend (i.e., it actsas a reversal pattern). It occurs when a small bullish (empty) line is engulfed by a large bearish(filled-in) line.
Engulfing Lines are one of the most important and powerful candle patterns. To form the pattern,Current bar's range encloses or “engulfs'' the prior bar's range, thereby indicating great marketstrength in the direction of Current bar's close. From a psychological perspective, Engulfing Linesindicate that the market opened in the same direction as the prior bar, but then reversedsentiment to close strongly in the opposite direction, overcoming and reversing previous bar'sassumption regarding value.An engulfing candle often warns of the approaching reversal of aMinor, or short-term, trend. The Minor trend typically lasts between three and 15 bars. When anengulfing candle appears around this time, it often signals the beginning of a reversal.
The engulfing candle must completely "consume" the real body of the previous candle. Thepower of the engulfing candle is increased by two factors -- the size of the candle and the volumeon the bar it occurs. The bigger the engulfing candle, the more significant it is likely to be. A large
bearish engulfing says the bears have taken command after an uptrend. Also, if volume is abovenormal on the bar when the signal is given, this increases the power of the message.
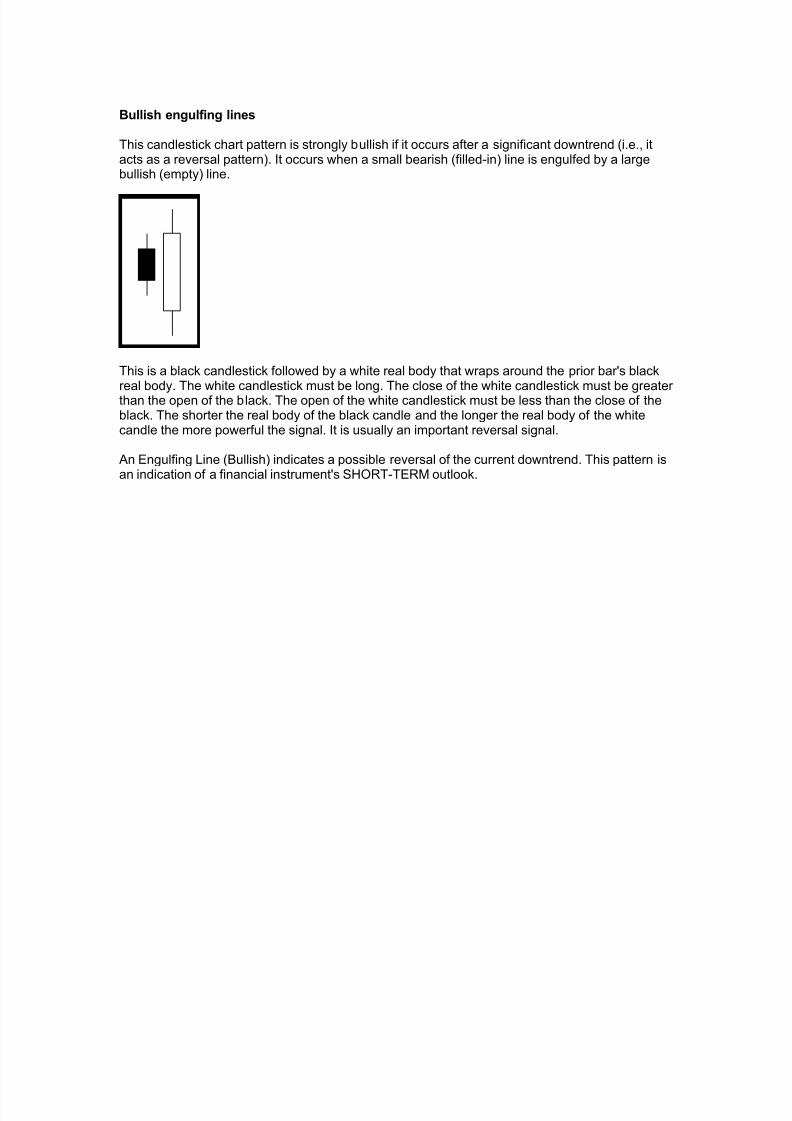
Bullish engulfing lines This candlestick chart pattern is strongly bullish if it occurs after a significant downtrend (i.e., itacts as a reversal pattern). It occurs when a small bearish (filled-in) line is engulfed by a largebullish (empty) line.
This is a black candlestick followed by a white real body that wraps around the prior bar's blackreal body. The white candlestick must be long. The close of the white candlestick must be greater than the open of the black. The open of the white candlestick must be less than the close of theblack. The shorter the real body of the black candle and the longer the real body of the whitecandle the more powerful the signal. It is usually an important reversal signal. An Engulfing Line (Bullish) indicates a possible reversal of the current downtrend. This pattern isan indication of a financial instrument's SHORT-TERM outlook.
Dark cloud cover This is a bearish candlestick chart pattern. The pattern is more significant if the second line'sbody is below the center of the previous line's body (as illustrated).
• First bar is a long white bar
• Second bar is black with an open above the high of the previous bar
• Second bar closes within but below the midpoint of the first bar's body
In an uptrend the market gaps open, but loses ground to fall below the midpoint of the previousbar. The Dark Cloud Cover pattern suggests an opportunity for the shorts to capitalize on the nextbar's open: a warning sign to bullish investors. The Dark Cloud Cover candle occurs after astrong uptrend. A series of ascending candles is ultimately "capped" by a final strong whitecandle. At this point, the stock or index seems technically healthy and the bulls may be lulled intoa sense of false complacency.
On the bar of the dark cloud cover, the instrument opens above the previous bar's high. For a true
dark cloud cover to emerge, therefore, the instrument should gap above the upper shadow of theprevious white "capping" candle. At the opening bell on this trading bar, it seems like the uptrendwill continue.
As the bar wears on, however, the bears wrest control. On the dark cloud cover bar, the stockcloses at least halfway into the previous white "capping" candle. The larger the penetration of theprevious candle (that is, the closer this candle is to being a bearish engulfing), the more powerfulthe signal.
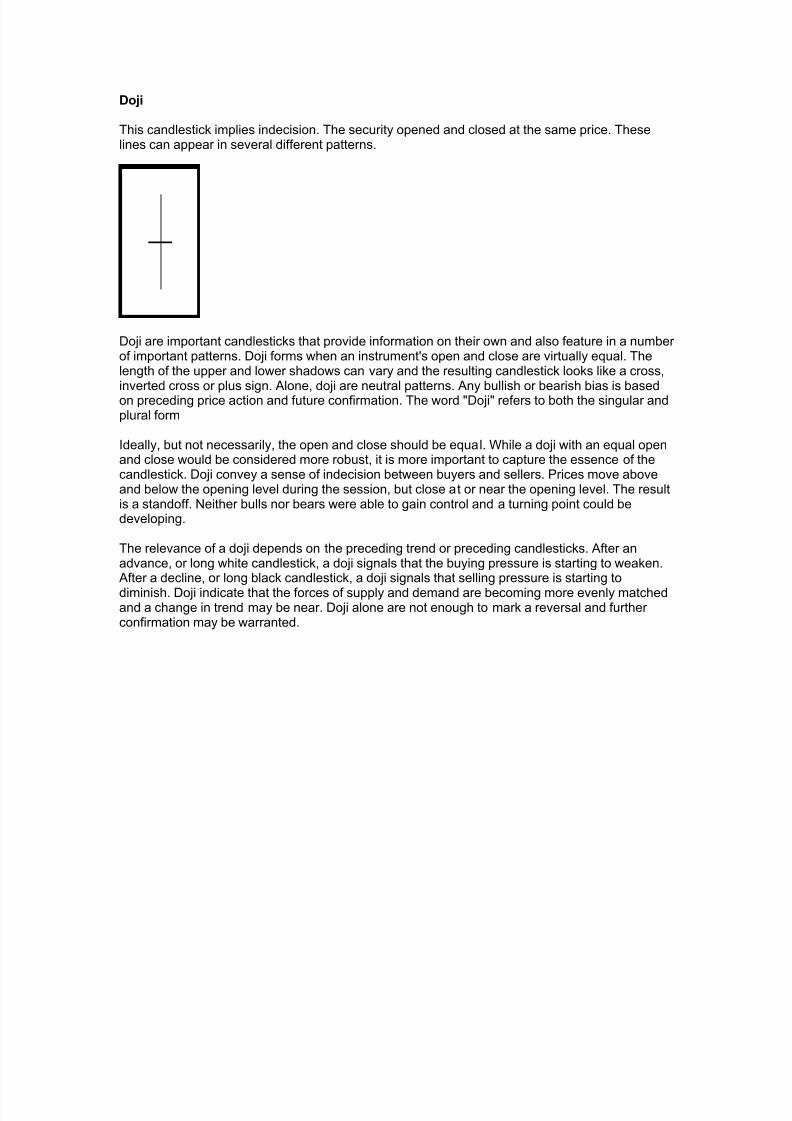
Doji This candlestick implies indecision. The security opened and closed at the same price. Theselines can appear in several different patterns.
Doji are important candlesticks that provide information on their own and also feature in a number of important patterns. Doji forms when an instrument's open and close are virtually equal. Thelength of the upper and lower shadows can vary and the resulting candlestick looks like a cross,inverted cross or plus sign. Alone, doji are neutral patterns. Any bullish or bearish bias is basedon preceding price action and future confirmation. The word "Doji" refers to both the singular andplural form Ideally, but not necessarily, the open and close should be equal. While a doji with an equal openand close would be considered more robust, it is more important to capture the essence of thecandlestick. Doji convey a sense of indecision between buyers and sellers. Prices move aboveand below the opening level during the session, but close at or near the opening level. The resultis a standoff. Neither bulls nor bears were able to gain control and a turning point could bedeveloping. The relevance of a doji depends on the preceding trend or preceding candlesticks. After anadvance, or long white candlestick, a doji signals that the buying pressure is starting to weaken.After a decline, or long black candlestick, a doji signals that selling pressure is starting to
diminish. Doji indicate that the forces of supply and demand are becoming more evenly matchedand a change in trend may be near. Doji alone are not enough to mark a reversal and further confirmation may be warranted.
Doji star A Doji is a name of a candlestick in Japanese Candlestick charting. This type of charts allow for a quick visual digestion of changing supply and demand patterns. The Doji is one of many typesof patterns or candlesticks that give implication as to future price action. The Doji is simply aformation in which the open and close are the same. This candlestick is a component of manyimportant candlestick patterns such as the Doji Star, which is a Doji, which gaps above or below awhite or black candlestick.
A star indicates a reversal and a doji indicates indecision. The Doji star is a reversal signal withconfirmation to be made during the next trading bar. Thus, this candlestick chart pattern usuallyindicates a reversal following an indecisive bar. You should wait for a confirmation before tradinga doji star.
When a doji gaps above a real body in an uptrend, or gaps under a real body in a falling market,that particular doji is called a doji star .
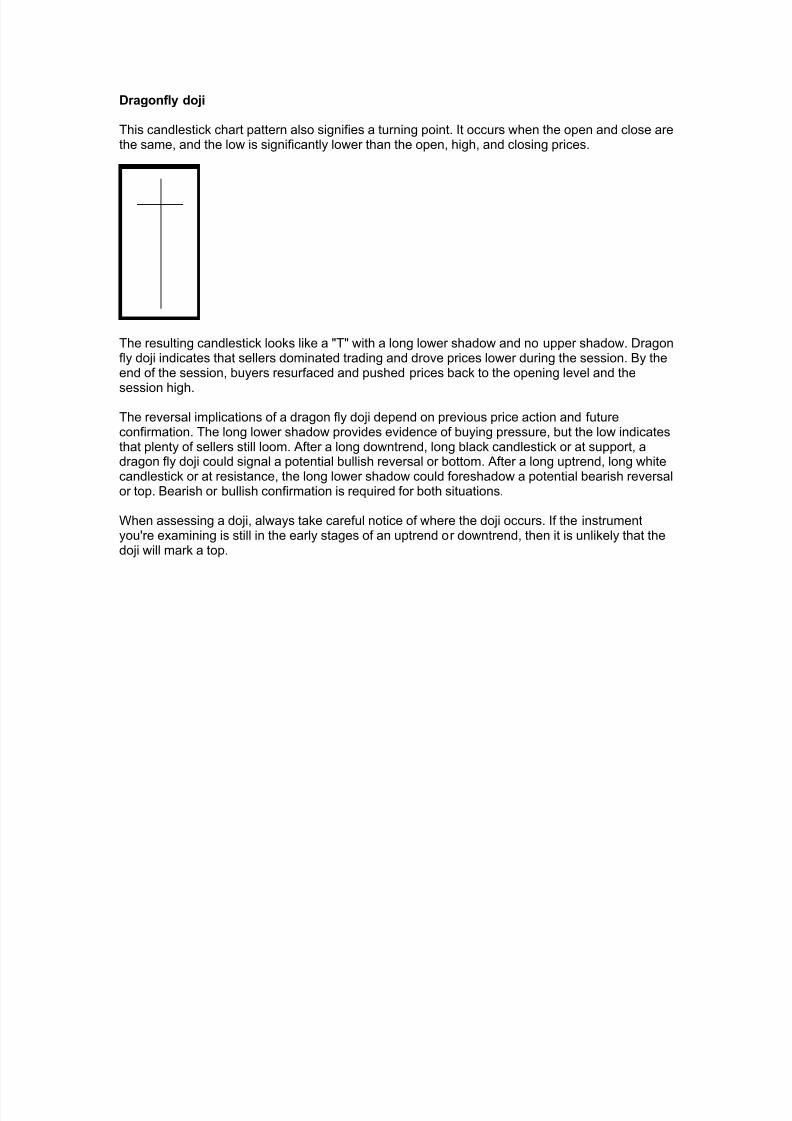
Dragonfly doji This candlestick chart pattern also signifies a turning point. It occurs when the open and close arethe same, and the low is significantly lower than the open, high, and closing prices.
The resulting candlestick looks like a "T" with a long lower shadow and no upper shadow. Dragonfly doji indicates that sellers dominated trading and drove prices lower during the session. By theend of the session, buyers resurfaced and pushed prices back to the opening level and the
session high.
The reversal implications of a dragon fly doji depend on previous price action and futureconfirmation. The long lower shadow provides evidence of buying pressure, but the low indicatesthat plenty of sellers still loom. After a long downtrend, long black candlestick or at support, adragon fly doji could signal a potential bullish reversal or bottom. After a long uptrend, long whitecandlestick or at resistance, the long lower shadow could foreshadow a potential bearish reversalor top. Bearish or bullish confirmation is required for both situations.
When assessing a doji, always take careful notice of where the doji occurs. If the instrumentyou're examining is still in the early stages of an uptrend or downtrend, then it is unlikely that thedoji will mark a top.
Evening star This is a candlestick chart bearish pattern signifying a potential top. The "star" indicates apossible reversal and the bearish (filled-in) line confirms this. The star can be empty or filled-in. Atop reversal pattern where the first is a tall real body, the second is a small real body (green/whiteor red/black) which gaps high to form a star. The third is a red candlestick, which closes well intothe first session's green real body.
The evening star pattern occurs during a sustained uptrend. On the first bar we see a candle witha long white body. Everything looks normal and the bulls appear to have full control of theinstrument. On the second bar, however, a star candle occurs. For this to be a valid evening star pattern, the instrument must gap higher on the bar of the star. The star can be either black/red or white/green. A star candle has a small real body and often contains a large upper shadow.
The star communicates that the bulls and bears are involved in a tug of war, yet neither side iswinning. After a sustained uptrend, those who want to take profits have come into balance withthose eager to buy. A large upper shadow indicates that the instrument could not sustain itsprobe into new high ground. A potential reversal has been signaled.
On the third bar, a candle with a black real body emerges. This candle retreats substantially intothe real body of the first bar. The pattern is made more powerful if there is a gap between thesecond and third bar's candles. However, this gap is unusual, particularly when it comes to equitytrading. As such, it is not a required part of the pattern. The further this third candle retreats intothe real body of the first bar's candle, the more powerful the reversal signal. Since the third bar affirms the star's potentially bearish implications, no further confirmation is needed.
This candlestick chart pattern signifies a turning point. It occurs when the open, close, and loware the same, and the high is significantly higher than the open, low, and closing prices.
A "gravestone doji," as the name implies, is probably the most ominous candle of all. On that bar,prices rallied, but could not stand the "altitude" they achieved. By the end of the bar they cameback and closed at the same level.
Gravestone Doji's are the opposite of the Dragonfly Doji and are top reversal indicators whenconfirmed with bearish engulfing. As the name implies, gravestone doji's look like a gravestone.The resulting candlestick looks like an upside down "T" with a long upper shadow and no lower shadow. Gravestone doji indicate that buyers dominated trading and drove prices higher duringthe session. However, by the end of the session, sellers resurfaced and pushed prices back tothe opening level and the session low.
As with the dragon fly doji and other candlesticks, the reversal implications of gravestone dojidepend on previous price action and future confirmation of data. Even though the long upper shadow indicates a failed rally, the intrabar high provides evidence of some buying pressure.After a long downtrend, long black candlestick or at support, focus turns to the evidence of buyingpressure and a potential bullish reversal. After a long uptrend, long white candlestick or atresistance, focus turns to the failed rally and a potential bearish reversal. Bearish or bullishconfirmation is required for both situations.
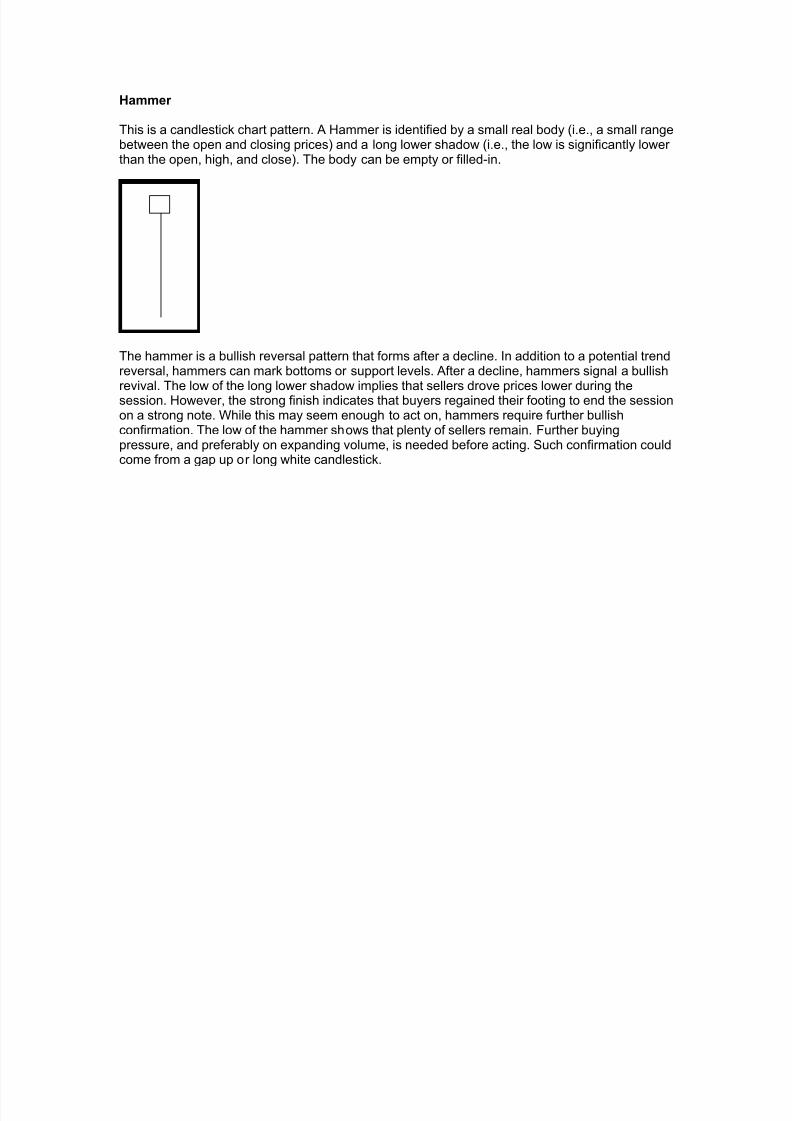
Hammer This is a candlestick chart pattern. A Hammer is identified by a small real body (i.e., a small rangebetween the open and closing prices) and a long lower shadow (i.e., the low is significantly lower than the open, high, and close). The body can be empty or filled-in.
The hammer is a bullish reversal pattern that forms after a decline. In addition to a potential trendreversal, hammers can mark bottoms or support levels. After a decline, hammers signal a bullishrevival. The low of the long lower shadow implies that sellers drove prices lower during thesession. However, the strong finish indicates that buyers regained their footing to end the sessionon a strong note. While this may seem enough to act on, hammers require further bullishconfirmation. The low of the hammer shows that plenty of sellers remain. Further buyingpressure, and preferably on expanding volume, is needed before acting. Such confirmation couldcome from a gap up or long white candlestick.
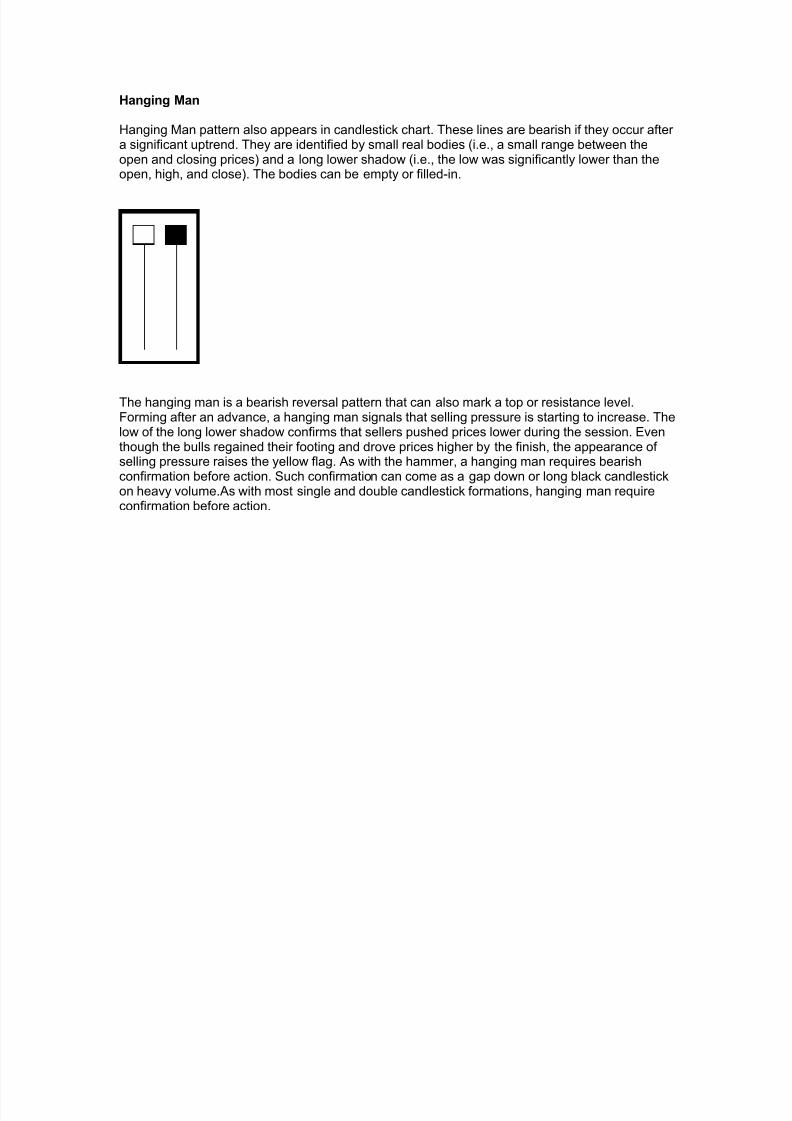
Hanging Man Hanging Man pattern also appears in candlestick chart. These lines are bearish if they occur after a significant uptrend. They are identified by small real bodies (i.e., a small range between theopen and closing prices) and a long lower shadow (i.e., the low was significantly lower than theopen, high, and close). The bodies can be empty or filled-in.
The hanging man is a bearish reversal pattern that can also mark a top or resistance level.Forming after an advance, a hanging man signals that selling pressure is starting to increase. Thelow of the long lower shadow confirms that sellers pushed prices lower during the session. Eventhough the bulls regained their footing and drove prices higher by the finish, the appearance of selling pressure raises the yellow flag. As with the hammer, a hanging man requires bearishconfirmation before action. Such confirmation can come as a gap down or long black candlestickon heavy volume.As with most single and double candlestick formations, hanging man requireconfirmation before action.
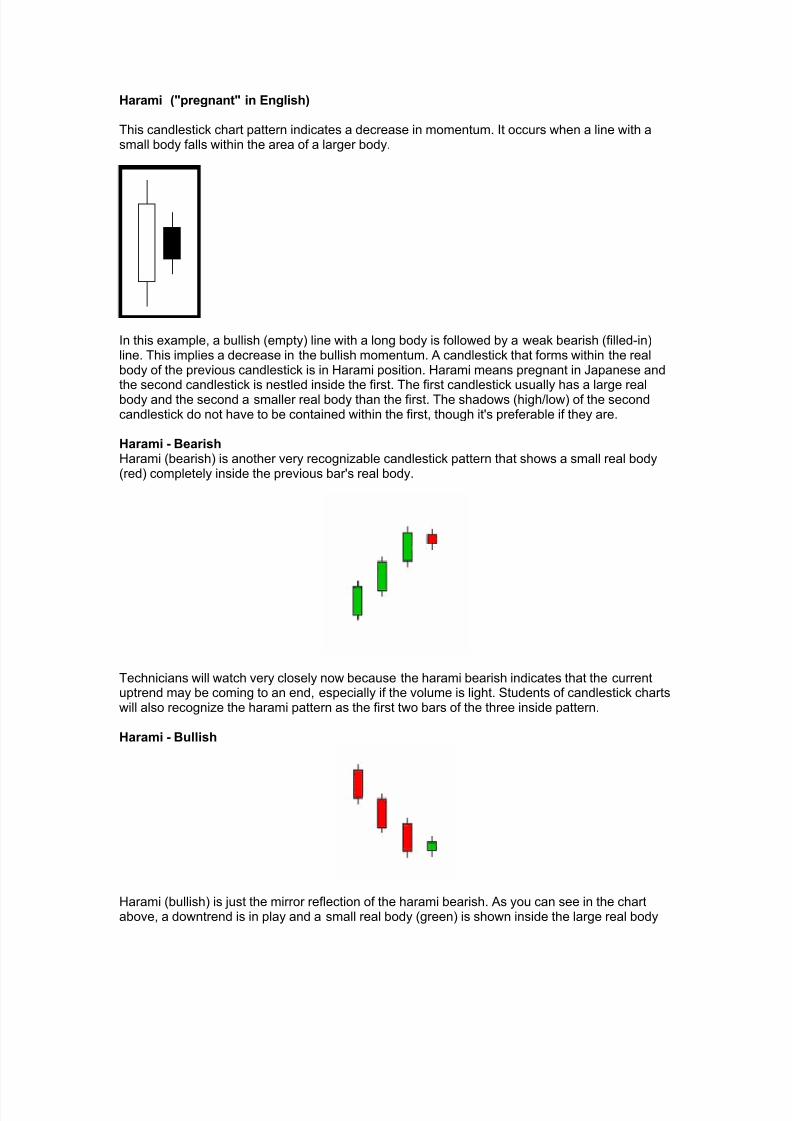
Harami ("pregnant" in English) This candlestick chart pattern indicates a decrease in momentum. It occurs when a line with asmall body falls within the area of a larger body.
In this example, a bullish (empty) line with a long body is followed by a weak bearish (filled-in)line. This implies a decrease in the bullish momentum. A candlestick that forms within the realbody of the previous candlestick is in Harami position. Harami means pregnant in Japanese andthe second candlestick is nestled inside the first. The first candlestick usually has a large realbody and the second a smaller real body than the first. The shadows (high/low) of the secondcandlestick do not have to be contained within the first, though it's preferable if they are. Harami - BearishHarami (bearish) is another very recognizable candlestick pattern that shows a small real body(red) completely inside the previous bar's real body.
Technicians will watch very closely now because the harami bearish indicates that the currentuptrend may be coming to an end, especially if the volume is light. Students of candlestick chartswill also recognize the harami pattern as the first two bars of the three inside pattern.
Harami - Bullish
Harami (bullish) is just the mirror reflection of the harami bearish. As you can see in the chartabove, a downtrend is in play and a small real body (green) is shown inside the large real body
(red) of the previous bar. This tells the technician that the trend is coming to a conclusion. Theharami implies that the preceding trend is about to conclude. A candlestick closing higher the nextbar would confirm the trend reversal. After a decline, a black/black or black/white combination can still be regarded as a bullish harami.The first long black candlestick signals that significant selling pressure remains and could indicatecapitulation. The small candlestick immediately following forms with a gap up on the open,indicating a sudden increase in buying pressure and potential reversal.
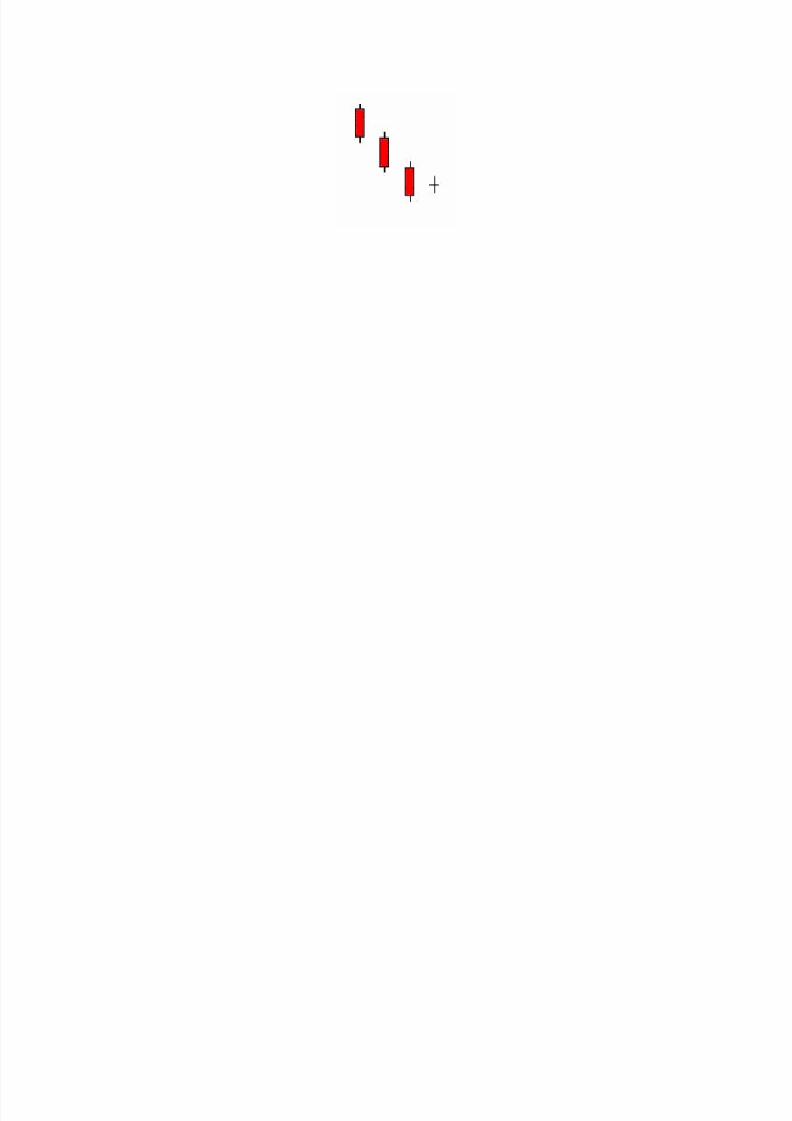
Harami cross This candlestick pattern indicates a decrease in momentum. The pattern is similar to a harami,except the second line is a doji (signifying indecision).
The 1st bar is a long white bar. The 2nd bar is a doji bar that is engulfed by the 1st bar's body.The 2nd bar's price range does not pierce the previous bar's range and closes about where itopened. Volume on the 2nd bar is low which indicates that traders are lacking enough information
to decide whether to go long or short. A Harami cross can be either bullish or bearish, depending on the previous trend. Theappearance of a Harami Cross, rather than a smaller body, increases the likelihood that the trendwill reverse.
Harami Cross – Bearish
Harami cross (bearish) is a pattern of a harami with a doji instead of a small real body followingup on the next trading session. The doji is within the range of the real body of the prior session.
Like the harami, the trend starts out in play, but the market then decides to reverse intra-bar withvolume being somewhat non-existent and the pattern closing at the same price as the issueopened. The uptrend has been reversed.
Harami Cross - Bullish
The harami cross, whether the bullish or bearish version, starts out looking like the basic haramipattern. The harami cross bullish is the exact opposite of the harami cross bearish and does notrequire any further explanation. Again, a trend has been reversed.
Long black (filled-in) line This is candlestick pattern is a bearish line. It occurs when prices open near the high and closesignificantly lower near the bar's low.
Long black candlesticks show strong selling pressure. The longer the black candlestick is, thefurther the close is below the open. This indicates that prices declined significantly from the openand sellers were aggressive. After a long advance, a long black candlestick can foreshadow aturning point or mark a future resistance level. After a long decline a long black candlestick canindicate panic or capitulation.
Long-legged doji This is a candlestick chart pattern, which often signifies a turning point. A "long-legged" doji is afar more dramatic candle. It says that prices moved far higher on the bar, but then profit takingkicked in. Typically, a very large upper shadow is left. A close below the midpoint of the candleshows a lot of weakness. It occurs when the open and close are the same, and the rangebetween the high and low is relatively large.
Long-legged doji have long upper and lower shadows that are almost equal in length. These dojireflect a great amount of indecision in the market. Long-legged doji indicate that prices tradedwell above and below the session's opening level, but closed virtually even with the open.
This is a bullish line. It occurs when prices open near the low and close significantly higher near the bar's high. This pattern occurs in candlestick chart. It is bullish type pattern. Long white candlesticks show strong buying pressure. The longer the white candlestick is, thefurther the close is above the open. This indicates that prices advanced significantly from open toclose and buyers were aggressive. While long white candlesticks are generally bullish, muchdepends on their position within the broader technical picture. After extended declines, long whitecandlesticks can mark a potential turning point or support level. If buying gets too aggressive after a long advance, it can lead to excessive bullishness.
This is a bullish candlestick chart pattern. First line is a long black line (bearish line) and thesecond line is a long white line (bullish line). The second line opens lower than the first line's low,but it closes more than halfway above the first line's real body.
The gap down on the 2nd bar perpetuates the downtrend. However, the 2nd bar's close is abovethe midpoint of the 1st bar's body. This suggests to the bears that a bottom could be forming. Themore penetration of the close on the 2nd bar to the 1st bar's body, the more probable the reversalsignal will succeed.
Shooting star This candlestick chart pattern suggests a minor reversal when it appears after a rally. The star'sbody must appear near the low price and the line should have a long upper shadow.
A small real body nears the lower end of the trading range, with a long upper shadow. The color of the body is not critical. Not usually considered a major reversal sign, only a warning.
The market gaps open above the previous bar's close in an uptrend. It rallies to a new high thenloses strength and closes near its low: a bearish change of momentum. Confirmation of the trendreversal would by an opening below the body of the Shooting Star on the next trading bar.
• A very long upper shadow.
• The small real body at the lower end of the price range.
• The real body gaps away from the prior real body.
By definition, this is a pattern that signals a possible top. Because like all reversal patterns,confirmation is key before taking any action to position yourself.
For this reversal pattern, here's what you are looking for:
• Gap open greater than the previous close
• A new high
• An open and close in the bottom of the range.
In candlestick speak, the real body is small - the open and close are close to each other. Thewick is at least three times as long as the real body.For confirmation of this pattern, theinstrument needs to trade lower, obviously. The best balance of risk versus reward comes whenyou wait for the to trade below the shooting star's low .A Shooting Star sends a warning that thetop is near. It got its name by looking like a shooting star.
Spinning tops These candlestick chart pattern are neutral lines. They occur when the distance between the highand low, and the distance between the open and close, are relatively small. These are theCandlestick lines that have small bodies with upper and lower shadows that exceed the length of the body.
Candlesticks with a long upper shadow, long lower shadow and small real body is called spinningtops. One long shadow represents a reversal of sorts; spinning tops represent indecision. Thesmall real body (whether hollow or filled) shows little movement from open to close, and theshadows indicate that both bulls and bears were active during the session.
Even though the session opened and closed with little change, prices moved significantly higher and lower in the mean time. Neither buyers nor sellers could gain the upper hand and the resultwas a standoff. After a long advance or long white candlestick, a spinning top indicates weaknessamong the bulls and a potential change or interruption in trend. After a long decline or long blackcandlestick, a spinning top indicates weakness among the bears and a potential change or interruption in trend. Spinning tops candles denote situations where the market is having difficulty coming to aconsensus on a security's value. They portray a market in which uncertainty and indecisionprevail. Neither the buyers nor the sellers have a clear sense of which direction the market willhead. The forces of supply and demand are equally balanced. In the spinning top, the shadowsare relatively small and the candle has a very small range. When combined with low volume,traders may be expressing disinterest.
Star Stars are the candlestick pattern, which indicate reversals. A star is a line with a small real bodythat occurs after a line with a much larger real body, where the real bodies do not overlap. Theshadows may overlap.
A candlestick that gaps away from the previous candlestick is said to be in star position. The firstcandlestick usually has a large real body, but not always, and the second candlestick in star
position has a small real body. Depending on the previous candlestick, the star positioncandlestick gaps up or down and appears isolated from previous price action. The twocandlesticks can be any combination of white and black.