TRAFFIC ACCIDENT COSTING FOR THAILAND Pipat THONGCHIM Lecturer Department of Civil Engineering Faculty of Engineering Prince of Songkla University Hatyai, Songkhla 90112 Thailand Fax: +66-74-446514 E-mail: [email protected]Pichai TANEERANANON Associate Professor Department of Civil Engineering Faculty of Engineering Prince of Songkla University Hatyai, Songkhla 90112 Thailand Fax: +66-74-446514 E-mail: [email protected]Paramet LUATHEP Lecturer Department of Civil Engineering Faculty of Engineering Prince of Songkla University Hatyai, Songkhla 90112 Thailand Fax: +66-74-446514 E-mail: [email protected]Phayada PRAPONGSENA Statistical Administration Officer Bureau of Traffic Safety Department of Highways Ministry of Transport Ratchatavi, Bangkok 10400 Thailand Fax: +66-23-546713 E-mail: [email protected]Abstract: This paper presents the results of Thailand study of traffic accident costing. Five provinces are selected as representatives for north-eastern, northern, middle, southern region and the capital city. They are Khon Kaen, Lampang, Nakhonsawan, Songkhla, and Bangkok. The Human Capital Method (HCM) is adopted for the 2004 study in which 13,766 people were killed. The cost components are grouped into three categories thus: human category comprising loss of productivity, medical treatment, long term care, quality of life and emergency service; property damage category comprising vehicle and non-vehicle damages; and general traffic accident category comprising insurance, police administration, judicial, emergency rescue services and travel delay. Further, all estimated costs are computed for four levels of casualty and accident severities. The total costs of traffic accident in Thailand for the year 2004 are estimated at 153,755 million baht (approximately US$ 3,460 million). Key Words: Traffic accident costing, Human capital method, Thailand 1. INTRODUCTION Economic growth in Thailand has brought about an expanding network of roads and an increasing number of the driving public. The growing number of vehicles on the roads, in turn, has contributed to significant increases of road crashes annually. Road crashes have been a major cause of death and injury in Thailand. The trend of accident occurrences and number of fatalities between 1987 and 2005 are shown in Figure 1. As shown in Figure 1, the number of road crashes can be seen to rise from 24,132 cases in 1987 to 102,610 in 1994; dropping to 67,800 in 1999 and surge to 122,040 in 2005, in line with the economic recovery. While the number of fatalities were on an increasing trend starting from 8,589 in year 1987 to peak at 16,727 (1.91 deaths per hour) in 1995. After peaking, the number of fatalities declined to 12,858 (1.47 deaths per hour) in 2005. Journal of the Eastern Asia Society for Transportation Studies, Vol. 7, 2007 2891
Transcript
TRAFFIC ACCIDENT COSTING FOR THAILAND
Pipat THONGCHIM Lecturer Department of Civil Engineering Faculty of Engineering Prince of Songkla University Hatyai, Songkhla 90112 Thailand Fax: +66-74-446514 E-mail: [email protected]
Pichai TANEERANANON Associate Professor Department of Civil Engineering Faculty of Engineering Prince of Songkla University Hatyai, Songkhla 90112 Thailand Fax: +66-74-446514 E-mail: [email protected]
Paramet LUATHEP Lecturer Department of Civil Engineering Faculty of Engineering Prince of Songkla University Hatyai, Songkhla 90112 Thailand Fax: +66-74-446514 E-mail: [email protected]
Phayada PRAPONGSENA Statistical Administration Officer Bureau of Traffic Safety Department of Highways Ministry of Transport Ratchatavi, Bangkok 10400 Thailand Fax: +66-23-546713 E-mail: [email protected]
Abstract: This paper presents the results of Thailand study of traffic accident costing. Five provinces are selected as representatives for north-eastern, northern, middle, southern region and the capital city. They are Khon Kaen, Lampang, Nakhonsawan, Songkhla, and Bangkok. The Human Capital Method (HCM) is adopted for the 2004 study in which 13,766 people were killed. The cost components are grouped into three categories thus: human category comprising loss of productivity, medical treatment, long term care, quality of life and emergency service; property damage category comprising vehicle and non-vehicle damages; and general traffic accident category comprising insurance, police administration, judicial, emergency rescue services and travel delay. Further, all estimated costs are computed for four levels of casualty and accident severities. The total costs of traffic accident in Thailand for the year 2004 are estimated at 153,755 million baht (approximately US$ 3,460 million). Key Words: Traffic accident costing, Human capital method, Thailand 1. INTRODUCTION Economic growth in Thailand has brought about an expanding network of roads and an increasing number of the driving public. The growing number of vehicles on the roads, in turn, has contributed to significant increases of road crashes annually. Road crashes have been a major cause of death and injury in Thailand. The trend of accident occurrences and number of fatalities between 1987 and 2005 are shown in Figure 1. As shown in Figure 1, the number of road crashes can be seen to rise from 24,132 cases in 1987 to 102,610 in 1994; dropping to 67,800 in 1999 and surge to 122,040 in 2005, in line with the economic recovery. While the number of fatalities were on an increasing trend starting from 8,589 in year 1987 to peak at 16,727 (1.91 deaths per hour) in 1995. After peaking, the number of fatalities declined to 12,858 (1.47 deaths per hour) in 2005.
Journal of the Eastern Asia Society for Transportation Studies, Vol. 7, 2007
2891
Figure 1 Trend in traffic accident occurrences and fatalities
(Source: Taneerananon, 2006) 2. ACCIDENT COSTING STUDY In 1995, TRL (1995) described two main approaches used in determining the cost of traffic accidents which are the Human Capital Approach (HC) and Willingness to Pay Approach (WTP). The former is based on the value of a person in the economic production process and that to prevent a crash will lead to saving of the potential loss in productivity incurred when that person is killed or injured. The approach has been widely used in developing countries as it is relatively simple to calculate compared to the WTP approach which is commonly used in developed countries. The method (with sums added to reflect pain, grief and suffering of those involved and their loved ones) could be considered as the natural starting point for developing countries. The major limitation encountered is data availability and data integrity. The WTP is based on an individual’s assessment of their crash risk and what they are prepared to pay to reduce or minimize this risk. Using this method, the average cost of a fatal crash was up to four times greater than in those countries which made little or no allowance for human emotion costs. Even when correcting for the effect of standard of living, costs were still two to three times greater. However, this method could be very difficult to use in developing countries, as it is based on the completion of complex questionnaires, which relate to perceived risk and payment by individuals to avoid a given (hypothetical) level of risk. Various recent studies of economic costs of traffic accident are summarized together with the approaches used in a number of countries as shown in Table 1. DFID (2003) has recently published guidelines for estimating the cost of road crashes in developing countries (DFID Project R7780). In the guidelines, the HC method was recommended for use in developing countries, with sums added to reflect the human emotion costs which take account of pain, grief and suffering of the people involved. It is clear that the major limitation encountered is data availability and data integrity. Therefore, to look for a guiding framework for the development of a road crash costing system for Thailand, it has been decided to look closely at a system operating in a highly developed country, Australia in this case, then examine the issues that are relevant to Thailand.
Journal of the Eastern Asia Society for Transportation Studies, Vol. 7, 2007
2892
Table 1 Costing methods and estimates of economic costs of traffic accidents
Source: Mohan (2002) Literature reviewed by Suwanrada et al. (2005) indicates that there are a number of previous studies on the analysis of traffic accident costing in Thailand. Virtually all of these have adopted the human capital approach in estimating the losses. Costing for Thailand include studies by Patamasiriwat (1994), Tosutho (1997), Boontam (2001), Luathep and Tanaboriboon (2005), and ADB (2005. Studies limited to road accidents in Bangkok include those by Komnamoon (1979), Promglam (1998), Kradang-Nga (1999), and Sumiratana (1996). Other studies, such as Chanchareon et al. (1993) and Kunaratanapruek et al. (1995), focus on only medical costs of road accidents. The time period, level of data, and type of losses in these research studies are summarized in Table 2. As shown in Table 2, the latter studies attempted to cover all related cost components such as emergency medical cost, administration costs from either police or insurance system, and human cost which reflects pain, grief, and suffering of victims and their family. However, this human cost was estimated by using the recommended percentage figures from United Kingdom which do not reflect the real human cost of Thai road victims. Furthermore, there is an important contributing factors in traffic accident cost which have not been yet studied in Thailand, they are travel delay costs as a result of a traffic accident, and long term care costs for the disabled. Taking into account the issues mentioned, this study sets out to determine traffic accident costs in Thailand, using the HC method.
Journal of the Eastern Asia Society for Transportation Studies, Vol. 7, 2007
2893
Table 2 Previous traffic accident costing studies for Thailand Previous Studies Studied Year Cost Components Total Cost
(million baht) Patamasiriwat (1994)
1992 1. Lost output of the dead 2. Reduced output of the disabled 3. Medical cost 4. Lost output in taking care of the injured 5. Property damage
69,652.2
Tosutho (1997) 1995 1. Medical cost 2. Property damage 3. Lost income 4. Loss of the injured, disabled, and families
14,650
Boontam (2001) 2001 Lost output by fatality 18,694-37,529 ADB (2004) 2002 1. Medical cost
2. Lost output by death and injury 3. Property damage 4. Insurance administrative cost 5. Emergency medical cost 6. Human cost
115,932
Luathep and Tanaboriboon (2005)
2002 1. Medical cost 2. Lost output by death and injury 3. Property damage 4. Insurance and police administrative cost 5. Emergency medical cost 6. Human cost
140,000
Suwanrada et al. (2005)
2002 1. Lost output by death 2. Lost output by injury and disability 3. Lost output by care taking for the injured and
the disabled 4. Medical cost 5. Property damage 6. Human cost
85,856-134,197
Source: Modified from Suwanrada et al. (2005), Luathep and Tanaboriboon (2005) 3. SCOPE OF THE STUDY This paper describes the interim results of Thailand traffic accident costing by the HC method which has been widely used in developing countries as it is relatively simple to calculate compared to the WTP approach which is commonly used in developed countries. Five provinces with reliable of accident data have been selected as representative provinces for the north-eastern, northern, middle, southern region and the capital of Thailand. They are Khon Kaen, Lampang, Nakhonsawan, Songkhla, and Bangkok, respectively. These five selected provinces are shown in Figure 2. In this study, the cost components are grouped into three categories: first, the human cost category which consists of loss of productivity, medical treatment, long term care, quality of life and emergency service, second, the property damage cost category comprising of vehicle and non-vehicle damage, and third, the general traffic accident cost category consisting of insurance administration, police administration, judicial system, emergency rescue service and travel delay. The grouping of cost components is illustrated in Figure 3.
Journal of the Eastern Asia Society for Transportation Studies, Vol. 7, 2007
2894
Figure 2 Five pilot provinces for studying of traffic accident costs in Thailand
(Source: GuidetoThailand.com, 2006)
Human Capital Approach
Human Costs Category
Loss of Productivity Costs
Quality of Life Costs
Medical Costs
EMS. Costs
Long Term Care Costs
Property Damage Costs Category
Vehicle Damage Costs
Non-Vehicle Damage Costs
General Crash Costs Category
Insurance Administration
Police Administration
Judicial System Costs
ERS. Costs
Travel Delay Costs
Figure 3 Grouping of the cost components by HC approach
All three groups of cost component are further described in the next section.
Journal of the Eastern Asia Society for Transportation Studies, Vol. 7, 2007
2895
4. COST COMPONENTS As mentioned earlier three cost categories are classified in this study, the details can be described as follows: 4.1 Human Cost Category 4.1.1 Loss of Productivity Cost Loss of productivity is the losses from those affected by traffic accidents. This study adopts the approach in which a series of income is estimated by a wage function. Specifically, the wage function constructed by Suwanrada et al. (2005) are applied and using the statistics reported by National Statistical Office (NSO) to calculate foregone income. Four cases are identified for loss of productivity which are fatality, serious injuries both with and without associated disabilities, slight injuries, and those relatives and friends who take care of the injured and the disabled To calculate future income, this study assumes, as in Suwanrada et al. (2005), that wages increase with the age of a wage earner at the same rate as economic growth. Since it is expected that the long-term economic growth for Thailand ranges from 4% to 6% per year (BOT, 2005), the base case for wage increase is set at 5% per year, with the low case of 4% and the high case of 6%. The discount rate is assumed to be 6% per year. The retiring age is set at 65 to reflect a longer working life in recent years. As for data on the number of working day losses and work efficiency reductions, this study relies heavily on the database on accident patients, namely Injury Surveillance (IS) database, maintained by the central hospitals in Khon Kaen, Lampong, Nakornsawan and Hatyai, as well as data from interviews with a sample of patients. Preliminary data from the hospitals indicate that in 2004 the average hospital stay ranges from 10 to 12 days for serious injuries and 1 day for slight injuries. In our subsequent surveys and interviews, questions were asked about the types and severity of disabilities, the effect on work ability, and the need by the disabled for care taking by relatives and others. 4.1.2 Loss of Quality of Life Cost The loss of quality of life or human cost reflects pain, grief, and suffering experienced by victims of road crashes, and by their families and friends. This study estimates this cost component by conducting in-depth interviews with those who are involved in road accidents. In addition, the interviews also include legal experts (lawyers, prosecutors, judges, and academicians), insurance personnel (insurance company staff and social security officials), and politicians both local and national. The results can be summarized in Table 3.
Table 3 Quality of life costs from the interviews Quality of Life Costs as Percentage of Total Human Costs Interviewees Fatality Disability Serious Injury Slight Injury
Journal of the Eastern Asia Society for Transportation Studies, Vol. 7, 2007
2896
4.1.3 Medical Cost The medical and hospital costs include in-hospital patient costs covering operations, x-rays, medicines, doctor services, food and bed etc., and out-hospital patient costs, rehabilitation costs, prosthetic costs. This study also attempted to deeply investigate the hospital and medical cost in practical works from the central hospital in five selected provinces. 4.1.4 EMS Cost The Emergency Medical Service or EMS costs are those associated with emergency medical services, which cover the labor cost (wage and overtime of rescue team and staff), material cost (office materials, medical supplies, fuel and maintenance cost), capital cost (command control center, vehicle parking and garage, EMS room, ambulances and tools, durable articles) as well as overhead cost. The EMS costs in this study were obtained from data survey and collection of EMS units in five provinces. 4.1.5 Long Term Care Costs Long-term medical and rehabilitation cost is incurred from the year of the accident through to the year of death. For disabilities caused by road accidents, the costs of long-term care are divided into two parts, the cost in terms of lost output by those relatives and friends who spend time taking care of the disabled, both working and non-working and the long-term medical and rehabilitation cost. It is assumed that the average medical cost in real terms is the same for each year. However, the nominal cost will be adjusted by 3.5% annually, based on the average annual increase in expenses on personal medical care found in the consumer price index survey between 1990 and 2004 (BOT, 2005). With the discount rate of 6%, the formula for the long-term medical cost calculation of each age group is shown in equation 1.
( )( )∑
= ++
=T
tt
t
A rgML
0 11 (1)
Where AL = long-term medical cost of a person at the age of A
M = average annual medical cost for one disabled person in 2004 g = annual increase rate of the medical cost, set at 3.5%
r = discount rate, set at 6% T = difference between life expectancy and age during the accident
4.2 Property Damage Cost Category 4.2.1 Vehicle Damage Cost The appropriate way to determine the average cost per damaged vehicle is to gather information from insurance companies. The information is based on each case of vehicle damage classified by vehicle type and severity of crash (i.e. according to fatal, serious, slight, and PDO), in an each single crash. However, in case there is a limitation to access the insurance database, the total costs of damaged vehicles classified by vehicle type and severity of crash as well as the total number of damaged vehicles obtained from both insurance company and repairing shop questionnaire surveys were used to determine the average cost per damaged vehicle. The average cost per damaged vehicle are classified by four severities and 16 vehicles types based on the vehicle
Journal of the Eastern Asia Society for Transportation Studies, Vol. 7, 2007
2897
types reported by the police. Furthermore, the average number of each type of vehicle damaged in each crash can be obtained by manually collecting from the police accident records. Finally, multiplying those figures with the costs per damaged vehicle, the final average vehicle damage cost per crash by severity can be determined. 4.2.2 Non-Vehicle Damage Costs The cost of public roadside property or furniture damages are acquired from the Department of Highways’ database files. Therefore, the average costs of 9 types of road furniture damaged in each crash can be estimated. Subsequently, by multiplying the average number of each type of road furniture damaged in each crash with the average cost per damaged road furniture, the final average road furniture damage cost per crash severity can be determined. 4.3 General Crash Cost Category 4.3.1 Insurance Administration Costs In fact, there are two main categories of insurance system to protect the road victims in any road crash, compulsory motor insurance and voluntary motor insurance. Firstly, the compulsory motor insurance is the formal name of the Protection for Motor Vehicle Victims Act B.E.2535 (1992) which protects losses of any injury or losses of life from road crashes. However, this law only protects the losses of life, bodily harm and heath harm excluding motor vehicle repair. Secondly, the voluntary motor insurance which is additional protection also covers and responds to all costs including the damages of vehicles depending on the different premium values. Regarding to annual report published by Department of Insurance (2004), it shows that the number of insurance claims are 15,435,522 claims and 3,377,486 claims for compulsory motor insurance and motor insurance, respectively. This reveals the fact that the ratio of these two insurance claim system are 4.57: 1. This study presents the number of insurance claims considering all vehicle fleets involved in the crashes are under the compulsory and voluntary insurance system by applying the mentioned figures together with all estimated numbers of crashes by the level of severities, finally, the number of insurance claims classified by severity are determined. The information on the amount of staff work are obtained from the interview and statistical data. All staff time have to be identified in man-month unit which indicates the amount of average claims/cases per staff per month including commission fee, transportation expenditures, communication expenditures. From all the available information, the cost of insurance administration can be determined. However, this figure needs to be adjusted regarding those crashes processed by the insurance. Therefore, the statistics of insurance claims can classified by crash severity types from available information. By using this figure, the final average cost of insurance administration can be determined. 4.3.2 Police Administration Costs In general, the Royal Thai Police summarizes and publishes the statistics of reported crimes and road traffic accidents annually. In addition, for the provincial road crash statistics, the Provincial Police also reports these mentioned data. Therefore, this study collected the number of attendances by police personnel from provincial police stations in five study areas to find the relationship in the number of police cases by severity.
Journal of the Eastern Asia Society for Transportation Studies, Vol. 7, 2007
2898
Also, to identify average amount of staff-service time, the information on the amount of staff work, the information are gathered from interview survey and annual records from the mentioned police stations. 4.3.3 Judicial System Costs In general, traffic accident is one of the categories under criminal crimes. Two judicial court offices deal with the road traffic accident cases; they are attorney court and judicial court offices. Therefore, the expenditures of these two courts are similarly classified into three categories thus labor cost, material cost, together with capital cost. However, it is difficult to obtain the actual number of road traffic accidents litigated by the court which are classified by four severities. This study, therefore, makes an effort to collect all information from available related sources. Moreover, the number of crash cases by severity which are pursued in the court, are collected (and used to adjust) to determine the average legal and court costs by crash severity. However, these information are collected from lawyers, civil courts and provincial courts in selected provinces under this study. 4.3.4 Emergency Rescue Service (ERS) Costs In Thailand, there are many private foundations which assist the road crash victims at the scene of the accident. These foundations are well organized in their work and often they will be at the crash site before an ambulance or a police officer arrives. They work closely with police and hospitals. They work on a voluntary basis but have their own emergency vehicles and well trained volunteering staff. Funding mostly comes from public donations and government support on a case by case basis. Due to the limitations in gathering the ERS cost data, the researchers only collected the expenses of supporting road traffic accident rescues from well-known foundations in selected provinces. 4.3.5 Travel Delay Costs Travel delay cost is the cost incurred to travelers from the delay caused by traffic accidents. This cause may partially or fully block the carriageway. Even if there is no blockage, some drivers may reduce speed or may stop to offer assistance. After-accident investigations and clean-ups would also restrict traffic flow. Such delays result in costs as time is lost in traffic. According to Bureau of Transport Economics (2000), three factors are found to affect traffic accident travel delay cost which are level of road blockage, traffic flow conditions, and clearance and emergency response time. The level of road blockage is dependent on accident severity and road types. Traffic flow conditions are determined by time of the day and road types. Clearance time is dependent on accident severity. These mention factors are adopted to determine the travel delay cost. In order to perform the travel delay cost analysis, accident data addressing issues of location, frequency, clearance time of the crash, traffic flow, and level of blockage of the road need to be collected. As occurrence of an accident is random, there is no practical way to observe and collect the primary accident data as the accident is occurring. Therefore, secondary data regarding events that have previously occurred must be used for various analyses. After getting the travel time lost, the travel delay cost can be calculated from equation 2.
Journal of the Eastern Asia Society for Transportation Studies, Vol. 7, 2007
2899
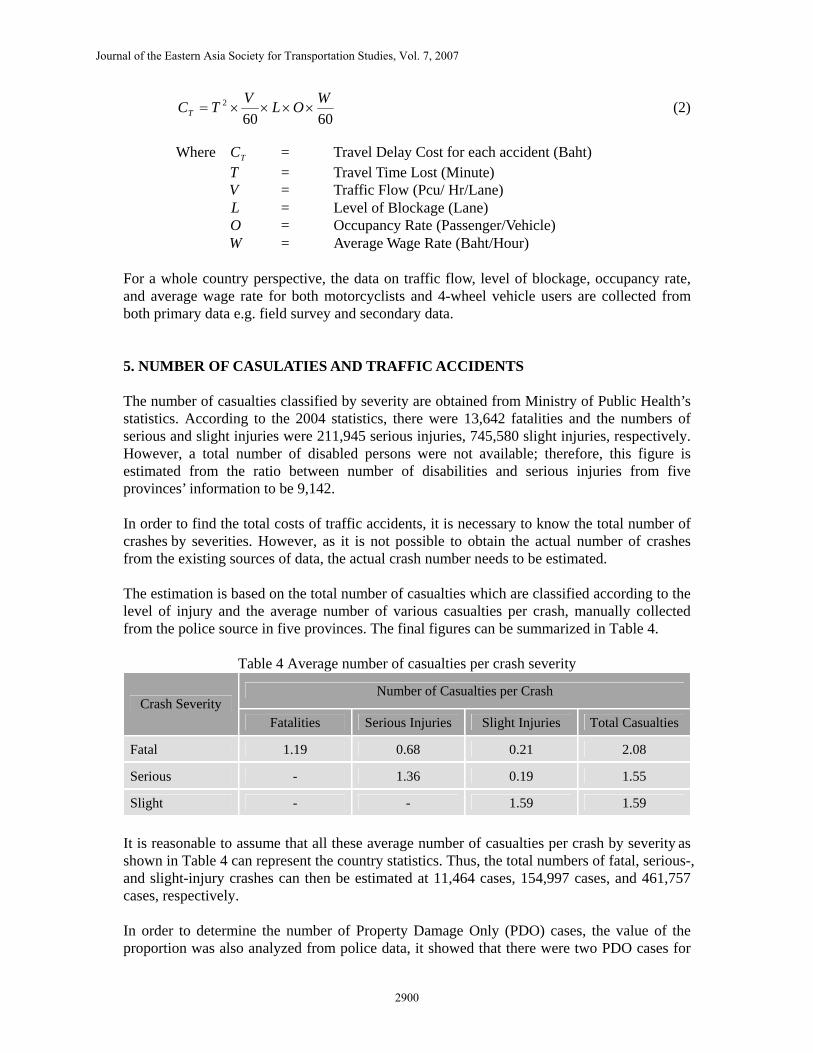
60602 WOLVTCT ××××= (2)
Where TC = Travel Delay Cost for each accident (Baht) T = Travel Time Lost (Minute) V = Traffic Flow (Pcu/ Hr/Lane) L = Level of Blockage (Lane) O = Occupancy Rate (Passenger/Vehicle) W = Average Wage Rate (Baht/Hour) For a whole country perspective, the data on traffic flow, level of blockage, occupancy rate, and average wage rate for both motorcyclists and 4-wheel vehicle users are collected from both primary data e.g. field survey and secondary data. 5. NUMBER OF CASULATIES AND TRAFFIC ACCIDENTS The number of casualties classified by severity are obtained from Ministry of Public Health’s statistics. According to the 2004 statistics, there were 13,642 fatalities and the numbers of serious and slight injuries were 211,945 serious injuries, 745,580 slight injuries, respectively. However, a total number of disabled persons were not available; therefore, this figure is estimated from the ratio between number of disabilities and serious injuries from five provinces’ information to be 9,142. In order to find the total costs of traffic accidents, it is necessary to know the total number of crashes by severities. However, as it is not possible to obtain the actual number of crashes from the existing sources of data, the actual crash number needs to be estimated. The estimation is based on the total number of casualties which are classified according to the level of injury and the average number of various casualties per crash, manually collected from the police source in five provinces. The final figures can be summarized in Table 4.
Table 4 Average number of casualties per crash severity
Number of Casualties per Crash Crash Severity
Fatalities Serious Injuries Slight Injuries Total Casualties
Fatal 1.19 0.68 0.21 2.08
Serious - 1.36 0.19 1.55
Slight - - 1.59 1.59
It is reasonable to assume that all these average number of casualties per crash by severity as shown in Table 4 can represent the country statistics. Thus, the total numbers of fatal, serious-, and slight-injury crashes can then be estimated at 11,464 cases, 154,997 cases, and 461,757 cases, respectively. In order to determine the number of Property Damage Only (PDO) cases, the value of the proportion was also analyzed from police data, it showed that there were two PDO cases for
Journal of the Eastern Asia Society for Transportation Studies, Vol. 7, 2007
2900
every slight injury case. Therefore, the number of PDO crashes are determined to be 923,514 cases. 6. THAILAND ACCIDENT COSTING MODEL 6.1 Accident Costing Model The traffic accident costs by the HC Approach can be calculated from the equation below:
Total Traffic Accident Costs CBA ++= (3) The total costs consist of three categories of cost components as follows:
Human Costs Category, (A) 54321 AAAAA ++++= (4)
Property Damage Costs Category, (B) 21 BB += (5)
General Crash Costs Category,(C) 54321 CCCCC ++++= (6)
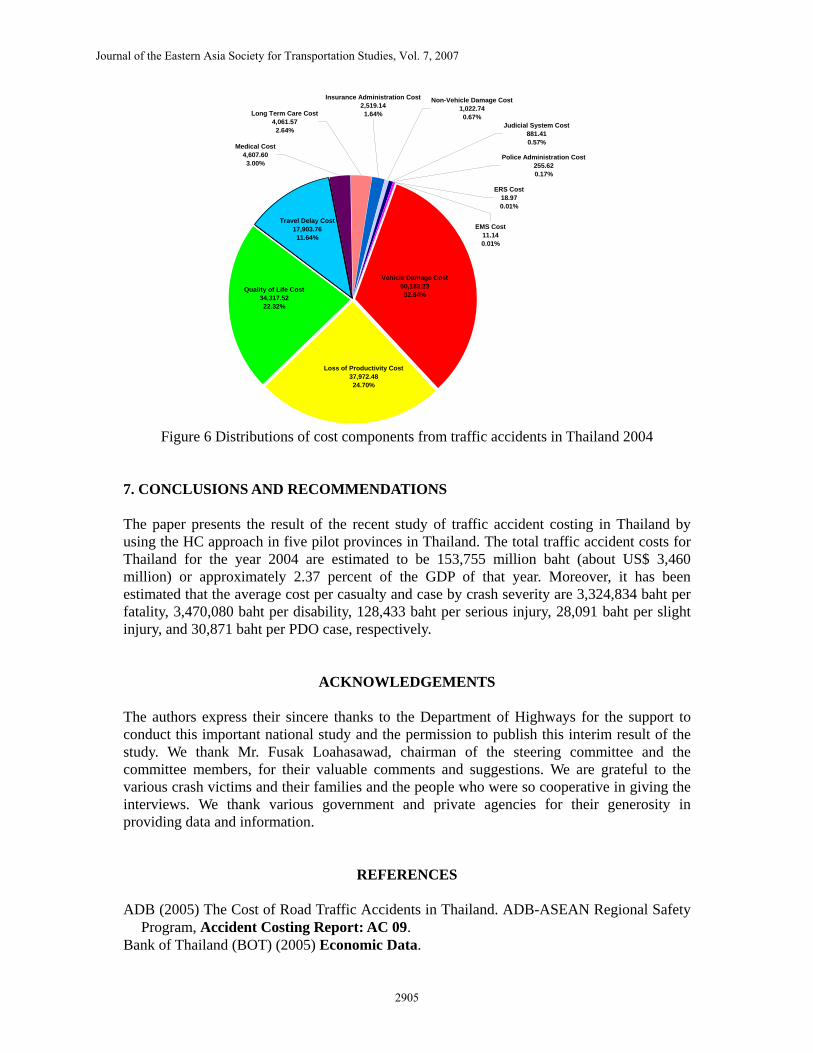
The details of these cost components are summarized in Table 5 6.2 Traffic Accident Cost in Thailand Using the model as shown in Table 5, the amount related to the human, the vehicle and non-vehicle, and general costs can be computed, the results are shown in Table 6. Once the average cost per casualty and cost per case by severity can be determined by dividing the total cost by the number of total number of casualties and cases by severity, the results can be summarized in Table 7. The distribution of total costs classified by three cost categories is shown in Figure 4, when the sharing of total costs from traffic accident classified by severity is shown Figure 5. Finally, all cost components can be illustrated the significant allocation as shown Figure 6.
Journal of the Eastern Asia Society for Transportation Studies, Vol. 7, 2007
2901
Table 5 Details of all cost components in the Thailand accident costing model
Cost Element
Estimating Formula
Loss of Productivity (A1)
1) Lost of productivity in term of income loss from fatalities = [No. fatalities by age range] x [foregone income] 2) Lost of productivity in term of income loss from serious injuries to disabilities (no work) = [No. serious injuries to disabilities by age range] x [foregone income, if abilities can not work] 3) Lost output in terms of income loss from serious injuries to disabilities (work) = [No. serious injuries to disabilities by age range] x [foregone income, if abilities can work] * Assume effectiveness reduced by 30% 4) Lost output in terms of income loss from injuries = [No. of injuries]severity x [No. of day in Hospital] x [average wage per day] 5) Lost output in terms of income loss involving those relatives and friends who take care of the injured and the disabled = [No. of injuries]severity x [No. of day to take care] x [average wage per day] * No. of carer to injury = 1:1
Quality of Life Costs (A2)
Total quality of life costs = [No. of crashes]severity x [estimated added percentage of quality of life costs]severity
Medical Costs (A3) Total medical costs = [No. of casualties]severity x [average hospitalization expenses]severity
EMS Costs (A4) Total EMS costs = [No. of EMS cases]severity x [average EMS costs]severity
Cat
egor
y A
Long Term Care Costs (A5)
Total Long Term Care Costs = [No. of disabilities] x [average the long-term medical and rehabilitation cost + average the cost in terms of lost output by those relatives and friends who spend time taking care of the disabled, both working and non-working]
Vehicle Damage Costs (B1)
Total vehicle damage costs = [No. of crashes]severity x [average vehicle damage costs]severity
Cat
egor
y B
Non-Vehicle Damage Costs (B2)
Total non-vehicle damage costs = [No. of crashes]severity x [average non-vehicle damage costs]severity
Insurance Costs (C1) Total insurance administrative costs = [No. of crashes]severity x [average insurance administrative costs]severity
Police Costs (C2) Total police administrative costs = [No. of attendances by police]severity x [average insurance administrative costs]severity
Judicial System Costs (C3)
Total judicial system costs = [No. of attendances by court cases]severity x [average judicial system costs]severity
ERS Costs (C4) Total ERS costs = [No. of ERS cases]severity x [average ERS costs]severity
Cat
egor
y C
Travel Delay Costs (C5)
Total travel delay costs = [No. of crashes]severity x [average travel delay costs]severity
Journal of the Eastern Asia Society for Transportation Studies, Vol. 7, 2007
2902
Table 6 Traffic accident cost in Thailand in the year of 2004 Severities
Figure 4 Distributions of three cost categories from traffic accidents in Thailand 2004
Serious Injuries 27,220.84
17.70% Disabilities 31,723.47
20.63%
Fatalities 45,357.39
29.50%
Slight Injuries 20,944.04
13.62%
PDO Cases 28,509.45
18.54%
Figure 5 Distributions total traffic accident costs classified by severity in Thailand 2004
Journal of the Eastern Asia Society for Transportation Studies, Vol. 7, 2007
2904
Quality of Life Cost 34,317.52
22.32%
Loss of Productivity Cost 37,972.48
24.70%
Vehicle Damage Cost 50,183.23
32.64%
Insurance Administration Cost 2,519.14
1.64%
ERS Cost 18.97 0.01%
EMS Cost 11.14 0.01%
Long Term Care Cost 4,061.57
2.64%
Travel Delay Cost 17,903.76
11.64%
Medical Cost 4,607.60
3.00%
Non-Vehicle Damage Cost 1,022.74
0.67%Judicial System Cost
881.41 0.57%
Police Administration Cost 255.62 0.17%
Figure 6 Distributions of cost components from traffic accidents in Thailand 2004
7. CONCLUSIONS AND RECOMMENDATIONS The paper presents the result of the recent study of traffic accident costing in Thailand by using the HC approach in five pilot provinces in Thailand. The total traffic accident costs for Thailand for the year 2004 are estimated to be 153,755 million baht (about US$ 3,460 million) or approximately 2.37 percent of the GDP of that year. Moreover, it has been estimated that the average cost per casualty and case by crash severity are 3,324,834 baht per fatality, 3,470,080 baht per disability, 128,433 baht per serious injury, 28,091 baht per slight injury, and 30,871 baht per PDO case, respectively.
ACKNOWLEDGEMENTS
The authors express their sincere thanks to the Department of Highways for the support to conduct this important national study and the permission to publish this interim result of the study. We thank Mr. Fusak Loahasawad, chairman of the steering committee and the committee members, for their valuable comments and suggestions. We are grateful to the various crash victims and their families and the people who were so cooperative in giving the interviews. We thank various government and private agencies for their generosity in providing data and information.
REFERENCES ADB (2005) The Cost of Road Traffic Accidents in Thailand. ADB-ASEAN Regional Safety
Program, Accident Costing Report: AC 09. Bank of Thailand (BOT) (2005) Economic Data.
Journal of the Eastern Asia Society for Transportation Studies, Vol. 7, 2007
2905
Available from: http://www.bot.or.th/BOThomepage/databank/EconData/EconData_e.htm [2006, October 3]
Bank of Thailand (2005) Thailand’s Key Economic Indicators. Available from: http://www.bot.or.th/BOThomepage/DataBank/EconData/Thai_Key/ Thai_KeyE.asp [2006, November 12]
Bureau of Traffic Safety (2005) Traffic Accident on National Highways 2004. Department of Highways, Ministry of Transport, Thailand
Bureau of Transport Economics (2000) Road Crash Costs in Australia. Commonwealth of Australia 2000, Report 102
Department of Insurance (2005) Statistics Data of Insurance Business. Available from: http://www.doi.go.th/stat_data/eng-version/eStat_of_Non-Life_Yearly.htm [2006, October 3]
Department of International Development (DFID) (2003) Guidelines for Estimating the Cost of Road Crashes in Developing Countries. Project R7780.
Guide toThailand.com (2006) Map of Thailand. Available from: http://www.guidetothailand.com [2006, December 13]
Komnamoon, P. (1979) Cost of Road Traffic Accidents: A Case Study of Bangkok Metropolitan (in Thai). Master Thesis, Chulalongkorn University.
Luathep, P. and Tanaboriboon, Y. (2005) Determination of Economic Losses due to Road Crashes in Thailand, Journal of the Eastern Asia Society for Transportation Studies (EASTS), Vol.6, pp.3413-3425, Bangkok, Thailand.
Ministry of Interior (1979) Land Traffic Act B.E. 2522 (in Thai). Thailand. Ministry of Public Health (2005) Accident and Disaster Statistics in Thailand 2004 (in
Thai). Mohan, D. (2002) Social Cost of Road Traffic Crashes in India, Proceedings of the First
Safe Community on Cost of Injury, Viborg, Denmark, October 2002, pp 33-38. Royal Thai Police (2005) Traffic Accident Statistics in 2004 (in Thai).
Available from: http://www.police.go.th/statistic/traff_main.htm [2006, November 12] Suwanrada et al. (2005) The Cost of Road Accidents in Thailand: An Analysis of the
Efficiency of Road Safety Budget and Risk Behavior by Road Users (in Thai). Submitted to the Office of Thai Health Promotion Foundation.
Taneerananon, P. (2006) Engineering Safer Roads, in Thai, Limbrother Publisher, Songkhla, Thailand.
TRL (1995) Overseas Road Note 10, Costing Road Accidents in Developing Counties. Transport Research Laboratory, Crowthorne.
Journal of the Eastern Asia Society for Transportation Studies, Vol. 7, 2007