81
T.C. BAHÇEŞEHİR UNIVERSITY CAPACITY ANALYSIS OF D-BLOCK ELEVATORS AND DEVELOPING ALTERNATIVE OPERATION POLICIES Capstone Project 2 Ceyhun Ercan Ali Yılmaz
| Date post: | 28-Dec-2015 |
| Category: |
Documents |
| Upload: | ceyhun-ercan |
| View: | 98 times |
| Download: | 1 times |
T.C.BAHÇEŞEHİR UNIVERSITY
CAPACITY ANALYSIS OF D-BLOCK ELEVATORS AND DEVELOPING ALTERNATIVE OPERATION
POLICIES
Capstone Project 2
Ceyhun Ercan
Ali Yılmaz
İSTANBUL, 2014


T.C.BAHÇEŞEHİR UNIVERSITY
FACULTY OF ENGINEERING
DEPARTMENT OF INDUSTRIAL ENGINEERING
CAPACITY ANALYSIS OF D-BLOCK ELEVATORS AND DEVELOPING ALTERNATIVE OPERATION
POLICIES
Capstone Project 2
Ceyhun Ercan
Ali Yılmaz
Advisor: Prof.Dr. Erkan Bayraktar
Dr. Adnan Çorum
İSTANBUL, 2014
T.C.BAHÇEŞEHİR UNIVERSITY
FACULTY OF ENGINEERING
DEPARTMENT OF INDUSTRIAL ENGINEERING
Name of the project: Capacity Analysis of D-Block Elevators and Developing Alternative Operation Policies
Name/Last Name of the Student: Ceyhun Ercan,Ali Yılmaz
Date of Thesis Defense: 22/05/2014-23/05/2014
I hereby state that the graduation project prepared by Your Name (Title Format) has been completed under my supervision. I accept this work as a “Graduation Project”.
/ /Adnan Corum (Dr.)
I hereby state that I have examined this graduation project by Your Name (Title Format) which is accepted by his supervisor. This work is acceptable as a graduation project and the student is eligible to take the graduation project examination.
/ /Erkan Bayraktar(Prof. Dr.)
Head of the Department of Industrial Engineering
We hereby state that we have held the graduation examination of Your Name and agree that the student has satisfied all requirements.
THE EXAMINATION COMMITTEE
Committee Member Signature
1. …………………………. ………………………..
2. ………………………….. ………………………..
3. ………………………….. ………………………..

ii
ACADEMIC HONESTY PLEDGE
In keeping with Bahçeşehir University Student Code of Conduct, I pledge that this work is
my own and that I have not received inappropriate assistance in its preparation.
I further declare that all resources in print or on the web are explicitly cited.
NAME DATE SIGNATURE
Ali YILMAZ 20/05/2014
Ceyhun ERCAN 20/05/2014
iii
ABSTRACT
CAPACITY ANALYSIS OF D-BLOCK ELEVATORS AND DEVELOPING ALTERNATIVE OPERATION POLICIES
Ceyhun ErcanAli Yılmaz
Faculty of EngineeringDepartment of Industrial Engineering
Advisor: Prof.Dr. Erkan Bayraktar Dr. Adnan Çorum
MAY, 2014, 58 Pages
This dissertation is written to determine the problems of the elevator usage in D
Block and to decide on a method to solve these problems. Firstly, problems are addressed
from all aspects and detailed elevator traffic is calculated. Then, the suitable simulation
program for the solution has been designed with the collected data. Consequently, the
conventional simulation application emerged. The effects of the detected problems are
deeply analysed in the Elevate simulation program which is an advanced program that is
universally recognised and used only by few people in Turkey.
Key Words: Capacity Analysis of Elevators,System of Elevators, Simulation of Elevators, Traffic Calculation,Utilization of Elevator, Effects of Waiting
iv
ÖZET
D BLOK’DA YER ALAN ASANSÖRLERİN KAPASİTE ANALİZİ VE ALTERNATİF ÇÖZÜM ÖNERİLERİNİN GELİŞTİRİLMESİ
Ceyhun Ercan,Ali Yılmaz
Mühendislik FakültesiEndüstri Mühendisliği Bölümü
Tez Danışmanı: Prof.Dr. Erkan Bayraktar Dr. Adnan Çorum
MAYIS, 2014, 58 Sayfa
Bu çalışma , D Bloktaki asansörlerinin kullanımındaki problemleri belirlemek ve
bu problemlerin çözümüne yönelik karar vermek için yapılmıştır. Çalışmada öncelikle
problem tüm yönleriyle ele alınmış , detaylı trafik hesabı yapılmıştır. Çözüm için uygun
simülasyon programı belirlenmiş toplanan datalar ile konvansiyonel simülasyon
uygulaması gerçekleştirilmiştir.Elde edilen sonuçların bekleme süresi üzerindeki etkileri
detaylı şekilde incelenerek çözüme yönelik uygun bir karar almak amaçlanmıştır.
Kullanılan simülasyon uygulaması Elevate programı olup , bu program asansör
simülasyonları üzerine Dünya’da çok yaygın olan ve en gelişmiş programlardan olup
Türkiye’de sınırlı kişinin kullanabildiği bir programdır.
Anahtar Kelimeler: Kapasite Analizi,Simülasyon Uygulaması,Asannsör Sistemleri,Asansörlerin Trafik Hesabı, Asansörlerin Kullanımı, Beklemenin Etkisi
v
TABLE OF CONTENTS
ABSTRACT..........................................................................................................................iii
ÖZET.....................................................................................................................................iv
TABLE OF CONTENTS.......................................................................................................v
LIST OF FIGURES...............................................................................................................vi
LIST OF ABBREVIATIONS..............................................................................................vii
1. INTRODUCTION..............................................................................................................1
2. LITERATURE REVIEW...................................................................................................2
3.MATERIALS AND METHODS(METHADOLOGY)…………………………………..8
3.1PROBLEM DEFINITION…………….…………………………………………..8
3.1.1 Survey………………………………………………………………………8
3.1.2 Traffic Calculation………………………………………………………..12
3.2. PROCEDURE (HOW TO SOLVE THE PROBLEM)…………………………18
3.3 COLLECT DATA AND ANALYSIS OF DATA………………………………20
3.4 SIMULATION OF CURRENT SITUATION AND SOLUTION WAYS……
26
4RESULTS AND.CONCLUSION……………………………………………………….39
5.ACKNOWLEDGEMENTS……………………………………………………………..40
REFERENCES…………………………………………………………………………….41
APPENDIX A…………………………………………………………………………… 43
APPENDIX B.......................................................................................................................48

vi
LIST OF FIGURES
Figure 1. Bahcesehir University………………………………………………..i
Figure 2. Logo of Bahcesehir University………………………………………ii
1. INTRODUCTION
The density of people and loads in motion, and elapsed time during moving of
people and loads from one place to another are important. Therefore, today, the usage of
elevators matters in the places where the capacity of population is high. Apparently,
Beşiktaş Campus of our university has become an area in which the density of people has
been gradually increasing every day. One of the busiest buildings in the campus is D Block
where is the common area shared by the faculty of engineering and the faculty of law.
There are three elevators in D Block; two of them are located at the left-hand side
and the other is at the right. Three of them intensively work depending on the extra
population in the building within a day. The density of people using elevators and the
circulation of loads shows an alteration depending on many different factors such as the
floors where the academic units, other educational areas, terrace and the elevators –one at
the right and a double-door lift at the left – are located. For example, the double-door
elevator at the left is more actively preferred and used than the one at the right.
It is obvious that the elevators in D Block could not take the whole pressure of
intensive functioning and could not prove a useful work. This report has been written to
present the problematical usage of the elevators in D Block with regard to statements of
users and real time data; to suggest an alternative solution by determining the problems in
all dimensions; and to make a simulation by analysing this solution suggestion.
Two essential factors have been examined while structuring the project. These
factors are related to the technical capacity of the elevator –physically and the psychology
of users. While drawing the capacity problem, real time data had been used, so that the
presence of the problem was computationally proven with the user and load traffic. The
problem was also examined in terms of user psychology, in relation to that a detailed
survey was conducted, and then the results of the survey was analysed and particularly
elaborated in the ‘Effect of Waiting’ argument placed in the literature review.
1
In the first part of the Project, you will respectively find the literature review
including relevant previous researches and studies at a glance, definition of the problem
and the approach to the problem. Afterwards, the first part will be completed with the
potential solution proposals. In the second part, you will find the quantitative analysis of
the operation decision which was thought intended the solution of the density problem;
calculation and application of the simulation; and lastly the calculation of human and load
traffic. In the third and last part, there will be placed conclusion, appendix and references.
2. LITERATURE REVIEW
To begin with, regarding the capacity of the elevators, a review of previous studies
and researches has to be done. In the light of some of these researches that we particularly
chose, in order to constitute an appropriate operation policy and to gauge the capacity of
the elevators in D Block, we have made an analysis mainly based on two kinds of texts:
discussions on balanced traffic model to use in the analysis of the elevator capacity, and
certain articles giving a technical background for the potential simulation which will be
developed to the operation system after the capacity analysis. Lastly, another point we
have considered in this case is the “psychology effect of waiting” and relating other
discussion that we reached through using this concept as keyword in the review.
For a sufficient carrying capacity and passengers’ comfort and convenience, it is
very important to carefully design suitable elevator systems (e.g., the appropriate number
of cages, velocity, capacity, etc.) using models that describe real elevator movements. The
procedure used in conventional design calculations for office buildings is to determine the
carrying capacity for up-peak traffic situations using simple arrival-passenger models. To
the extent that, in their work of Revised Design Calculations of Elevator Systems (2008),
Maeda Takiiji and Komaya Kiyotishi, closely examine techniques which are used in the
determination of appropriate elevator model for a building. Additionally, they contribute
the studies on the recovery of the current systems and the enhancement of the quality of
service. To be more precise, Takiiji and Kiyotishi discuss in detail new revised design
calculations using the balanced traffic model, which can deal with elevator movements
considering the passenger arrival rate. As some performance indices to evaluate the quality
2

of service can be calculated by using this model, elevator system designers can now
determine appropriate elevator facilities satisfying goals. In respect to this, with their
comparative method in the measurement of data for a proposed model, they give us an idea
on our possible methodology and the analysis that we made of the ideal traffic model for
the system in our case.
Following the modelling of the elevator systems, in Performance Analysis of an
Elevator System During Up-Peak (2009), Yutae Lee, Tai Suk Kimb, Ho-Shin Choc and
Bong Dae Choi mainly focus on the waiting period and the optimisation of the round trip
periods. In addition to that, they also address the Queuing Analysis and add it to the other
factors that constitute the traffic in an elevator system such as passenger number, elevator
round-trip time, passenger waiting time, passenger ride time and passenger journey time.
In the light of Lee, Kimb, Choc and Dae’s account, we modelled the elevator system in D
Block according to round-trip time whose distribution strongly depends on the number of
passengers waiting at the lobby and the distributive function of the queue as well as the
number of stops, the journey time, the ride time and the highest reversal floor.
Concordantly, in her thesis named Analysis of An Elevator System During Up-peak
- An Application of Queuing Theory (2013), Marianne Deknudt supports our analysis
through her mathematical model for an elevator system which is represented by a discrete-
time queuing system with batch service. The term batch indicates that more than one
customer can be served simultaneously. According to the Queuing Theory, elevator is
described during the up-peak which means that customers only arrive at the ground floor
and go to higher floors, so that customers cannot join the server during a service cycle.
Deknudt aims in this project to evaluate the average time that a customer spends while
waiting for/using the elevator, i.e. from the arrival to the lobby to the reaching at the
destination floor. To do that, she mainly focused on service process and performance and,
used “Probability Generating Functions” (PGF) to facilitate the calculations of the
probability distributions and the technique of “Little’s Law” to measure the performance.
All these techniques and approaches that Deknudt introduces us have been used in the
calculation of traffic and service process in D Block –the subject matter of this thesis.
3
On the other hand, Chang Bum Kim, Kyoung A. Seong, Hyung,Lee-Kwang, Jeong
0. Kim and Yong Bae Lim assert in their paper entitled Fuzzy Approach to Elevator Group
Control System (1995) that in the operation systems of elevator groups, more productive
results are obtained from conventional methods with the fuzzy approach. The elevator
group control systems are the control systems that manage systematically, three or more
elevators in order to efficiently transport the passengers. In the elevator group control
system, the area-weight which determines the load biases of elevators is a control
parameter closely related to the system performance. This correspondence proposes a
fuzzy model based method to determine the area-weight. The proposed method uses a two-
stage fuzzy inference model which is built by the study of area-weight properties and
expert knowledge. The proposed method shows more desirable results than the
conventional method in simulations that use real traffic data. Therefore, in the case study
of this thesis, hall-call assignment method has been also applied to an elevator system by
taking the fuzzy rules into consideration.
Although it may seems as off-topic, Tsung-Che Cihang and Li-Chen Fu make
remarkable contributions to the development of elevator systems in Design of Modern
Elevator Group Control Systems (2005) and emphasize that for a good elevator system,
professionally designed elevator group control system (EGCS) is inevitably necessary. In
this sense, Cihang and Fu offer us a similar work to the Fuzzy Approach, but they claim
that they could design a better EGCS through the “Hall Call Priority Maker” (HCPM)
method that they selected for their work. The rescheduling ability is achieved by this new
mechanism called as HCPM refinement, which is a priority maker for hall calls. The
advantages of our EGCS are shown through extensive simulation results. Based on Cihang
and Fu’s point of view, we make a comparison between our EGCS and the previous one,
which shows that our results are also quite satisfactory and superior.
Nowadays most of the main companies in the vertical transport industry are
researching tools capable of providing support for the design process of elevator systems.
Numerous decisions have to be taken to obtain an accurate, comfortable, and high-quality
service. In this context, the design of decision support tools is becoming a real necessity
4
that most important companies are including as part of their strategic plans. Pablo Cortes,
Jesus Munuzuri and Luis Onieva design on a user-friendly planning and simulating tool for
dynamic vertical traffic in Design Analysis of a Tool for Planning and Simulating Dynamic
Vertical Transport (2011). They investigate a specific program which is called as
“simMP”. With this program they support the planning and design stage of the elevator
system, in order to collaborate in the selection of the type of elevator (number, type of
dynamic, capacity, etc.) and the optimization algorithm. As a result of that, Cortes,
Munuzuri and Oniveal give the “simMP” prominence by focusing on the high quality
service process.
The traditional method of elevator configuration is testing tentatively. So it costs
too much resource and the result is usually dissatisfactory. In this sense, high costs of the
materials used in the conventional elevator configuration parameters drew Qun Zong, Lijan
Wei and Yiju Cheng into a different study in College of Electric and Automotion
Engineering (2004) to solve this problem, so that they examine a new method based on the
“Markov Network Queuing Theory” to build an elevator traffic model. Consequently, by
contrasting the new method with traditional one, they prove that with this new method
more feasible results were obtained in the elevator configuration. On the other side, there
are three other sources that we found useful in different aspects of the elevator
configuration. First one is Heuristic Algorithm to Solve Multi-floor Layout Problem with
the Consideration of Elevator Utilization (2012) by Kenichiro Matsuzaki, Takashi Irohara
and Kazuho Yoshimoto which is based on the increase of the utilization and feasibility of
the elevators, proves certain arguments. The algorithm used in the calculation of the
number of elevators, location of elevators and the capacity of elevators is called as MUSE
(Multi-Story layout algorithm with the consideration of Elevator utilization) that is
preferred to obtain optimum results.
Secondly Takashi Nagatani and Kazuhiro Tobita point the dynamic behaviour of
elevators in Effect of Periodic Inflow on Elevator Traffic (2012). To be more precise, they
observed the factors depending on the movement of elevators and made a prototype of this
movement. Thirdly, Kuo-Ming Chang and Chieh-Li Chen conduct another research on the
enhancement of the performance of elevator services in Real Time Scheduling for Elevator
5
Group Systems (2003). In Chang’s article, a so-called Score Index Assignment (SIA)
approach is proposed to design the real-time scheduling for elevator group systems. The
SIA approach can fit in any different traffic request conditions by tuning the control
(assignment) parameters in the so-called total service evaluation index function of elevator.
In this way certain arguments on alternative solutions for the traffic problem in elevator
systems have been brought forward. So far, we have mentioned two useful approaches
oriented to the solution of problems relating to the operation system and the capacity.
However, we also searched articles and other sources on the possible psychological
dimension of the issue. At that point, there are some available articles and certain studies
which indicate that the key word is “effects of waiting” in this dimension.
Julie Baker observes the effects of the passengers waiting in the queue on the
operation system of elevators in her work entitled as The Effects of the Service
Environment on Affect and Consumer Perception Waiting Time: An integrative review and
research propositions (1996). By doing this, she analyses the relation between time and
environmental factors. Additionally, Shirley Taylor put this issue one step ahead in The
effects of filled waiting time and service provider control over the delay an evaloution of
service (1995) and emphasizes the effects of waiting on passengers between the margins of
time and perception. So much so that, Frederic Bielen and Nathalie Demoulin claim that
“waiting” is the essential issue for the service providers in their article entitled as Waiting
Time Influence on the Satisfaction-loyalty Relationship in Services (2007). As a result of
that effort, they indicate the relation between satisfaction and loyalty among users and then
claim that the most effective way to increase the satisfaction is the decrease of waiting
periods in the service providers. As a last source relating to the psychological dimension,
we take Effects of Actual Waiting Time, Perceived Waiting Time, Information Delivery and
Express Quality on Patient Satisfaction in the Emergency Department (1995) by David
A.Thompson, Paul R.Yarnold and Diana R.Wiliams in which they analysis the waiting
time of patients in a hospital’s emergency room and then they question in detail the effects
of the time on the psychology of patients. Eventually, they reached the result of a direct
relation between two: with the less time to wait, more satisfaction comes up.
6

The traditional assignment approaches for elevator group systems, which are simple
and rough, are only fit for low-rise buildings. Hence, they are not suitable in the high-rise
buildings with complex traffic requests. Therefore, to reveal any potential problem
regarding the capacity analysis of the elevators in D Block, the analysis of traffic
calculation is crucial. All previous studies and researches mentioned above are the system
simulation applications which we partially benefit, mathematical models and the third one
is the Queuing Theory which we have almost never used, but benefited to open a new and
a wider discussion perspective. Real-Time scheduling for elevator group systems (2003) by
Kuo-Ming Chang and Optimization of Group Elevator Scheduling With Advance
Information (2010) by Jin Sun and Qian-Chuan Zhao are the two important articles that
assist us in the quantitative proof of the problem.
However, the essential ones are the article Yukarı Yönde Asansör Trafiği ve
Performans Hesabı (2004) by Prof. Dr. Erdem İmrak from Istanbul Technical University
and the book entitled as Asansörler ve Yürüyen Merdivenler (2010) by İsmail Gerdemeli.
The data used in the traffic calculation are compatible with the British Standards (BS) and
response to many questions from the cabin number in the multiple-floor vertical transport
systems to the highest return floor and average waiting time. All these analysis and studies
have offered us the opportunity to perceive the traffic problem in an elevator system from a
passenger perspective. In this way, we can focus on the question whether these kinds of
problems have an effect on the preference of passengers or not (For instance; does the
waiting influence in preferring the left or right elevator?). Lastly, analysis of these all
abovementioned researches and approaches has enabled us to revise potential problems led
by the solutions we suggest in our study on the elevators in D Block.
7
3.MATERIALS AND METHODS ( METHADOLOGY)
3.1 DEFINITION OF THE PROBLEM
3.1.1 SURVEY
3.1.1.1 Statistical Distributions of Survey Result
3.1.1.2 Analysis of Survey Result
3.1.2 TRAFFIC CALCULATION OF D-BLOCK ELEVATORS
3.2 PROCEDURE (HOW TO SOLVE THE PROBLEM)
3.3 COLLECT DATA AND ANALYSIS OF DATA
Capstone Project 2
3.4 SIMULATION OF CURRENT SITUATION AND SOLUTION WAYS
Capstone Project 2
3.1 PROBLEM DEFINITON
The purpose of this Project is to present an operation policy that is aimed at a more
efficiently usage of the elevators in D Block, as all mentioned in the introduction part. To
do such a Project, the problem itself has to be clearly conceptualized. Therefore, the first
thing to do is to define the problem from various aspects such as a survey study to
investigate the effect of problem on passengers and a traffic calculation to reveal the
capacity problem in the elevator system. As a result of these two, there will be enough data
to define the problem and give an idea about it to the reader.
3.1.1 SURVEY
The questions placed in the survey were chosen to consider different aspects of the
problem such as to have an idea on the elevator-using habits of passengers, to determine
mostly which floors the passengers use the elevators to reach at and to measure the effects
of two possible decisions that could be made about the solution. There are 10 questions in
the survey. First 5 questions basically helped to obtain information about the elevator
usage. These questions were designed to find out the crux of the problem. The last 5
questions were prepared in order to provide required data for the solutions. This survey had
8
been conducted with 100 participants from the human traffic in D Block and the further
details of the questions can be found in the Appendix B.
3.1.1.1 Statistical Distributions of Survey Result
The graphical representation of survey was added on Appendix A.The general
distribution of the answers given to the survey questions is as below :
• Regarding the elevator usage-operation is %60 of the user satisfaction is at the
“rock-bottom” and %35 of them is at the “medium level”. Only %5 of the passengers
expressed their “satisfaction”.[ graphic i.]
• Among these hundred people, % 35 of them is “quite often”, %25 is “sometimes”
and another % 25 is “seldom” using the elevators. As for that % 15 of them stated that they
“never” use the elevators.[ graphic ii.]
• %80 of the users stated that they prefer to use any of the “elevators at the left
side” and the remained %20 prefer any of the “elevators at the right side”[ graphic iii.].
• %5 of the passengers who take the elevator from the ground level, implied that
they ride the elevators “down to the -1 floor”. On the other hand %15 of them showed that
they take the elevators to ride up to the “300s floor”, %35 of them up to the “400s floor”
and %45 of them up to the “500s floor”.[ graphic iv.]
• For %55 of the participants, the waiting time for the elevator is “too long”; for
%25 of them “long”; for %15 of them “normal”; for %7 of them “a short while”. %3 of the
passengers stated that they “never” wait for the elevators.[ graphic v.]
• %85 of the passengers who take the elevator from the ground level stated that they
never use the elevators to ride down. Only %15 of them told that they seldom use the
elevators to ride down.[ graphic vi.]
• %35 of the passengers who take the elevator from the ground level said that at
least once they used the elevators to ride up to the 300s floor. %65 of them told that they
have not used any of the elevators at the ground level even to ride up to the upper floor.
[graphic vii.]
• Concerning the solution to the operative problem of the elevators, in the case of
any potential block off to the elevators for the -1 and 300s floors (for the elevators at the
left side), % 85 of the users declared “not to be negatively affected” or “might be slightly
9
affected” by this situation. As to %15 of them declared they could be “negatively affected”
by the situation.[ graphic viii.]
• As an alternative solution to the operative problem of the elevators, the method of
separate access to the odd and even floors was considered by %55 of the passengers as
“not to be negatively affected” or “might be slightly affected”. On the other hand, %45 of
them considered this as a “might be a complicated situation and negatively affect the
passengers”.[ graphic ix.]
• Referring to the two different methods to sort the problem in the elevators
mentioned in the questions number 8 and 9 in the survey, to the question of “if one of these
two methods will sort the problem out, which one would they prefer?”, %74 of the users
stated that to block off the elevator to certain floors is easier and more reasonable. Whereas
%26 of them stated that they would prefer the odd-even floor method.[ graphic x.]
3.1.1.2 Analysis of Survey Result
The analysis of given answers to the questionnaire and the first impressions given
by those answers are as follows:
• As it is obvious that the satisfaction about the elevator usage is at a very low level.
Majority of the survey participants complain about the situation and so think that some
precautions should be taken in oder to better the situation.
• The result of the survey indicates us that contrary to what is estimated, the usage
rate of the elevators in D Block is quite low. The number of people who always ride the
elevators is in the minority. This fact indicates us that the planning decisions to be taken on
the operation policy will directly affect a much smaller group of people than what is
estimated.
• As is known, the elevators at the left side are used more than the one at the right
side which is also confirmed by the survey results. This situation indicates that there is no
problem about the capacity of the elevator at the right side, but the traffic and capacity
problems are derived from the extensive usage of the elevators at the left side.
• People mostly use the elevators to ride up to the upper floors (400s and 500s).
Among the reasons of the preference of these floors, location of the academic units at the
10
third and fourth floors is also taken into consideration. However, as the main reason that
people prefer the elevators to avoid the stairs usage should not be missed.
• From the survey results, it is seen that there is a problem derived from waiting
time at the queue for the elevator. Therefore, the users also expect a solution for the
waiting as well as the traffic problem of the elevator. This situation convinced us to use the
Queuing Theory as an appropriate suggestion to any potential solution of the problem.
• One of the remarkable results of the survey is that people almost never use the
elevators from the gorund floor to ride down to the -1 floor For example: only the elevators
at the right side are available to access).
• Another survey result similarly shows that most of the people prefer to use the
stair in order to walk up to an upper floor from the ground floor, instead of the elevators.
As reasons of that, the shortness of stair climbing distance and the lenghtiness of the
elevator waiting time are presented.
• From the survey results, we see that there will not be an overreaction against any
potential decision to block off the elevators at the left side in respect to the solution of the
traffic problem in D Block. This idea which might be seem as a radical decision does not
negatively affect the user psychology if it is mathematically proven that it can solve the
problem.
• Another well-known method in solving traffic problems of elevators is to separate
the elevators according to the access to odd floors and even floors. The answers given to
the question asked to learn the opinions on the feasibility of this method show us that this
method might cause a complicated situation for the passengers. In respect to this, %45 of
the participants will be our most important mainstay not to prefer this method.
• When we asked to the participants which method they will prefer from these two
options, the majority stated that they find the access to certain floors as a better solution,
because it is simpler for the passengers to adapt to such an elevator operation system. In
other word, a decision taken from this point of view is more efficient and affirmed by the
users’ answers in the survey.
11
3.1.2 TRAFFIC CALCULATION OF D-BLOCK ELEVATORS
It is obvious that we need to calculate the human traffic in D Block to measure if
the available elevators are enough for the whole building. Therefore, conventional traffic
calculation method will be preferred. All the steps in this method were adapted from
Erdem İmrak’s book Asansörler ve Yürüyen Merdivenler (Elevators and Moving Stairs).
Erdem İmrak bases all standards that he used in the traffic calculation in his own work, on
the internationally recognized British Standards (BSI) that is also used in our own country.
The complete name of this standard is “BS 5655-6:2002 Lifts and Service Lifts”. In this
Project the values that are suitable to D Block were taken from these standards and the
tables showing them are also put in this section.
Sufficiency Analysis of Capacity through Elevator Traffic Calculation
a) Number of people in the Building
Number of the people who benefit from the elevator facility is the first step in
the traffic calculation, so the characteristics of the building have to be known. Data on
average headcount in D Block are given below:
- B = 3887 Total population of D Blok
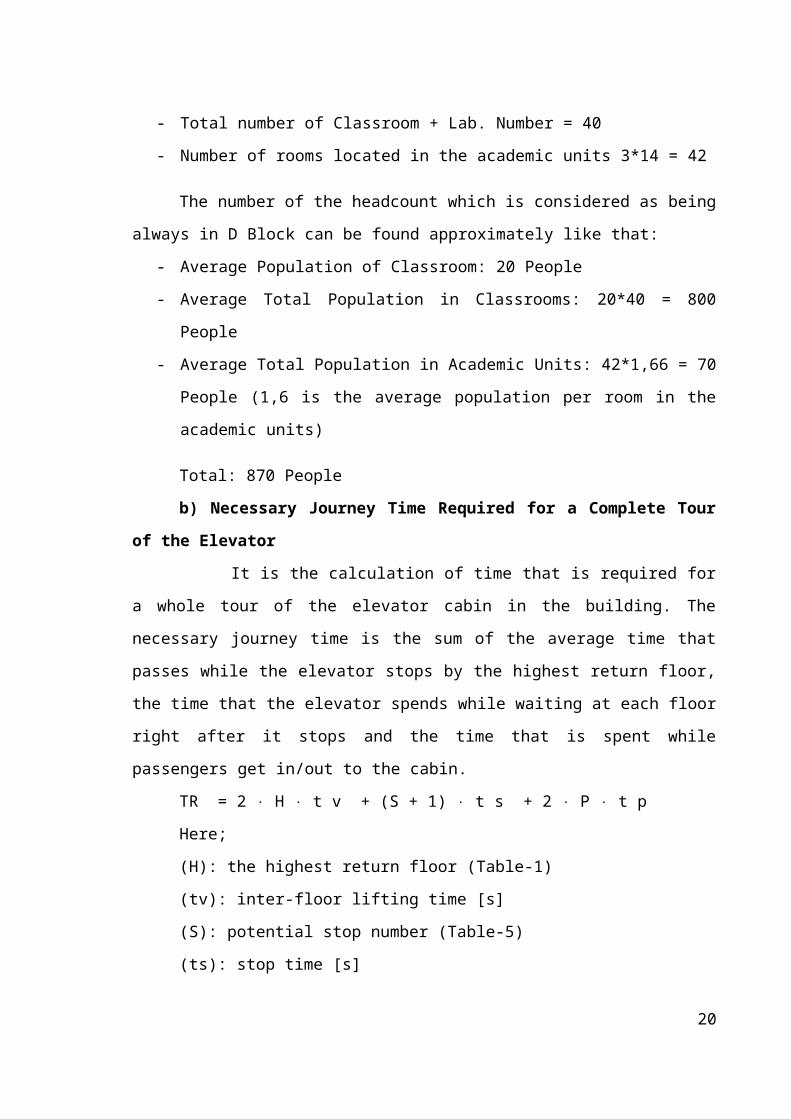
- Total number of Classroom + Lab. Number = 40
- Number of rooms located in the academic units 3*14 = 42
The number of the headcount which is considered as being always in D Block can
be found approximately like that:
- Average Population of Classroom: 20 People
- Average Total Population in Classrooms: 20*40 = 800 People
- Average Total Population in Academic Units: 42*1,66 = 70 People (1,6 is the aver-
age population per room in the academic units)
Total: 870 People
b) Necessary Journey Time Required for a Complete Tour of the Elevator
It is the calculation of time that is required for a whole tour of the elevator cabin
in the building. The necessary journey time is the sum of the average time that passes
while the elevator stops by the highest return floor, the time that the elevator spends while
12
waiting at each floor right after it stops and the time that is spent while passengers get
in/out to the cabin.
TR = 2 ⋅ H ⋅ t v + (S + 1) ⋅ t s + 2 ⋅ P ⋅ t pHere;
(H): the highest return floor (Table-1)
(tv): inter-floor lifting time [s]
(S): potential stop number (Table-5)
(ts): stop time [s]
(P): passenger number per cabin (Table-6)
(tp): Passenger transfer time [s] (Table-7)
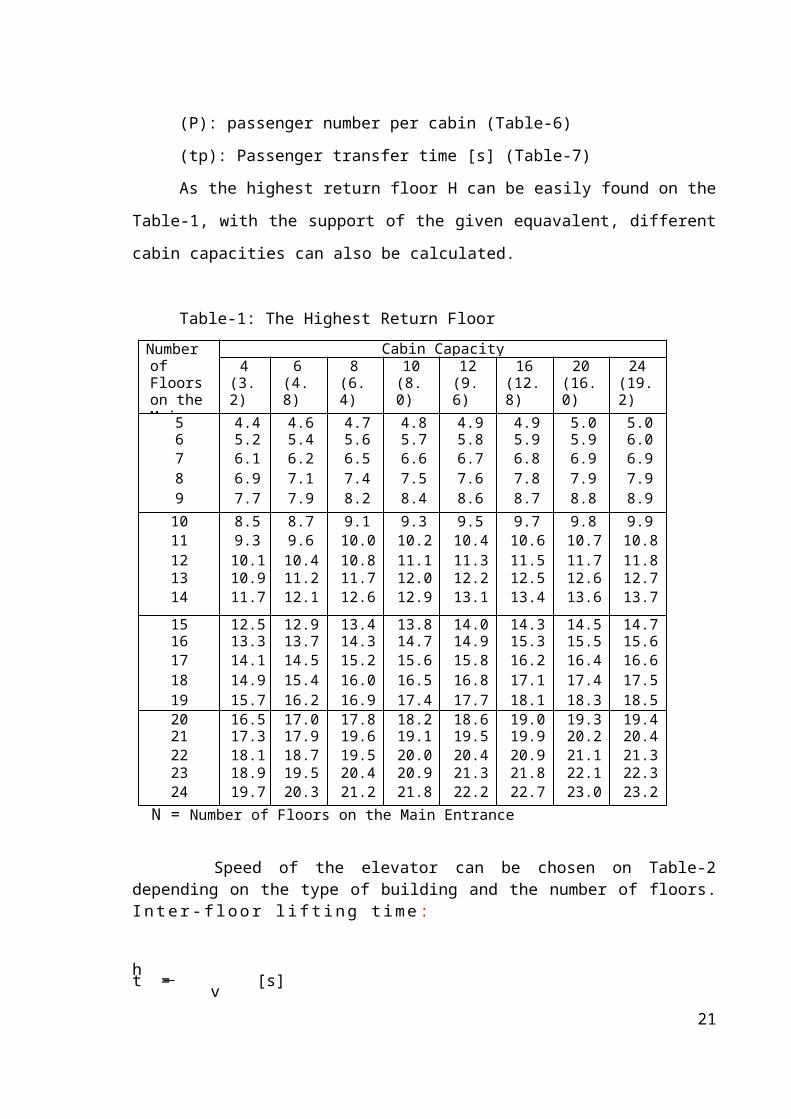
As the highest return floor H can be easily found on the Table-1, with the support
of the given equavalent, different cabin capacities can also be calculated.
Table-1: The Highest Return Floor
Number of Floors on the Main Entrance
Cabin Capacity (P)4
(3.2)6
(4.8)8
(6.4)10
(8.0)12
(9.6)16
(12.8)20
(16.0)24
(19.2)
56789
4.45.26.16.97.7
4.65.46.27.17.9
4.75.66.57.48.2
4.85.76.67.58.4
4.95.86.77.68.6
4.95.96.87.88.7
5.05.96.97.98.8
5.06.06.97.98.9
1011121314
8.59.310.110.911.7
8.79.610.411.212.1
9.110.010.811.712.6
9.310.211.112.012.9
9.510.411.312.213.1
9.710.611.512.513.4
9.810.711.712.613.6
9.910.811.812.713.7
1516171819
12.513.314.114.915.7
12.913.714.515.416.2
13.414.315.216.016.9
13.814.715.616.517.4
14.014.915.816.817.7
14.315.316.217.118.1
14.515.516.417.418.3
14.715.616.617.518.5
2021222324
16.517.318.118.919.7
17.017.918.719.520.3
17.819.619.520.421.2
18.219.120.020.921.8
18.619.520.421.322.2
19.019.920.921.822.7
19.320.221.122.123.0
19.420.421.322.323.2
N = Number of Floors on the Main Entrance
13
Speed of the elevator can be chosen on Table-2 depending on the type of building and the number of floors. I n t e r - f l o o r l i f t i n g t i m e :
ht = [s] v
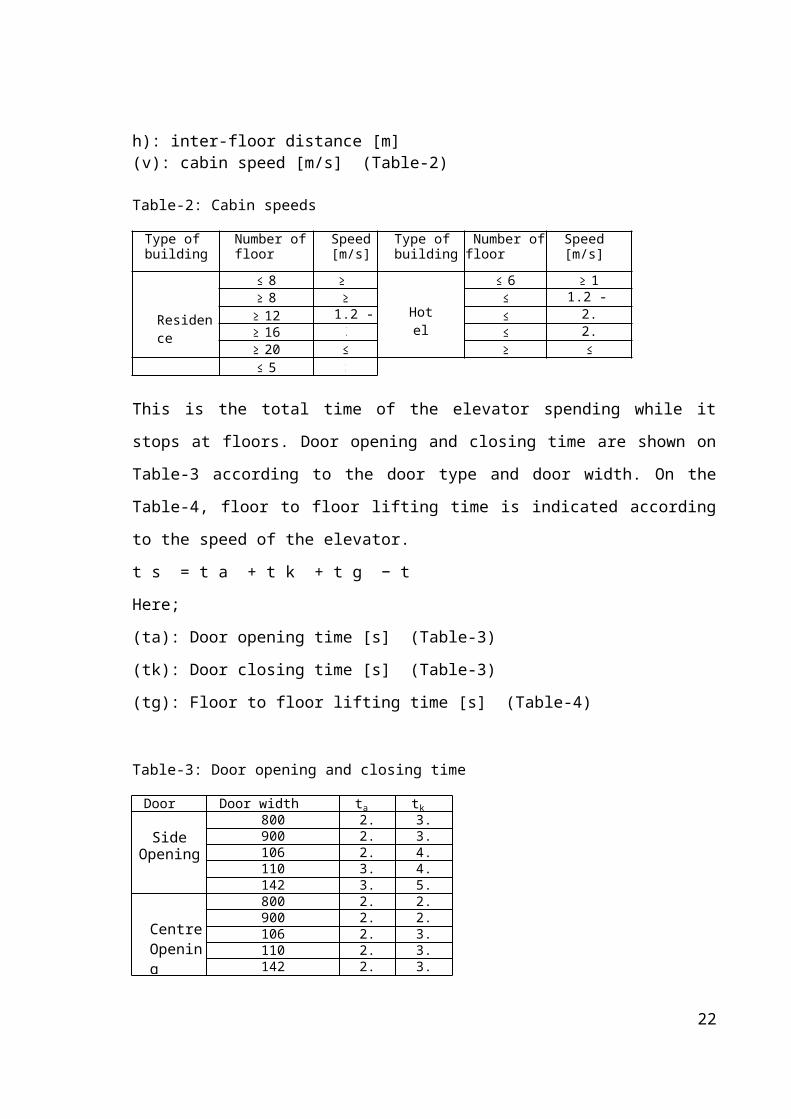
h): inter-floor distance [m](v): cabin speed [m/s] (Table-2)
Table-2: Cabin speeds
Type of building
Number of floor
Speed [m/s]
Type of building
Number of floor
Speed [m/s]
Residence
≤ 8 ≥ 0.63
Hotel
≤ 6 ≥ 1≥ 8 ≥
1≤ 10 1.2 - 1.5
≥ 12 1.2 - 1.5
≤ 15 2.0≥ 16 2
.≤ 20 2.5
≥ 20 ≤ 2
≥ 20 ≤ 3.0
Bureau ≤ 5 ≥
This is the total time of the elevator spending while it stops at floors. Door opening and
closing time are shown on Table-3 according to the door type and door width. On the
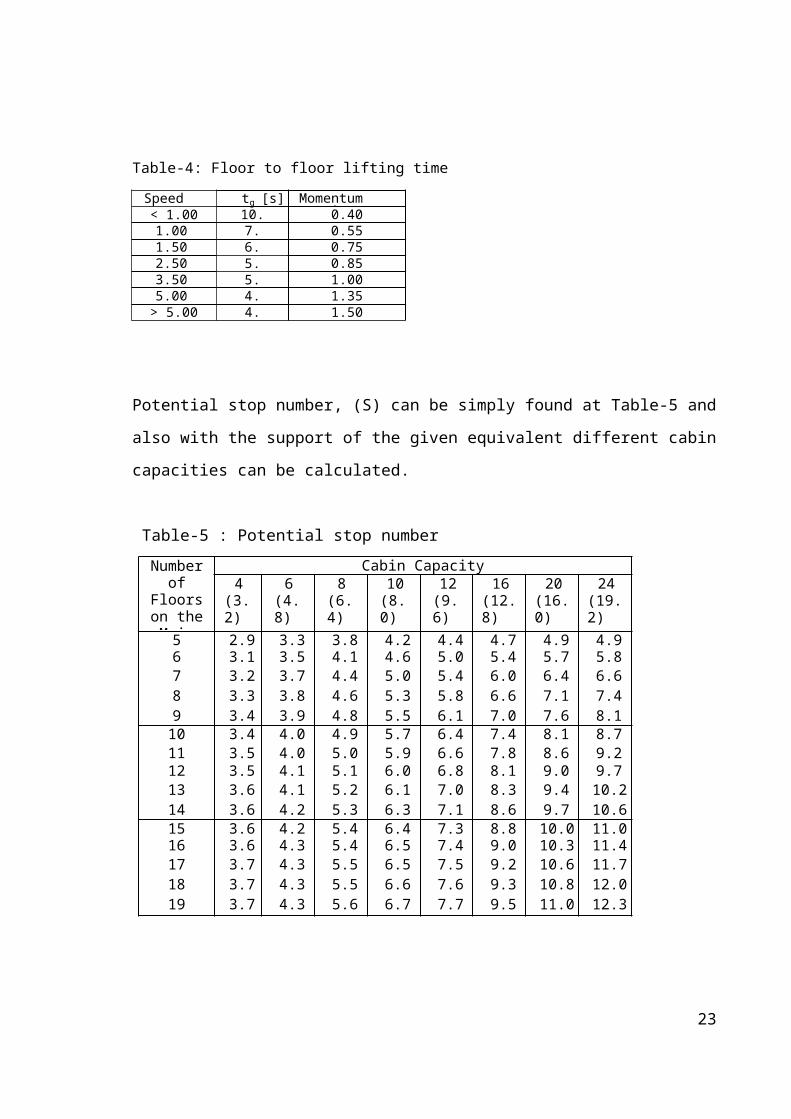
Table-4, floor to floor lifting time is indicated according to the speed of the elevator.
t s = t a + t k + t g − t
Here;
(ta): Door opening time [s] (Table-3)
(tk): Door closing time [s] (Table-3)
(tg): Floor to floor lifting time [s] (Table-4)
Table-3: Door opening and closing time
14
Door type Door width [mm] ta [s] tk [s]
Side Opening
800 2.5 3.0900 2.5 3.81060 2.9 4.01100 3.0 4.01420 3.7 5.0
Centre Opening
800 2.0 2.5900 2.3 2.91060 2.5 3.31100 2.5 3.51420 2.7 3.7
Table-4: Floor to floor lifting time
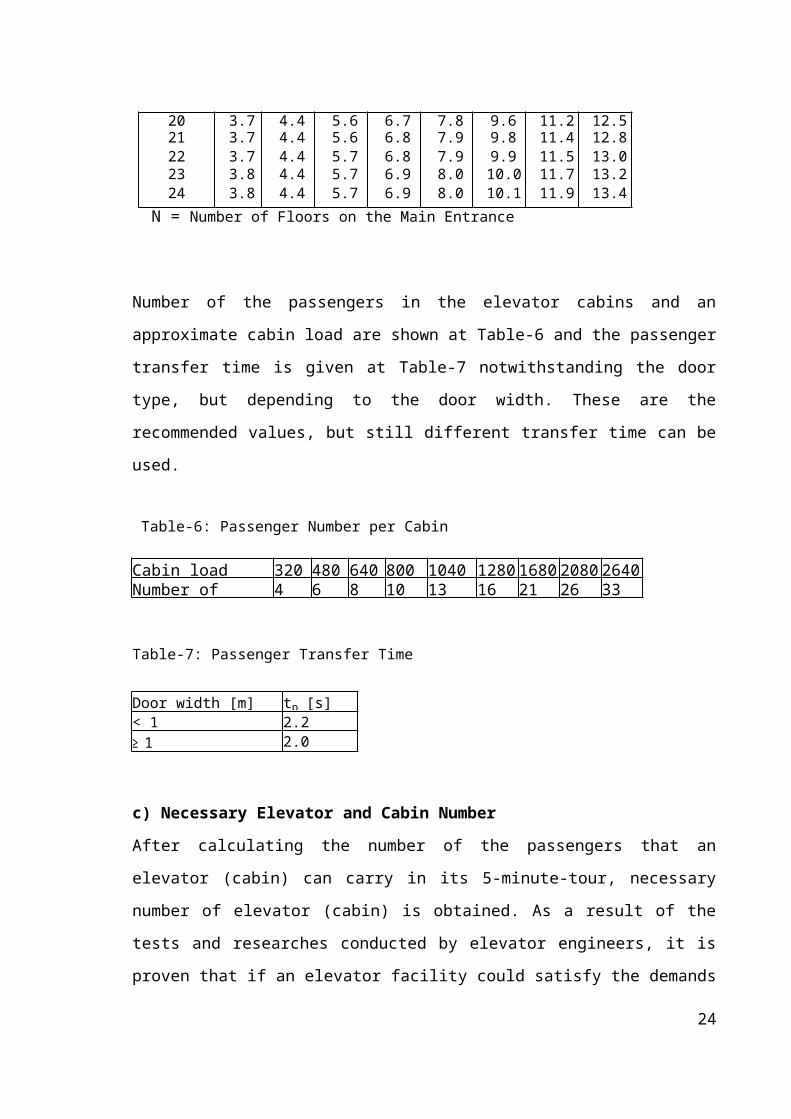
Potential stop number, (S) can be simply found at Table-5 and also with the support of the
given equivalent different cabin capacities can be calculated.
Table-5 : Potential stop number
Number of Floors on the Main Entrance
Cabin Capacity (P)4
(3.2)6
(4.8)8
(6.4)10
(8.0)12
(9.6)16
(12.8)20
(16.0)24
(19.2)
56789
2.93.13.23.33.4
3.33.53.73.83.9
3.84.14.44.64.8
4.24.65.05.35.5
4.45.05.45.86.1
4.75.46.06.67.0
4.95.76.47.17.6
4.95.86.67.48.1
1011121314
3.43.53.53.63.6
4.04.04.14.14.2
4.95.05.15.25.3
5.75.96.06.16.3
6.46.66.87.07.1
7.47.88.18.38.6
8.18.69.09.49.7
8.79.29.710.210.6
1516171819
3.63.63.73.73.7
4.24.34.34.34.3
5.45.45.55.55.6
6.46.56.56.66.7
7.37.47.57.67.7
8.89.09.29.39.5
10.010.310.610.811.0
11.011.411.712.012.3
2021222324
3.73.73.73.83.8
4.44.44.44.44.4
5.65.65.75.75.7
6.76.86.86.96.9
7.87.97.98.08.0
9.69.89.9
10.010.1
11.211.411.511.711.9
12.512.813.013.213.4
N = Number of Floors on the Main Entrance
Number of the passengers in the elevator cabins and an approximate cabin load are shown
at Table-6 and the passenger transfer time is given at Table-7 notwithstanding the door
15
Speed [m/s] tg [s] Momentum [m/s2]< 1.00 10.0 0.401.00 7.0 0.551.50 6.0 0.752.50 5.5 0.853.50 5.0 1.005.00 4.5 1.35
> 5.00 4.3 1.50
type, but depending to the door width. These are the recommended values, but still
different transfer time can be used.
Table-6: Passenger Number per Cabin
Table-7: Passenger Transfer Time
c) Necessary Elevator and Cabin Number
After calculating the number of the passengers that an elevator (cabin) can carry in its 5-
minute-tour, necessary number of elevator (cabin) is obtained. As a result of the tests and
researches conducted by elevator engineers, it is proven that if an elevator facility could
satisfy the demands occurred in the most critical five minutes in the elevator traffic, it
continues to serve all the day without any problem.
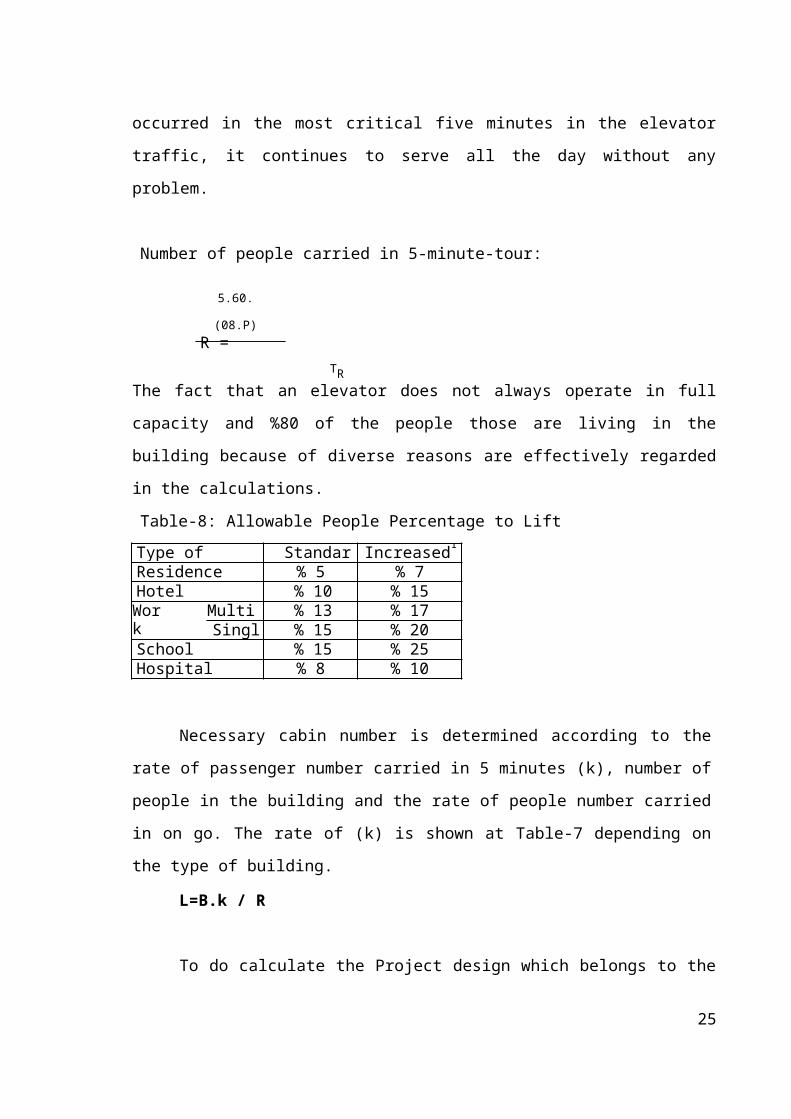
Number of people carried in 5-minute-tour:
5.60. (08.P)
R =
TRThe fact that an elevator does not always operate in full capacity and %80 of the people
those are living in the building because of diverse reasons are effectively regarded in the
calculations.
Table-8: Allowable People Percentage to Lift
16
Cabin load [kg] 320 480 640 800 1040 1280 1680 2080 2640Number of Passenger 4 6 8 10 13 16 21 26 33
Door width [m] tp [s]< 1 2.2≥ 1 2.0
Type of building Standard Increased1)
Residence % 5 % 7Hotel % 10 % 15
WorkCentral
Multiple % 13 % 17Single % 15 % 20
School % 15 % 25Hospital % 8 % 10
Necessary cabin number is determined according to the rate of passenger number
carried in 5 minutes (k), number of people in the building and the rate of people number
carried in on go. The rate of (k) is shown at Table-7 depending on the type of building.
L=B.k / R
To do calculate the Project design which belongs to the elevators in our university,
we should gather all data and investigate if the number of available elevators is enough for
the existing population in D Block.
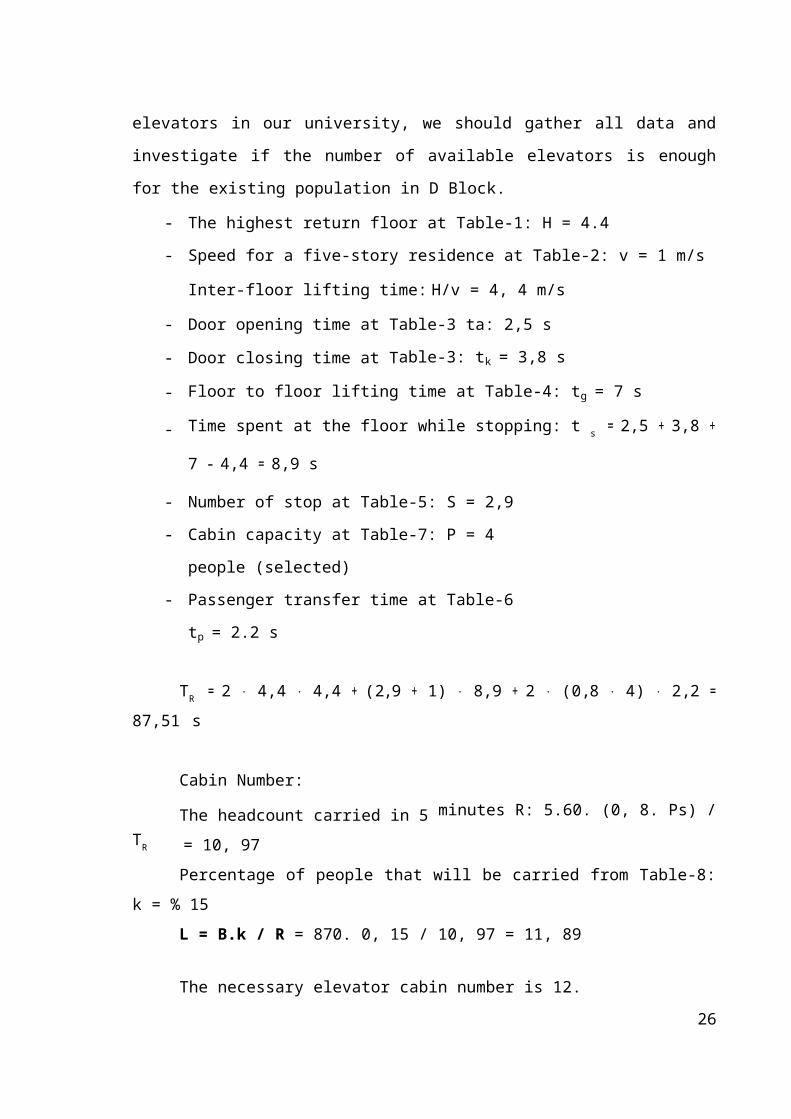
- The highest return floor at Table-1: H = 4.4
- Speed for a five-story residence at Table-2: v = 1 m/s
Inter-floor lifting time: H/v = 4, 4 m/s
- Door opening time at Table-3 ta: 2,5 s
- Door closing time at Table-3: tk = 3,8 s
- Floor to floor lifting time at Table-4: tg = 7 s
- Time spent at the floor while stopping: t s = 2,5 + 3,8 + 7 – 4,4 = 8,9 s
- Number of stop at Table-5: S = 2,9
- Cabin capacity at Table-7: P = 4 people (selected)
- Passenger transfer time at Table-6 tp = 2.2 s
TR = 2 ⋅ 4,4 ⋅ 4,4 + (2,9 + 1) ⋅ 8,9 + 2 ⋅ (0,8 ⋅ 4) ⋅ 2,2 = 87,51 s
Cabin Number:
The headcount carried in 5 minutes R: 5.60. (0, 8. Ps) / TR = 10, 97
Percentage of people that will be carried from Table-8: k = % 15
L = B.k / R = 870. 0, 15 / 10, 97 = 11, 89
The necessary elevator cabin number is 12.
As is seen, the problem itself is clearly presented in a computational form as a
result of a calculation which was adapted to the elevator in D Block as to British
Standards (BSI) data that are applied by Erdem İmrak in his work called as Asansörler ve
17
Yürüyen Merdivenler (Elevators and Moving Stairs). According to the calculations in the
Conventional Elevator Traffic Modelling, the necessary elevator cabin number in the
building is 12. However, the available cabin number is 3. The dramatic difference between
these two numbers refers to the remarkable overpopulation behind the real problem in D
Block. Also, it is not known that it is not possible to place new elevators next to the
existing ones. Hence, the result of this project is that: if it is not possible to increase the
number of elevators to decrease the traffic, take some certain precautions to improve the
performance of elevators’ usage. Tos um up, through both the survey and the mathematical
calculation of the traffic, the problem itself is introduced. Afterwards, how to solve this
problem, which system to apply and what kind of precautions to take will be considered.
3.2 PROCEDURE (HOW THE PROBLEM WILL BE SOLVED)
So far, serious problems about the elevators in D Block have been revealed and
defined in detail. Considering that, the first thing to do in the solution of the problem is to
collect the data. Then, these collected data will help us to constitute a simulation model in
order to apply a new operation policy. Among the large scale of the data, the ones will be
collected from the studies whose technical details and feasibility have been scanned and
reviewed before. This is also the same data collecting sources which is mentioned in the
Literature Review and will be a guide to us while collecting the data. System simulation is
the next process after finishing the collection of the data. At that point, the operation policy
is important to be emphasized. Regarding that, current researches and approaches have
been scanned. Again, the objective ideas of the operation policy were pointed out in the
survey workouts and the potential effects of these ideas on the users were observed and
measured. Previously conducted researches and studies indicate that the basic policy to
solve the problem relating to the elevator usage in a building is to increase the number of
the elevators. However, the problem in the elevator system of D Block is derived from the
overpopulation.
If it is not possible to sort out such a problem through the decrease of the
population or addition of new elevators, there remain two options as a precaution. [1] First
regulation is to block off the access to certain floors and [2] the second regulation is
even/odd floor separation. In this Project, two simulation models will be presented: one for
18
the block off the elevators to certain floors –for instance; the block off the elevators at the
left side to ride down/up to the -1. and +1. floors. Another simulation on the regulation of
the elevator operations to the floors which allow the elevator traffic –for instance; one of
the twin elevators at the left side for the odd floors, and the other one is for the access to
even floors. In this simulation model, “Elevate Simulation Program”1 will be used which
is indisputably the most effective simulation program in the World. In the end, results will
be explained with graphics and stats in details. In the “Results and Discussion” parts,
simulation models and workouts will be technically analysed and finally, the results will be
controlled if they show the expected decrease in the waiting time or not. In this way, the
results of the simulations will be separately analysed under the effects of technical and
psychological factors, as two basic factors.
1 For further information, please visit: www.peters-research.com
19
3.3 COLLECT DATA AND ANALYSIS OF DATA
According to Elevate-8.0 Simulation Software , we have to collect data as follows :
Job Data allows you to record details of the project, and who has performed
the calculations. This information, the date, and document name is included
in the header of all Elevate print outs.
Table 3.3.1 Screenshot of Job Data Entry
Analysis Data Dispatcher Algorithm the dispatcher algorithm determines how the elevators will serve the calls placed on the system by the passengers.It should be selected for now Standard Algorithm.
Gorup Collective a control system which allocates hall calls by(i) estimating the expected travel distance between hall calls
and each elevator; (ii) allocating the call to the “nearest” elevator.
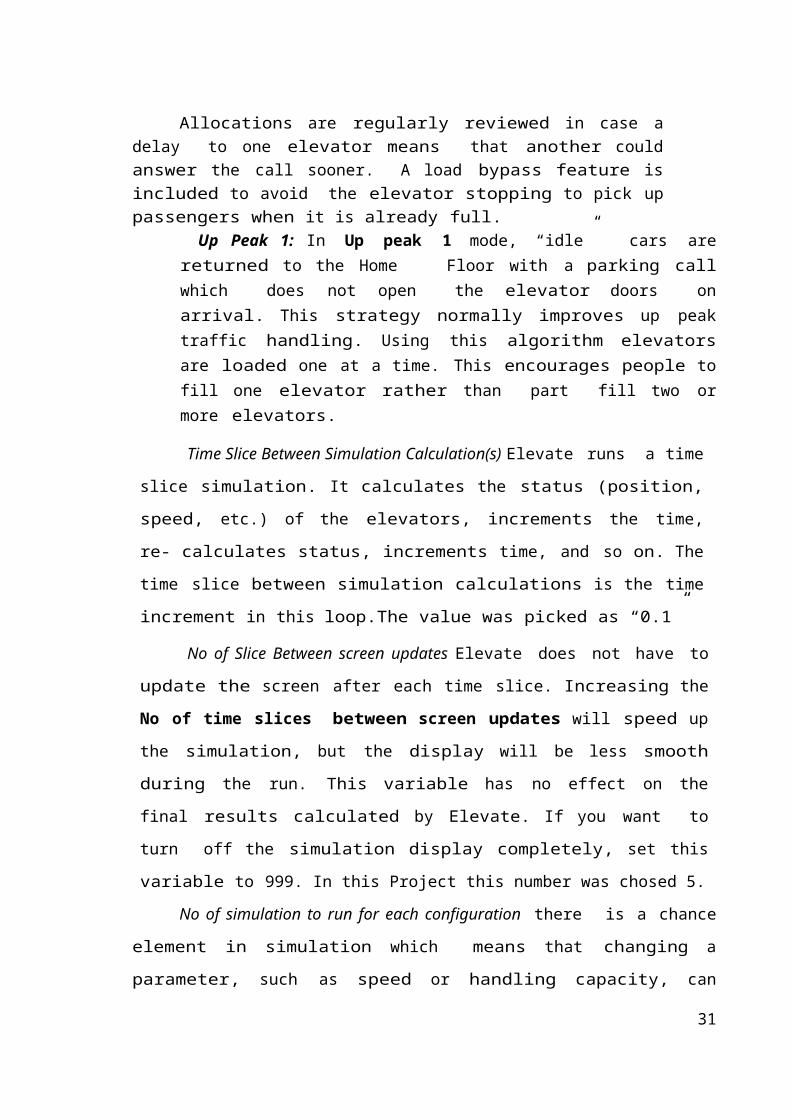
Allocations are regularly reviewed in case a delay to one elevator means that another could answer the call sooner. A load bypass feature is included to avoid the elevator stopping to pick up passengers when it is already full.
Up Peak 1: In Up peak 1 mode, “idle” cars are returned to the Home Floor with a parking call which does not open the elevator doors on arrival. This strategy normally improves up peak traffic handling. Using this algorithm elevators are loaded one at a time. This encourages people to fill one elevator rather than part fill two or more elevators.
20
Time Slice Between Simulation Calculation(s) Elevate runs a time slice
simulation. It calculates the status (position, speed, etc.) of the elevators,
increments the time, re- calculates status, increments time, and so on. The time
slice between simulation calculations is the time increment in this loop.The
value was picked as “0.1”
No of Slice Between screen updates Elevate does not have to update the
screen after each time slice. Increasing the No of time slices between screen
updates will speed up the simulation, but the display will be less smooth during
the run. This variable has no effect on the final results calculated by Elevate. If
you want to turn off the simulation display completely, set this variable to 999.
In this Project this number was chosed 5.
No of simulation to run for each configuration there is a chance element in
simulation which means that changing a parameter, such as speed or handling
capacity, can sometimes lead to performance results getting worse when you
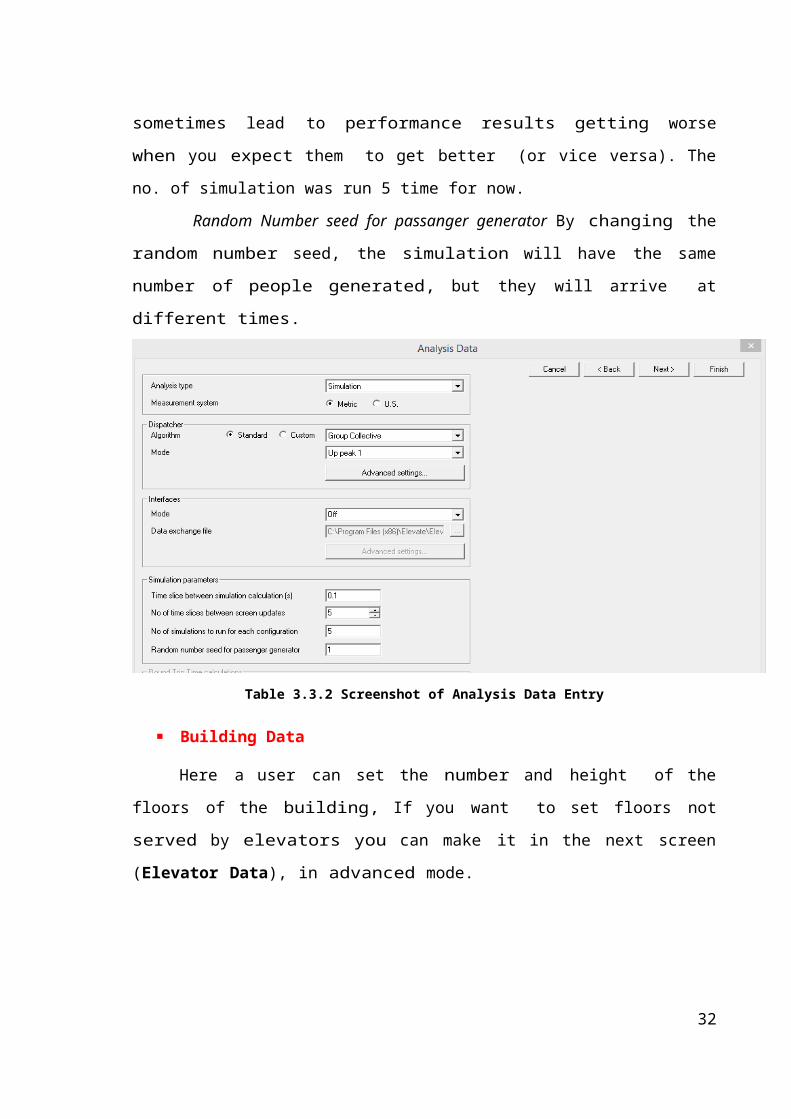
expect them to get better (or vice versa). The no. of simulation was run 5 time for now.
Random Number seed for passanger generator By changing the random
number seed, the simulation will have the same number of people generated, but
they will arrive at different times.
Table 3.3.2 Screenshot of Analysis Data Entry
21
Building Data
Here a user can set the number and height of the floors of the building, If
you want to set floors not served by elevators you can make it in the next screen
(Elevator Data), in advanced mode.
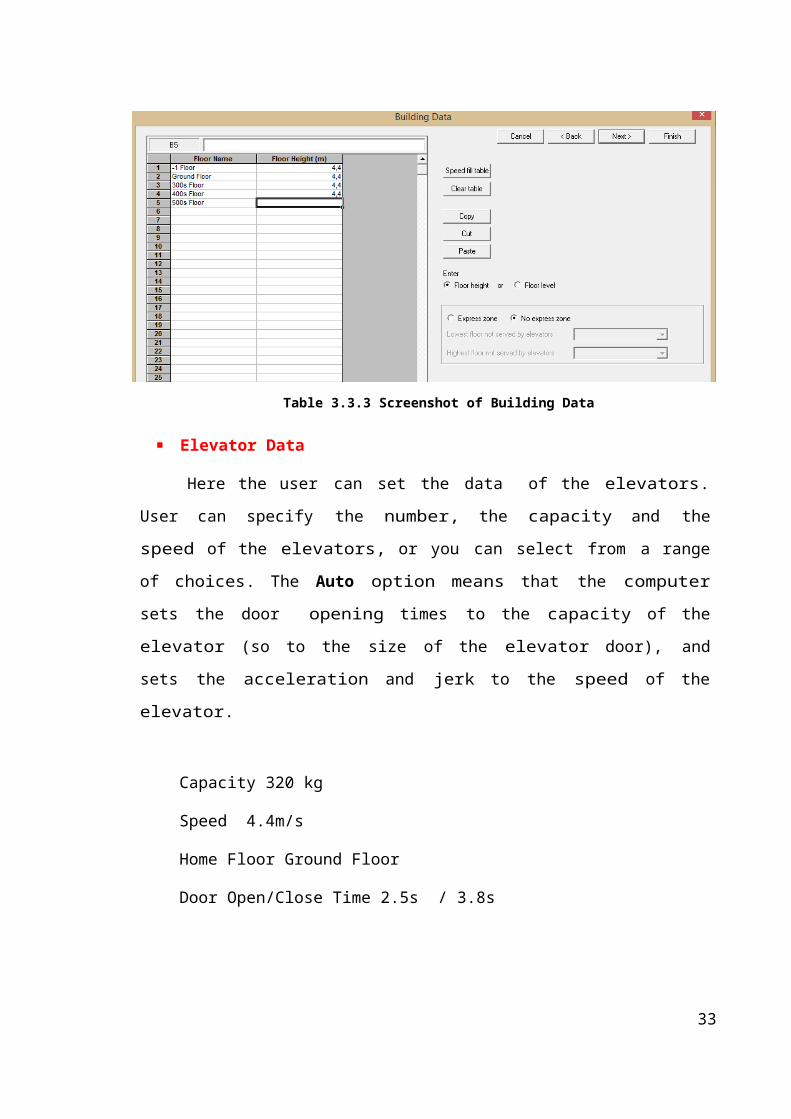
Table 3.3.3 Screenshot of Building Data
Elevator Data
Here the user can set the data of the elevators. User can specify the
number, the capacity and the speed of the elevators, or you can select from a
range of choices. The Auto option means that the computer sets the door
opening times to the capacity of the elevator (so to the size of the elevator door),
and sets the acceleration and jerk to the speed of the elevator.
Capacity 320 kg
Speed 4.4m/s
Home Floor Ground Floor
Door Open/Close Time 2.5s / 3.8s
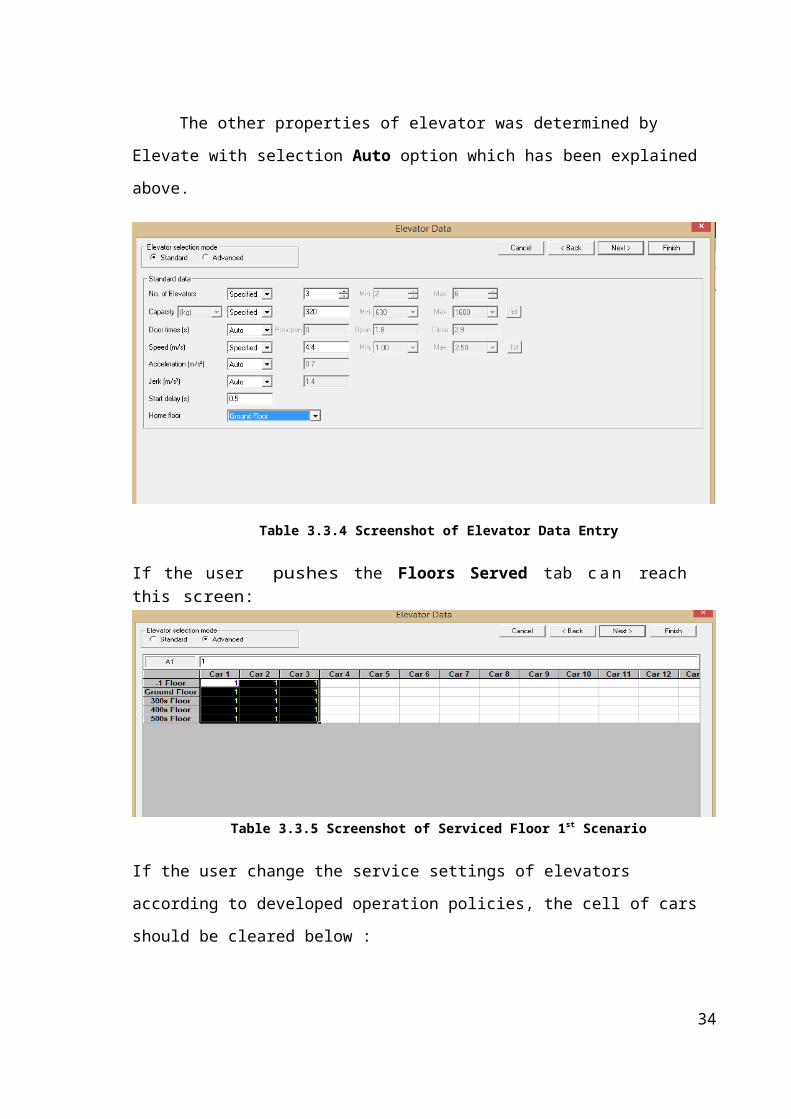
The other properties of elevator was determined by Elevate with selection Auto
option which has been explained above.
22
Table 3.3.4 Screenshot of Elevator Data Entry
If the user pushes the Floors Served tab c a n reach this screen:
Table 3.3.5 Screenshot of Serviced Floor 1st Scenario
If the user change the service settings of elevators according to developed operation
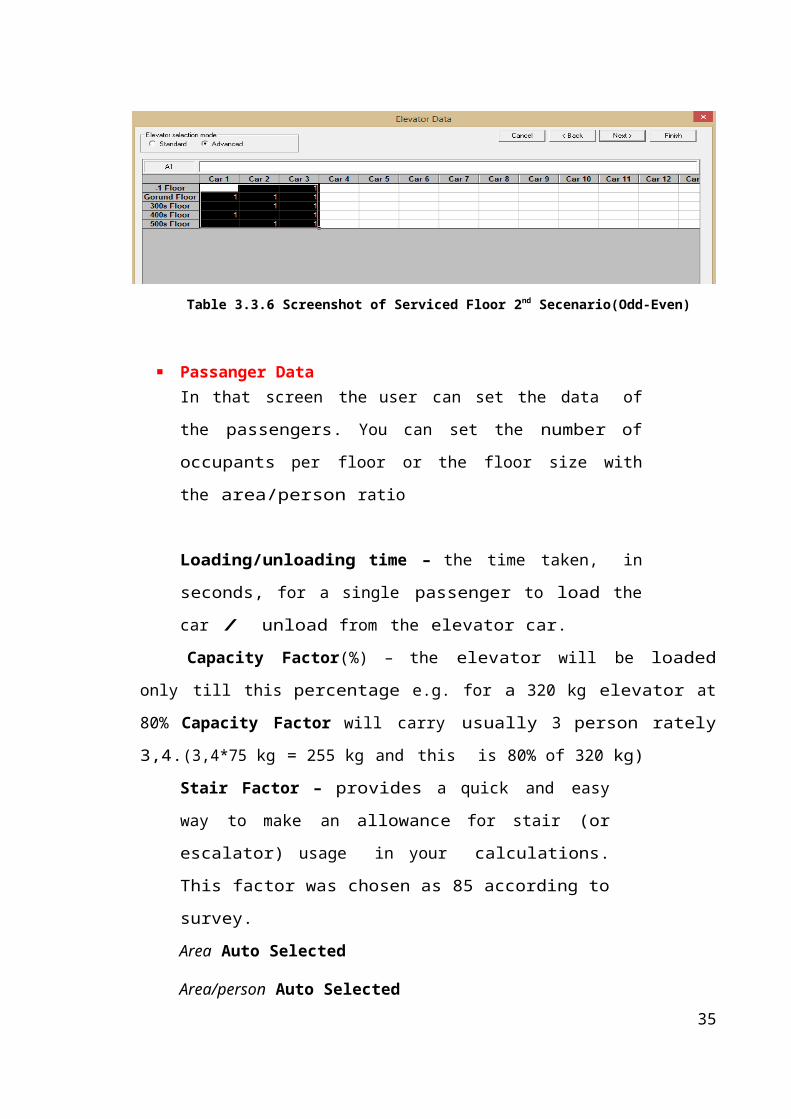
policies, the cell of cars should be cleared below :
Table 3.3.6 Screenshot of Serviced Floor 2nd Secenario(Odd-Even)
23
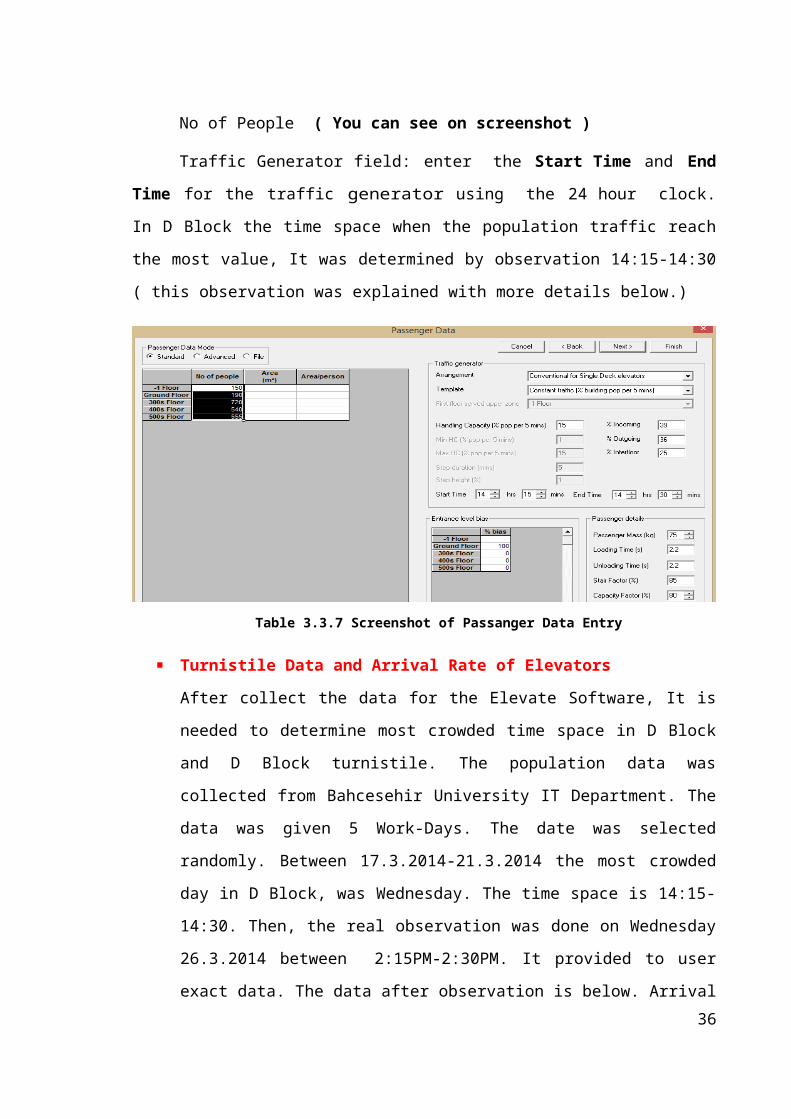
Passanger DataIn that screen the user can set the data of the passengers. You can
set the number of occupants per floor or the floor size with the
area/person ratio
Loading/unloading time – the time taken, in seconds, for a single
passenger to load the car / unload from the elevator car.
Capacity Factor(%) – the elevator will be loaded only till this percentage
e.g. for a 320 kg elevator at 80% Capacity Factor will carry usually 3 person rately
3,4.(3,4*75 kg = 255 kg and this is 80% of 320 kg)
Stair Factor – provides a quick and easy way to make an
allowance for stair (or escalator) usage in your calculations.
This factor was chosen as 85 according to survey.
Area Auto Selected
Area/person Auto Selected
No of People ( You can see on screenshot )
Traffic Generator field: enter the Start Time and End Time for the traffic
generator using the 24 hour clock. In D Block the time space when the population
traffic reach the most value, It was determined by observation 14:15-14:30 ( this
observation was explained with more details below.)
Table 3.3.7 Screenshot of Passanger Data Entry
24
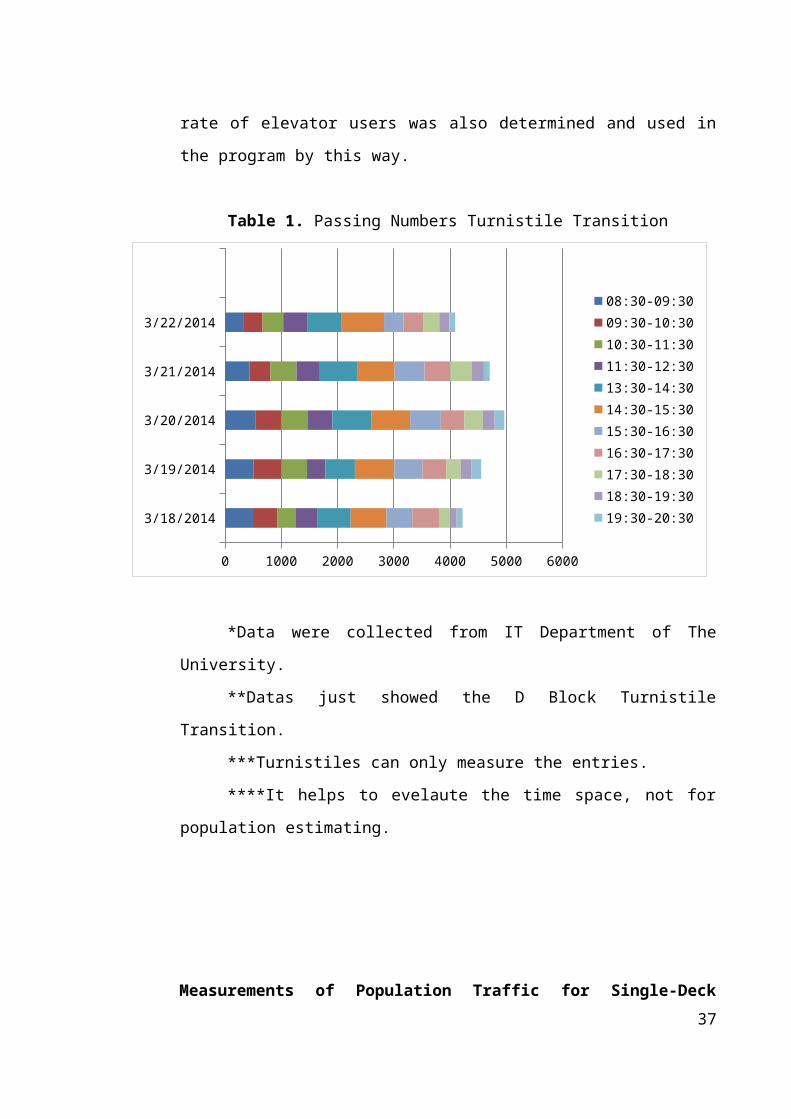
Turnistile Data and Arrival Rate of Elevators
After collect the data for the Elevate Software, It is needed to determine most
crowded time space in D Block and D Block turnistile. The population data was
collected from Bahcesehir University IT Department. The data was given 5 Work-
Days. The date was selected randomly. Between 17.3.2014-21.3.2014 the most
crowded day in D Block, was Wednesday. The time space is 14:15-14:30. Then,
the real observation was done on Wednesday 26.3.2014 between 2:15PM-2:30PM.
It provided to user exact data. The data after observation is below. Arrival rate of
elevator users was also determined and used in the program by this way.
Table 1. Passing Numbers Turnistile Transition
3/18/2014
3/19/2014
3/20/2014
3/21/2014
3/22/2014
0 1000 2000 3000 4000 5000 6000
08:30-09:3009:30-10:3010:30-11:3011:30-12:3013:30-14:3014:30-15:3015:30-16:3016:30-17:3017:30-18:3018:30-19:3019:30-20:30
*Data were collected from IT Department of The University.
**Datas just showed the D Block Turnistile Transition.
***Turnistiles can only measure the entries.
****It helps to evelaute the time space, not for population estimating.
25
Measurements of Population Traffic for Single-Deck Elevators in D-Block
Time Space : 14:15-14:30
Number Of People Who Prefer Stairs : 198
Number of People Who Prefer Elevators : 35
Avarage Rate of Using Elevators : % 15,021
Avarage Waiting Time : 36,29 seconds
Arrival Rate : 15
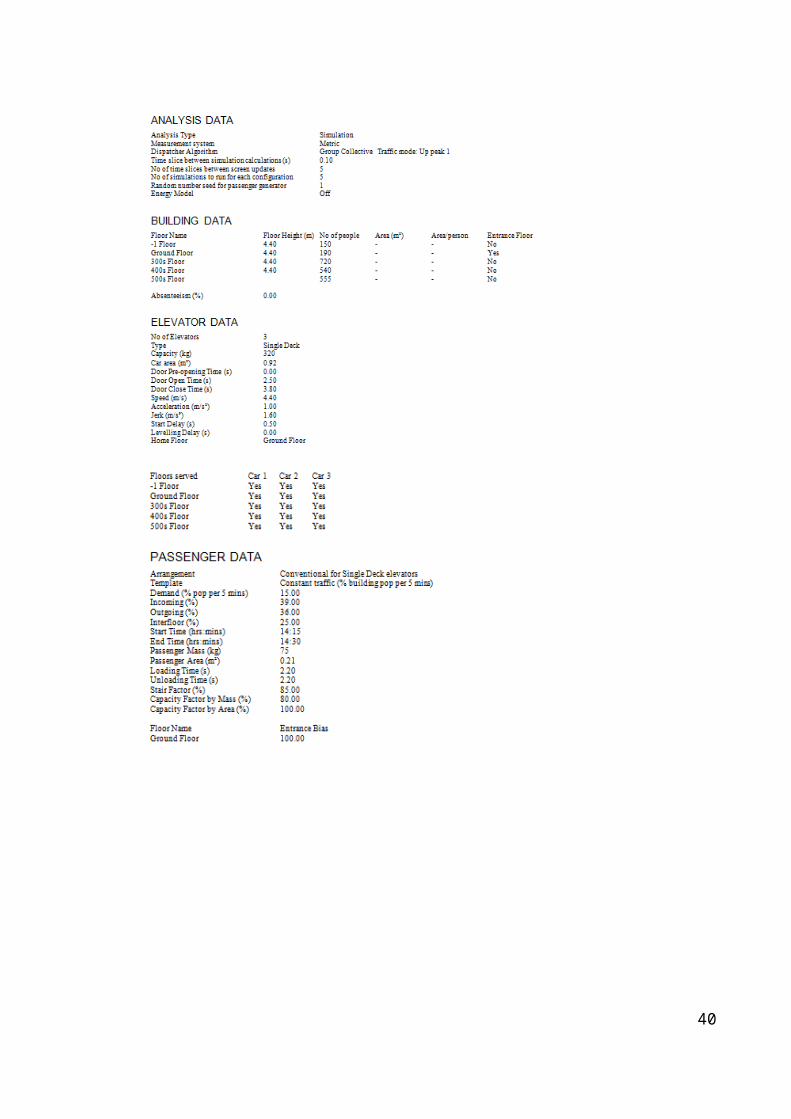
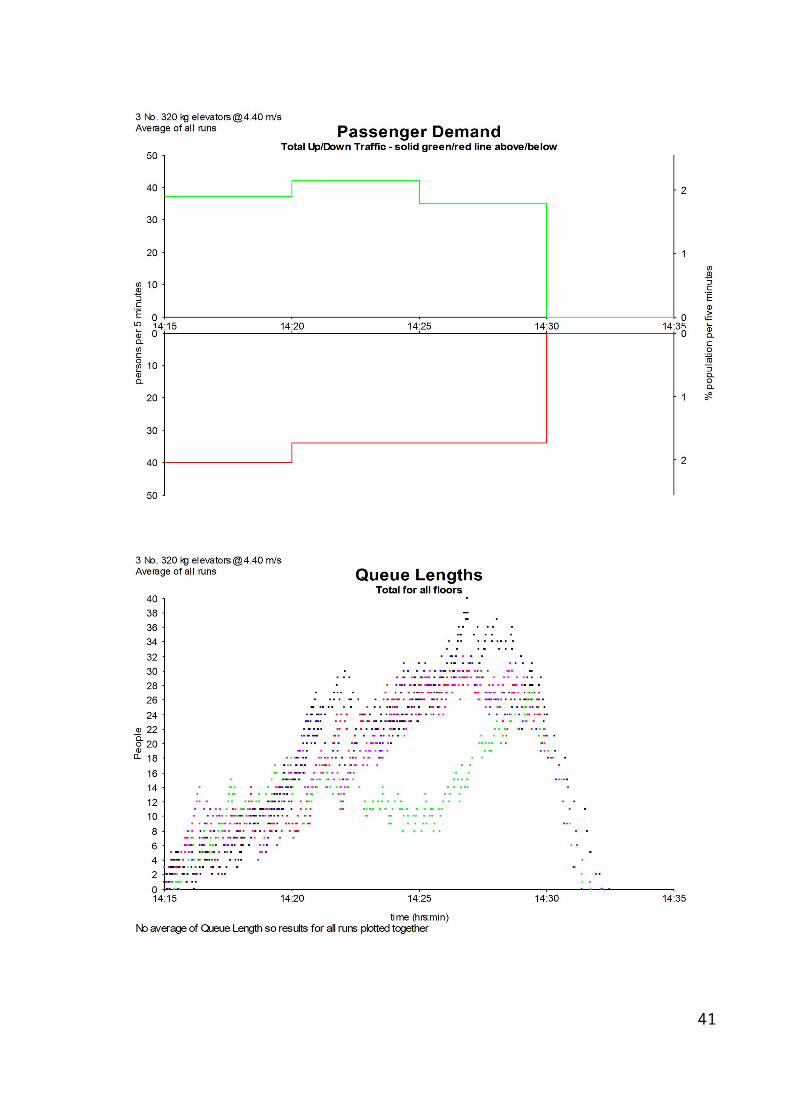
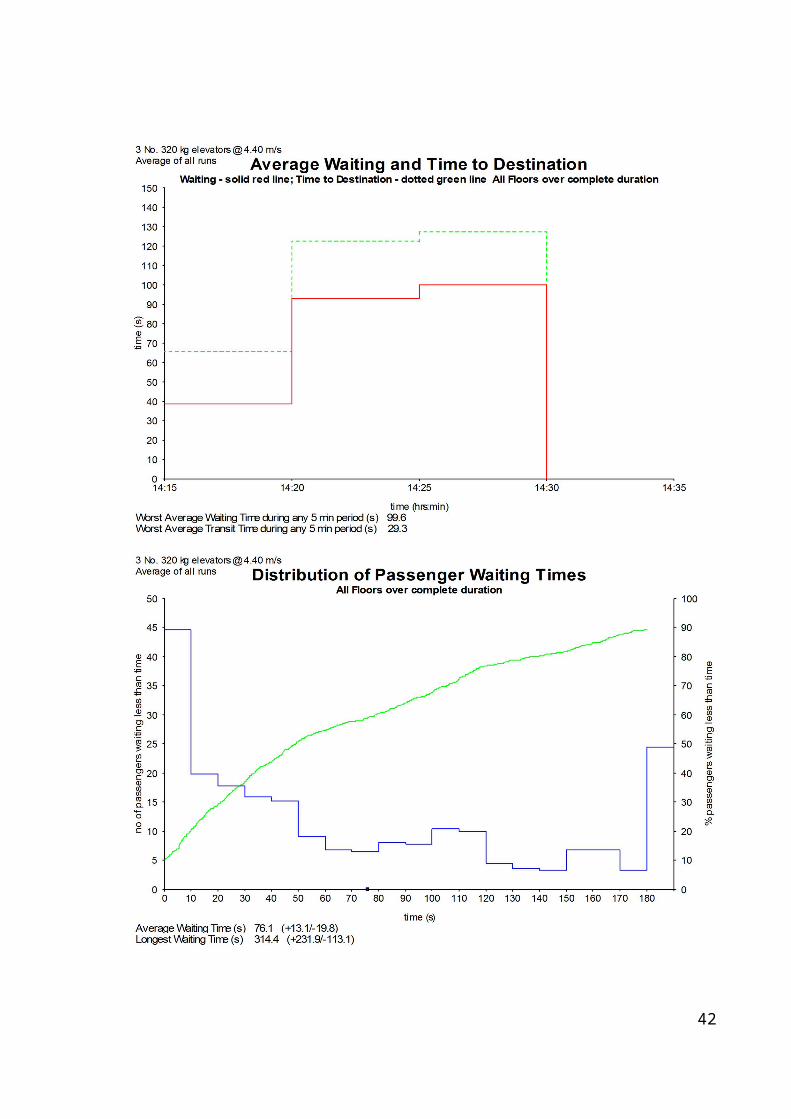
3.4 SIMULATION OF CURRENT SITUATION AND SOLUTION WAYS
After all data was collected, all procedures was completed. Now , the program should be
runned. Before run the program, the user can choose what are wanted from the report
option which can provide the users distribution graphs and also calculation values such as
average waiting time of passangers, queue length,avarage destination time etc.
As said before , the simulation was runned 3 conditions. 1st scenario is current
situation.There are no any developed policy or restrictions on served floor. 2nd scenario is
Odd-Even regulation on left-sided elevators. The served elevators were regulated.Both of
two cars(elevators) can not serve -1 according to policy , Additionally, one of left-sided
elevators can not serve 300s and 500s from ground floor (There is no transformation from
Ground Floor to 300s and 500s{Odd Floors}). Other elevator can not serve 400s from
ground floor.(Even Floor). The last,3rd scenario is blocked -1 and +1(300s) Floors from
Ground Floor.
26
1st Scenario ( Current Situation , There is no any developed policy)
27
28
29
30
2nd Scenario ( odd-even policy )
31
32
33
34
3rd Scenario ( Blocked -1 and +1(300s) Floors)
35
36

37
38
4.RESULTS AND CONCLUSION
After simulation , three different results were obtained. As it is expected that in current
situation the worst result was obtained as a waiting time. Then two mainly method which
determined after measuring the user’s preference were applied. Firstly , the first developed
policy was simulated. It is seen that the range was so high between two result. Lastly,
blocked method was simulated. After -1 and +1(300s) floors were blocked, the waiting
time was worse than odd-even policy. Also , eveluation was done all perspectives as
passanger demand,queue length,avarage waiting and time to destination,distribution of
passanger transit time,distribution of time to destination. All works were showed and
reported above graphically by Elevate 8.0. To determine operation policy develop the
current situation or not, the avarage waiting time was compared between the scenarios. The
results were listed below :
1st Scenario ; Current Situation has avarage waiting time 76.1 s
2nd Scenario ; Odd-Even Operation Policy has avarage waiting time 22.1 s
3rd Scenario ; Blocking -1 and 300s Floor Policy has avarage waiting time 52.4 s
On the whole , according to develop alternative operation policy to decrease waiting time
on D Block Elevator Systems, Firstly the problem was clearly defined with using survey
tool. Then, the answer that who has written article about elevator systems was found.
After completed the literature review, data for simulation was collected with all details.
Data was assigned on Elevate Software Program and the solution ways were simulated. As
it is seen that the better result was obtained clearly. Avarage waiting time was decreased as
22.1 by applying Odd-Even operation policy on D Block elevator systems.
39
5.ACKNOWLEDGEMENTS
We would like to express the deepest appreciation to our advisors Prof. Dr. Erkan
Bayraktar, and Dr. Adnan Çorum who have always helped us with their guidance in regard
to this Project. We would also like to thank to Asst. Prof. Dr. Semra Ağralı for the detailed
information about the process of conducting this Project. In addition, a big thank to the
mechanical engineer, Prof. Dr. Erdem İmrak –the associate dean of the Engineering
Faculty at Istanbul Technical University – , we really appreciate him for sharing all works
with us that he has done on the vertical elevator systems so far, and gave important tips
regarding the progression of the Project. Lastly, we thank to our friend Yaprak Aydın who
support us in the editing of the project.
Ceyhun ERCAN , Ali YILMAZ
İstanbul, 2014
40
REFERENCES
• Baker, J., & Cameron, M. (1996). The effects of the service environment on
affect and consumer perception of waiting time: An integrative review and research
propositions. Journal of the Academy of Marketing Science, 24(4), 338-349. doi:
10.1177/0092070396244005
• Chang Bum, K., Seong, K. A., Hyung, L., & Kim, J. O. (1996). Design and
implementation of fegcs: fuzzy elevator group control system. In Fuzzy Information
Processing Society (pp. 109 - 113). Retrieved from
http://ieeexplore.ieee.org/xpl/articleDetails.jsp?tp=&arnumber=384263&url=http://
ieeexplore.ieee.org/xpls/abs_all.jsp?arnumber=384263
• Chang, K., Chen, C., & Wu , T. (2003). Real-time scheduling for elevator
group systems. Systems Analysis Modelling Simulation, 43(12), 1675-1696. doi:
10.1080/02329290310001597133
• Chian, T., & Fu , L. (2002). Design of modern elevator group control
systems. icra '02. ieee international conference. doi: 10.1109/ROBOT.2002.1014750
• Cortes, P., Muñuzuri, J., & Onieva, L. (2006). Design and analysis of a tool
for planning and simulating dynamic vertical transport. SIMULATION, 82(4), 255-274.
doi: 10.1177/0037549706066986
• Deknudt, M. (2013). Analysis of an elevator system during up-peak: An
application of queueing theory. (Unpublished master's thesis, Ghent University)Retrieved
from http://lib.ugent.be/fulltxt/RUG01/002/033/329/RUG01-
002033329_2013_0001_AC.pdf
• Frédéric Bielen, Nathalie Demoulin, (2007) "Waiting time influence on the
satisfaction-loyalty relationship in services", Managing Service Quality, Vol. 17 Iss: 2,
pp.174 – 193
• Imrak, C. E. & Gerdemeli, I. (2009). Asansörler ve yürüyen merdivenler.
Istanbul: Birsen Yayınevi / Mühendislik Dizisi.
• Imrak, C. E., & Fetvacı, M. C. (2004). Yukari yÖnde asansÖr trafİĞİ ve
performans hesabi. MMO, (531), Retrieved from
http://teknolojikarastirmalar.com/frmeIndeksDetay.aspx?IDTarama=1702
• Kenichiro , M., Takashi, I., & Kazuho, Y. (1999). Heuristic algorithm to
41
solve the multi-floor layout problem with the consideration of elevator utilization.
Computers & Industrial Engineering, 36(2), 487–502. Retrieved from
http://dx.doi.org/10.1016/S0360-8352(99)00144-8
• Lee, Y., Kim, T. S., Cho, H., Sung, D. K., & Choi, B. D. (2009).
Performance analysis of an elevator system during up-peak. Mathematical and Computer
Modelling, 49(3-4), 423-431. Retrieved from http://dx.doi.org/10.1016/j.mcm.2008.09.006
• Nagatani , T., & Tobita, K. (2012). Effect of periodic inflow on elevator
traffic. Physica, 391(18), 4397-4405. doi: 10.1016/j.physa.2012.04.013
• Soyoon, L., & Hyokyung, B. (2005). An energy-aware elevator group
control system. In Industrial Informatics (pp. 639 - 643). Retrieved from
http://ieeexplore.ieee.org/xpl/login.jsp?tp=&arnumber=6221620&url=http://
ieeexplore.ieee.org/stamp/stamp.jsp?tp=&arnumber=6221620
• Sun, J., Zhao, Q., & Luh, P. B. (2010). Optimization of group elevator
scheduling with advance information. In Automation Science and Engineering (pp. 352-
363). doi: 10.1109/TASE.2009.2024242
• Taylor, S. (1995). The effects of filled waiting time and service provider
control over the delay on evaluations of service. Journal of the Academy of Marketing
Science, 23(1), 38-48. doi: 10.1007/BF02894610
• Thompson, D. A., Yarnold, P. R., Williams, D. R., & Adams, S. L. (1996).
Effects of actual waiting time, perceived waiting time, information delivery, and
expressive quality on patient satisfaction in the emergency department. Annals of
Emergency Medicine, 28(6), 657–665. Retrieved from http://dx.doi.org/10.1016/S0196-
0644(96)70090-2
• Zong, Q., Wei, L., & Cheng, Y. (2004). Elevator configuration based on the
markov network queuing model. In Intelligent Control and Automation (pp. 236- 239). doi:
10.1109/WCICA.2004.1340564
42
APPENDIX A
Graphical Representation of Survey Results
Rock Bottom60%
Medium35%
Satisfaction5%
i.Satisfaction
Quite Often35%
Sometimes25%
Seldom25%
Never15%
ii.Using of Elevators
43
Left-Side80%
Right-Side20%
iii.Side
"-1" Floor5%
300s Floor15%
400s Floor35%
500s Floor45%
iv.Floor
44
52%
24%
14%
7%
3%
v.WaitingToo Long Long Normal Short While Never
85%
15%
vi."-1" Floor UseNever Seldom Use
45
Never65%
Seldom35%
vii.300s Floor Use
85%
15%
viii.Blocking "-1" or 300s FloorNot Affected Slightly Affected
46
Slightly Affected55%
Complicated Situtation45%
ix.Odd-Even Method's Effect
Block-Off74%
Odd-Even26%
x.Which Solution Way ?
47
APPENDIX B
Survey Paper Example
TC. BAHCESEHIR UNIVERSITY
INDUSTRIAL ENGINEERING DEPARTMENT
CAPSTONE PROJECT SURVEY ABOUT USAGE OF D-BLOCK ELEVATORS
ALİ YILMAZ 0994892
CEYHUN ERCAN 0997824
Q-1 ARE YOU SATISFIED ABOUT USE OF D-BLOCK ELEVATORS ?
1 2 3 4 5
Q-2 HOW OFTEN DO YOU USE THE ELEVATORS?( 1 TO 5; LOW TO HIGH)
1 2 3 4 5
Q-3 WHICH ELEVATORS DO YOU USE GENERALLY?
1- 2(LEFT-SIDE) 3(RIGHT-SIDE)
Q-4 WHICH FLOOR DO YOU USE THE ELEVATORS FOR GENERALLY?(Suppose you are in ground floor)
-1 FLOOR GROUND FLOOR 300s FLOOR 400s FLOOR 500s FLOOR
Q-5 DO YOU WAIT THE ELEVATORS SO MUCH ? (1 TO 5 ; LESS TO MUCH)
1 2 3 4 5
Q-6 HAVE YOU EVER USED THE ELEVATORS TO GO DOWN TO -1 FLOOR BEFORE ? IF YOU USE; HOW OFTEN?
(Suppose you are in ground floor)
YES NO
1 2 3 4 5
Q-7 HAVE YOU EVER USED THE ELEVATORS TO GO DOWN TO 300s FLOOR BEFORE? IF YOU USE; HOW OFTEN?
(Suppose you are in ground floor)
YES NO
1 2 3 4 5
Q-8 IF THE ACCESS OF 300s AND -1 FLOOR FROM THE GROUND FLOOR IS BLOCKED; HOW DO YOU AFFECT BECAUSE OF THIS ACT? (1 TO 5; LESS TO MUCH)
1 2 3 4 5
48
Q-9 IF THE LEFT-SIDE ELEVATORS SEPERATE AS ODD-EVEN TO SOLVE THE TRAFFIC PROBLEM OF THE ELEVATORS, WILL ANY COMPLEX SITUATION OCCUR AT D-BLOCK FOR YOU?( 1 TO 5; LESS TO MUCH)
1 2 3 4 5
Q-10 WHICH METHOD YOU WILL PREFER IF WE ASKED BEFORE , SELECT ONER OF THEM : METHOD TO BLOCK ACCESS( Q8 ) OR ODD-EVEN METHOD ( Q9)
BLOCK THE ACCESS ANY FLOORS (Q-8) ODD-EVEN SIMULATION METHOD(Q-9)
PLEASE SHARE WITH US YOUR SUGGESTIONS :
THANK YOU FOR YOUR ATTENTION
49


