Page 1
Colorado Department of Transportation
2017 Pavement Design Manual
98
TRAFFIC AND CLIMATE
Traffic and climate related inputs required for conducting pavement design and analysis using M-
E Design software are discussed in this chapter.
3.1 Traffic
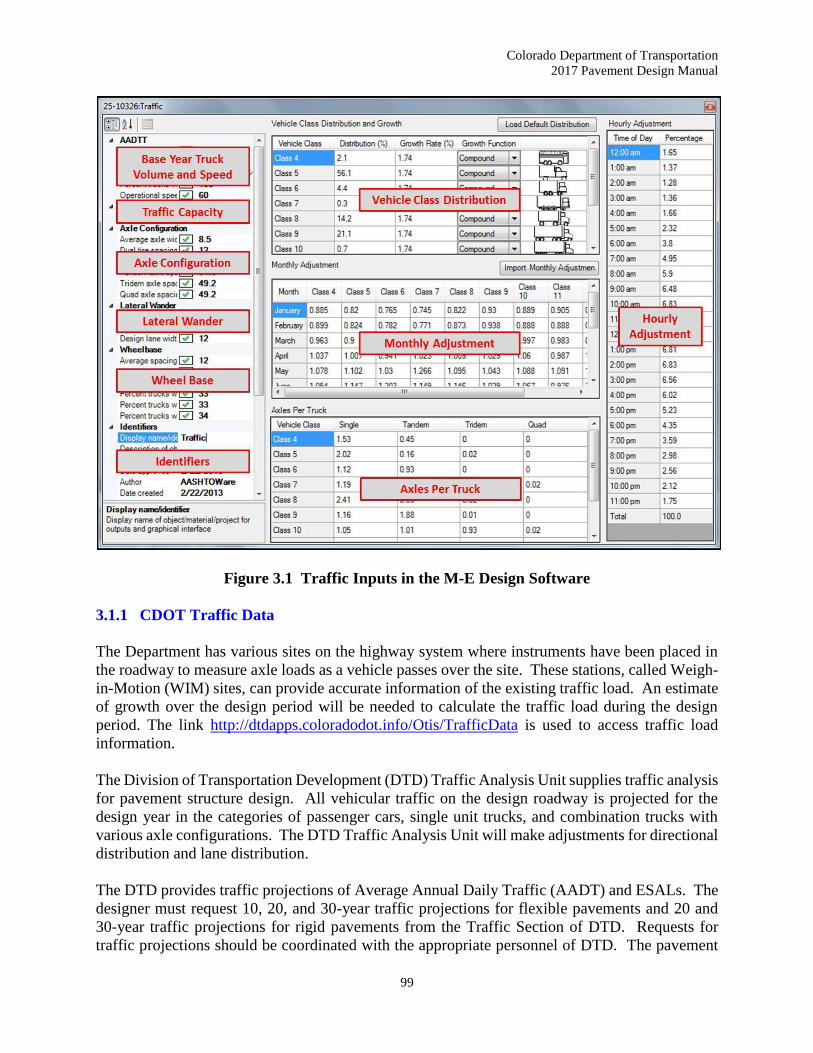
Prior to M-E Design, the number of 18,000-pound Equivalent Single Axle Loads (18-kip ESAL)
represented the amount of traffic and its characteristics. However, M-E Design traffic input
requirements are more detailed and can be categorized as follows, refer to Figure 3.1 Traffic
Inputs in the M-E Design Software:
Base year traffic information
Analysis period or pavement design life
Date newly constructed or rehabilitated pavement is opened to traffic
Two-way average annual daily truck traffic (AADTT)
Number of lanes in design direction
Truck direction distribution factor
Lane distribution factor
Operational speed
Traffic adjustment factors
Monthly adjustment factors
Vehicle class distribution
Truck hourly distribution
Growth rate and type
Number of axles per truck
Axle load distribution factors
General traffic inputs
Lateral wander of axle loads
Axle configuration
Wheelbase
Tire pressure
This section primarily deals with traffic input requirements for pavement designs using M-E
Design software. The 18-kip ESALs are still required for asphalt binder selection, see Section
6.12.3 Binder Selection and pavement designs using the CDOT thin and ultra-thin Concrete
Overlay design procedures. Refer to the CDOT 2012 Pavement Design Manual for information
on traffic characterization using the ESAL methodology.
Page 2
Colorado Department of Transportation
2017 Pavement Design Manual
99
Figure 3.1 Traffic Inputs in the M-E Design Software
3.1.1 CDOT Traffic Data
The Department has various sites on the highway system where instruments have been placed in
the roadway to measure axle loads as a vehicle passes over the site. These stations, called Weigh-
in-Motion (WIM) sites, can provide accurate information of the existing traffic load. An estimate
of growth over the design period will be needed to calculate the traffic load during the design
period. The link http://dtdapps.coloradodot.info/Otis/TrafficData is used to access traffic load
information.
The Division of Transportation Development (DTD) Traffic Analysis Unit supplies traffic analysis
for pavement structure design. All vehicular traffic on the design roadway is projected for the
design year in the categories of passenger cars, single unit trucks, and combination trucks with
various axle configurations. The DTD Traffic Analysis Unit will make adjustments for directional
distribution and lane distribution.
The DTD provides traffic projections of Average Annual Daily Traffic (AADT) and ESALs. The
designer must request 10, 20, and 30-year traffic projections for flexible pavements and 20 and
30-year traffic projections for rigid pavements from the Traffic Section of DTD. Requests for
traffic projections should be coordinated with the appropriate personnel of DTD. The pavement
Page 3
Colorado Department of Transportation
2017 Pavement Design Manual
100
designer can help ensure accurate traffic projections are provided by documenting local conditions
and planned economic development that may affect future traffic loads and volumes. The DTD
should be notified of special traffic situations when traffic data are requested. Some special
situations may include:
A street that is or will be a major arterial route for city buses.
A roadway that will carry truck traffic to and from heavily used distribution or freight
centers.
A highway that will experience an increase in traffic from a connection to a major,
high-traffic area.
A highway that will be constructed in the near future.
A roadway that will experience a decrease in traffic due to the future opening of a
parallel roadway facility.
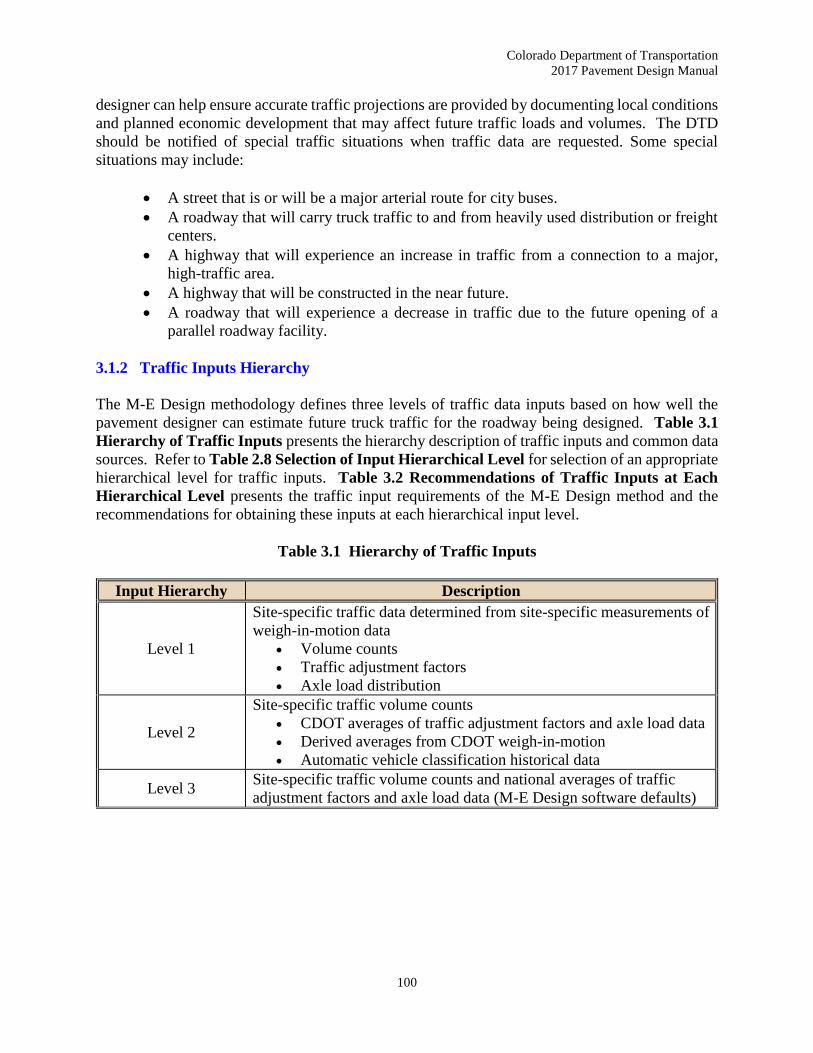
3.1.2 Traffic Inputs Hierarchy
The M-E Design methodology defines three levels of traffic data inputs based on how well the
pavement designer can estimate future truck traffic for the roadway being designed. Table 3.1
Hierarchy of Traffic Inputs presents the hierarchy description of traffic inputs and common data
sources. Refer to Table 2.8 Selection of Input Hierarchical Level for selection of an appropriate
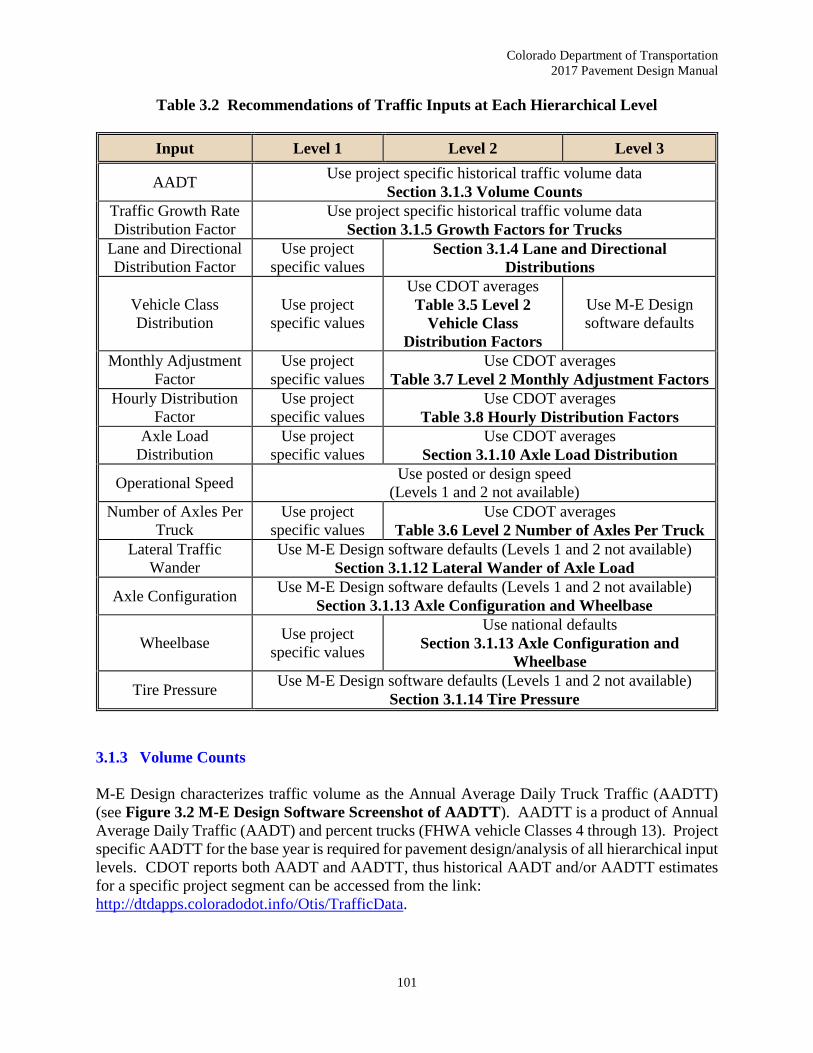
hierarchical level for traffic inputs. Table 3.2 Recommendations of Traffic Inputs at Each
Hierarchical Level presents the traffic input requirements of the M-E Design method and the
recommendations for obtaining these inputs at each hierarchical input level.
Table 3.1 Hierarchy of Traffic Inputs
Input Hierarchy Description
Level 1
Site-specific traffic data determined from site-specific measurements of
weigh-in-motion data
Volume counts
Traffic adjustment factors
Axle load distribution
Level 2
Site-specific traffic volume counts
CDOT averages of traffic adjustment factors and axle load data
Derived averages from CDOT weigh-in-motion
Automatic vehicle classification historical data
Level 3 Site-specific traffic volume counts and national averages of traffic
adjustment factors and axle load data (M-E Design software defaults)
Page 4
Colorado Department of Transportation
2017 Pavement Design Manual
101
Table 3.2 Recommendations of Traffic Inputs at Each Hierarchical Level
Input Level 1 Level 2 Level 3
AADT Use project specific historical traffic volume data
Section 3.1.3 Volume Counts
Traffic Growth Rate
Distribution Factor
Use project specific historical traffic volume data
Section 3.1.5 Growth Factors for Trucks
Lane and Directional
Distribution Factor
Use project
specific values Section 3.1.4 Lane and Directional
Distributions
Vehicle Class
Distribution
Use project
specific values
Use CDOT averages
Table 3.5 Level 2
Vehicle Class
Distribution Factors
Use M-E Design
software defaults
Monthly Adjustment
Factor
Use project
specific values
Use CDOT averages
Table 3.7 Level 2 Monthly Adjustment Factors
Hourly Distribution
Factor
Use project
specific values
Use CDOT averages
Table 3.8 Hourly Distribution Factors
Axle Load
Distribution
Use project
specific values
Use CDOT averages
Section 3.1.10 Axle Load Distribution
Operational Speed Use posted or design speed
(Levels 1 and 2 not available)
Number of Axles Per
Truck
Use project
specific values
Use CDOT averages
Table 3.6 Level 2 Number of Axles Per Truck
Lateral Traffic
Wander
Use M-E Design software defaults (Levels 1 and 2 not available)
Section 3.1.12 Lateral Wander of Axle Load
Axle Configuration Use M-E Design software defaults (Levels 1 and 2 not available)
Section 3.1.13 Axle Configuration and Wheelbase
Wheelbase Use project
specific values
Use national defaults
Section 3.1.13 Axle Configuration and
Wheelbase
Tire Pressure Use M-E Design software defaults (Levels 1 and 2 not available)
Section 3.1.14 Tire Pressure
3.1.3 Volume Counts
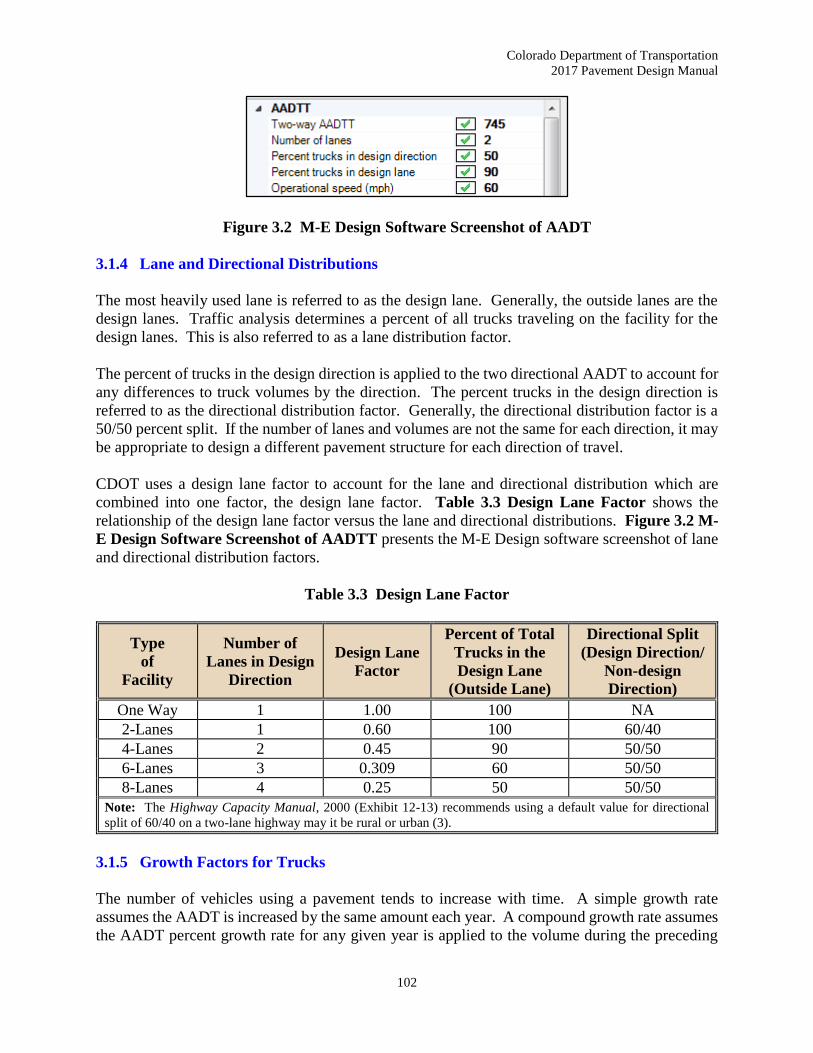
M-E Design characterizes traffic volume as the Annual Average Daily Truck Traffic (AADTT)
(see Figure 3.2 M-E Design Software Screenshot of AADTT). AADTT is a product of Annual
Average Daily Traffic (AADT) and percent trucks (FHWA vehicle Classes 4 through 13). Project
specific AADTT for the base year is required for pavement design/analysis of all hierarchical input
levels. CDOT reports both AADT and AADTT, thus historical AADT and/or AADTT estimates
for a specific project segment can be accessed from the link:
http://dtdapps.coloradodot.info/Otis/TrafficData.
Page 5
Colorado Department of Transportation
2017 Pavement Design Manual
102
Figure 3.2 M-E Design Software Screenshot of AADT
3.1.4 Lane and Directional Distributions
The most heavily used lane is referred to as the design lane. Generally, the outside lanes are the
design lanes. Traffic analysis determines a percent of all trucks traveling on the facility for the
design lanes. This is also referred to as a lane distribution factor.
The percent of trucks in the design direction is applied to the two directional AADT to account for
any differences to truck volumes by the direction. The percent trucks in the design direction is
referred to as the directional distribution factor. Generally, the directional distribution factor is a
50/50 percent split. If the number of lanes and volumes are not the same for each direction, it may
be appropriate to design a different pavement structure for each direction of travel.
CDOT uses a design lane factor to account for the lane and directional distribution which are
combined into one factor, the design lane factor. Table 3.3 Design Lane Factor shows the
relationship of the design lane factor versus the lane and directional distributions. Figure 3.2 M-
E Design Software Screenshot of AADTT presents the M-E Design software screenshot of lane
and directional distribution factors.
Table 3.3 Design Lane Factor
Type
of
Facility
Number of
Lanes in Design
Direction
Design Lane
Factor
Percent of Total
Trucks in the
Design Lane
(Outside Lane)
Directional Split
(Design Direction/
Non-design
Direction)
One Way 1 1.00 100 NA
2-Lanes 1 0.60 100 60/40
4-Lanes 2 0.45 90 50/50
6-Lanes 3 0.309 60 50/50
8-Lanes 4 0.25 50 50/50
Note: The Highway Capacity Manual, 2000 (Exhibit 12-13) recommends using a default value for directional
split of 60/40 on a two-lane highway may it be rural or urban (3).
3.1.5 Growth Factors for Trucks
The number of vehicles using a pavement tends to increase with time. A simple growth rate
assumes the AADT is increased by the same amount each year. A compound growth rate assumes
the AADT percent growth rate for any given year is applied to the volume during the preceding
Page 6
Colorado Department of Transportation
2017 Pavement Design Manual
103
year. CDOT a the compound growth rate. Use equation Eq. 3-1 or Table 3.4 Growth Rate
Determined Using OTIS 20-Year Growth Factor.
Tf = (1+r)n Eq. 3-1
Where:
Tf = growth factor
r = rate if growth expressed as a fraction
n = number of years
The CDOT traffic analysis unit may be consulted to estimate the increase in truck traffic over time
(using the M-E Design approach). The M-E Design software has the capability to use different
growth rates for different truck classes, but assumes the growth rate remains the same throughout
the analysis period, see Figure 3.3 M-E Design Software Screenshot of Growth Rate.
Additionally, the estimated traffic volumes to be used in the pavement design can be subjected to
roadway capacity limits. Project specific growth rates are required for pavement design/analysis
for all hierarchical input levels. An estimate of truck volume growth over the design period can
be accessed from the link http://dtdapps.coloradodot.info/Otis/TrafficData.
Figure 3.3 M-E Design Software Screenshot of Growth Rate
Page 7
Colorado Department of Transportation
2017 Pavement Design Manual
104
Table 3.4 Growth Rate Determined Using OTIS 20-Year Growth Factor
20 Year Growth
Factor (OTIS)
r
(%)
20 Year Growth
Factor (OTIS)
r
(%)
1.00 0.000 2.30 4.256
1.05 0.245 2.35 4.364
1.10 0.478 2.40 4.475
1.15 0.703 2.45 4.584
1.20 0.916 2.50 4.690
1.25 1.122 2.55 4.793
1.30 1.320 2.60 4.894
1.35 1.512 2.65 4.995
1.40 1.697 2.70 5.092
1.45 1.877 2.75 5.179
1.50 2.048 2.80 5.283
1.55 2.196 2.85 5.377
1.60 2.378 2.90 5.464
1.65 2.535 2.95 5.559
1.70 2.689 3.00 5.647
1.75 2.840 3.05 5.834
1.80 2.983 3.10 5.820
1.85 3.123 3.15 5.905
1.90 3.261 3.20 5.988
1.95 3.393 3.25 6.070
2.00 3.526 3.30 6.149
2.05 3.655 3.35 6.232
2.10 3.784 3.40 6.310
2.15 3.902 3.45 6.386
2.20 4.021 3.50 6.465
2.25 4.139
3.1.6 Vehicle Classification
M-E Design requires a vehicle class distribution which represents the percentage of each truck
class (Classes 4 through 13) within the truck traffic distribution as part of the AADTT for the base
year. The sum of the percent AADTT of all truck classes should equal 100. This normalized
distribution is determined from an analysis of AVC data and represents data collected over
multiple years. CDOT uses a classification scheme of categorizing vehicles into three bins. These
vehicle classifications types are (1):
Passenger vehicles: Classes 1-3 are 0-20 feet
Single unit trucks: Classes 4-7 are 20-40 feet
Combination trucks: Classes 8-13 and greater than 40 feet long
Page 8
Colorado Department of Transportation
2017 Pavement Design Manual
105
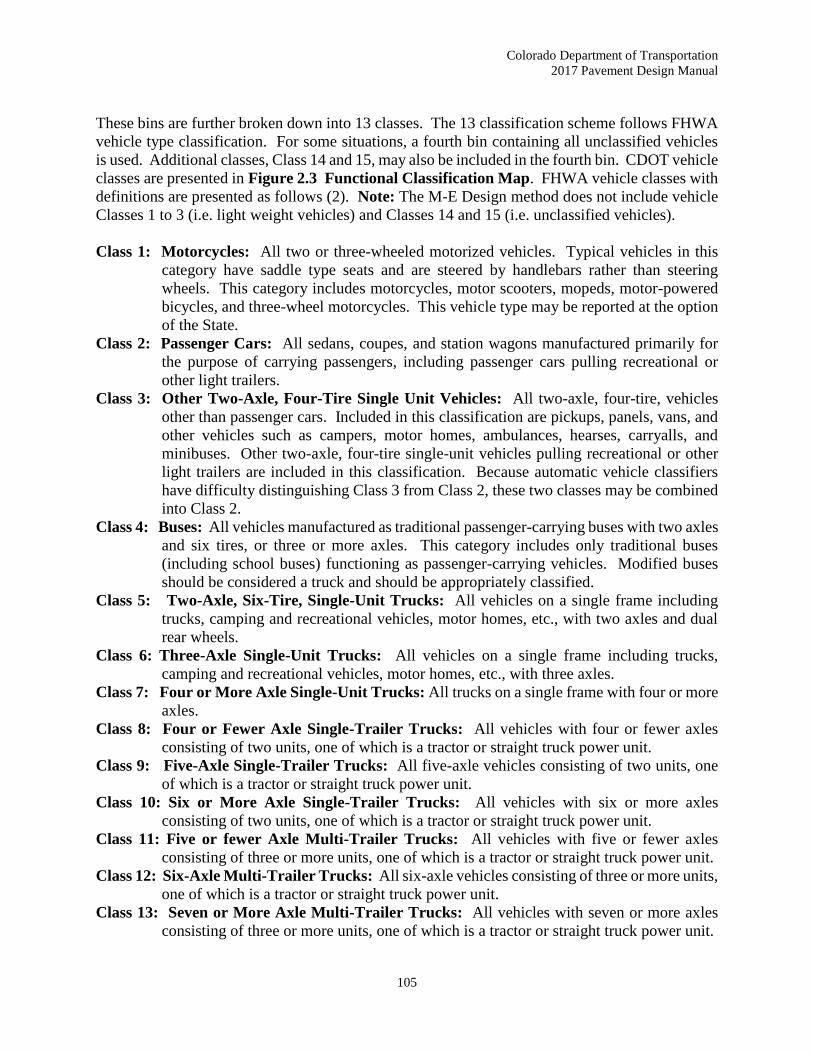
These bins are further broken down into 13 classes. The 13 classification scheme follows FHWA
vehicle type classification. For some situations, a fourth bin containing all unclassified vehicles
is used. Additional classes, Class 14 and 15, may also be included in the fourth bin. CDOT vehicle
classes are presented in Figure 2.3 Functional Classification Map. FHWA vehicle classes with
definitions are presented as follows (2). Note: The M-E Design method does not include vehicle
Classes 1 to 3 (i.e. light weight vehicles) and Classes 14 and 15 (i.e. unclassified vehicles).
Class 1: Motorcycles: All two or three-wheeled motorized vehicles. Typical vehicles in this
category have saddle type seats and are steered by handlebars rather than steering
wheels. This category includes motorcycles, motor scooters, mopeds, motor-powered
bicycles, and three-wheel motorcycles. This vehicle type may be reported at the option
of the State.
Class 2: Passenger Cars: All sedans, coupes, and station wagons manufactured primarily for
the purpose of carrying passengers, including passenger cars pulling recreational or
other light trailers.
Class 3: Other Two-Axle, Four-Tire Single Unit Vehicles: All two-axle, four-tire, vehicles
other than passenger cars. Included in this classification are pickups, panels, vans, and
other vehicles such as campers, motor homes, ambulances, hearses, carryalls, and
minibuses. Other two-axle, four-tire single-unit vehicles pulling recreational or other
light trailers are included in this classification. Because automatic vehicle classifiers
have difficulty distinguishing Class 3 from Class 2, these two classes may be combined
into Class 2.
Class 4: Buses: All vehicles manufactured as traditional passenger-carrying buses with two axles
and six tires, or three or more axles. This category includes only traditional buses
(including school buses) functioning as passenger-carrying vehicles. Modified buses
should be considered a truck and should be appropriately classified.
Class 5: Two-Axle, Six-Tire, Single-Unit Trucks: All vehicles on a single frame including
trucks, camping and recreational vehicles, motor homes, etc., with two axles and dual
rear wheels.
Class 6: Three-Axle Single-Unit Trucks: All vehicles on a single frame including trucks,
camping and recreational vehicles, motor homes, etc., with three axles.
Class 7: Four or More Axle Single-Unit Trucks: All trucks on a single frame with four or more
axles.
Class 8: Four or Fewer Axle Single-Trailer Trucks: All vehicles with four or fewer axles
consisting of two units, one of which is a tractor or straight truck power unit.
Class 9: Five-Axle Single-Trailer Trucks: All five-axle vehicles consisting of two units, one
of which is a tractor or straight truck power unit.
Class 10: Six or More Axle Single-Trailer Trucks: All vehicles with six or more axles
consisting of two units, one of which is a tractor or straight truck power unit.
Class 11: Five or fewer Axle Multi-Trailer Trucks: All vehicles with five or fewer axles
consisting of three or more units, one of which is a tractor or straight truck power unit.
Class 12: Six-Axle Multi-Trailer Trucks: All six-axle vehicles consisting of three or more units,
one of which is a tractor or straight truck power unit.
Class 13: Seven or More Axle Multi-Trailer Trucks: All vehicles with seven or more axles
consisting of three or more units, one of which is a tractor or straight truck power unit.
Page 9
Colorado Department of Transportation
2017 Pavement Design Manual
106
Note: In reporting information on trucks the following criteria should be used:
Truck tractor units traveling without a trailer will be considered single-unit trucks.
A truck tractor unit pulling other such units in a "saddle mount" configuration will be
considered one single-unit truck and defined only by the axles on the pulling unit.
Vehicles are defined by the number of axles in contact with the road, therefore, "floating"
axles are counted only when in the down position.
The term "trailer" includes both semi and full trailers.
Page 10
Colorado Department of Transportation
2017 Pavement Design Manual
107
Figure 3.4 CDOT Vehicle Classifications
Class Schema Description
8four or less axles,
single trailers
9 f ive axles,
single trailers
10 six or more axles,
single trailers
11f ive or less axles,
multi-trailers
12 six axles,
multi-trailers
13 seven or more axles,
multi-trailers
Co
mb
inatio
n U
nit
Vehic
les
14
Not used15
Unclassif iable
vehicle
Uncla
ssif
ied
Vehic
les
4buses
single/dual wheels
two axle,
single unit
single/dual wheels5
three axle,
single unit6
four axle,
single unit7
Sin
gle
Unit
Vehic
les
1all motorcycles plus
two wheel axles
all cars plus
one/two axle trailers2
3
all pickups and vans
single/dual wheels
plus
one/two/three axle
trailers
Lig
ht-
weig
ht
Vehic
les
Page 11
Colorado Department of Transportation
2017 Pavement Design Manual
108
For M-E Design, the vehicle class distribution inputs can be defined at three hierarchical input
levels. See Figure 3.5 M-E Design Software Screenshot of Vehicle Class Distribution. The
three input levels are described in the following sections.
3.1.6.1 Level 1 Vehicle Class Inputs
Level 1 inputs are the actual measured site data (over 24-hours) and must be used for highways
with heavy seasonal and atypical traffic. This data can be obtained from the CDOT DTD.
3.1.6.2 Level 2 Vehicle Class Inputs
Level 2 inputs are the regional average values determined from traffic analyses of data from
various WIM and AVC sites in Colorado. The traffic data analyses indicated three vehicle class
distribution clusters defined according to location and highway functional class. The descriptions
of vehicle class clusters are presented as follows, refer to Table 3.5 Class 5 and Class 9
Distribution per Cluster Type):
Cluster 1: This distribution had one large primary peak for Class 5 vehicles with
percentage ranging from 40 to 75. There was a secondary peak for Class 8 and 9 trucks
with percentage ranging from 10 to 30 percent. The main highway functional class was 4-
lane rural principal arterials (non-interstate, US highways and state routes), and a few
sections of urban freeways.
Cluster 2: This distribution had two distinct peaks for Class 5 and 9 vehicles. The
percentage of Class 5 ranged from 5 to 35 and the percentage of Class 9 ranged from 40 to
80. The main highway functional class was 4-lane rural principal arterial, interstate, and
highways.
Cluster 3: This distribution had two distinct peaks for Class 5 and 9 vehicles with
percentages of each class ranging from 15 to 50, with Class 9 trucks having a slightly higher
percentage than other truck types. The main highway functional classes were 2-lane rural
principal arterials (other), 2-lane rural major collectors, and 4-lane urban principal arterials.
Table 3.5 Class 5 and Class 9 Distribution Per Cluster Type
Cluster
Class 5
Distribution
(%)
Class 9
Distribution
(%)
Most Common Highway
Functional Class
Cluster 1 40-75 10-30 4-lane rural principal arterial (non-interstate)
A few urban freeways
Cluster 2 5-35 40-80 4-lane rural principal arterial (other)
Interstate highways
Cluster 3 15-50 15-50
2-lane rural principal arterial (other)
2-lane rural major collector
4-lane urban principal arterial
Page 12
Colorado Department of Transportation
2017 Pavement Design Manual
109
As a minimum, selection of the appropriate cluster type must be based on project location as shown
in Table 3.6 Level 2 Vehicle Class Distribution Factors and Figure 3.6 Vehicle Class
Distribution Factors for CDOT Clusters. Designers must choose the default vehicle class
distribution for the cluster that most closely describes the design traffic stream for the roadway
under design.
3.1.6.3 Level 3 Vehicle Class Inputs
For situations, where CDOT clusters are not suitable and Level 1 data is not available, designers
may use an appropriate default Truck Traffic Class (TTC) group in the M-E Design software. TTC
factors were developed using traffic data from over a 100 WIM and AVC sites located nationwide.
The data was obtained from FHWA LTPP program data.
Designers may select the most appropriate from seventeen TTC groups that best describe the truck
traffic mix of a given project. Figure 3.7 Truck Traffic Classification Groups presents a
screenshot of the seventeen TTC groups and their descriptions in the M-E Design software.
Figure 3.5 M-E Design Software Screenshot of Vehicle Class Distribution
Page 13
Colorado Department of Transportation
2017 Pavement Design Manual
110
Table 3.6 Level 2 CDOT Vehicle Class Distribution Factors
Vehicle
Class
Cluster 1 (Predominately Class 5)
Cluster 2 (Predominately Class 9)
Cluster 3
(Predominately Class 5 and 9)
4-Lane Rural Principal
Arterial
(Non-Interstate)
4-Lane Rural Principal Arterial
(Interstates and Highways)
2-Lane Rural Principal Arterial (other)
2-Lane Rural Major Collector
4-Lane Urban Principal Arterial
4 2.1 2.7 5.1
5 56.1 19.3 32.3
6 4.4 4.5 18
7 0.3 0.3 0.3
8 14.2 4.6 4.9
9 21.1 61.9 36.8
10 0.7 1.6 1.2
11 0.7 2.7 0.7
12 0.2 1.3 0.5
13 0.2 1.1 0.2
0
10
20
30
40
50
60
70
VC 4 VC 5 VC 6 VC 7 VC 8 VC 9 VC 10 VC 11 VC 12 VC 13
Perc
en
t
Vehicle Class
Cluster 1 Cluster 2 Cluster 3
Figure 3.6 Vehicle Class Distribution Factors for CDOT Clusters
Page 14
Colorado Department of Transportation
2017 Pavement Design Manual
111
Figure 3.7 Truck Traffic Classification Groups
3.1.7 Number of Axles per Truck
This input represents the average number of axles for each truck class (FHWA vehicle Class 4 to
13) and each axle type (single, tandem, tridem, and quad). For the M-E Design, the number of
axles per truck can be defined at three hierarchical input levels. Figure 3.8 M-E Design
Screenshot of Number of Axles Per Truck presents the M-E Design software screenshot for the
number of axles per truck. Three input levels are described in the following sections.
3.1.7.1 Level 1 Number of Axles Per Truck
Level 1 inputs are the actual measured site data and must be used for highways with heavy seasonal
and atypical traffic. This data can be obtained from the CDOT DTD.
3.1.7.2 Level 2 Number of Axles Per Truck
Level 2 inputs are the statewide average values determined from traffic analyses of data from
various WIM and AVC sites in Colorado. Refer to Table 3.7 Level 2 Number of Axles Per
Truck for CDOT statewide averages.
3.1.7.3 Level 3 Number of Axles Per Truck
Level 3 inputs are the M-E Design software defaults. This level is not recommended.
Page 15
Colorado Department of Transportation
2017 Pavement Design Manual
112
Figure 3.8 M-E Design Screenshot of Number of Axles Per Truck
Table 3.7 Level 2 Number of Axles Per Truck
Vehicle Class Single Axle Tandem Axle Tridem Axle Quad Axle
4 1.53 0.45 0.00 0.00
5 2.02 0.16 0.02 0.00
6 1.12 0.94 0.00 0.00
7 1.19 0.07 0.45 0.02
8 2.41 0.56 0.02 0.00
9 1.16 1.90 0.01 0.00
10 1.15 1.01 0.93 0.02
11 4.35 0.29 0.02 0.00
12 3.27 1.22 0.09 0.00
13 2.77 1.40 0.51 0.04
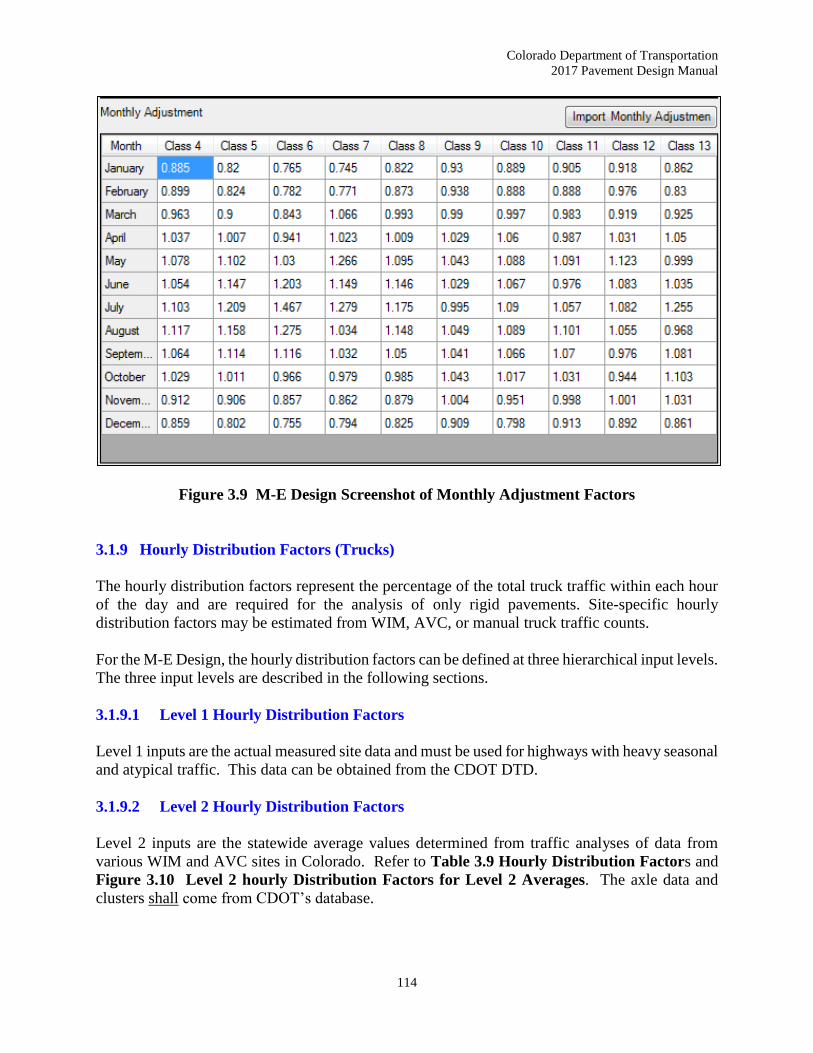
3.1.8 Monthly Adjustment Factors (Trucks)
Truck traffic monthly adjustment factors represent the proportion of the annual truck traffic for a
given truck class that occurs in a specific month. The sum of monthly factors for all months for
each vehicle class must equal 12. These monthly distribution factors may be determined from
WIM, AVC, or manual truck traffic counts. Axle data shall come from CDOT’s data base.
For the M-E Design, the monthly adjustment factors can be defined at three hierarchical input
levels, see Figure 3.9 M-E Design Screenshot of Monthly Adjustment Factors. The input
levels are described in the following sections.
Page 16
Colorado Department of Transportation
2017 Pavement Design Manual
113
3.1.8.1 Level 1 Monthly Adjustment Factors
Level 1 inputs are the actual measured site data and must be used for highways with heavy seasonal
and atypical traffic. This data can be obtained from the CDOT DTD.
3.1.8.2 Level 2 Monthly Adjustment Factors
Level 2 inputs are the statewide average values determined from traffic analyses of data from
various WIM and AVC sites in Colorado. Refer to Table 3.8 Level 2 Monthly Adjustment
Factors for Level 2 averages. The axle data and clusters shall come from CDOT’s data base.
3.1.8.3 Level 3 Monthly Adjustment Factors
Level 3 inputs are the M-E Design software defaults. This level is not recommended for use on
CDOT projects
Table 3.8 Level 2 Monthly Adjustment Factors
Month Vehicle/Truck Class
4 5 6 7 8 9 10 11 12 13
Jan 0.885 0.820 0.765 0.745 0.822 0.930 0.889 0.905 0.918 0.862
Feb 0.899 0.824 0.782 0.771 0.873 0.938 0.888 0.888 0.976 0.830
Mar 0.963 0.900 0.843 1.066 0.993 0.990 0.997 0.983 0.919 0.925
Apr 1.037 1.007 0.941 1.023 1.009 1.029 1.060 0.987 1.031 1.050
May 1.078 1.102 1.030 1.266 1.095 1.043 1.088 1.091 1.123 0.999
Jun 1.054 1.147 1.203 1.149 1.146 1.029 1.067 0.976 1.083 1.035
Jul 1.103 1.209 1.467 1.279 1.175 0.995 1.090 1.057 1.082 1.255
Aug 1.117 1.158 1.275 1.034 1.148 1.049 1.089 1.101 1.055 0.968
Sep 1.064 1.114 1.116 1.032 1.050 1.041 1.066 1.070 0.976 1.081
Oct 1.029 1.011 0.966 0.979 0.985 1.043 1.017 1.031 0.944 1.103
Nov 0.912 0.906 0.857 0.862 0.879 1.004 0.951 0.998 1.001 1.031
Dec 0.859 0.802 0.755 0.794 0.825 0.909 0.798 0.913 0.892 0.861
Page 17
Colorado Department of Transportation
2017 Pavement Design Manual
114
Figure 3.9 M-E Design Screenshot of Monthly Adjustment Factors
3.1.9 Hourly Distribution Factors (Trucks)
The hourly distribution factors represent the percentage of the total truck traffic within each hour
of the day and are required for the analysis of only rigid pavements. Site-specific hourly
distribution factors may be estimated from WIM, AVC, or manual truck traffic counts.
For the M-E Design, the hourly distribution factors can be defined at three hierarchical input levels.
The three input levels are described in the following sections.
3.1.9.1 Level 1 Hourly Distribution Factors
Level 1 inputs are the actual measured site data and must be used for highways with heavy seasonal
and atypical traffic. This data can be obtained from the CDOT DTD.
3.1.9.2 Level 2 Hourly Distribution Factors
Level 2 inputs are the statewide average values determined from traffic analyses of data from
various WIM and AVC sites in Colorado. Refer to Table 3.9 Hourly Distribution Factors and
Figure 3.10 Level 2 hourly Distribution Factors for Level 2 Averages. The axle data and
clusters shall come from CDOT’s database.
Page 18
Colorado Department of Transportation
2017 Pavement Design Manual
115
3.1.9.3 Level 3 Hourly Distribution Factors
Level 3 inputs are the M-E Design software defaults. This level is not recommended.
Table 3.9 Hourly Distribution Factors
Time Period Distribution,
percent Time Period
Distribution,
percent
12:00 a.m. - 1:00 a.m. 1.65 12:00 p.m. - 1:00 p.m. 6.75
1:00 a.m. - 2:00 a.m. 1.37 1:00 p.m. - 2:00 p.m. 6.81
2:00 a.m. - 3:00 a.m. 1.28 2:00 p.m. - 3:00 p.m. 6.83
3:00 a.m. - 4:00 a.m. 1.36 3:00 p.m. - 4:00 p.m. 6.56
4:00 a.m. - 5:00 a.m. 1.66 4:00 p.m. - 5:00 p.m. 6.02
5:00 a.m. - 6:00 a.m. 2.32 5:00 p.m. - 6:00 p.m. 5.23
6:00 a.m. - 7:00 a.m. 3.80 6:00 p.m. - 7:00 p.m. 4.35
7:00 a.m. - 8:00 a.m. 4.95 7:00 p.m. - 8:00 p.m. 3.59
8:00 a.m. - 9:00 a.m. 5.90 8:00 p.m. - 9:00 p.m. 2.98
9:00 a.m. - 10:00 a.m. 6.48 9:00 p.m. - 10:00 p.m. 2.56
10:00 a.m. – 11:00 a.m. 6.83 10:00 p.m. - 11:00 p.m. 2.12
11:00 a.m. – 12:00 p.m. 6.85 11:00 p.m. - 12:00 a.m. 1.75
0.0
1.0
2.0
3.0
4.0
5.0
6.0
7.0
8.0
12:0
0 A
M
1:0
0 A
M
2:0
0 A
M
3:0
0 A
M
4:0
0 A
M
5:0
0 A
M
6:0
0 A
M
7:0
0 A
M
8:0
0 A
M
9:0
0 A
M
10:0
0 A
M
11
:00
AM
12
:00
PM
1:0
0 P
M
2:0
0 P
M
3:0
0 P
M
4:0
0 P
M
5:0
0 P
M
6:0
0 P
M
7:0
0 P
M
8:0
0 P
M
9:0
0 P
M
10:0
0 P
M
11:0
0 P
M
Per
cen
t D
istr
ibu
tion
of
Tru
cks
Time of the Day
Figure 3.10 Level 2 Hourly Distribution Factors
Page 19
Colorado Department of Transportation
2017 Pavement Design Manual
116
3.1.10 Axle Load Distribution
The axle load distribution factors represent the percentage of the total axle applications within each
load interval for a specific axle type (single, tandem, tridem, and quad) and vehicle class (Classes
4 through 13). A definition of load intervals for each axle type is provided below:
Single Axles: 3,000 lb to 40,000 lb at 1,000-lb intervals
Tandem Axles: 6,000 lb to 80,000 lb at 2,000-lb intervals
Tridem and Quad Axles: 12,000 lb to 102,000 lb at 3,000-lb intervals. Developing
site-specific axle load distribution factors involves the processing of a massive amount
of WIM data. The processing should be completed external to the M-E Design software
using traffic loading analysis software.
For M-E Design, the axle load distribution factors can be defined at three hierarchial input levels.
See Figure 3.11 Single Axle Distribution in the M-E Design Software for a screenshot of axle
load distribution factors in the M-E Design software. The input levels are described in the
following sections.
3.1.10.1 Level 1 Axle Load Distribution Factors
Level 1 inputs are the actual measured site data and must be used for highways with unique traffic
characteristics and heavy haul routes (i.e. mining, lumber, and agricultural routes). This data can
be obtained from the CDOT DTD.
3.1.10.2 Level 2 Axle Load Distribution Factors
Level 2 inputs are the statewide average values determined from traffic analyses of data from
various WIM and AVC sites in Colorado. Table 3.10 Level 2 Axle Load Distribution Factors
(Percentages) through Table 3.13 Level 2 Quad Axle Load Distribution Factors
(Percentages), presents the CDOT averages of axle load distribution factors for single, tandem,
tridem and quad axles for each truck class, respectively. The axle data and clusters shall come
from CDOT’s data base.
Figure 3.12 CDOT Averages of Single Axle Load Distribution (Classes 5 and 9 only) presents
the load distributions of single axles for vehicle Classes 5 and 9. Figure 3.13 CDOT Averages
of Tandem Axle Load Distribution (Classes 5 and 9 only) presents the load distributions of
tandem axles for vehicle Classes 5 and 9. Electronic versions of the Level 2 axle load distributions
factors can be obtained from the CDOT Pavement Design office.
3.1.10.3 Level 3 Axle Load Distribution Factors
Level 3 inputs are the M-E Design software defaults. This level is not recommended for use on
CDOT projects.
Page 20
Colorado Department of Transportation
2017 Pavement Design Manual
117
Figure 3.11 Single Axle Distribution in the M-E Design Software
Page 21
Colorado Department of Transportation
2017 Pavement Design Manual
118
Table 3.10 Level 2 Single Axle Load Distribution Factors (Percentages)
Mean Axle
Load
(lbs.)
Vehicle/Truck Class
4 5 6 7 8 9 10 11 12 13
3,000 0.24 4.71 2.19 3.49 8.44 1.39 0.76 1.85 1.51 2.59
4,000 0.78 11.26 2.75 3.13 7.28 2.51 1.41 2.11 2.97 3.03
5,000 1.77 16.33 3.98 2.56 7.40 3.00 2.30 3.59 4.66 3.27
6,000 5.24 18.85 5.03 2.64 8.36 3.54 3.49 6.44 8.65 5.20
7,000 8.19 12.49 4.79 2.86 8.10 3.41 3.73 6.09 7.66 4.89
8,000 12.87 10.93 7.67 3.92 10.75 5.87 6.41 8.41 10.14 7.37
9,000 10.32 6.13 9.77 3.87 9.17 9.19 9.18 9.19 11.54 8.06
10,000 11.46 5.22 15.52 5.65 10.06 18.64 17.04 12.53 14.27 10.20
11,000 9.21 2.97 12.24 6.04 6.37 17.62 15.60 9.05 9.77 8.25
12,000 9.87 2.56 10.78 7.46 5.59 14.63 14.47 8.87 8.93 8.60
13,000 6.45 1.39 5.47 6.33 3.07 5.65 7.00 5.49 4.75 5.97
14,000 7.05 1.62 5.52 8.39 3.56 4.26 6.33 6.88 5.34 8.08
15,000 4.78 1.15 3.54 7.22 2.55 2.32 3.63 5.22 3.41 6.20
16,000 2.68 0.69 2.06 5.82 1.55 1.50 1.92 3.20 1.74 3.64
17,000 2.53 0.79 2.15 7.44 1.76 1.64 1.80 3.50 1.70 3.88
18,000 1.56 0.52 1.42 4.57 1.18 1.23 1.05 2.15 0.76 2.19
19,000 1.35 0.51 1.28 4.82 1.15 1.11 0.80 1.84 0.63 1.96
20,000 0.83 0.33 0.79 3.63 0.73 0.68 0.54 1.01 0.35 1.20
21,000 0.76 0.32 0.67 2.78 0.65 0.51 0.51 0.82 0.26 0.94
22,000 0.47 0.21 0.42 1.79 0.38 0.30 0.31 0.40 0.20 0.58
23,000 0.41 0.22 0.36 1.46 0.34 0.23 0.26 0.29 0.18 0.51
24,000 0.23 0.15 0.23 0.76 0.20 0.16 0.22 0.26 0.09 0.42
25,000 0.20 0.16 0.21 0.62 0.19 0.14 0.20 0.14 0.08 0.45
26,000 0.13 0.12 0.15 0.53 0.13 0.09 0.14 0.08 0.05 0.47
27,000 0.11 0.08 0.13 0.60 0.12 0.08 0.13 0.08 0.07 0.29
28,000 0.06 0.03 0.08 0.33 0.07 0.05 0.08 0.06 0.04 0.12
29,000 0.07 0.03 0.08 0.31 0.07 0.04 0.08 0.06 0.04 0.17
30,000 0.06 0.02 0.06 0.30 0.05 0.03 0.06 0.05 0.03 0.10
31,000 0.03 0.02 0.04 0.09 0.04 0.02 0.04 0.03 0.01 0.07
32,000 0.03 0.02 0.04 0.16 0.04 0.02 0.04 0.03 0.01 0.08
33,000 0.02 0.01 0.03 0.11 0.03 0.01 0.03 0.02 0.01 0.06
34,000 0.02 0.01 0.03 0.05 0.03 0.01 0.05 0.02 0.00 0.09
35,000 0.01 0.01 0.02 0.02 0.02 0.01 0.01 0.01 0.00 0.03
36,000 0.01 0.01 0.02 0.01 0.02 0.01 0.03 0.01 0.01 0.05
37,000 0.01 0.00 0.02 0.04 0.02 0.00 0.01 0.01 0.00 0.03
38,000 0.01 0.01 0.02 0.02 0.02 0.00 0.01 0.02 0.00 0.05
39,000 0.00 0.00 0.01 0.01 0.01 0.00 0.02 0.00 0.00 0.03
40,000 0.00 0.00 0.01 0.03 0.02 0.00 0.01 0.00 0.00 0.02
41,000 0.14 0.14 0.42 0.16 0.45 0.09 0.31 0.18 0.11 0.89
Page 22
Colorado Department of Transportation
2017 Pavement Design Manual
119
Table 3.11 Level 2 Tandem Axle Load Distribution Factors (Percentages)
Mean Axle
Load, lbs. Vehicle/Truck Class
4 5 6 7 8 9 10 11 12 13
6,000 0.41 38.29 2.94 12.80 18.36 3.21 0.90 4.34 2.19 3.22
8,000 1.51 24.51 7.75 2.15 9.01 5.20 1.57 1.62 3.19 3.76
10,000 2.68 16.41 12.42 3.45 9.79 7.57 3.08 3.78 4.89 5.06
12,000 4.17 8.75 12.11 3.65 10.51 8.61 5.30 6.50 9.15 7.11
14,000 4.46 4.66 9.72 3.15 10.15 8.29 7.08 13.11 10.75 8.50
16,000 4.82 2.61 7.83 0.70 8.39 7.24 8.17 8.03 11.61 8.73
18,000 6.53 1.60 6.30 2.20 6.65 6.08 8.73 8.03 12.58 8.04
20,000 8.19 1.03 5.26 0.65 5.50 5.21 8.66 8.31 12.86 7.51
22,000 9.39 0.71 4.49 3.40 4.33 4.74 8.02 9.39 10.78 7.33
24,000 10.04 0.49 3.86 4.00 3.33 4.50 7.08 9.00 8.14 6.27
26,000 9.41 0.31 3.47 6.15 2.41 4.53 6.35 8.10 5.33 5.05
28,000 8.81 0.21 3.20 2.10 1.83 4.77 6.00 6.46 3.37 4.19
30,000 8.53 0.14 3.32 4.35 1.60 5.41 5.67 4.88 2.06 4.46
32,000 6.48 0.08 2.94 3.15 1.19 5.40 4.73 2.95 0.97 3.34
34,000 4.95 0.05 2.71 5.85 1.08 5.48 4.21 2.16 0.55 2.91
36,000 3.51 0.03 2.48 5.85 0.97 4.66 3.51 1.02 0.33 2.83
38,000 2.10 0.02 2.15 7.55 0.88 3.28 2.54 0.61 0.34 2.16
40,000 1.29 0.02 1.74 6.05 0.74 2.01 1.99 0.44 0.27 2.17
42,000 0.78 0.01 1.39 4.00 0.60 1.20 1.64 0.32 0.15 1.34
44,000 0.52 0.01 1.05 2.50 0.50 0.77 1.10 0.19 0.09 0.83
46,000 0.37 0.01 0.75 3.85 0.39 0.52 0.81 0.09 0.04 0.84
48,000 0.26 0.00 0.52 1.20 0.30 0.36 0.70 0.09 0.12 0.93
50,000 0.19 0.00 0.37 1.60 0.23 0.26 0.53 0.08 0.03 0.62
52,000 0.13 0.02 0.34 4.15 0.19 0.19 0.37 0.05 0.02 0.87
54,000 0.11 0.01 0.24 1.15 0.15 0.14 0.26 0.04 0.02 0.31
56,000 0.08 0.01 0.18 1.40 0.13 0.10 0.20 0.05 0.04 0.28
58,000 0.05 0.00 0.12 0.15 0.11 0.07 0.16 0.03 0.01 0.23
60,000 0.04 0.00 0.08 1.00 0.08 0.05 0.15 0.03 0.02 0.15
62,000 0.03 0.00 0.06 0.75 0.07 0.04 0.11 0.07 0.01 0.12
64,000 0.02 0.00 0.05 0.60 0.05 0.03 0.07 0.02 0.00 0.22
66,000 0.01 0.00 0.03 0.00 0.05 0.02 0.05 0.01 0.00 0.09
68,000 0.01 0.00 0.03 0.00 0.03 0.02 0.10 0.01 0.00 0.11
70,000 0.01 0.00 0.01 0.00 0.03 0.01 0.03 0.01 0.00 0.04
72,000 0.00 0.00 0.02 0.40 0.02 0.01 0.03 0.01 0.00 0.05
74,000 0.01 0.00 0.01 0.00 0.03 0.01 0.01 0.01 0.00 0.05
76,000 0.00 0.00 0.01 0.00 0.02 0.00 0.02 0.01 0.00 0.03
78,000 0.00 0.00 0.00 0.00 0.02 0.00 0.01 0.01 0.00 0.02
80,000 0.00 0.00 0.00 0.00 0.02 0.00 0.01 0.01 0.00 0.02
82,000 0.05 0.00 0.05 0.00 0.23 0.04 0.06 0.16 0.05 0.25
Page 23
Colorado Department of Transportation
2017 Pavement Design Manual
120
Table 3.12 Level 2 Tridem Axle Load Distribution Factors (Percentages)
Mean Axle
Load, lbs. Vehicle/Truck Class
4 5 6 7 8 9 10 11 12 13
12,000 0.00 65.36 0.00 4.82 11.33 38.87 15.53 0.00 19.21 3.20
15,000 0.00 17.43 0.00 3.96 7.69 11.93 10.88 0.00 6.55 4.21
18,000 0.00 8.73 0.00 3.78 9.59 8.99 9.05 0.00 6.99 4.87
21,000 0.00 4.26 0.00 6.28 9.32 5.50 7.23 0.00 14.85 3.31
24,000 0.00 1.65 0.00 3.79 7.83 3.82 6.03 0.00 3.22 2.59
27,000 0.00 0.98 0.00 5.04 7.42 3.24 6.05 0.00 0.63 3.11
30,000 0.00 0.48 0.00 4.84 7.77 2.90 5.79 0.00 3.41 3.75
33,000 0.00 0.24 0.00 5.82 5.88 2.90 5.78 0.00 6.59 4.29
36,000 0.00 0.34 0.00 8.30 5.45 2.93 6.49 0.00 6.02 5.24
39,000 0.00 0.12 0.00 8.19 4.74 2.65 5.87 0.00 5.54 6.88
42,000 0.00 0.11 0.00 9.17 4.17 2.76 5.58 0.00 6.16 7.31
45,000 0.00 0.06 0.00 8.36 3.60 2.52 4.06 0.00 2.33 6.91
48,000 0.00 0.06 0.00 7.35 3.02 2.14 2.71 0.00 5.15 6.34
51,000 0.00 0.06 0.00 4.93 2.75 2.12 2.23 0.00 4.50 6.75
54,000 0.00 0.03 0.00 3.28 1.49 1.67 1.68 0.00 2.97 7.60
57,000 0.00 0.04 0.00 3.77 1.64 1.46 1.36 0.00 2.37 5.84
60,000 0.00 0.01 0.00 1.22 1.32 0.98 1.05 0.00 0.00 5.41
63,000 0.00 0.01 0.00 2.88 0.62 0.60 0.69 0.00 3.23 4.18
66,000 0.00 0.00 0.00 0.86 0.47 0.46 0.53 0.00 0.10 2.55
69,000 0.00 0.00 0.00 0.55 0.49 0.35 0.40 0.00 0.16 1.56
72,000 0.00 0.00 0.00 0.50 0.36 0.25 0.26 0.00 0.00 1.08
75,000 0.00 0.00 0.00 0.46 0.38 0.21 0.22 0.00 0.00 0.78
78,000 0.00 0.00 0.00 0.43 0.57 0.15 0.13 0.00 0.00 0.57
81,000 0.00 0.00 0.00 0.25 0.36 0.13 0.10 0.00 0.00 0.43
84,000 0.00 0.01 0.00 0.42 0.24 0.08 0.08 0.00 0.00 0.34
87,000 0.00 0.00 0.00 0.09 0.12 0.07 0.05 0.00 0.00 0.33
90,000 0.00 0.00 0.00 0.53 0.24 0.06 0.03 0.00 0.00 0.22
93,000 0.00 0.00 0.00 0.01 0.09 0.04 0.02 0.00 0.00 0.11
96,000 0.00 0.00 0.00 0.02 0.09 0.03 0.02 0.00 0.00 0.03
99,000 0.00 0.00 0.00 0.01 0.03 0.01 0.01 0.00 0.00 0.04
102,000 0.00 0.01 0.00 0.10 0.90 0.17 0.06 0.00 0.00 0.18
Page 24
Colorado Department of Transportation
2017 Pavement Design Manual
121
Table 3.13 Level 2 Quad Axle Load Distribution Factors (Percentages)
Mean Axle
Load, lbs. Vehicle/Truck Class
4 5 6 7 8 9 10 11 12 13
12,000 0.00 0.00 0.00 0.00 0.00 41.50 39.41 0.00 0.00 13.63
15,000 0.00 0.00 0.00 3.73 0.00 0.00 6.08 0.00 0.00 3.04
18,000 0.00 0.00 0.00 0.00 0.00 0.00 5.50 0.00 0.00 4.15
21,000 0.00 0.00 0.00 16.67 0.00 0.15 16.55 0.00 0.00 4.46
24,000 0.00 0.00 0.00 0.17 0.00 0.00 0.60 0.00 0.00 19.83
27,000 0.00 0.00 0.00 0.00 0.00 0.00 1.10 0.00 0.00 1.99
30,000 0.00 0.00 0.00 0.00 0.00 0.00 0.78 0.00 47.75 1.84
33,000 0.00 0.00 0.00 0.00 0.00 8.35 1.16 0.00 14.70 5.11
36,000 0.00 0.00 0.00 0.00 0.00 50.00 2.23 0.00 19.35 1.89
39,000 0.00 0.00 0.00 0.00 0.00 0.00 1.60 0.00 13.80 4.63
42,000 0.00 0.00 0.00 0.00 0.00 0.00 0.96 0.00 0.00 5.71
45,000 0.00 0.00 0.00 0.00 0.00 0.00 3.04 0.00 0.00 1.21
48,000 0.00 0.00 0.00 15.00 0.00 0.00 2.14 0.00 1.90 3.81
51,000 0.00 0.00 0.00 0.00 0.00 0.00 1.34 0.00 0.00 3.76
54,000 0.00 0.00 0.00 0.00 0.00 0.00 1.39 0.00 0.00 4.01
57,000 0.00 0.00 0.00 0.00 0.00 0.00 1.95 0.00 2.45 1.80
60,000 0.00 0.00 0.00 33.33 0.00 0.00 5.33 0.00 0.00 3.31
63,000 0.00 0.00 0.00 0.00 0.00 0.00 2.20 0.00 0.00 2.49
66,000 0.00 0.00 0.00 14.47 0.00 0.00 3.08 0.00 0.00 3.46
69,000 0.00 0.00 0.00 16.67 0.00 0.00 0.88 0.00 0.00 2.80
72,000 0.00 0.00 0.00 0.00 0.00 0.00 0.46 0.00 0.00 1.38
75,000 0.00 0.00 0.00 0.00 0.00 0.00 0.14 0.00 0.00 2.04
78,000 0.00 0.00 0.00 0.00 0.00 0.00 0.08 0.00 0.00 0.45
81,000 0.00 0.00 0.00 0.00 0.00 0.00 0.25 0.00 0.00 0.28
84,000 0.00 0.00 0.00 0.00 0.00 0.00 0.19 0.00 0.00 1.60
87,000 0.00 0.00 0.00 0.00 0.00 0.00 0.01 0.00 0.00 0.03
90,000 0.00 0.00 0.00 0.00 0.00 0.00 0.00 0.00 0.00 0.71
93,000 0.00 0.00 0.00 0.00 0.00 0.00 0.00 0.00 0.00 0.00
96,000 0.00 0.00 0.00 0.00 0.00 0.00 0.00 0.00 0.00 0.00
99,000 0.00 0.00 0.00 0.00 0.00 0.00 1.61 0.00 0.00 0.00
102,000 0.00 0.00 0.00 0.00 0.00 0.00 0.00 0.00 0.00 0.56
Page 25
Colorado Department of Transportation
2017 Pavement Design Manual
122
0
2
4
6
8
10
12
14
16
18
20
0 5000 10000 15000 20000 25000 30000 35000 40000 45000
Percen
t D
istr
ibu
tio
n
Axle Load (lbs)
Vehicle Class 5
Vehicle Class 9
Figure 3.12 CDOT Averages of Single Axle Load Distribution (Classes 5 and 9 only)
0
2
4
6
8
10
12
14
0 5000 10000 15000 20000 25000 30000 35000 40000 45000
Percen
t D
istr
ibu
tio
n
Axle Load (lbs)
Vehicle Class 6
Vehicle Class 9
Figure 3.13 CDOT Averages of Tandem Axle Load Distribution (Classes 5 and 9 only)
Page 26
Colorado Department of Transportation
2017 Pavement Design Manual
123
3.1.11 Vehicle Operational Speed (Trucks)
The vehicle operational speed of trucks or the average travel speed generally depends on many
factors, including the roadway facility type (interstate or otherwise), terrain, percentage of trucks
in the traffic stream, and so on. Truck speed has a significant impact on the HMA dynamic
modulus (E*) and the predicted performance. Lower speeds resulting higher incremental damage,
i.e. more fatigue cracking or deeper ruts or faulting. The posted truck speed limit is suggested
unless local site conditions, such as a steep upgrade or bus stop, require a lower speed.
3.1.11.1 Lateral Wander of Axle Loads
The inputs required for characterizing lateral wander (see Figure 3.14 M-E Design Software
Screenshot of Traffic Lateral Wander include the following:
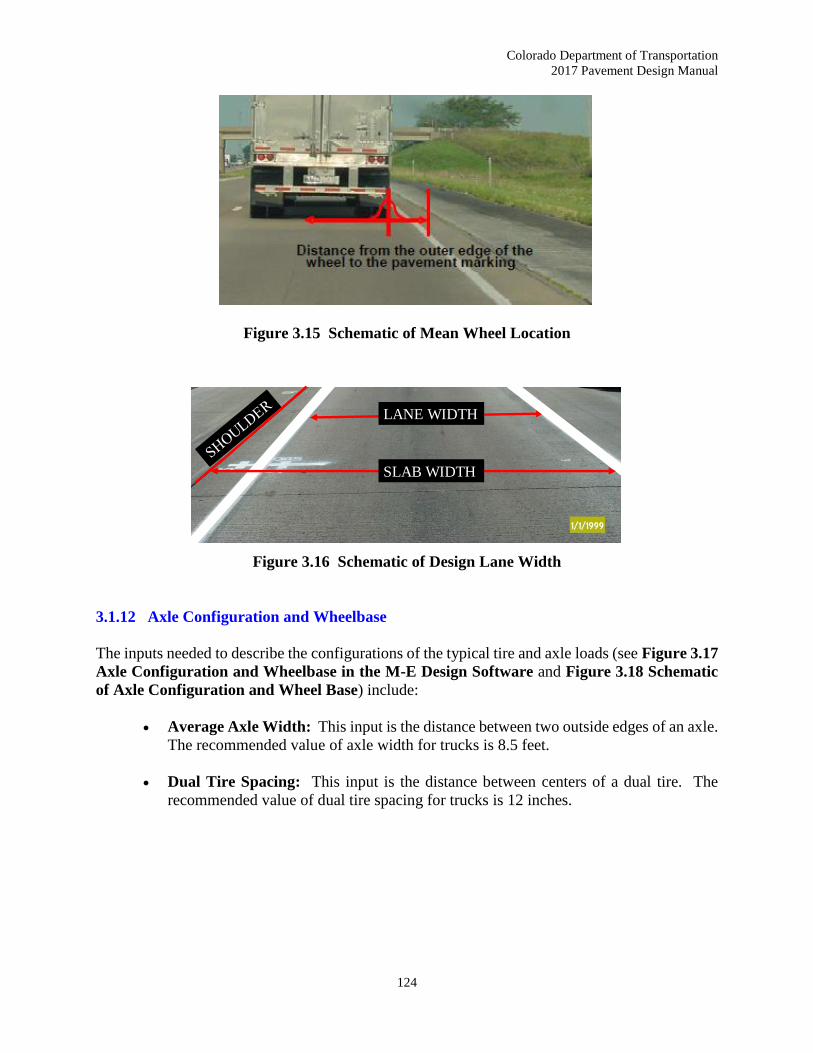
Mean Wheel Location: This is the distance from the outer edge of the wheel to the
pavement marking (see Figure 3.15 Schematic of Mean Wheel Location). The M-E
Design software provides a default value of 18 inches which is recommended unless a
measure value is available.
Traffic Wander Standard Deviation: This is the standard deviation of the lateral
traffic wander. The wander is used to predict distress and performance by determining
the number of axle load applications over a specified point. For standard lane widths,
a standard deviation value of 10 inches is suggested unless a measured value is
available. A lower or higher lateral wander value is suggested for narrower or wider
lanes, respectively.
Design Lane Width: This is the distance between the lane markings on either side of
the design lane (see Figure 3.16 Schematic of Design Lane Width).
Figure 3.14 M-E Design Software Screenshot of Traffic Lateral Wander
Page 27
Colorado Department of Transportation
2017 Pavement Design Manual
124
Figure 3.15 Schematic of Mean Wheel Location
Figure 3.16 Schematic of Design Lane Width
3.1.12 Axle Configuration and Wheelbase
The inputs needed to describe the configurations of the typical tire and axle loads (see Figure 3.17
Axle Configuration and Wheelbase in the M-E Design Software and Figure 3.18 Schematic
of Axle Configuration and Wheel Base) include:
Average Axle Width: This input is the distance between two outside edges of an axle.
The recommended value of axle width for trucks is 8.5 feet.
Dual Tire Spacing: This input is the distance between centers of a dual tire. The
recommended value of dual tire spacing for trucks is 12 inches.
LANE WIDTH
SLAB WIDTH
Page 28
Colorado Department of Transportation
2017 Pavement Design Manual
125
Figure 3.17 Axle Configuration and Wheelbase in the M-E Design Software
Figure 3.18 Schematic of Axle Configuration and Wheelbase
Axle Spacing: This input is the distance between the two consecutive axles of a
tandem, tridem, or quad truck. It is used in determining the number of load applications
for JPCP top-down cracking. The spacing of the axles is recorded in the WIM database.
These values have been found to be relatively constant for the standard truck classes.
The following values are suggested for use unless the predominant truck class has
different axle spacing.
Tandem axle spacing: 51.6 inches
Tridem axle spacing: 49.2 inches
Quad axle spacing: 49.2 inches
Axle Width
Axle Spacing
Tire Pressure
& Loads
Dual Tire Spacing
Wheel Base Width
Page 29
Colorado Department of Transportation
2017 Pavement Design Manual
126
Wheelbase: This input is the distance between the centers of the front and rear axles.
It is used in determining the number of load applications for JPCP top-down cracking.
The wheelbase is recorded in the WIM database. The following national averages are
suggested for use, unless site-specific wheelbase values are available.
Trucks with short spacing (10-13.5 feet): 17.5%
Trucks with medium spacing (13.5 to 16.5 feet): 21.6%
Trucks with long spacing (16.5 to 20.0 feet): 60.9%
3.1.13 Tire Pressure
Tire pressure may vary with the tire type. A constant value of hot inflation tire pressure
representing the average operating conditions should be used. The hot inflation pressure is
typically about 10 to 15 percent greater than the cold inflation pressure. A hot inflation tire
pressure value of 120 psi is suggested for use unless a special loading condition is simulated.
3.1.14 Traffic Files in Electronic Format for the M-E Design Software
Designers can create their own traffic input files in electronic formats by directly inputting the data
using the traffic input interface of the M-E Design software. This is not recommended for most
of the required inputs with exceptions for simple inputs such as AADTT, growth rate, etc.
For more complex input types such as the axle load distribution or axles per truck, the designers
can add Level 1 and 2 inputs in electronic format from the CDOT DTD. Level 3 input data can be
retrieved directly from the M-E Design software.
3.2 Climate
Climate data for the M-E Design software is obtained from weather stations located throughout
the state. Information from these stations (temperature, precipitation, wind speed, percent
sunshine, and relative humidity) are used to predict the temperature and moisture profiles within
the pavement structure. In addition, the M-E Design software requires the depth to groundwater
table (GWT) as an input. Note: The GWT depth value entered in the M-E Design software is the
depth below the final pavement surface.
For critical designs, the GWT data can be obtained from Colorado Division of Water Resources
database, United States Department of Agriculture (USDA) Natural Resources Conservation
Service (NRCS) Soil Survey Geographic (SSURGO) database, or project-specific soil borings.
For non-critical designs, one should guestimate the GWT depth based on designer’s experience.
3.2.1 Creating Project Specific Climate Input Files
The M-E Design software will identify the six closest weather stations for a given project location
based on its geographic coordinates. Designers can select one or more weather stations based on
the proximity to the project location. A single weather station can be selected when the project is
within reasonable proximity, or up to six surrounding weather stations can be selected and
Page 30
Colorado Department of Transportation
2017 Pavement Design Manual
127
combined into a virtual weather station. The software does this automatically after selection by
the user. Proximity is defined in terms of both distance and elevation. The recommendations for
selecting climatic inputs are presented in Table 3.14 Recommendations for Climatic Inputs. A
screenshot of the climate tab from the M-E Design software is presented in Figure 3.19 Climate
Tab in the M-E Design Software.
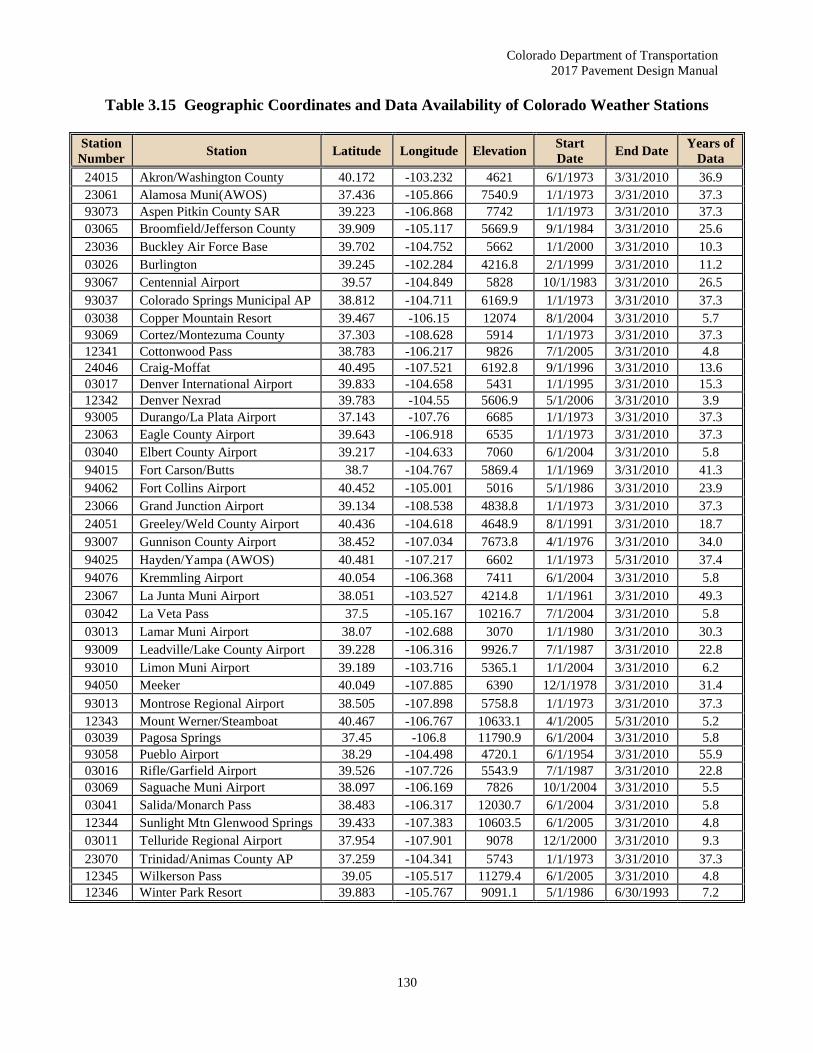
Climate data is currently available for 42 weather stations in Colorado, see Figure 3.20 Location
of Colorado Weather Stations. Weather stations located near the border of neighboring states
(Utah, Wyoming, Nebraska, New Mexico, Oklahoma, Kansas and Arizona) can be used. Table
3.14 Geographic Coordinates and Data Availability of Colorado Weather Stations presents
the geographic coordinates of Colorado Weather stations, including start and end dates of available
hourly weather records.
Table 3.14 Recommendations for Climatic Inputs
Climate Inputs Recommendations
Weather Station ≤ 50 Miles Import specific weather station
Weather Station >50 Miles Create a virtual weather station that includes two or more
surrounding weather stations
Depth of Water Table (feet)
Actual depth may be found in County Soil Reports1, project
geotechnical reports, or an estimate based on the area. The
depth of the water table typically ranges from 3 to 100 feet.
Note: 1 The United States Department of Agriculture (USDA) Natural Resources Conservation Service (NRCS) Soil
Survey Geographic (SSURGO) database. Another available resource for estimating depth of water table for a
project site is the Colorado Division of Water Resources database and geologic well logs available online at
http://www.nrcs.usda.gov/wps/portal/nrcs/main/soils/survey/geo/.
Page 31
Colorado Department of Transportation
2017 Pavement Design Manual
128
Figure 3.19 Climate Tab in the M-E Design Software
Page 32
Colorado Department of Transportation
2017 Pavement Design Manual
129
Figure 3.20 Location of Colorado Weather Stations
Page 33
Colorado Department of Transportation
2017 Pavement Design Manual
130
Table 3.15 Geographic Coordinates and Data Availability of Colorado Weather Stations
Station
Number Station Latitude Longitude Elevation
Start
Date End Date
Years of
Data
24015 Akron/Washington County 40.172 -103.232 4621 6/1/1973 3/31/2010 36.9
23061 Alamosa Muni(AWOS) 37.436 -105.866 7540.9 1/1/1973 3/31/2010 37.3
93073 Aspen Pitkin County SAR 39.223 -106.868 7742 1/1/1973 3/31/2010 37.3
03065 Broomfield/Jefferson County 39.909 -105.117 5669.9 9/1/1984 3/31/2010 25.6
23036 Buckley Air Force Base 39.702 -104.752 5662 1/1/2000 3/31/2010 10.3
03026 Burlington 39.245 -102.284 4216.8 2/1/1999 3/31/2010 11.2
93067 Centennial Airport 39.57 -104.849 5828 10/1/1983 3/31/2010 26.5
93037 Colorado Springs Municipal AP 38.812 -104.711 6169.9 1/1/1973 3/31/2010 37.3
03038 Copper Mountain Resort 39.467 -106.15 12074 8/1/2004 3/31/2010 5.7
93069 Cortez/Montezuma County 37.303 -108.628 5914 1/1/1973 3/31/2010 37.3
12341 Cottonwood Pass 38.783 -106.217 9826 7/1/2005 3/31/2010 4.8
24046 Craig-Moffat 40.495 -107.521 6192.8 9/1/1996 3/31/2010 13.6
03017 Denver International Airport 39.833 -104.658 5431 1/1/1995 3/31/2010 15.3
12342 Denver Nexrad 39.783 -104.55 5606.9 5/1/2006 3/31/2010 3.9
93005 Durango/La Plata Airport 37.143 -107.76 6685 1/1/1973 3/31/2010 37.3
23063 Eagle County Airport 39.643 -106.918 6535 1/1/1973 3/31/2010 37.3
03040 Elbert County Airport 39.217 -104.633 7060 6/1/2004 3/31/2010 5.8
94015 Fort Carson/Butts 38.7 -104.767 5869.4 1/1/1969 3/31/2010 41.3
94062 Fort Collins Airport 40.452 -105.001 5016 5/1/1986 3/31/2010 23.9
23066 Grand Junction Airport 39.134 -108.538 4838.8 1/1/1973 3/31/2010 37.3
24051 Greeley/Weld County Airport 40.436 -104.618 4648.9 8/1/1991 3/31/2010 18.7
93007 Gunnison County Airport 38.452 -107.034 7673.8 4/1/1976 3/31/2010 34.0
94025 Hayden/Yampa (AWOS) 40.481 -107.217 6602 1/1/1973 5/31/2010 37.4
94076 Kremmling Airport 40.054 -106.368 7411 6/1/2004 3/31/2010 5.8
23067 La Junta Muni Airport 38.051 -103.527 4214.8 1/1/1961 3/31/2010 49.3
03042 La Veta Pass 37.5 -105.167 10216.7 7/1/2004 3/31/2010 5.8
03013 Lamar Muni Airport 38.07 -102.688 3070 1/1/1980 3/31/2010 30.3
93009 Leadville/Lake County Airport 39.228 -106.316 9926.7 7/1/1987 3/31/2010 22.8
93010 Limon Muni Airport 39.189 -103.716 5365.1 1/1/2004 3/31/2010 6.2
94050 Meeker 40.049 -107.885 6390 12/1/1978 3/31/2010 31.4
93013 Montrose Regional Airport 38.505 -107.898 5758.8 1/1/1973 3/31/2010 37.3
12343 Mount Werner/Steamboat 40.467 -106.767 10633.1 4/1/2005 5/31/2010 5.2
03039 Pagosa Springs 37.45 -106.8 11790.9 6/1/2004 3/31/2010 5.8
93058 Pueblo Airport 38.29 -104.498 4720.1 6/1/1954 3/31/2010 55.9
03016 Rifle/Garfield Airport 39.526 -107.726 5543.9 7/1/1987 3/31/2010 22.8
03069 Saguache Muni Airport 38.097 -106.169 7826 10/1/2004 3/31/2010 5.5
03041 Salida/Monarch Pass 38.483 -106.317 12030.7 6/1/2004 3/31/2010 5.8
12344 Sunlight Mtn Glenwood Springs 39.433 -107.383 10603.5 6/1/2005 3/31/2010 4.8
03011 Telluride Regional Airport 37.954 -107.901 9078 12/1/2000 3/31/2010 9.3
23070 Trinidad/Animas County AP 37.259 -104.341 5743 1/1/1973 3/31/2010 37.3
12345 Wilkerson Pass 39.05 -105.517 11279.4 6/1/2005 3/31/2010 4.8
12346 Winter Park Resort 39.883 -105.767 9091.1 5/1/1986 6/30/1993 7.2
Page 34
Colorado Department of Transportation
2017 Pavement Design Manual
131
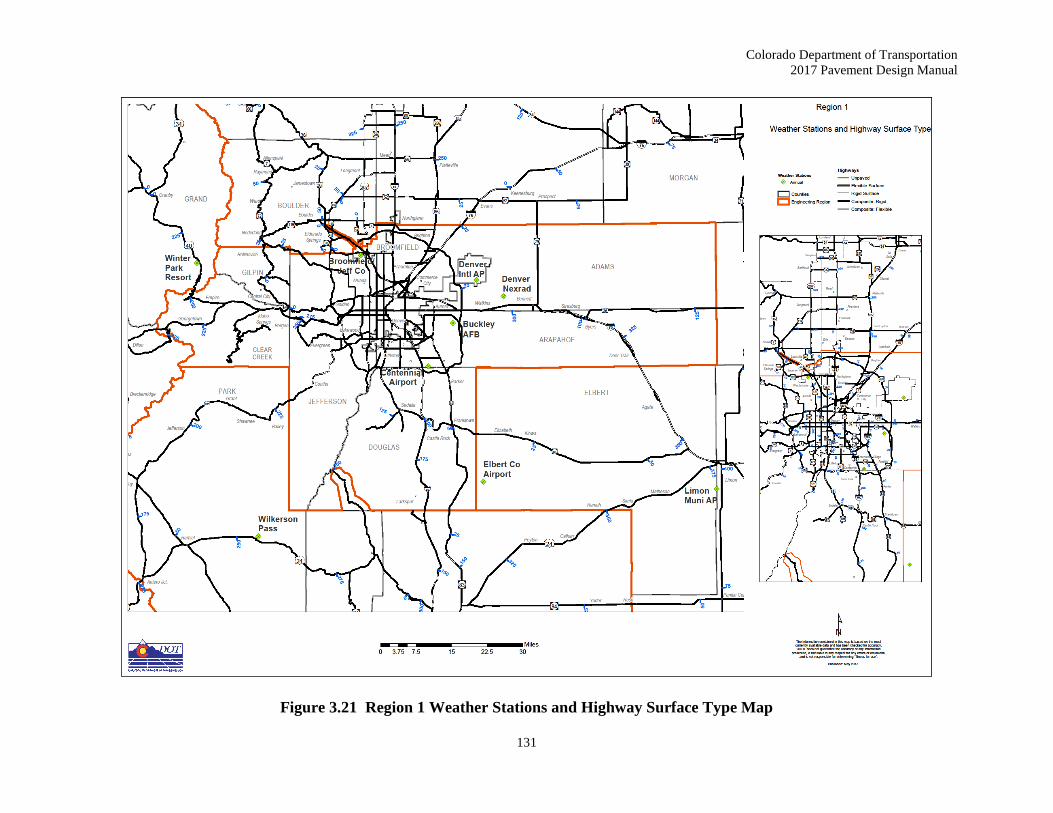
Figure 3.21 Region 1 Weather Stations and Highway Surface Type Map
Page 35
Colorado Department of Transportation
2017 Pavement Design Manual
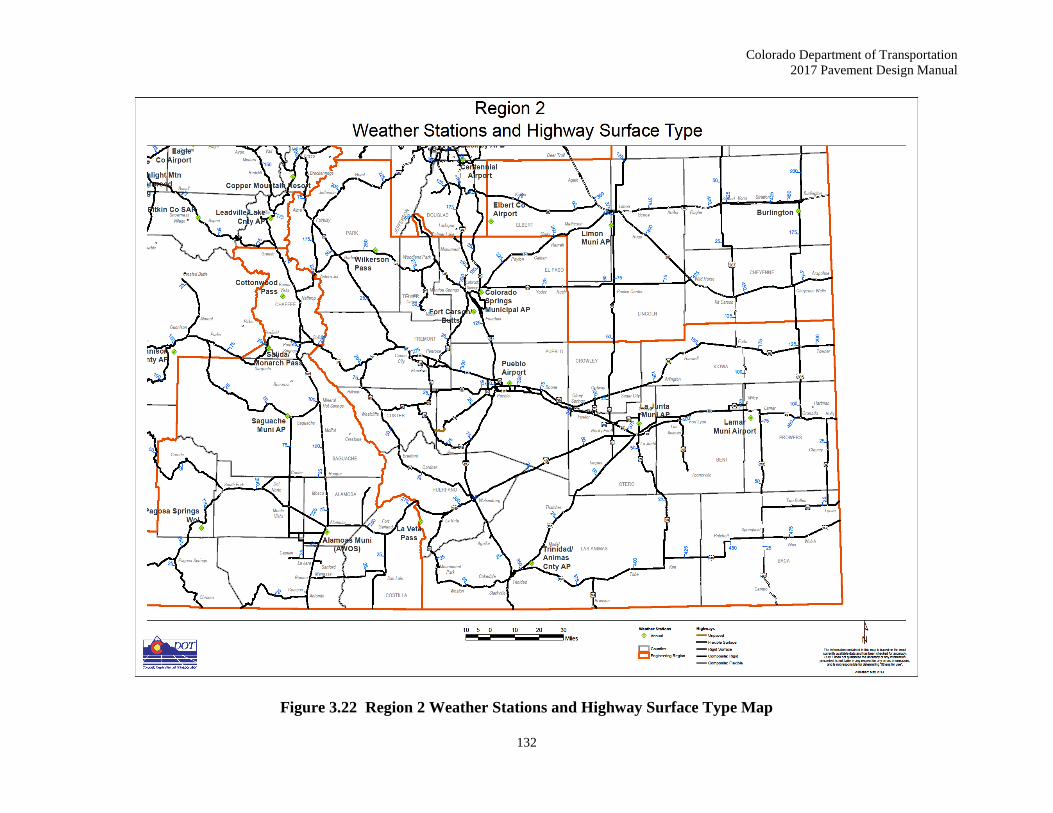
132
Figure 3.22 Region 2 Weather Stations and Highway Surface Type Map
Page 36
Colorado Department of Transportation
2017 Pavement Design Manual
133
Figure 3.23 Region 3 Weather Stations and Highway Surface Type Map
Page 37
Colorado Department of Transportation
2017 Pavement Design Manual
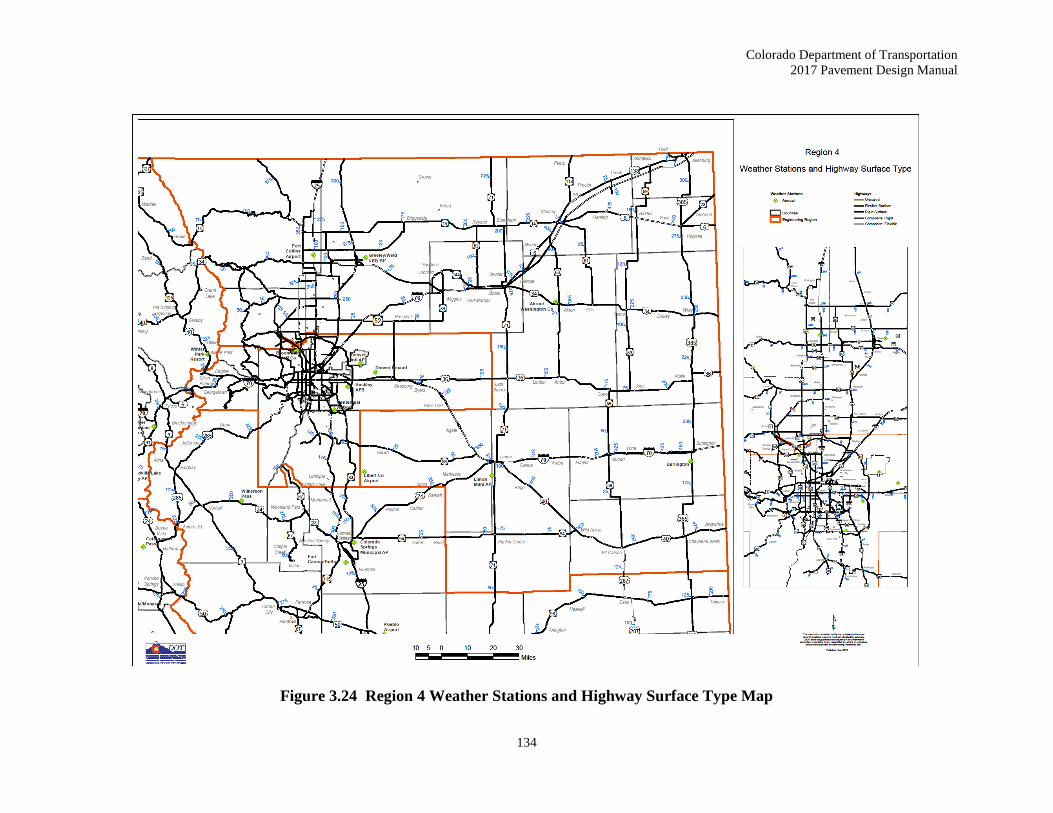
134
Figure 3.24 Region 4 Weather Stations and Highway Surface Type Map
Page 38
Colorado Department of Transportation
2017 Pavement Design Manual
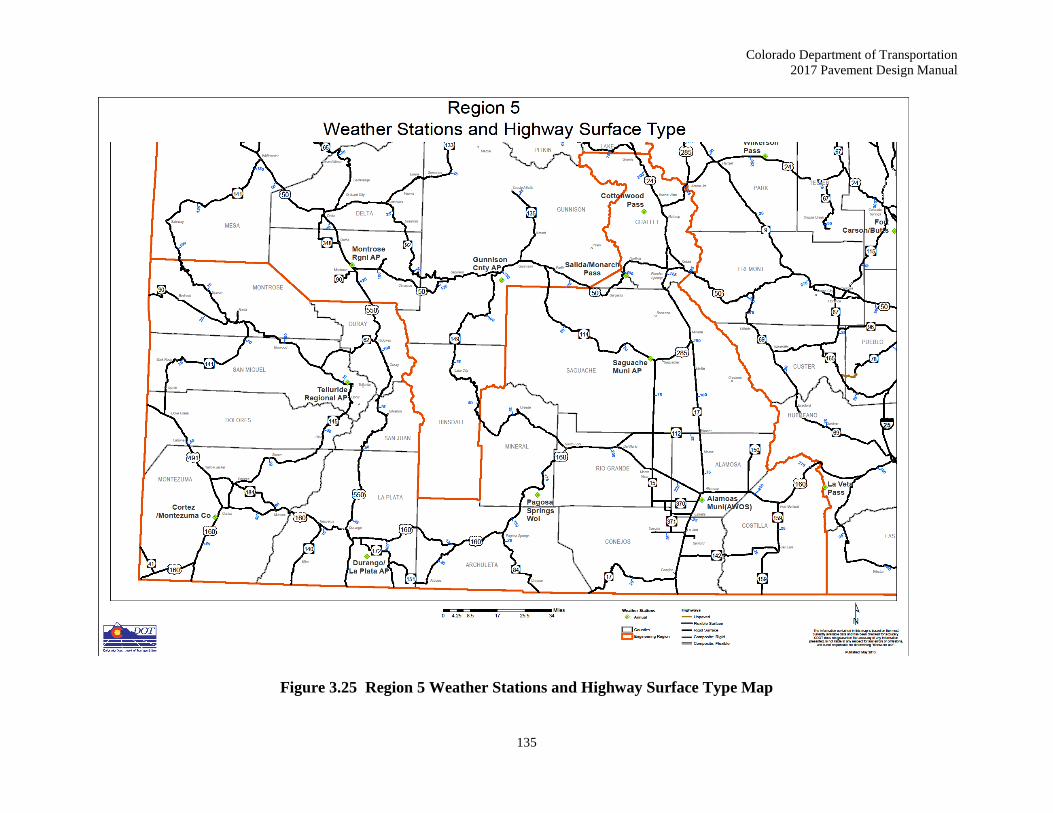
135
Figure 3.25 Region 5 Weather Stations and Highway Surface Type Map
Page 39
Colorado Department of Transportation
2017 Pavement Design Manual
136
References
1. Heavy Vehicle Travel Information System, Field Manual, FHWA publication PDF version,
May 2001 (revised), obtained at website,
http://www.fhwa.dot.gov/ohim/tvtw/hvtis.htm
2. Highway Capacity Manual, Transportation Research Board, National Research Council,
Washington, D.C., 2000.
3. AASHTO Mechanistic-Empirical Pavement Design Guide, A Manual of Practice, Interim
Edition, July 2008, American Association of State Highway and Transportation Officials,
Washington, DC, 2008.