32
City of Alexandria, Virginia TRAFFIC AND PARKING BOARD November 14, 2016

City of Alexandria, Virginia
TRAFFIC AND PARKING
BOARD November 14, 2016

November 14, 2016
• Approval of October 24, 2016 Minutes
• Public Discussion Period
• Public Hearing
• Staff Reports and Updates
2

Establishing Overnight Parking
Restriction in Lincolnia Hills
Agenda Item 4

Location

Expansion Overnight Parking
Restriction on 1100 Block of N.
Pegram Street
Agenda Item 5

Location
Installation Three Hour Parking Restriction
From 8AM-5PM, Monday-Friday on West
Side of the 500, 600, and 700 Blocks of
South Payne Street
Agenda Item 6
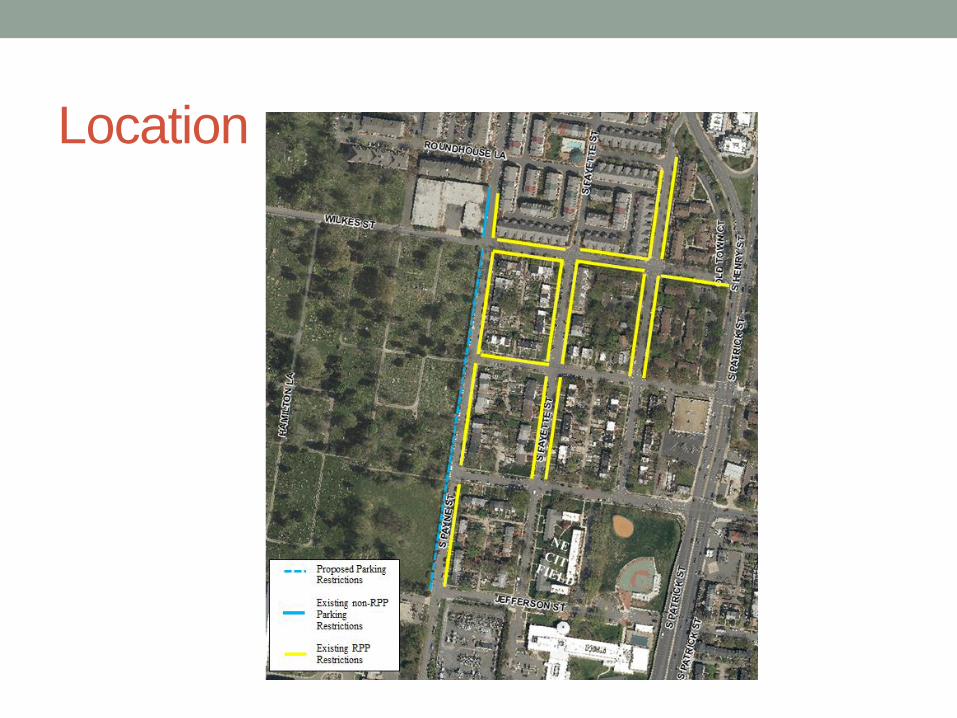
Location

Removal of Four Parking Spaces on the 400
Block of Second Street for Green Infrastructure
and Pedestrian Improvements
Agenda Item 7

Location

All Way Stop Sign Request at the
Intersection of Taney Avenue and N.
Howard Street
Agenda Item 8

Location
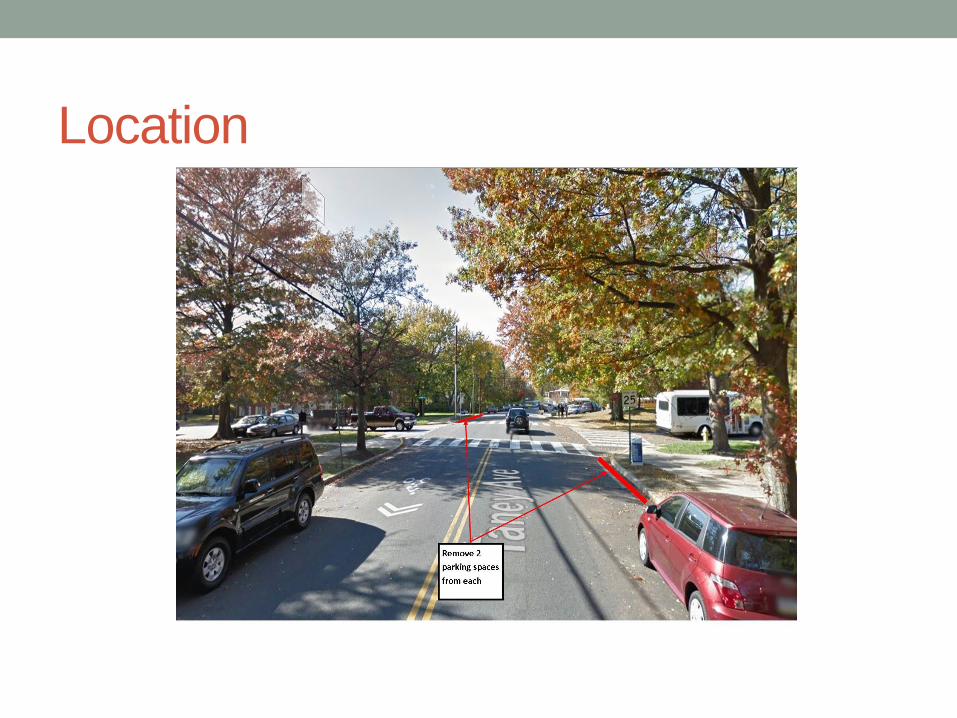
Location

Reviewing the Biennial and Public
Hearing on Conditions within the
Alexandria Taxicab Industry
Agenda Item 9

Economic Condition
• 143,000 Registered TNCs in Virginia
• Demand for dispatch service is decreasing
• Demand at airport is unchanged
• Alexandria has 30 driver vacancies and growing
• Gas prices down 40% since last biennial review
• Service is adequate
Proposing Changes to Part II, Title 9,
Chapter 12 of the City Code and the
City Manager Regulations
Agenda Item 10

Changes of City Codes and the City
Manager Regulations
• 9-12-34(a) Authorizations not in use
• 4.1.A. Age Limit for Taxicab Vehicles
• 6.2. Taxicab Industry Fees

Existing Fees
Alexandria Arlington Fairfax
Certificate
(company)
$4,000 N/A N/A
Affiliated Vehicles
(company)
$150 $150 $150
Vehicle Permit
(driver)
$150 N/A N/A
Driver’s Permit
(driver)
$150 $40 $40

Taxicab Fare Rate
Agenda Item 11

Regional Taxicab Fare Rates and Charges Alexandria Arlington Fairfax Montg.
Cty.
Uber X
Drop $3.00 $3.00 $3.50 $4.00 $2.50
Mileage $2.16 $2.16 $2.16 $2.00 $1.02
Waiting $24.92 $23.40 $21.60 $28.00 $10.20
Passengers $1.25 $1.00 $1.00 $1.00 --
Suitcases $0.50 $0.50 $0.50 $1.00 --
Trunk -- -- $2.00 $2.00 --
Groc. Bags -- -- $0.25 $1.00 --
Animals $2.00 -- $1.00 -- --
Snow $5.00 -- -- $2.50 --
Other
$5.00
Canc. Fee
Recommendation on the Renewal of
Existing Certificates of Public
Convenience and Necessity
Agenda Item 12

Summary of Staff’s Recommendations
Company Dispatch
Calls per
Driver
Current
Authorized
Taxicabs
Recommended
Changes
Total
Recommended
Authorizations
Alexandria Yellow
Cab
5.8 279 0 279
King Cab 1.3 53 0 53
VIP Cab 1.2 63 0 63
White Top Cab 7.3 107 0 107
Alexandria Union
Cab
<1 225 0 225
GoGreen Cab <1 17 0 17
City of Alexandria, Virginia
STAFF UPDATE: Reduced Speed
Limits on Seminary Road & Quaker
Lane

Background
• Speed limit reduction and safety improvements requested
by community for Seminary Rd. and N. Quaker Ln.
• Staff attended meetings with the community in fall 2015 to
hear concerns and discuss options to improve safety
• In February 2016, Board approved motion to recommend to
the City Manager to reduce the speed limits on Seminary
Rd. and on N. Quaker Ln. to 25 mph from 35 mph, and to
include increased enforcement
24
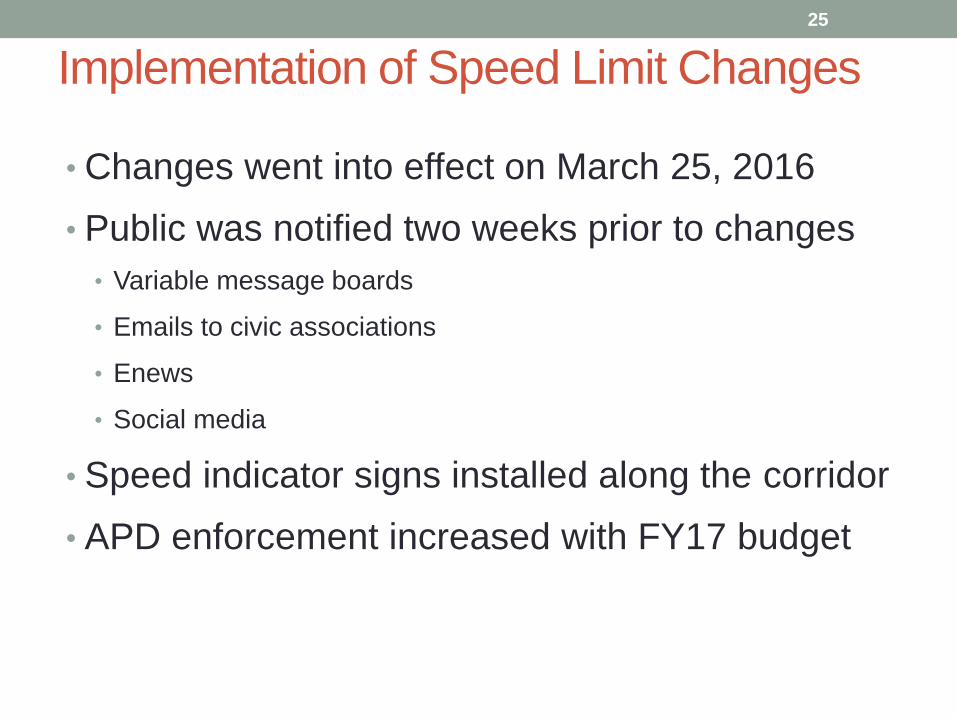
Implementation of Speed Limit Changes
25
• Changes went into effect on March 25, 2016
• Public was notified two weeks prior to changes
• Variable message boards
• Emails to civic associations
• Enews
• Social media
• Speed indicator signs installed along the corridor
• APD enforcement increased with FY17 budget
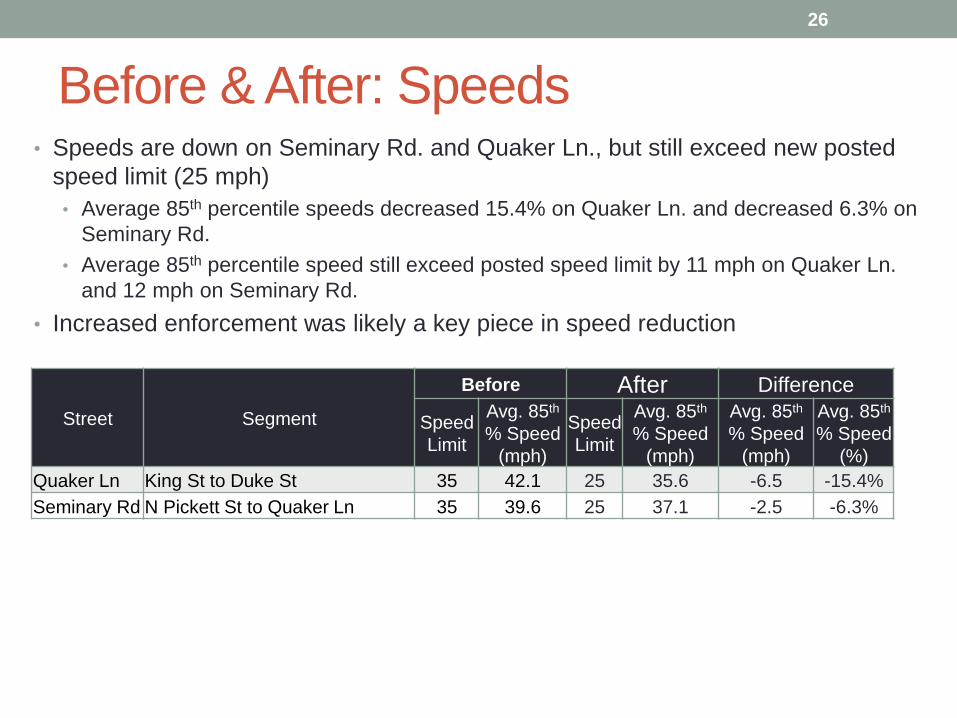
Before & After: Speeds • Speeds are down on Seminary Rd. and Quaker Ln., but still exceed new posted
speed limit (25 mph)
• Average 85th percentile speeds decreased 15.4% on Quaker Ln. and decreased 6.3% on
Seminary Rd.
• Average 85th percentile speed still exceed posted speed limit by 11 mph on Quaker Ln.
and 12 mph on Seminary Rd.
• Increased enforcement was likely a key piece in speed reduction
26
Street Segment
Before After Difference
Speed
Limit
Avg. 85th
% Speed
(mph)
Speed
Limit
Avg. 85th
% Speed
(mph)
Avg. 85th
% Speed
(mph)
Avg. 85th
% Speed
(%)
Quaker Ln King St to Duke St 35 42.1 25 35.6 -6.5 -15.4%
Seminary Rd N Pickett St to Quaker Ln 35 39.6 25 37.1 -2.5 -6.3%

Before & After: Traffic Volumes (ADT)
• Traffic volumes decreased slightly on Quaker Ln. and
Seminary Rd.
• Volumes decreased on Quaker Ln by 8% and Seminary Rd by 2.7%
27
Street Segment
Avg. Daily Traffic (# of vehicles)
Before After Difference Difference
(%)
Quaker Ln King St to Duke St 21510 19800 -1710 -8.0%
Seminary Rd N Pickett St to Quaker Ln 14730 14330 -400 -2.7%

Before & After: Crashes
• Reported crashes decreased on Seminary Rd and Quaker
Ln based on preliminary analysis
• No causation can be determined at this time between reduced speed
limits and decrease in reported crashes
28
Street Segment
Crashes between May 1 – Sept 30
Before (2011-2015) –
5 Year Average After (2016)
Quaker Ln King St to Duke St 7.0 3
Seminary Rd N Pickett St to Quaker Ln 2.8 0

Before & After: Side Streets • Volumes and speeds on side streets have remained
relatively the same, with little to no variation, and no clear
trends of traffic diversion from Seminary Rd. and Quaker
Ln.
29

Before and After: Side Street Volumes
30
# Street Segment
Avg. Daily Traffic (# of vehicles)
Before After Difference Difference
(%)
1 W Taylor Run Pkwy Duke St Service Rd & Dartmouth Rd
4,845
4,460
-385 -7.9%
2 Cloverway Ln Janneys Ln & Vassar Rd
330
359
29 +8.8%
3 Cambridge Rd Janneys Ln & Vassar Rd
2,691
2,715
24 +0.9%
4 Yale Dr Janneys Ln & Vassar Rd
1,932
2,065
133 +6.9%
5 Trinity Dr Cathedral Dr & Canterbury Ln
957
895
-62 -6.5%
6 Trinity Dr Quaker Ln & Ft William Pkwy
571
561
-10 -1.8%
7 Ft. William Pkwy Seminary Rd & Trinity Dr
1,196
1,238
42 +3.5%
8 North Howard St Seminary Rd & N Jordan St
6,176
5,408
-768 -12.4%
9 North Jordan St Seminary Rd & Howard St
7,384
7,838
454 +6.1%
10 Janneys Ln Skyhill Rd & W Taylor Run Pkwy
7,902
7,292
-610 -7.7%

Before and After: Side Street Speeds
31
# Street Segment
Avg. 85th Percentile Speed
Before
(mph)
After
(mph)
Difference
(mph)
Difference
(%)
1 W Taylor Run Pkwy Duke St Service Rd & Dartmouth Rd 27.3 29.5
+2.2 +8.1%
2 Cloverway Ln Janneys Ln & Vassar Rd 27.1 23.5
-3.6 -13.3%
3 Cambridge Rd Janneys Ln & Vassar Rd 23.3 22.0
-1.3 -5.6%
4 Yale Dr Janneys Ln & Vassar Rd 24.6 24.5
-0.1 -0.4%
5 Trinity Dr Cathedral Dr & Canterbury Ln 33 28.5
-4.5 -13.6%
6 Trinity Dr Quaker Ln & Ft William Pkwy 28.4 27.5
-0.9 -3.2%
7 Ft. William Pkwy Seminary Rd & Trinity Dr 25.7 28.5
+2.8 +10.9%
8 North Howard St Seminary Rd & N Jordan St 31.1 29.0
-2.1 -6.8%
9 North Jordan St Seminary Rd & Howard St 34.8 37.5
+2.7 +7.8%
10 Janneys Ln Skyhill Rd & W Taylor Run Pkwy 33.4 31.0
-2.4 -7.2%

Next Steps
• Staff will continue
to evaluate and
monitor reduced
speed limits on
Seminary and
Quaker, as well as
side streets
32
Streets Where Speed Limit was Reduced from
35 mph to 25 mph


