Page 1
TrafficFlowModelsandImpactofCombinedLaneChangeandSpeedLimitControlonEnvironmentinCaseofHighTruckTrafficVolumes
June2016 AResearchReportfromtheNationalCenterforSustainableTransportation
PetrosIoannou,UniversityofSouthernCaliforniaYihangZhang,UniversityofSouthernCaliforniaYanboZhao,UniversityofSouthernCalifornia
Page 2
i
AbouttheNationalCenterforSustainableTransportationTheNationalCenterforSustainableTransportationisaconsortiumofleadinguniversitiescommittedtoadvancinganenvironmentallysustainabletransportationsystemthroughcutting-edgeresearch,directpolicyengagement,andeducationofourfutureleaders.Consortiummembersinclude:UniversityofCalifornia,Davis;UniversityofCalifornia,Riverside;UniversityofSouthernCalifornia;CaliforniaStateUniversity,LongBeach;GeorgiaInstituteofTechnology;andUniversityofVermont.Moreinformationcanbefoundat:ncst.ucdavis.edu.DisclaimerThisreportwaspreparedastheresultofworksponsoredbytheCaliforniaEnergyCommission.ItdoesnotnecessarilyrepresenttheviewsoftheEnergyCommission,itsemployeesortheStateofCalifornia.TheEnergyCommission,theStateofCalifornia,itsemployees,contractorsandsubcontractorsmakenowarrant,expressorimplied,andassumenolegalliabilityfortheinformationinthisreport;nordoesanypartyrepresentthattheusesofthisinformationwillnotinfringeuponprivatelyownedrights.ThisreporthasnotbeenapprovedordisapprovedbytheCaliforniaEnergyCommissionnorhastheCaliforniaEnergyCommissionpassedupontheaccuracyoradequacyoftheinformationinthisreport.Thecontentsofthisreportreflecttheviewsoftheauthors,whoareresponsibleforthefactsandtheaccuracyoftheinformationpresentedherein.ThisdocumentisdisseminatedunderthesponsorshipoftheUnitedStatesDepartmentofTransportation’sUniversityTransportationCentersprogram,intheinterestofinformationexchange.TheU.S.Governmentassumesnoliabilityforthecontentsorusethereof.AcknowledgmentsThisstudywasfundedbyagrantfromtheCaliforniaEnergyCommission.TheauthorswouldliketothanktheNCSTandCECfortheirsupportofuniversity-basedresearchintransportation,andespeciallyforthefundingprovidedinsupportofthisproject.TheauthorswouldliketoacknowledgeinteractionswiththeresearchgroupofProfessorMatthewBarthofUniversityofCalifornia,Riversideontrafficflowmodelingandenvironmentalmodels.
Page 3
ii
TrafficFlowModelsandImpactofCombinedLaneChangeandSpeedLimitControlonEnvironmentinCaseofHigh
TruckTrafficVolumesANationalCenterforSustainableTransportationResearchReport
June2016
PetrosIoannou,UniversityofSouthernCaliforniaYihangZhang,UniversityofSouthernCaliforniaYanboZhao,UniversityofSouthernCalifornia
Page 4
iii
[pageleftintentionallyblank]
Page 5
iv
TABLEOFCONTENTSLISTOFFIGURES.............................................................................................................................v
LISTOFTABLES..............................................................................................................................vi
ABSTRACT.......................................................................................................................................1
CHAPTER1:MicroscopicTrafficNetworkModel...........................................................................2
CHAPTER2:ImpactofCombinedLaneChangeSpeedLimitControlonEnvironmentinCaseofHighTruckTrafficVolumes.............................................................................................................5
Introduction................................................................................................................................5
CombinedLC&VSLController...................................................................................................7
DescriptionofLCSystemandVSLSystem..............................................................................7DesignofLCControlStrategy.................................................................................................9DesignofVSLControlLaw....................................................................................................10CombinationofVSLControlandLCControl.........................................................................11
Evaluation.................................................................................................................................12
SimulationNetwork..............................................................................................................12TrafficDemandandComposition.........................................................................................13MonteCarloSimulationandSetupofIncidentScenarios....................................................14PerformanceMeasurements................................................................................................15ControllerParameters..........................................................................................................16SimulationResults................................................................................................................16
Conclusion................................................................................................................................20
GLOSSARY.....................................................................................................................................22
REFERENCES.................................................................................................................................23
NOMENCLATURE..........................................................................................................................25
APPENDIXA:Definitions...............................................................................................................26
Page 6
v
LISTOFFIGURESFigure1:SelectedFreewayNetworkArea.....................................................................................2
Figure2:TrafficSimulatorofSelectedFreewayNetwork..............................................................3
Figure3:SelectedArterialRoadNetwork......................................................................................4
Figure4:TrafficSimulatorofSelectedArterialRoadNetwork......................................................4
Figure5:HighwayBottleneck.........................................................................................................8
Figure6:ConfigurationofLC&VSLController...............................................................................8
Figure7:𝝃underDifferentTrafficConditions..............................................................................10
Figure8:SystemBlockDiagram...................................................................................................12
Figure9:SimulationNetwork.......................................................................................................13
Figure10:FlowRateinDischarchingSection...............................................................................17
Figure11:DensityinDischargingSection.....................................................................................17
Page 7
vi
LISTOFTABLESTable1:VehicleTypes..................................................................................................................14
Table2:SimulationScenarios.......................................................................................................15
Table3:PerformanceofCarsinScenario1..................................................................................18
Table4:PerformanceofTrucksinScenario1..............................................................................18
Table5:PerformanceofCarsinScenario2..................................................................................18
Table6:PerformanceofTrucksinScenario2..............................................................................19
Table7:PerformanceofCarsinScenario3..................................................................................19
Table8:PerformanceofTrucksinScenario3..............................................................................19
Page 8
1
TrafficFlowModelsandImpactofCombinedLaneChangeandSpeedLimitControlonEnvironmentinCaseofHighTruckTrafficVolumesABSTRACTThisreportpresentstheworkperformedincollaborationwithUniversityofCalifornia,Riverside(UCR)aspartofaprojecttoUniversityofCalifornia,DavisfundedbytheCaliforniaEnergyCommission(CEC).Theaimoftheprojectistoresearchintelligenttrafficcontrolstrategies,whichwillhavepositiveimpactontheenvironmentbyreducingfuelconsumptionandpollutionlevelsinareaswherethetruckvolumeisrelativelyhigh,usingasanexamplefordemonstrationanetworkadjacenttothetwinportsofLosAngelesandLongBeach.Theworkisdividedintotwoparts.ThefirstpartinvolvesthedevelopmentofamicroscopictrafficsimulationnetworkinaselectedareaaroundthePortsofLongBeach/LosAngelesincollaborationwithUCRtobeusedforsimulationstudiesofdifferentIntelligentTransportationTechnologiesfortrafficflowcontrol.Thesecondpartdealswiththeevaluationoftheimpactofcombinedvariablespeedlimit(VSL)andlanechangecontrolontheenvironmentduringhighwayincidentswherethevolumeoftrucksisrelativelyhigh.WeusethesimulationmodeldevelopedinthefirstparttocarryoutmicroscopicMonte-CarlotrafficflowsimulationsoftrafficinordertoevaluatethebenefitsofcombinedVSLandlanechangecontrolduringincidentsonI-710thatinvolveclosureoflanesandcapacitydrops.Wedemonstratedthatthiscombinedcontrolstrategyisabletogenerateconsistentimprovementswithrespecttotraveltime,safety,andenvironmentalimpactunderdifferenttrafficconditionsandincidentscenarios.
Page 9
2
CHAPTER1:MicroscopicTrafficNetworkModelUnderthiseffortwe,developedamicroscopictrafficsimulationmodelusingVISSIMsoftwaretobeusedforevaluationofdifferentIntelligentTransportationSystem(ITS)technologiesandtrafficflowcontroltechniquesattheUniversityofSouthernCalifornia(USC)andUniversityofCalifornia,Riverside(UCR).ThesimulationmodelinvolvesatrafficnetworkthatincludeshighwaysandarterialstreetsadjacenttothePortofLongBeach/LosAngeles.Anarterialstreetisahigh-capacityurbanroadthatdeliverstrafficfromsmallerroadstofreeways.Inordertoimprovethespeedofcomputations,thesimulationmodelallowstheusertosplititintoparts.Forexample,forhighwaytrafficflowcontrolthesimulatormodelsthehighwaytrafficthatinteractswithsomeofthemainarterialstreetswhichfeedintotherespectivehighway,withoutexercisingthefullnetwork.Fortrafficflowcontrolstrategiesforarterialstreets,thesimulatorfocusesontrafficonarterialstreetsandtreatsthehighwaytrafficasasourceandsinkoftrafficinteractingwiththearterialnetwork.TheoverallsimulationmodelcoversI-110,I-710,andSR-47freeways,andarterialstreetsneartheportasshowninFigure1.ThesimulationmodelallowstheimplementationoftrafficflowcontrolalgorithmsinMATLAB/C++softwareintegratedwiththesimulationenvironmentviaaComponentObjectModel(COM)interface.ThecorrespondingVISSIMdiagramofthesimulationmodelthatfocusesonhighwaytrafficflowisshowninFigure2.
Figure1:SelectedFreewayNetworkArea
*Whenthesourceofafigure,table,orphotoisnototherwisecredited,itistheworkoftheauthorsofthereport.
Page 10
3
Figure2:TrafficSimulatorofSelectedFreewayNetwork
ThearterialroadnetworkadjacenttothePortofLongBeachiscircledbyPacificCoastHighway,NorthWilmingtonBlvd.,WestAnaheimSt.,andNorthAvalonBlvd.,andconsistsofmorethan100intersectionsintotal—15ofwhichhavetrafficsignalsasshowninFigure3.The15intersectionsarecontrolledby15signalcontrollers,whichcanbedesignedusingdifferentapproaches.ThecorrespondingmicroscopicsimulatoroftheselectedroadnetworkinVISSIMisshowninFigure4.ThedesignedmicroscopictrafficsimulationnetworkmodelisusedtoevaluateacombinedvariablespeedlimitandlanechangecontrolstrategyunderUSC’spartoftheproject.UCRconsideredthesimulationmodelfortrafficlightcontrolevaluations.
Page 11
4
Figure3:SelectedArterialRoadNetwork
Figure4:TrafficSimulatorofSelectedArterialRoadNetwork
1 23 4 5
6
7
8
910111213
14
15
Page 12
5
CHAPTER2:ImpactofCombinedLaneChangeSpeedLimitControlonEnvironmentinCaseofHighTruckTrafficVolumes
IntroductionTrucksareimportantcomponentsofsurfacetransportationintheUnitedStatesandallovertheworld.In2012,largetruckscarried67%offreighttransportationbyweightand64%byvalueintheUnitedStates.Thedemandoftrucktransportationin2040ispredictedtoincreaseby42.5%comparedto2012(Strockoetal.2014).Truckshaveadetrimentaleffectontrafficflowduetotheirsizeandslowerdynamicswhencomparedwithlightdutyvehicles.Inaddition,theypollutemoreandconsumemorefuelasindividualvehicles.From2003to2012,heavytrucksproduced22%oftotalcongestioncost(valueoftraveltimedelayplusexcessfuelconsumption),22%oftrafficgreenhousegasemissions,andwereinvolvedinmorethanhalfofon-roadcrashes(Schranketal.2014,EnvironmentalProtectionAgency2015,Tothetal.2003).Especiallyinhighwaysegmentswithhightruckvolume(e.g.highwaysegmentsgoinginandoutofportareas,freighttransportationhubs,andarterialtruckcorridors),thetraveltimedelay,accidentrates,andairpollutantemissionratesofalltypesofvehiclesarehigherthantheaveragelevelinotherareas.Therefore,efficienttrafficflowcontrolstrategiesareneededattruck-dominanthighwaynetworkstoregulatetrafficflows,avoidorpostponecongestions,andreduceaccidentsandemissions.Fromtheperspectiveoftrafficflowcontrol,therearetwobasicideastosaveenergyandreduceemissions:
1. Reducingtraveltimeofvehicles.Thelongertimethatvehiclesstayonroadswiththeirengineson,themoreemissionsareproducedandmoreenergyisconsumed.Therefore,reducingthetotaltraveltimeofvehiclesbyimprovingtrafficmobilityhaspotentialtobenefittheenvironment.
2. Improvingtheengineefficiency.Vehicleenginesgainhigherefficiencyundergoodoperatingconditions,andhencecantravellongerdistanceswithlessenergyandproducefeweremissions.Undercertainroadconditions,goodoperatingconditionsrequiremoderatespeed,lowacceleration,andlownumberofstop-and-gotrafficsituations.Therefore,bysmoothingthetrafficflowwecanimproveengineefficiencyandprovideapositiveenvironmentalimpact.
VariableSpeedLimit(VSL)isanimportanthighwaycontrolstrategywhichhaslongbeenstudiedandreportedtobeabletosmoothtrafficflowsanddampenshockwaves(VandenHoogenandSmulders1994,WangandIoannou2011,LuandShladover2014).VSLsarespeedlimitsthatchangebasedonroad,traffic,andweatherconditions.Intruck-dominanthighwaynetworks,maneuveringoftruckssuchasaccelerationsandlanechangeseasilydisturbthetrafficflow,andincreasetraveltimeandtailpipeemissions.Therefore,itisintuitivethatbysmoothingandhomogenizingthetrafficflowintruck-dominanthighwaynetworkswithVSLwecouldimprovetrafficmobility,safety,andenvironmentalimpact.
Page 13
6
ThebenefitsofVSLontrafficsafetyhavebeenshowninsimulationsandfieldtestswhilenumerousstudieshavealsobeenconductedtodesignandevaluatedifferentVSLcontrolmethodswithrespecttoimprovementsintrafficmobilityandenvironmentalimpact(LuandShladover2014,Hegyietal.2005,Yangetal.2013,JinandJin2014).TheseVSLmethodsarereportedtoimprovetrafficmobilityinmacroscopictrafficsimulations.However,inmostcases,theseimprovementscannotbeduplicatedonthemicroscopiclevelandtheperformancevariesamongdifferenttrafficconditionsduetomanymicroscopicandstochasticfactors,whicharehardtomeasureorpredict.Thegoalofthisstudyistofindacontrolschemethatprovidesconsistentimprovementsunderdifferenttrafficconditions.Highwaycongestionusuallyoccursatbottleneckscausedbyincidents,lanedrop,etc.Inourstudy,wefoundoutthatoneoftheproblemsaVSLschemeisfacedwithisthatmostlanechangesaretakingplaceinthevicinityofthebottleneckatforcedlanechanges,creatingcongestionanddeterioratingpossibletraveltimeimprovementsobtainedbytheuseofVSL.Especiallyintruck-dominanthighwaysegments,alanechangeofasingletruckcansignificantlyaffecttrafficinotherlanes.Thisobservationmotivatedustouseacombinedlanechange(LC)andVSLcontrolstrategywherevehiclesarerecommendedtochangelanesupstreamandreducecongestioninthevicinityofthebottleneck.WehavedemonstratedusingMonteCarlomicroscopictrafficsimulationsunderdifferentbottleneckscenariosthatthiscombinedLCandVSLcontrolschemeguaranteesconsistentimprovementswithrespecttotraveltime,safety,andenvironmentalimpact.Inthisproposedcombinedcontrolmethod,LCcontrolprovideslanechangerecommendationstoupstreamvehicles,whichspreadslanechangesalongalongdistanceandhencemitigatesthecapacitydropatbottlenecks.AlocalfeedbackVSLcontrollerisdeployedtomaintaindownstreamdensityandsuppresstrafficdisturbance.ConstraintsareappliedtoVSLcommandsfordriveracceptance.NumerousstudieshavebeenconductedtoevaluateVSLsonhighway,butnoneofthemtakestheeffectsoflargetrucksintoconsideration.Abdel-Atyetal.(2006)evaluatedthesafetybenefitofVSLonfreeways.Theauthorconcludedthatwell-configuredVSLstrategiescandecreasethecrashlikelihood,butlargegapsofspeedlimitalongtimeandspacemayincreaseit.Noimprovementintraveltimeisobservedinthisstudy.Hegyietal.(2005)modifiedtheMETANETmodelandadoptedmodelpredictivecontrol(MPC)todetermineoptimalVSLcontrolwithtotaltraveltime(TTT)ofallvehiclesasthecostfunction.Thestudyreporteda21%decreaseinTTTwiththemethodinmacroscopicsimulation.However,thismodel-basedcontrolmethodisnotrobusttodifferenttrafficscenarios.Kejunetal.(2008)appliedthesameapproachasinHegyietal.(2005)tohighwayworkzonescenariosandfoundnosignificantimprovementinTTT.
Page 14
7
Yangetal.(2013)introducedaKalmanFilteralgorithmtoimprovethepredictionaccuracyofMPCs,whichthereforeenhancedtheperformanceoftheMPCVSLcontrolsystem.ThemethodwasevaluatedwithVISSIMandthesimulationresultshowsTTTcanbedecreasedby16%duringpeaktraffichours.InJinandJin(2014),Abdel-Atyetal.(2006),Kejunetal.(2008),andBaldietal.(2014),twodifferentstaticfeedbackcontrollersareproposedtomaximizetheflowrateathighwaybottlenecks.Closed-loopstabilityisprovedinbothstudies.However,thestabilityholdsonlyifspeedlimitsvarycontinuously,whichisdifficultfordriverstofollowinreality,ifnotimpossible.LCcontrolorLCrecommendationhavebeenusedinhighwaytodealwithlaneclosureorhelpwithmerging.Jhaetal.(1999)evaluatedthreedifferentlanecontrolsignalsettingsforthetunnelofI-93South.YellowandredoverheadsignalswereappliedaheadofincidentlocationandevaluatedusingthemicroscopicsimulatorMITSIM.Thestudyshowedthatunderincidentcondition,traveltimeissensitivetoupstreamroadgeometryanddrivercompliancerate.CarelesslyconfiguredLCsignalsettingsmayresultinincreaseoftraveltime.Baskaretal.(2008)proposedaMPCapproachtodetermineappropriatespeedlimitsandlaneallocationsforplatoons.Theapproachissimulatedona2-lanehighwaysegmentandreportedtoimprovetraveltimeby5%-10%.However,thisapproachassumesallvehiclesarecontrolledbyroad-sidecontrollers,whichisnotimplementableyet.
CombinedLC&VSLControllerInthissection,thedesignparametersandtheprocedureofdesigningacombinedLC&VSLcontrollerareintroduced.
DescriptionofLCSystemandVSLSystemCongestionusuallyoccursathighwaybottleneckswhichcanbeintroducedbyroadgeometry,incidents,orconstructionevents.Whenupstreamflowrateexceedsthebottleneckcapacity,congestionoccurs.AsshowninFigure5,thedischargingsection,whichisthehighwaysectionimmediatelyupstreamofthebottleneck,usuallyhashighvehicledensityandlowflowrate.Aqueuewouldestablishinblockedlanesormerginglanes.WithoutLCcontrol,novehiclewouldhaveknowledgeofwhenandwhichdirectiontochangelanesuntiltheystopinthequeue.Thisraisesthenumberofstopsandformsahugegapbetweenthespeedofvehicleswaitinginthequeueandthespeedofvehiclesmovingintheopenlanes,whichmakesthelanechangeverydangerousandintroduceshugedisturbancesandshockwavestothetrafficflow.ApplyingLCrecommendation,driverswouldbeinformedoflaneclosureandlanechangedirectionaheadoftimeanddistance.LCrecommendationallowsdriverstocontinueinthepreviouslaneiftheycannotfindagaptomerge.Thiscontrolstyleprovideshigherroadutilizationratesandwon’tmakeextrastops.
Page 15
8
Figure5:HighwayBottleneck
TheproposedVSLcontrolsystemisdeployedatthehighwaysegmentupstreamofthebottleneckandconsistsofon-roadsensors,overhead,orroadsidevariablespeedlimitsignsandcentralprocessingunit.AnexampleofacombinedLC&VSLcontrolsystemisshowninFigure6—thehighwaysegmentupstreamofthebottleneckisdividedintoNsectionswithsimilarlengthtoensurehomogeneity.LCcontrolusesoverheadsignstomakelanechangerecommendationsatthebeginningofMsectionsupstreamofthebottleneck,i.e.sectionN-M+1throughsectionN.Foreachlane,thereare4possibletypesofLCrecommendations:“StraightAhead”,“ChangetoLeft”,“ChangetoRight”,and“ChangetoEitherWay”.ThelengthoftheLC-controlledsegmentisafunctionofvehicledemandandbottleneckcapacity.VehiclesarenotforcedtoperformlanechangesatwheretheLCsignsappear,butareexpectedtobepreparedandlookforanappropriatechancetochangelanes.
Figure6:ConfigurationofLC&VSLController
AnLCcontrolledsegmentworksasthedischargingsectioninFigure5.Thespeedlimitsinthissegmentremainconstant—usuallythefreeflowhighwayspeedlimit—toensurethatvehiclescangetthroughthebottleneckasfastaspossible.Tohelpimproveflowrateatthebottleneck,theVSLcontrollertendstomaintainreasonabledensityinthedischargesection.VSLsigns,whichareusedtoinformdriversoftheenforced
Page 16
9
speedlimits,aredeployedatthebeginningofSection1throughSectionN-M.Itisassumedthatsensorsmeasurevehicledensityatsections1toNandsendtheinformationtotheVSLcontroller.Thecentralprocessingunitreceivesthedensitysignalinreal-timeandcomputesthedesiredVSLcontrolcommandofeachsectionfordisplay.
DesignofLCControlStrategyInthisstudy,thedesignoftheLCcontrollerincludesdecisionsonthepatternofLCrecommendationsandthelengthofLCcontrolledsegmentsaccordingtobottleneckformation.
LaneChangeRecommendationPatternsAssignmentofproperlanechangerecommendationtype𝑅! inlaneishouldhelpupstreamvehiclestoleavetheclosedlaneandevenlydistributetrafficflowtoopenlanes.Therefore,theLCcontrolpatternisafunctionofbottleneckformation.Supposeageneralhighwaysegmenthasmlanes,withLane1(Lanem)beingtheright(orleft)mostlane.WeselecttheLCrecommendationtypeforeachlaneusingthefollowingrules:
1. Fori=1,2,…,m,ifLaneiisopen,𝑅!="StraightAhead".
2. Fori=1(i=m),ifLaneiisclosed,𝑅!="ChangetoLeft(Right)".
3. For1<i<mifLaneiisclosed,andLanei-1andLanei+1arebothopen,𝑅!="ChangetoEitherWay".
4. For1<i<m,ifLaneiisclosed,Lanei-1(Lanei+1)isclosed,andLanei+1(Lanei-1)isopen,𝑅!="ChangetoLeft(Right)".
5. For1<i<m,ifLaneiisclosed,andLanei-1andLanei+1arebothclosed,thenwecheck𝑅(!!!)and𝑅(!!!).If𝑅(!!!) = 𝑅(!!!),then𝑅! = 𝑅(!!!) = 𝑅(!!!),elseif𝑅(!!!) ≠ 𝑅(!!!),𝑅!="ChangetoEitherWay".
Rules(1)–(5)canalwaysbeappliedfromLane1andLanemtothemiddleslanes,whichhencearewell-definedandself-consistent.
LengthofLCControlSegmentDecisiononthelengthoftheLCcontrolledsegmentisatrade-offbetweensmoothlanechangingandcapacityutilization.AlongerLCcontrolsegmentgivesupstreamvehiclesmorespacetochangelanesandthereforefurtheravoidsthequeue,butleadstoroadsurfaceunderutilization.Intuitively,ifmorelanesareclosedatthebottleneck,morevehiclesneedtochangelanes,andthenlongerLCcontroldistanceisrequiredtoprovideenoughspaceandtimetochangelanes.Therefore,theLCcontrolledsegmentlength𝑑!" isdecidedbythefollowingequation:
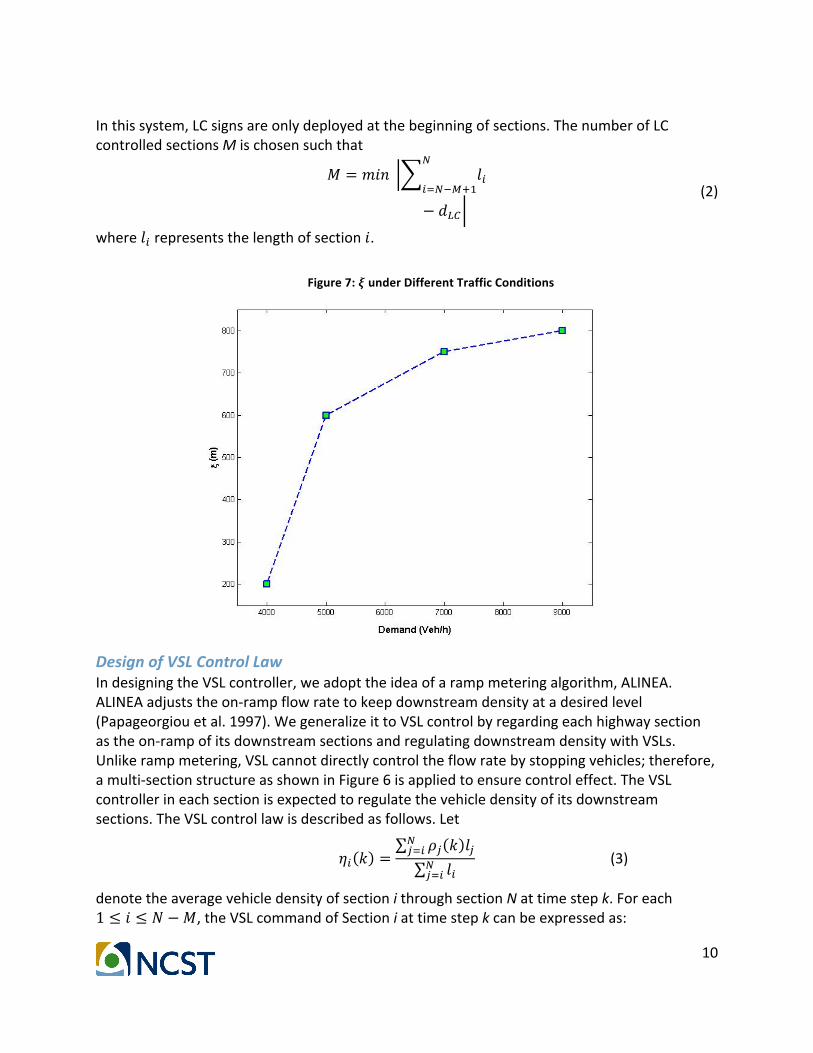
𝑑!" = 𝜉 ∗ 𝑛 (1)wherenisthenumberoflanesclosedatthebottleneck,and𝜉isadesignparameterrelatedtotheoriginalcapacityofthebottlenecksectionandthetrafficdemand.Forspecifichighwaysegments,theminimumvalueof𝜉requiredunderdifferenttrafficdemandcanbefoundbysimulation.Figure7showstheminimum𝜉underdifferentdemandforthesystemshowninFigure6.
Page 17
10
Inthissystem,LCsignsareonlydeployedatthebeginningofsections.ThenumberofLCcontrolledsectionsMischosensuchthat
𝑀 = 𝑚𝑖𝑛 𝑙!
!
!!!!!!!
− 𝑑!" (2)
where𝑙! representsthelengthofsection𝑖.
Figure7:𝝃underDifferentTrafficConditions
DesignofVSLControlLawIndesigningtheVSLcontroller,weadopttheideaofarampmeteringalgorithm,ALINEA.ALINEAadjuststheon-rampflowratetokeepdownstreamdensityatadesiredlevel(Papageorgiouetal.1997).WegeneralizeittoVSLcontrolbyregardingeachhighwaysectionastheon-rampofitsdownstreamsectionsandregulatingdownstreamdensitywithVSLs.Unlikerampmetering,VSLcannotdirectlycontroltheflowratebystoppingvehicles;therefore,amulti-sectionstructureasshowninFigure6isappliedtoensurecontroleffect.TheVSLcontrollerineachsectionisexpectedtoregulatethevehicledensityofitsdownstreamsections.TheVSLcontrollawisdescribedasfollows.Let
𝜂! 𝑘 =𝜌! 𝑘 𝑙!!
!!!
𝑙!!!!!
(3)
denotetheaveragevehicledensityofsectionithroughsectionNattimestepk.Foreach1 ≤ 𝑖 ≤ 𝑁 −𝑀,theVSLcommandofSectioniattimestepkcanbeexpressedas:
Page 18
11
𝑉! 𝑘 = 𝑉! 𝑘 − 1 + 𝐾! 𝜌! − 𝜂!(𝑘) (4)
where𝑉! 𝑘 isthespeedlimitcommandofsectioniincontrolperiod𝑘.𝐾!isthefeedbackgainand𝜌! denotesthecriticaldensityofthedischargingsection.InEquation(4),VSLcommandsrespondtothedifferencetoafixedreferencedensity,inordertosuppressshockwavesandmaintainthedensityinthedischargingsection.
ConstraintsonVSLcommandsToensuresafety,weapplythefollowingconstraintstoVSLcommandsinEquation(4).
1. FiniteNumberedCommandSpace.VSLcommandswouldbehardtocomplywithiftakingvaluesfromacontinuousspace.Hence,weroundVSLcommands𝑉! 𝑘 inEquation(4)towhole5mi/hnumbersandapplylower/upperboundstoit.Thismakesthecommandsclearfordriversandaddsdead-zonecharacteristicstothecontrollerandthereforeavoidcontrolchattering.
2. SaturationofSpeedLimitVariations.Itisdangeroustodecreasethespeedlimittoofastinbothtimeandspace.ThedecreaseshouldbewithinsomethresholdC! > 0betweensuccessivecontrolperiodsandhighwaysections.Wedon'tboundthespeedlimitvariationifthespeedlimitincreases.Inthisstudy,𝐶! = 10 𝑚𝑖/ℎ (16 𝑘𝑚/ℎ)C! =10mi/h(16km/h).
Theabovedescribedconstraintscanbepresentedasfollows𝑉! 𝑘 − 𝑉! 𝑘 − 1 < 𝐶! , 1 ≤ 𝑖 ≤ 𝑁 −𝑀 (5)𝑉! 𝑘 − 𝑉!!! 𝑘 < 𝐶! , 1 ≤ 𝑖 ≤ 𝑁 −𝑀 (6)𝑉!"# ≤ 𝑉! 𝑗 ≤ 𝑉!"# , 1 ≤ 𝑖 ≤ 𝑁 −𝑀 (7)
Hence,thevirtualmainlinerampmeteringVSLcontrollercanbeformulatedasfollows:
𝑉!(𝑘) = 𝑉! 𝑘 − 1 + 𝐾! 𝜌! − 𝜂! 𝑘 ! (8)
𝑉! 𝑘 = max 𝑉! 𝑘 ,𝑉! 𝑘 − 1 − 𝐶! , �!!! 𝑘 − 1 − 𝐶! (9)
𝑉! 𝑘 =𝑉!"# , if𝑉! 𝑘 > 𝑉!"#𝑉!"#, if𝑉! 𝑘 > 𝑉!"#𝑉! 𝑘 , otherwise
(10)
InEquation(9), ⋅⋅⋅ !istheoperatorthatroundsarealnumbertoitsclosestwholemultipleof5.InEquation(10),𝑉!"#and𝑉!"#aretheupperandlowerboundsofVSLcommands,respectively.
CombinationofVSLControlandLCControlAsdescribedinSection2.2andSection2.3,theLCcontrollerisdesignedbasedonbottlenecklayoutandtrafficdemand.TheVSLcontrollertakesanLCcontrolledsegmentasthedischargingsectionanddeploysVSLsignsupstreamofittokeepdesireddensityandsmooththetrafficflow.TheeffectofanLCcontrollerhelpstheVSLcontrollertobemoreeffectiveingeneratingthedesiredbenefits.AblockdiagramofthecombinedVSL&LCcontrolsystemisshowninFigure8.
Page 19
12
Figure8:SystemBlockDiagram
Evaluation
SimulationNetworkWeevaluatethecombinedVSL&LCcontrolmethodona16km-longsouthboundsegmentofI-710freewayinCalifornia,UnitedStates(betweenI-105junctionandPortofLongBeach),whichhasastaticspeedlimitof65mi/h(105km/h).ThePortofLongBeachisoneofthelargestseaportsintheUSandI-710freewaycarrieshightrafficdemandwithlargetruckvolume.Itispredictedthatthepeakhourdemandofthissegmentwouldbeabout9,000vehiclesperhour(veh/h)in2035,30%ofwhichwouldbetrucks(Systematics2007).Thisisaveryhighratioconsideringthelargeoveralldemand.WebuildthisfreewaynetworkinVISSIM.Thestudiedhighwaysegmenthas3–5lanesatdifferentlocations,asshowninFigure9.Weassumethebottleneckisintroducedbyanincidentwhichblockedonelane.Theupstreamsegmentofthebottleneckisdividedintoten500–600metersections.ThebarsacrossthehighwayinFigure9arewhereVSLsignsandLCsignsaredeployed.Neartheindicatedincidentspotisa3-lane/4-laneconnection;therefore,differentbottleneckconditionscanbesimulatedbyslightlychangingtheincidentlocation.InVISSIM,incidentsaresimulatedbyplacingastoppedbusinacertainlane.
Page 20
13
Figure9:SimulationNetwork
TrafficDemandandCompositionWeredefinedthevehicletypesinVISSIMbasedonFederalHighwayAdministration(FHWA)vehicleclassesandEnvironmentProtectionAgency(EPA)MotorVehicleEmissionSimulator(MOVES)vehiclesourcetypestoapplytheenvironmentalevaluationmodels(Systematics2007,EnvironmentalProtectionAgency2010).ThevehicletypesandtheirproportioninthesimulationtrafficdemandarelistedinTable1.Here,passengertrucksareclassifiedascarssincetheirweight,power,anddynamicsareverymuchsimilartopassengercarsaccordingtoFHWA.
Page 21
14
Table1:VehicleTypes
VehicleClass VehicleType AverageWeight(kg) ProportioninDemand(%)
CarsPassengerCar 1,400 40
PassengerTruck 1,800 30
Trucks
Single-bodyShortTruck 6,800 5
Single-bodyLongTruck 7,600 5
CombinedShort-hualTruck 29,000 1
CombinedLong-haulTruck 32,000 1
Tosimulatetheworstcase,thetrafficdemandofthehighwayandeachramparecalibratedwith2014annualaveragepeakhourdataprovidedbyCaliforniaDepartmentofTransportation(2015),butincreasedproportionallytomakethehighwaydemand9,000veh/hatthebottleneck,30%ofwhicharetrucksaspredictedinLosAngelesCountyMetropolitanTransportationAuthority(2010).Weassumethatallpassengercarsaregasoline-basedandalltrucksarediesel-based.CarfollowingandlanechangebehaviorintheVISSIMmodeliscalibratedtobemoderate.Accordingtoourstudy,thesystemperformanceisnotsensitivetodrivingbehaviorwithcombinedVSL/LCcontrol.
MonteCarloSimulationandSetupofIncidentScenariosToverifythattheproposedcontrolmethodgeneratesconsistentresultsunderdifferenttrafficconditions,wesetup3differentscenariosonthehighwaynetworktoperformageneralevaluationoftheproposedmethodandtake10setsofMonteCarlosimulationforeachscenario.ThefinalperformancemeasurementsareaveragesoftheMonteCarlosimulationresults.Inthesimulation,alllanesareopenatthebeginningofthesimulation.At20minafterthesimulationbegins,acertainlaneisclosedneartheincidentspot(asshowninFigure9)andthecontrollerisactivated.Thesimulationterminateswhen2,000vehiclespassthroughthebottleneck.Weheldconstantthetotalnumberofvehiclesthatpassedthroughthebottleneckineachsimulation,sothatthemeasurementsarecomparable.ThescenarioconfigurationsarelistedinTable2.
Page 22
15
Table2:SimulationScenarios
ScenarioNumber TotalNumberofLanes BottleneckPattern
1 3 Lane2Closed
2 3 Lane3Closed
3 4 Lane3Closed
PerformanceMeasurementsWeintroducethefollowingmeasurementstoevaluatetheperformanceoftheproposedcontrolmethod.Tobeprecise,allmeasuresstartwhenalaneclosesandterminateattheendofthesimulation.Controleffectsontrafficmobilityareevaluatedbytotaltraveltime(TTT)ofallvehiclesthatpassedthroughthehighwaynetwork(inhours).Let𝑡!,!"and𝑡!,!"#denotethetimeinstantvehicleientersandexitsthenetwork,respectively.TTTisgivenbytheequation:
𝑇𝑇𝑇 = 𝑡!,!"# − 𝑡!,!"
!"""
!!!
(11)
Controleffectsontrafficsafetyareevaluatedbytotalnumberofstops𝑠!"!andtotalnumberoflanechanges𝑐!"!:
𝑠!"! = 𝑠!
!"""
�!!
(12)
𝑐!"! = 𝑐!
!"""
!!!
(13)
where𝑠! and𝑐! arenumberofstopsandlanechangesperformedbyvehiclei,respectively.
Forenvironmentalimpact,wemeasurefuelconsumptionrate𝑓𝑟,carbondioxide(CO2)emissionrate𝐸!!!,andnitrogenoxide(NOx)emissionrate𝐸!!! asfollows:
𝑓𝑟 =
𝑓!!"""!!!
2000 ⋅ 𝑑!!"""!!!
(14)
𝐸!!! =
𝐸!!!,!!"""!!!
2000 ⋅ 𝑑!!"""!!!
(15)
Page 23
16
𝐸!!! =
𝐸!!!,!!"""!!!
2000 ⋅ 𝑑!!"""!!!
(16)
where𝑓!,𝐸!!!,!,and𝐸!!!,! arefuelconsumption,CO2emissionrateandNOxemissionrateofvehicleirespectively.𝑑! isthedistancetravelledinthenetworkofvehiclei.
ControllerParametersInoursimulation,thedefaultspeedlimitwhenVSLcontrollerisnotactiveis𝑣!=65mi/h(105km/h).TheVSLdecreasethresholdis𝐶!=5mi/h.ThelowerandupperboundsofVSLare𝑉!"#=30mi/h(48km/h)and𝑉!"�=65mi/h(105km/h),respectively.Feedbackgainis𝐾!=2.
SimulationResultsInscenario1–3,wecomparethesimulationresultsunderthefollowingcontrolmodes:
1. Nocontrol.
2. LCcontrolonly.
3. VSLcontrolonly.
4. CombinedVSL&LCcontrol
Figure10andFigure11showthedischargingsectiondensityandthebottleneckflowrateduringthesimulationinscenario1.Aftertheincidenthappensat1,200s,thedensityofthedischargingsectionincreasesdramaticallyto250veh/kmandthebottleneckflowratedropsby50%ifLCcontrolisnotapplied.WhenVSLcontrolisappliedalone,thedensityofthedischargingsectionincreasesslower,butcannotbekeptatalowerlevel.WhenLCcontrolisapplied,thebottleneckflowrateonlydeceasedbyabout30%.Sincewelose1laneoutof3,theflowrateperlanehasnodrop.LCcontrolensuresahighdischargingrateofthebottleneckandthereforeavoidsthecongestion.ComparingtheflowrateanddensitycurvewithandwithoutVSLcontrol,systemoscillationisdampenedbyVSL,andthustrafficsafetyimproved.Fuelconsumptionandemissionsalsotendtobereduced,whichisshowninTables3–8.
Page 24
17
Figure10:FlowRateinDischarchingSection
Figure11:DensityinDischargingSection
TheeffectsofdifferentcontrolmodesonperformancemeasurementsdefinedintheprevioussectionsareshowninTables3–8.TheenvironmentaldatainthetablesareallevaluatedwithCMEM(ComprehensiveModalEmissionModel)(Barthetal.2000).Wecanobservethatthecombinedcontrolmethodprovidessignificantimprovementoneachmeasurement,whichisalsoconsistentwithrespecttodifferentscenarios.ThecombinedVSL&LCcontrolstrategyreducesTTTby26–32%,𝑠!"!byabout90%,𝑐!"!by3–14%,𝑓𝑟and𝐸!!! by16–24%,and𝐸!!! by16–21%.
Page 25
18
Table3:PerformanceofCarsinScenario1
PerformanceMeasurement
NoControl LC
LCPercentageChanged
VSLVSL
PercentageChanged
VSL+LCVSL+LC
PercentageChanged
TravelTime(min) 29,561 20,486 -31% 29,780 1% 20,574 -30%
NumberofStops 27,503 3,007 -89% 25,721 -6% 3,099 -89%
NumberofLC 12,344 12,089 -2% 11,134 -10% 10,630 -14%
Fuel(g/mi/veh) 141.46 120.76 -15% 130.78 -8% 109.64 -22%
CO2(g/mi/veh) 422.4 354.76 -16% 394.44 -7% 325.56 -23%
NOx(g/mi/veh) 0.49 0.47 -4% 0.42 -15% 0.39 -20%
Table4:PerformanceofTrucksinScenario1
PerformanceMeasurement
NoControl LC
LCPercentageChanged
VSLVSL
PercentageChanged
VSL+LCVSL+LC
PercentageChanged
TravelTime(min) 9,539 6,925 -27% 9,447 -1% 7,047 -26%
NumberofStops 6,757 719 -89% 6,344 -6% 783 -88%
NumberofLC 1,245 1,314 6% 1,094 -12% 1,142 -8%
Fuel(g/mi/veh) 599.24 582.77 -3% 520.60 -13% 505.71 -16%
CO2(g/mi/veh) 1,917.86 1,864.23 -3% 1,665.80 -13% 1,617.36 -16%
NOx(g/mi/veh) 22.10 20.38 -8% 20.03 -9% 18.65 -16%
Table5:PerformanceofCarsinScenario2
PerformanceMeasurement
NoControl LC
LCPercentageChanged
VSLVSL
PercentageChanged
VSL+LCVSL+LC
PercentageChanged
TravelTime(min) 29,076 19,914 -32% 28,403 -2% 19,854 -32%
NumberofStops 23,889 2,541 -89% 22,464 -6% 2,321 -90%
NumberofLC 12,404 12,944 4% 11,254 -9% 11,585 -7%
Fuel(g/mi/veh) 141.60 120.67 -15% 128.50 -9% 109.67 -23%
CO2(g/mi/veh) 421.32 353.24 -16% 386.03 -8% 323.71 -23%
NOx(g/mi/veh) 0.50 0.48 -5% 0.42 -17% 0.41 -19%
Page 26
19
Table6:PerformanceofTrucksinScenario2
PerformanceMeasurement
NoControl LC
LCPercentageChanged
VSLVSL
PercentageChanged
VSL+LCVSL+LC
PercentageChanged
TravelTime(min) 9,273 6,862 -26% 9,280 0% 6,842 -26%
NumberofStops 7,206 573 -92% 6,665 -7% 535 -93%
NumberofLC 1,354 1543 14% 1,233 -9% 1,373 1%
Fuel(g/mi/veh) 599.35 582.86 -3% 516.70 -14% 502.49 -16%
CO2(g/mi/veh) 1,918.83 1,864.56 -3% 1,653.81 -14% 1,607.09 -16%
NOx(g/mi/veh) 22.22 20.37 -8% 19.94 -10% 18.56 -16%
Table7:PerformanceofCarsinScenario3
PerformanceMeasurement
NoControl LC
LCPercentageChanged
VSLVSL
PercentageChanged
VSL+LCVSL+LC
PercentageChanged
TravelTime(min) 30,033 20,378 -32% 30,033 0% 20,426 -32%
NumberofStops 27,544 2,797 -90% 25,763 -6% 2,681 -90%
NumberofLC 12,475 12,380 -1% 11,295 -9% 11,084 -11%
Fuel(g/mi/veh) 143.37 120.71 -16% 132.38 -8% 110.05 -23%
CO2(g/mi/veh) 427.21 354.32 -17% 398.29 -%7% 326.01 -24%
NOx(g/mi/veh) 0.51 0.47 -6% 0.43 -15% 0.40 -21%
Table8:PerformanceofTrucksinScenario3
PerformanceMeasurement
NoControl LC
LCPercentageChanged
VSLVSL
PercentageChanged
VSL+LCVSL+LC
PercentageChanged
TravelTime(min) 9,524 6,938 -27% 9,650 1% 6,914 -27%
NumberofStops 6,729 695 -90% 6,568 -2% 650 -90%
NumberofLC 1,276 1,331 4% 1,152 -10% 1,162 -9%
Fuel(g/mi/veh) 601.58 583.50 -3% 523.66 -13% 506.20 -16%
CO2(g/mi/veh) 1,925.31 1,866.57 -3% 1,675.56 -13% 1,618.96 -16%
NOx(g/mi/veh) 22.16 20.40 -8% 20.12 -9% 18.67 -16%
TostudytherolesofVSLcontrolandLCcontrolinthecombinedcontrolstrategyrespectively,wealsoanalyzethecasesinwhichVSLcontrolandLCcontrolareappliedtothetrafficsystemindividually.LCcontrolconsiderablydecreasestraveltimeandnumberofstops,butcannotreducenumberoflanechanges.LCcontrolonlyspreadsforcedlanechangesalongtheLCcontrolledsections,insteadofavoidingthem.Ontheotherhand,VSLcontrolhomogenizesthedensityandspeedineachsection.Driversdonottendtochangelanesifthedensityandspeedaresimilarinalllanes;thereforeVSLcontrolisabletoreducenumberoflanechangesinVSL
Page 27
20
controlledsections.Thisisveryimportantfortrafficsafetyintruck-dominanthighways.Trucksnotonlytakealongtimeandlargespacetochangelanes,theirlargesizealsoblockstheeyesightofdrivers,whichmakeslanechangingmuchmoredangerousthanusual.Theevaluationofenvironmentalimpactsisinteresting.VSLcontrolandLCcontrolhavedifferentperformanceeffectsondifferentmeasurementsandvehicletypes.Fortrucks,𝑓𝑟and𝐸!!! arehighlysensitivetoaccelerations.LargeportionsoffuelconsumptionandCO2emissionsareproducedbyspeedingupandslowingdowninshockwaves.Therefore,althoughLCcontrolreducedthetraveltimeoftrucksby26–27%,𝑓𝑟and𝐸!!! oftrucksareonlyreducedby3%.Ontheotherhand,VSLcontrolsuppressesshockwavesandsmoothsthespeedofallvehicles,whichreduce𝑓𝑟and𝐸!!! oftrucksby13–14%.Forcars,𝑓𝑟and𝐸!!! arenotassensitivetoaccelerationsastheyarefortrucks.Engineefficiency,whichincreaseswithvehiclespeed,isalsoamajorfactor.LCcontrolsignificantlyincreasestheaveragespeedandengineefficiencyofcars,andthereforedecreases𝑓𝑟and𝐸!!! ofcarsby15–17%.Inthemeantime,VSLcontrolalsoreduces𝑓𝑟and𝐸!!! ofcarsby7–9%.NOxisamajortoxicroadtrafficemission.Sinceweassumecarsareallgasoline-based,theNOxemissionofcarsisverysmallcomparedtothatoftrucks.BothVSLcontrolandLCcontrolcontributetoreducingNOx.Fromthesimulationresultsandanalysisabove,acombinedVSL&LCcontrolmethodcanimprovethebottleneckflowrate,smoothandhomogenizethetrafficflowsimultaneously,andishenceabletoprovidesignificantandconsistentimprovementontrafficmobility,safety,andenvironmentalimpactsintruck-dominanthighwaynetworks.
ConclusionThisreportproposedacombinedvariablespeedlimit(VSL)andlanechange(LC)controlstrategyfortruck-dominanthighwaytraffic.Intheproposedmethod,LCcontrolprovideslanechangerecommendationsinanopenloopmannerbasedonbottleneckformation.Anon-modelbasedreactiveproportional-integral(PI)VSLcontrollerisdesignedwhichisrobustwithrespecttotrafficdisturbanceandislesscomputationallydemandingthanmodel-basedproactiveVSLcontrollers.CertainconstraintsontheoutputoftheVSLcontrollerareimposedbytakingintoaccountdriverresponsetoVSLcommands.SimulationsofthetrafficalongI-710wherethevolumeoftrucksisrelativelyhighareusedtodemonstrateimprovementsintraveltimeandtheenvironmentunderdifferentscenarios.Combinedlanechangeandvariablespeedlimitcontrolforhighwaytraffichasastrongpotentialtoimprovetrafficflowduringincidentsandbottlenecksbycommunicatinglanechangeandspeedlimitrecommendationstodrivers.UsingthetrafficonI-710asademonstrationexample,weshowedconsistentbenefitsfordifferentincidentscenariosasfollows:
• Reducedtraveltimeontheorderof25–36%• Reducednumberofstopsby90%• Fuelsavingsofabout20%
Page 28
21
• ReductionofCO2andNOxemissionsbyabout16–20%
Theimplementationofcombinedlanechangeandvariablespeedcontrolisfeasiblewithtoday’savailabletechnologiesanddoesnotrequiremajorchangestoexistinghighwayinfrastructure.
Page 29
22
GLOSSARYTerm DefinitionCEC CaliforniaEnergyCommissionCMEM ComprehensiveModalEmissionModelCO2 CarbonDioxideCOM ComponentObjectModelEPA EnvironmentProtectionAgencyFHWA FederalHighwayAdministrationITS IntelligentTransportationSystemLC LaneChangeMOVES MotorVehicleEmissionSimulatorMPC ModelPredictiveControlNOx NitrogenOxidesPI Proportional-IntegralTTT TotalTravelTimeUCR UniversityofCalifornia,RiversideUSC UniversityofSouthernCaliforniaVSL VariableSpeedLimit
Page 30
23
REFERENCESAbdel-Aty,M., J.Dilmore,andA.Dhindsa (2006).Evaluationofvariable speed limits for real-
timefreewaysafetyimprovement,Accidentanalysis&prevention,vol.38,no.2,pp.335–345.
Baldi, S., I.Michailidis, E.B.Kosmatopoulos,A.Papachristodoulou, andP.A. Ioannou (2014).Convexdesigncontrolforpracticalnonlinearsystems.
Barth, M., An, F., Younglove, T., Scora, G., Levine, C., Ross, M., Wenzel, T. (2000).Comprehensive modal emission model (CMEM), version 2.0 user’s guide,University ofCalifornia,Riverside.
Baskar,L.D.,B.DeSchutter,andH.Hellendoorn(2008).Model-basedpredictivetrafficcontrolfor intelligent vehicles: Dynamic speed limits and dynamic lane allocation, IntelligentVehiclesSymposium,2008IEEE,pp.174–179.
California Department of Transportation (2015). Caltrans performance measurement system(pems).http://pems.dot.ca.gov/.Accessed2015.
EnvironmentalProtectionAgency(2010).MOVES2010HighwayVehicle:PopulationandActivityData. Assessment and Standards Division, Office of Transportation and Air Quality.November2010.EPA420-R-10-026.
EnvironmentalProtectionAgency(2015).InventoryofUSgreenhousegasemissionsandsinks:1990-2013,EPA430-R-15-004,Tech.Rep.
Hegyi, A., B. De Schutter, and J. Hellendoorn (2005). Optimal coordination of variable speedlimitstosuppressshockwaves,IEEETransactionsonIntelligentTransportationSystems,vol.6,no.1,pp.102–112.
Jha,M., D. Cuneo, andM. Ben-Akiva (1999). Evaluation of freeway lane control for incidentmanagement,Journaloftransportationengineering,vol.125,no.6,pp.495–501.
Jin,W.-L.,andH. Jin (2014).Analysisanddesignofavariablespeed limitcontrol systematafreeway lane-dropbottleneck:A switched systems approach,Decision andControl (CDC),2014IEEE53rdAnnualConferenceon,Dec2014,pp.1753–1758.
Kejun,L.,Y.Meiping,Z.Jianlong,andY.Xiaoguang(2008).Modelpredictivecontrolforvariablespeed limit in freewaywork zone, in Control Conference, 2008. CCC 2008. 27th Chinese.IEEE,pp.488–493.
LosAngelesCountyMetropolitanTransportationAuthority(2010).Technicalmemorandum-I-710corridorprojectEIR/EIStraveldemandmodelingmethodology,Tech.Rep.
Lu, X.-Y. and S. E. Shladover (2014). Review of variable speed limits and advisories,TransportationResearchRecord: Journalof theTransportationResearchBoard,vol.2423,no.1,pp.15–23.
Page 31
24
Papageorgiou, M., H. Hadj-Salem, and F. Middelham (1997). ALINEA local ramp metering:Summary of field results, Transportation Research Record: Journal of the TransportationResearchBoard,vol.1603,no.1,pp.90–98.
Schrank, D., B. Eisele, and T. Lomax (2012). TTI’s 2012 urban mobility report, Texas A&MTransportationInstitute.TheTexasA&MUniversitySystem.
Smulders, S. (1990). Control of freeway traffic flow by variable speed signs, TransportationResearchPartB:Methodological,vol.24,no.2,pp.111–132.
Strocko,E.,M.Sprung,L.Nguyen,C.Rick,andJ.Sedor(2014).Freightfactsandfigures2013,Tech.Rep.
Systematics,C.(2007).MAGinternaltrucktravelsurveyandtruckmodeldevelopmentstudy.
Toth,G.R.,G.A.Radja,K.K.Thiriez,andJ.S.Carra(2003).Largetruckcrashcausationstudyinthe united states, Proceedings of the 18th International Technical Conference on theEnhancedSafetyofVehicles.Washington,DC:DepartmentofTransportation.
Van den Hoogen, E. and S. Smulders (1994). Control by variable speed signs: Results of thedutchexperiment.
Wang, Y. and P. Ioannou (2011). Dynamic variable speed limit control: Design, analysis andbenefits,Ph.D.dissertation,UniversityofSouthernCalifornia.
Yang, X., Y. Lin, Y. Lu, and N. Zou (2013). Optimal variable speed limit control for real-timefreewaycongestions,Procedia-SocialandBehavioralSciences,vol.96,pp.2362–2372.
Page 32
25
NOMENCLATURE⋅⋅⋅ ! operatorthatroundsarealnumbertoitsclosestwholemultipleof5𝐶! variablespeedlimitdecreasethreshold𝑐! numberoflanechangesperformedbyvehiclei𝑐!"! totalnumberoflanechanges𝑑! distancetravelledinthenetworkofvehiclei𝑑!" lanechangecontrolledsegmentlength𝜉 designparameterrelatedtotheoriginalcapacityofthebottlenecksection
andthetrafficdemand𝐸!!! CO2emissionrate𝐸!!!,! CO2emissionrateofvehiclei𝐸!!! NOxemissionrate𝐸!!!,! NOxemissionrateofvehiclei𝑓𝑟 fuelconsumptionrate𝑓! fuelconsumptionofvehicleirespectively𝑖 incrementalunit(e.g.,forsectionnumber,vehiclenumber)k timestep𝐾! feedbackgain𝑙! lengthofsection𝑖𝑀 numberoflanechangecontrolledsections𝑁 totalnumberofhighwaysegmentsupstreamofthebottleneck𝑛 numberoflanesclosedatthebottleneck
𝜂! 𝑘 averagevehicledensityofsectionithroughsectionNattimestepk𝜌! criticaldensityofthedischargingsection𝑅! lanechangerecommendationtype𝑠! numberofstopsperformedbyvehiclei𝑠!"! totalnumberofstops𝑡!,!" timeinstantvehicleientersthenetwork𝑡!,!"# timeinstantvehicleiexitsthenetwork𝑣! defaultspeedlimitwhenvariablespeedlimitcontrollerisnotactive𝑉! 𝑘 speedlimitcommandofsectioniincontrolperiod𝑘𝑉!"# upperboundofvariablespeedlimit𝑉!�! lowerboundofvariablespeedlimit
Page 33
26
APPENDIXA:DefinitionsArterialstreet:Ahigh-capacityurbanroadthatdeliverstrafficfromsmallerroadstofreeways.Modelpredictivecontrol:Anadvancedmethodofprocesscontrolthatreliesondynamicmodelsoftheprocess.Themainadvantageofmodelpredictivecontrolisthefactthatitallowsthecurrenttimeeventtobeoptimized,whilekeepingfuturetimeeventsinaccount.MonteCarlomethod:Acomputationalalgorithmthatreliesonrepeatedrandomsamplingtoobtainnumericalresults.Itisatechniqueinwhichalargequantityofrandomlygeneratednumbersarestudiedusingaprobabilisticmodeltofindanapproximatesolutiontoanumericalproblemthatwouldbedifficulttosolvebyothermethods.Proportional-integralcontroller:Analgorithmthatcomputesandproducesanoutputateverysampletime,whileeliminatingoffsets.Proportional-integralcontrollersarewidelyusedinprocesscontrolapplications.Variablespeedlimit:Trafficspeedlimitthatchangesbasedonroad,traffic,and/orweathercondition.