Page 1
Traffic Impact Study
TMS Engineers, Inc.
Westlake Elementary SchoolWestlake, Ohio
June 5, 2017
Prepared for:Westlake City Schools - Board of Education
27200 Hilliard BoulevardWestlake, OH 44145
Page 2
TRAFFICIMPACTSTUDY
WestlakeElementarySchool
Westlake,Ohio
June5,2017
PreparedFor:
WestlakeCitySchools‐BoardofEducation27200HilliardBoulevardWestlake,Ohio44145
PreparedBy:
TMSEngineers,Inc.2112CaseParkwayS.
Unit#7Twinsburg,Ohio44087
Page 3
Traffic Impact Study Westlake Elementary School, Westlake, Ohio
TableofContents
ExecutiveSummary . . . . . . . . . . . . . . . . . . . . . . . . . . . . . . . . . . . . . . . . . . . . . . . . . . . . . . . . . . . . . . . . . . . . . . . vi‐ix
Chapter1Introduction . . . . . . . . . . . . . . . . . . . . . . . . . . . . . . . . . . . . . . . . . . . . . . . . . . . . . . . . . 1‐4
1.1 PurposeoftheReport . . . . . . . . . . . . . . . . . . . . . . . . . . . . . . . . . . . . . . . . . . . . . . . . . . . . . 1
1.2 StudyObjectives . . . . . . . . . . . . . . . . . . . . . . . . . . . . . . . . . . . . . . . . . . . . . . . . . . . . . . . . . . . . . . . . . 4
Chapter2AreaConditions . . . . . . . . . . . . . . . . . . . . . . . . . . . . . . . . . . . . . . . . . . . . . . . . . . . . . 5‐12
2.1 TransportationNetworkStudyArea . . . . . . . . . . . . . . . . . . . . . . . . . . . . . . . . . . . . . . . . . . . . . . 5
2.2 Traffic. . . . . . . . . . . . . . . . . . . . . . . . . . . . . . . . . . . . . . . . . . . . . . . . . . . . . . . . . . . . . . . . . . . . . . . . . . . 10
Chapter3ProjectedTrafficConditions . . . . . . . . . . . . . . . . . . . . . . . . . . . . . . . . . . . . . . . 13‐28
3.1 SiteTraffic . . . . . . . . . . . . . . . . . . . . . . . . . . . . . . . . . . . . . . . . . . . . . . . . . . . . . . . . . . . . . . . . . . . . . . 13
3.2 Non‐SiteTraffic . . . . . . . . . . . . . . . . . . . . . . . . . . . . . . . . . . . . . . . . . . . . . . . . . . . . . . . . . . . . . . . . . 20
3.3 FutureTraffic . . . . . . . . . . . . . . . . . . . . . . . . . . . . . . . . . . . . . . . . . . . . . . . . . . . . . . . . . . . . . . . . . . . 24
Chapter4TrafficAnalysis. . . . . . . . . . . . . . . . . . . . . . . . . . . . . . . . . . . . . . . . . . . . . . . . . . . . 29‐67
4.1 CapacityandLOSatStudyAreaIntersections . . . . . . . . . . . . . . . . . . . . . . . . . . . . . . . . . . . . 29
4.2 CapacityandLOSatDevelopmentAccessIntersections. . . . . . . . . . . . . . . . . . . . . . . . . . . 46
4.3 AuxiliaryTurningLaneWarrantAnalysis . . . . . . . . . . . . . . . . . . . . . . . . . . . . . . . . . . . . . . . . 49
4.4 TurnLaneLengthAnalysis . . . . . . . . . . . . . . . . . . . . . . . . . . . . . . . . . . . . . . . . . . . . . . . . . . . . . . 50
4.5 AlternateScenarioAnalysis. . . . . . . . . . . . . . . . . . . . . . . . . . . . . . . . . . . . . . . . . . . . . . . . . . . . . . 52
4.6 ImprovementstoAccommodateStudyAreaTraffic . . . . . . . . . . . . . . . . . . . . . . . . . . . . . . 62
Chapter5Conclusions . . . . . . . . . . . . . . . . . . . . . . . . . . . . . . . . . . . . . . . . . . . . . . . . . . . . . . . 68‐71
June 5, 2017 Page i TMS Engineers, Inc.
Page 4
Traffic Impact Study Westlake Elementary School, Westlake, Ohio
Appendices
AppendixA‐TrafficCountDataAppendixB‐TripGenerationData
AppendixC‐ExistingCapacityAnalysisWorksheets‐2017
AppendixD‐No‐BuildCapacityAnalysisWorksheets‐2019
AppendixE‐No‐BuildCapacityAnalysisWorksheets‐2039
AppendixF‐No‐BuildCapacityAnalysisWorksheets‐2039w/Improvements
AppendixG‐BuildCapacityAnalysisWorksheets‐2019
AppendixH‐BuildCapacityAnalysisWorksheets‐2019w/Improvements
AppendixI‐TrafficSignalWarrantAnalysis
AppendixJ‐BuildCapacityAnalysisWorksheets‐2039
AppendixK‐BuildCapacityAnalysisWorksheets‐2039w/Improvements
AppendixL‐AccessCapacityAnalysisWorksheets‐2019
AppendixM‐AccessCapacityAnalysisWorksheets‐2039
AppendixN‐ODOTTurnLaneWarrantGraphs
AppendixO‐ODOTTurnLaneDesignCriteria
AppendixP‐CapacityAnalysisWorksheets‐2039AlternateScenario
AppendixQ‐CapacityAnalysisWorksheets‐2039AlternateScenariow/Improvements
AppendixR‐ODOTChannelizingIslandDesignCriteria
June 5, 2017 Page ii TMS Engineers, Inc.
Page 5
Traffic Impact Study Westlake Elementary School, Westlake, Ohio
ListofFigures
Figure1.1LocationMap . . . . . . . . . . . . . . . . . . . . . . . . . . . . . . . . . . . . . . . . . . . . . . . . . . . . . . . . . . . . . . . . . . . . . . . . . 2
Figure1.2SitePlan . . . . . . . . . . . . . . . . . . . . . . . . . . . . . . . . . . . . . . . . . . . . . . . . . . . . . . . . . . . . . . . . . . . . . . . . . . . . . . 3
Figure2.1FunctionalClassification . . . . . . . . . . . . . . . . . . . . . . . . . . . . . . . . . . . . . . . . . . . . . . . . . . . . . . . . . . . . . . 6
Figure2.2AerialView . . . . . . . . . . . . . . . . . . . . . . . . . . . . . . . . . . . . . . . . . . . . . . . . . . . . . . . . . . . . . . . . . . . . . . . . . . . 9
Figure2.3ExistingLaneUse&TrafficControl . . . . . . . . . . . . . . . . . . . . . . . . . . . . . . . . . . . . . . . . . . . . . . . . . . . 10
Figure2.4ExistingWeekdayPeakHourTrafficVolumes. . . . . . . . . . . . . . . . . . . . . . . . . . . . . . . . . . . . . . . . . 12
Figure3.1GeneratedTrafficDistribution‐PassengerVehicles . . . . . . . . . . . . . . . . . . . . . . . . . . . . . . . . . . . 16
Figure3.2GeneratedTrafficDistribution‐SchoolBuses . . . . . . . . . . . . . . . . . . . . . . . . . . . . . . . . . . . . . . . . . 17
Figure3.3GeneratedTraffic‐PassengerVehicles. . . . . . . . . . . . . . . . . . . . . . . . . . . . . . . . . . . . . . . . . . . . . . . . 18
Figure3.4GeneratedTraffic‐SchoolBuses. . . . . . . . . . . . . . . . . . . . . . . . . . . . . . . . . . . . . . . . . . . . . . . . . . . . . . 19
Figure3.52019No‐BuildWeekdayTrafficVolumes . . . . . . . . . . . . . . . . . . . . . . . . . . . . . . . . . . . . . . . . . . . . . 25
Figure3.62039No‐BuildWeekdayTrafficVolumes . . . . . . . . . . . . . . . . . . . . . . . . . . . . . . . . . . . . . . . . . . . . . 26
Figure3.72019BuildWeekdayTrafficVolumes . . . . . . . . . . . . . . . . . . . . . . . . . . . . . . . . . . . . . . . . . . . . . . . . 27
Figure3.82039BuildWeekdayTrafficVolumes . . . . . . . . . . . . . . . . . . . . . . . . . . . . . . . . . . . . . . . . . . . . . . . . 28
Figure4.1AlternateScenarioGeneratedTraffic‐PassengerVehicles . . . . . . . . . . . . . . . . . . . . . . . . . . . . 54
Figure4.2AlternateScenario2039BuildWeekdayTrafficVolumes. . . . . . . . . . . . . . . . . . . . . . . . . . . . . 55
Figure4.3RecommendedLaneUseandTrafficControl‐SitePlan . . . . . . . . . . . . . . . . . . . . . . . . . . . . . . . 64
Figure4.4RecommendedLaneUseandTrafficControl‐InteriorTrafficControl . . . . . . . . . . . . . . . . . 66
Figure4.5RecommendedLaneUseandTrafficControl‐AlternateScenario. . . . . . . . . . . . . . . . . . . . . . 67
June 5, 2017 Page iii TMS Engineers, Inc.
Page 6
Traffic Impact Study Westlake Elementary School, Westlake, Ohio
ListofTables
Table‐2.1FunctionalClassification . . . . . . . . . . . . . . . . . . . . . . . . . . . . . . . . . . . . . . . . . . . . . . . . . . . . . . . . . . . . . . . 5
Table‐2.2RoadwayCharacteristics . . . . . . . . . . . . . . . . . . . . . . . . . . . . . . . . . . . . . . . . . . . . . . . . . . . . . . . . . . . . . . . 7
Table‐3.1ITELandUseCodes . . . . . . . . . . . . . . . . . . . . . . . . . . . . . . . . . . . . . . . . . . . . . . . . . . . . . . . . . . . . . . . . . . . 13
Table‐3.2NewTripGeneration . . . . . . . . . . . . . . . . . . . . . . . . . . . . . . . . . . . . . . . . . . . . . . . . . . . . . . . . . . . . . . . . . 14
Table‐3.3AMTripOrigins&Destinations . . . . . . . . . . . . . . . . . . . . . . . . . . . . . . . . . . . . . . . . . . . . . . . . . . . . . . . 14
Table‐3.4PMTripOrigins&Destinations . . . . . . . . . . . . . . . . . . . . . . . . . . . . . . . . . . . . . . . . . . . . . . . . . . . . . . . 15
Table‐3.5GrowthRates&Factors . . . . . . . . . . . . . . . . . . . . . . . . . . . . . . . . . . . . . . . . . . . . . . . . . . . . . . . . . . . . . . . 21
Table‐3.6DHVFactorCalculations . . . . . . . . . . . . . . . . . . . . . . . . . . . . . . . . . . . . . . . . . . . . . . . . . . . . . . . . . . . . . . 23
Table‐4.1IntersectionLOS . . . . . . . . . . . . . . . . . . . . . . . . . . . . . . . . . . . . . . . . . . . . . . . . . . . . . . . . . . . . . . . . . . . . . . 29
Table‐4.22017Levels‐of‐Service(ExistingConditions) . . . . . . . . . . . . . . . . . . . . . . . . . . . . . . . . . . . . . . . . . . 30
Table‐4.32019Levels‐of‐Service(No‐BuildConditions) . . . . . . . . . . . . . . . . . . . . . . . . . . . . . . . . . . . . . . . . . 31
Table‐4.42039Levels‐of‐Service(No‐BuildConditions) . . . . . . . . . . . . . . . . . . . . . . . . . . . . . . . . . . . . . . . . . 32
Table‐4.52039Levels‐of‐Service(No‐BuildConditions‐RecommendedImprovements) . . . . . . . . . 33
Table‐4.62019Levels‐of‐Service(BuildConditions). . . . . . . . . . . . . . . . . . . . . . . . . . . . . . . . . . . . . . . . . . . . . 34
Table‐4.72019No‐BuildvsBuildScenario(AMPeakHourComparisonTable). . . . . . . . . . . . . . . . . . . 35
Table‐4.82019No‐BuildvsBuildScenario(PMPeakHourComparisonTable) . . . . . . . . . . . . . . . . . . . 36
Table‐4.92019Levels‐of‐Service(BuildConditions‐RecommendedImprovements). . . . . . . . . . . . . 38
Table‐4.102039Levels‐of‐Service(BuildConditions) . . . . . . . . . . . . . . . . . . . . . . . . . . . . . . . . . . . . . . . . . . . 40
Table‐4.112039No‐BuildvsBuildScenario(AMPeakHourComparisonTable) . . . . . . . . . . . . . . . . . 41
Table‐4.122039No‐BuildvsBuildScenario(PMPeakHourComparisonTable). . . . . . . . . . . . . . . . . . 42
Table‐4.132039Levels‐of‐Service(BuildConditions‐RecommendedImprovements) . . . . . . . . . . . 44
Table‐4.142019Levels‐of‐Service(BuildConditions‐AccessLocations). . . . . . . . . . . . . . . . . . . . . . . . . 46
Table‐4.152039Levels‐of‐Service(BuildConditions‐AccessLocations). . . . . . . . . . . . . . . . . . . . . . . . . 48
June 5, 2017 Page iv TMS Engineers, Inc.
Page 7
Traffic Impact Study Westlake Elementary School, Westlake, Ohio
Table‐4.16TurningLaneWarrants‐CenterRidgeRoad&ProposedEastAccess . . . . . . . . . . . . . . . . . 49
Table‐4.17TurnLaneLengthAnalysis‐CenterRidgeRoad&DoverCenterRoad. . . . . . . . . . . . . . . . . 50
Table‐4.18TurnLaneLengthAnalysis‐CenterRidgeRoad&ProposedWestAccess . . . . . . . . . . . . . 51
Table‐4.192039Levels‐of‐Service(BuildConditions‐AlternateScenario) . . . . . . . . . . . . . . . . . . . . . . . 56
Table‐4.202039Levels‐of‐Service(AlternateScenario‐RecommendedImprovements) . . . . . . . . . 57
Table‐4.212039SitePlanvsAlternateScenario(AMPeakHourComparisonTable). . . . . . . . . . . . . . 59
Table‐4.232039SitePlanvsAlternateScenario(PMPeakHourComparisonTable‐AMS) . . . . . . . 60
Table‐4.24TurnLaneLengthAnalysis‐CenterRidgeRoad&DoverCenterRoad. . . . . . . . . . . . . . . . . 61
Table‐4.25TurnLaneLengthAnalysis‐CenterRidgeRoad&GlenmoreDrive/WestAccess . . . . . . 61
June 5, 2017 Page v TMS Engineers, Inc.
Page 8
Traffic Impact Study Westlake Elementary School, Westlake, Ohio
ExecutiveSummary
ThistrafficimpactstudyhasbeenpreparedattherequestoftheWestlakeCitySchoolsforaproposed
elementaryschool.TheprojectsiteislocatedintheCityofWestlake,CuyahogaCounty,Ohioalongthe
southsideofCenterRidgeRoad(USRoute20)betweenGlenmoreDrivetothewestandDoverCenter
Roadtotheeast.
Theproposedelementaryschoolisexpectedtohaveastudentpopulationof1,450studentswith120
staffforgradespre‐kindergartenthroughfourthgrade.Figure1.2showstheproposedsiteplanfor
theelementaryschool.
ThedevelopmentisproposedwithtwoaccessdrivewaysalongthesouthsideofCenterRidgeRoadand
oneaccessdrivewayalongthenorthsideofWestownBoulevard.
Theyear2019wasanalyzedfortheopeningyearconditions,andtheyear2039wasanalyzedasthe
designyearforthetwentyyearconditionsanalysis.
Theelementaryschooldaybeginsat7:50AMandendsat2:20PM,thereforethereportanalyzedthe
hoursof7:30to8:30AMand2:00PMto3:00PM.The7:30to8:30AMhourwasreferredtoasthe
weekdayAMpeakhourforthepurposeofthisreport.The2:00to3:00PMhourwasreferredtoasthe
PMpeakhourforthepurposeofthisreport.Theseperiodswereanalyzedsincetheyreflecttheperiod
ofthehighestvolumeoftrafficflowfortheproposedschool.
Theelementaryschoolwasassumedtogenerateatotalof30enteringand30exitingtripsforschool
buses.Thesevolumesareincludedinthetotalgenerationvolumescalculatedforthisanalysis.
Theproposedelementaryschoolisexpectedtogeneratethefollowingaveragehourlytrafficduringthe
AMandPMpeakperiods:
ITETRIPGENERATION
SIZE
(Staff)
TRIPENDS
ITE
CodeLandUseDescription
AMPeakHour
ofGenerator
(Enter/Exit)
PMPeakHour
ofGenerator
(Enter/Exit)
520 ElementarySchool 120 431 368 176 225
TOTALNEWGENERATEDTRIPS 799 401
June 5, 2017 Page vi TMS Engineers, Inc.
Page 9
Traffic Impact Study Westlake Elementary School, Westlake, Ohio
RecommendedImprovementstoServeExistingConditionsTheexistingstudyareaintersectionsweredeterminedtobeoperatingwithacceptablelevels‐of‐service
duringthepeakhoursunderstudy.
ItshouldbenotedthatawestboundrightturnlaneatintersectionofCenterRidgeRoadandDover
CenterRoadhasbeenpreviouslyrecommendedinotherreportspreparedfortheCityofWestlake.This
recommendationwasbasedonananalysisoftheroadwaypeakhours.Theelementaryschoolanalysis
isbasedonthepeakhouroftheschooltrafficvolumeswhichdoesnotcoincidewiththepeakhourof
trafficfortheroadway(i.etheschoolpeaksintheafternoonfrom2:00to3:00PMwhiletheroadway
peaksfrom5:00to6:00PM).
RecommendedImprovementstoServeFutureConditionswithouttheDevelopmentThestudyareaintersectionsandapproachesareexpectedtooperatewithacceptablelevels‐of‐service
undertheexpected2019No‐BuildconditionsduringtheAMandPMpeakhours.
ThefollowingimprovementswererecommendedtoaccommodatetheYear2039No‐Buildtrafficat
thestudyareaintersectionsthatdonotprovideaccesstotheproposedelementaryschool.
CenterRidgeRoad&DoverCenterRoad
# Constructawestboundrightturnlane.
# Constructanorthboundrightturnlane.
NoadditionalintersectionimprovementswerefoundtobenecessarytoaccommodatetheYear2039
No‐Build trafficat theremainingstudyarea intersections. Theremainingstudy intersectionsare
anticipatedtooperatewithacceptablelevels‐of‐serviceduringtheAMandPMpeakhours.
RecommendedImprovementstoMitigatetheTrafficAssociatedwiththeDevelopmentThefollowinglaneuseandtrafficcontrolarerecommendedtoaccommodatethe2019and2039site
generated(Build)trafficbasedonthedevelopmentsiteplanshowninFigure1.2:
CenterRidgeRoad&GlenmoreDrive(2039)
# Constructasouthboundleftturnlane.
CenterRidgeRoad&DoverCenterRoad
# Constructawestboundrightturnlane.(2019)
# Constructasouthboundrightturnlane.(2039)
June 5, 2017 Page vii TMS Engineers, Inc.
Page 10
Traffic Impact Study Westlake Elementary School, Westlake, Ohio
DoverCenterRoad&WestownBoulevard(2019)
# Re‐stripetheeastboundapproachforoneingresslaneandtwoegresslanesconsisting
ofarightturnlaneandleftturnlane.
Thefollowinglaneuseandtrafficcontrolarerecommendedtoaccommodatethe2039sitegenerated
(Build)trafficbasedontheAlternateScenariodetailedinSection4.5:
CenterRidgeRoad&DoverCenterRoad
# Constructasouthboundrightturnlane.
DoverCenterRoad&WestownBoulevard
# Installtrafficsignalcontrol.
# Re‐stripetheeastboundapproachforoneingresslaneandtwoegresslanesconsisting
ofarightturnlaneandleftturnlane.
DevelopmentAccessRecommendationsThefollowinglaneuseandtrafficcontrolarerecommendedtoaccommodatethe2019and2039site
generated(Build)trafficbasedonthedevelopmentsiteplanshowninFigure1.2:
CenterRidgeRoad&ProposedWestAccess(2019)
# Installtrafficsignalcontrol.
# Constructtheproposeddevelopmentroadwaywithoneegresslaneandtwoingress
lanes.
# Theegresslanesshouldconsistofanexclusiveleftturnlaneandanexclusiverightturn
lane.
# Constructanexclusivewestboundleftturnlane.
# Includethechurchaccessdriveaspartofintersectionandtrafficsignalcontrol.
CenterRidgeRoad&ProposedEastAccess(2019)
# Constructtheproposeddevelopmentroadwaywithoneegresslaneandoneingress
lane.
# Restricttheaccessdrivewaytorightturnsinandrightturnsoutofthesiteonlythrough
theuseofachannelizingisland.
# Theegressdriveshouldbeconstructedpertherecommendationsandguidelinesfound
intheODOTAccessManagementManualforchannelizingislands(SeeAppendixR).
# Installstopsigncontrolonthenorthboundapproach.
June 5, 2017 Page viii TMS Engineers, Inc.
Page 11
Traffic Impact Study Westlake Elementary School, Westlake, Ohio
Thefollowinglaneuseandtrafficcontrolarerecommendedtoaccommodatethe2039sitegenerated
(Build)trafficbasedontheAlternateScenariodetailedinSection4.5:
CenterRidgeRoad&ProposedWestAccess/GlenmoreDrive
# ConstructthedevelopmentWestAccessdirectlyacrossfromGlenmoreDrive.
# Installtrafficsignalcontrol.
# Constructtheproposeddevelopmentroadwaywithoneegresslaneandtwoingress
lanes.
# Theegresslanesshouldconsistofanexclusiveleftturnlaneandasharedthroughand
rightturnlane.
# Constructanexclusivewestboundleftturnlane.
# Constructanexclusiveeastboundleftturnlane.
CenterRidgeRoad&ProposedEastAccess
# Constructtheproposeddevelopmentroadwaywithoneegresslaneandoneingress
lane.
# Restricttheaccessdrivewaytorightturnsinandrightturnsoutofthesiteonlythrough
theuseofachannelizingisland.
# Theegressdriveshouldbeconstructedpertherecommendationsandguidelinesfound
intheODOTAccessManagementManualforchannelizingislands(SeeAppendixR).
# Installstopsigncontrolonthenorthboundapproach.
ConclusionBasedupontheresultsoftheanalysisinthisstudyandthecorrespondingrecommendations,itcanbe
seen that the site generated traffic can be accommodatedwithout adversely impacting the area
roadwaynetworkundereachscenario.
June 5, 2017 Page ix TMS Engineers, Inc.
Page 12
Traffic Impact Study Westlake Elementary School, Westlake, Ohio
Chapter1
Introduction
1.1 PurposeofReport
ThistrafficimpactstudyhasbeenpreparedattherequestoftheWestlakeCitySchoolsforaproposed
elementaryschool.TheprojectsiteislocatedintheCityofWestlake,CuyahogaCounty,Ohioalongthe
southsideofCenterRidgeRoad(USRoute20)betweenGlenmoreDrivetothewestandDoverCenter
Roadtotheeast.Figure1.1,Page2showstheproposedlocationofthedevelopment.
Theproposedelementaryschoolisexpectedtohaveastudentpopulationof1,450studentswith120
staffforgradespre‐kindergartenthroughfourthgrade.Figure1.2,Page3showstheproposedsite
planfortheelementaryschool.
ThedevelopmentisproposedwithtwoaccessdrivewaysalongthesouthsideofCenterRidgeRoadand
one access driveway along the north side ofWestownBoulevard. The proposed location of the
developmentroadwayscanbeseeninFigure1.2,Page3.TheWestownBoulevardaccessisproposed
forschoolbustrafficonly.AllpassengervehiclesareproposedtousetheaccesslocationsalongCenter
RidgeRoad.
ThecurrentdevelopmentscheduleexpectstheschooltoopenintheFallof2019.Therefore,2019will
beanalyzedfortheopeningyearconditions,andtheyear2039willbeanalyzedasthedesignyearfor
thetwentyyearconditionsanalysis.
June 5, 2017 Page 1 TMS Engineers, Inc.
Page 13
ElementarySchoolWestlake,Ohio
TrafficImpactStudyLocationMap
Figure1.1
Page2
NOTTOSCALE
DEVELOPMENTSITE
Page 14
ElementarySchoolWestlake,Ohio
TrafficImpactStudySitePlan
Figure1.2
Page3
NOTTOSCALE
Page 15
Traffic Impact Study Westlake Elementary School, Westlake, Ohio
1.2 StudyObjectives
Thisstudyisstructuredforthefollowingpurposes;
# to adequately assess the traffic impacts associatedwith the proposed elementary
schoolidentifythelevelofoff‐siteaccessandtraffic,
# toprovideacomprehensivestudywhichevaluatesanddocumentsthetrafficimpacts
andoff‐siteimprovements,wherewarranted,
# andtoprovideatechnicallysoundbasistoidentifymitigationrequirementstooff‐site
trafficimpacts.
Thisstudydocumentsthemethodologies,findingsandconclusionsoftheanalysis,includingthebasis
forallassumptions,trafficparametersutilizedandconclusionsreached.
Thetrafficimpactswillbedeterminedbycomparingtheexistingintersectionlevels‐of‐servicebefore
thedevelopment of the proposed elementary school to the anticipated levels‐of‐service after the
elementaryschooliscompleted.Levels‐of‐serviceforthestudyareaandaccessdrivewayintersections
willbecalculatedusingthecomputerizedversionoftheTransportationResearchBoard'sHighway
CapacityManual6THEdition,HCM6E(HCS7,Release7.2).
Thejustificationforanychangestotheintersectiontrafficcontrolwillbedeterminedbycomparing
data collectedof theexisting traffic conditions to the criteriaestablishedby theOhioManualof
UniformTrafficControlDevicesandprofessionalengineeringjudgmentfromanon‐sitefieldreview.
TheAuxiliaryLaneGraphsfoundinSection401‐6oftheLocationandDesignManual,Volume1will
beusedtodeterminetheneedforauxiliaryturnlanesatunsignalizedintersectionsasrecommended
intheLocationandDesignManual,Volume1andtheAccessManagementManual.
Intersectiongeometricdesigncriteriawillbebasedintheinformationandproceduresfoundinthe
OhioDepartmentofTransportation’sLocation&DesignManual,Volume1.
June 5, 2017 Page 4 TMS Engineers, Inc.
Page 16
Traffic Impact Study Westlake Elementary School, Westlake, Ohio
Chapter2
AreaConditions
2.1 TransportationNetworkStudyArea
TheOhioDepartmentofTransportationfunctionallyclassifiesroadwaystohelpdefinearoadway’s
characteristicsaswellasidentifyroadwaysthatareeligibleforfederalfunds.Functionalclassification
isthegroupingofroads,streets,andhighwaysinahierarchybasedonthetypeofhighwayservicethey
provide.Generally,streetsandhighwaysperformtwotypesofservice.Theyprovideeithertraffic
mobilityorlandaccessandcanberankedintermsoftheproportionofservicetheyprovide.The
ODOTfunctionalclassificationoftheroadwaysinthestudyareacanbeseenonODOT’swebsite.
The following table lists the study roadways that have an assigned functional classification as
determinedbyODOTandlocalgovernmententities.Roadwaysthatarenotlistedashavingafunctional
classificationcanbeassignedintooneoftwocategories.Thefirstcategoryisalocalroadwayandthe
secondcategoryisthatofanaccessdrive.
Table2.1FunctionalClassification
ROADWAY AREA FC# CLASSIFICATION
CenterRidgeRoad(USRoute20) Urban 3 PrincipalArterial
DoverCenterRoad Urban 5 MajorCollector
GlenmoreDrive Urban 7 LocalRoadway
WestownBoulevard Urban 7 LocalRoadway
Figure2.1,Page6detailsthesectionofthefunctionalclassificationmapforthestudyarea. The
classificationmapscancurrentlybefoundonlineatthefollowingODOTwebaddress:
http://www.dot.state.oh.us/Divisions/Planning/ProgramManagement/MajorPrograms/MapRoom/Forms/AllItems.aspx
June 5, 2017 Page 5 TMS Engineers, Inc.
Page 17
ElementarySchoolWestlake,Ohio
TrafficImpactStudy
FunctionalClassification
Figure2.1
Page6
NOTTOSCALE
DEVELOPMENTSITE
Page 18
Traffic Impact Study Westlake Elementary School, Westlake, Ohio
Thefollowingtabledetailstheprimarycharacteristicsofthestudyarearoadways:
Table2.2RoadwayCharacteristics
ROADWAY #OFLANES ORIENTATIONSPEEDLIMIT
(MPH)
ADT*
(VPD)
CenterRidgeRoad(US20) 4 East‐West 35 18,280
DoverCenterRoad 2 North‐South 35 14,060
GlenmoreDrive 2 North‐South 25 760
WestownBoulevard 2 East‐West 25 1,320
*Trafficdatacollectedin2017forthisreport/Roundedtonearest10TH
Thefollowingsectionsdetailthelaneuse,trafficcontrol,andaveragedailytrafficateachlocationunder
studyforthisreport.
CENTERRIDGEROAD(US20)&DOVERCENTERROAD
CenterRidgeRoadWestApproach CenterRidgeRoadEastApproach
‐1ExclusiveLeftTurnLane ‐1ExclusiveLeftTurnLane
‐1ThroughLane ‐1ThroughLane
‐1SharedThrough&RightTurnLane ‐1SharedThrough&RightTurnLane
DoverCenterRoadNorthApproach DoverCenterRoadSouthApproach
‐1ExclusiveLeftTurnLane ‐1ExclusiveLeftTurnLane
‐1SharedThrough&RightTurnLane ‐1SharedThrough&RightTurnLane
Theintersectioniscontrolledbyatrafficsignal.Theintersectionoperateswithan8‐phaseoperation
thatallowspermissiveandprotectedleftturnsonallapproaches.Theleftturnmovementsfromall
approachescanbemadewhentheleftturnarrowallowsthemovement(protectedmovement)or
during the green ball indicationwhen there is a gap in the opposing through traffic (permissive
movement).
June 5, 2017 Page 7 TMS Engineers, Inc.
Page 19
Traffic Impact Study Westlake Elementary School, Westlake, Ohio
CENTERRIDGEROAD(US20)&GLENMOREDRIVE
CenterRidgeRoadWestApproach CenterRidgeRoadEastApproach
‐1SharedThrough&LeftTurnLane ‐1ThroughLane
‐1ThroughLane ‐1SharedThrough&RightTurnLane
GlenmoreDriveNorthApproach
‐1SharedLeft&RightTurnLane
TheintersectioniscontrolledbyastopsignontheGlenmoreDriveapproach.TheCenterRidgeRoad
approachesoperateunderfree‐flowconditionswiththewestboundleftturnmovementyieldingtothe
eastboundmovements.
DOVERCENTERROAD&WESTOWNBOULEVARD
DoverCenterRoadNorthApproach DoverCenterRoadSouthApproach
‐1SharedThrough&RightTurnLane ‐1SharedThroughLane&LeftTurnLane
WestownBoulevardWestApproach
‐1SharedLeft&RightTurnLane
TheintersectioniscontrolledbyastopsignontheWestownBoulevardapproach.TheDoverCenter
Roadapproachesoperateunderfree‐flowconditionswiththenorthboundleftturnmovementyielding
tothesouthboundmovements.
Figure2.2,Page9showsanaerialviewofthestudyarea.
Figure2.3,Page10showstheexistinglaneuseandtrafficcontrolconditionsinthestudyarea.These
willbeconsideredtheexistingbaseconditionsforthisreport.
June 5, 2017 Page 8 TMS Engineers, Inc.
Page 20
ElementarySchoolWestlake,Ohio
TrafficImpactStudy
AerialView
Figure2.2
Page9
NOTTOSCALE
DoverCenterRoad
DEVELOPMENTSITE
Westown Boulevard
GlenmoreDrive
Page 21
ElementarySchoolWestlake,Ohio
TrafficImpactStudy
DoverCenterRoad
CenterRidgeRoad
CenterRidgeRoad
GlenmoreDrive
PROPOSEDELEMENTARYSCHOOL
NOTTOSCALE
ProposedEastAccess
ProposedWestAccess
ProposedSouthAccess
DoverCenterRoad
WestownBoulevard
ExistingLaneUse&TrafficControl
Figure2.3
Page10
ExistingLaneUse
LEGEND
ExistingSignal
ExistingStopSignSTOP
ProposedAccess
STOP
ST
OP
Page 22
Traffic Impact Study Westlake Elementary School, Westlake, Ohio
2.2 Traffic
Weekdayninehourturningmovementcountswereperformedatthefollowinglocations:
1. CenterRidgeRoad(US20)&DoverCenterRoad
2. CenterRidgeRoad(US20)&GlenmoreDrive
3. DoverCenterRoad&WestownBoulevard
ThetrafficcountswereperformedonTuesday,May9,2017.
Theweekdaytrafficcountswereconductedinfifteen(15)minuteintervalsbetweenthehoursof7AM‐
10AM,11AM‐1PM,and2PM‐6PM,thenhourlytotalswerecalculated.Acopyoftheintersection
turnmovementcountsareincludedinAppendixA.
Averagedailytrafficwascalculatedfortheroadwaysusingexpansionfactorstoaccountfordailyand
seasonalvariationsaccordingtotherecommendationsandlatestdatafromtheOhioDepartmentof
Transportation.
Theelementaryschooldaybeginsat7:50AMandendsat2:20PM,thereforethereportwillanalyze
thehoursof7:30to8:30AMand2:00PMto3:00PM.The7:30to8:30AMhourwillbereferredtoas
theweekdayAMpeakhourforthepurposeofthisreport.The2:00to3:00PMhourwillbereferred
toasthePMpeakhourforthepurposeofthisreport.Theseperiodswillbeanalyzedsincetheyreflect
theperiodofthehighestvolumeoftrafficflowfortheproposedschool.
TheexistingAMandPMpeakhourtrafficvolumesareshowninFigure2.4,Page12.
June 5, 2017 Page 11 TMS Engineers, Inc.
Page 23
ElementarySchoolWestlake,Ohio
TrafficImpactStudy
DoverCenterRoad
CenterRidgeRoad
CenterRidgeRoad
GlenmoreDrive
PROPOSEDELEMENTARYSCHOOL
NOTTOSCALE
ProposedEastAccess
ProposedWestAccess
ProposedSouthAccess
DoverCenterRoad
WestownBoulevard
ExistingWeekdayPeakHour
TrafficVolumes
Figure2.4
Page12
PMPeakHourTraffic
AMPeakHourTraffic
LEGEND
XX
(XX)
75 (106)275 (258)150 (105)
176 (106)631 (368)
55 (81)
106 (133)328 (271)116 (84)
233 (92)350 (367)82 (76)
24 (11)483 (592)
6 (3)878 (507)
9 (11)25 (11)
25 (20)334 (390)
8 (13)478 (454)
62 (35)22 (18)
Page 24
Traffic Impact Study Westlake Elementary School, Westlake, Ohio
Chapter3
ProjectedTrafficConditions
3.1 SiteTraffic
TripGeneration
Calculatingfuturetotaldrivewaytripsrequiresanestimateofthetrafficgeneratedbytheproposed
development.Themostwidelyacceptedmethodofdeterminingtheamountoftrafficthattheproposed
developmentwillgenerateistocomparetheproposedlandusewithexistingfacilitiesofthesameuse.
The Institute of Transportation Engineers (ITE) has prepared amanual titled “TripGeneration
Manual”, which is a compilation of similar traffic generation studies to aide in making such a
comparison.Themostrecentupdateofthismanualisthe9THeditionandwasutilizedforthisstudy.
The proposed development is expected to consist of a pre‐kindergarten through fourth grade
elementaryschool.Theschoolisexpectedtohaveastudentpopulationof1,450studentsand120staff.
The following table details the development land use from the site plan (Figure 1.2) and the
correspondingITElandusethatwillbeusedtoforecastthesitegeneratedtrafficvolumesfortheBuild
conditions:
Table3.1ITELandUseCodes
SITEPLAN
DESCRIPTION
LANDUSE ITE
CODE
ITE
DESCRIPTION
PK‐4School Institutional 520 ElementarySchool
June 5, 2017 Page 13 TMS Engineers, Inc.
Page 25
Traffic Impact Study Westlake Elementary School, Westlake, Ohio
The following tables detail the development generated traffic volumes based on the previously
describedmethodsasoutlinedinthe(ITE)TripGenerationHandbook.Calculationswereprepared
basedonthenumberofstudentsandthenumberofstaff.Thevolumeofsitegeneratedtripswashigher
usingthenumberofstafffortheschoolandwillthereforebeusedintheanalysis.Copiesofthetrip
generationworksheetscanbeseeninAppendixB.
Table3.3NetTripGeneration
ITETRIPGENERATION
SIZE(Staff)
TRIPENDS
ITE
CodeLandUseDescription
AMPeakHour
ofGenerator
(Enter/Exit)
PMPeakHour
ofGenerator
(Enter/Exit)
520 ElementarySchool 120 431 368 176 225
TOTALNEWGENERATEDTRIPS 799 401
DistributionofGeneratedTraffic
Thedirectionaldistribution for thenewgeneratedtraffic isa functionof theprevailingoperating
conditionsontheexistingroadways.Thedistributionpatternthatwasassumedisshowninthetables
thatfollowandarebasedupontheexistingtrafficvolumesattheintersectionofCenterRidgeRoadand
DoverCenterRoadduringtheAMandPManalysishoursshowninFigure2.4.
Table3.4AMTripOriginsandDestinations
ORIGIN/
DESTINATIONROUTE FROM
%
TOTAL
NEW
TRIPSTO
%
TOTAL
NEW
TRIPS
North DoverCenter 500 19% 84 737 29% 105
South DoverCenter 550 21% 92 412 16% 59
East CenterRidge 665 26% 111 897 35% 128
West CenterRidge 862 34% 144 531 20% 76
TOTALS 2577 100% 431 2577 100% 368
June 5, 2017 Page 14 TMS Engineers, Inc.
Page 26
Traffic Impact Study Westlake Elementary School, Westlake, Ohio
Table3.5PMTripOriginsandDestinations
ORIGIN/
DESTINATIONROUTE FROM
%
TOTAL
NEW
TRIPSTO
%
TOTAL
NEW
TRIPS
North DoverCenter 469 23% 40 469 23% 51
South DoverCenter 488 24% 42 415 20% 46
East CenterRidge 535 26% 46 557 27% 61
West CenterRidge 555 27% 48 606 30% 67
TOTALS 2047 100% 176 2047 100% 225
ThedirectionaldistributionforthenewAMandPMpeakhourgeneratedtrafficpassengervehicletrips
areshowngraphicallyinFigure3.1,Page16.ThedirectionaldistributionforthenewAMandPMpeak
hourgeneratedschoolbustripsareshowngraphicallyinFigure3.2,Page17.
AssignmentofGeneratedTraffic
BaseduponthedistributionpatternsshowninFigures3.1&3.2,thenewAMandPMpeakgenerated
trafficwereassignedtothestudyintersections. Theassignmentsoftheestimatednewgenerated
passengervehicletrafficfortheproposedelementaryschoolareshowngraphicallyinFigure3.3,Page
18.Theassignmentsoftheestimatednewgeneratedschoolbustrafficfortheproposedelementary
schoolareshowngraphicallyinFigure3.4,Page19.
June 5, 2017 Page 15 TMS Engineers, Inc.
Page 27
ElementarySchoolWestlake,Ohio
TrafficImpactStudy
DoverCenterRoad
CenterRidgeRoad
CenterRidgeRoad
GlenmoreDrive
PROPOSEDELEMENTARYSCHOOL
NOTTOSCALE
ProposedEastAccess
ProposedWestAccess
ProposedSouthAccess
DoverCenterRoad
WestownBoulevard
NewGeneratedTrafficDistribution
Figure3.1
Page16
LEGEND
AMPeakHourDistributionXX
RED=EnteringVolumes
GREEN=ExitingVolumes
PMPeakHourDistribution(XX)
34% (27%
)
80% (70%)
19% (23%)
21% (24%)
66% (73%
)
20% (30%)
66% (73%
)20%
(30%)
34% (27%
)
26% (26%
)
29% (23%
)35%
(27%)
16% (20%
)
16% (20%)
21% (24%)
Page 28
ElementarySchoolWestlake,Ohio
TrafficImpactStudy
DoverCenterRoad
CenterRidgeRoad
CenterRidgeRoad
GlenmoreDrive
PROPOSEDELEMENTARYSCHOOL
NOTTOSCALE
ProposedEastAccess
ProposedWestAccess
ProposedSouthAccess
DoverCenterRoad
WestownBoulevard
NewGeneratedTrafficDistribution
SchoolBuses
Figure3.2
Page17
LEGEND
AMPeakHourDistributionXX
RED=EnteringVolumes
GREEN=ExitingVolumes
PMPeakHourDistribution(XX)
34% (27%
)
19% (23%)
20% (30%)29% (23%)35% (27%)
100% (100%
)
100% (100%)
20% (30%
)26%
(26%)
34% (27%
)
79% (76%)
21% (24%)
34% (27%
)
20% (30%
)34% (27%
)
20% (30%
)
84% (80%
)16%
(20%)
Page 29
ElementarySchoolWestlake,Ohio
TrafficImpactStudy
DoverCenterRoad
CenterRidgeRoad
CenterRidgeRoad
GlenmoreDrive
PROPOSEDELEMENTARYSCHOOL
NOTTOSCALE
ProposedEastAccess
ProposedWestAccess
ProposedSouthAccess
DoverCenterRoad
WestownBoulevard
NewGeneratedTraffic
PassengerVehicles
Figure3.3
Page18
NEWGENERATEDTRAFFIC
TOTALTRIPS
ENTER
EXIT
AM739
401
338
PM341
146
195
LEGEND
AMPeakHourTripsXX
RED=EnteringVolumes
GREEN=ExitingVolumes
PMPeakHourTrips(XX)
134 (40)
269 (137)
78 (33)
86 (35)
267 (106)
69 (58)
267 (106)69 (58)
134 (40)
103 (38)
97 (45)118 (53)
54 (39)
54 (39)
86 (35)
Page 30
ElementarySchoolWestlake,Ohio
TrafficImpactStudy
DoverCenterRoad
CenterRidgeRoad
CenterRidgeRoad
GlenmoreDrive
PROPOSEDELEMENTARYSCHOOL
NOTTOSCALE
ProposedEastAccess
ProposedWestAccess
ProposedSouthAccess
DoverCenterRoad
WestownBoulevard
NewGeneratedTraffic
SchoolBuses
Figure3.4
Page19
NEWGENERATEDTRAFFIC
TOTALTRIPS
ENTER
EXIT
AM60
30
30
PM60
30
30
LEGEND
AMPeakHourTripsXX
RED=EnteringVolumes
GREEN=ExitingVolumes
PMPeakHourTrips(XX)
10 (8)
6 (7)
6 (9)9 (7)
10 (8)
30 (30)
30 (30)
6 (9)8 (8)
10 (8)
24 (23)
6 (7)
25 (24)5 (6)
10 (8)
6 (9)
10 (8)
6 (9)
Page 31
Traffic Impact Study Westlake Elementary School, Westlake, Ohio
3.2 Non‐SiteTraffic
BackgroundTrafficGrowth
Usuallythedesignofnewroadwaysorimprovementstoexistingroadwaysshouldnotbebasedon
currenttrafficvolumesalone,butshouldconsiderfuturetrafficvolumesexpectedtomakeuseofthe
facilities.Roadwaysshouldbedesignedtoaccommodatethetrafficvolumethatislikelytooccurwithin
thedesignlifeofthefacility.Inapracticalsense,thisdesignvolumeshouldbeavaluethatcanbe
estimatedwithreasonableaccuracy.Itisbelievedthatthemaximumdesignperiodisintherangeof
15to24years.Therefore,aperiodoftwentyyearsiswidelyusedasabasisfordesign.Trafficcannot
usuallybeforecastedaccuratelybeyondthisperiodonaspecificfacilitybecauseofprobablechanges
inthegeneralregionaleconomy,population,andlanddevelopmentalongtheroadway.TheODOT
AccessManagementManualrequiresthatopeningyearandtwentyyeardesignhourtrafficvolumes
beanalyzedforaproposeddevelopment.
Roadways,likethosefoundinthestudyarea,carryasignificantamountofthroughtrafficduetotheir
functionalcharacteristics. This through trafficcomponentgenerally increasesasregionalgrowth
occurs.Therefore,itisanticipatedthatexistingtrafficonthestudyarearoadwayswillincreasein
futureyears.
Anyrecommendedimprovementsfortheseintersectionsshouldadequatelyhandlethetransportation
needs of the intersections for twenty years from the opening of the project based upon sound
engineeringpracticeandthelikelihoodoftrafficgrowthduetothefunctionalcharacteristicsofthe
roadways.
TheelementaryschoolisexpectedtobeopenintheFallof2019.Theyears2019and2039willbe
analyzedfortheproposedelementaryschool.Therefore,itisnecessarytoestimatehistoricalgrowth
rates in order to establish the future traffic on the study area roadways due to non‐site related
conditions.
TheODOTTrafficMonitoringManagementSystem(TMMS)wasconsultedtodeterminepasthistorical
trendsonthestudyarearoadways.TheODOTTrafficMonitoringManagementSystem(TMMS)canbe
currentlyaccessedatthefollowingwebaddress:
http://www.dot.state.oh.us/Divisions/Planning/TechServ/traffic/Pages/TMMS.aspx
June 5, 2017 Page 20 TMS Engineers, Inc.
Page 32
Traffic Impact Study Westlake Elementary School, Westlake, Ohio
TheTMMSprovideddataatthefollowinglocationthatwasusedtodeterminethestudyareagrowth
rates:
1. CenterRidgeRoad(US20)EastofCanterbury‐LocationID18318
2. CenterRidgeRoad(US20)EastofBradley‐LocationID18218
3. DoverCenterRoadNorthofLorain‐Location48618
4. DoverCenterRoadNorthofHilliard‐Location301898
TheintersectionofCenterRidgeRoadandDoverCenterRoadhadalsobeenpreviouslycountedbyTMS
Engineers,Inc.intheyears2007,2012,2014,and2016
Basedonthecollectedhistoricaltrafficdata,alineargrowthrateof1.00%peryearwillbeusedto
determinetheanticipatedstudyareavolumesunderthe2019and2039No‐BuildconditionsforCenter
RidgeRoad(US20)andDoverCenterRoad.Nogrowthratewillbeappliedtothelocalroadways,local
accessdriveways,andturningmovementsattheintersections.
Alineargrowthratewasutilizedtoestimatenon‐siterelatedtrafficgrowth.Thesegrowthrateswill
beappliedtotheexistingtrafficvolumes(Figure2.4).Thegrowthrateandfactorsforthestudyarea
roadwayscanbeseeninthefollowingtable:
Table3.5‐GrowthRates&Factors
ROADWAYGROWTHRATE
(AnnualGrowth)
2019GROWTH
FACTOR
2039GROWTH
FACTOR
CenterRidgeRoad(US20) 1.00% 1.02 1.22
DoverCenterRoad 1.00% 1.02 1.22
June 5, 2017 Page 21 TMS Engineers, Inc.
Page 33
Traffic Impact Study Westlake Elementary School, Westlake, Ohio
DesignHourTraffic
The traffic patterns on any roadway typically show considerable variation in the traffic volumes
experiencedduringthevarioushoursofthedayandinthehourlyvolumesexperiencedthroughoutthe
year.Akeydecisioninthedesignprocessinvolvesdeterminingwhichofthesehourlytrafficvolumes
shouldbeusedasthebasisforthedesign.Itwouldbewastefultopredicateadesignonthemaximum
peakhourtrafficthatoccursduringtheyearandtheuseoftheaveragehourlytrafficwouldresultin
aninadequatedesign.Thehourlytrafficvolumesusedinadesignshouldnotbeexceededveryoften
orbyverymuch.Ontheothersideofthespectrum,thehourlytrafficvolumesshouldnotbesohigh
thattrafficwouldrarelybesufficienttomakefulluseofthedesignedfacility.Normaldesignpolicyin
theStateofOhioisbaseduponareviewofcurvesthatdepictthevariationinhourlytrafficvolumes
duringtheyear.TheOhioDepartmentofTransportationrecommendsusingthe30THhighesthouras
adesigncontrolforurbanstreets.Thereistypicallyverylittledifferencebetweenthevolumesinthis
range.TheOhioDepartmentofTransportationprovidesfactorsoramethodologytodeterminefactors
thatareappliedtocounteddailytrafficvolumestodetermineappropriatedesignhourtrafficvolumes.
FollowingguidelinessetforthintheODOTAccessManagementManual,allanalysesarerequiredto
examinethedesignhourvolumefortheadjacentroadwayandpeakhourtrafficvolumeoftheproposed
development.
TheODOTCertifiedTrafficManualprovidesthemethodsforestimatingdesignhourvolumes.The
preferredmethodistocomputetheratioofthepeakhourvolumeagainstthedailytrafficvolumefor
thestudyarearoadways.AK‐factoristhenselectedfromavailableODOTdataforrouteswiththesame
functional classification and a similarADT. The selectedK‐factor is then divided by the ratio to
determinetheDHVfactorthatwillbeusedtocomputethedesignhourvolumes.
Forroadwayswithoutcomparablesite‐specificdata,thedesignhourfactorisdeterminedusingthe
ODOTPeakHourtoDesignHourcharts.Thesechartsarebasedonthefunctionalclassificationofthe
roadway,thedayoftheweekandthemonththatthetrafficdatawascollected.
K‐factors were determined using site specific data available on the ODOT Traffic Monitoring
June 5, 2017 Page 22 TMS Engineers, Inc.
Page 34
Traffic Impact Study Westlake Elementary School, Westlake, Ohio
ManagementSystem(TMMS).TheODOTTMMScancurrentlybefoundatthefollowingwebaddress:
http://odot.ms2soft.com/tcds/tsearch.asp?loc=Odot&mod=
ForCenterRidgeRoad(US20),datawasavailableatLocationID18318.ThelocationiseastofDover
CenterRoad.ThelocationhadanAADTof12,944vehiclesperdayin2016withaDHV‐30of1,275
vehicles.TheavailabledatayieldsaK‐factorof0.0985.
ForDoverCenterRoad,datawasavailableatLocationID48618.ThelocationissouthofCenterRidge
Road.ThelocationhadanAADTof13,509vehiclesperdayin2016withaDHV‐30of1,389vehicles.
TheavailabledatayieldsaK‐factorof0.1028.
ThefollowingtabledetailsthecalculationofthedesignhourfactorsforCenterRidgeRoadandDover
CenterRoad:
Table3.6‐DHVFactorCalculations
LOCATIONPEAKHOUR
VOLUMEADT RATIO K‐FACTOR
DHV
FACTOR*
CenterRidgeRoad(US20) 1,691 18,280 0.0925 0.099 1.06
DoverCenterRoad 1,322 14,062 0.0940 0.103 1.09
* ‐Iftheresultantvalue is lessthan1.00,thepeakhourvolumesshouldbeusedasthedesignhour
volumesmakingtheDHVfactor1.00.
Theremainingroadwaysinthestudyareaweredeterminedtolackcomparablesitespecificdataas
comparedtotheavailabledataandtheODOTK&DReportsinordertousethepreferredmethodof
usingsitespecificdata.TheODOTPeakHourtoDesignHourchartswillbeusedtodeterminethe
designhourfactorsforthestudyarearoadways.
GlenmoreDriveandWestownBoulevardareurbanlocalroadwaysthatwerecountedonaTuesdayin
May.Theroadwayshaveadesignhourfactorof1.17.
June 5, 2017 Page 23 TMS Engineers, Inc.
Page 35
Traffic Impact Study Westlake Elementary School, Westlake, Ohio
3.3 FutureTraffic
No‐BuildCondition
In order to estimate the future traffic considering non‐project traffic conditions, the previously
discussedcalculationofdesignhourfactorsandgrowthratesforeachmovementwereappliedtothe
existing2017trafficvolumesshowninFigure2.4.
Theestimated2019and2039No‐Buildtrafficvolumesforthestudyareaareshowngraphicallyin
Figures3.5and3.6,Pages25and26.Thistrafficistheexpectedtrafficiftheproposedelementary
schoolisnotconstructed,the“No‐Build”condition.
TheNo‐Build traffic volumeshavebeen rounded to thenearest 10 to adhere to preferredODOT
practices.
BuildCondition
Inordertoestimatethefuturetrafficconsideringprojecttrafficconditions,thesumofthe2019and
2039No‐Buildvolumes,showninFigures3.5and3.6,wereaddedtothenewgeneratedtrafficto
equalthefutureBuildanalysishourvolumes.
Theestimated2019and2039BuildtrafficvolumesforthestudyareaareshowngraphicallyinFigures
3.7and3.8,Pages27and28fortheproposedelementaryschool. Thesetrafficvolumesarethe
expectedvolumesiftheproposedelementaryschoolisconstructed,orthe“Build”condition.
June 5, 2017 Page 24 TMS Engineers, Inc.
Page 36
ElementarySchoolWestlake,Ohio
TrafficImpactStudy
DoverCenterRoad
CenterRidgeRoad
CenterRidgeRoad
GlenmoreDrive
PROPOSEDELEMENTARYSCHOOL
NOTTOSCALE
ProposedEastAccess
ProposedWestAccess
ProposedSouthAccess
DoverCenterRoad
WestownBoulevard
2019No‐BuildWeekday
TrafficVolumes
Figure3.5
Page25
PMPeakHourTraffic
AMPeakHourTraffic
LEGEND
XX
(XX)
80 (120)310 (290)170 (120)
190 (120)680 (440)
60 (90)
120 (150)370 (300)130 (90)
250 (100)380 (400)90 (80)
30 (10)520 (640)
10 (10)950 (550)
10 (10)30 (10)
30 (20)370 (430)
10 (10)530 (510)
70 (40)30 (20)
Page 37
ElementarySchoolWestlake,Ohio
TrafficImpactStudy
DoverCenterRoad
CenterRidgeRoad
CenterRidgeRoad
GlenmoreDrive
PROPOSEDELEMENTARYSCHOOL
NOTTOSCALE
ProposedEastAccess
ProposedWestAccess
ProposedSouthAccess
DoverCenterRoad
WestownBoulevard
2039No‐BuildWeekday
TrafficVolumes
Figure3.6
Page26
PMPeakHourTraffic
AMPeakHourTraffic
LEGEND
XX
(XX)
100 (140)370 (340)200 (140)
230 (140)820 (480)
70 (110)
140 (180)440 (360)150 (110)
300 (120)450 (480)110 (100)
30 (10)630 (770)
10 (10)1140 (660)
10 (10)30 (10)
30 (20)440 (520)
10 (10)640 (600)
70 (40)30 (20)
Page 38
ElementarySchoolWestlake,Ohio
TrafficImpactStudy
DoverCenterRoad
CenterRidgeRoad
CenterRidgeRoad
GlenmoreDrive
PROPOSEDELEMENTARYSCHOOL
NOTTOSCALE
ProposedEastAccess
ProposedWestAccess
ProposedSouthAccess
DoverCenterRoad
WestownBoulevard
2019BuildWeekdayTraffic
Figure3.7
Page27
158 (153)316 (297)170 (120)
287 (165)798 (453)124 (137)
212 (194)379 (307)140 (98)
30 (10)595 (707)
10 (10)1094 (598)
10 (10)30 (10)
54 (43)424 (469)
16 (17)616 (545)
30 (30)40 (30)
0 (0)100 (60)
0 (0)30 (30)
95 (64)35 (26)
250 (100)483 (438)98 (88)
990 (568)134 (40)
556 (659)267 (106)
69 (58)0 (0)
990 (568)0 (0)
823 (765)
269 (137)
Page 39
ElementarySchoolWestlake,Ohio
TrafficImpactStudy
DoverCenterRoad
CenterRidgeRoad
CenterRidgeRoad
GlenmoreDrive
PROPOSEDELEMENTARYSCHOOL
NOTTOSCALE
ProposedEastAccess
ProposedWestAccess
ProposedSouthAccess
DoverCenterRoad
WestownBoulevard
2039BuildWeekdayTraffic
Figure3.8
Page28
178 (173)376 (347)200 (140)
327 (185)938 (533)134 (157)
232 (224)449 (367)150 (118)
300 (120)553 (518)118 (108)
30 (10)705 (837)
10 (10)1284 (708)
10 (10)30 (10)
54 (43)494 (559)
16 (17)726 (635)
95 (64)35 (26)
30 (30)40 (30)
0 (0)100 (60)
0 (0)30 (30)
1180 (678)134 (40)
666 (789)267 (106)
69 (58)0 (0)
1180 (678)0 (0)
933 (895)
269 (137)
Page 40
Traffic Impact Study Westlake Elementary School, Westlake, Ohio
Chapter4
TrafficAnalysis
4.1 CapacityandLOSatStudyAreaIntersections
Intersectioncapacityanalyseswereperformedatthestudyintersectionusingtheproceduresoutlined
inthecomputerizedversionoftheTransportationResearchBoard’sHighwayCapacityManual6TH
Edition,HCM6E(HCS7,Release7.2).Thecapacityanalyseswereperformedinordertoestimatethe
maximum amount of traffic that can be accommodated by a roadway facility while maintaining
recommendedoperationalqualities.Existing,NoBuild,andBuildanalysishourtrafficvolumeswere
analyzedtodeterminethelevel‐of‐service(LOS)atthestudyareaintersections.
Thecapacityanalysisproceduresprovideacalculated“averagevehicledelay”,whichisbasedontraffic
volumes,numberoflanes,typeoftrafficcontrol,channelization,grade,andpercentageoflargevehicles
in the traffic streamateach intersection. Theaveragedelay calculatedat an intersection is then
assigneda“grade”orlevelofservice(LOS)rangingfromLOSA,thebest,toLOSF,theworstbasedupon
driverexpectation.TheintersectionLOS“grades”asdefinedbytheTransportationResearchBoard
areasfollows:
Table4.1IntersectionLOS
LOS
UNSIGNALIZED
AVERAGEDELAY
PERVEHICLE(sec)
SIGNALIZED
AVERAGEDELAY
PERVEHICLE(sec)
A #10.0 #10.0
B 10.1to15.0 10.1to20.0
C 15.1to25.0 20.1to35.0
D 25.1to35.0 35.1to55.0
E 35.1to50.0 55.1to80.0
F >50 >80
Thecapacityanalysisproceduresandtheresultinglevelofservicegradesanddelaysarearecognized
traffic engineering standard for measuring the efficiency of intersection operations by such
organizationsastheInstituteofTransportationEngineers,AmericanAssociationofStateHighwayand
TransportationOfficials,andtheOhioDepartmentofTransportation.
June 5, 2017 Page 29 TMS Engineers, Inc.
Page 41
Traffic Impact Study Westlake Elementary School, Westlake, Ohio
ExistingConditions‐2017CapacityAnalysis
Analyseswereperformedfortheexisting2017conditions.Allanalyseswillassumethatthesignal
timingwouldbeoptimizedtobalancecriticallanedelaysatthesignalizedintersection.Thetraffic
volumesusedintheanalysiscanbeseeninFigure2.4.Copiesofthecapacityworksheetsareincluded
inAppendixC.TheresultsoftheYear2017ExistingConditionsanalysisareshowninthefollowing
table:
Table4.2‐2017Levels‐of‐Service
(ExistingConditions)
LOCATIONTRAFFIC
CONTROLMOVEMENT
AMPEAK
LOS(DELAY)
PMPEAK
LOS(DELAY)
CenterRidge&DoverCenter TrafficSignal Intersection C(31.6) C(27.7)
Eastbound C(33.3) C(27.7)
Westbound C(32.0) C(28.3)
Northbound C(32.3) C(27.0)
Southbound C(27.5) C(27.6)
CenterRidge&Glenmore StopSign EastboundLeft A(8.6) A(8.9)
Southbound C(19.9) C(15.2)
DoverCenter&Westown StopSign Eastbound C(18.8) C(17.5)
NorthboundLeft A(8.1) A(8.3)
(XX.X)=Averagevehicledelayinsecondspervehicle
Thestudyareaintersectionsandapproachesareoperatingwithacceptablelevels‐of‐serviceunderthe
2017existingconditionsduringtheAMandPMpeakhours.
June 5, 2017 Page 30 TMS Engineers, Inc.
Page 42
Traffic Impact Study Westlake Elementary School, Westlake, Ohio
No‐BuildConditions‐2019CapacityAnalysis
Analyseswereperformedfortheprojected2019openingdayconditionsundertheNo‐Buildscenario.
Theseanalyseswillbeused tocompare to theconditionsexpectedunder theBuildscenario. All
analyseswillassumethatthesignaltimingwouldbeoptimizedtobalancecriticallanedelaysatthe
signalizedintersection.ThetrafficvolumesusedintheanalysiscanbeseeninFigure3.5.Copiesof
thecapacityworksheetsareincludedinAppendixD.TheresultsoftheYear2019No‐Buildanalysis
areshowninthefollowingtable:
Table4.3‐2019Levels‐of‐Service
(No‐BuildConditions)
LOCATIONTRAFFIC
CONTROLMOVEMENT
AMPEAK
LOS(DELAY)
PMPEAK
LOS(DELAY)
CenterRidge&DoverCenter TrafficSignal Intersection D(35.5) C(29.1)
Eastbound D(38.8) C(29.2)
Westbound D(35.2) C(29.9)
Northbound D(35.7) C(27.9)
Southbound C(30.4) C(29.1)
CenterRidge&Glenmore StopSign EastboundLeft A(8.8) A(9.0)
Southbound C(23.4) C(16.5)
DoverCenter&Westown StopSign Eastbound C(22.3) C(19.9)
NorthboundLeft A(8.3) A(8.4)
(XX.X)=Averagevehicledelayinsecondspervehicle
Thestudyareaintersectionsandapproachesareexpectedtooperatewithacceptablelevels‐of‐service
undertheexpected2019No‐BuildconditionsduringtheAMandPMpeakhours.
June 5, 2017 Page 31 TMS Engineers, Inc.
Page 43
Traffic Impact Study Westlake Elementary School, Westlake, Ohio
No‐BuildConditions‐2039CapacityAnalysis
Analyseswereperformedfortheprojected2039designyearconditionsundertheNo‐Buildscenario.
Theseanalyseswillbeused tocompare to theconditionsexpectedunder theBuildscenario. All
analyseswillassumethatthesignaltimingwouldbeoptimizedtobalancecriticallanedelaysatthe
signalizedintersection.ThetrafficvolumesusedintheanalysiscanbeseeninFigure3.6.Copiesof
thecapacityworksheetsareincludedinAppendixE.TheresultsoftheYear2039No‐Buildanalysis
areshowninthefollowingtable:
Table4.42039Levels‐of‐Service
(No‐BuildConditions)
LOCATIONTRAFFIC
CONTROLMOVEMENT
AMPEAK
LOS(DELAY)
PMPEAK
LOS(DELAY)
CenterRidge&DoverCenter TrafficSignal Intersection E(57.0) C(33.2)
Eastbound E(61.4) C(32.9)
Westbound E(60.8) C(33.7)
Northbound E(59.3) C(33.6)
Southbound D(42.5) C(32.7)
CenterRidge&Glenmore StopSign EastboundLeft A(9.2) A(9.6)
Southbound D(32.5) C(20.1)
DoverCenter&Westown StopSign Eastbound D(30.6) D(25.6)
NorthboundLeft A(8.5) A(8.7)
(XX.X)=Averagevehicledelayinsecondspervehicle
TheintersectionofCenterRidgeRoadandDoverCenterRoadwasdeterminedtobeoperatingwith
poorlevels‐of‐serviceandhighdelayundertheexpected2039No‐BuildconditionsduringtheAMpeak
hour.Theremainingintersectionsweredeterminedtobeoperatingwithacceptablelevels‐of‐service
undertheexpected2039No‐BuildconditionsduringtheAMandPMpeakhours.
June 5, 2017 Page 32 TMS Engineers, Inc.
Page 44
Traffic Impact Study Westlake Elementary School, Westlake, Ohio
Inordertodeterminewhatmitigationwouldbenecessaryto improvethe levels‐of‐serviceat the
intersectionofCenterRidgeRoadandDoverCenterRoad,certainimprovementsweretestedwith
furthercapacityanalyses.Thefollowingimprovementsarerecommendedtomitigatetheanticipated
poorlevels‐of‐serviceunderthe2039No‐Buildconditions:
# Constructawestboundrightturnlane.
# Constructanorthboundrightturnlane.
Thefollowingtableshowsthecapacityanalysisresultsofimplementingtheproposedimprovements.
CopiesofthecapacityworksheetsfortheimprovedintersectionareinincludedinAppendixF.
Table4.52039Levels‐of‐Service
(No‐BuildConditions‐RecommendedImprovements)
LOCATIONTRAFFIC
CONTROLMOVEMENT
AMPEAK
LOS(DELAY)
PMPEAK
LOS(DELAY)
CenterRidge&DoverCenter TrafficSignal Intersection C(34.2) C(29.9)
Eastbound C(39.0) C(32.9)
Westbound C(26.4) C(28.4)
Northbound C(30.8) C(26.2)
Southbound D(39.8) C(31.8)
(XX.X)=Averagevehicledelayinsecondspervehicle
June 5, 2017 Page 33 TMS Engineers, Inc.
Page 45
Traffic Impact Study Westlake Elementary School, Westlake, Ohio
BuildCondition‐2019CapacityAnalysis
Analyseswereperformedfortheprojected2019openingdayBuildconditions.Theanalyseswillbe
usedtodeterminethefuturelevels‐of‐serviceatthestudyintersectionsundertheanticipatedBuild
conditions.Allanalyseswillassumethatthesignaltimingwouldbeoptimizedtobalancecriticallane
delays at the signalized intersection. The intersections analyzed in this section only include the
intersectionsthatdonotprovidedirectaccesstothedevelopmentsite.Thetrafficvolumesusedinthe
analysiscanbeseeninFigure3.7.CopiesofthecapacityworksheetsareincludedinAppendixG.The
resultsofthe2019Buildanalysesareshowninthefollowingtables:
Table4.62019Levels‐of‐Service
(BuildConditions)
LOCATIONTRAFFIC
CONTROLMOVEMENT
AMPEAK
LOS(DELAY)
PMPEAK
LOS(DELAY)
CenterRidge&DoverCenter TrafficSignal Intersection D(52.4) C(31.6)
Eastbound D(49.5) C(32.3)
Westbound D(53.1) C(31.5)
Northbound E(56.0) C(30.5)
Southbound D(52.8) C(31.8)
CenterRidge&Glenmore StopSign EastboundLeft A(9.0) A(9.3)
Southbound D(29.4) C(18.1)
DoverCenter&Westown StopSign Eastbound E(46.9) D(34.1)
NorthboundLeft A(9.1) A(9.4)
(XX.X)=Averagevehicledelayinsecondspervehicle
ThenorthboundapproachattheintersectionofCenterRidgeRoadandDoverCenterisexpectedto
operate with a poor level‐of‐service during the AM peak hour under the expected 2019 Build
conditions.
TheeastboundapproachattheintersectionofDoverCenterRoadandWestownBoulevardisexpected
to operatewith a poor level‐of‐service during theAMpeakhour under the expected2019Build
conditions.
June 5, 2017 Page 34 TMS Engineers, Inc.
Page 46
Traffic Impact Study Westlake Elementary School, Westlake, Ohio
A comparisonwas performed to show the incremental effects on the capacity of the study area
intersections due to the development of the proposed elementary school and to identify where
improvementsmaybenecessarytoaccommodateBuildtraffic.
ThefollowingtablesshowasidebysidecomparisonoftheBuildversusNoBuildconditionsforthe
2019AMandPMpeakhours.
Table4.72019No‐BuildvsBuildScenario
AMPeakHourComparisonTable
LOCATION
(TRAFFICCONTROL)MOVEMENT
NOBUILD
LOS(DELAY)
BUILD
LOS(DELAY)
DIFFERENCE
+/‐
CenterRidge&DoverCenter Intersection D(35.5) D(52.4) +16.9
(TrafficSignal) Eastbound D(38.8) D(49.5) +10.7
Westbound D(35.2) D(53.1) +17.9
Northbound D(35.7) E(56.0) +20.3
Southbound C(30.4) D(52.8) +22.4
CenterRidge&Glenmore EastboundLeft A(8.8) A(9.0) +0.2
(StopSign) Southbound C(23.4) D(29.4) +6.0
DoverCenter&Westown Eastbound C(22.3) E(46.9) +24.6
(StopSign) NorthboundLeft A(8.3) A(9.1) +0.8
(XX.X)=Averagevehicledelayinsecondspervehicle
The2019AMpeakhourcomparisontablesindicatetheapproachandintersectiondelaysareimpacted
withtheadditionofthedevelopmentgeneratedtrafficunderthe2019AMpeakhourconditions.The
intersectionofCenterRidgeRoadandDoverCenterRoadexperiencesincreaseddelayinexcessof20
secondsforthenorthboundandsouthboundapproaches.Thenorthboundapproachisalsoexpected
todegradetolevel‐of‐serviceE.TheeastboundapproachattheintersectionofDoverCenterRoadand
WestownBoulevardisexpectedtodegradetoalevel‐of‐serviceEundertheexpectedBuildconditions
duringtheAMpeakhour.Thepoorlevel‐of‐servicecanbeattributedtothelackofadequategapsin
thenorth‐south through traffic streamand the site generated school bus traffic on theWestown
Boulevardapproach.
June 5, 2017 Page 35 TMS Engineers, Inc.
Page 47
Traffic Impact Study Westlake Elementary School, Westlake, Ohio
Table4.82019No‐BuildvsBuildScenario
PMPeakHourComparisonTable
LOCATION
(TRAFFICCONTROL)MOVEMENT
NOBUILD
LOS(DELAY)
BUILD
LOS(DELAY)
DIFFERENCE
+/‐
CenterRidge&DoverCenter Intersection C(29.1) C(31.6) +2.5
(TrafficSignal) Eastbound C(29.2) C(32.3) +3.1
Westbound C(29.9) C(31.5) +1.6
Northbound C(27.9) C(30.5) +2.6
Southbound C(29.1) C(31.8) +2.7
CenterRidge&Glenmore EastboundLeft A(9.0) A(9.3) +0.3
(StopSign) Southbound C(16.5) C(18.1) +1.6
DoverCenter&Westown Eastbound C(19.9) D(34.1) +14.2
(StopSign) NorthboundLeft A(8.4) A(9.4) +1.0
(XX.X)=Averagevehicledelayinsecondspervehicle
The2019PMpeakhourcomparisontablesindicatetheapproachandintersectiondelaysareonly
minimallyimpactedwiththeadditionofthedevelopmentgeneratedtrafficunderthe2019PMpeak
hourconditions.Theintersectionandapproachlevels‐of‐serviceremainunchangedfromtheNo‐Build
toBuildconditionswiththeexceptionoftheeastboundapproachattheintersectionofDoverCenter
RoadandWestownBoulevard.Thelevel‐of‐serviceisexpectedtodegradefromanLOSCtoandLOS
D.
BasedontheseresultsimprovementsarenecessarytotheintersectionsofDoverCenterRoadatCenter
RidgeRoadandWestownBoulevardwith the sitegenerated trafficunder the2019openingyear
conditions.
Inordertodeterminewhatmitigationwouldbenecessarytoimprovethedelayexperiencedandthe
levels‐of‐service at these intersections, certain improvements were tested with further capacity
analyses.Thefollowingimprovementsweredeterminedtomitigatetheanticipatedpoorlevels‐of‐
serviceand/orlessenthedelayexperiencedunderthe2019Buildconditions:
CenterRidgeRoad&DoverCenterRoad
# Constructawestboundrightturnlane.
June 5, 2017 Page 36 TMS Engineers, Inc.
Page 48
Traffic Impact Study Westlake Elementary School, Westlake, Ohio
DoverCenterRoad&WestownBoulevard
# Stripetheeastboundapproachforseparateleftandrightturnlanes.
OR
# Installaroundabout.
OR
# Installtrafficsignalcontrol.
TheexistingwidthofWestownBoulevardatDoverCenterRoadisapproximately36feetwide.The
roadwaycouldbestripedforthree12footlanes.Thelaneswouldconsistofonewestboundingress
lane,oneeastboundleftturnlane,andoneeastboundrightturnlane. Itshouldbenotedthatthe
addition of a second lanemay create a situationwhere side by side turning vehicles stoppedon
WestownBoulevardmayblocktheothervehiclesviewofoncomingtrafficalongDoverCenterRoad.
TheconstructionofaroundaboutattheintersectionwouldlikelyrequireroadwideningonDover
CenterRoadtoaccommodatethediameteroftheroundaboutandthesplitterislandsonthenorthand
southapproaches.Theseimprovementswouldlikelyrequirethereplacementofthebridgeonthe
southapproachtoaccommodatethewidening.Theconstructionofaroundaboutandthereplacement
ofthebridgewouldresultinthisbeingahighcostimprovement.
Thefollowingtableshowsthecapacityanalysisresultsofimplementingtheproposedimprovements.
CopiesofthecapacityworksheetsfortheimprovedintersectionsareinincludedinAppendixH.
June 5, 2017 Page 37 TMS Engineers, Inc.
Page 49
Traffic Impact Study Westlake Elementary School, Westlake, Ohio
Table4.92019Levels‐of‐Service
(BuildConditions‐RecommendedImprovements)
LOCATIONTRAFFIC
CONTROLMOVEMENT
AMPEAK
LOS(DELAY)
PMPEAK
LOS(DELAY)
CenterRidge&DoverCenter TrafficSignal Intersection D(43.3) C(30.4)
Eastbound D(49.4) C(32.0)
Westbound C(27.7) C(27.3)
Northbound D(49.8) C(30.5)
Southbound D(44.6) C(31.8)
DoverCenter&Westown StopSign EastboundLeft E(49.0) E(37.6)
(EBRTL<L) EastboundRight C(22.3) B(12.6)
Eastbound E(41.8) D(30.4)
Northbound A(9.1) A(9.4)
DoverCenter&Westown Roundabout Intersection A(8.8) A(8.0)
Eastbound A(7.7) A(8.0)
Northbound B(10.5) A(8.6)
Southbound A(7.0) A(7.4)
DoverCenter&Westown TrafficSignal Intersection C(20.4) C(20.3)
Eastbound C(22.0) C(20.7)
Northbound C(21.9) C(20.7)
Southbound B(18.0) B(19.7)
(XX.X)=Averagevehicledelayinsecondspervehicle
TheinstallationofaroundaboutortrafficsignalcontrolattheintersectionofDoverCenterRoadand
WestownBoulevardisexpectedtoallowtheintersectiontooperatewithlevel‐of‐serviceCorbetter.
Thestripingoftheeastboundapproachforseparateleftandrightturnlanesisstillexpectedtoresult
inlevel‐of‐serviceE,howevertheoveralldelayhasbeenreducedandwiththeexclusiveleftturnlane
therightturnvehicleswillnotbeblockedbyavehiclewaitingtomakealeftturn.
June 5, 2017 Page 38 TMS Engineers, Inc.
Page 50
Traffic Impact Study Westlake Elementary School, Westlake, Ohio
TrafficSignalWarrantAnalysis‐DoverCenterRoad&WestownBoulevard2019BuildConditions
Theanticipated2019BuildtrafficconditionsattheintersectionofDoverCenterRoadandWestown
BoulevardwereanalyzedandcomparedtothecriteriaestablishedbytheOhioManualofUniform
TrafficControlDevicesandprofessionalengineeringjudgementtodetermineiftrafficsignalcontrol
iswarrantedattheintersection.Allofthedatacollectedanddeterminedforthisstudywasanalyzed
andcomparedtothethresholdsestablishedbythecriteriafromtheOMUTCD.Warrants1‐9were
evaluatedforthisanalysisoftheexpected2019Buildconditions.
Inorder todetermine if the2019anticipatedbuildconditionsareexpected tomeetoneof these
warrants,theexistinghourlyvolumesweremultipliedbythepreviouslydiscussedgrowthrateto
determinethefuture2019Buildconditions.Thesitegeneratedtrafficwasaddedtothepeakhours.
Noadditionaltrafficwasaddedtotheremaininghours.Itshouldbenotedthatthedesignhourfactors
havenotbeenincludedinthesignalwarrantvolumecalculations.
BasedupontheevaluationofthewarrantsestablishedbytheOhioManualofUniformTrafficControl
Devices,weconcludethatatrafficsignalisnotjustifiedattheintersectionofDoverCenterRoadand
WestownBoulevardasrequiredby theOhioRevisedCodebasedupon theexpected2019Build
conditions.CopiesofthetrafficsignalwarrantanalysisworksheetscanbefoundinAppendixI.
June 5, 2017 Page 39 TMS Engineers, Inc.
Page 51
Traffic Impact Study Westlake Elementary School, Westlake, Ohio
BuildCondition‐2039CapacityAnalysis
Analyseswereperformedfortheprojected2039designyearBuildconditionsundertheSitePlan
scenario.Theanalyseswillbeusedtodeterminethefuturelevels‐of‐serviceatthestudyintersections
under theanticipatedbuildconditions. Allanalyseswillassumethat thesignal timingwouldbe
optimizedtobalancecriticallanedelaysatthesignalizedintersection.Theintersectionsanalyzedin
thissectiononlyincludetheintersectionsthatdonotprovideaccesstothedevelopment.Thetraffic
volumesusedintheanalysiscanbeseeninFigure3.8.Copiesofthecapacityworksheetsareincluded
inAppendixJ.Theresultsofthe2039Buildanalysesareshowninthefollowingtable:
Table4.102039Levels‐of‐Service
(BuildConditions)
LOCATIONTRAFFIC
CONTROLMOVEMENT
AMPEAK
LOS(DELAY)
PMPEAK
LOS(DELAY)
CenterRidge&DoverCenter TrafficSignal Intersection E(61.1) D(35.1)
Eastbound F(85.0) D(40.9)
Westbound C(32.5) C(31.0)
Northbound D(44.7) C(29.2)
Southbound E(71.6) D(38.4)
CenterRidge&Glenmore StopSign EastboundLeft A(9.5) A(9.9)
Southbound E(42.8) C(22.4)
DoverCenter&Westown StopSign Eastbound F(87.3) F(50.3)
NorthboundLeft A(9.4) A(9.7)
(XX.X)=Averagevehicledelayinsecondspervehicle
Thestudyareaintersectionsareexpectedtooperatewithacceptablelevels‐of‐serviceduringtheAM
andPMpeakhoursundertheexpected2039Buildconditions.
June 5, 2017 Page 40 TMS Engineers, Inc.
Page 52
Traffic Impact Study Westlake Elementary School, Westlake, Ohio
A comparisonwas performed to show the incremental effects on the capacity of the study area
intersections due to the development of the proposed development and to identify where
improvementsmaybenecessarytoaccommodateBuildtraffic.
ThefollowingtablesshowasidebysidecomparisonoftheBuildversusNo‐Buildconditionsforthe
2039AMandPMpeakhours.
Table4.112039No‐BuildvsBuildScenario
AMPeakHourComparisonTable
LOCATION
(TRAFFICCONTROL)MOVEMENT
NOBUILD
LOS(DELAY)
BUILD
LOS(DELAY)
DIFFERENCE
+/‐
CenterRidge&DoverCenter Intersection C(34.2) E(61.1) +26.9
(TrafficSignal) Eastbound C(39.0) F(85.0) +46.0
Westbound C(26.4) C(32.5) +6.1
Northbound C(30.8) D(44.7) +13.9
Southbound D(39.8) E(71.6) +31.8
CenterRidge&Glenmore EastboundLeft A(9.2) A(9.5) +0.3
(StopSign) Southbound D(32.5) E(42.8) +10.3
DoverCenter&Westown Eastbound D(25.4) F(87.3) +61.9
(StopSign) NorthboundLeft A(8.5) A(9.4) +0.9
(XX.X)=Averagevehicledelayinsecondspervehicle
The2039AMpeakhourcomparisontableindicatesthattheapproachandintersectiondelaysare
impactedwiththeadditionofthedevelopmentgeneratedtrafficunderthe2039peakhourconditions.
TheintersectionofCenterRidgeRoadandDoverCenterRoadexperiencesincreaseddelayinexcess
of 20 seconds for the eastbound and southbound approaches. The eastbound approach at the
intersectionofDoverCenterRoadandWestownBoulevardisexpectedtodegradetoalevel‐of‐service
FundertheexpectedBuildconditionsduringtheAMpeakhour.Thepoorlevel‐of‐servicecanbe
attributedtothelackofadequategapsinthenorth‐souththroughtrafficstreamandthesitegenerated
schoolbustrafficontheWestownBoulevardapproach.
June 5, 2017 Page 41 TMS Engineers, Inc.
Page 53
Traffic Impact Study Westlake Elementary School, Westlake, Ohio
Table4.122039No‐BuildvsBuildScenario
PMPeakHourComparisonTable
LOCATION
(TRAFFICCONTROL)MOVEMENT
NOBUILD
LOS(DELAY)
BUILD
LOS(DELAY)
DIFFERENCE
+/‐
CenterRidge&DoverCenter Intersection C(29.9) D(35.1) +5.2
(TrafficSignal) Eastbound C(32.9) D(40.9) +8.0
Westbound C(28.4) C(31.0) +2.4
Northbound C(26.2) C(29.2) +3.0
Southbound C(31.8) D(38.4) +6.6
CenterRidge&Glenmore EastboundLeft A(9.6) A(9.9) +0.3
(StopSign) Southbound C(20.1) C(22.4) +2.3
DoverCenter&Westown Eastbound C(21.4) F(50.3) +28.9
(StopSign) NorthboundLeft A(8.7) A(9.7) +1.0
(XX.X)=Averagevehicledelayinsecondspervehicle
The2039PMpeakhourcomparisontablesindicatetheapproachandintersectiondelaysareonly
minimallyimpactedwiththeadditionofthedevelopmentgeneratedtrafficunderthe2019PMpeak
hourconditionswiththeexceptionoftheeastboundapproachattheDoverCenterRoadandWestown
Boulevardintersection.
Basedontheseresultsimprovementsarenecessarytoallthreestudyareaintersectionsduetothesite
generatedtrafficunderthe2039openingyearconditions.
Inordertodeterminewhatmitigationwouldbenecessarytoimprovethelevels‐of‐serviceatthese
intersections, certain improvements were tested with further capacity analyses. The following
improvementsarerecommendedtomitigatetheanticipatedpoorlevels‐of‐serviceunderthe2039
Buildconditions:
CenterRidgeRoad&DoverCenterRoad
# Constructasouthboundrightturnlane.
June 5, 2017 Page 42 TMS Engineers, Inc.
Page 54
Traffic Impact Study Westlake Elementary School, Westlake, Ohio
CenterRidgeRoad&GlenmoreDrive
# Constructanexclusivesouthboundleftturnlane.
Theadditionofaseparateleftturnlaneisstillexpectedtoresultinapoorlevel‐of‐service,howeverthe
overalldelaywillbereducedandwiththeexclusiveleftturnlanetherightturnvehicleswillnotbe
blockedbyavehiclewaitingtomakealeftturn.Itshouldbenotedthattheadditionofasecondlane
may create a situationwhere side by side turning vehiclesmay block the other vehicles viewof
oncomingtraffic.
TheintersectionisnotexpectedtomeettheminimumsidestreetvolumethresholdsfortheOMUTCD
trafficsignalwarrantcriteria.GlenmoreDrivehasapeakvolumeof50vehiclesinthe5:00PMto6:00
PMhour.TheminimumsidestreetvolumeforWarrant1(8‐HourVehicularVolume)is150vehicles
forConditionAand75vehiclesforCondition.TheminimumsidestreetvolumeforWarrant2(4‐Hour
VehicularVolume)is80vehicles.
DoverCenterRoad&WestownBoulevard
# Stripetheeastboundapproachforseparateleftandrightturnlanes.
OR
# Installaroundabout.
OR
# Installtrafficsignalcontrol.
TheexistingwidthofWestownBoulevardatDoverCenterRoadisapproximately36feetwide.The
roadwaycouldbestripedforthree12footlanes.Thelaneswouldconsistofonewestboundingress
lane,oneeastboundleftturnlane,andoneeastboundrightturnlane.Thestripingoftheeastbound
approachforseparateleftandrightturnlanesisstillexpectedtoresultinapoorlevel‐of‐service,
howevertheoveralldelaywillbereducedandwiththeexclusiveleftturnlanetherightturnvehicles
willnotbeblockedbyavehiclewaitingtomakealeftturn.
TheconstructionofaroundaboutattheintersectionwouldlikelyrequireroadwideningonDover
CenterRoadtoaccommodatethediameteroftheroundaboutandthesplitterislandsonthenorthand
southapproaches.Theseimprovementswouldlikelyrequirethereplacementofthebridgeonthe
southapproachtoaccommodatethewidening.Theconstructionofaroundaboutandthereplacement
ofthebridgewouldresultinthisbeingahighcostimprovement.
Thefollowingtableshowsthecapacityanalysisresultsofimplementingtheproposedimprovements.
CopiesofthecapacityworksheetsfortheimprovedintersectionsareinincludedinAppendixK.
June 5, 2017 Page 43 TMS Engineers, Inc.
Page 55
Traffic Impact Study Westlake Elementary School, Westlake, Ohio
Table4.132039Levels‐of‐Service
(BuildConditions‐RecommendedImprovements)
LOCATIONTRAFFIC
CONTROLMOVEMENT
AMPEAK
LOS(DELAY)
PMPEAK
LOS(DELAY)
CenterRidge&DoverCenter TrafficSignal Intersection D(40.7) C(28.2)
Eastbound D(50.3) C(29.9)
Westbound C(27.6) C(25.0)
Northbound D(42.6) C(30.0)
Southbound D(37.6) C(27.4)
CenterRidge&Glenmore StopSign Eastbound A(9.5) A(9.9)
SouthboundLeft F(51.2) D(32.0)
SouthboundRight B(11.1) B(11.7)
Southbound E(41.2) C(21.9)
DoverCenter&Westown StopSign EastboundLeft F(87.9) F(55.2)
(EBRTL<L) EastboundRight D(29.5) D(26.7)
Eastbound F(72.1) E(47.0)
Northbound A(9.4) A(9.7)
DoverCenter&Westown Roundabout Intersection B(10.7) A(9.3)
Eastbound A(8.5) A(9.1)
Northbound B(13.3) B(10.1)
Southbound A(7.8) A(8.5)
DoverCenter&Westown TrafficSignal Intersection C(20.8) C(20.9)
Eastbound C(22.8) C(21.2)
Northbound C(23.0) C(21.4)
Southbound B(17.2) C(20.3)
(XX.X)=Averagevehicledelayinsecondspervehicle
June 5, 2017 Page 44 TMS Engineers, Inc.
Page 56
Traffic Impact Study Westlake Elementary School, Westlake, Ohio
TrafficSignalWarrantAnalysis‐DoverCenterRoad&WestownBoulevard2039BuildConditions
Theanticipated2039BuildtrafficconditionsattheintersectionofDoverCenterRoadandWestown
BoulevardwereanalyzedandcomparedtothecriteriaestablishedbytheOhioManualofUniform
TrafficControlDevicesandprofessionalengineeringjudgementtodetermineiftrafficsignalcontrol
iswarrantedattheintersection.Allofthedatacollectedanddeterminedforthisstudywasanalyzed
andcomparedtothethresholdsestablishedbythecriteriafromtheOMUTCD.Warrants1‐9were
evaluatedforthisanalysisoftheexpected2039Buildconditions.
Inorder todetermine if the2039anticipatedbuildconditionsareexpected tomeetoneof these
warrants,theexistinghourlyvolumesweremultipliedbythepreviouslydiscussedgrowthrateto
determinethefuture2039Buildconditions.Thesitegeneratedtrafficwasaddedtothepeakhours.
Noadditionaltrafficwasaddedtotheremaininghours.Itshouldbenotedthatthedesignhourfactors
havenotbeenincludedonthesignalwarrantvolumecalculations.
BasedupontheevaluationofthewarrantsestablishedbytheOhioManualofUniformTrafficControl
Devices,weconcludethatatrafficsignalisnotjustifiedattheintersectionofDoverCenterRoadand
WestownBoulevardasrequiredby theOhioRevisedCodebasedupon theexpected2039Build
conditions.CopiesofthetrafficsignalwarrantanalysisworksheetscanbefoundinAppendixI.
June 5, 2017 Page 45 TMS Engineers, Inc.
Page 57
Traffic Impact Study Westlake Elementary School, Westlake, Ohio
4.2 Capacity&LOSatDevelopmentAccessIntersections
CapacityanalyseswereperformedfortheintersectionslocatedalongCenterRidgeRoadthatprovide
accesstotheproposedelementaryschoolsiteusingtheproceduresoutlined inthecomputerized
versionof theTransportationResearchBoard’s HighwayCapacityManual6THEdition,HCM6E
(HCS7,Release7.2).Theinitialoperatingconditionsfortheproposedintersectionswillincludetraffic
signalcontrolatthewestaccesslocationandastopsigncontrolledrestrictedaccessdrivewayatthe
eastaccesslocation.
BuildCondition‐2019CapacityAnalysis
Analyseswereperformedfortheprojected2019openingdayconditionsundertheBuildscenarioto
determinethefuturelevel‐of‐serviceattheintersectionswhereaccessisavailabletotheelementary
schoolalongCenterRidgeRoad.Theresultsofthe2019Buildanalysesareshowninthefollowing
table.CopiesofthecapacityworksheetsareincludedinAppendixL.
Table4.142019Levels‐of‐Service
(BuildConditions‐AccessLocations)
LOCATIONTRAFFIC
CONTROLMOVEMENT
AMPEAK
LOS(DELAY)
PMPEAK
LOS(DELAY)
CenterRidge&WestAccess TrafficSignal Intersection C(27.0) C(23.1)
Eastbound C(33.5) C(28.4)
Westbound B(17.9) B(18.7)
Northbound C(26.8) C(22.5)
Southbound C(33.8) C(28.4)
CenterRidge&EastAccess StopSign Northbound C(22.7) B(11.7)
(XX.X)=Averagevehicledelayinsecondspervehicle
TheintersectionswhereaccesstothedevelopmentisavailablealongCenterRidgeRoadareexpected
tooperatewithacceptablelevels‐of‐serviceunderthe2019BuildconditionsduringtheAMandPM
peakhours.TheanalysesdeterminedthatanexclusivewestboundleftturnlaneattheproposedWest
Accessintersectionwouldbenecessarytoaccommodatetheexpectedsitegeneratedtrafficvolumes.
June 5, 2017 Page 46 TMS Engineers, Inc.
Page 58
Traffic Impact Study Westlake Elementary School, Westlake, Ohio
TrafficSignalWarrantAnalysis‐CenterRidgeRoad&WestAccess2019BuildConditions
Theanticipated2019BuildtrafficconditionsattheintersectionofCenterRidgeRoadandtheproposed
WestAccessdrivewaywereanalyzedandcomparedtothecriteriaestablishedbytheOhioManualof
UniformTrafficControlDevicesandprofessionalengineeringjudgementtodetermineiftrafficsignal
controliswarrantedattheintersection.Allofthedatacollectedanddeterminedforthisstudywas
analyzedandcomparedtothethresholdsestablishedbythecriteriafromtheOMUTCD.Warrant3was
evaluatedforthisanalysisoftheexpected2019Buildconditions.
Inorder todetermine if the2019anticipatedbuildconditionsareexpected tomeetoneof these
warrants,theexistinghourlyvolumesweremultipliedbythepreviouslydiscussedgrowthrateto
determinethefuture2019Buildconditions.Thesitegeneratedtrafficwasaddedtothepeakhours.
Itshouldbenotedthatthedesignhourfactorshavenotbeenincludedonthesignalwarrantvolume
calculations.
BasedupontheevaluationofthewarrantsestablishedbytheOhioManualofUniformTrafficControl
Devices,weconcludethatatrafficsignalisjustifiedattheintersectionofCenterRidgeRoadandthe
proposedWestAccessdrivewayasrequiredbytheOhioRevisedCodebasedupontheexpected2019
Buildconditions.CopiesofthetrafficsignalwarrantanalysisworksheetscanbefoundinAppendixI.
June 5, 2017 Page 47 TMS Engineers, Inc.
Page 59
Traffic Impact Study Westlake Elementary School, Westlake, Ohio
BuildCondition‐2039CapacityAnalysis
Analyseswereperformedfortheprojected2039designyearconditionsundertheBuildscenarioto
determinethefuturelevel‐of‐serviceattheintersectionswhereaccessisavailabletotheelementary
schoolalongCenterRidgeRoad.Theresultsofthe2039Buildanalysesareshowninthefollowing
table.CopiesofthecapacityworksheetsareincludedinAppendixM.
Table4.152039Levels‐of‐Service
(BuildConditions‐AccessLocations)
LOCATIONTRAFFIC
CONTROLMOVEMENT
AMPEAK
LOS(DELAY)
PMPEAK
LOS(DELAY)
CenterRidge&WestAccess TrafficSignal Intersection C(28.7) C(21.7)
Eastbound D(36.7) C(26.8)
Westbound B(17.0) B(17.4)
Northbound C(30.1) C(20.5)
Southbound D(37.5) C(26.9)
CenterRidge&EastAccess StopSign Northbound D(31.2) B(12.5)
(XX.X)=Averagevehicledelayinsecondspervehicle
TheintersectionswhereaccesstothedevelopmentisavailablealongCenterRidgeRoadareexpected
tooperatewithacceptablelevels‐of‐serviceunderthe2039BuildconditionsduringtheAMandPM
peakhours.
June 5, 2017 Page 48 TMS Engineers, Inc.
Page 60
Traffic Impact Study Westlake Elementary School, Westlake, Ohio
4.3 AuxiliaryTurningLaneWarrantAnalysis
TheODOTLocationandDesignManual,Volume1andtheAccessManagementManualrecommend
thattheneedforauxiliaryturnlanesatunsignalizedintersectionsbedeterminedbyusingtheAuxiliary
Lane Graphs found in Section 401‐6 of the Location and Design Manual, Volume 1. This
recommendationismadeforthefree‐flowapproachesatunsignalizedintersections.Section401.6.3
oftheODOTLocationandDesignManualstatesthat:
“Todeterminethenumberanduseofrightandleftturnlanes,intersectioncapacityanalysisprocedures
ofthecurrenteditionoftheHighwayCapacityManualshouldbeused.Forunsignalizedintersections,
rightandleftturnlanesmayalsobeneedediftheymeetwarrantsprovidedinFigures401‐6a,b,cand
d.Thewarrantsapplyonlytothefree‐flowapproachoftheunsignalizedintersection.”
ItistheintentofthisreporttoevaluatetheneedforanexclusiverightturnlaneonCenterRidgeRoad
attheEastAccess.
Theneedforanexclusiveturnlaneattheintersectionwasbasedonafour‐laneroadwaywithaposted
speedlimitof35milesperhourforCenterRidgeRoad.
Thefollowingtableshowstheresultsoftheanalysisoftheneedforanexclusiverightturnlaneat
CenterRidgeRoadandtheproposedEastAccessdriveway.CopiesoftheODOTturnlanewarrant
graphscanbeseeninAppendixN.
Table4.16TurningLaneWarrantAnalysis
CenterRidgeRoad&ProposedEastAccess
TURNLANE&LOCATION2019 2039
AMPEAK PMPEAK AMPEAK PMPEAK
EBRightTurnLane@ProposedEastAccess NO NO NO NO
Theresultsoftheturnlanewarrantanalysisindicatethatanexclusiveeastboundrightturnlanewas
showntonotbewarrantedonCenterRidgeRoadattheproposedEastAccessundertheexpected2019
and2039Buildconditions.
June 5, 2017 Page 49 TMS Engineers, Inc.
Page 61
Traffic Impact Study Westlake Elementary School, Westlake, Ohio
4.4 TurnLaneLengthAnalysis
An analysis was performed to determine the necessary turn lane storage length in order to
accommodatetherecommendedturnlanesundertheYear2039peakhourBuildconditions.
TheanalysiswasperformedinaccordancewiththeprocedurerecommendedbytheOhioDepartment
ofTransportationintheirLocationandDesignManual,Volume1,Section401.TheODOTcriteria
andproceduresarefurnishedinAppendixO.
Therecommendedmaximumleftturnlanelengthis600feetandtherightturnlanelengthis800feet,
howeverifthecalculatedturnlanelengthislowerthanthesevaluesthemaximumlengthwillnotbe
applicable.
Thefollowingtablesshowtheresultsoftheanalysisbaseduponthehighestanticipatedmovement
volumesattheintersections.
Table4.17‐TurnLaneLengthAnalysis
CenterRidgeRoad&DoverCenterRoad
Movement
Direction
DHV No.of
Lanes
Cycles
/
Hour
Average
Veh/
Cycle/
Lane
Design
Speed
(mph)
Fig.401‐
10
Storage
Length
(ft)
Fig.401‐9
Condition Backup
Length
(ft)
Turn
Lane
Length*
(ft)A* B* C*
WBRT 300 1 36 8.3 40 350 ‐‐ ‐‐ 466 ‐‐ 466*
WBT 553 2 36 7.7 40 ‐‐ ‐‐ ‐‐ ‐‐ 325 ‐‐
NBRT 150 1 36 4.2 40 200 ‐‐ ‐‐ 311 ‐‐ 475*
NBT 449 1 36 12.5 40 ‐‐ ‐‐ ‐‐ ‐‐ 475 ‐‐
SBRT 178 1 36 4.9 40 200 ‐‐ ‐‐ 311 ‐‐ 400*
SBT 376 1 36 10.4 40 ‐‐ ‐‐ ‐‐ ‐‐ 400 ‐‐
*Includes50'taper
June 5, 2017 Page 50 TMS Engineers, Inc.
Page 62
Traffic Impact Study Westlake Elementary School, Westlake, Ohio
Table4.18‐TurnLaneLengthAnalysis
CenterRidgeRoad&ProposedWestAccess
Movement
Direction
DHV No.of
Lanes
Cycles
/
Hour
Average
Veh/
Cycle/
Lane
Design
Speed
(mph)
Fig.401‐
10
Storage
Length
(ft)
Fig.401‐9
Condition Backup
Length
(ft)
Turn
Lane
Length*
(ft)A* B* C*
WBLT 267 1 36 7.4 40 325 ‐‐ ‐‐ 436 ‐‐ 436*
WBT/RT 789 2 36 11.0 40 ‐‐ ‐‐ ‐‐ ‐‐ 400 ‐‐
*Includes50'taper
June 5, 2017 Page 51 TMS Engineers, Inc.
Page 63
Traffic Impact Study Westlake Elementary School, Westlake, Ohio
4.5 AlternativeScenarioAnalysis
ThepreviousanalysesindicatedthattheintersectionofCenterRidgeRoadandDoverCenterRoadwas
expectedtorequireseveralimprovementsinordertomitigatetheimpactofthesitegeneratedtraffic.
TheintersectionsofCenterRidgeRoad/GlenmoreDriveandDoverCenterRoad/WestownBoulevard
weredeterminedtooperatewithpoorlevels‐of‐serviceasaresultofthesitegeneratedtrafficandwere
notabletobefullymitigatedwithoutunwarrantedimprovementsorhighcostimprovements.For
thesestatedreasonsanalternativescenariowasdevelopedtodeterminetheimpactontheadjacent
studyareaintersectionsascomparedtotheproposedscenariodetailedonthesiteplan(Figure1.2).
Theanalysisofthisscenariowillbebasedonthe2039twentyyeardesigntrafficvolumes.
Thesitegeneratedschoolbus trafficwill continue touseabusonlyaccessdrivealongWestown
Boulevardasdetailedonthesiteplan(Figure1.2).Therewillbenochangestotheschoolbusvolumes
ordistributionthroughoutthestreetnetworkasdetailedinFigure3.4.
TheproposedWestAccessdrivewillberelocatedtothewestsothatitalignsdirectlyacrossfrom
GlenmoreDrive.TheWestaccessdrivewouldthenbeextendedtothecul‐de‐sacatthewestofendof
WestownBoulevard.TheintentwouldbetoallowthevehiclescomingfromthesouthalongDover
CenterRoadtoaccessthesitewithouthavingtomakeanorthboundleftturnattheCenterRidgeRoad
andDoverCenterRoadintersection.VehiclesexitingthesitetothesouthalongDoverCenterRoad
wouldthenalsobeabletoavoidtheintersectionofCenterRidgeRoadandDoverCenterRoadaswell.
TheproposedsignalwouldalsobeabletoservetheGlenmoreDrivetrafficandtheWestlakeUnited
MethodistChurchwouldbeabletoaccessthetrafficsignalviatheiraccessdrivesalongGlenmoreDrive.
TheproposedEastaccessdrivewillremainasdetailedonthesiteplanasarestrictedaccessdriveway.
June 5, 2017 Page 52 TMS Engineers, Inc.
Page 64
Traffic Impact Study Westlake Elementary School, Westlake, Ohio
Theassignmentsoftheestimatednewgeneratedpassengervehicletrafficfortheproposedelementary
schoolareshowngraphicallyinFigure4.1,Page54.Theassignmentsoftheestimatednewgenerated
schoolbustrafficfortheproposedelementaryschoolwasshowngraphicallyinFigure3.4,Page19,
astheschoolbusdistributionhasnotbeenalteredinthisscenario.
Inordertoestimatethefuturetrafficconsideringthedescribedalternativeconditions,thesumofthe
2039No‐Buildvolumes,showninFigure3.6,wereaddedtothenewgeneratedtraffic(Figures3.4&
4.1)toequalthefutureBuildpeakhourvolumes.
Theestimated2039BuildtrafficvolumesforthealternativescenarioareshowngraphicallyinFigure
4.2,Page55fortheproposedelementaryschool.
June 5, 2017 Page 53 TMS Engineers, Inc.
Page 65
ElementarySchoolWestlake,Ohio
TrafficImpactStudy
DoverCenterRoad
CenterRidgeRoad
CenterRidgeRoad
GlenmoreDrive
PROPOSEDELEMENTARYSCHOOL
NOTTOSCALE
ProposedEastAccess
ProposedWestAccess
ProposedSouthAccess
DoverCenterRoad
WestownBoulevard
NewGeneratedTrafficPassengerVehiclesAlternateScenario
Figure4.1
Page54
NEWGENERATEDTRAFFIC
TOTALTRIPS
ENTER
EXIT
AM739
401
338
PM341
146
195
LEGENDAMPeakHourTripsXX
RED=EnteringVolumesGREEN=ExitingVolumes
PMPeakHourTrips(XX)
134 (40)
215 (98)
78 (33)
86 (35)
86 (35)
69 (58)181 (71)
103 (38)
97 (45)118 (53)
54 (39)
181 (71)
86 (35)
54 (39)
54 (39)
Page 66
ElementarySchoolWestlake,Ohio
TrafficImpactStudy
DoverCenterRoad
CenterRidgeRoad
CenterRidgeRoad
GlenmoreDrive
PROPOSEDELEMENTARYSCHOOL
NOTTOSCALE
ProposedEastAccess
ProposedWestAccess
ProposedSouthAccess
DoverCenterRoad
WestownBoulevard
2039BuildWeekdayTraffic
Figure4.2
Page55
178 (173)376 (347)200 (140)
327 (185)938 (533)
80 (118)
146 (189)449 (367)150 (118)
300 (120)553 (518)118 (108)
54 (43)440 (520)
102 (52)640 (600)
95 (64)69 (65)
30 (30)126 (65)
0 (0)154 (99)
0 (0)30 (30)
1180 (678)0 (0)
847 (860)
215 (98)86 (35)40 (30)
0 (0)100 (60)
0 (0)54 (39)
10 (10)0 (0)30 (10)
10 (10)1150 (668)
134 (40)
69 (58)0 (0)0 (0)
30 (10)636 (779)181 (71)
Page 67
Traffic Impact Study Westlake Elementary School, Westlake, Ohio
Analyseswereperformedfortheprojected2039designyearBuildconditionsunderthealternative
scenario.Thisanalysiswillbeusedtodeterminethefuturelevels‐of‐serviceatthestudyintersections
under theanticipatedbuildconditions. All analysiswill assume that thesignal timingwouldbe
optimizedtobalancecriticallanedelaysatthesignalizedintersection.Thetrafficvolumesusedinthis
analysiscanbeseeninFigure4.1.CopiesofthecapacityworksheetsareincludedinAppendixP.The
resultsofthe2039Buildanalysesareshowninthefollowingtables:
Table4.192039Levels‐of‐Service
(BuildConditions‐AlternativeScenario)
LOCATIONTRAFFIC
CONTROLMOVEMENT
AMPEAK
LOS(DELAY)
PMPEAK
LOS(DELAY)
CenterRidge&DoverCenter TrafficSignal Intersection D(36.8) C(27.4)
Eastbound D(44.6) C(29.4)
Westbound C(29.3) C(25.2)
Northbound D(36.1) C(28.4)
Southbound C(33.1) C(26.4)
CenterRidge&Glenmore/West TrafficSignal Intersection C(22.9) B(18.6)
Eastbound C(28,2) C(22.9)
Westbound B(14.1) B(14.6)
Northbound C(27.8) C(22.4)
Southbound C(26.0) C(21.3)
CenterRidge&EastAccess StopSign NorthboundRight C(24.0) B(11.9)
DoverCenter&Westown StopSign EastboundLeft F(123.8) F(61.8)
EastboundRight B(12.6) B(13.5)
Eastbound F(76.9) E(37.5)
Northbound B(12.6) A(9.2)
(XX.X)=Averagevehicledelayinsecondspervehicle
Thestudyareaintersectionsareexpectedtooperatewithacceptablelevels‐of‐serviceduringtheAM
andPMpeakhoursundertheexpected2039AlternateScenarioBuildconditionswiththeexception
oftheDoverCenterRoadandWestownBoulevardintersection.
June 5, 2017 Page 56 TMS Engineers, Inc.
Page 68
Traffic Impact Study Westlake Elementary School, Westlake, Ohio
Basedontheseresults improvementsarenecessaryat the intersectionofDoverCenterRoadand
WestownBoulevardunderthe2039AlternateScenarioBuildconditions.
Inordertodeterminewhatmitigationwouldbenecessarytoimprovethelevels‐of‐serviceatthis
intersection, certain improvements were tested with further capacity analyses. The following
improvementsarerecommendedtomitigatetheanticipatedpoorlevels‐of‐serviceunderthe2039
AlternateScenarioBuildconditions:
DoverCenterRoad&WestownBoulevard
# Stripetheeastboundapproachforseparateleftandrightturnlanes.
# Installtrafficsignalcontrol.
Thefollowingtableshowsthecapacityanalysisresultsofimplementingtheproposedimprovements.
CopiesofthecapacityworksheetsfortheimprovedintersectionareinincludedinAppendixQ.
Table4.202039Levels‐of‐Service
(AlternativeScenario‐RecommendedImprovements)
LOCATIONTRAFFIC
CONTROLMOVEMENT
AMPEAK
LOS(DELAY)
PMPEAK
LOS(DELAY)
DoverCenter&Westown TrafficSignal Intersection C(22.2) B(19.8)
Eastbound C(27.2) C(21.7)
Northbound C(27.6) C(21.7)
Southbound B(12.3) B(16.4)
(XX.X)=Averagevehicledelayinsecondspervehicle
June 5, 2017 Page 57 TMS Engineers, Inc.
Page 69
Traffic Impact Study Westlake Elementary School, Westlake, Ohio
TrafficSignalWarrantAnalysis‐DoverCenterRoad&WestownBoulevard2039AlternateConditions
Theanticipated2039AlternateScenarioBuildtrafficconditionsattheintersectionofDoverCenter
RoadandWestownBoulevardwereanalyzedandcomparedtothecriteriaestablishedbytheOhio
ManualofUniformTrafficControlDevicesandprofessionalengineeringjudgementtodetermine
iftrafficsignalcontroliswarrantedattheintersection.Allofthedatacollectedanddeterminedforthis
studywasanalyzedandcomparedtothethresholdsestablishedbythecriteriafromtheOMUTCD.
Warrant3wasevaluatedforthisanalysisoftheexpected2039AlternateScenarioBuildconditions.
Inorder todetermine if the2039anticipatedbuildconditionsareexpected tomeetoneof these
warrants,theexistinghourlyvolumesmultipliedbythepreviouslydiscussedgrowthratetodetermine
thefuture2039Buildconditions.Thesitegeneratedtrafficwasaddedtothepeakhours.Itshouldbe
notedthatthedesignhourfactorshavenotbeenincludedonthesignalwarrantvolumecalculations.
BasedupontheevaluationofthewarrantsestablishedbytheOhioManualofUniformTrafficControl
Devices,weconcludethatatrafficsignalisjustifiedattheintersectionofDoverCenterRoadand
WestownBoulevardasrequiredbytheOhioRevisedCodebasedupontheexpected2039Alternate
ScenarioBuildconditions.Copiesofthetrafficsignalwarrantanalysisworksheetscanbefoundin
AppendixI.
June 5, 2017 Page 58 TMS Engineers, Inc.
Page 70
Traffic Impact Study Westlake Elementary School, Westlake, Ohio
A comparisonwas performed to show the incremental effects on the capacity of the study area
intersectionsduetothealternatescenarioascomparedtothesiteplanconditionsshowninFigure1.2.
Thefollowingtablesshowasidebysidecomparisonofthesiteplanversusthealternatescenario
conditionsforthe2039AMandPMpeakhours.
Table4.212039SitePlanvs.AlternateScenario
AMPeakHourComparisonTable
LOCATION
(TRAFFICCONTROL)MOVEMENT
SITEPLAN
LOS(DELAY)
ALTERNATE
LOS(DELAY)
DIFFERENCE
+/‐
CenterRidge&DoverCenter Intersection D(40.7) D(36.8) –3.9
(TrafficSignal) Eastbound D(50.3) D(44.6) ‐5.7
Westbound C(27.6) C(29.3) +1.7
Northbound D(42.6) D(36.1) ‐6.5
Southbound D(37.6) C(33.1) ‐4.5
CenterRidge&EastAccess
(StopSign)NorthboundRight D(31.2) C(24.0) ‐7.2
DoverCenter&Westown Intersection C(20.8) C(22.2) +1.4
(TrafficSignal) Eastbound C(22.8) C(27.2) +4.4
Northbound C(23.0) C(21.7) ‐1.3
Southbound B(17.2) B(12.3) ‐4.9
(XX.X)=Averagevehicledelayinsecondspervehicle
The2039AMpeakhourcomparisontableindicatesthattheintersectiondelaysareloweredunderthe
AlternateScenarioattheCenterRidgeRoadintersections.The2039AMpeakhourcomparisontable
indicatestheapproachandintersectiondelaysattheintersectionofDoverCenterRoadandWestown
BoulevardareonlyminimallyimpactedbytheproposedconditionsoftheAlternateScenario.
June 5, 2017 Page 59 TMS Engineers, Inc.
Page 71
Traffic Impact Study Westlake Elementary School, Westlake, Ohio
Table4.222039SitePlanvs.AlternateScenario
PMPeakHourComparisonTable
LOCATION
(TRAFFICCONTROL)MOVEMENT
NOBUILD
LOS(DELAY)
BUILD
LOS(DELAY)
DIFFERENCE
+/‐
CenterRidge&DoverCenter Intersection C(28.2) C(27.4) ‐0.8
(TrafficSignal) Eastbound C(29.9) C(29.4) ‐0.5
Westbound C(25.0) C(25.2) ‐0.2
Northbound C(30.0) C(28.4) ‐1.6
Southbound C(27.4) C(26.4) ‐1.0
CenterRidge&EastAccess
(StopSign)NorthboundRight B(12.5) B(11.9) ‐0.6
DoverCenter&Westown Intersection C(20.9) B(19.8) ‐1.1
(TrafficSignal) Eastbound C(21.2) C(21.7) +0.5
Northbound C(21.4) C(21.7) +0.3
Southbound C(20.3) B(16.4) ‐3.9
(XX.X)=Averagevehicledelayinsecondspervehicle
The2039PMpeakhourcomparisontableindicatesthattheintersectiondelaysareloweredunderthe
AlternateScenarioattheCenterRidgeRoadintersections.The2039PMpeakhourcomparisontable
indicatestheapproachandintersectiondelaysattheintersectionofDoverCenterRoadandWestown
BoulevardareonlyminimallyimpactedbytheproposedconditionsoftheAlternateScenario.
June 5, 2017 Page 60 TMS Engineers, Inc.
Page 72
Traffic Impact Study Westlake Elementary School, Westlake, Ohio
An analysis was performed to determine the necessary turn lane storage length in order to
accommodatetherecommendedturnlanesundertheYear2039peakhourBuildconditionsforthe
AlternateScenario. The following tablesshowtheresultsof theanalysisbasedupon thehighest
anticipatedmovementvolumesattheintersections.
Table4.26‐TurnLaneLengthAnalysis
CenterRidgeRoad&DoverCenterRoad
Movement
Direction
DHV No.of
Lanes
Cycles
/
Hour
Average
Veh/
Cycle/
Lane
Design
Speed
(mph)
Fig.401‐
10
Storage
Length
(ft)
Fig.401‐9
Condition Backup
Length
(ft)
Turn
Lane
Length*
(ft)A* B* C*
WBRT 300 1 36 8.3 40 350 ‐‐ ‐‐ 466 ‐‐ 466*
WBT 553 2 36 7.7 40 ‐‐ ‐‐ ‐‐ ‐‐ 325 ‐‐
NBRT 150 1 36 4.2 40 200 ‐‐ ‐‐ 311 ‐‐ 475*
NBT 449 1 36 12.5 40 ‐‐ ‐‐ ‐‐ ‐‐ 475 ‐‐
SBRT 178 1 36 4.9 40 200 ‐‐ ‐‐ 311 ‐‐ 400*
SBT 376 1 36 10.4 40 ‐‐ ‐‐ ‐‐ ‐‐ 400 ‐‐
*Includes50'taper
Table4.27‐TurnLaneLengthAnalysis
CenterRidgeRoad&GlenmoreDrive/ProposedWestAccess
Movement
Direction
DHV No.of
Lanes
Cycles
/
Hour
Average
Veh/
Cycle/
Lane
Design
Speed
(mph)
Fig.401‐
10
Storage
Length
(ft)
Fig.401‐9
Condition Backup
Length
(ft)
Turn
Lane
Length*
(ft)A* B* C*
EBLT 10 1 36 0.3 40 50 ‐‐ ‐‐ 161 ‐‐ 600*
EBT/RT 1284 2 36 17.8 40 ‐‐ ‐‐ ‐‐ ‐‐ 625
WBLT 181 1 36 5.0 40 200 ‐‐ ‐‐ 311 ‐‐ 400*
WBT/RT 789 2 36 11.0 40 ‐‐ ‐‐ ‐‐ ‐‐ 400 ‐‐
*Includes50'taper
June 5, 2017 Page 61 TMS Engineers, Inc.
Page 73
Traffic Impact Study Westlake Elementary School, Westlake, Ohio
4.6 ImprovementstoAccommodateStudyAreaTraffic
Nointersectionimprovementswerefoundtobenecessarytoaccommodatethe2017existingtraffic
conditionsatthestudyareaintersections.
ItshouldbenotedthatawestboundrightturnlaneatintersectionofCenterRidgeRoadandDover
CenterRoadhasbeenpreviouslyrecommendedinotherreportspreparedfortheCityofWestlake.This
recommendationwasbasedonananalysisoftheroadwaypeakhours.Theelementaryschoolanalysis
isbasedonthepeakhouroftheschooltrafficvolumeswhichdoesnotcoincidewiththepeakhourof
trafficfortheroadway(i.etheschoolpeaksintheafternoonfrom2:00to3:00PMwhiletheroadway
peaksfrom5:00to6:00PM).
NointersectionimprovementswerefoundtobenecessarytoaccommodatetheYear2019No‐Build
trafficatthestudyareaintersections.
ThefollowingimprovementswererecommendedtoaccommodatetheYear2039No‐Buildtrafficat
thestudyareaintersectionsthatdonotprovideaccesstotheproposeddevelopment.
CenterRidgeRoad&DoverCenterRoad
# Constructawestboundrightturnlane.
# Constructanorthboundrightturnlane.
NoadditionalintersectionimprovementswerefoundtobenecessarytoaccommodatetheYear2039
No‐Build trafficat theremainingstudyarea intersections. Theremainingstudy intersectionsare
anticipatedtooperatewithacceptablelevelsofserviceduringtheAMandPMpeakhours.
Thefollowinglaneuseandtrafficcontrolarerecommendedtoaccommodatethe2019and2039site
generated(Build)trafficbasedonthedevelopmentsiteplanshowninFigure1.2:
CenterRidgeRoad&GlenmoreDrive
# Constructasouthboundleftturnlane.(2039)
Theadditionofaseparateleftturnlaneisstillexpectedtoresultinapoorlevel‐of‐serviceunderthe
2039Buildconditions,howevertheoveralldelaywillbereducedandwiththeexclusiveleftturnlane
therightturnvehicleswillnotbeblockedbyavehiclewaitingtomakealeftturn.Itshouldbenoted
thattheadditionofasecondlanemaycreateasituationwheresidebysideturningvehiclesmayblock
theothervehiclesviewofoncomingtraffic.
June 5, 2017 Page 62 TMS Engineers, Inc.
Page 74
Traffic Impact Study Westlake Elementary School, Westlake, Ohio
CenterRidgeRoad&ProposedWestAccess(2019)
# Installtrafficsignalcontrol.
# Constructtheproposeddevelopmentroadwaywithoneegresslaneandtwoingress
lanes.
# Theegresslanesshouldconsistofanexclusiveleftturnlaneandanexclusiverightturn
lane.
# Constructanexclusivewestboundleftturnlane.
# Includethechurchaccessdriveaspartofintersectionandtrafficsignalcontrol.
CenterRidgeRoad&ProposedEastAccess(2019)
# Constructtheproposeddevelopmentroadwaywithoneegresslaneandoneingress
lane.
# Restricttheaccessdrivewaytorightturnsinandrightturnsoutofthesiteonlythrough
theuseofachannelizingisland.
# Theegressdriveshouldbeconstructedpertherecommendationsandguidelinesfound
intheODOTAccessManagementManualforchannelizingislands(SeeAppendixR).
# Installstopsigncontrolonthenorthboundapproach.
CenterRidgeRoad&DoverCenterRoad
# Constructawestboundrightturnlane.(2019)
# Constructasouthboundrightturnlane.(2039)
DoverCenterRoad&WestownBoulevard(2019)
# Re‐stripetheeastboundapproachforoneingresslaneandtwoegresslanesconsisting
ofarightturnlaneandleftturnlane.
Trafficsignalcontrolandaroundaboutwereanalyzedaspotentialimprovementsfortheintersection.
Trafficsignalcontrolisnotexpectedtobewarrantedattheintersectionbasedonthetrafficsignal
warrantsfoundintheOMUTCD.Theconstructionofroundaboutattheintersectionwasdetermined
tobeunlikelyduetothebridgelocatedonthesouthapproachandthehighcostofincludingitinthe
constructionoftheroundabout.
The recommended lane use and traffic control for the study area to accommodate the proposed
developmentbasedonthesiteplaninFigure1.2canbeseeninFigure4.3,Page64.
June 5, 2017 Page 63 TMS Engineers, Inc.
Page 75
ElementarySchoolWestlake,Ohio
TrafficImpactStudy
DoverCenterRoad
CenterRidgeRoad
CenterRidgeRoad
GlenmoreDrive
PROPOSEDELEMENTARYSCHOOL
NOTTOSCALE
ProposedEastAccess
ProposedWestAccess
ProposedSouthAccess
DoverCenterRoad
WestownBoulevard
RecommendedLaneUseandTraffic
Control– SitePlan
Figure4.3
Page64
STOP
ProposedLaneUse
LEGEND
ProposedSignal
ProposedStopSignSTOP
ExistingLaneUse
ExistingSignal
ExistingStopSign
STOP
ProposedAccess
ST
OP
ST
OP
2019BUILD
2019BUILD
2019BUILD
2019BUILD
ST
OP
2039NO‐BUILD
2039NO‐BUILD2019BUILD
2039BUILD
2039BUILD
Page 76
Traffic Impact Study Westlake Elementary School, Westlake, Ohio
Thefollowinglaneuseandtrafficcontrolarerecommendedtoaccommodatethe2039sitegenerated
(Build)trafficbasedontheAlternateScenariodetailedinSection4.5:
CenterRidgeRoad&ProposedWestAccess/GlenmoreDrive
# ConstructthedevelopmentWestAccessdirectlyacrossfromGlenmoreDrive.
# Installtrafficsignalcontrol.
# Constructtheproposeddevelopmentroadwaywithoneegresslaneandtwoingress
lanes.
# Theegresslanesshouldconsistofanexclusiveleftturnlaneandasharedthroughand
rightturnlane.
# Constructanexclusivewestboundleftturnlane.
# Constructanexclusiveeastboundleftturnlane.
CenterRidgeRoad&ProposedEastAccess
# Constructtheproposeddevelopmentroadwaywithoneegresslaneandoneingress
lane.
# Restricttheaccessdrivewaytorightturnsinandrightturnsoutofthesiteonlythrough
theuseofachannelizingisland.
# Theegressdriveshouldbeconstructedpertherecommendationsandguidelinesfound
intheODOTAccessManagementManualforchannelizingislands(SeeAppendixR).
# Installstopsigncontrolonthenorthboundapproach.
CenterRidgeRoad&DoverCenterRoad
# Constructasouthboundrightturnlane.
DoverCenterRoad&WestownBoulevard
# Installtrafficsignalcontrol.
# Re‐stripetheeastboundapproachforoneingresslaneandtwoegresslanesconsisting
ofarightturnlaneandleftturnlane.
TherecommendedtrafficcontrolwithinthesitetoaccommodatetheAlternateScenariocanbeseen
inFigure4.4,Page66.
The recommended lane use and traffic control for the study area to accommodate the proposed
developmentbasedontheAlternateScenariodescribedinSection4.5canbeseeninFigure4.5,Page
67.
June 5, 2017 Page 65 TMS Engineers, Inc.
Page 77
ElementarySchoolWestlake,Ohio
TrafficImpactStudy
InteriorTrafficControl
AlternateScenario
Figure4.4
Page66
ProposedStopSign
LEGEND
NOTTOSCALE
Page 78
ElementarySchoolWestlake,Ohio
TrafficImpactStudy
DoverCenterRoad
CenterRidgeRoad
CenterRidgeRoad
GlenmoreDrive
PROPOSEDELEMENTARYSCHOOL
NOTTOSCALE
ProposedEastAccess
ProposedWestAccess
ProposedSouthAccess
DoverCenterRoad
WestownBoulevard
RecommendedLaneUseandTraffic
Control– Alternate
Figure4.5
Page66
STOP
ProposedLaneUse
LEGEND
ProposedSignal
ProposedStopSignSTOP
ExistingLaneUse
ExistingSignal
ExistingStopSign
STOP
ProposedAccess
ST
OP
ST
OP
2039NO‐BUILD 2039
NO‐BUILD
ST
OP
Page 79
Traffic Impact Study Westlake Elementary School, Westlake, Ohio
Chapter5
Conclusions
Basedontheresultsoftheanalyses,weofferthefollowingconclusionsandrecommendations:
5.1 ThistrafficimpactstudyhasbeenpreparedattherequestoftheWestlakeCitySchoolsfora
proposedelementaryschool. TheprojectsiteislocatedintheCityofWestlake,Cuyahoga
County,OhioalongthesouthsideofCenterRidgeRoad(USRoute20)betweenGlenmoreDrive
tothewestandDoverCenterRoadtotheeast.
5.2 Theproposedelementaryschoolisexpectedtohaveastudentpopulationof1,450students
with 120 staff for grades pre‐kindergarten through fourth grade. Figure1.2 shows the
proposedsiteplanfortheelementaryschool.
5.3 ThedevelopmentisproposedwithtwoaccessdrivewaysalongthesouthsideofCenterRidge
RoadandoneaccessdrivewayalongthenorthsideofWestownBoulevard.
5.4 Theyear2019wasanalyzedfortheopeningyearconditions,andtheyear2039wasanalyzed
asthedesignyearforthetwentyyearconditionsanalysis.
5.5 The elementary school day begins at 7:50AM and ends at 2:20 PM, therefore the report
analyzedthehoursof7:30to8:30AMand2:00PMto3:00PM.The7:30to8:30AMhourwas
referredtoastheweekdayAMpeakhourforthepurposeofthisreport.The2:00to3:00PM
hourwasreferredtoasthePMpeakhourforthepurposeofthisreport.Theseperiodswere
analyzedsincetheyreflecttheperiodofthehighestvolumeoftrafficflowfortheproposed
school.
5.6 Theelementaryschoolwasassumedtogenerateatotalof30enteringand30exitingtripsfor
schoolbuses.Thesevolumesareincludedinthetotalgenerationvolumescalculatedforthis
analysis.
June 5, 2017 Page 68 TMS Engineers, Inc.
Page 80
Traffic Impact Study Westlake Elementary School, Westlake, Ohio
5.7 Theproposedelementaryschoolisexpectedtogeneratethefollowingaveragehourlytraffic
duringtheAMandPMpeakperiods:
ITETRIPGENERATION
SIZE
(Staff)
TRIPENDS
ITE
CodeLandUseDescription
AMPeakHour
ofGenerator
(Enter/Exit)
PMPeakHour
ofGenerator
(Enter/Exit)
520 ElementarySchool 120 431 368 176 225
TOTALNEWGENERATEDTRIPS 799 401
5.8 Nointersectionimprovementswerefoundtobenecessarytoaccommodatethe2017existing
trafficconditionsatthestudyareaintersections.
5.9 NointersectionimprovementswerefoundtobenecessarytoaccommodatetheYear2019No‐
Buildtrafficatthestudyareaintersections.
5.10 ThefollowingimprovementswererecommendedtoaccommodatetheYear2039No‐Build
trafficatthestudyareaintersectionsthatdonotprovideaccesstotheproposedelementary
school.
CenterRidgeRoad&DoverCenterRoad
# Constructawestboundrightturnlane.
# Constructanorthboundrightturnlane.
NoadditionalintersectionimprovementswerefoundtobenecessarytoaccommodatetheYear
2039 No‐Build traffic at the remaining study area intersections. The remaining study
intersectionsareanticipatedtooperatewithacceptablelevelsofserviceduringtheAMandPM
peakhours.
June 5, 2017 Page 69 TMS Engineers, Inc.
Page 81
Traffic Impact Study Westlake Elementary School, Westlake, Ohio
5.11 Thefollowinglaneuseandtrafficcontrolarerecommendedtoaccommodatethe2019and
2039sitegenerated(Build)trafficbasedonthedevelopmentsiteplanshowninFigure1.2:
CenterRidgeRoad&GlenmoreDrive(2039)
# Constructasouthboundleftturnlane.
CenterRidgeRoad&ProposedWestAccess(2019)
# Installtrafficsignalcontrol.
# Constructtheproposeddevelopmentroadwaywithoneegresslaneandtwoingress
lanes.
# Theegresslanesshouldconsistofanexclusiveleftturnlaneandanexclusiverightturn
lane.
# Constructanexclusivewestboundleftturnlane.
# Includethechurchaccessdriveaspartofintersectionandtrafficsignalcontrol.
CenterRidgeRoad&ProposedEastAccess(2019)
# Constructtheproposeddevelopmentroadwaywithoneegresslaneandoneingress
lane.
# Restricttheaccessdrivewaytorightturnsinandrightturnsoutofthesiteonlythrough
theuseofachannelizingisland.
# Theegressdriveshouldbeconstructedpertherecommendationsandguidelinesfound
intheODOTAccessManagementManualforchannelizingislands(SeeAppendixX).
# Installstopsigncontrolonthenorthboundapproach.
CenterRidgeRoad&DoverCenterRoad
# Constructawestboundrightturnlane.(2019)
# Constructasouthboundrightturnlane.(2039)
DoverCenterRoad&WestownBoulevard(2019)
# Re‐stripetheeastboundapproachforoneingresslaneandtwoegresslanesconsisting
ofarightturnlaneandleftturnlane.
June 5, 2017 Page 70 TMS Engineers, Inc.
Page 82
Traffic Impact Study Westlake Elementary School, Westlake, Ohio
5.12 Thefollowinglaneuseandtrafficcontrolarerecommendedtoaccommodatethe2039site
generated(Build)trafficbasedontheAlternateScenariodetailedinSection4.5:
CenterRidgeRoad&ProposedWestAccess/GlenmoreDrive
# ConstructthedevelopmentWestAccessdirectlyacrossfromGlenmoreDrive.
# Installtrafficsignalcontrol.
# Constructtheproposeddevelopmentroadwaywithoneegresslaneandtwoingress
lanes.
# Theegresslanesshouldconsistofanexclusiveleftturnlaneandasharedthroughand
rightturnlane.
# Constructanexclusivewestboundleftturnlane.
# Constructanexclusiveeastboundleftturnlane.
CenterRidgeRoad&ProposedEastAccess
# Constructtheproposeddevelopmentroadwaywithoneegresslaneandoneingress
lane.
# Restricttheaccessdrivewaytorightturnsinandrightturnsoutofthesiteonlythrough
theuseofachannelizingisland.
# Theegressdriveshouldbeconstructedpertherecommendationsandguidelinesfound
intheODOTAccessManagementManualforchannelizingislands(SeeAppendixX).
# Installstopsigncontrolonthenorthboundapproach.
CenterRidgeRoad&DoverCenterRoad
# Constructasouthboundrightturnlane.
DoverCenterRoad&WestownBoulevard
# Installtrafficsignalcontrol.
# Re‐stripetheeastboundapproachforoneingresslaneandtwoegresslanesconsisting
ofarightturnlaneandleftturnlane.
5.13 Basedupontheresultsoftheanalysisinthisstudyandthecorrespondingrecommendations,
itcanbeseenthatthesitegeneratedtrafficcanbeaccommodatedwithoutadverselyimpacting
thearearoadwaynetworkundereachscenario.
June 5, 2017 Page 71 TMS Engineers, Inc.
Page 83
Traffic Impact Study Westlake Elementary School, Westlake, Ohio
AppendixA
TrafficCountData
June 5, 2017 TMS Engineers, Inc.
Page 84
Mun
icip
alit
y:A
t In
ters
ecti
on o
fan
d
Dat
e:
Day
:P
roje
ct:
Wea
ther
:
Dat
a en
try
by:
JJ
OD
ate
ente
red:
Left
Thr
uR
ight
Tot
alT
rkB
usLe
ftT
hru
Rig
htT
otal
Trk
Bus
Left
Thr
uR
ight
Tot
alT
rkB
usLe
ftT
hru
Rig
htT
otal
Trk
Bus
Nor
thS
outh
East
Wes
t
06
:00
07
:00
93
7
1
29
32
23
0
08
:00
9
04
1
32
72
23
1
09
:00
8
46
1
05
01
89
6
10
:00
11
:00
93
0
1
17
02
10
0
12
:00
95
3
11
83
21
36
1:0
0
2:0
0
95
7
1
09
02
04
7
3:0
0
11
88
1
53
22
72
0
4:0
0
11
48
16
04
27
52
5:0
0
13
22
16
91
30
13
6:0
0
7:0
0
8:0
0
9:0
0
TO
TA
LS1
18
02
54
89
85
47
13
57
24
11
13
24
78
88
14
47
25
81
69
18
58
76
37
88
12
35
58
99
12
23
21
22
74
02
07
94
60
41
10
83
11
19
40
21
12
5
AD
T1
80
73
90
11
50
87
21
51
70
43
79
41
34
96
84
61
40
62
13
41
57
99
18
91
90
31
18
78
61
54
12
16
92
48
18
28
03
23
41
HO
UR
LY F
AC
TO
R:
1
.68
MO
NT
HLY
FA
CT
OR
:
0.9
1C
OM
BIN
ED F
AC
TO
R:
1
.53
17
-05
2
Rec
orde
r(s)
:
Cle
arG
FA &
PM
BM
ay.
10
, 2
01
7
Com
men
ts:
TM
S E
NG
INEE
RS
, IN
C.
21
12
Cas
e P
arkw
ay S
outh
#7
TO
TA
LA
LLD
IREC
.
PEA
K H
OU
R F
AC
TO
RFR
OM
WES
T
Cen
ter
Rid
ge R
d.C
ente
r R
idge
Rd.
(33
0)
68
6-6
40
2
FA
X:
(3
30
) 6
86
-64
17
FRO
M N
OR
TH
FRO
M S
OU
TH
TO
TA
LN
OR
TH
SO
UT
H
1.7
%1
.7%
2.3
%2
.6%
TO
TA
LEA
ST
WES
T
Tw
insb
urg,
Ohi
o 4
40
87
FRO
M E
AS
TT
IME
BEG
INS
Dov
er C
ente
r R
d.D
over
Cen
ter
Rd.
Page 85
Mun
icip
alit
y:A
t In
ters
ecti
on o
fan
d
Dat
e:
Day
:P
roje
ct:
Wea
ther
:
Dat
a en
try
by:
JJ
OD
ate
ente
red:
Left
Thr
uR
ight
Tot
alT
rkB
usLe
ftT
hru
Rig
htT
otal
Trk
Bus
Left
Thr
uR
ight
Tot
alT
rkB
usLe
ftT
hru
Rig
htT
otal
Trk
Bus
Nor
thS
outh
East
Wes
t
06
:00
07
:00
26
1
10
41
13
0
08
:00
29
1
26
41
29
3
09
:00
16
1
09
81
11
4
10
:00
11
:00
15
1
19
61
21
1
12
:00
13
1
15
71
17
0
1:0
0
2:0
0
22
1
11
31
13
5
3:0
0
48
1
50
81
55
6
4:0
0
25
15
15
15
40
5:0
0
50
16
38
16
88
6:0
0
7:0
0
8:0
0
9:0
0
TO
TA
LS1
33
01
11
24
44
22
44
05
54
51
60
57
05
12
22
39
15
79
70
58
88
11
53
01
15
93
11
83
7
AD
T2
04
01
70
37
43
74
08
48
92
45
87
34
13
98
87
50
90
14
17
74
81
81
22
HO
UR
LY F
AC
TO
R:
1
.68
MO
NT
HLY
FA
CT
OR
:
0.9
1C
OM
BIN
ED F
AC
TO
R:
1
.53
17
-05
2
Rec
orde
r(s)
:
Cle
arD
JSM
ay.
10
, 2
01
7
Com
men
ts:
TM
S E
NG
INEE
RS
, IN
C.
21
12
Cas
e P
arkw
ay S
outh
#7
TO
TA
LA
LLD
IREC
.
PEA
K H
OU
R F
AC
TO
RFR
OM
WES
T
Cen
ter
Rid
ge R
d.C
ente
r R
idge
Rd.
(33
0)
68
6-6
40
2
FA
X:
(3
30
) 6
86
-64
17
FRO
M N
OR
TH
FRO
M S
OU
TH
TO
TA
LN
OR
TH
SO
UT
H
2.5
%2
.5%
2.5
%
TO
TA
LEA
ST
WES
T
Tw
insb
urg,
Ohi
o 4
40
87
FRO
M E
AS
TT
IME
BEG
INS
Gle
nmor
e D
r.
Page 86
Mun
icip
alit
y:A
t In
ters
ecti
on o
fan
d
Dat
e:
Day
:P
roje
ct:
Wea
ther
:
Dat
a en
try
by:
JJ
OD
ate
ente
red:
Left
Thr
uR
ight
Tot
alT
rkB
usLe
ftT
hru
Rig
htT
otal
Trk
Bus
Left
Thr
uR
ight
Tot
alT
rkB
usLe
ftT
hru
Rig
htT
otal
Trk
Bus
Nor
thS
outh
East
Wes
t
06
:00
07
:00
79
4
84
87
8
08
:00
7
24
59
78
3
09
:00
72
3
58
78
1
10
:00
11
:00
89
5
44
93
9
12
:00
88
6
51
93
7
1:0
0
2:0
0
87
7
53
93
0
3:0
0
10
98
45
11
43
4:0
0
11
65
40
12
05
5:0
0
12
13
42
12
55
6:0
0
7:0
0
8:0
0
9:0
0
TO
TA
LS0
38
59
25
94
11
84
81
41
26
41
31
04
25
73
81
68
37
52
89
01
87
47
69
34
76
88
51
AD
T0
59
08
39
76
30
41
93
63
24
06
51
71
28
22
44
20
28
67
29
72
91
35
50
HO
UR
LY F
AC
TO
R:
1
.68
MO
NT
HLY
FA
CT
OR
:
0.9
1C
OM
BIN
ED F
AC
TO
R:
1
.53
1.5
%1
.3%
2.5
%
TO
TA
LEA
ST
WES
T
Tw
insb
urg,
Ohi
o 4
40
87
FRO
M E
AS
TT
IME
BEG
INS
Dov
er C
ente
r R
d.D
over
Cen
ter
Rd.
PEA
K H
OU
R F
AC
TO
RFR
OM
WES
T
Wes
tow
n B
lvd.
(33
0)
68
6-6
40
2
FA
X:
(3
30
) 6
86
-64
17
FRO
M N
OR
TH
FRO
M S
OU
TH
TO
TA
LN
OR
TH
SO
UT
H
May
. 1
0,
20
17
Com
men
ts:
TM
S E
NG
INEE
RS
, IN
C.
21
12
Cas
e P
arkw
ay S
outh
#7
TO
TA
LA
LLD
IREC
.
17
-05
2
Rec
orde
r(s)
:
Cle
arS
LC
Page 87
Traffic Impact Study Westlake Elementary School, Westlake, Ohio
AppendixB
TripGenerationData
June 5, 2017 TMS Engineers, Inc.
Page 88
ELEMENTARY SCHOOLITE CODE = 520
PK‐4 Elementary School ‐ Westlake, OhioDate: 5/15/2017
Trip Generation based on: Size of Analysis Area: 120 Employees
Number of Employees
Average Weekday 2‐way Volume 18.14 0.00 1.00 2176
Generator AM Peak Hour Enter 3.60 0.00 1.00 431
Generator AM Peak Hour Exit 3.06 0.00 1.00 368
Generator AM Peak Hour Total 6.66 0.00 1.00 799
Generator PM Peak Hour Enter 1.47 0.00 1.00 176
Generator PM Peak Hour Exit 1.87 0.00 1.00 225
Generator PM Peak Hour Total 3.34 0.00 1.00 401
Saturday 2‐way Volume ‐‐‐ ‐‐‐ ‐‐‐ ‐‐‐
Saturday Peak Hour Enter ‐‐‐ ‐‐‐ ‐‐‐ ‐‐‐
Saturday Peak Hour Exit ‐‐‐ ‐‐‐ ‐‐‐ ‐‐‐
Saturday Peak Hour Total ‐‐‐ ‐‐‐ ‐‐‐ ‐‐‐
ENTER EXIT
Average Weekday 2‐way Volume 50% 50%
Generator AM Peak Hour Total 54% 46%
Generator PM Peak Hour Total 44% 56%
Saturday 2‐way Volume
Saturday Peak Hour Volume
Source: Institute of Transportation Engineers
Trip Generartion, 9th Edition, 2012.
Average
Rate
Standard
Deviation
Adjustment
factor
Driveway
Volume
T 7.65 X ‐ 118.67
T 19.87 X ‐ 207.96
T 3.29 X 6.41
NO AVAILABEDATA
NOAVAILABLEDATA
Page 89
ELEMENTARY SCHOOLITE CODE = 520
PK‐4 Elementary School ‐ Westlake, OhioDate: 5/15/2017
Trip Generation based on: Size of Analysis Area: 1450 Students
Number of Students
Average Weekday 2‐way Volume 1.29 1.26 1.00 1871
Generator AM Peak Hour Enter 0.25 0.00 1.00 359
Generator AM Peak Hour Exit 0.20 0.00 1.00 294
Generator AM Peak Hour Total 0.45 0.70 1.00 653
Generator PM Peak Hour Enter 0.13 0.00 1.00 183
Generator PM Peak Hour Exit 0.15 0.00 1.00 223
Generator PM Peak Hour Total 0.28 0.54 1.00 406
Saturday 2‐way Volume ‐‐‐ ‐‐‐ ‐‐‐ ‐‐‐
Saturday Peak Hour Enter ‐‐‐ ‐‐‐ ‐‐‐ ‐‐‐
Saturday Peak Hour Exit ‐‐‐ ‐‐‐ ‐‐‐ ‐‐‐
Saturday Peak Hour Total ‐‐‐ ‐‐‐ ‐‐‐ ‐‐‐
ENTER EXIT
Average Weekday 2‐way Volume 50% 50%
Generator AM Peak Hour Total 55% 45%
Generator PM Peak Hour Total 45% 55%
Saturday 2‐way Volume
Saturday Peak Hour Volume
Source: Institute of Transportation Engineers
Trip Generartion, 9th Edition, 2012.
Average
Rate
Standard
Deviation
Adjustment
factor
Driveway
Volume
EQUATIONNOT GIVEN
EQUATIONNOT GIVEN
EQUATIONNOT GIVEN
NO AVAILABEDATA
NOAVAILABLEDATA
Page 90
Traffic Impact Study Westlake Elementary School, Westlake, Ohio
AppendixC
ExistingCapacityAnalysesWorksheets‐2017
June 5, 2017 TMS Engineers, Inc.
Page 91
HCS7 Signalized Intersection Results Summary
General Information Intersection Information
Agency TMS Engineers, Inc. Duration, h 0.25
Analyst ABC Analysis Date May 19, 2017 Area Type Other
Jurisdiction Westlake, OH Time Period AM Peak PHF 0.92
Urban Street Center Ridge Analysis Year 2017 Analysis Period 1> 7:00
Intersection @ Dover Center File Name AM EX CenterDover.xus
Project Description Existing Conditions
Demand Information EB WB NB SB
Approach Movement L T R L T R L T R L T R
Demand ( v ), veh/h 176 631 55 82 350 233 106 328 116 150 275 75
Signal Information
GreenYellowRed
7.0 31.4 7.0 34.6 0.0 0.03.6 3.6 3.6 3.6 0.0 0.01.4 1.4 1.4 1.4 0.0 0.0
1 2 4
5 6 7
Cycle, s 100.0 Reference Phase 2
Offset, s 0 Reference Point End
Uncoordinated No Simult. Gap E/W On
Force Mode Fixed Simult. Gap N/S On
Timer Results EBL EBT WBL WBT NBL NBT SBL SBT
Assigned Phase 5 2 1 6 3 8 7 4
Case Number 1.1 4.0 1.1 4.0 1.1 4.0 1.1 4.0
Phase Duration, s 12.0 36.4 12.0 36.4 12.0 39.6 12.0 39.6
Change Period, ( Y+R c ), s 5.0 5.0 5.0 5.0 5.0 5.0 5.0 5.0
Max Allow Headway ( MAH ), s 3.1 0.0 3.1 0.0 3.1 3.1 3.1 3.1
Queue Clearance Time ( g s ), s 9.0 5.3 6.0 26.2 7.9 19.5
Green Extension Time ( g e ), s 0.0 0.0 0.0 0.0 0.0 1.4 0.0 1.6
Phase Call Probability 1.00 1.00 1.00 1.00 1.00 1.00
Max Out Probability 1.00 1.00 1.00 0.13 1.00 0.01
Movement Group Results EB WB NB SB
Approach Movement L T R L T R L T R L T R
Assigned Movement 5 2 12 1 6 16 3 8 18 7 4 14
Adjusted Flow Rate ( v ), veh/h 191 378 368 89 337 297 115 483 163 380
Adjusted Saturation Flow Rate ( s ), veh/h/ln 1781 1870 1817 1767 1856 1609 1781 1786 1781 1801
Queue Service Time ( g s ), s 7.0 17.4 17.4 3.3 15.2 15.5 4.0 24.2 5.9 17.5
Cycle Queue Clearance Time ( g c ), s 7.0 17.4 17.4 3.3 15.2 15.5 4.0 24.2 5.9 17.5
Green Ratio ( g/C ) 0.38 0.31 0.31 0.38 0.31 0.31 0.42 0.35 0.42 0.35
Capacity ( c ), veh/h 307 587 571 281 583 505 348 618 273 623
Volume-to-Capacity Ratio ( X ) 0.624 0.643 0.644 0.317 0.578 0.588 0.331 0.781 0.597 0.611
Back of Queue ( Q ), ft/ln ( 85 th percentile) 129.7 290.9 280.4 61.1 257 229 74.5 365.6 106.4 262.3
Back of Queue ( Q ), veh/ln ( 85 th percentile) 5.1 11.5 11.2 2.4 10.0 9.2 2.9 14.4 4.2 10.3
Queue Storage Ratio ( RQ ) ( 85 th percentile) 0.86 0.00 0.00 0.41 0.00 0.00 0.43 0.00 0.33 0.00
Uniform Delay ( d 1 ), s/veh 24.1 29.5 29.5 22.1 28.7 28.9 20.4 29.3 23.0 27.1
Incremental Delay ( d 2 ), s/veh 2.9 5.4 5.5 0.2 4.1 4.9 0.2 5.8 2.5 1.3
Initial Queue Delay ( d 3 ), s/veh 0.0 0.0 0.0 0.0 0.0 0.0 0.0 0.0 0.0 0.0
Control Delay ( d ), s/veh 27.0 34.8 35.0 22.4 32.9 33.8 20.6 35.1 25.4 28.4
Level of Service (LOS) C C D C C C C D C C
Approach Delay, s/veh / LOS 33.3 C 32.0 C 32.3 C 27.5 C
Intersection Delay, s/veh / LOS 31.6 C
Multimodal Results EB WB NB SB
Pedestrian LOS Score / LOS 2.3 B 2.3 B 2.8 C 2.8 C
Bicycle LOS Score / LOS 1.3 A 1.1 A 1.5 A 1.4 A
Copyright © 2017 University of Florida, All Rights Reserved. HCS7™ Streets Version 7.2 Generated: 5/23/2017 2:48:55 PM
Page 92
HCS7 Two-Way Stop-Control Report
General Information Site InformationAnalyst ABC Intersection Center Ridge & Glenmore
Agency/Co. TMS Engineers, Inc. Jurisdiction Westlake, OH
Date Performed 5/19/2017 East/West Street Center Ridge Road
Analysis Year 2017 North/South Street Glenmore Drive
Time Analyzed AM Peak Peak Hour Factor 0.92
Intersection Orientation East-West Analysis Time Period (hrs) 0.25
Project Description Existing Conditions
Lanes
Major Street: East-West
Vehicle Volumes and AdjustmentsApproach Eastbound Westbound Northbound Southbound
Movement U L T R U L T R U L T R U L T R
Priority 1U 1 2 3 4U 4 5 6 7 8 9 10 11 12
Number of Lanes 0 0 2 0 0 0 2 0 0 0 0 0 1 0
Configuration LT T T TR LR
Volume, V (veh/h) 6 878 483 24 25 9
Percent Heavy Vehicles (%) 3 3 3
Proportion Time Blocked
Percent Grade (%) 0
Right Turn Channelized No No No No
Median Type/Storage Undivided
Critical and Follow-up HeadwaysBase Critical Headway (sec) 4.1 7.5 6.9
Critical Headway (sec) 4.16 6.86 6.96
Base Follow-Up Headway (sec) 2.2 3.5 3.3
Follow-Up Headway (sec) 2.23 3.53 3.33
Delay, Queue Length, and Level of ServiceFlow Rate, v (veh/h) 7 37
Capacity, c (veh/h) 1008 278
v/c Ratio 0.01 0.13
95% Queue Length, Q₉₅ (veh) 0.0 0.5
Control Delay (s/veh) 8.6 19.9
Level of Service, LOS A C
Approach Delay (s/veh) 0.1 19.9
Approach LOS C
Copyright © 2017 University of Florida. All Rights Reserved. HCS7™ TWSC Version 7.2 Generated: 5/23/2017 2:58:41 PMTWSC1.xtw
Page 93
HCS7 Two-Way Stop-Control Report
General Information Site InformationAnalyst ABC Intersection Dover Center & Westown
Agency/Co. TMS Engineers, Inc. Jurisdiction Westlake, OH
Date Performed 5/19/2017 East/West Street Westown Boulevard
Analysis Year 2017 North/South Street Dover Center Road
Time Analyzed AM Peak Peak Hour Factor 0.92
Intersection Orientation North-South Analysis Time Period (hrs) 0.25
Project Description Existing Conditions
Lanes
Major Street: North-South
Vehicle Volumes and AdjustmentsApproach Eastbound Westbound Northbound Southbound
Movement U L T R U L T R U L T R U L T R
Priority 10 11 12 7 8 9 1U 1 2 3 4U 4 5 6
Number of Lanes 0 1 0 0 0 0 0 0 1 0 0 0 1 0
Configuration LR LT TR
Volume, V (veh/h) 62 22 8 478 334 25
Percent Heavy Vehicles (%) 3 3 3
Proportion Time Blocked
Percent Grade (%) 0
Right Turn Channelized No No No No
Median Type/Storage Undivided
Critical and Follow-up HeadwaysBase Critical Headway (sec)
Critical Headway (sec)
Base Follow-Up Headway (sec)
Follow-Up Headway (sec)
Delay, Queue Length, and Level of ServiceFlow Rate, v (veh/h) 91 9
Capacity, c (veh/h) 407 1162
v/c Ratio 0.22 0.01
95% Queue Length, Q₉₅ (veh) 0.8 0.0
Control Delay (s/veh) 16.4 8.1
Level of Service, LOS C A
Approach Delay (s/veh) 16.4 0.2
Approach LOS C
Copyright © 2017 University of Florida. All Rights Reserved. HCS7™ TWSC Version 7.2 Generated: 5/23/2017 3:02:08 PMAM EX Westown.xtw
Page 94
HCS7 Signalized Intersection Results Summary
General Information Intersection Information
Agency TMS Engineers, Inc. Duration, h 0.25
Analyst ABC Analysis Date May 19, 2017 Area Type Other
Jurisdiction Westlake, OH Time Period PM Peak PHF 0.92
Urban Street Center Ridge Analysis Year 2017 Analysis Period 1> 7:00
Intersection @ Dover Center File Name PM EX CenterDover.xus
Project Description Existing Conditions
Demand Information EB WB NB SB
Approach Movement L T R L T R L T R L T R
Demand ( v ), veh/h 106 368 81 76 367 92 133 271 84 105 258 106
Signal Information
GreenYellowRed
7.0 31.7 7.0 34.3 0.0 0.03.6 3.6 3.6 3.6 0.0 0.01.4 1.4 1.4 1.4 0.0 0.0
1 2 4
5 6 7
Cycle, s 100.0 Reference Phase 2
Offset, s 0 Reference Point End
Uncoordinated No Simult. Gap E/W On
Force Mode Fixed Simult. Gap N/S On
Timer Results EBL EBT WBL WBT NBL NBT SBL SBT
Assigned Phase 5 2 1 6 3 8 7 4
Case Number 1.1 4.0 1.1 4.0 1.1 4.0 1.1 4.0
Phase Duration, s 12.0 36.7 12.0 36.7 12.0 39.3 12.0 39.3
Change Period, ( Y+R c ), s 5.0 5.0 5.0 5.0 5.0 5.0 5.0 5.0
Max Allow Headway ( MAH ), s 3.1 0.0 3.1 0.0 3.1 3.1 3.1 3.1
Queue Clearance Time ( g s ), s 6.2 5.0 7.2 20.0 6.0 20.8
Green Extension Time ( g e ), s 0.0 0.0 0.0 0.0 0.0 1.4 0.0 1.4
Phase Call Probability 1.00 1.00 1.00 1.00 1.00 1.00
Max Out Probability 1.00 1.00 1.00 0.01 1.00 0.01
Movement Group Results EB WB NB SB
Approach Movement L T R L T R L T R L T R
Assigned Movement 5 2 12 1 6 16 3 8 18 7 4 14
Adjusted Flow Rate ( v ), veh/h 115 250 238 83 256 243 145 386 114 396
Adjusted Saturation Flow Rate ( s ), veh/h/ln 1781 1870 1754 1767 1856 1727 1781 1794 1781 1777
Queue Service Time ( g s ), s 4.2 10.5 10.7 3.0 10.9 11.2 5.2 18.0 4.0 18.8
Cycle Queue Clearance Time ( g c ), s 4.2 10.5 10.7 3.0 10.9 11.2 5.2 18.0 4.0 18.8
Green Ratio ( g/C ) 0.39 0.32 0.32 0.39 0.32 0.32 0.41 0.34 0.41 0.34
Capacity ( c ), veh/h 363 593 556 367 588 548 330 615 359 610
Volume-to-Capacity Ratio ( X ) 0.317 0.422 0.428 0.225 0.436 0.443 0.438 0.627 0.318 0.649
Back of Queue ( Q ), ft/ln ( 85 th percentile) 78.5 184.1 175 55.8 190.6 179.1 91.6 269.2 74.2 279.1
Back of Queue ( Q ), veh/ln ( 85 th percentile) 3.1 7.2 7.0 2.2 7.4 7.2 3.6 10.6 2.9 11.0
Queue Storage Ratio ( RQ ) ( 85 th percentile) 0.52 0.00 0.00 0.37 0.00 0.00 0.52 0.00 0.23 0.00
Uniform Delay ( d 1 ), s/veh 21.1 26.9 27.0 20.6 27.1 27.1 21.3 27.5 20.2 27.8
Incremental Delay ( d 2 ), s/veh 0.2 2.2 2.4 0.1 2.3 2.6 0.3 1.5 0.2 1.9
Initial Queue Delay ( d 3 ), s/veh 0.0 0.0 0.0 0.0 0.0 0.0 0.0 0.0 0.0 0.0
Control Delay ( d ), s/veh 21.3 29.1 29.4 20.7 29.4 29.7 21.6 29.0 20.4 29.7
Level of Service (LOS) C C C C C C C C C C
Approach Delay, s/veh / LOS 27.7 C 28.3 C 27.0 C 27.6 C
Intersection Delay, s/veh / LOS 27.7 C
Multimodal Results EB WB NB SB
Pedestrian LOS Score / LOS 2.3 B 2.3 B 2.8 C 2.8 C
Bicycle LOS Score / LOS 1.0 A 1.0 A 1.4 A 1.3 A
Copyright © 2017 University of Florida, All Rights Reserved. HCS7™ Streets Version 7.2 Generated: 5/23/2017 3:02:36 PM
Page 95
HCS7 Two-Way Stop-Control Report
General Information Site InformationAnalyst ABC Intersection Center Ridge & Glenmore
Agency/Co. TMS Engineers, Inc. Jurisdiction Westlake, OH
Date Performed 5/19/2017 East/West Street Center Ridge Road
Analysis Year 2017 North/South Street Glenmore Drive
Time Analyzed PM Peak Peak Hour Factor 0.92
Intersection Orientation East-West Analysis Time Period (hrs) 0.25
Project Description Existing Conditions
Lanes
Major Street: East-West
Vehicle Volumes and AdjustmentsApproach Eastbound Westbound Northbound Southbound
Movement U L T R U L T R U L T R U L T R
Priority 1U 1 2 3 4U 4 5 6 7 8 9 10 11 12
Number of Lanes 0 0 2 0 0 0 2 0 0 0 0 0 1 0
Configuration LT T T TR LR
Volume, V (veh/h) 3 507 592 11 11 11
Percent Heavy Vehicles (%) 3 3 3
Proportion Time Blocked
Percent Grade (%) 0
Right Turn Channelized No No No No
Median Type/Storage Undivided
Critical and Follow-up HeadwaysBase Critical Headway (sec) 4.1 7.5 6.9
Critical Headway (sec) 4.16 6.86 6.96
Base Follow-Up Headway (sec) 2.2 3.5 3.3
Follow-Up Headway (sec) 2.23 3.53 3.33
Delay, Queue Length, and Level of ServiceFlow Rate, v (veh/h) 3 24
Capacity, c (veh/h) 921 377
v/c Ratio 0.00 0.06
95% Queue Length, Q₉₅ (veh) 0.0 0.2
Control Delay (s/veh) 8.9 15.2
Level of Service, LOS A C
Approach Delay (s/veh) 0.1 15.2
Approach LOS C
Copyright © 2017 University of Florida. All Rights Reserved. HCS7™ TWSC Version 7.2 Generated: 5/23/2017 3:05:51 PMAM EX Glenmore.xtw
Page 96
HCS7 Two-Way Stop-Control Report
General Information Site InformationAnalyst ABC Intersection Dover Center & Westown
Agency/Co. TMS Engineers, Inc. Jurisdiction Westlake, OH
Date Performed 5/19/2017 East/West Street Westown Boulevard
Analysis Year 2017 North/South Street Dover Center Road
Time Analyzed PM Peak Peak Hour Factor 0.92
Intersection Orientation North-South Analysis Time Period (hrs) 0.25
Project Description Existing Conditions
Lanes
Major Street: North-South
Vehicle Volumes and AdjustmentsApproach Eastbound Westbound Northbound Southbound
Movement U L T R U L T R U L T R U L T R
Priority 10 11 12 7 8 9 1U 1 2 3 4U 4 5 6
Number of Lanes 0 1 0 0 0 0 0 0 1 0 0 0 1 0
Configuration LR LT TR
Volume, V (veh/h) 35 18 13 454 390 20
Percent Heavy Vehicles (%) 3 3 3
Proportion Time Blocked
Percent Grade (%) 0
Right Turn Channelized No No No No
Median Type/Storage Undivided
Critical and Follow-up HeadwaysBase Critical Headway (sec) 7.1 6.2 4.1
Critical Headway (sec) 6.43 6.23 4.13
Base Follow-Up Headway (sec) 3.5 3.3 2.2
Follow-Up Headway (sec) 3.53 3.33 2.23
Delay, Queue Length, and Level of ServiceFlow Rate, v (veh/h) 58 14
Capacity, c (veh/h) 429 1108
v/c Ratio 0.14 0.01
95% Queue Length, Q₉₅ (veh) 0.5 0.0
Control Delay (s/veh) 14.7 8.3
Level of Service, LOS B A
Approach Delay (s/veh) 14.7 0.4
Approach LOS B
Copyright © 2017 University of Florida. All Rights Reserved. HCS7™ TWSC Version 7.2 Generated: 5/23/2017 3:07:20 PMPM EX Westown.xtw
Page 97
Traffic Impact Study Westlake Elementary School, Westlake, Ohio
AppendixD
No‐BuildCapacityAnalysisWorksheets‐2019
June 5, 2017 TMS Engineers, Inc.
Page 98
HCS7 Signalized Intersection Results Summary
General Information Intersection Information
Agency TMS Engineers, Inc. Duration, h 0.25
Analyst ABC Analysis Date May 19, 2017 Area Type Other
Jurisdiction Westlake, OH Time Period AM Peak PHF 0.92
Urban Street Center Ridge Analysis Year 2019 Analysis Period 1> 7:00
Intersection @ Dover Center File Name AM 19NB CenterDover.xus
Project Description No-Build Conditions
Demand Information EB WB NB SB
Approach Movement L T R L T R L T R L T R
Demand ( v ), veh/h 190 680 60 90 380 250 120 370 130 170 310 80
Signal Information
GreenYellowRed
7.0 30.1 7.0 35.9 0.0 0.03.6 3.6 3.6 3.6 0.0 0.01.4 1.4 1.4 1.4 0.0 0.0
1 2 4
5 6 7
Cycle, s 100.0 Reference Phase 2
Offset, s 0 Reference Point End
Uncoordinated No Simult. Gap E/W On
Force Mode Fixed Simult. Gap N/S On
Timer Results EBL EBT WBL WBT NBL NBT SBL SBT
Assigned Phase 5 2 1 6 3 8 7 4
Case Number 1.1 4.0 1.1 4.0 1.1 4.0 1.1 4.0
Phase Duration, s 12.0 35.1 12.0 35.1 12.0 40.9 12.0 40.9
Change Period, ( Y+R c ), s 5.0 5.0 5.0 5.0 5.0 5.0 5.0 5.0
Max Allow Headway ( MAH ), s 3.1 0.0 3.1 0.0 3.1 3.1 3.1 3.1
Queue Clearance Time ( g s ), s 9.0 5.7 6.5 30.0 8.6 21.7
Green Extension Time ( g e ), s 0.0 0.0 0.0 0.0 0.0 1.3 0.0 1.9
Phase Call Probability 1.00 1.00 1.00 1.00 1.00 1.00
Max Out Probability 1.00 1.00 1.00 0.39 1.00 0.02
Movement Group Results EB WB NB SB
Approach Movement L T R L T R L T R L T R
Assigned Movement 5 2 12 1 6 16 3 8 18 7 4 14
Adjusted Flow Rate ( v ), veh/h 207 408 396 98 365 320 130 543 185 424
Adjusted Saturation Flow Rate ( s ), veh/h/ln 1781 1870 1817 1767 1856 1610 1781 1787 1781 1804
Queue Service Time ( g s ), s 7.0 19.5 19.5 3.7 17.1 17.4 4.5 28.0 6.6 19.7
Cycle Queue Clearance Time ( g c ), s 7.0 19.5 19.5 3.7 17.1 17.4 4.5 28.0 6.6 19.7
Green Ratio ( g/C ) 0.37 0.30 0.30 0.37 0.30 0.30 0.43 0.36 0.43 0.36
Capacity ( c ), veh/h 278 563 547 253 559 484 334 641 247 648
Volume-to-Capacity Ratio ( X ) 0.743 0.724 0.725 0.386 0.653 0.661 0.391 0.847 0.747 0.655
Back of Queue ( Q ), ft/ln ( 85 th percentile) 156 329.6 317.6 69.5 289.3 256.9 81.6 432.2 132.9 292.6
Back of Queue ( Q ), veh/ln ( 85 th percentile) 6.1 13.0 12.7 2.7 11.3 10.3 3.2 17.0 5.2 11.5
Queue Storage Ratio ( RQ ) ( 85 th percentile) 1.04 0.00 0.00 0.46 0.00 0.00 0.47 0.00 0.41 0.00
Uniform Delay ( d 1 ), s/veh 27.6 31.2 31.3 23.7 30.4 30.5 20.3 29.5 23.8 26.9
Incremental Delay ( d 2 ), s/veh 9.1 7.9 8.1 0.4 5.8 6.9 0.3 9.8 10.5 1.9
Initial Queue Delay ( d 3 ), s/veh 0.0 0.0 0.0 0.0 0.0 0.0 0.0 0.0 0.0 0.0
Control Delay ( d ), s/veh 36.7 39.1 39.4 24.0 36.3 37.4 20.6 39.3 34.3 28.8
Level of Service (LOS) D D D C D D C D C C
Approach Delay, s/veh / LOS 38.8 D 35.2 D 35.7 D 30.4 C
Intersection Delay, s/veh / LOS 35.5 D
Multimodal Results EB WB NB SB
Pedestrian LOS Score / LOS 2.3 B 2.3 B 2.8 C 2.8 C
Bicycle LOS Score / LOS 1.3 A 1.1 A 1.6 B 1.5 A
Copyright © 2017 University of Florida, All Rights Reserved. HCS7™ Streets Version 7.2 Generated: 5/23/2017 3:13:30 PM
Page 99
HCS7 Two-Way Stop-Control Report
General Information Site InformationAnalyst ABC Intersection Center Ridge & Glenmore
Agency/Co. TMS Engineers, Inc. Jurisdiction Westlake, OH
Date Performed 5/19/2017 East/West Street Center Ridge Road
Analysis Year 2019 North/South Street Glenmore Drive
Time Analyzed AM Peak Peak Hour Factor 0.92
Intersection Orientation East-West Analysis Time Period (hrs) 0.25
Project Description No-Build Conditions
Lanes
Major Street: East-West
Vehicle Volumes and AdjustmentsApproach Eastbound Westbound Northbound Southbound
Movement U L T R U L T R U L T R U L T R
Priority 1U 1 2 3 4U 4 5 6 7 8 9 10 11 12
Number of Lanes 0 0 2 0 0 0 2 0 0 0 0 0 1 0
Configuration LT T T TR LR
Volume, V (veh/h) 10 950 520 30 30 10
Percent Heavy Vehicles (%) 3 3 3
Proportion Time Blocked
Percent Grade (%) 0
Right Turn Channelized No No No No
Median Type/Storage Undivided
Critical and Follow-up HeadwaysBase Critical Headway (sec) 4.1 7.5 6.9
Critical Headway (sec) 4.16 6.86 6.96
Base Follow-Up Headway (sec) 2.2 3.5 3.3
Follow-Up Headway (sec) 2.23 3.53 3.33
Delay, Queue Length, and Level of ServiceFlow Rate, v (veh/h) 11 44
Capacity, c (veh/h) 968 240
v/c Ratio 0.01 0.18
95% Queue Length, Q₉₅ (veh) 0.0 0.7
Control Delay (s/veh) 8.8 23.4
Level of Service, LOS A C
Approach Delay (s/veh) 0.2 23.4
Approach LOS C
Copyright © 2017 University of Florida. All Rights Reserved. HCS7™ TWSC Version 7.2 Generated: 5/23/2017 3:13:12 PMAM 19NB Glenmore.xtw
Page 100
HCS7 Two-Way Stop-Control Report
General Information Site InformationAnalyst ABC Intersection Dover Center & Westown
Agency/Co. TMS Engineers, Inc. Jurisdiction Westlake, OH
Date Performed 5/19/2017 East/West Street Westown Boulevard
Analysis Year 2019 North/South Street Dover Center Road
Time Analyzed AM Peak Peak Hour Factor 0.92
Intersection Orientation North-South Analysis Time Period (hrs) 0.25
Project Description No-Build Conditions
Lanes
Major Street: North-South
Vehicle Volumes and AdjustmentsApproach Eastbound Westbound Northbound Southbound
Movement U L T R U L T R U L T R U L T R
Priority 10 11 12 7 8 9 1U 1 2 3 4U 4 5 6
Number of Lanes 0 1 0 0 0 0 0 0 1 0 0 0 1 0
Configuration LR LT TR
Volume, V (veh/h) 70 30 10 530 370 30
Percent Heavy Vehicles (%) 3 3 3
Proportion Time Blocked
Percent Grade (%) 0
Right Turn Channelized No No No No
Median Type/Storage Undivided
Critical and Follow-up HeadwaysBase Critical Headway (sec)
Critical Headway (sec)
Base Follow-Up Headway (sec)
Follow-Up Headway (sec)
Delay, Queue Length, and Level of ServiceFlow Rate, v (veh/h) 109 11
Capacity, c (veh/h) 373 1118
v/c Ratio 0.29 0.01
95% Queue Length, Q₉₅ (veh) 1.2 0.0
Control Delay (s/veh) 18.6 8.3
Level of Service, LOS C A
Approach Delay (s/veh) 18.6 0.3
Approach LOS C
Copyright © 2017 University of Florida. All Rights Reserved. HCS7™ TWSC Version 7.2 Generated: 5/23/2017 3:14:36 PMAM 19NB Westown.xtw
Page 101
HCS7 Signalized Intersection Results Summary
General Information Intersection Information
Agency TMS Engineers, Inc. Duration, h 0.25
Analyst ABC Analysis Date May 19, 2017 Area Type Other
Jurisdiction Westlake, OH Time Period PM Peak PHF 0.92
Urban Street Center Ridge Analysis Year 2019 Analysis Period 1> 7:00
Intersection @ Dover Center File Name PM 19NB CenterDover.xus
Project Description No-Build Conditions
Demand Information EB WB NB SB
Approach Movement L T R L T R L T R L T R
Demand ( v ), veh/h 120 400 90 80 400 100 150 300 90 120 290 120
Signal Information
GreenYellowRed
7.0 30.9 7.0 35.1 0.0 0.03.6 3.6 3.6 3.6 0.0 0.01.4 1.4 1.4 1.4 0.0 0.0
1 2 4
5 6 7
Cycle, s 100.0 Reference Phase 2
Offset, s 0 Reference Point End
Uncoordinated No Simult. Gap E/W On
Force Mode Fixed Simult. Gap N/S On
Timer Results EBL EBT WBL WBT NBL NBT SBL SBT
Assigned Phase 5 2 1 6 3 8 7 4
Case Number 1.1 4.0 1.1 4.0 1.1 4.0 1.1 4.0
Phase Duration, s 12.0 35.9 12.0 35.9 12.0 40.1 12.0 40.1
Change Period, ( Y+R c ), s 5.0 5.0 5.0 5.0 5.0 5.0 5.0 5.0
Max Allow Headway ( MAH ), s 3.1 0.0 3.1 0.0 3.1 3.1 3.1 3.1
Queue Clearance Time ( g s ), s 6.9 5.2 7.8 22.1 6.6 23.7
Green Extension Time ( g e ), s 0.0 0.0 0.0 0.0 0.0 1.6 0.0 1.6
Phase Call Probability 1.00 1.00 1.00 1.00 1.00 1.00
Max Out Probability 1.00 1.00 1.00 0.02 1.00 0.04
Movement Group Results EB WB NB SB
Approach Movement L T R L T R L T R L T R
Assigned Movement 5 2 12 1 6 16 3 8 18 7 4 14
Adjusted Flow Rate ( v ), veh/h 130 273 259 87 280 264 163 424 130 446
Adjusted Saturation Flow Rate ( s ), veh/h/ln 1781 1870 1751 1767 1856 1727 1781 1796 1781 1777
Queue Service Time ( g s ), s 4.9 11.8 12.0 3.2 12.3 12.5 5.8 20.1 4.6 21.7
Cycle Queue Clearance Time ( g c ), s 4.9 11.8 12.0 3.2 12.3 12.5 5.8 20.1 4.6 21.7
Green Ratio ( g/C ) 0.38 0.31 0.31 0.38 0.31 0.31 0.42 0.35 0.42 0.35
Capacity ( c ), veh/h 339 578 541 342 573 534 304 630 322 624
Volume-to-Capacity Ratio ( X ) 0.385 0.473 0.479 0.254 0.488 0.494 0.536 0.673 0.405 0.715
Back of Queue ( Q ), ft/ln ( 85 th percentile) 88.4 204.7 193.9 60 211.6 198.3 102 298 82.8 321
Back of Queue ( Q ), veh/ln ( 85 th percentile) 3.5 8.1 7.8 2.3 8.3 7.9 4.0 11.7 3.3 12.6
Queue Storage Ratio ( RQ ) ( 85 th percentile) 0.59 0.00 0.00 0.40 0.00 0.00 0.58 0.00 0.25 0.00
Uniform Delay ( d 1 ), s/veh 22.0 28.0 28.0 21.4 28.1 28.2 21.9 27.6 20.9 28.1
Incremental Delay ( d 2 ), s/veh 0.3 2.8 3.0 0.1 3.0 3.2 1.0 2.3 0.3 3.3
Initial Queue Delay ( d 3 ), s/veh 0.0 0.0 0.0 0.0 0.0 0.0 0.0 0.0 0.0 0.0
Control Delay ( d ), s/veh 22.3 30.7 31.0 21.5 31.1 31.4 22.9 29.9 21.2 31.5
Level of Service (LOS) C C C C C C C C C C
Approach Delay, s/veh / LOS 29.2 C 29.9 C 27.9 C 29.1 C
Intersection Delay, s/veh / LOS 29.1 C
Multimodal Results EB WB NB SB
Pedestrian LOS Score / LOS 2.3 B 2.3 B 2.8 C 2.8 C
Bicycle LOS Score / LOS 1.0 A 1.0 A 1.5 A 1.4 A
Copyright © 2017 University of Florida, All Rights Reserved. HCS7™ Streets Version 7.2 Generated: 5/23/2017 3:14:54 PM
Page 102
HCS7 Two-Way Stop-Control Report
General Information Site InformationAnalyst ABC Intersection Center Ridge & Glenmore
Agency/Co. TMS Engineers, Inc. Jurisdiction Westlake, OH
Date Performed 5/19/2017 East/West Street Center Ridge Road
Analysis Year 2019 North/South Street Glenmore Drive
Time Analyzed PM Peak Peak Hour Factor 0.92
Intersection Orientation East-West Analysis Time Period (hrs) 0.25
Project Description No-Build Conditions
Lanes
Major Street: East-West
Vehicle Volumes and AdjustmentsApproach Eastbound Westbound Northbound Southbound
Movement U L T R U L T R U L T R U L T R
Priority 1U 1 2 3 4U 4 5 6 7 8 9 10 11 12
Number of Lanes 0 0 2 0 0 0 2 0 0 0 0 0 1 0
Configuration LT T T TR LR
Volume, V (veh/h) 10 550 640 10 10 10
Percent Heavy Vehicles (%) 0 3 3
Proportion Time Blocked
Percent Grade (%) 0
Right Turn Channelized No No No No
Median Type/Storage Undivided
Critical and Follow-up HeadwaysBase Critical Headway (sec) 4.1 7.5 6.9
Critical Headway (sec) 4.10 6.86 6.96
Base Follow-Up Headway (sec) 2.2 3.5 3.3
Follow-Up Headway (sec) 2.20 3.53 3.33
Delay, Queue Length, and Level of ServiceFlow Rate, v (veh/h) 11 22
Capacity, c (veh/h) 901 336
v/c Ratio 0.01 0.07
95% Queue Length, Q₉₅ (veh) 0.0 0.2
Control Delay (s/veh) 9.0 16.5
Level of Service, LOS A C
Approach Delay (s/veh) 0.2 16.5
Approach LOS C
Copyright © 2017 University of Florida. All Rights Reserved. HCS7™ TWSC Version 7.2 Generated: 5/23/2017 3:17:34 PMPM 19NB Glenmore.xtw
Page 103
HCS7 Two-Way Stop-Control Report
General Information Site InformationAnalyst ABC Intersection Dover Center & Westown
Agency/Co. TMS Engineers, Inc. Jurisdiction Westlake, OH
Date Performed 5/19/2017 East/West Street Westown Boulevard
Analysis Year 2019 North/South Street Dover Center Road
Time Analyzed PM Peak Peak Hour Factor 0.92
Intersection Orientation North-South Analysis Time Period (hrs) 0.25
Project Description No-Build Conditions
Lanes
Major Street: North-South
Vehicle Volumes and AdjustmentsApproach Eastbound Westbound Northbound Southbound
Movement U L T R U L T R U L T R U L T R
Priority 10 11 12 7 8 9 1U 1 2 3 4U 4 5 6
Number of Lanes 0 1 0 0 0 0 0 0 1 0 0 0 1 0
Configuration LR LT TR
Volume, V (veh/h) 40 20 10 510 430 20
Percent Heavy Vehicles (%) 3 3 3
Proportion Time Blocked
Percent Grade (%) 0
Right Turn Channelized No No No No
Median Type/Storage Undivided
Critical and Follow-up HeadwaysBase Critical Headway (sec)
Critical Headway (sec)
Base Follow-Up Headway (sec)
Follow-Up Headway (sec)
Delay, Queue Length, and Level of ServiceFlow Rate, v (veh/h) 65 11
Capacity, c (veh/h) 373 1068
v/c Ratio 0.17 0.01
95% Queue Length, Q₉₅ (veh) 0.6 0.0
Control Delay (s/veh) 16.7 8.4
Level of Service, LOS C A
Approach Delay (s/veh) 16.7 0.3
Approach LOS C
Copyright © 2017 University of Florida. All Rights Reserved. HCS7™ TWSC Version 7.2 Generated: 5/23/2017 3:18:25 PMPM 19NB Westown.xtw
Page 104
Traffic Impact Study Westlake Elementary School, Westlake, Ohio
AppendixE
No‐BuildCapacityAnalysisWorksheets‐2039
June 5, 2017 TMS Engineers, Inc.
Page 105
HCS7 Signalized Intersection Results Summary
General Information Intersection Information
Agency TMS Engineers, Inc. Duration, h 0.25
Analyst ABC Analysis Date May 19, 2017 Area Type Other
Jurisdiction Westlake, OH Time Period AM Peak PHF 0.92
Urban Street Center Ridge Analysis Year 2039 Analysis Period 1> 7:00
Intersection @ Dover Center File Name AM 39NB CenterDover.xus
Project Description No-Build Conditions
Demand Information EB WB NB SB
Approach Movement L T R L T R L T R L T R
Demand ( v ), veh/h 230 820 70 110 450 300 140 440 150 200 370 100
Signal Information
GreenYellowRed
7.0 3.0 25.3 7.0 1.9 35.83.6 0.0 3.6 3.6 0.0 3.61.4 0.0 1.4 1.4 0.0 1.4
1 2 4
5 6 7
Cycle, s 100.0 Reference Phase 2
Offset, s 0 Reference Point End
Uncoordinated No Simult. Gap E/W On
Force Mode Fixed Simult. Gap N/S On
Timer Results EBL EBT WBL WBT NBL NBT SBL SBT
Assigned Phase 5 2 1 6 3 8 7 4
Case Number 1.1 4.0 1.1 4.0 1.1 4.0 1.1 4.0
Phase Duration, s 15.0 33.3 12.0 30.3 12.0 40.8 13.9 42.7
Change Period, ( Y+R c ), s 5.0 5.0 5.0 5.0 5.0 5.0 5.0 5.0
Max Allow Headway ( MAH ), s 3.1 0.0 3.1 0.0 3.1 3.1 3.1 3.1
Queue Clearance Time ( g s ), s 12.0 6.9 7.3 37.8 10.1 26.7
Green Extension Time ( g e ), s 0.0 0.0 0.0 0.0 0.0 0.0 0.0 2.2
Phase Call Probability 1.00 1.00 1.00 1.00 1.00 1.00
Max Out Probability 1.00 1.00 1.00 1.00 1.00 0.11
Movement Group Results EB WB NB SB
Approach Movement L T R L T R L T R L T R
Assigned Movement 5 2 12 1 6 16 3 8 18 7 4 14
Adjusted Flow Rate ( v ), veh/h 250 491 477 120 436 379 152 641 217 511
Adjusted Saturation Flow Rate ( s ), veh/h/ln 1781 1870 1818 1767 1856 1607 1781 1789 1781 1801
Queue Service Time ( g s ), s 10.0 25.5 25.5 4.9 23.0 23.1 5.3 35.8 8.1 24.7
Cycle Queue Clearance Time ( g c ), s 10.0 25.5 25.5 4.9 23.0 23.1 5.3 35.8 8.1 24.7
Green Ratio ( g/C ) 0.35 0.28 0.28 0.32 0.25 0.25 0.43 0.36 0.45 0.38
Capacity ( c ), veh/h 265 529 515 200 469 407 295 640 231 679
Volume-to-Capacity Ratio ( X ) 0.943 0.927 0.927 0.597 0.929 0.932 0.516 1.002 0.943 0.752
Back of Queue ( Q ), ft/ln ( 85 th percentile) 254.3 477.8 460.5 95.5 446.6 395.9 94.2 658.1 281.6 364.9
Back of Queue ( Q ), veh/ln ( 85 th percentile) 10.0 18.8 18.4 3.7 17.4 15.8 3.7 25.9 11.1 14.4
Queue Storage Ratio ( RQ ) ( 85 th percentile) 1.70 0.00 0.00 0.64 0.00 0.00 0.54 0.00 0.87 0.00
Uniform Delay ( d 1 ), s/veh 28.3 34.8 34.8 27.8 36.5 36.5 21.6 32.1 25.5 27.1
Incremental Delay ( d 2 ), s/veh 39.5 24.6 25.1 3.4 27.2 30.5 0.7 36.0 43.1 4.2
Initial Queue Delay ( d 3 ), s/veh 0.0 0.0 0.0 0.0 0.0 0.0 0.0 0.0 0.0 0.0
Control Delay ( d ), s/veh 67.9 59.5 60.0 31.1 63.6 67.0 22.3 68.1 68.6 31.3
Level of Service (LOS) E E E C E E C F E C
Approach Delay, s/veh / LOS 61.4 E 60.8 E 59.3 E 42.5 D
Intersection Delay, s/veh / LOS 57.0 E
Multimodal Results EB WB NB SB
Pedestrian LOS Score / LOS 2.3 B 2.3 B 2.8 C 2.8 C
Bicycle LOS Score / LOS 1.5 A 1.3 A 1.8 B 1.7 B
Copyright © 2017 University of Florida, All Rights Reserved. HCS7™ Streets Version 7.2 Generated: 5/23/2017 3:21:46 PM
Page 106
HCS7 Two-Way Stop-Control Report
General Information Site InformationAnalyst ABC Intersection Center Ridge & Glenmore
Agency/Co. TMS Engineers, Inc. Jurisdiction Westlake, OH
Date Performed 5/19/2017 East/West Street Center Ridge Road
Analysis Year 2039 North/South Street Glenmore Drive
Time Analyzed AM Peak Peak Hour Factor 0.92
Intersection Orientation East-West Analysis Time Period (hrs) 0.25
Project Description No-Build Conditions
Lanes
Major Street: East-West
Vehicle Volumes and AdjustmentsApproach Eastbound Westbound Northbound Southbound
Movement U L T R U L T R U L T R U L T R
Priority 1U 1 2 3 4U 4 5 6 7 8 9 10 11 12
Number of Lanes 0 0 2 0 0 0 2 0 0 0 0 0 1 0
Configuration LT T T TR LR
Volume, V (veh/h) 10 1140 630 30 30 10
Percent Heavy Vehicles (%) 3 3 3
Proportion Time Blocked
Percent Grade (%) 0
Right Turn Channelized No No No No
Median Type/Storage Undivided
Critical and Follow-up HeadwaysBase Critical Headway (sec) 4.1 7.5 6.9
Critical Headway (sec) 4.16 6.86 6.96
Base Follow-Up Headway (sec) 2.2 3.5 3.3
Follow-Up Headway (sec) 2.23 3.53 3.33
Delay, Queue Length, and Level of ServiceFlow Rate, v (veh/h) 11 44
Capacity, c (veh/h) 872 174
v/c Ratio 0.01 0.25
95% Queue Length, Q₉₅ (veh) 0.0 1.0
Control Delay (s/veh) 9.2 32.5
Level of Service, LOS A D
Approach Delay (s/veh) 0.3 32.5
Approach LOS D
Copyright © 2017 University of Florida. All Rights Reserved. HCS7™ TWSC Version 7.2 Generated: 5/23/2017 3:34:51 PMAM 39NB Glenmore.xtw
Page 107
HCS7 Two-Way Stop-Control ReportGeneral Information Site Information
Analyst ABC Intersection Dover Center & Westown
Agency/Co. TMS Engineers, Inc. Jurisdiction Westlake, OH
Date Performed 5/19/2017 East/West Street Westown Boulevard
Analysis Year 2039 North/South Street Dover Center Road
Time Analyzed AM Peak Peak Hour Factor 0.92
Intersection Orientation North-South Analysis Time Period (hrs) 0.25
Project Description No-Build Conditions
Lanes
Major Street: North-South
Vehicle Volumes and AdjustmentsApproach Eastbound Westbound Northbound Southbound
Movement U L T R U L T R U L T R U L T R
Priority 10 11 12 7 8 9 1U 1 2 3 4U 4 5 6
Number of Lanes 0 1 0 0 0 0 0 0 1 0 0 0 1 0
Configuration LR LT TR
Volume, V (veh/h) 70 30 10 640 440 30
Percent Heavy Vehicles (%) 3 3 3
Proportion Time Blocked
Percent Grade (%) 0
Right Turn Channelized No No No No
Median Type/Storage Undivided
Critical and Follow-up HeadwaysBase Critical Headway (sec)
Critical Headway (sec)
Base Follow-Up Headway (sec)
Follow-Up Headway (sec)
Delay, Queue Length, and Level of ServiceFlow Rate, v (veh/h) 109 11
Capacity, c (veh/h) 247 1048
v/c Ratio 0.44 0.01
95% Queue Length, Q₉₅ (veh) 2.1 0.0
Control Delay (s/veh) 30.6 8.5
Level of Service, LOS D A
Approach Delay (s/veh) 30.6 0.3
Approach LOS D
Copyright © 2017 University of Florida. All Rights Reserved. HCS7™ TWSC Version 7.2.1 Generated: 5/31/2017 11:33:56 AMAM 39NB Westown.xtw
Page 108
HCS7 Signalized Intersection Results Summary
General Information Intersection Information
Agency TMS Engineers, Inc. Duration, h 0.25
Analyst ABC Analysis Date May 19, 2017 Area Type Other
Jurisdiction Westlake, OH Time Period PM Peak PHF 0.92
Urban Street Center Ridge Analysis Year 2039 Analysis Period 1> 7:00
Intersection @ Dover Center File Name PM 39NB CenterDover.xus
Project Description No-Build Conditions
Demand Information EB WB NB SB
Approach Movement L T R L T R L T R L T R
Demand ( v ), veh/h 140 480 110 100 480 120 180 360 110 140 340 140
Signal Information
GreenYellowRed
7.0 29.7 7.0 36.3 0.0 0.03.6 3.6 3.6 3.6 0.0 0.01.4 1.4 1.4 1.4 0.0 0.0
1 2 4
5 6 7
Cycle, s 100.0 Reference Phase 2
Offset, s 0 Reference Point End
Uncoordinated No Simult. Gap E/W On
Force Mode Fixed Simult. Gap N/S On
Timer Results EBL EBT WBL WBT NBL NBT SBL SBT
Assigned Phase 5 2 1 6 3 8 7 4
Case Number 1.1 4.0 1.1 4.0 1.1 4.0 1.1 4.0
Phase Duration, s 12.0 34.7 12.0 34.7 12.0 41.3 12.0 41.3
Change Period, ( Y+R c ), s 5.0 5.0 5.0 5.0 5.0 5.0 5.0 5.0
Max Allow Headway ( MAH ), s 3.1 0.0 3.1 0.0 3.1 3.1 3.1 3.1
Queue Clearance Time ( g s ), s 7.9 6.1 9.0 27.3 7.3 28.5
Green Extension Time ( g e ), s 0.0 0.0 0.0 0.0 0.0 1.8 0.0 1.7
Phase Call Probability 1.00 1.00 1.00 1.00 1.00 1.00
Max Out Probability 1.00 1.00 1.00 0.16 1.00 0.22
Movement Group Results EB WB NB SB
Approach Movement L T R L T R L T R L T R
Assigned Movement 5 2 12 1 6 16 3 8 18 7 4 14
Adjusted Flow Rate ( v ), veh/h 152 330 311 109 337 316 196 511 152 522
Adjusted Saturation Flow Rate ( s ), veh/h/ln 1781 1870 1749 1767 1856 1727 1781 1795 1781 1777
Queue Service Time ( g s ), s 5.9 15.1 15.2 4.1 15.6 15.7 7.0 25.3 5.3 26.5
Cycle Queue Clearance Time ( g c ), s 5.9 15.1 15.2 4.1 15.6 15.7 7.0 25.3 5.3 26.5
Green Ratio ( g/C ) 0.37 0.30 0.30 0.37 0.30 0.30 0.43 0.36 0.43 0.36
Capacity ( c ), veh/h 290 555 520 293 551 513 266 652 294 645
Volume-to-Capacity Ratio ( X ) 0.524 0.594 0.599 0.371 0.611 0.615 0.737 0.784 0.517 0.809
Back of Queue ( Q ), ft/ln ( 85 th percentile) 104.1 256.5 241.7 78 265 247.2 138 379.8 93.6 397.3
Back of Queue ( Q ), veh/ln ( 85 th percentile) 4.1 10.1 9.7 3.0 10.4 9.9 5.4 15.0 3.7 15.6
Queue Storage Ratio ( RQ ) ( 85 th percentile) 0.69 0.00 0.00 0.52 0.00 0.00 0.79 0.00 0.29 0.00
Uniform Delay ( d 1 ), s/veh 23.9 30.0 30.1 23.1 30.2 30.2 23.3 28.4 21.5 28.7
Incremental Delay ( d 2 ), s/veh 0.9 4.6 5.0 0.3 5.0 5.4 9.1 5.7 0.7 7.1
Initial Queue Delay ( d 3 ), s/veh 0.0 0.0 0.0 0.0 0.0 0.0 0.0 0.0 0.0 0.0
Control Delay ( d ), s/veh 24.7 34.6 35.1 23.4 35.2 35.7 32.4 34.1 22.2 35.8
Level of Service (LOS) C C D C D D C C C D
Approach Delay, s/veh / LOS 32.9 C 33.7 C 33.6 C 32.7 C
Intersection Delay, s/veh / LOS 33.2 C
Multimodal Results EB WB NB SB
Pedestrian LOS Score / LOS 2.3 B 2.3 B 2.8 C 2.8 C
Bicycle LOS Score / LOS 1.1 A 1.1 A 1.7 B 1.6 B
Copyright © 2017 University of Florida, All Rights Reserved. HCS7™ Streets Version 7.2 Generated: 5/23/2017 3:39:12 PM
Page 109
HCS7 Two-Way Stop-Control Report
General Information Site InformationAnalyst ABC Intersection Center Ridge & Glenmore
Agency/Co. TMS Engineers, Inc. Jurisdiction Westlake, OH
Date Performed 5/19/2017 East/West Street Center Ridge Road
Analysis Year 2039 North/South Street Glenmore Drive
Time Analyzed PM Peak Peak Hour Factor 0.92
Intersection Orientation East-West Analysis Time Period (hrs) 0.25
Project Description No-Build Conditions
Lanes
Major Street: East-West
Vehicle Volumes and AdjustmentsApproach Eastbound Westbound Northbound Southbound
Movement U L T R U L T R U L T R U L T R
Priority 1U 1 2 3 4U 4 5 6 7 8 9 10 11 12
Number of Lanes 0 0 2 0 0 0 2 0 0 0 0 0 1 0
Configuration LT T T TR LR
Volume, V (veh/h) 10 660 770 10 10 10
Percent Heavy Vehicles (%) 0 3 3
Proportion Time Blocked
Percent Grade (%) 0
Right Turn Channelized No No No No
Median Type/Storage Undivided
Critical and Follow-up HeadwaysBase Critical Headway (sec)
Critical Headway (sec)
Base Follow-Up Headway (sec)
Follow-Up Headway (sec)
Delay, Queue Length, and Level of ServiceFlow Rate, v (veh/h) 11 22
Capacity, c (veh/h) 798 260
v/c Ratio 0.01 0.08
95% Queue Length, Q₉₅ (veh) 0.0 0.3
Control Delay (s/veh) 9.6 20.1
Level of Service, LOS A C
Approach Delay (s/veh) 0.2 20.1
Approach LOS C
Copyright © 2017 University of Florida. All Rights Reserved. HCS7™ TWSC Version 7.2 Generated: 5/23/2017 3:38:54 PMPM 19NB Glenmore.xtw
Page 110
HCS7 Two-Way Stop-Control ReportGeneral Information Site Information
Analyst ABC Intersection Dover Center & Westown
Agency/Co. TMS Engineers, Inc. Jurisdiction Westlake, OH
Date Performed 5/19/2017 East/West Street Westown Boulevard
Analysis Year 2039 North/South Street Dover Center Road
Time Analyzed PM Peak Peak Hour Factor 0.92
Intersection Orientation North-South Analysis Time Period (hrs) 0.25
Project Description No-Build Conditions
Lanes
Major Street: North-South
Vehicle Volumes and AdjustmentsApproach Eastbound Westbound Northbound Southbound
Movement U L T R U L T R U L T R U L T R
Priority 10 11 12 7 8 9 1U 1 2 3 4U 4 5 6
Number of Lanes 0 1 0 0 0 0 0 0 1 0 0 0 1 0
Configuration LR LT TR
Volume, V (veh/h) 40 20 10 600 520 20
Percent Heavy Vehicles (%) 3 3 3
Proportion Time Blocked
Percent Grade (%) 0
Right Turn Channelized No No No No
Median Type/Storage Undivided
Critical and Follow-up HeadwaysBase Critical Headway (sec)
Critical Headway (sec)
Base Follow-Up Headway (sec)
Follow-Up Headway (sec)
Delay, Queue Length, and Level of ServiceFlow Rate, v (veh/h) 65 11
Capacity, c (veh/h) 239 982
v/c Ratio 0.27 0.01
95% Queue Length, Q₉₅ (veh) 1.1 0.0
Control Delay (s/veh) 25.6 8.7
Level of Service, LOS D A
Approach Delay (s/veh) 25.6 0.3
Approach LOS D
Copyright © 2017 University of Florida. All Rights Reserved. HCS7™ TWSC Version 7.2.1 Generated: 5/31/2017 11:34:29 AMPM 39NB Westown.xtw
Page 111
Traffic Impact Study Westlake Elementary School, Westlake, Ohio
AppendixF
No‐BuildCapacityAnalysisWorksheets‐2039w/Improvements
June 5, 2017 TMS Engineers, Inc.
Page 112
HCS7 Signalized Intersection Results Summary
General Information Intersection InformationAgency TMS Engineers, Inc. Duration, h 0.25Analyst ABC Analysis Date May 19, 2017 Area Type OtherJurisdiction Westlake, OH Time Period AM Peak PHF 0.92Urban Street Center Ridge Analysis Year 2039 Analysis Period 1> 7:00Intersection @ Dover Center File Name AM 39NB CenterDover-WBNB RTL.xusProject Description WB & NB RTL
Demand Information EB WB NB SBApproach Movement L T R L T R L T R L T RDemand ( v ), veh/h 230 820 70 110 450 300 140 440 150 200 370 100
Signal Information
GreenYellowRed
7.0 32.7 7.0 0.1 33.2 0.03.6 3.6 3.6 0.0 3.6 0.01.4 1.4 1.4 0.0 1.4 0.0
1 2 3 4
5 6 7 8
Cycle, s 100.0 Reference Phase 2Offset, s 0 Reference Point EndUncoordinated No Simult. Gap E/W OnForce Mode Fixed Simult. Gap N/S On
Timer Results EBL EBT WBL WBT NBL NBT SBL SBTAssigned Phase 5 2 1 6 3 8 7 4Case Number 1.1 4.0 1.1 3.0 1.1 3.0 1.1 4.0Phase Duration, s 12.0 37.7 12.0 37.7 12.0 38.2 12.1 38.3Change Period, ( Y+R c ), s 5.0 5.0 5.0 5.0 5.0 5.0 5.0 5.0Max Allow Headway ( MAH ), s 3.1 0.0 3.1 0.0 3.1 3.1 3.1 3.1Queue Clearance Time ( g s ), s 9.0 6.4 7.6 24.9 9.1 28.4Green Extension Time ( g e ), s 0.0 0.0 0.0 0.0 0.0 1.9 0.0 1.4Phase Call Probability 1.00 1.00 1.00 1.00 1.00 1.00Max Out Probability 1.00 1.00 1.00 0.22 1.00 0.59
Movement Group Results EB WB NB SBApproach Movement L T R L T R L T R L T RAssigned Movement 5 2 12 1 6 16 3 8 18 7 4 14Adjusted Flow Rate ( v ), veh/h 250 491 477 120 489 326 152 478 163 217 511Adjusted Saturation Flow Rate ( s ), veh/h/ln 1781 1870 1818 1767 1766 1610 1781 1870 1610 1781 1801Queue Service Time ( g s ), s 7.0 23.9 23.9 4.4 10.8 15.3 5.6 22.9 6.7 7.1 26.4Cycle Queue Clearance Time ( g c ), s 7.0 23.9 23.9 4.4 10.8 15.3 5.6 22.9 6.7 7.1 26.4Green Ratio ( g/C ) 0.40 0.33 0.33 0.40 0.33 0.40 0.40 0.33 0.40 0.40 0.33Capacity ( c ), veh/h 377 612 595 235 1155 641 240 621 647 292 600Volume-to-Capacity Ratio ( X ) 0.663 0.802 0.802 0.509 0.423 0.509 0.633 0.770 0.252 0.743 0.852Back of Queue ( Q ), ft/ln ( 85 th percentile) 94.8 401.1 386.4 81.5 175 215.9 105.6 362.4 102.3 155.5 419.9Back of Queue ( Q ), veh/ln ( 85 th percentile) 3.7 15.8 15.5 3.2 6.8 8.6 4.2 14.3 4.1 6.1 16.5Queue Storage Ratio ( RQ ) ( 85 th percentile) 0.63 0.00 0.00 0.54 0.00 0.00 0.60 0.00 0.00 0.48 0.00Uniform Delay ( d 1 ), s/veh 25.7 30.7 30.7 23.7 26.3 22.7 24.4 30.0 19.9 26.4 31.1Incremental Delay ( d 2 ), s/veh 3.5 10.7 10.9 0.8 1.1 2.9 4.1 5.3 0.1 8.8 10.8Initial Queue Delay ( d 3 ), s/veh 0.0 0.0 0.0 0.0 0.0 0.0 0.0 0.0 0.0 0.0 0.0Control Delay ( d ), s/veh 29.2 41.3 41.6 24.5 27.4 25.6 28.5 35.3 20.0 35.2 41.8Level of Service (LOS) C D D C C C C D B D DApproach Delay, s/veh / LOS 39.0 D 26.4 C 30.8 C 39.8 DIntersection Delay, s/veh / LOS 34.2 C
Multimodal Results EB WB NB SBPedestrian LOS Score / LOS 2.4 B 2.3 B 2.9 C 2.8 CBicycle LOS Score / LOS 1.5 A 1.3 A 1.8 B 1.7 B
Copyright © 2017 University of Florida, All Rights Reserved. HCS7™ Streets Version 7.2.1 Generated: 5/31/2017 11:20:50 AM
Page 113
HCS7 Signalized Intersection Results Summary
General Information Intersection InformationAgency TMS Engineers, Inc. Duration, h 0.25Analyst ABC Analysis Date May 19, 2017 Area Type OtherJurisdiction Westlake, OH Time Period PM Peak PHF 0.92Urban Street Center Ridge Analysis Year 2039 Analysis Period 1> 7:00Intersection @ Dover Center File Name PM 39NB CenterDover-WBNB RTL.xusProject Description WB & NB RTL
Demand Information EB WB NB SBApproach Movement L T R L T R L T R L T RDemand ( v ), veh/h 140 480 110 100 480 120 180 360 110 140 340 140
Signal Information
GreenYellowRed
7.0 29.5 7.0 36.5 0.0 0.03.6 3.6 3.6 3.6 0.0 0.01.4 1.4 1.4 1.4 0.0 0.0
1 2 3 4
5 6 7 8
Cycle, s 100.0 Reference Phase 2Offset, s 0 Reference Point EndUncoordinated No Simult. Gap E/W OnForce Mode Fixed Simult. Gap N/S On
Timer Results EBL EBT WBL WBT NBL NBT SBL SBTAssigned Phase 5 2 1 6 3 8 7 4Case Number 1.1 4.0 1.1 3.0 1.1 3.0 1.1 4.0Phase Duration, s 12.0 34.5 12.0 34.5 12.0 41.5 12.0 41.5Change Period, ( Y+R c ), s 5.0 5.0 5.0 5.0 5.0 5.0 5.0 5.0Max Allow Headway ( MAH ), s 3.1 0.0 3.1 0.0 3.1 3.1 3.1 3.1Queue Clearance Time ( g s ), s 7.9 6.2 9.0 18.8 7.3 28.4Green Extension Time ( g e ), s 0.0 0.0 0.0 0.0 0.0 2.1 0.0 1.6Phase Call Probability 1.00 1.00 1.00 1.00 1.00 1.00Max Out Probability 1.00 1.00 1.00 0.01 1.00 0.20
Movement Group Results EB WB NB SBApproach Movement L T R L T R L T R L T RAssigned Movement 5 2 12 1 6 16 3 8 18 7 4 14Adjusted Flow Rate ( v ), veh/h 152 330 311 109 522 130 196 391 120 152 522Adjusted Saturation Flow Rate ( s ), veh/h/ln 1781 1870 1749 1767 1766 1610 1781 1870 1610 1781 1777Queue Service Time ( g s ), s 5.9 15.1 15.3 4.2 12.2 5.6 7.0 16.8 4.5 5.3 26.4Cycle Queue Clearance Time ( g c ), s 5.9 15.1 15.3 4.2 12.2 5.6 7.0 16.8 4.5 5.3 26.4Green Ratio ( g/C ) 0.36 0.30 0.30 0.36 0.30 0.37 0.44 0.36 0.44 0.44 0.36Capacity ( c ), veh/h 331 552 516 291 1042 588 268 683 700 372 649Volume-to-Capacity Ratio ( X ) 0.459 0.598 0.603 0.373 0.501 0.222 0.730 0.573 0.171 0.409 0.804Back of Queue ( Q ), ft/ln ( 85 th percentile) 103.4 257.7 242.9 78.3 196.5 93.7 134.6 257.7 73.5 92 394.7Back of Queue ( Q ), veh/ln ( 85 th percentile) 4.1 10.1 9.7 3.1 7.7 3.7 5.3 10.1 2.9 3.6 15.5Queue Storage Ratio ( RQ ) ( 85 th percentile) 0.69 0.00 0.00 0.52 0.00 0.00 0.77 0.00 0.00 0.28 0.00Uniform Delay ( d 1 ), s/veh 23.3 30.2 30.2 23.2 29.2 21.9 23.1 25.5 17.2 19.5 28.5Incremental Delay ( d 2 ), s/veh 0.4 4.7 5.1 0.3 1.7 0.9 8.5 0.8 0.0 0.3 6.8Initial Queue Delay ( d 3 ), s/veh 0.0 0.0 0.0 0.0 0.0 0.0 0.0 0.0 0.0 0.0 0.0Control Delay ( d ), s/veh 23.6 34.9 35.4 23.5 30.9 22.8 31.6 26.3 17.3 19.8 35.3Level of Service (LOS) C C D C C C C C B B DApproach Delay, s/veh / LOS 32.9 C 28.4 C 26.2 C 31.8 CIntersection Delay, s/veh / LOS 29.9 C
Multimodal Results EB WB NB SBPedestrian LOS Score / LOS 2.4 B 2.3 B 2.9 C 2.8 CBicycle LOS Score / LOS 1.1 A 1.1 A 1.7 B 1.6 B
Copyright © 2017 University of Florida, All Rights Reserved. HCS7™ Streets Version 7.2.1 Generated: 5/31/2017 11:21:34 AM
Page 114
Traffic Impact Study Westlake Elementary School, Westlake, Ohio
AppendixG
BuildCapacityAnalysisWorksheets‐2019
June 5, 2017 TMS Engineers, Inc.
Page 115
HCS7 Signalized Intersection Results Summary
General Information Intersection Information
Agency TMS Engineers, Inc. Duration, h 0.25
Analyst ABC Analysis Date May 19, 2017 Area Type Other
Jurisdiction Westlake, OH Time Period AM Peak PHF 0.92
Urban Street Center Ridge Analysis Year 2019 Analysis Period 1> 7:00
Intersection @ Dover Center File Name AM 19 CenterDover.xus
Project Description Build Conditions
Demand Information EB WB NB SB
Approach Movement L T R L T R L T R L T R
Demand ( v ), veh/h 287 798 124 98 483 250 212 379 140 170 316 158
Signal Information
GreenYellowRed
7.0 1.1 25.9 7.5 1.2 32.33.6 3.6 3.6 3.6 0.0 3.61.4 1.4 1.4 1.4 0.0 1.4
1 2 4
5 6 7
Cycle, s 100.0 Reference Phase 2
Offset, s 0 Reference Point End
Uncoordinated No Simult. Gap E/W On
Force Mode Fixed Simult. Gap N/S On
Timer Results EBL EBT WBL WBT NBL NBT SBL SBT
Assigned Phase 5 2 1 6 3 8 7 4
Case Number 1.1 4.0 1.1 4.0 1.1 4.0 1.1 4.0
Phase Duration, s 18.1 37.0 12.0 30.9 13.7 38.5 12.5 37.3
Change Period, ( Y+R c ), s 5.0 5.0 5.0 5.0 5.0 5.0 5.0 5.0
Max Allow Headway ( MAH ), s 3.1 0.0 3.1 0.0 3.1 3.1 3.1 3.1
Queue Clearance Time ( g s ), s 14.5 6.3 10.7 33.1 9.0 30.2
Green Extension Time ( g e ), s 0.0 0.0 0.0 0.0 0.0 0.2 0.0 0.7
Phase Call Probability 1.00 1.00 1.00 1.00 1.00 1.00
Max Out Probability 1.00 1.00 1.00 1.00 1.00 1.00
Movement Group Results EB WB NB SB
Approach Movement L T R L T R L T R L T R
Assigned Movement 5 2 12 1 6 16 3 8 18 7 4 14
Adjusted Flow Rate ( v ), veh/h 312 513 489 107 422 375 230 564 185 515
Adjusted Saturation Flow Rate ( s ), veh/h/ln 1781 1870 1782 1753 1856 1641 1767 1770 1781 1751
Queue Service Time ( g s ), s 12.5 25.7 25.7 4.3 21.8 21.9 8.7 31.1 7.0 28.2
Cycle Queue Clearance Time ( g c ), s 12.5 25.7 25.7 4.3 21.8 21.9 8.7 31.1 7.0 28.2
Green Ratio ( g/C ) 0.41 0.32 0.32 0.33 0.26 0.26 0.41 0.34 0.40 0.32
Capacity ( c ), veh/h 332 599 570 218 481 425 261 593 209 565
Volume-to-Capacity Ratio ( X ) 0.938 0.857 0.857 0.488 0.878 0.881 0.881 0.952 0.885 0.911
Back of Queue ( Q ), ft/ln ( 85 th percentile) 360.1 443.5 420.9 86.3 405.3 364.6 270.3 540.9 230.2 469.8
Back of Queue ( Q ), veh/ln ( 85 th percentile) 14.2 17.5 16.8 3.3 15.8 14.6 10.6 21.1 9.1 18.4
Queue Storage Ratio ( RQ ) ( 85 th percentile) 2.40 0.00 0.00 0.58 0.00 0.00 1.54 0.00 0.71 0.00
Uniform Delay ( d 1 ), s/veh 24.8 31.9 31.9 26.8 35.5 35.6 25.2 32.5 25.4 32.5
Incremental Delay ( d 2 ), s/veh 33.2 14.7 15.3 0.6 19.8 22.2 26.7 25.2 32.2 18.6
Initial Queue Delay ( d 3 ), s/veh 0.0 0.0 0.0 0.0 0.0 0.0 0.0 0.0 0.0 0.0
Control Delay ( d ), s/veh 58.0 46.6 47.2 27.5 55.4 57.8 51.9 57.7 57.6 51.1
Level of Service (LOS) E D D C E E D E E D
Approach Delay, s/veh / LOS 49.5 D 53.1 D 56.0 E 52.8 D
Intersection Delay, s/veh / LOS 52.4 D
Multimodal Results EB WB NB SB
Pedestrian LOS Score / LOS 2.3 B 2.3 B 2.8 C 2.8 C
Bicycle LOS Score / LOS 1.6 B 1.2 A 1.8 B 1.6 B
Copyright © 2017 University of Florida, All Rights Reserved. HCS7™ Streets Version 7.2 Generated: 5/30/2017 6:35:37 AM
Page 116
HCS7 Two-Way Stop-Control Report
General Information Site InformationAnalyst ABC Intersection Center Ridge & Glenmore
Agency/Co. TMS Engineers, Inc. Jurisdiction Westlake, OH
Date Performed 5/19/2017 East/West Street Center Ridge Road
Analysis Year 2019 North/South Street Glenmore Drive
Time Analyzed AM Peak Peak Hour Factor 0.92
Intersection Orientation East-West Analysis Time Period (hrs) 0.25
Project Description Build Conditions
Lanes
Major Street: East-West
Vehicle Volumes and AdjustmentsApproach Eastbound Westbound Northbound Southbound
Movement U L T R U L T R U L T R U L T R
Priority 1U 1 2 3 4U 4 5 6 7 8 9 10 11 12
Number of Lanes 0 0 2 0 0 0 2 0 0 0 0 0 1 0
Configuration LT T T TR LR
Volume, V (veh/h) 10 1094 595 30 30 10
Percent Heavy Vehicles (%) 3 3 3
Proportion Time Blocked
Percent Grade (%) 0
Right Turn Channelized No No No No
Median Type/Storage Undivided
Critical and Follow-up HeadwaysBase Critical Headway (sec) 4.1 7.5 6.9
Critical Headway (sec) 4.16 6.86 6.96
Base Follow-Up Headway (sec) 2.2 3.5 3.3
Follow-Up Headway (sec) 2.23 3.53 3.33
Delay, Queue Length, and Level of ServiceFlow Rate, v (veh/h) 11 44
Capacity, c (veh/h) 902 191
v/c Ratio 0.01 0.23
95% Queue Length, Q₉₅ (veh) 0.0 0.9
Control Delay (s/veh) 9.0 29.4
Level of Service, LOS A D
Approach Delay (s/veh) 0.2 29.4
Approach LOS D
Copyright © 2017 University of Florida. All Rights Reserved. HCS7™ TWSC Version 7.2 Generated: 5/30/2017 6:58:12 AMAM 19 Glenmore.xtw
Page 117
HCS7 Two-Way Stop-Control Report
General Information Site InformationAnalyst ABC Intersection Dover Center & Westown
Agency/Co. TMS Engineers, Inc. Jurisdiction Westlake, OH
Date Performed 5/19/2017 East/West Street Westown Boulevard
Analysis Year 2019 North/South Street Dover Center Road
Time Analyzed AM Peak Peak Hour Factor 0.92
Intersection Orientation North-South Analysis Time Period (hrs) 0.25
Project Description Build Conditions
Lanes
Major Street: North-South
Vehicle Volumes and AdjustmentsApproach Eastbound Westbound Northbound Southbound
Movement U L T R U L T R U L T R U L T R
Priority 10 11 12 7 8 9 1U 1 2 3 4U 4 5 6
Number of Lanes 0 1 0 0 0 0 0 0 1 0 0 0 1 0
Configuration LR LT TR
Volume, V (veh/h) 95 35 16 616 424 54
Percent Heavy Vehicles (%) 28 17 38
Proportion Time Blocked
Percent Grade (%) 0
Right Turn Channelized No No No No
Median Type/Storage Undivided
Critical and Follow-up HeadwaysBase Critical Headway (sec) 7.1 6.2 4.1
Critical Headway (sec) 6.68 6.37 4.48
Base Follow-Up Headway (sec) 3.5 3.3 2.2
Follow-Up Headway (sec) 3.75 3.45 2.54
Delay, Queue Length, and Level of ServiceFlow Rate, v (veh/h) 141 17
Capacity, c (veh/h) 246 887
v/c Ratio 0.57 0.02
95% Queue Length, Q₉₅ (veh) 3.2 0.1
Control Delay (s/veh) 37.7 9.1
Level of Service, LOS E A
Approach Delay (s/veh) 37.7 0.5
Approach LOS E
Copyright © 2017 University of Florida. All Rights Reserved. HCS7™ TWSC Version 7.2 Generated: 5/30/2017 7:00:36 AMAM 19 Westown.xtw
Page 118
HCS7 Signalized Intersection Results Summary
General Information Intersection Information
Agency TMS Engineers, Inc. Duration, h 0.25
Analyst ABC Analysis Date May 19, 2017 Area Type Other
Jurisdiction Westlake, OH Time Period PM Peak PHF 0.92
Urban Street Center Ridge Analysis Year 2019 Analysis Period 1> 7:00
Intersection @ Dover Center File Name PM 19 CenterDover.xus
Project Description No-Build Conditions
Demand Information EB WB NB SB
Approach Movement L T R L T R L T R L T R
Demand ( v ), veh/h 165 453 137 88 438 100 194 307 98 120 297 153
Signal Information
GreenYellowRed
7.0 30.2 7.1 35.7 0.0 0.03.6 3.6 3.6 3.6 0.0 0.01.4 1.4 1.4 1.4 0.0 0.0
1 2 4
5 6 7
Cycle, s 100.0 Reference Phase 2
Offset, s 0 Reference Point End
Uncoordinated No Simult. Gap E/W On
Force Mode Fixed Simult. Gap N/S On
Timer Results EBL EBT WBL WBT NBL NBT SBL SBT
Assigned Phase 5 2 1 6 3 8 7 4
Case Number 1.1 4.0 1.1 4.0 1.1 4.0 1.1 4.0
Phase Duration, s 12.0 35.2 12.0 35.2 12.1 40.8 12.0 40.7
Change Period, ( Y+R c ), s 5.0 5.0 5.0 5.0 5.0 5.0 5.0 5.0
Max Allow Headway ( MAH ), s 3.1 0.0 3.1 0.0 3.1 3.1 3.1 3.1
Queue Clearance Time ( g s ), s 9.0 5.6 9.1 23.1 6.5 27.0
Green Extension Time ( g e ), s 0.0 0.0 0.0 0.0 0.0 1.8 0.0 1.5
Phase Call Probability 1.00 1.00 1.00 1.00 1.00 1.00
Max Out Probability 1.00 1.00 1.00 0.03 1.00 0.14
Movement Group Results EB WB NB SB
Approach Movement L T R L T R L T R L T R
Assigned Movement 5 2 12 1 6 16 3 8 18 7 4 14
Adjusted Flow Rate ( v ), veh/h 179 332 309 96 301 284 211 440 130 489
Adjusted Saturation Flow Rate ( s ), veh/h/ln 1781 1870 1721 1753 1856 1736 1767 1778 1781 1749
Queue Service Time ( g s ), s 7.0 15.1 15.3 3.6 13.5 13.7 7.1 21.1 4.5 25.0
Cycle Queue Clearance Time ( g c ), s 7.0 15.1 15.3 3.6 13.5 13.7 7.1 21.1 4.5 25.0
Green Ratio ( g/C ) 0.37 0.30 0.30 0.37 0.30 0.30 0.43 0.36 0.43 0.36
Capacity ( c ), veh/h 317 565 520 295 560 524 294 637 317 624
Volume-to-Capacity Ratio ( X ) 0.565 0.589 0.594 0.324 0.536 0.542 0.717 0.692 0.411 0.784
Back of Queue ( Q ), ft/ln ( 85 th percentile) 121.1 256 238.9 67.9 231.4 216.9 143.4 313.2 81.9 371.1
Back of Queue ( Q ), veh/ln ( 85 th percentile) 4.8 10.1 9.6 2.6 9.0 8.7 5.6 12.2 3.2 14.5
Queue Storage Ratio ( RQ ) ( 85 th percentile) 0.81 0.00 0.00 0.45 0.00 0.00 0.82 0.00 0.25 0.00
Uniform Delay ( d 1 ), s/veh 23.5 29.6 29.7 22.6 29.1 29.1 24.2 27.4 20.8 28.7
Incremental Delay ( d 2 ), s/veh 1.5 4.5 4.9 0.2 3.7 4.0 7.1 2.7 0.3 5.9
Initial Queue Delay ( d 3 ), s/veh 0.0 0.0 0.0 0.0 0.0 0.0 0.0 0.0 0.0 0.0
Control Delay ( d ), s/veh 25.0 34.1 34.6 22.8 32.7 33.1 31.3 30.1 21.1 34.6
Level of Service (LOS) C C C C C C C C C C
Approach Delay, s/veh / LOS 32.3 C 31.5 C 30.5 C 31.8 C
Intersection Delay, s/veh / LOS 31.6 C
Multimodal Results EB WB NB SB
Pedestrian LOS Score / LOS 2.3 B 2.3 B 2.8 C 2.8 C
Bicycle LOS Score / LOS 1.2 A 1.0 A 1.6 B 1.5 B
Copyright © 2017 University of Florida, All Rights Reserved. HCS7™ Streets Version 7.2 Generated: 5/30/2017 7:01:09 AM
Page 119
HCS7 Two-Way Stop-Control Report
General Information Site InformationAnalyst ABC Intersection Center Ridge & Glenmore
Agency/Co. TMS Engineers, Inc. Jurisdiction Westlake, OH
Date Performed 5/19/2017 East/West Street Center Ridge Road
Analysis Year 2019 North/South Street Glenmore Drive
Time Analyzed PM Peak Peak Hour Factor 0.92
Intersection Orientation East-West Analysis Time Period (hrs) 0.25
Project Description Build Conditions
Lanes
Major Street: East-West
Vehicle Volumes and AdjustmentsApproach Eastbound Westbound Northbound Southbound
Movement U L T R U L T R U L T R U L T R
Priority 1U 1 2 3 4U 4 5 6 7 8 9 10 11 12
Number of Lanes 0 0 2 0 0 0 2 0 0 0 0 0 1 0
Configuration LT T T TR LR
Volume, V (veh/h) 10 598 707 10 10 10
Percent Heavy Vehicles (%) 0 3 3
Proportion Time Blocked
Percent Grade (%) 0
Right Turn Channelized No No No No
Median Type/Storage Undivided
Critical and Follow-up HeadwaysBase Critical Headway (sec)
Critical Headway (sec)
Base Follow-Up Headway (sec)
Follow-Up Headway (sec)
Delay, Queue Length, and Level of ServiceFlow Rate, v (veh/h) 11 22
Capacity, c (veh/h) 847 297
v/c Ratio 0.01 0.07
95% Queue Length, Q₉₅ (veh) 0.0 0.2
Control Delay (s/veh) 9.3 18.1
Level of Service, LOS A C
Approach Delay (s/veh) 0.2 18.1
Approach LOS C
Copyright © 2017 University of Florida. All Rights Reserved. HCS7™ TWSC Version 7.2 Generated: 5/30/2017 7:22:53 AMPM 19 Glenmore.xtw
Page 120
HCS7 Two-Way Stop-Control Report
General Information Site InformationAnalyst ABC Intersection Dover Center & Westown
Agency/Co. TMS Engineers, Inc. Jurisdiction Westlake, OH
Date Performed 5/19/2017 East/West Street Westown Boulevard
Analysis Year 2019 North/South Street Dover Center Road
Time Analyzed PM Peak Peak Hour Factor 0.92
Intersection Orientation North-South Analysis Time Period (hrs) 0.25
Project Description Build Conditions
Lanes
Major Street: North-South
Vehicle Volumes and AdjustmentsApproach Eastbound Westbound Northbound Southbound
Movement U L T R U L T R U L T R U L T R
Priority 10 11 12 7 8 9 1U 1 2 3 4U 4 5 6
Number of Lanes 0 1 0 0 0 0 0 0 1 0 0 0 1 0
Configuration LR LT TR
Volume, V (veh/h) 64 26 17 545 469 43
Percent Heavy Vehicles (%) 39 27 41
Proportion Time Blocked
Percent Grade (%) 0
Right Turn Channelized No No No No
Median Type/Storage Undivided
Critical and Follow-up HeadwaysBase Critical Headway (sec) 7.1 6.2 4.1
Critical Headway (sec) 6.79 6.47 4.51
Base Follow-Up Headway (sec) 3.5 3.3 2.2
Follow-Up Headway (sec) 3.85 3.54 2.57
Delay, Queue Length, and Level of ServiceFlow Rate, v (veh/h) 98 18
Capacity, c (veh/h) 250 845
v/c Ratio 0.39 0.02
95% Queue Length, Q₉₅ (veh) 1.8 0.1
Control Delay (s/veh) 28.4 9.4
Level of Service, LOS D A
Approach Delay (s/veh) 28.4 0.6
Approach LOS D
Copyright © 2017 University of Florida. All Rights Reserved. HCS7™ TWSC Version 7.2 Generated: 5/30/2017 7:24:26 AMPM 19 Westown.xtw
Page 121
Traffic Impact Study Westlake Elementary School, Westlake, Ohio
AppendixH
BuildCapacityAnalysisWorksheets‐2019w/Improvements
June 5, 2017 TMS Engineers, Inc.
Page 122
HCS7 Signalized Intersection Results Summary
General Information Intersection Information
Agency TMS Engineers, Inc. Duration, h 0.25
Analyst ABC Analysis Date May 19, 2017 Area Type Other
Jurisdiction Westlake, OH Time Period AM Peak PHF 0.92
Urban Street Center Ridge Analysis Year 2019 Analysis Period 1> 7:00
Intersection @ Dover Center File Name AM 19 CenterDover-IMP2.xus
Project Description WB RTL
Demand Information EB WB NB SB
Approach Movement L T R L T R L T R L T R
Demand ( v ), veh/h 287 798 124 98 483 250 212 379 140 170 316 158
Signal Information
GreenYellowRed
7.0 31.2 7.0 0.6 34.2 0.03.6 3.6 3.6 0.0 3.6 0.01.4 1.4 1.4 0.0 1.4 0.0
1 2 4
5 6 7
Cycle, s 100.0 Reference Phase 2
Offset, s 0 Reference Point End
Uncoordinated No Simult. Gap E/W On
Force Mode Fixed Simult. Gap N/S On
Timer Results EBL EBT WBL WBT NBL NBT SBL SBT
Assigned Phase 5 2 1 6 3 8 7 4
Case Number 1.1 4.0 1.1 3.0 1.1 4.0 1.1 4.0
Phase Duration, s 12.1 36.2 12.0 36.1 12.6 39.8 12.0 39.2
Change Period, ( Y+R c ), s 5.0 5.0 5.0 5.0 5.0 5.0 5.0 5.0
Max Allow Headway ( MAH ), s 3.1 0.0 3.1 0.0 3.1 3.1 3.1 3.1
Queue Clearance Time ( g s ), s 9.1 6.0 9.6 32.5 8.8 29.4
Green Extension Time ( g e ), s 0.0 0.0 0.0 0.0 0.0 0.8 0.0 1.3
Phase Call Probability 1.00 1.00 1.00 1.00 1.00 1.00
Max Out Probability 1.00 1.00 1.00 1.00 1.00 0.61
Movement Group Results EB WB NB SB
Approach Movement L T R L T R L T R L T R
Assigned Movement 5 2 12 1 6 16 3 8 18 7 4 14
Adjusted Flow Rate ( v ), veh/h 312 513 489 107 525 272 230 564 185 515
Adjusted Saturation Flow Rate ( s ), veh/h/ln 1781 1870 1782 1753 1766 1610 1767 1770 1781 1751
Queue Service Time ( g s ), s 7.1 26.0 26.0 4.0 12.0 12.6 7.6 30.5 6.8 27.4
Cycle Queue Clearance Time ( g c ), s 7.1 26.0 26.0 4.0 12.0 12.6 7.6 30.5 6.8 27.4
Green Ratio ( g/C ) 0.38 0.31 0.31 0.38 0.31 0.38 0.42 0.35 0.41 0.34
Capacity ( c ), veh/h 366 584 556 212 1099 613 266 616 216 599
Volume-to-Capacity Ratio ( X ) 0.853 0.879 0.879 0.502 0.478 0.443 0.867 0.916 0.855 0.861
Back of Queue ( Q ), ft/ln ( 85 th percentile) 205.3 456.7 433.5 75.9 192.7 182.9 194.1 503.2 162.8 428.8
Back of Queue ( Q ), veh/ln ( 85 th percentile) 8.1 18.0 17.3 2.9 7.5 7.3 7.6 19.7 6.4 16.7
Queue Storage Ratio ( RQ ) ( 85 th percentile) 1.37 0.00 0.00 0.51 0.00 0.00 1.11 0.00 0.50 0.00
Uniform Delay ( d 1 ), s/veh 30.8 32.6 32.6 25.0 27.9 23.0 27.0 31.2 25.0 30.7
Incremental Delay ( d 2 ), s/veh 16.6 17.1 17.8 0.7 1.5 2.3 23.9 18.2 25.9 11.6
Initial Queue Delay ( d 3 ), s/veh 0.0 0.0 0.0 0.0 0.0 0.0 0.0 0.0 0.0 0.0
Control Delay ( d ), s/veh 47.4 49.7 50.4 25.7 29.4 25.4 50.9 49.4 50.9 42.3
Level of Service (LOS) D D D C C C D D D D
Approach Delay, s/veh / LOS 49.4 D 27.7 C 49.8 D 44.6 D
Intersection Delay, s/veh / LOS 43.3 D
Multimodal Results EB WB NB SB
Pedestrian LOS Score / LOS 2.3 B 2.3 B 2.9 C 2.8 C
Bicycle LOS Score / LOS 1.6 B 1.2 A 1.8 B 1.6 B
Copyright © 2017 University of Florida, All Rights Reserved. HCS7™ Streets Version 7.2 Generated: 5/30/2017 7:08:43 AM
Page 123
HCS7 Roundabouts ReportGeneral Information Site Information
Analyst ABC Intersection Dover Center & Westown
Agency or Co. TMS Engineers, Inc. E/W Street Name Westown Boulevard
Date Performed 5/19/2017 N/S Street Name Dover Center Road
Analysis Year 2019 Analysis Time Period (hrs) 0.25
Time Analyzed AM Peak Peak Hour Factor 0.92
Project Description Roundabout Jurisdiction Westlake, OH
Volume Adjustments and Site Characteristics
Approach EB WB NB SB
Movement U L T R U L T R U L T R U L T R
Number of Lanes (N) 0 0 1 0 0 0 0 0 0 0 1 0 0 0 1 0
Lane Assignment LR LT TR
Volume (V), veh/h 0 95 35 0 16 616 0 424 54
Percent Heavy Vehicles, % 3 28 17 3 38 3 3 3 44
Flow Rate (vPCE), pc/h 0 132 45 0 24 690 0 475 85
Right-Turn Bypass None None None None
Conflicting Lanes 1 1 1
Pedestrians Crossing, p/h 0 0 0
Critical and Follow-Up Headway Adjustment
Approach EB WB NB SB
Lane Left Right Bypass Left Right Bypass Left Right Bypass Left Right Bypass
Critical Headway (s) 4.9763 4.9763 4.9763
Follow-Up Headway (s) 2.6087 2.6087 2.6087
Flow Computations, Capacity and v/c Ratios
Approach EB WB NB SB
Lane Left Right Bypass Left Right Bypass Left Right Bypass Left Right Bypass
Entry Flow (ve), pc/h 177 714 560
Entry Volume veh/h 142 687 520
Circulating Flow (vc), pc/h 475 846 132 24
Exiting Flow (vex), pc/h 0 109 822 520
Capacity (cpce), pc/h 850 1206 1347
Capacity (c), veh/h 680 1161 1251
v/c Ratio (x) 0.21 0.59 0.42
Delay and Level of Service
Approach EB WB NB SB
Lane Left Right Bypass Left Right Bypass Left Right Bypass Left Right Bypass
Lane Control Delay (d), s/veh 7.7 10.5 7.0
Lane LOS A B A
95% Queue, veh 0.8 4.1 2.1
Approach Delay, s/veh 7.7 10.5 7.0
Approach LOS A B A
Intersection Delay, s/veh | LOS 8.8 A
Copyright © 2017 University of Florida. All Rights Reserved. HCS7™ Roundabouts Version 7.2 5/30/2017 10:50:01 AMAM 19 Westown-RDAB.xro
Page 124
HCS7 Signalized Intersection Results Summary
General Information Intersection Information
Agency TMS Engineers, Inc. Duration, h 0.25
Analyst ABC Analysis Date May 19, 2017 Area Type Other
Jurisdiction Westlake, OH Time Period AM Peak PHF 0.92
Urban Street Dover Center @ Analysis Year 2019 Analysis Period 1> 7:00
Intersection Westown File Name AM 19 Westown-TS.xus
Project Description Traffic Signal
Demand Information EB WB NB SB
Approach Movement L T R L T R L T R L T R
Demand ( v ), veh/h 95 0 35 16 616 424 54
Signal Information
GreenYellowRed
52.8 37.2 0.0 0.0 0.0 0.03.6 3.6 0.0 0.0 0.0 0.01.4 1.4 0.0 0.0 0.0 0.0
1 3 4
5 6 7 8
Cycle, s 100.0 Reference Phase 2
Offset, s 0 Reference Point End
Uncoordinated No Simult. Gap E/W On
Force Mode Fixed Simult. Gap N/S On
Timer Results EBL EBT WBL WBT NBL NBT SBL SBT
Assigned Phase 4 2 6
Case Number 12.0 8.0 8.0
Phase Duration, s 42.2 57.8 57.8
Change Period, ( Y+R c ), s 5.0 5.0 5.0
Max Allow Headway ( MAH ), s 3.2 0.0 0.0
Queue Clearance Time ( g s ), s 9.0
Green Extension Time ( g e ), s 0.3 0.0 0.0
Phase Call Probability 1.00
Max Out Probability 0.00
Movement Group Results EB WB NB SB
Approach Movement L T R L T R L T R L T R
Assigned Movement 7 4 14 5 2 6 16
Adjusted Flow Rate ( v ), veh/h 141 687 520
Adjusted Saturation Flow Rate ( s ), veh/h/ln 1410 1803 1790
Queue Service Time ( g s ), s 7.0 0.0 19.3
Cycle Queue Clearance Time ( g c ), s 7.0 28.5 19.3
Green Ratio ( g/C ) 0.37 0.53 0.53
Capacity ( c ), veh/h 524 989 945
Volume-to-Capacity Ratio ( X ) 0.269 0.695 0.550
Back of Queue ( Q ), ft/ln ( 85 th percentile) 115 409.1 282.1
Back of Queue ( Q ), veh/ln ( 85 th percentile) 3.8 15.7 10.8
Queue Storage Ratio ( RQ ) ( 85 th percentile) 0.00 0.00 0.00
Uniform Delay ( d 1 ), s/veh 21.9 17.9 15.7
Incremental Delay ( d 2 ), s/veh 0.1 4.0 2.3
Initial Queue Delay ( d 3 ), s/veh 0.0 0.0 0.0
Control Delay ( d ), s/veh 22.0 21.9 18.0
Level of Service (LOS) C C B
Approach Delay, s/veh / LOS 22.0 C 0.0 21.9 C 18.0 B
Intersection Delay, s/veh / LOS 20.4 C
Multimodal Results EB WB NB SB
Pedestrian LOS Score / LOS 2.1 B 2.1 B 1.9 B 1.4 A
Bicycle LOS Score / LOS 0.7 A 1.6 B 1.3 A
Copyright © 2017 University of Florida, All Rights Reserved. HCS7™ Streets Version 7.2 Generated: 5/30/2017 10:53:54 AM
Page 125
HCS7 Signalized Intersection Results Summary
General Information Intersection Information
Agency TMS Engineers, Inc. Duration, h 0.25
Analyst ABC Analysis Date May 19, 2017 Area Type Other
Jurisdiction Westlake, OH Time Period PM Peak PHF 0.92
Urban Street Center Ridge Analysis Year 2019 Analysis Period 1> 7:00
Intersection @ Dover Center File Name PM 19 CenterDover-WB RTL.xus
Project Description WB RTL
Demand Information EB WB NB SB
Approach Movement L T R L T R L T R L T R
Demand ( v ), veh/h 165 453 137 88 438 100 194 307 98 120 297 153
Signal Information
GreenYellowRed
7.0 30.2 7.1 35.7 0.0 0.03.6 3.6 3.6 3.6 0.0 0.01.4 1.4 1.4 1.4 0.0 0.0
1 2 4
5 6 7
Cycle, s 100.0 Reference Phase 2
Offset, s 0 Reference Point End
Uncoordinated No Simult. Gap E/W On
Force Mode Fixed Simult. Gap N/S On
Timer Results EBL EBT WBL WBT NBL NBT SBL SBT
Assigned Phase 5 2 1 6 3 8 7 4
Case Number 1.1 4.0 1.1 3.0 1.1 4.0 1.1 4.0
Phase Duration, s 12.0 35.2 12.0 35.2 12.1 40.8 12.0 40.7
Change Period, ( Y+R c ), s 5.0 5.0 5.0 5.0 5.0 5.0 5.0 5.0
Max Allow Headway ( MAH ), s 3.1 0.0 3.1 0.0 3.1 3.1 3.1 3.1
Queue Clearance Time ( g s ), s 9.0 5.6 9.1 23.1 6.5 27.0
Green Extension Time ( g e ), s 0.0 0.0 0.0 0.0 0.0 1.8 0.0 1.5
Phase Call Probability 1.00 1.00 1.00 1.00 1.00 1.00
Max Out Probability 1.00 1.00 1.00 0.03 1.00 0.14
Movement Group Results EB WB NB SB
Approach Movement L T R L T R L T R L T R
Assigned Movement 5 2 12 1 6 16 3 8 18 7 4 14
Adjusted Flow Rate ( v ), veh/h 179 332 309 96 476 109 211 440 130 489
Adjusted Saturation Flow Rate ( s ), veh/h/ln 1781 1870 1721 1753 1766 1610 1767 1778 1781 1749
Queue Service Time ( g s ), s 7.0 15.1 15.3 3.6 10.9 4.5 7.1 21.1 4.5 25.0
Cycle Queue Clearance Time ( g c ), s 7.0 15.1 15.3 3.6 10.9 4.5 7.1 21.1 4.5 25.0
Green Ratio ( g/C ) 0.37 0.30 0.30 0.37 0.30 0.37 0.43 0.36 0.43 0.36
Capacity ( c ), veh/h 356 565 520 295 1067 599 294 637 317 624
Volume-to-Capacity Ratio ( X ) 0.504 0.589 0.594 0.324 0.446 0.181 0.717 0.692 0.411 0.784
Back of Queue ( Q ), ft/ln ( 85 th percentile) 118.3 256 238.9 67.9 177.3 79.2 143.4 313.2 81.9 371.1
Back of Queue ( Q ), veh/ln ( 85 th percentile) 4.7 10.1 9.6 2.6 6.9 3.2 5.6 12.2 3.2 14.5
Queue Storage Ratio ( RQ ) ( 85 th percentile) 0.79 0.00 0.00 0.45 0.00 0.00 0.82 0.00 0.25 0.00
Uniform Delay ( d 1 ), s/veh 23.0 29.6 29.7 22.6 28.2 21.1 24.2 27.4 20.8 28.7
Incremental Delay ( d 2 ), s/veh 0.5 4.5 4.9 0.2 1.4 0.7 7.1 2.7 0.3 5.9
Initial Queue Delay ( d 3 ), s/veh 0.0 0.0 0.0 0.0 0.0 0.0 0.0 0.0 0.0 0.0
Control Delay ( d ), s/veh 23.5 34.1 34.6 22.8 29.5 21.8 31.3 30.1 21.1 34.6
Level of Service (LOS) C C C C C C C C C C
Approach Delay, s/veh / LOS 32.0 C 27.3 C 30.5 C 31.8 C
Intersection Delay, s/veh / LOS 30.4 C
Multimodal Results EB WB NB SB
Pedestrian LOS Score / LOS 2.3 B 2.3 B 2.9 C 2.8 C
Bicycle LOS Score / LOS 1.2 A 1.0 A 1.6 B 1.5 B
Copyright © 2017 University of Florida, All Rights Reserved. HCS7™ Streets Version 7.2 Generated: 5/30/2017 7:21:31 AM
Page 126
HCS7 Roundabouts ReportGeneral Information Site Information
Analyst ABC Intersection Dover Center & Westown
Agency or Co. TMS Engineers, Inc. E/W Street Name Westown Boulevard
Date Performed 5/19/2017 N/S Street Name Dover Center Road
Analysis Year 2019 Analysis Time Period (hrs) 0.25
Time Analyzed PM Peak Peak Hour Factor 0.92
Project Description Roundabout Jurisdiction Westlake, OH
Volume Adjustments and Site Characteristics
Approach EB WB NB SB
Movement U L T R U L T R U L T R U L T R
Number of Lanes (N) 0 0 1 0 0 0 0 0 0 0 1 0 0 0 1 0
Lane Assignment LR LT TR
Volume (V), veh/h 0 64 26 0 17 545 0 469 43
Percent Heavy Vehicles, % 3 39 27 3 41 3 3 3 53
Flow Rate (vPCE), pc/h 0 97 36 0 26 610 0 525 72
Right-Turn Bypass None None None None
Conflicting Lanes 1 1 1
Pedestrians Crossing, p/h 0 0 0
Critical and Follow-Up Headway Adjustment
Approach EB WB NB SB
Lane Left Right Bypass Left Right Bypass Left Right Bypass Left Right Bypass
Critical Headway (s) 4.9763 4.9763 4.9763
Follow-Up Headway (s) 2.6087 2.6087 2.6087
Flow Computations, Capacity and v/c Ratios
Approach EB WB NB SB
Lane Left Right Bypass Left Right Bypass Left Right Bypass Left Right Bypass
Entry Flow (ve), pc/h 133 636 597
Entry Volume veh/h 98 611 557
Circulating Flow (vc), pc/h 525 733 97 26
Exiting Flow (vex), pc/h 0 98 707 561
Capacity (cpce), pc/h 808 1250 1344
Capacity (c), veh/h 596 1200 1253
v/c Ratio (x) 0.16 0.51 0.44
Delay and Level of Service
Approach EB WB NB SB
Lane Left Right Bypass Left Right Bypass Left Right Bypass Left Right Bypass
Lane Control Delay (d), s/veh 8.0 8.6 7.4
Lane LOS A A A
95% Queue, veh 0.6 3.0 2.3
Approach Delay, s/veh 8.0 8.6 7.4
Approach LOS A A A
Intersection Delay, s/veh | LOS 8.0 A
Copyright © 2017 University of Florida. All Rights Reserved. HCS7™ Roundabouts Version 7.2 5/30/2017 10:52:43 AMPM 19 Westown-RDAB.xro
Page 127
HCS7 Signalized Intersection Results Summary
General Information Intersection Information
Agency TMS Engineers, Inc. Duration, h 0.25
Analyst ABC Analysis Date May 19, 2017 Area Type Other
Jurisdiction Westlake, OH Time Period PM Peak PHF 0.92
Urban Street Dover Center @ Analysis Year 2019 Analysis Period 1> 7:00
Intersection Westown File Name PM 19 Westown-TS.xus
Project Description Traffic Signal
Demand Information EB WB NB SB
Approach Movement L T R L T R L T R L T R
Demand ( v ), veh/h 64 0 26 17 545 469 43
Signal Information
GreenYellowRed
51.7 38.3 0.0 0.0 0.0 0.03.6 3.6 0.0 0.0 0.0 0.01.4 1.4 0.0 0.0 0.0 0.0
1 3 4
5 6 7 8
Cycle, s 100.0 Reference Phase 2
Offset, s 0 Reference Point End
Uncoordinated No Simult. Gap E/W On
Force Mode Fixed Simult. Gap N/S On
Timer Results EBL EBT WBL WBT NBL NBT SBL SBT
Assigned Phase 4 2 6
Case Number 12.0 8.0 8.0
Phase Duration, s 43.3 56.7 56.7
Change Period, ( Y+R c ), s 5.0 5.0 5.0
Max Allow Headway ( MAH ), s 3.2 0.0 0.0
Queue Clearance Time ( g s ), s 7.2
Green Extension Time ( g e ), s 0.2 0.0 0.0
Phase Call Probability 1.00
Max Out Probability 0.00
Movement Group Results EB WB NB SB
Approach Movement L T R L T R L T R L T R
Assigned Movement 7 4 14 5 2 6 16
Adjusted Flow Rate ( v ), veh/h 98 611 557
Adjusted Saturation Flow Rate ( s ), veh/h/ln 1256 1796 1799
Queue Service Time ( g s ), s 5.2 0.0 21.6
Cycle Queue Clearance Time ( g c ), s 5.2 24.3 21.6
Green Ratio ( g/C ) 0.38 0.52 0.52
Capacity ( c ), veh/h 481 966 930
Volume-to-Capacity Ratio ( X ) 0.203 0.633 0.598
Back of Queue ( Q ), ft/ln ( 85 th percentile) 86.7 355.5 316.7
Back of Queue ( Q ), veh/ln ( 85 th percentile) 2.7 13.7 12.2
Queue Storage Ratio ( RQ ) ( 85 th percentile) 0.00 0.00 0.00
Uniform Delay ( d 1 ), s/veh 20.6 17.5 16.9
Incremental Delay ( d 2 ), s/veh 0.1 3.2 2.8
Initial Queue Delay ( d 3 ), s/veh 0.0 0.0 0.0
Control Delay ( d ), s/veh 20.7 20.7 19.7
Level of Service (LOS) C C B
Approach Delay, s/veh / LOS 20.7 C 0.0 20.7 C 19.7 B
Intersection Delay, s/veh / LOS 20.3 C
Multimodal Results EB WB NB SB
Pedestrian LOS Score / LOS 2.1 B 2.1 B 1.9 B 1.4 A
Bicycle LOS Score / LOS 0.6 A 1.5 A 1.4 A
Copyright © 2017 University of Florida, All Rights Reserved. HCS7™ Streets Version 7.2 Generated: 5/30/2017 10:53:54 AM
Page 128
Traffic Impact Study Westlake Elementary School, Westlake, Ohio
AppendixI
TrafficSignalWarrantAnalysis
June 5, 2017 TMS Engineers, Inc.
Page 129
Form 750-020-01TRAFFIC ENGINEERING - 07/99
Page 1 of 52019 BUILD CONDITIONS
TRAFFIC SIGNAL WARRANT SUMMARY
City: Engineer:County: Date:
Major Street: Lanes: Critical Approach Speed:Minor Street: Lanes:
Volume Level Criteria1. Is the critical speed of major street traffic > 70 km/h (40 mph) ? Yes No2. Is the intersection in a built-up area of isolated community of <10,000 population? Yes No
If Question 1 or 2 above is answered "Yes", then use "70%" volume level 70% 100%
WARRANT 1 - EIGHT-HOUR VEHICULAR VOLUME Applicable: Yes NoWarrant 1 is satisfied if Condition A or Condition B is "100%" satisfied. Satisfied: Yes NoWarrant is also satisfied if both Condition A and Condition B are "80%" satisfied.
Condition A - Minimum Vehicular Volume 100% Satisfied: Yes No80% Satisfied: Yes No
Record 8 highest hours and the corresponding volumes in boxes provided. Condition is 100% satisfied if the minimum volumes are met for eight hours . Condition is 80% satisfied if parenthetical volumes are met for eight hours.
Condition B - Interruption of Continuous Traffic Applicable: Yes NoCondition B is intended for application where the traffic volume is Excessive Delay: Yes Noso heavy that traffic on the minor street suffers excessive delay. 100% Satisfied: Yes No
80% Satisfied: Yes No
Record 8 highest hours and the corresponding volumes in boxes provided. Condition is 100% satisfied if the minimum volumes are met for eight hours . Condition is 80% satisfied if parenthetical volumes are met for eight hours.
Source: Revised from NCHRP Report 457
on Minor Street (60) (042) (80)42119 58 44 51 83 45 40
(720)Highest Approach 75 53
on Major Street (600) (420)100 70
1,175968 718 869 854 935 1,050 1,119Both Approaches 750 525 900
Minimum Requirements
7:3
0 A
M -
8:3
0 A
M(volumes in veh/hr) (80% Shown in Brackets)Approach Lanes 1 2 or more
Volume Level
Both Approacheson Major Street
Highest Approach on Minor Street
500 350
150(120)
Eight Highest Hours
9:0
0 A
M -
10
:00
AM
11
:00
AM
-
12
:00
PM
12
:00
PM
-
1:0
0 P
M
5:0
0 P
M
935 1,050
Approach Lanes
Volume Level
(volumes in veh/hr) (80% Shown in Brackets)1
70%100%
2 or more
630
6:0
0 P
M
100% 70% 100% 70% 2:0
0 P
M -
3:0
0 P
M
4:0
0 P
M
4240
1,119 1,175
83
5:0
0 P
M -
3:0
0 P
M -
45
Eight Highest Hours
4:0
0 P
M -
514458119
6:0
0 P
M
8:3
0 A
M
12
:00
PM
12
:00
PM
-
1:0
0 P
M
2:0
0 P
M -
3:0
0 P
M -
4:0
0 P
M -
5:0
0 P
M -
3:0
0 P
M
4:0
0 P
M
5:0
0 P
M
11
:00
AM
-70%100% 9
:00
AM
-
10
:00
AM
Minimum Requirements
7:3
0 A
M -
869 854(400) (280) (480)
968 718420600
(160)105
(084)200 140
ABCMay 19, 2017
Dover Center RoadWestown Boulevard
CuyahogaWestlake
11
35
Page 130
Form 750-020-01TRAFFIC ENGINEERING - 07/99
Page 2 of 52019 BUILD CONDITIONS
TRAFFIC SIGNAL WARRANT SUMMARY
City: Engineer:County: Date:
Major Street: Lanes: Critical Approach Speed:Minor Street: Lanes:
Volume Level Criteria1. Is the critical speed of major street traffic > 70 km/h (40 mph) ? Yes No2. Is the intersection in a built-up area of isolated community of <10,000 population? Yes No
If Question 1 or 2 above is answered "Yes", then use "70%" volume level 70% 100%
WARRANT 2 - FOUR-HOUR VEHICULAR VOLUME Applicable: Yes No If all four points lie above the appropriate line, then the warrant is satisfied. Satisfied: Yes No
* Note: 115 vph applies as the lower threshold volume for a minor street approach with two or more lanes and
80 vph applies as the lower threshold volume threshold for a minor street approach with one lane.
* Note: 80 vph applies as the lower threshold volume for a minor street approach with two or more lanes and
60 vph applies as the lower threshold volume threshold for a minor street approach with one lane.
Source: Revised from NCHRP Report 457
135
9:00 AM -
Dover Center RoadWestown Boulevard
8:30 AM
Cuyahoga
718 5810:00 AM
Hours Street Street
7:30 AM -968 119
12:00 PM -854 51
1:00 PM
2:00 PM -935 83
3:00 PM
Westlake ABC
FourHighest
VolumesMajor Minor
Plot four volume combinations on the applicable figure below.
May 19, 2017
1
0
100
200
300
400
500
600
700
300 400 500 600 700 800 900 1000 1100 1200 1300 1400 1500 1600 1700
MIN
OR
ST
RE
ET
H
IGH
VO
LU
ME
AP
PR
OA
CH
-V
PH
MAJOR STREET - TOTAL OF BOTH APPROACHES - VPH
FIGURE 4C-1: Criteria for "100%" Volume Level
2 OR MORE LANES & 2 OR MORE LANES
2 OR MORE LANES & 1 LANE
1 LANE & 1 LANE
*115*80
0
100
200
300
400
200 300 400 500 600 700 800 900 1000
MIN
OR
ST
RE
ET
HIG
H V
OL
UM
E A
PP
RO
AC
H -
VP
H
MAJOR STREET - TOTAL OF BOTH APPROACHES - VPH
FIGURE 4C-2: Criteria for "70%" Volume Level
2 OR MORE LANES & 2 OR MORE LANES
2 OR MORE LANES & 1 LANE
1 LANE & 1 LANE
*80
*60
(Community Less than 10,000 population or above 70 km/hr (40 mph) on Major Street)
Page 131
Form 750-020-01TRAFFIC ENGINEERING - 07/99
Page 3 of 52019 BUILD CONDITIONS
TRAFFIC SIGNAL WARRANT SUMMARY
City: Engineer:County: Date:
Major Street: Lanes: Critical Approach Speed:Minor Street: Lanes:
Volume Level Criteria1. Is the critical speed of major street traffic > 70 km/h (40 mph) ? Yes No2. Is the intersection in a built-up area of isolated community of <10,000 population? Yes No
If Question 1 or 2 above is answered "Yes", then use "70%" volume level 70% 100%
WARRANT 3 - PEAK HOUR Applicable: Yes NoIf all three criteria are fullfilled or the plotted point lies above the appropriate line, Satisfied: Yes Nothen the warrant is satisfed.
Record hour when criteria are fulfilled
and the corresponding delay or volume
in boxes provided.
Criteria
* Note: 150 vph applies as the lower threshold volume for a minor street approach with two or more lanes and
100 vph applies as the lower threshold volume threshold for a minor street approach with one lane.
* Note: 100 vph applies as the lower threshold volume for a minor street approach with two or more lanes and
75 vph applies as the lower threshold volume threshold for a minor street approach with one lane.
Source: Revised from NCHRP Report 457
AM 119968
WestlakeCuyahoga
Plot volume combination on the applicable figure below.
35Westown Boulevard 1
ABCMay 19, 2017
1. Delay on Minor Approach*(vehicle-hours)
Dover Center Road 1
Peak Hour
Unusual condition justifying
use of warrant:
School Bus Traffic
4
1 2
Delay Criteria* 4.0 5.0
*(vehicles per hour)
Approach Lanes
Delay*
2. Volume on Minor Approach
1.2
Yes NoFulfilled?:
150
119
Approach Lanes 1 2
Volume Criteria* 100
Volume*
650
Fulfilled?:
800
Yes No
*(vehicles per hour)3. Total Entering Volume
Volume Criteria*
No. of Approaches 3
NoYesFulfilled?:
1,087Volume*
0
100
200
300
400
500
600
400 500 600 700 800 900 1000 1100 1200 1300 1400 1500 1600 1700 1800
MIN
OR
ST
RE
ET
HIG
H V
OL
UM
E A
PP
RO
AC
H -
VP
H
MAJOR STREET - TOTAL OF BOTH APPROACHES - VPH
FIGURE 4C-3: Criteria for "100%" Volume Level
2 OR MORE LANES & 2 OR MORE LANES
2 OR MORE LANES & 1 LANE
1 LANE & 1 LANE
*150
*100
0
100
200
300
400
500
300 400 500 600 700 800 900 1000 1100 1200 1300
MIN
OR
ST
RE
ET
HIG
H V
OL
UM
E A
PP
RO
AC
H -
VP
H
MAJOR STREET - TOTAL OF BOTH APPROACHES - VPH
FIGURE 4C-4: Criteria for "70%" Volume Level
2 OR MORE LANES & 2 OR MORE LANES
2 OR MORE LANES & 1 LANE
1 LANE & 1 LANE
*100
*75
(Community Less than 10,000 population or above 70 km/hr (40 mph) on Major Street)
Page 132
Form 750-020-01TRAFFIC ENGINEERING - 07/99
Page 4 of 52019 BUILD CONDITIONS
TRAFFIC SIGNAL WARRANT SUMMARY
City: Engineer:County: Date:
Major Street: Lanes: Critical Approach Speed:Minor Street: Lanes:
WARRANT 4 - PEDESTRIAN VOLUME Applicable: Yes NoRecord hours where criteria are fulfilled and the corresponding volume or gap Satisfied: Yes Nofrequency in the boxes provided. The warrant is satisfied if condition 1 or 2 is fulfilled
and condition 3 is fulfilled.
1. Pedestrian volume crossing the major street is
100 ped/hr or more for each of any four hoursand there are less than 60 gaps per hour in the
major street traffic stream of adequate length.
2. Pedestrian volume crossing the major street is190 ped/hr or more for any one hour and there
are less than 60 gaps per hour in the major street
traffic stream of adequate length.
3. The nearest traffic signal along the major street is located more than 90 m (300 ft) away, or the nearest signalis within 90 m (300 ft) but the proposed traffic signal will not restrict the progressive movement of traffic.
WARRANT 5 - SCHOOL CROSSING Applicable: Yes NoRecord hours where criteria are fulfilled and the corresponding volume or gap Satisfied: Yes Nofrequency in the boxes provided. The warrant is satisfied if all three of the criteria
are fulfilled.
1. There are a minimum of 20 students crossing the major street Students: Hour:
during the highest crossing hour.
2. There are fewer adequate gaps in the major street traffic stream during the period Minutes: Gaps:
when the children are using the crossing than the number of minutes in the same period.
3. The nearest traffic signal along the major street is located more than 90 m (300 ft) away, or the nearest signalis within 90 m (300 ft) but the proposed traffic signal will not restrict the progressive movement of traffic.
WARRANT 6 - COORDINATED SIGNAL SYSTEM Applicable: Yes NoIndicate if the criteria are fulfilled in the boxes provided. The warrant is Satisfied: Yes Nosatisfied if either criterion is fulfilled. This warrant should not be applied when the
resulting signal spacing would be less than 300 m (1,000 ft).
1. On a one-way street or a street that has traffic predominately in one direction, the adjacent signals are
so far apart that they do not provide the necessary degree of vehicle platooning.
2. On a two-way street, adjacent signals do not provide the necessary degree of platooning, andthe proposed and adjacent signals will collectively provide a progressive operation.
Source: Revised from NCHRP Report 457
8:00 - 9:00 AM 0
Pedestrian Fulfilled?
0YesGaps
5:00 - 6:00 PM
Hour Volume7:00 8:00 AM
WestlakeCuyahoga
ABCMay 19, 2017
PedestrianNo
Fulfilled?
0
Criteria
Fulfilled?
NoYes
0
YesCriteria
0
No
1 35Westown Boulevard 1Dover Center Road
Criteria
4:00 - 5:00 PM
Page 133
Form 750-020-01TRAFFIC ENGINEERING - 07/99
Page 5 of 52019 BUILD CONDITIONS
TRAFFIC SIGNAL WARRANT SUMMARY
City: Engineer:County: Date:
Major Street: Lanes: Critical Approach Speed:Minor Street: Lanes:
WARRANT 7 - CRASH EXPERIENCE Applicable: Yes NoRecord hours where criteria are fulfilled, the corresponding volume, and other Satisfied: Yes Noinformation in the boxes provided. The warrant is satisfied if all three of the criteria
are fulfilled.
1. One of the Warrant 1, Condition A (80% satisfied)
warrants Warrant 1, Condition B (80% satisfied)
to the right
is met.
2. Adequate trial of other remedial measure
has failed to reduce crash frequency.
3. Five or more reported crashes, of types susceptible to correction by signal, have occurred within a 12-mo. period.
WARRANT 8 - ROADWAY NETWORK Applicable: Yes NoRecord hours where criteria are fulfilled, and the corresponding volume or other Satisfied: Yes Noinformation in the boxes provided. The warrant is satisfied if at least one of the criteria
is fulfilled and if all intersecting routes have one or more of the characteristics listed.
1. Both of a. Total entering volume of at least 1,000 veh/hr Entering Volume:
the criteria during a typical weekday peak hour.
to the right b. Five-year projected volumes that satisfy
are met. one or more of Warrants 1, 2, or 3.
2. Total entering volume at least
1,000 veh/hr for each of any 5 hrs
of a non-normal business day(Sat. or Sun.)
1. Part of the street or highway system that serves as the principal roadway
network for through traffic flow.
2. Rural or suburban highway outside of, entering, or traversing a city.
3. Appears as a major route on an official plan.
CONCLUSIONS Warrants Satisfied:
Remarks:
Source: Revised from NCHRP Report 457
at 80% of volume requirements:
80 ped/hr for four (4) hours or
Characteristics of Major Routes
ABCMay 19, 2017
Volume
WestlakeCuyahoga
Dover Center Road
Criteria
Warrant 4, Pedestrian Volume
Major Street:
Minor Street:
Major Street:
Minor Street:
Minor Street:
Yes
2 3
Fulfilled?No Yes No
Met?
Hour
Fulfilled?Yes No
Criteria
Major Street:
Met?Yes NoHour
Warrant:
Satisfied?:
1
Fulfilled?Yes
Volume
No
NoMet?
Yes
UNKNOWN
2
Number of crashes per 12 months:
Measure tried:
1 35Westown Boulevard 1
Warrant #9 NOT APPLICABLE due to no at grade railroad crossing.INTERSECTION DOES NOT MEET WARRANT CRITERIA UNDER 2019 BUILD CONDITIONS
152 ped/hr for one (1) hour
Page 134
Form 750-020-01TRAFFIC ENGINEERING - 07/99
Page 1 of 52039 BUILD CONDITIONS
TRAFFIC SIGNAL WARRANT SUMMARY
City: Engineer:County: Date:
Major Street: Lanes: Critical Approach Speed:Minor Street: Lanes:
Volume Level Criteria1. Is the critical speed of major street traffic > 70 km/h (40 mph) ? Yes No2. Is the intersection in a built-up area of isolated community of <10,000 population? Yes No
If Question 1 or 2 above is answered "Yes", then use "70%" volume level 70% 100%
WARRANT 1 - EIGHT-HOUR VEHICULAR VOLUME Applicable: Yes NoWarrant 1 is satisfied if Condition A or Condition B is "100%" satisfied. Satisfied: Yes NoWarrant is also satisfied if both Condition A and Condition B are "80%" satisfied.
Condition A - Minimum Vehicular Volume 100% Satisfied: Yes No80% Satisfied: Yes No
Record 8 highest hours and the corresponding volumes in boxes provided. Condition is 100% satisfied if the minimum volumes are met for eight hours . Condition is 80% satisfied if parenthetical volumes are met for eight hours.
Condition B - Interruption of Continuous Traffic Applicable: Yes NoCondition B is intended for application where the traffic volume is Excessive Delay: Yes Noso heavy that traffic on the minor street suffers excessive delay. 100% Satisfied: Yes No
80% Satisfied: Yes No
Record 8 highest hours and the corresponding volumes in boxes provided. Condition is 100% satisfied if the minimum volumes are met for eight hours . Condition is 80% satisfied if parenthetical volumes are met for eight hours.
Source: Revised from NCHRP Report 457
ABCMay 19, 2017
Dover Center RoadWestown Boulevard
CuyahogaWestlake
11
35
(160)105
(084)200 140
1,039 1,021(400) (280) (480)
1,131 859420600
11
:00
AM
-70%100% 9
:00
AM
-
10
:00
AM
Minimum Requirements
7:3
0 A
M -
3:0
0 P
M -
4:0
0 P
M -
5:0
0 P
M -
3:0
0 P
M
4:0
0 P
M
5:0
0 P
M
514458119
6:0
0 P
M
8:3
0 A
M
12
:00
PM
12
:00
PM
-
1:0
0 P
M
2:0
0 P
M -
4240
1,338 1,405
83
5:0
0 P
M -
3:0
0 P
M -
45
Eight Highest Hours
4:0
0 P
M -
630
6:0
0 P
M
100% 70% 100% 70% 2:0
0 P
M -
3:0
0 P
M
4:0
0 P
M
Approach Lanes
Volume Level
(volumes in veh/hr) (80% Shown in Brackets)1
70%100%
2 or more
Eight Highest Hours
9:0
0 A
M -
10
:00
AM
11
:00
AM
-
12
:00
PM
12
:00
PM
-
1:0
0 P
M
5:0
0 P
M
1,104 1,255Both Approacheson Major Street
Highest Approach on Minor Street
500 350
150(120)
(80% Shown in Brackets)Approach Lanes 1 2 or more
Volume Level
1,338Both Approaches 750 525 900
Minimum Requirements
7:3
0 A
M -
8:3
0 A
M(volumes in veh/hr)
(420)100 70
1,4051,131 859 1,039 1,021 1,104 1,255
83 45 40
(720)Highest Approach 75 53
on Major Street (600)
on Minor Street (60) (042) (80)42119 58 44 51
Page 135
Form 750-020-01TRAFFIC ENGINEERING - 07/99
Page 2 of 52039 BUILD CONDITIONS
TRAFFIC SIGNAL WARRANT SUMMARY
City: Engineer:County: Date:
Major Street: Lanes: Critical Approach Speed:Minor Street: Lanes:
Volume Level Criteria1. Is the critical speed of major street traffic > 70 km/h (40 mph) ? Yes No2. Is the intersection in a built-up area of isolated community of <10,000 population? Yes No
If Question 1 or 2 above is answered "Yes", then use "70%" volume level 70% 100%
WARRANT 2 - FOUR-HOUR VEHICULAR VOLUME Applicable: Yes No If all four points lie above the appropriate line, then the warrant is satisfied. Satisfied: Yes No
* Note: 115 vph applies as the lower threshold volume for a minor street approach with two or more lanes and
80 vph applies as the lower threshold volume threshold for a minor street approach with one lane.
* Note: 80 vph applies as the lower threshold volume for a minor street approach with two or more lanes and
60 vph applies as the lower threshold volume threshold for a minor street approach with one lane.
Source: Revised from NCHRP Report 457
Westlake ABC
FourHighest
VolumesMajor Minor
Plot four volume combinations on the applicable figure below.
May 19, 2017
1
12:00 PM -1,021 51
1:00 PM
2:00 PM -1,104 83
3:00 PM
Cuyahoga
859 5810:00 AM
Hours Street Street
7:30 AM -1,131 119
135
9:00 AM -
Dover Center RoadWestown Boulevard
8:30 AM
0
100
200
300
400
500
600
700
300 400 500 600 700 800 900 1000 1100 1200 1300 1400 1500 1600 1700
MIN
OR
ST
RE
ET
H
IGH
VO
LU
ME
AP
PR
OA
CH
-V
PH
MAJOR STREET - TOTAL OF BOTH APPROACHES - VPH
FIGURE 4C-1: Criteria for "100%" Volume Level
2 OR MORE LANES & 2 OR MORE LANES
2 OR MORE LANES & 1 LANE
1 LANE & 1 LANE
*115*80
0
100
200
300
400
200 300 400 500 600 700 800 900 1000
MIN
OR
ST
RE
ET
HIG
H V
OL
UM
E A
PP
RO
AC
H -
VP
H
MAJOR STREET - TOTAL OF BOTH APPROACHES - VPH
FIGURE 4C-2: Criteria for "70%" Volume Level
2 OR MORE LANES & 2 OR MORE LANES
2 OR MORE LANES & 1 LANE
1 LANE & 1 LANE
*80
*60
(Community Less than 10,000 population or above 70 km/hr (40 mph) on Major Street)
Page 136
Form 750-020-01TRAFFIC ENGINEERING - 07/99
Page 3 of 52039 BUILD CONDITIONS
TRAFFIC SIGNAL WARRANT SUMMARY
City: Engineer:County: Date:
Major Street: Lanes: Critical Approach Speed:Minor Street: Lanes:
Volume Level Criteria1. Is the critical speed of major street traffic > 70 km/h (40 mph) ? Yes No2. Is the intersection in a built-up area of isolated community of <10,000 population? Yes No
If Question 1 or 2 above is answered "Yes", then use "70%" volume level 70% 100%
WARRANT 3 - PEAK HOUR Applicable: Yes NoIf all three criteria are fullfilled or the plotted point lies above the appropriate line, Satisfied: Yes Nothen the warrant is satisfed.
Record hour when criteria are fulfilled
and the corresponding delay or volume
in boxes provided.
Criteria
* Note: 150 vph applies as the lower threshold volume for a minor street approach with two or more lanes and
100 vph applies as the lower threshold volume threshold for a minor street approach with one lane.
* Note: 100 vph applies as the lower threshold volume for a minor street approach with two or more lanes and
75 vph applies as the lower threshold volume threshold for a minor street approach with one lane.
Source: Revised from NCHRP Report 457
NoYesFulfilled?:
1,420Volume*
650
Fulfilled?:
800
Yes No
*(vehicles per hour)3. Total Entering Volume
Volume Criteria*
No. of Approaches 3
119
Approach Lanes 1 2
Volume Criteria* 100
Volume*
2.8
Yes NoFulfilled?:
150
4
1 2
Delay Criteria* 4.0 5.0
*(vehicles per hour)
Approach Lanes
Delay*
2. Volume on Minor Approach
May 19, 2017
1. Delay on Minor Approach*(vehicle-hours)
Dover Center Road 1
Peak Hour
Unusual condition justifying
use of warrant:
School Bus Traffic
AM 1191131
WestlakeCuyahoga
Plot volume combination on the applicable figure below.
35Westown Boulevard 1
ABC
0
100
200
300
400
500
600
400 500 600 700 800 900 1000 1100 1200 1300 1400 1500 1600 1700 1800
MIN
OR
ST
RE
ET
HIG
H V
OL
UM
E A
PP
RO
AC
H -
VP
H
MAJOR STREET - TOTAL OF BOTH APPROACHES - VPH
FIGURE 4C-3: Criteria for "100%" Volume Level
2 OR MORE LANES & 2 OR MORE LANES
2 OR MORE LANES & 1 LANE
1 LANE & 1 LANE
*150
*100
0
100
200
300
400
500
300 400 500 600 700 800 900 1000 1100 1200 1300
MIN
OR
ST
RE
ET
HIG
H V
OL
UM
E A
PP
RO
AC
H -
VP
H
MAJOR STREET - TOTAL OF BOTH APPROACHES - VPH
FIGURE 4C-4: Criteria for "70%" Volume Level
2 OR MORE LANES & 2 OR MORE LANES
2 OR MORE LANES & 1 LANE
1 LANE & 1 LANE
*100
*75
(Community Less than 10,000 population or above 70 km/hr (40 mph) on Major Street)
Page 137
Form 750-020-01TRAFFIC ENGINEERING - 07/99
Page 4 of 52039 BUILD CONDITIONS
TRAFFIC SIGNAL WARRANT SUMMARY
City: Engineer:County: Date:
Major Street: Lanes: Critical Approach Speed:Minor Street: Lanes:
WARRANT 4 - PEDESTRIAN VOLUME Applicable: Yes NoRecord hours where criteria are fulfilled and the corresponding volume or gap Satisfied: Yes Nofrequency in the boxes provided. The warrant is satisfied if condition 1 or 2 is fulfilled
and condition 3 is fulfilled.
1. Pedestrian volume crossing the major street is
100 ped/hr or more for each of any four hoursand there are less than 60 gaps per hour in the
major street traffic stream of adequate length.
2. Pedestrian volume crossing the major street is190 ped/hr or more for any one hour and there
are less than 60 gaps per hour in the major street
traffic stream of adequate length.
3. The nearest traffic signal along the major street is located more than 90 m (300 ft) away, or the nearest signalis within 90 m (300 ft) but the proposed traffic signal will not restrict the progressive movement of traffic.
WARRANT 5 - SCHOOL CROSSING Applicable: Yes NoRecord hours where criteria are fulfilled and the corresponding volume or gap Satisfied: Yes Nofrequency in the boxes provided. The warrant is satisfied if all three of the criteria
are fulfilled.
1. There are a minimum of 20 students crossing the major street Students: Hour:
during the highest crossing hour.
2. There are fewer adequate gaps in the major street traffic stream during the period Minutes: Gaps:
when the children are using the crossing than the number of minutes in the same period.
3. The nearest traffic signal along the major street is located more than 90 m (300 ft) away, or the nearest signalis within 90 m (300 ft) but the proposed traffic signal will not restrict the progressive movement of traffic.
WARRANT 6 - COORDINATED SIGNAL SYSTEM Applicable: Yes NoIndicate if the criteria are fulfilled in the boxes provided. The warrant is Satisfied: Yes Nosatisfied if either criterion is fulfilled. This warrant should not be applied when the
resulting signal spacing would be less than 300 m (1,000 ft).
1. On a one-way street or a street that has traffic predominately in one direction, the adjacent signals are
so far apart that they do not provide the necessary degree of vehicle platooning.
2. On a two-way street, adjacent signals do not provide the necessary degree of platooning, andthe proposed and adjacent signals will collectively provide a progressive operation.
Source: Revised from NCHRP Report 457
1 35Westown Boulevard 1Dover Center Road
Criteria
4:00 - 5:00 PM0
No
0
YesCriteriaFulfilled?
NoYesFulfilled?
0
Criteria
5:00 - 6:00 PM
Hour Volume7:00 8:00 AM
WestlakeCuyahoga
ABCMay 19, 2017
PedestrianNo
8:00 - 9:00 AM 0
Pedestrian Fulfilled?
0YesGaps
Page 138
Form 750-020-01TRAFFIC ENGINEERING - 07/99
Page 5 of 52039 BUILD CONDITIONS
TRAFFIC SIGNAL WARRANT SUMMARY
City: Engineer:County: Date:
Major Street: Lanes: Critical Approach Speed:Minor Street: Lanes:
WARRANT 7 - CRASH EXPERIENCE Applicable: Yes NoRecord hours where criteria are fulfilled, the corresponding volume, and other Satisfied: Yes Noinformation in the boxes provided. The warrant is satisfied if all three of the criteria
are fulfilled.
1. One of the Warrant 1, Condition A (80% satisfied)
warrants Warrant 1, Condition B (80% satisfied)
to the right
is met.
2. Adequate trial of other remedial measure
has failed to reduce crash frequency.
3. Five or more reported crashes, of types susceptible to correction by signal, have occurred within a 12-mo. period.
WARRANT 8 - ROADWAY NETWORK Applicable: Yes NoRecord hours where criteria are fulfilled, and the corresponding volume or other Satisfied: Yes Noinformation in the boxes provided. The warrant is satisfied if at least one of the criteria
is fulfilled and if all intersecting routes have one or more of the characteristics listed.
1. Both of a. Total entering volume of at least 1,000 veh/hr Entering Volume:
the criteria during a typical weekday peak hour.
to the right b. Five-year projected volumes that satisfy
are met. one or more of Warrants 1, 2, or 3.
2. Total entering volume at least
1,000 veh/hr for each of any 5 hrs
of a non-normal business day(Sat. or Sun.)
1. Part of the street or highway system that serves as the principal roadway
network for through traffic flow.
2. Rural or suburban highway outside of, entering, or traversing a city.
3. Appears as a major route on an official plan.
CONCLUSIONS Warrants Satisfied:
Remarks:
Source: Revised from NCHRP Report 457
Warrant #9 NOT APPLICABLE due to no at grade railroad crossing.INTERSECTION DOES NOT MEET WARRANT CRITERIA UNDER 2039 BUILD CONDITIONS
152 ped/hr for one (1) hour
1 35Westown Boulevard 1
UNKNOWN
2
Number of crashes per 12 months:
Measure tried:
Fulfilled?Yes
Volume
No
NoMet?
YesCriteria
Major Street:
Met?Yes NoHour
Warrant:
Satisfied?:
1
Hour
Fulfilled?Yes No
No Yes NoMet?
2 3
Fulfilled?
Minor Street:
Yes
Major Street:
Minor Street:
Major Street:
Minor Street:
ABCMay 19, 2017
Volume
WestlakeCuyahoga
Dover Center Road
Criteria
Warrant 4, Pedestrian Volume
at 80% of volume requirements:
80 ped/hr for four (4) hours or
Characteristics of Major Routes
Page 139
Form 750-020-01TRAFFIC ENGINEERING - 07/99
Page 3 of 52039 ALTERNATE SCENARIO BUILD CONDITIONS
TRAFFIC SIGNAL WARRANT SUMMARY
City: Engineer:County: Date:
Major Street: Lanes: Critical Approach Speed:Minor Street: Lanes:
Volume Level Criteria1. Is the critical speed of major street traffic > 70 km/h (40 mph) ? Yes No2. Is the intersection in a built-up area of isolated community of <10,000 population? Yes No
If Question 1 or 2 above is answered "Yes", then use "70%" volume level 70% 100%
WARRANT 3 - PEAK HOUR Applicable: Yes NoIf all three criteria are fullfilled or the plotted point lies above the appropriate line, Satisfied: Yes Nothen the warrant is satisfed.
Record hour when criteria are fulfilled
and the corresponding delay or volume
in boxes provided.
Criteria
* Note: 150 vph applies as the lower threshold volume for a minor street approach with two or more lanes and
100 vph applies as the lower threshold volume threshold for a minor street approach with one lane.
* Note: 100 vph applies as the lower threshold volume for a minor street approach with two or more lanes and
75 vph applies as the lower threshold volume threshold for a minor street approach with one lane.
Source: Revised from NCHRP Report 457
NoYesFulfilled?:
1,420Volume*
650
Fulfilled?:
800
Yes No
*(vehicles per hour)3. Total Entering Volume
Volume Criteria*
No. of Approaches 3
119
Approach Lanes 1 2
Volume Criteria* 100
Volume*
2.8
Yes NoFulfilled?:
150
4
1 2
Delay Criteria* 4.0 5.0
*(vehicles per hour)
Approach Lanes
Delay*
2. Volume on Minor Approach
May 19, 2017
1. Delay on Minor Approach*(vehicle-hours)
Dover Center Road 1
Peak Hour
Unusual condition justifying
use of warrant:
School Bus Traffic
AM 1731107
WestlakeCuyahoga
Plot volume combination on the applicable figure below.
35Westown Boulevard 1
ABC
0
100
200
300
400
500
600
400 500 600 700 800 900 1000 1100 1200 1300 1400 1500 1600 1700 1800
MIN
OR
ST
RE
ET
HIG
H V
OL
UM
E A
PP
RO
AC
H -
VP
H
MAJOR STREET - TOTAL OF BOTH APPROACHES - VPH
FIGURE 4C-3: Criteria for "100%" Volume Level
2 OR MORE LANES & 2 OR MORE LANES
2 OR MORE LANES & 1 LANE
1 LANE & 1 LANE
*150
*100
0
100
200
300
400
500
300 400 500 600 700 800 900 1000 1100 1200 1300
MIN
OR
ST
RE
ET
HIG
H V
OL
UM
E A
PP
RO
AC
H -
VP
H
MAJOR STREET - TOTAL OF BOTH APPROACHES - VPH
FIGURE 4C-4: Criteria for "70%" Volume Level
2 OR MORE LANES & 2 OR MORE LANES
2 OR MORE LANES & 1 LANE
1 LANE & 1 LANE
*100
*75
(Community Less than 10,000 population or above 70 km/hr (40 mph) on Major Street)
Page 140
Form 750-020-01TRAFFIC ENGINEERING - 07/99
Page 3 of 52019 BUILD CONDITIONS
TRAFFIC SIGNAL WARRANT SUMMARY
City: Engineer:County: Date:
Major Street: Lanes: Critical Approach Speed:Minor Street: Lanes:
Volume Level Criteria1. Is the critical speed of major street traffic > 70 km/h (40 mph) ? Yes No2. Is the intersection in a built-up area of isolated community of <10,000 population? Yes No
If Question 1 or 2 above is answered "Yes", then use "70%" volume level 70% 100%
WARRANT 3 - PEAK HOUR Applicable: Yes NoIf all three criteria are fullfilled or the plotted point lies above the appropriate line, Satisfied: Yes Nothen the warrant is satisfed.
Record hour when criteria are fulfilled
and the corresponding delay or volume
in boxes provided.
Criteria
* Note: 150 vph applies as the lower threshold volume for a minor street approach with two or more lanes and
100 vph applies as the lower threshold volume threshold for a minor street approach with one lane.
* Note: 100 vph applies as the lower threshold volume for a minor street approach with two or more lanes and
75 vph applies as the lower threshold volume threshold for a minor street approach with one lane.
Source: Revised from NCHRP Report 457
AM 2671066
WestlakeCuyahoga
Plot volume combination on the applicable figure below.
35Proposed West Access 1
ABCMay 19, 2017
1. Delay on Minor Approach*(vehicle-hours)
Center Ridge Road 2
Peak Hour
Unusual condition justifying
use of warrant:
School Bus Traffic
4
1 2
Delay Criteria* 4.0 5.0
*(vehicles per hour)
Approach Lanes
Delay*
2. Volume on Minor Approach
Yes NoFulfilled?:
150
267
Approach Lanes 1 2
Volume Criteria* 100
Volume*
650
Fulfilled?:
800
Yes No
*(vehicles per hour)3. Total Entering Volume
Volume Criteria*
No. of Approaches 3
NoYesFulfilled?:
1,333Volume*
0
100
200
300
400
500
600
400 500 600 700 800 900 1000 1100 1200 1300 1400 1500 1600 1700 1800
MIN
OR
ST
RE
ET
HIG
H V
OL
UM
E A
PP
RO
AC
H -
VP
H
MAJOR STREET - TOTAL OF BOTH APPROACHES - VPH
FIGURE 4C-3: Criteria for "100%" Volume Level
2 OR MORE LANES & 2 OR MORE LANES
2 OR MORE LANES & 1 LANE
1 LANE & 1 LANE
*150
*100
0
100
200
300
400
500
300 400 500 600 700 800 900 1000 1100 1200 1300
MIN
OR
ST
RE
ET
HIG
H V
OL
UM
E A
PP
RO
AC
H -
VP
H
MAJOR STREET - TOTAL OF BOTH APPROACHES - VPH
FIGURE 4C-4: Criteria for "70%" Volume Level
2 OR MORE LANES & 2 OR MORE LANES
2 OR MORE LANES & 1 LANE
1 LANE & 1 LANE
*100
*75
(Community Less than 10,000 population or above 70 km/hr (40 mph) on Major Street)
Page 141
Traffic Impact Study Westlake Elementary School, Westlake, Ohio
AppendixJ
BuildCapacityAnalysisWorksheets‐2039
June 5, 2017 TMS Engineers, Inc.
Page 142
HCS7 Signalized Intersection Results Summary
General Information Intersection InformationAgency TMS Engineers, Inc. Duration, h 0.25Analyst ABC Analysis Date May 19, 2017 Area Type OtherJurisdiction Westlake, OH Time Period AM Peak PHF 0.92Urban Street Center Ridge Analysis Year 2039 Analysis Period 1> 7:00Intersection @ Dover Center File Name AM 39 CenterDover-WBNB RTL.xusProject Description Build Conditions
Demand Information EB WB NB SBApproach Movement L T R L T R L T R L T RDemand ( v ), veh/h 327 938 134 118 553 300 232 449 150 200 376 178
Signal Information
GreenYellowRed
7.0 2.4 28.1 7.7 2.4 32.43.6 0.0 3.6 3.6 0.0 3.61.4 0.0 1.4 1.4 0.0 1.4
1 2 3 4
5 6 7 8
Cycle, s 100.0 Reference Phase 2Offset, s 0 Reference Point EndUncoordinated No Simult. Gap E/W OnForce Mode Fixed Simult. Gap N/S On
Timer Results EBL EBT WBL WBT NBL NBT SBL SBTAssigned Phase 5 2 1 6 3 8 7 4Case Number 1.1 4.0 1.1 3.0 1.1 3.0 1.1 4.0Phase Duration, s 14.4 35.5 12.0 33.1 15.1 39.8 12.7 37.4Change Period, ( Y+R c ), s 5.0 5.0 5.0 5.0 5.0 5.0 5.0 5.0Max Allow Headway ( MAH ), s 3.1 0.0 3.1 0.0 3.1 3.1 3.1 3.1Queue Clearance Time ( g s ), s 11.4 7.1 12.1 25.0 9.7 34.4Green Extension Time ( g e ), s 0.0 0.0 0.0 0.0 0.0 2.2 0.0 0.0Phase Call Probability 1.00 1.00 1.00 1.00 1.00 1.00Max Out Probability 1.00 1.00 1.00 0.18 1.00 1.00
Movement Group Results EB WB NB SBApproach Movement L T R L T R L T R L T RAssigned Movement 5 2 12 1 6 16 3 8 18 7 4 14Adjusted Flow Rate ( v ), veh/h 355 595 570 128 601 326 252 488 163 217 602Adjusted Saturation Flow Rate ( s ), veh/h/ln 1781 1870 1788 1767 1766 1610 1781 1870 1610 1781 1768Queue Service Time ( g s ), s 9.4 30.5 30.5 5.1 14.7 16.3 10.1 23.0 6.6 7.7 32.4Cycle Queue Clearance Time ( g c ), s 9.4 30.5 30.5 5.1 14.7 16.3 10.1 23.0 6.6 7.7 32.4Green Ratio ( g/C ) 0.37 0.30 0.30 0.35 0.28 0.36 0.43 0.35 0.42 0.40 0.32Capacity ( c ), veh/h 349 570 545 196 993 576 252 651 673 298 573Volume-to-Capacity Ratio ( X ) 1.019 1.043 1.045 0.655 0.605 0.566 1.001 0.750 0.242 0.730 1.051Back of Queue ( Q ), ft/ln ( 85 th percentile) 313.3 677 646.3 102.4 233.7 233.4 270.1 358.3 99.4 153.5 691.4Back of Queue ( Q ), veh/ln ( 85 th percentile) 12.3 26.7 25.9 4.0 9.1 9.3 10.6 14.1 4.0 6.0 27.2Queue Storage Ratio ( RQ ) ( 85 th percentile) 2.09 0.00 0.00 0.68 0.00 0.00 1.54 0.00 0.00 0.47 0.00Uniform Delay ( d 1 ), s/veh 32.2 34.8 34.8 26.7 31.1 25.8 27.1 28.8 18.8 25.2 33.8Incremental Delay ( d 2 ), s/veh 53.2 49.5 50.8 6.2 2.7 4.0 57.0 4.3 0.1 7.7 51.7Initial Queue Delay ( d 3 ), s/veh 0.0 0.0 0.0 0.0 0.0 0.0 0.0 0.0 0.0 0.0 0.0Control Delay ( d ), s/veh 85.3 84.2 85.6 32.8 33.9 29.8 84.0 33.1 18.9 32.9 85.5Level of Service (LOS) F F F C C C F C B C FApproach Delay, s/veh / LOS 85.0 F 32.5 C 44.7 D 71.6 EIntersection Delay, s/veh / LOS 61.1 E
Multimodal Results EB WB NB SBPedestrian LOS Score / LOS 2.4 B 2.3 B 2.9 C 2.8 CBicycle LOS Score / LOS 1.7 B 1.4 A 2.0 B 1.8 B
Copyright © 2017 University of Florida, All Rights Reserved. HCS7™ Streets Version 7.2.1 Generated: 5/31/2017 12:02:34 PM
Page 143
HCS7 Two-Way Stop-Control Report
General Information Site InformationAnalyst ABC Intersection Center Ridge & Glenmore
Agency/Co. TMS Engineers, Inc. Jurisdiction Westlake, OH
Date Performed 5/19/2017 East/West Street Center Ridge Road
Analysis Year 2039 North/South Street Glenmore Drive
Time Analyzed AM Peak Peak Hour Factor 0.92
Intersection Orientation East-West Analysis Time Period (hrs) 0.25
Project Description Build Conditions
Lanes
Major Street: East-West
Vehicle Volumes and AdjustmentsApproach Eastbound Westbound Northbound Southbound
Movement U L T R U L T R U L T R U L T R
Priority 1U 1 2 3 4U 4 5 6 7 8 9 10 11 12
Number of Lanes 0 0 2 0 0 0 2 0 0 0 0 0 1 0
Configuration LT T T TR LR
Volume, V (veh/h) 10 1284 705 30 30 10
Percent Heavy Vehicles (%) 3 3 3
Proportion Time Blocked
Percent Grade (%) 0
Right Turn Channelized No No No No
Median Type/Storage Undivided
Critical and Follow-up HeadwaysBase Critical Headway (sec)
Critical Headway (sec)
Base Follow-Up Headway (sec)
Follow-Up Headway (sec)
Delay, Queue Length, and Level of ServiceFlow Rate, v (veh/h) 11 44
Capacity, c (veh/h) 813 138
v/c Ratio 0.01 0.32
95% Queue Length, Q₉₅ (veh) 0.0 1.3
Control Delay (s/veh) 9.5 42.8
Level of Service, LOS A E
Approach Delay (s/veh) 0.4 42.8
Approach LOS E
Copyright © 2017 University of Florida. All Rights Reserved. HCS7™ TWSC Version 7.2 Generated: 5/31/2017 7:01:25 AMAM 39 Glenmore.xtw
Page 144
HCS7 Two-Way Stop-Control ReportGeneral Information Site Information
Analyst ABC Intersection Dover Center & Westown
Agency/Co. TMS Engineers, Inc. Jurisdiction Westlake, OH
Date Performed 5/19/2017 East/West Street Westown Boulevard
Analysis Year North/South Street Dover Center Road
Time Analyzed Peak Hour Factor 0.92
Intersection Orientation Analysis Time Period (hrs) 0.25
Project Description
2039
AM Peak
North-South
Build Conditions
Lanes
Major Street: North-South
Vehicle Volumes and AdjustmentsApproach Eastbound Westbound Northbound Southbound
Movement U L T R U L T R U L T R U L T R
Priority 10 11 12 7 8 9 1U 1 2 3 4U 4 5 6
Number of Lanes 0 1 0 0 0 0 0 0 1 0 0 0 1 0
Configuration LR LT TR
Volume, V (veh/h) 95 35 16 726 494 54
Percent Heavy Vehicles (%) 28 17 38
Proportion Time Blocked
Percent Grade (%) 0
Right Turn Channelized No No No No
Median Type/Storage Undivided
Critical and Follow-up HeadwaysBase Critical Headway (sec)
Critical Headway (sec)
Base Follow-Up Headway (sec)
Follow-Up Headway (sec)
Delay, Queue Length, and Level of ServiceFlow Rate, v (veh/h) 141 17
Capacity, c (veh/h) 168 827
v/c Ratio 0.84 0.02
95% Queue Length, Q₉₅ (veh) 5.8 0.1
Control Delay (s/veh) 87.3 9.4
Level of Service, LOS F A
Approach Delay (s/veh) 87.3 0.5
Approach LOS F
Copyright © 2017 University of Florida. All Rights Reserved. HCS7™ TWSC Version 7.2.1 Generated: 5/31/2017 1:07:45 PMAM 39 Westown.xtw
Page 145
HCS7 Signalized Intersection Results Summary
General Information Intersection InformationAgency TMS Engineers, Inc. Duration, h 0.25Analyst ABC Analysis Date May 19, 2017 Area Type OtherJurisdiction Westlake, OH Time Period PM Peak PHF 0.92Urban Street Center Ridge Analysis Year 2039 Analysis Period 1> 7:00Intersection @ Dover Center File Name PM 39 CenterDover-WBNB RTL.xusProject Description Build Conditions
Demand Information EB WB NB SBApproach Movement L T R L T R L T R L T RDemand ( v ), veh/h 185 533 157 108 518 120 224 367 118 140 347 173
Signal Information
GreenYellowRed
7.0 27.7 7.0 2.1 36.2 0.03.6 3.6 3.6 0.0 3.6 0.01.4 1.4 1.4 0.0 1.4 0.0
1 2 3 4
5 6 7 8
Cycle, s 100.0 Reference Phase 2Offset, s 0 Reference Point EndUncoordinated No Simult. Gap E/W OnForce Mode Fixed Simult. Gap N/S On
Timer Results EBL EBT WBL WBT NBL NBT SBL SBTAssigned Phase 5 2 1 6 3 8 7 4Case Number 1.1 4.0 1.1 3.0 1.1 3.0 1.1 4.0Phase Duration, s 12.0 32.7 12.0 32.7 14.1 43.3 12.0 41.2Change Period, ( Y+R c ), s 5.0 5.0 5.0 5.0 5.0 5.0 5.0 5.0Max Allow Headway ( MAH ), s 3.1 0.0 3.1 0.0 3.1 3.1 3.1 3.1Queue Clearance Time ( g s ), s 9.0 6.6 10.7 18.7 7.3 32.1Green Extension Time ( g e ), s 0.0 0.0 0.0 0.0 0.0 2.3 0.0 1.2Phase Call Probability 1.00 1.00 1.00 1.00 1.00 1.00Max Out Probability 1.00 1.00 1.00 0.01 1.00 0.74
Movement Group Results EB WB NB SBApproach Movement L T R L T R L T R L T RAssigned Movement 5 2 12 1 6 16 3 8 18 7 4 14Adjusted Flow Rate ( v ), veh/h 201 390 360 117 563 130 243 399 128 152 565Adjusted Saturation Flow Rate ( s ), veh/h/ln 1781 1870 1723 1767 1766 1610 1781 1870 1610 1781 1765Queue Service Time ( g s ), s 7.0 19.0 19.1 4.6 13.7 5.8 8.7 16.7 4.7 5.3 30.1Cycle Queue Clearance Time ( g c ), s 7.0 19.0 19.1 4.6 13.7 5.8 8.7 16.7 4.7 5.3 30.1Green Ratio ( g/C ) 0.35 0.28 0.28 0.35 0.28 0.35 0.45 0.38 0.45 0.43 0.36Capacity ( c ), veh/h 298 518 477 242 979 559 286 716 729 390 639Volume-to-Capacity Ratio ( X ) 0.674 0.752 0.755 0.485 0.575 0.233 0.851 0.557 0.176 0.391 0.885Back of Queue ( Q ), ft/ln ( 85 th percentile) 147.7 329.8 307 86 219.2 96.3 185.7 254.3 75.9 92.4 470.8Back of Queue ( Q ), veh/ln ( 85 th percentile) 5.8 13.0 12.3 3.4 8.6 3.9 7.3 10.0 3.0 3.6 18.5Queue Storage Ratio ( RQ ) ( 85 th percentile) 0.98 0.00 0.00 0.57 0.00 0.00 1.06 0.00 0.00 0.28 0.00Uniform Delay ( d 1 ), s/veh 27.9 33.0 33.0 25.5 31.1 23.2 23.2 24.2 16.3 19.3 29.9Incremental Delay ( d 2 ), s/veh 4.8 9.7 10.6 0.6 2.5 1.0 20.1 0.6 0.0 0.2 13.5Initial Queue Delay ( d 3 ), s/veh 0.0 0.0 0.0 0.0 0.0 0.0 0.0 0.0 0.0 0.0 0.0Control Delay ( d ), s/veh 32.7 42.7 43.6 26.1 33.6 24.2 43.4 24.8 16.3 19.5 43.5Level of Service (LOS) C D D C C C D C B B DApproach Delay, s/veh / LOS 40.9 D 31.0 C 29.2 C 38.4 DIntersection Delay, s/veh / LOS 35.1 D
Multimodal Results EB WB NB SBPedestrian LOS Score / LOS 2.4 B 2.3 B 2.9 C 2.8 CBicycle LOS Score / LOS 1.3 A 1.2 A 1.8 B 1.7 B
Copyright © 2017 University of Florida, All Rights Reserved. HCS7™ Streets Version 7.2.1 Generated: 5/31/2017 12:16:26 PM
Page 146
HCS7 Two-Way Stop-Control Report
General Information Site InformationAnalyst ABC Intersection Center Ridge & Glenmore
Agency/Co. TMS Engineers, Inc. Jurisdiction Westlake, OH
Date Performed 5/19/2017 East/West Street Center Ridge Road
Analysis Year 2039 North/South Street Glenmore Drive
Time Analyzed PM Peak Peak Hour Factor 0.92
Intersection Orientation East-West Analysis Time Period (hrs) 0.25
Project Description Build Conditions
Lanes
Major Street: East-West
Vehicle Volumes and AdjustmentsApproach Eastbound Westbound Northbound Southbound
Movement U L T R U L T R U L T R U L T R
Priority 1U 1 2 3 4U 4 5 6 7 8 9 10 11 12
Number of Lanes 0 0 2 0 0 0 2 0 0 0 0 0 1 0
Configuration LT T T TR LR
Volume, V (veh/h) 10 708 837 10 10 10
Percent Heavy Vehicles (%) 0 3 3
Proportion Time Blocked
Percent Grade (%) 0
Right Turn Channelized No No No No
Median Type/Storage Undivided
Critical and Follow-up HeadwaysBase Critical Headway (sec)
Critical Headway (sec)
Base Follow-Up Headway (sec)
Follow-Up Headway (sec)
Delay, Queue Length, and Level of ServiceFlow Rate, v (veh/h) 11 22
Capacity, c (veh/h) 750 228
v/c Ratio 0.01 0.10
95% Queue Length, Q₉₅ (veh) 0.0 0.3
Control Delay (s/veh) 9.9 22.4
Level of Service, LOS A C
Approach Delay (s/veh) 0.3 22.4
Approach LOS C
Copyright © 2017 University of Florida. All Rights Reserved. HCS7™ TWSC Version 7.2 Generated: 5/31/2017 7:02:02 AMPM 39 Glenmore.xtw
Page 147
HCS7 Two-Way Stop-Control ReportGeneral Information Site Information
Analyst ABC Intersection Dover Center & Westown
Agency/Co. TMS Engineers, Inc. Jurisdiction Westlake, OH
Date Performed 5/19/2017 East/West Street Westown Boulevard
Analysis Year 2039 North/South Street Dover Center Road
Time Analyzed PM Peak Peak Hour Factor 0.92
Intersection Orientation North-South Analysis Time Period (hrs) 0.25
Project Description Build Conditions
Lanes
Major Street: North-South
Vehicle Volumes and AdjustmentsApproach Eastbound Westbound Northbound Southbound
Movement U L T R U L T R U L T R U L T R
Priority 10 11 12 7 8 9 1U 1 2 3 4U 4 5 6
Number of Lanes 0 1 0 0 0 0 0 0 1 0 0 0 1 0
Configuration LR LT TR
Volume, V (veh/h) 64 26 17 635 539 43
Percent Heavy Vehicles (%) 39 27 41
Proportion Time Blocked
Percent Grade (%) 0
Right Turn Channelized No No No No
Median Type/Storage Undivided
Critical and Follow-up HeadwaysBase Critical Headway (sec)
Critical Headway (sec)
Base Follow-Up Headway (sec)
Follow-Up Headway (sec)
Delay, Queue Length, and Level of ServiceFlow Rate, v (veh/h) 98 18
Capacity, c (veh/h) 172 788
v/c Ratio 0.57 0.02
95% Queue Length, Q₉₅ (veh) 3.0 0.1
Control Delay (s/veh) 50.3 9.7
Level of Service, LOS F A
Approach Delay (s/veh) 50.3 0.6
Approach LOS F
Copyright © 2017 University of Florida. All Rights Reserved. HCS7™ TWSC Version 7.2.1 Generated: 5/31/2017 1:07:05 PMPM 39 Westown.xtw
Page 148
Traffic Impact Study Westlake Elementary School, Westlake, Ohio
AppendixK
BuildCapacityAnalysisWorksheets‐2039w/Improvements
June 5, 2017 TMS Engineers, Inc.
Page 149
HCS7 Signalized Intersection Results Summary
General Information Intersection InformationAgency TMS Engineers, Inc. Duration, h 0.25Analyst ABC Analysis Date May 19, 2017 Area Type OtherJurisdiction Westlake, OH Time Period AM Peak PHF 0.92Urban Street Center Ridge Analysis Year 2039 Analysis Period 1> 7:00Intersection @ Dover Center File Name AM 39 CenterDover-SB TL.xusProject Description SB RTL
Demand Information EB WB NB SBApproach Movement L T R L T R L T R L T RDemand ( v ), veh/h 327 938 134 118 553 300 232 449 150 200 376 178
Signal Information
GreenYellowRed
7.0 2.6 32.4 9.1 28.9 0.03.6 0.0 3.6 3.6 3.6 0.01.4 0.0 1.4 1.4 1.4 0.0
1 2 3 4
5 6 7 8
Cycle, s 100.0 Reference Phase 2Offset, s 0 Reference Point EndUncoordinated No Simult. Gap E/W OnForce Mode Fixed Simult. Gap N/S On
Timer Results EBL EBT WBL WBT NBL NBT SBL SBTAssigned Phase 5 2 1 6 3 8 7 4Case Number 1.1 4.0 1.1 3.0 1.1 3.0 1.1 3.0Phase Duration, s 14.6 40.0 12.0 37.4 14.1 34.0 14.0 33.9Change Period, ( Y+R c ), s 5.0 5.0 5.0 5.0 5.0 5.0 5.0 5.0Max Allow Headway ( MAH ), s 3.1 0.0 3.1 0.0 3.1 3.1 3.1 3.1Queue Clearance Time ( g s ), s 11.6 6.7 11.1 27.1 10.6 21.9Green Extension Time ( g e ), s 0.0 0.0 0.0 0.0 0.0 0.8 0.0 1.9Phase Call Probability 1.00 1.00 1.00 1.00 1.00 1.00Max Out Probability 1.00 1.00 1.00 1.00 1.00 0.35
Movement Group Results EB WB NB SBApproach Movement L T R L T R L T R L T RAssigned Movement 5 2 12 1 6 16 3 8 18 7 4 14Adjusted Flow Rate ( v ), veh/h 355 595 570 128 601 326 252 488 163 217 409 193Adjusted Saturation Flow Rate ( s ), veh/h/ln 1781 1870 1788 1767 1766 1610 1781 1870 1610 1781 1870 1610Queue Service Time ( g s ), s 9.6 30.3 30.4 4.7 13.9 14.9 9.1 25.1 7.2 8.6 19.9 8.4Cycle Queue Clearance Time ( g c ), s 9.6 30.3 30.4 4.7 13.9 14.9 9.1 25.1 7.2 8.6 19.9 8.4Green Ratio ( g/C ) 0.42 0.35 0.35 0.39 0.32 0.41 0.38 0.29 0.36 0.38 0.29 0.39Capacity ( c ), veh/h 395 655 626 208 1145 667 322 542 580 250 541 620Volume-to-Capacity Ratio ( X ) 0.901 0.909 0.911 0.616 0.525 0.489 0.783 0.900 0.281 0.870 0.756 0.312Back of Queue ( Q ), ft/ln ( 85 th percentile) 227.3 525.6 501.7 93 217.3 209.3 189.1 443 109.4 194.1 323.4 122.9Back of Queue ( Q ), veh/ln ( 85 th percentile) 9.0 20.7 20.1 3.6 8.5 8.4 7.4 17.4 4.4 7.6 12.7 4.9Queue Storage Ratio ( RQ ) ( 85 th percentile) 1.52 0.00 0.00 0.62 0.00 0.00 1.08 0.00 0.00 0.60 0.00 0.00Uniform Delay ( d 1 ), s/veh 28.1 31.0 31.0 24.9 27.5 21.5 26.9 34.1 22.8 26.1 32.3 21.5Incremental Delay ( d 2 ), s/veh 22.5 18.8 19.7 4.0 1.7 2.6 10.9 17.5 0.1 25.5 5.4 0.1Initial Queue Delay ( d 3 ), s/veh 0.0 0.0 0.0 0.0 0.0 0.0 0.0 0.0 0.0 0.0 0.0 0.0Control Delay ( d ), s/veh 50.6 49.8 50.7 28.9 29.3 24.1 37.8 51.6 22.9 51.6 37.8 21.6Level of Service (LOS) D D D C C C D D C D D CApproach Delay, s/veh / LOS 50.3 D 27.6 C 42.6 D 37.6 DIntersection Delay, s/veh / LOS 40.7 D
Multimodal Results EB WB NB SBPedestrian LOS Score / LOS 2.4 B 2.4 B 3.0 C 2.8 CBicycle LOS Score / LOS 1.7 B 1.4 A 2.0 B 1.8 B
Copyright © 2017 University of Florida, All Rights Reserved. HCS7™ Streets Version 7.2.1 Generated: 5/31/2017 12:35:38 PM
Page 150
HCS7 Two-Way Stop-Control ReportGeneral Information Site Information
Analyst ABC Intersection Center Ridge & Glenmore
Agency/Co. TMS Engineers, Inc. Jurisdiction Westlake, OH
Date Performed 5/19/2017 East/West Street Center Ridge Road
Analysis Year 2039 North/South Street Glenmore Drive
Time Analyzed AM Peak Peak Hour Factor 0.92
Intersection Orientation East-West Analysis Time Period (hrs) 0.25
Project Description SB RTL & LTL
Lanes
Major Street: East-West
Vehicle Volumes and AdjustmentsApproach Eastbound Westbound Northbound Southbound
Movement U L T R U L T R U L T R U L T R
Priority 1U 1 2 3 4U 4 5 6 7 8 9 10 11 12
Number of Lanes 0 0 2 0 0 0 2 0 0 0 0 1 0 1
Configuration LT T T TR L R
Volume, V (veh/h) 10 1284 705 30 30 10
Percent Heavy Vehicles (%) 3 3 3
Proportion Time Blocked
Percent Grade (%) 0
Right Turn Channelized No No No No
Median Type/Storage Undivided
Critical and Follow-up HeadwaysBase Critical Headway (sec)
Critical Headway (sec)
Base Follow-Up Headway (sec)
Follow-Up Headway (sec)
Delay, Queue Length, and Level of ServiceFlow Rate, v (veh/h) 11 33 11
Capacity, c (veh/h) 813 110 597
v/c Ratio 0.01 0.30 0.02
95% Queue Length, Q₉₅ (veh) 0.0 1.1 0.1
Control Delay (s/veh) 9.5 51.2 11.1
Level of Service, LOS A F B
Approach Delay (s/veh) 0.4 41.2
Approach LOS E
Copyright © 2017 University of Florida. All Rights Reserved. HCS7™ TWSC Version 7.2.1 Generated: 5/31/2017 2:11:57 PMAM 39 Glenmore-SB TL.xtw
Page 151
HCS7 Two-Way Stop-Control ReportGeneral Information Site Information
Analyst ABC Intersection Dover Center & Westown
Agency/Co. TMS Engineers, Inc. Jurisdiction Westlake, OH
Date Performed 5/19/2017 East/West Street Westown Boulevard
Analysis Year 2039 North/South Street Dover Center Road
Time Analyzed AM Peak Peak Hour Factor 0.92
Intersection Orientation North-South Analysis Time Period (hrs) 0.25
Project Description EB RTL & LTL
Lanes
Major Street: North-South
Vehicle Volumes and AdjustmentsApproach Eastbound Westbound Northbound Southbound
Movement U L T R U L T R U L T R U L T R
Priority 10 11 12 7 8 9 1U 1 2 3 4U 4 5 6
Number of Lanes 1 0 1 0 0 0 0 0 1 0 0 0 1 0
Configuration L R LT TR
Volume, V (veh/h) 95 35 16 726 494 54
Percent Heavy Vehicles (%) 28 17 38
Proportion Time Blocked
Percent Grade (%) 0
Right Turn Channelized No No No No
Median Type/Storage Undivided
Critical and Follow-up HeadwaysBase Critical Headway (sec)
Critical Headway (sec)
Base Follow-Up Headway (sec)
Follow-Up Headway (sec)
Delay, Queue Length, and Level of ServiceFlow Rate, v (veh/h) 103 38 17
Capacity, c (veh/h) 135 185 827
v/c Ratio 0.76 0.21 0.02
95% Queue Length, Q₉₅ (veh) 4.5 0.7 0.1
Control Delay (s/veh) 87.9 29.5 9.4
Level of Service, LOS F D A
Approach Delay (s/veh) 72.1 0.5
Approach LOS F
Copyright © 2017 University of Florida. All Rights Reserved. HCS7™ TWSC Version 7.2.1 Generated: 5/31/2017 1:02:28 PMAM 39 Westown-EB TL.xtw
Page 152
HCS7 Roundabouts ReportGeneral Information Site Information
Analyst ABC Intersection Dover Center & Westown
Agency or Co. TMS Engineers, Inc. E/W Street Name Westown Boulevard
Date Performed 5/19/2017 N/S Street Name Dover Center Road
Analysis Year 2039 Analysis Time Period (hrs) 0.25
Time Analyzed AM Peak Peak Hour Factor 0.92
Project Description Roundabout Jurisdiction Westlake, OH
Volume Adjustments and Site Characteristics
Approach EB WB NB SB
Movement U L T R U L T R U L T R U L T R
Number of Lanes (N) 0 0 1 0 0 0 0 0 0 0 1 0 0 0 1 0
Lane Assignment LR LT TR
Volume (V), veh/h 0 95 35 0 16 726 0 494 54
Percent Heavy Vehicles, % 3 28 17 3 38 3 3 3 44
Flow Rate (vPCE), pc/h 0 132 45 0 24 813 0 553 85
Right-Turn Bypass None None None None
Conflicting Lanes 1 1 1
Pedestrians Crossing, p/h 0 0 0
Critical and Follow-Up Headway Adjustment
Approach EB WB NB SB
Lane Left Right Bypass Left Right Bypass Left Right Bypass Left Right Bypass
Critical Headway (s) 4.9763 4.9763 4.9763
Follow-Up Headway (s) 2.6087 2.6087 2.6087
Flow Computations, Capacity and v/c Ratios
Approach EB WB NB SB
Lane Left Right Bypass Left Right Bypass Left Right Bypass Left Right Bypass
Entry Flow (ve), pc/h 177 837 638
Entry Volume veh/h 142 807 596
Circulating Flow (vc), pc/h 553 969 132 24
Exiting Flow (vex), pc/h 0 109 945 598
Capacity (cpce), pc/h 785 1206 1347
Capacity (c), veh/h 628 1163 1258
v/c Ratio (x) 0.23 0.69 0.47
Delay and Level of Service
Approach EB WB NB SB
Lane Left Right Bypass Left Right Bypass Left Right Bypass Left Right Bypass
Lane Control Delay (d), s/veh 8.5 13.3 7.8
Lane LOS A B A
95% Queue, veh 0.9 6.0 2.6
Approach Delay, s/veh 8.5 13.3 7.8
Approach LOS A B A
Intersection Delay, s/veh | LOS 10.7 B
Copyright © 2017 University of Florida. All Rights Reserved. HCS7™ Roundabouts Version 7.2 5/31/2017 7:12:07 AMAM 39 Westown-RDAB.xro
Page 153
HCS7 Signalized Intersection Results Summary
General Information Intersection InformationAgency TMS Engineers, Inc. Duration, h 0.25Analyst ABC Analysis Date May 19, 2017 Area Type OtherJurisdiction Westlake, OH Time Period AM Peak PHF 0.92Urban Street Dover Center @ Analysis Year 2039 Analysis Period 1> 7:00Intersection Westown File Name AM 39 Westown-TS.xusProject Description Traffic Signal
Demand Information EB WB NB SBApproach Movement L T R L T R L T R L T RDemand ( v ), veh/h 95 35 16 726 494 54
Signal Information
GreenYellowRed
0.0 55.8 34.2 0.0 0.0 0.03.6 3.6 3.6 0.0 0.0 0.01.4 1.4 1.4 0.0 0.0 0.0
1 2 3 4
5 6 7 8
Cycle, s 100.0 Reference Phase 2Offset, s 0 Reference Point EndUncoordinated No Simult. Gap E/W OnForce Mode Fixed Simult. Gap N/S On
Timer Results EBL EBT WBL WBT NBL NBT SBL SBTAssigned Phase 4 5 2 6Case Number 9.0 0.0 14.0 8.3Phase Duration, s 39.2 0.0 60.8 60.8Change Period, ( Y+R c ), s 5.0 5.0 5.0 5.0Max Allow Headway ( MAH ), s 3.2 0.0 0.0 0.0Queue Clearance Time ( g s ), s 6.0Green Extension Time ( g e ), s 0.2 0.0 0.0 0.0Phase Call Probability 1.00Max Out Probability 0.00
Movement Group Results EB WB NB SBApproach Movement L T R L T R L T R L T RAssigned Movement 7 14 5 2 6 16Adjusted Flow Rate ( v ), veh/h 103 38 807 596Adjusted Saturation Flow Rate ( s ), veh/h/ln 1810 1610 1805 1794Queue Service Time ( g s ), s 4.0 1.6 7.0 22.0Cycle Queue Clearance Time ( g c ), s 4.0 1.6 35.0 22.0Green Ratio ( g/C ) 0.34 0.34 0.56 0.56Capacity ( c ), veh/h 619 551 1044 1001Volume-to-Capacity Ratio ( X ) 0.167 0.069 0.772 0.595Back of Queue ( Q ), ft/ln ( 85 th percentile) 75.1 26.7 488.8 312.5Back of Queue ( Q ), veh/ln ( 85 th percentile) 3.0 1.1 18.8 12.0Queue Storage Ratio ( RQ ) ( 85 th percentile) 0.00 0.00 0.00 0.00Uniform Delay ( d 1 ), s/veh 23.0 22.2 17.5 14.6Incremental Delay ( d 2 ), s/veh 0.0 0.0 5.5 2.6Initial Queue Delay ( d 3 ), s/veh 0.0 0.0 0.0 0.0Control Delay ( d ), s/veh 23.0 22.2 23.0 17.2Level of Service (LOS) C C C BApproach Delay, s/veh / LOS 22.8 C 0.0 23.0 C 17.2 BIntersection Delay, s/veh / LOS 20.8 C
Multimodal Results EB WB NB SBPedestrian LOS Score / LOS 2.1 B 2.1 B 0.7 A 1.7 BBicycle LOS Score / LOS F 1.8 B 1.5 A
Copyright © 2017 University of Florida, All Rights Reserved. HCS7™ Streets Version 7.2.1 Generated: 6/1/2017 10:43:34 AM
Page 154
HCS7 Signalized Intersection Results Summary
General Information Intersection InformationAgency TMS Engineers, Inc. Duration, h 0.25Analyst ABC Analysis Date May 19, 2017 Area Type OtherJurisdiction Westlake, OH Time Period PM Peak PHF 0.92Urban Street Center Ridge Analysis Year 2039 Analysis Period 1> 7:00Intersection @ Dover Center File Name PM 39 CenterDover-SB RTL.xusProject Description SB RTL
Demand Information EB WB NB SBApproach Movement L T R L T R L T R L T RDemand ( v ), veh/h 185 533 157 108 518 120 224 367 118 140 347 173
Signal Information
GreenYellowRed
7.0 34.2 7.0 0.7 31.1 0.03.6 3.6 3.6 0.0 3.6 0.01.4 1.4 1.4 0.0 1.4 0.0
1 2 3 4
5 6 7 8
Cycle, s 100.0 Reference Phase 2Offset, s 0 Reference Point EndUncoordinated No Simult. Gap E/W OnForce Mode Fixed Simult. Gap N/S On
Timer Results EBL EBT WBL WBT NBL NBT SBL SBTAssigned Phase 5 2 1 6 3 8 7 4Case Number 1.1 4.0 1.1 3.0 1.1 3.0 1.1 3.0Phase Duration, s 12.0 39.2 12.0 39.2 12.7 36.8 12.0 36.1Change Period, ( Y+R c ), s 5.0 5.0 5.0 5.0 5.0 5.0 5.0 5.0Max Allow Headway ( MAH ), s 3.1 0.0 3.1 0.0 3.1 3.1 3.1 3.1Queue Clearance Time ( g s ), s 9.0 6.2 9.7 20.5 7.8 19.4Green Extension Time ( g e ), s 0.0 0.0 0.0 0.0 0.0 1.9 0.0 2.0Phase Call Probability 1.00 1.00 1.00 1.00 1.00 1.00Max Out Probability 1.00 1.00 1.00 0.08 1.00 0.07
Movement Group Results EB WB NB SBApproach Movement L T R L T R L T R L T RAssigned Movement 5 2 12 1 6 16 3 8 18 7 4 14Adjusted Flow Rate ( v ), veh/h 201 390 360 117 563 130 243 399 128 152 377 188Adjusted Saturation Flow Rate ( s ), veh/h/ln 1781 1870 1723 1767 1766 1610 1781 1870 1610 1781 1870 1610Queue Service Time ( g s ), s 7.0 17.3 17.4 4.2 12.5 5.2 7.7 18.5 5.3 5.8 17.4 8.2Cycle Queue Clearance Time ( g c ), s 7.0 17.3 17.4 4.2 12.5 5.2 7.7 18.5 5.3 5.8 17.4 8.2Green Ratio ( g/C ) 0.41 0.34 0.34 0.41 0.34 0.41 0.39 0.32 0.39 0.38 0.31 0.38Capacity ( c ), veh/h 364 640 589 300 1208 663 347 595 625 308 582 613Volume-to-Capacity Ratio ( X ) 0.553 0.609 0.612 0.391 0.466 0.197 0.702 0.671 0.205 0.494 0.648 0.307Back of Queue ( Q ), ft/ln ( 85 th percentile) 125 284.4 263.9 77.4 196.7 86.6 94.8 290.8 84.8 101.1 274.5 120.6Back of Queue ( Q ), veh/ln ( 85 th percentile) 4.9 11.2 10.6 3.0 7.7 3.5 3.7 11.4 3.4 4.0 10.8 4.8Queue Storage Ratio ( RQ ) ( 85 th percentile) 0.83 0.00 0.00 0.52 0.00 0.00 0.54 0.00 0.00 0.31 0.00 0.00Uniform Delay ( d 1 ), s/veh 21.6 27.3 27.4 20.8 25.8 18.8 26.7 29.6 20.3 23.3 29.7 21.7Incremental Delay ( d 2 ), s/veh 1.1 4.3 4.7 0.3 1.3 0.7 5.3 2.4 0.1 0.5 2.0 0.1Initial Queue Delay ( d 3 ), s/veh 0.0 0.0 0.0 0.0 0.0 0.0 0.0 0.0 0.0 0.0 0.0 0.0Control Delay ( d ), s/veh 22.7 31.6 32.1 21.1 27.0 19.5 32.0 32.0 20.4 23.7 31.7 21.8Level of Service (LOS) C C C C C B C C C C C CApproach Delay, s/veh / LOS 29.9 C 25.0 C 30.0 C 27.4 CIntersection Delay, s/veh / LOS 28.2 C
Multimodal Results EB WB NB SBPedestrian LOS Score / LOS 2.4 B 2.4 B 2.9 C 2.8 CBicycle LOS Score / LOS 1.3 A 1.2 A 1.8 B 1.7 B
Copyright © 2017 University of Florida, All Rights Reserved. HCS7™ Streets Version 7.2.1 Generated: 5/31/2017 12:40:35 PM
Page 155
HCS7 Two-Way Stop-Control ReportGeneral Information Site Information
Analyst ABC Intersection Center Ridge & Glenmore
Agency/Co. TMS Engineers, Inc. Jurisdiction Westlake, OH
Date Performed 5/19/2017 East/West Street Center Ridge Road
Analysis Year 2039 North/South Street Glenmore Drive
Time Analyzed PM Peak Peak Hour Factor 0.92
Intersection Orientation East-West Analysis Time Period (hrs) 0.25
Project Description SB RTL & LTL
Lanes
Major Street: East-West
Vehicle Volumes and AdjustmentsApproach Eastbound Westbound Northbound Southbound
Movement U L T R U L T R U L T R U L T R
Priority 1U 1 2 3 4U 4 5 6 7 8 9 10 11 12
Number of Lanes 0 0 2 0 0 0 2 0 0 0 0 1 0 1
Configuration LT T T TR L R
Volume, V (veh/h) 10 708 837 10 10 10
Percent Heavy Vehicles (%) 0 3 3
Proportion Time Blocked
Percent Grade (%) 0
Right Turn Channelized No No No No
Median Type/Storage Undivided
Critical and Follow-up HeadwaysBase Critical Headway (sec)
Critical Headway (sec)
Base Follow-Up Headway (sec)
Follow-Up Headway (sec)
Delay, Queue Length, and Level of ServiceFlow Rate, v (veh/h) 11 11 11
Capacity, c (veh/h) 750 144 546
v/c Ratio 0.01 0.08 0.02
95% Queue Length, Q₉₅ (veh) 0.0 0.2 0.1
Control Delay (s/veh) 9.9 32.0 11.7
Level of Service, LOS A D B
Approach Delay (s/veh) 0.3 21.9
Approach LOS C
Copyright © 2017 University of Florida. All Rights Reserved. HCS7™ TWSC Version 7.2.1 Generated: 5/31/2017 2:13:32 PMPM 39 Glenmore-SB TL.xtw
Page 156
HCS7 Two-Way Stop-Control ReportGeneral Information Site Information
Analyst ABC Intersection Dover Center & Westown
Agency/Co. TMS Engineers, Inc. Jurisdiction Westlake, OH
Date Performed 5/19/2017 East/West Street Westown Boulevard
Analysis Year 2039 North/South Street Dover Center Road
Time Analyzed PM Peak Peak Hour Factor 0.92
Intersection Orientation North-South Analysis Time Period (hrs) 0.25
Project Description EB RTL & LTL
Lanes
Major Street: North-South
Vehicle Volumes and AdjustmentsApproach Eastbound Westbound Northbound Southbound
Movement U L T R U L T R U L T R U L T R
Priority 10 11 12 7 8 9 1U 1 2 3 4U 4 5 6
Number of Lanes 0 1 0 0 0 0 0 0 1 0 0 0 1 0
Configuration LR LT TR
Volume, V (veh/h) 64 26 17 635 539 43
Percent Heavy Vehicles (%) 39 27 41
Proportion Time Blocked
Percent Grade (%) 0
Right Turn Channelized No No No No
Median Type/Storage Undivided
Critical and Follow-up HeadwaysBase Critical Headway (sec)
Critical Headway (sec)
Base Follow-Up Headway (sec)
Follow-Up Headway (sec)
Delay, Queue Length, and Level of ServiceFlow Rate, v (veh/h) 98 18
Capacity, c (veh/h) 193 788
v/c Ratio 0.51 0.02
95% Queue Length, Q₉₅ (veh) 2.5 0.1
Control Delay (s/veh) 41.3 9.7
Level of Service, LOS E A
Approach Delay (s/veh) 41.3 0.6
Approach LOS E
Copyright © 2017 University of Florida. All Rights Reserved. HCS7™ TWSC Version 7.2.1 Generated: 5/31/2017 1:03:56 PMPM 39 Westown-EB TL.xtw
Page 157
HCS7 Roundabouts ReportGeneral Information Site Information
Analyst ABC Intersection Dover Center & Westown
Agency or Co. TMS Engineers, Inc. E/W Street Name Westown Boulevard
Date Performed 5/19/2017 N/S Street Name Dover Center Road
Analysis Year 2039 Analysis Time Period (hrs) 0.25
Time Analyzed PM Peak Peak Hour Factor 0.92
Project Description Roundabout Jurisdiction Westlake, OH
Volume Adjustments and Site Characteristics
Approach EB WB NB SB
Movement U L T R U L T R U L T R U L T R
Number of Lanes (N) 0 0 1 0 0 0 0 0 0 0 1 0 0 0 1 0
Lane Assignment LR LT TR
Volume (V), veh/h 0 64 26 0 17 635 0 559 43
Percent Heavy Vehicles, % 3 39 27 3 41 3 3 3 53
Flow Rate (vPCE), pc/h 0 97 36 0 26 711 0 626 72
Right-Turn Bypass None None None None
Conflicting Lanes 1 1 1
Pedestrians Crossing, p/h 0 0 0
Critical and Follow-Up Headway Adjustment
Approach EB WB NB SB
Lane Left Right Bypass Left Right Bypass Left Right Bypass Left Right Bypass
Critical Headway (s) 4.9763 4.9763 4.9763
Follow-Up Headway (s) 2.6087 2.6087 2.6087
Flow Computations, Capacity and v/c Ratios
Approach EB WB NB SB
Lane Left Right Bypass Left Right Bypass Left Right Bypass Left Right Bypass
Entry Flow (ve), pc/h 133 737 698
Entry Volume veh/h 98 709 655
Circulating Flow (vc), pc/h 626 834 97 26
Exiting Flow (vex), pc/h 0 98 808 662
Capacity (cpce), pc/h 729 1250 1344
Capacity (c), veh/h 538 1202 1261
v/c Ratio (x) 0.18 0.59 0.52
Delay and Level of Service
Approach EB WB NB SB
Lane Left Right Bypass Left Right Bypass Left Right Bypass Left Right Bypass
Lane Control Delay (d), s/veh 9.1 10.1 8.5
Lane LOS A B A
95% Queue, veh 0.7 4.0 3.1
Approach Delay, s/veh 9.1 10.1 8.5
Approach LOS A B A
Intersection Delay, s/veh | LOS 9.3 A
Copyright © 2017 University of Florida. All Rights Reserved. HCS7™ Roundabouts Version 7.2 5/31/2017 7:13:08 AMPM 39 Westown-RDAB.xro
Page 158
HCS7 Signalized Intersection Results Summary
General Information Intersection InformationAgency TMS Engineers, Inc. Duration, h 0.25Analyst ABC Analysis Date May 19, 2017 Area Type OtherJurisdiction Westlake, OH Time Period PM Peak PHF 0.92Urban Street Dover Center @ Analysis Year 2039 Analysis Period 1> 7:00Intersection Westown File Name PM 39 Westown-TS.xusProject Description Traffic Signal
Demand Information EB WB NB SBApproach Movement L T R L T R L T R L T RDemand ( v ), veh/h 64 26 17 635 559 43
Signal Information
GreenYellowRed
0.0 54.0 36.0 0.0 0.0 0.03.6 3.6 3.6 0.0 0.0 0.01.4 1.4 1.4 0.0 0.0 0.0
1 2 3 4
5 6 7 8
Cycle, s 100.0 Reference Phase 2Offset, s 0 Reference Point EndUncoordinated No Simult. Gap E/W OnForce Mode Fixed Simult. Gap N/S On
Timer Results EBL EBT WBL WBT NBL NBT SBL SBTAssigned Phase 4 5 2 6Case Number 9.0 0.0 14.0 8.3Phase Duration, s 41.0 0.0 59.0 59.0Change Period, ( Y+R c ), s 5.0 5.0 5.0 5.0Max Allow Headway ( MAH ), s 3.2 0.0 0.0 0.0Queue Clearance Time ( g s ), s 4.6Green Extension Time ( g e ), s 0.2 0.0 0.0 0.0Phase Call Probability 1.00Max Out Probability 0.00
Movement Group Results EB WB NB SBApproach Movement L T R L T R L T R L T RAssigned Movement 7 14 5 2 6 16Adjusted Flow Rate ( v ), veh/h 70 28 709 654Adjusted Saturation Flow Rate ( s ), veh/h/ln 1810 1610 1798 1803Queue Service Time ( g s ), s 2.6 1.1 7.0 26.2Cycle Queue Clearance Time ( g c ), s 2.6 1.1 29.2 26.2Green Ratio ( g/C ) 0.36 0.36 0.54 0.54Capacity ( c ), veh/h 651 580 1008 973Volume-to-Capacity Ratio ( X ) 0.107 0.049 0.703 0.672Back of Queue ( Q ), ft/ln ( 85 th percentile) 48 19.1 414 374Back of Queue ( Q ), veh/ln ( 85 th percentile) 1.9 0.8 15.9 14.4Queue Storage Ratio ( RQ ) ( 85 th percentile) 0.00 0.00 0.00 0.00Uniform Delay ( d 1 ), s/veh 21.3 20.8 17.3 16.6Incremental Delay ( d 2 ), s/veh 0.0 0.0 4.1 3.7Initial Queue Delay ( d 3 ), s/veh 0.0 0.0 0.0 0.0Control Delay ( d ), s/veh 21.3 20.9 21.4 20.3Level of Service (LOS) C C C CApproach Delay, s/veh / LOS 21.2 C 0.0 21.4 C 20.3 CIntersection Delay, s/veh / LOS 20.9 C
Multimodal Results EB WB NB SBPedestrian LOS Score / LOS 2.1 B 2.1 B 0.7 A 1.7 BBicycle LOS Score / LOS F 1.7 B 1.6 B
Copyright © 2017 University of Florida, All Rights Reserved. HCS7™ Streets Version 7.2.1 Generated: 6/1/2017 10:47:07 AM
Page 159
Traffic Impact Study Westlake Elementary School, Westlake, Ohio
AppendixL
AccessCapacityAnalysisWorksheets‐2019
June 5, 2017 TMS Engineers, Inc.
Page 160
HCS7 Signalized Intersection Results Summary
General Information Intersection Information
Agency TMS Engineers, Inc. Duration, h 0.25
Analyst ABC Analysis Date May 19, 2017 Area Type Other
Jurisdiction Westlake, OH Time Period AM Peak PHF 0.92
Urban Street Center Ridge Road Analysis Year 2019 Analysis Period 1> 7:00
Intersection @ West Access File Name AM 19 West.xus
Project Description Build Conditions
Demand Information EB WB NB SB
Approach Movement L T R L T R L T R L T R
Demand ( v ), veh/h 10 990 134 267 556 10 69 10 10 10 10 10
Signal Information
GreenYellowRed
12.2 42.2 7.0 18.6 0.0 0.03.6 3.6 3.6 3.6 0.0 0.01.4 1.4 1.4 1.4 0.0 0.0
1 2 4
5 6 7
Cycle, s 100.0 Reference Phase 2
Offset, s 0 Reference Point End
Uncoordinated No Simult. Gap E/W On
Force Mode Fixed Simult. Gap N/S On
Timer Results EBL EBT WBL WBT NBL NBT SBL SBT
Assigned Phase 2 1 6 3 8 4
Case Number 6.3 1.0 4.0 1.0 4.0 8.3
Phase Duration, s 47.2 17.2 64.4 12.0 35.6 23.6
Change Period, ( Y+R c ), s 5.0 5.0 5.0 5.0 5.0 5.0
Max Allow Headway ( MAH ), s 0.0 3.1 0.0 3.1 3.2 3.2
Queue Clearance Time ( g s ), s 10.3 5.1 2.9 3.5
Green Extension Time ( g e ), s 0.0 0.1 0.0 0.0 0.1 0.1
Phase Call Probability 1.00 1.00 1.00 1.00
Max Out Probability 1.00 1.00 0.00 0.00
Movement Group Results EB WB NB SB
Approach Movement L T R L T R L T R L T R
Assigned Movement 5 2 12 1 6 16 3 8 18 7 4 14
Adjusted Flow Rate ( v ), veh/h 11 623 599 290 308 307 75 22 33
Adjusted Saturation Flow Rate ( s ), veh/h/ln 820 1856 1778 1810 1856 1844 1810 1743 1654
Queue Service Time ( g s ), s 0.8 29.2 29.3 8.3 8.1 8.1 3.1 0.9 0.0
Cycle Queue Clearance Time ( g c ), s 0.8 29.2 29.3 8.3 8.1 8.1 3.1 0.9 1.5
Green Ratio ( g/C ) 0.42 0.42 0.42 0.56 0.59 0.59 0.28 0.31 0.19
Capacity ( c ), veh/h 418 783 750 352 1102 1095 440 533 356
Volume-to-Capacity Ratio ( X ) 0.026 0.796 0.798 0.824 0.280 0.280 0.170 0.041 0.092
Back of Queue ( Q ), ft/ln ( 85 th percentile) 7 456.7 433.3 165.5 130.2 126.6 60.1 16.1 29.3
Back of Queue ( Q ), veh/ln ( 85 th percentile) 0.3 17.8 17.3 6.6 5.1 5.1 2.4 0.6 1.2
Queue Storage Ratio ( RQ ) ( 85 th percentile) 0.00 0.00 0.00 0.00 0.00 0.00 0.00 0.00 0.00
Uniform Delay ( d 1 ), s/veh 16.9 25.1 25.2 19.8 9.9 9.9 27.4 24.4 33.7
Incremental Delay ( d 2 ), s/veh 0.1 8.2 8.7 13.7 0.6 0.6 0.1 0.0 0.0
Initial Queue Delay ( d 3 ), s/veh 0.0 0.0 0.0 0.0 0.0 0.0 0.0 0.0 0.0
Control Delay ( d ), s/veh 17.0 33.4 33.8 33.5 10.5 10.5 27.5 24.4 33.8
Level of Service (LOS) B C C C B B C C C
Approach Delay, s/veh / LOS 33.5 C 17.9 B 26.8 C 33.8 C
Intersection Delay, s/veh / LOS 27.0 C
Multimodal Results EB WB NB SB
Pedestrian LOS Score / LOS 2.3 B 2.1 B 2.8 C 2.8 C
Bicycle LOS Score / LOS 1.5 B 1.2 A 0.6 A 0.5 A
Copyright © 2017 University of Florida, All Rights Reserved. HCS7™ Streets Version 7.2 Generated: 5/30/2017 4:41:06 PM
Page 161
HCS7 Two-Way Stop-Control Report
General Information Site InformationAnalyst ABC Intersection Center Ridge & East
Agency/Co. TMS Engineers, Inc. Jurisdiction Westlake, OH
Date Performed 5/19/2017 East/West Street Center Ridge Road
Analysis Year 2019 North/South Street East Access
Time Analyzed AM Peak Peak Hour Factor 0.92
Intersection Orientation East-West Analysis Time Period (hrs) 0.25
Project Description Build Conditions
Lanes
Major Street: East-West
Vehicle Volumes and AdjustmentsApproach Eastbound Westbound Northbound Southbound
Movement U L T R U L T R U L T R U L T R
Priority 1U 1 2 3 4U 4 5 6 7 8 9 10 11 12
Number of Lanes 0 0 2 0 0 0 2 0 0 0 1 0 0 0
Configuration T TR T R
Volume, V (veh/h) 990 10 823 269
Percent Heavy Vehicles (%) 0
Proportion Time Blocked
Percent Grade (%) 0
Right Turn Channelized No No No No
Median Type/Storage Undivided
Critical and Follow-up HeadwaysBase Critical Headway (sec) 6.9
Critical Headway (sec) 6.90
Base Follow-Up Headway (sec) 3.3
Follow-Up Headway (sec) 3.30
Delay, Queue Length, and Level of ServiceFlow Rate, v (veh/h) 292
Capacity, c (veh/h) 488
v/c Ratio 0.60
95% Queue Length, Q₉₅ (veh) 3.9
Control Delay (s/veh) 22.7
Level of Service, LOS C
Approach Delay (s/veh) 22.7
Approach LOS C
Copyright © 2017 University of Florida. All Rights Reserved. HCS7™ TWSC Version 7.2 Generated: 5/30/2017 4:32:31 PMAM 19 East.xtw
Page 162
HCS7 Signalized Intersection Results Summary
General Information Intersection Information
Agency TMS Engineers, Inc. Duration, h 0.25
Analyst ABC Analysis Date May 19, 2017 Area Type Other
Jurisdiction Westlake, OH Time Period PM Peak PHF 0.92
Urban Street Center Ridge Road Analysis Year 2019 Analysis Period 1> 7:00
Intersection @ West Access File Name PM 19 West.xus
Project Description Build Conditions
Demand Information EB WB NB SB
Approach Movement L T R L T R L T R L T R
Demand ( v ), veh/h 10 568 40 106 659 10 58 10 10 10 10 10
Signal Information
GreenYellowRed
0.0 0.0 0.0 0.0 0.0 0.00.0 0.0 0.0 0.0 0.0 0.00.0 0.0 0.0 0.0 0.0 0.0
1 2 4
5 6 7
Cycle, s 100.0 Reference Phase 2
Offset, s 0 Reference Point End
Uncoordinated No Simult. Gap E/W On
Force Mode Fixed Simult. Gap N/S On
Timer Results EBL EBT WBL WBT NBL NBT SBL SBT
Assigned Phase 2 1 6 3 8 4
Case Number 6.3 1.0 4.0 1.0 4.0 8.3
Phase Duration, s 40.2 12.0 52.2 12.0 47.8 35.8
Change Period, ( Y+R c ), s 5.0 5.0 5.0 5.0 5.0 5.0
Max Allow Headway ( MAH ), s 0.0 0.0 0.0 0.0 0.0 0.0
Queue Clearance Time ( g s ), s 0.0 0.0 0.0 0.0 0.0 0.0
Green Extension Time ( g e ), s 0.0 0.0 0.0 0.0 0.0 0.0
Phase Call Probability 0.00 0.00 0.00 0.00 0.00 0.00
Max Out Probability 0.00 0.00 0.00 0.00 0.00 0.00
Movement Group Results EB WB NB SB
Approach Movement L T R L T R L T R L T R
Assigned Movement 5 2 12 1 6 16 3 8 18 7 4 14
Adjusted Flow Rate ( v ), veh/h 0 0 0 0 0 0 0 0 0
Adjusted Saturation Flow Rate ( s ), veh/h/ln 0 0 0 0 0 0 0 0 0
Queue Service Time ( g s ), s 0.0 0.0 0.0 0.0 0.0 0.0 0.0 0.0 0.0
Cycle Queue Clearance Time ( g c ), s 0.0 0.0 0.0 0.0 0.0 0.0 0.0 0.0 0.0
Green Ratio ( g/C ) 0.35 0.35 0.35 0.44 0.47 0.47 0.40 0.43 0.31
Capacity ( c ), veh/h 325 653 638 363 876 871 199 746 120
Volume-to-Capacity Ratio ( X ) 0.033 0.511 0.513 0.317 0.416 0.416 0.317 0.029 0.273
Back of Queue ( Q ), ft/ln ( 85 th percentile) 8.3 236.6 227.2 69.1 206.3 200.7 67.5 12.7 24.8
Back of Queue ( Q ), veh/ln ( 85 th percentile) 0.3 9.2 9.1 2.8 8.1 8.0 2.7 0.5 1.0
Queue Storage Ratio ( RQ ) ( 85 th percentile) 0.00 0.00 0.00 0.00 0.00 0.00 0.00 0.00 0.00
Uniform Delay ( d 1 ), s/veh 21.9 25.6 25.6 18.2 17.3 17.3 24.2 16.6 28.0
Incremental Delay ( d 2 ), s/veh 0.2 2.8 2.9 0.2 1.5 1.5 0.3 0.0 0.5
Initial Queue Delay ( d 3 ), s/veh 0.0 0.0 0.0 0.0 0.0 0.0 0.0 0.0 0.0
Control Delay ( d ), s/veh 22.1 28.4 28.5 18.4 18.8 18.8 24.5 16.6 28.4
Level of Service (LOS) C C C B B B C B C
Approach Delay, s/veh / LOS 28.4 C 18.7 B 22.5 C 28.4 C
Intersection Delay, s/veh / LOS 23.1 C
Multimodal Results EB WB NB SB
Pedestrian LOS Score / LOS 2.3 B 2.1 B 2.8 C 2.8 C
Bicycle LOS Score / LOS 1.0 A 1.2 A 0.6 A 0.5 A
Copyright © 2017 University of Florida, All Rights Reserved. HCS7™ Streets Version 7.2 Generated: 5/30/2017 12:31:09 PM
Page 163
HCS7 Two-Way Stop-Control Report
General Information Site InformationAnalyst ABC Intersection Center Ridge & East
Agency/Co. TMS Engineers, Inc. Jurisdiction Westlake, OH
Date Performed 5/19/2017 East/West Street Center Ridge Road
Analysis Year 2019 North/South Street East Access
Time Analyzed PM Peak Peak Hour Factor 0.92
Intersection Orientation East-West Analysis Time Period (hrs) 0.25
Project Description Build Conditions
Lanes
Major Street: East-West
Vehicle Volumes and AdjustmentsApproach Eastbound Westbound Northbound Southbound
Movement U L T R U L T R U L T R U L T R
Priority 1U 1 2 3 4U 4 5 6 7 8 9 10 11 12
Number of Lanes 0 0 2 0 0 0 2 0 0 0 1 0 0 0
Configuration T TR T R
Volume, V (veh/h) 568 10 765 137
Percent Heavy Vehicles (%) 0
Proportion Time Blocked
Percent Grade (%) 0
Right Turn Channelized No No No No
Median Type/Storage Undivided
Critical and Follow-up HeadwaysBase Critical Headway (sec) 6.9
Critical Headway (sec) 6.90
Base Follow-Up Headway (sec) 3.3
Follow-Up Headway (sec) 3.30
Delay, Queue Length, and Level of ServiceFlow Rate, v (veh/h) 149
Capacity, c (veh/h) 688
v/c Ratio 0.22
95% Queue Length, Q₉₅ (veh) 0.8
Control Delay (s/veh) 11.7
Level of Service, LOS B
Approach Delay (s/veh) 11.7
Approach LOS B
Copyright © 2017 University of Florida. All Rights Reserved. HCS7™ TWSC Version 7.2 Generated: 5/30/2017 4:33:54 PMPM 19 East.xtw
Page 164
Traffic Impact Study Westlake Elementary School, Westlake, Ohio
AppendixM
AccessCapacityAnalysisWorksheets‐2039
June 5, 2017 TMS Engineers, Inc.
Page 165
HCS7 Signalized Intersection Results Summary
General Information Intersection Information
Agency TMS Engineers, Inc. Duration, h 0.25
Analyst ABC Analysis Date May 19, 2017 Area Type Other
Jurisdiction Westlake, OH Time Period AM Peak PHF 0.92
Urban Street Center Ridge Road Analysis Year 2039 Analysis Period 1> 7:00
Intersection @ West Access File Name AM 39 West.xus
Project Description Build Conditions
Demand Information EB WB NB SB
Approach Movement L T R L T R L T R L T R
Demand ( v ), veh/h 10 1180 134 267 666 10 69 10 10 10 10 10
Signal Information
GreenYellowRed
13.6 45.1 7.0 14.3 0.0 0.03.6 3.6 3.6 3.6 0.0 0.01.4 1.4 1.4 1.4 0.0 0.0
1 2 4
5 6 7
Cycle, s 100.0 Reference Phase 2
Offset, s 0 Reference Point End
Uncoordinated No Simult. Gap E/W On
Force Mode Fixed Simult. Gap N/S On
Timer Results EBL EBT WBL WBT NBL NBT SBL SBT
Assigned Phase 2 1 6 3 8 4
Case Number 6.3 1.0 4.0 1.0 4.0 8.3
Phase Duration, s 50.1 18.6 68.7 12.0 31.3 19.3
Change Period, ( Y+R c ), s 5.0 5.0 5.0 5.0 5.0 5.0
Max Allow Headway ( MAH ), s 0.0 3.1 0.0 3.1 3.2 3.2
Queue Clearance Time ( g s ), s 11.4 5.3 2.9 3.6
Green Extension Time ( g e ), s 0.0 0.1 0.0 0.0 0.1 0.0
Phase Call Probability 1.00 1.00 1.00 1.00
Max Out Probability 1.00 1.00 0.00 0.00
Movement Group Results EB WB NB SB
Approach Movement L T R L T R L T R L T R
Assigned Movement 5 2 12 1 6 16 3 8 18 7 4 14
Adjusted Flow Rate ( v ), veh/h 11 724 704 290 368 366 75 22 33
Adjusted Saturation Flow Rate ( s ), veh/h/ln 734 1856 1789 1810 1856 1846 1810 1743 1663
Queue Service Time ( g s ), s 0.8 35.2 35.6 9.4 9.0 9.0 3.3 0.9 0.0
Cycle Queue Clearance Time ( g c ), s 0.8 35.2 35.6 9.4 9.0 9.0 3.3 0.9 1.6
Green Ratio ( g/C ) 0.45 0.45 0.45 0.61 0.64 0.64 0.23 0.26 0.14
Capacity ( c ), veh/h 403 837 807 354 1182 1176 378 458 286
Volume-to-Capacity Ratio ( X ) 0.027 0.866 0.872 0.819 0.312 0.312 0.198 0.047 0.114
Back of Queue ( Q ), ft/ln ( 85 th percentile) 6.7 548.1 529 283.1 137.4 133.7 64.3 17.3 31.2
Back of Queue ( Q ), veh/ln ( 85 th percentile) 0.3 21.4 21.2 11.3 5.4 5.3 2.6 0.7 1.2
Queue Storage Ratio ( RQ ) ( 85 th percentile) 0.00 0.00 0.00 0.00 0.00 0.00 0.00 0.00 0.00
Uniform Delay ( d 1 ), s/veh 15.3 24.7 24.8 24.4 8.2 8.2 30.8 27.5 37.4
Incremental Delay ( d 2 ), s/veh 0.1 11.6 12.5 13.2 0.7 0.7 0.1 0.0 0.1
Initial Queue Delay ( d 3 ), s/veh 0.0 0.0 0.0 0.0 0.0 0.0 0.0 0.0 0.0
Control Delay ( d ), s/veh 15.4 36.3 37.4 37.6 8.9 8.9 30.8 27.5 37.5
Level of Service (LOS) B D D D A A C C D
Approach Delay, s/veh / LOS 36.7 D 17.0 B 30.1 C 37.5 D
Intersection Delay, s/veh / LOS 28.7 C
Multimodal Results EB WB NB SB
Pedestrian LOS Score / LOS 2.3 B 2.1 B 2.8 C 2.9 C
Bicycle LOS Score / LOS 1.7 B 1.3 A 0.6 A 0.5 A
Copyright © 2017 University of Florida, All Rights Reserved. HCS7™ Streets Version 7.2 Generated: 5/30/2017 4:40:22 PM
Page 166
HCS7 Two-Way Stop-Control Report
General Information Site InformationAnalyst ABC Intersection Center Ridge & East
Agency/Co. TMS Engineers, Inc. Jurisdiction Westlake, OH
Date Performed 5/19/2017 East/West Street Center Ridge Road
Analysis Year 2039 North/South Street East Access
Time Analyzed AM Peak Peak Hour Factor 0.92
Intersection Orientation East-West Analysis Time Period (hrs) 0.25
Project Description Build Conditions
Lanes
Major Street: East-West
Vehicle Volumes and AdjustmentsApproach Eastbound Westbound Northbound Southbound
Movement U L T R U L T R U L T R U L T R
Priority 1U 1 2 3 4U 4 5 6 7 8 9 10 11 12
Number of Lanes 0 0 2 0 0 0 2 0 0 0 1 0 0 0
Configuration T TR T R
Volume, V (veh/h) 1180 10 933 269
Percent Heavy Vehicles (%) 0
Proportion Time Blocked
Percent Grade (%) 0
Right Turn Channelized No No No No
Median Type/Storage Undivided
Critical and Follow-up HeadwaysBase Critical Headway (sec)
Critical Headway (sec)
Base Follow-Up Headway (sec)
Follow-Up Headway (sec)
Delay, Queue Length, and Level of ServiceFlow Rate, v (veh/h) 292
Capacity, c (veh/h) 419
v/c Ratio 0.70
95% Queue Length, Q₉₅ (veh) 5.2
Control Delay (s/veh) 31.2
Level of Service, LOS D
Approach Delay (s/veh) 31.2
Approach LOS D
Copyright © 2017 University of Florida. All Rights Reserved. HCS7™ TWSC Version 7.2 Generated: 5/30/2017 4:47:11 PMAM 19 East.xtw
Page 167
HCS7 Signalized Intersection Results Summary
General Information Intersection Information
Agency TMS Engineers, Inc. Duration, h 0.25
Analyst ABC Analysis Date May 19, 2017 Area Type Other
Jurisdiction Westlake, OH Time Period PM Peak PHF 0.92
Urban Street Center Ridge Road Analysis Year 2019 Analysis Period 1> 7:00
Intersection @ West Access File Name PM 39 West.xus
Project Description Build Conditions
Demand Information EB WB NB SB
Approach Movement L T R L T R L T R L T R
Demand ( v ), veh/h 10 678 40 106 789 10 58 10 10 10 10 10
Signal Information
GreenYellowRed
7.0 38.7 7.0 27.3 0.0 0.03.6 3.6 3.6 3.6 0.0 0.01.4 1.4 1.4 1.4 0.0 0.0
1 2 4
5 6 7
Cycle, s 100.0 Reference Phase 2
Offset, s 0 Reference Point End
Uncoordinated No Simult. Gap E/W On
Force Mode Fixed Simult. Gap N/S On
Timer Results EBL EBT WBL WBT NBL NBT SBL SBT
Assigned Phase 2 1 6 3 8 4
Case Number 6.3 1.0 4.0 1.0 4.0 8.3
Phase Duration, s 43.7 12.0 55.7 12.0 44.3 32.3
Change Period, ( Y+R c ), s 5.0 5.0 5.0 5.0 5.0 5.0
Max Allow Headway ( MAH ), s 0.0 3.1 0.0 3.1 3.2 3.2
Queue Clearance Time ( g s ), s 5.6 4.3 2.8 3.3
Green Extension Time ( g e ), s 0.0 0.0 0.0 0.0 0.1 0.1
Phase Call Probability 1.00 1.00 1.00 1.00
Max Out Probability 1.00 1.00 0.00 0.00
Movement Group Results EB WB NB SB
Approach Movement L T R L T R L T R L T R
Assigned Movement 5 2 12 1 6 16 3 8 18 7 4 14
Adjusted Flow Rate ( v ), veh/h 11 394 386 115 435 433 63 22 33
Adjusted Saturation Flow Rate ( s ), veh/h/ln 648 1856 1819 1810 1856 1847 1810 1743 1642
Queue Service Time ( g s ), s 1.1 16.5 16.5 3.6 15.1 15.1 2.3 0.8 0.0
Cycle Queue Clearance Time ( g c ), s 4.2 16.5 16.5 3.6 15.1 15.1 2.3 0.8 1.3
Green Ratio ( g/C ) 0.39 0.39 0.39 0.48 0.51 0.51 0.36 0.39 0.27
Capacity ( c ), veh/h 302 718 704 354 941 937 565 685 496
Volume-to-Capacity Ratio ( X ) 0.036 0.549 0.549 0.325 0.463 0.463 0.112 0.032 0.066
Back of Queue ( Q ), ft/ln ( 85 th percentile) 8.2 267 256.9 63.7 233 226.8 42.9 13.7 25.7
Back of Queue ( Q ), veh/ln ( 85 th percentile) 0.3 10.4 10.3 2.5 9.1 9.1 1.7 0.5 1.0
Queue Storage Ratio ( RQ ) ( 85 th percentile) 0.00 0.00 0.00 0.00 0.00 0.00 0.00 0.00 0.00
Uniform Delay ( d 1 ), s/veh 21.1 23.9 23.9 16.7 15.9 15.9 21.1 18.7 26.9
Incremental Delay ( d 2 ), s/veh 0.2 3.0 3.1 0.2 1.6 1.6 0.0 0.0 0.0
Initial Queue Delay ( d 3 ), s/veh 0.0 0.0 0.0 0.0 0.0 0.0 0.0 0.0 0.0
Control Delay ( d ), s/veh 21.3 26.9 26.9 16.9 17.5 17.5 21.1 18.7 26.9
Level of Service (LOS) C C C B B B C B C
Approach Delay, s/veh / LOS 26.8 C 17.4 B 20.5 C 26.9 C
Intersection Delay, s/veh / LOS 21.7 C
Multimodal Results EB WB NB SB
Pedestrian LOS Score / LOS 2.3 B 2.1 B 2.8 C 2.8 C
Bicycle LOS Score / LOS 1.1 A 1.3 A 0.6 A 0.5 A
Copyright © 2017 University of Florida, All Rights Reserved. HCS7™ Streets Version 7.2 Generated: 5/30/2017 4:48:06 PM
Page 168
HCS7 Two-Way Stop-Control Report
General Information Site InformationAnalyst ABC Intersection Center Ridge & East
Agency/Co. TMS Engineers, Inc. Jurisdiction Westlake, OH
Date Performed 5/19/2017 East/West Street Center Ridge Road
Analysis Year 2019 North/South Street East Access
Time Analyzed PM Peak Peak Hour Factor 0.92
Intersection Orientation East-West Analysis Time Period (hrs) 0.25
Project Description Build Conditions
Lanes
Major Street: East-West
Vehicle Volumes and AdjustmentsApproach Eastbound Westbound Northbound Southbound
Movement U L T R U L T R U L T R U L T R
Priority 1U 1 2 3 4U 4 5 6 7 8 9 10 11 12
Number of Lanes 0 0 2 0 0 0 2 0 0 0 1 0 0 0
Configuration T TR T R
Volume, V (veh/h) 678 10 895 137
Percent Heavy Vehicles (%) 0
Proportion Time Blocked
Percent Grade (%) 0
Right Turn Channelized No No No No
Median Type/Storage Undivided
Critical and Follow-up HeadwaysBase Critical Headway (sec)
Critical Headway (sec)
Base Follow-Up Headway (sec)
Follow-Up Headway (sec)
Delay, Queue Length, and Level of ServiceFlow Rate, v (veh/h) 149
Capacity, c (veh/h) 629
v/c Ratio 0.24
95% Queue Length, Q₉₅ (veh) 0.9
Control Delay (s/veh) 12.5
Level of Service, LOS B
Approach Delay (s/veh) 12.5
Approach LOS B
Copyright © 2017 University of Florida. All Rights Reserved. HCS7™ TWSC Version 7.2 Generated: 5/30/2017 4:50:21 PMPM 19 East.xtw
Page 169
Traffic Impact Study Westlake Elementary School, Westlake, Ohio
AppendixN
ODOTTurnLaneWarrantGraphs
June 5, 2017 TMS Engineers, Inc.
Page 170
CE
NT
ER
RID
GE
RO
AD
& E
AS
T A
CC
ES
S
2019
Bu
ild –
WA
RR
AN
T IS
ME
T
AM
Ad
van
cin
g V
olu
me
= 1
000
vph
AM
Rig
ht
Tu
rn V
olu
me
= 1
0 vp
h
WA
RR
AN
T IS
NO
T M
ET
PM
Ad
van
cin
g V
olu
me
= 5
78 v
ph
PM
Rig
ht
Tu
rn V
olu
me
= 1
0 vp
h
WA
RR
AN
T IS
NO
T M
ET
Page 171
CE
NT
ER
RID
GE
RO
AD
& E
AS
T A
CC
ES
S
2039
Bu
ild –
WA
RR
AN
T IS
ME
T
AM
Ad
van
cin
g V
olu
me
= 1
190
vph
AM
Rig
ht
Tu
rn V
olu
me
= 1
0 vp
h
WA
RR
AN
T IS
NO
T M
ET
PM
Ad
van
cin
g V
olu
me
= 6
88 v
ph
PM
Rig
ht
Tu
rn V
olu
me
= 1
0 vp
h
WA
RR
AN
T IS
NO
T M
ET
Page 172
Traffic Impact Study Westlake Elementary School, Westlake, Ohio
AppendixO
ODOTTurnLaneDesignCriteria
June 5, 2017 TMS Engineers, Inc.
Page 176
Example - Turn Lane Design Using Figures 401-9 and 401-10
Problem
Calculate the length of an exclusive left-turn lane on a signalized intersection approach of a rural arterialhighway (Design Speed - 55 mph). The intersection approach has three comprised on an exclusive leftturn lane and two through lanes with 200 left turning vehicles and 680 through vehicles, respectively. Thetraffic signal has a 90 second cycle length.
Determine Lane Length
Refer to the matrix in Figure 401-9. First, using the given design speed of 55 mph, enter the column withthe design speed “50-60". Next, determine if the left turn demand volume is “high” or “low”. “Low” isconsidered 10% or less of the approach traffic flow. The demand is 200/(680 + 200) = 22.7%. Therefore,the left turn demand is considered “high”. Based on a “signalized” intersection, the matrix indicates thatMethod B or C (whichever is greater) should be used to calculate the length of the left turn lane.
Method B, for the 55 mph design speed, requires a left turn lane length of 285 ft.
Method C is calculated by adding the 164 ft. (for the 55 mph design speed) to the storage lengthdetermined from Figure 401-10. To determine the storage length, first, calculate the number ofcycles/hour (3,600 seconds/hour x 1 cycle/90 seconds = 40 cycles/hour). Next, divide the hourly left turnapproach volume by the number of cycles/hour (200 left turning vehicles divided by 40 cycles/hour = 5). Using Figure 401-10, the required storage length is 200 ft. Adding the 200 ft. storage length to the 164 ft.(moderate speed deceleration length) noted above equals 364 ft. A comparison of the values fromMethod B and Method C yields 285 ft. and 364 ft., respectively. Therefore, use the greater value of 364 ft.
Check Length for Backup
Next, check to determine if backups from the through movements will block left turning vehicles fromentering the left turn lane. Figure 401-10 is also used for this purpose. Using the value of 40 cycles/hour(determined above), calculate the average number of through vehicles per cycle (680/40 = 17). Based onFigure 401-10, this will result in backups of 600 ft. in a single lane. However, since the through trafficvolume is in two through lanes, the backup of through vehicles is only one-half the 600 ft., or 300 ft.
Therefore, the through vehicle backup of 300 ft. per lane will not block left turning vehicles desiring toenter the left turn lane which extends back 364 ft.
October 2004
Page 177
Traffic Impact Study Westlake Elementary School, Westlake, Ohio
AppendixP
CapacityAnalysisWorksheets‐2039AlternateScenario
June 5, 2017 TMS Engineers, Inc.
Page 178
HCS7 Signalized Intersection Results Summary
General Information Intersection InformationAgency TMS Engineers, Inc. Duration, h 0.25Analyst ABC Analysis Date May 19, 2017 Area Type OtherJurisdiction Westlake, OH Time Period AM Peak PHF 0.92Urban Street Center Ridge Analysis Year 2039 Analysis Period 1> 7:00Intersection @ Dover Center File Name AM 39ALT CenterDover-SB RTL.xusProject Description Alternate Scenario
Demand Information EB WB NB SBApproach Movement L T R L T R L T R L T RDemand ( v ), veh/h 327 938 80 118 553 300 146 449 160 200 376 178
Signal Information
GreenYellowRed
7.0 4.1 30.7 7.0 0.8 30.43.6 0.0 3.6 3.6 0.0 3.61.4 0.0 1.4 1.4 0.0 1.4
1 2 3 4
5 6 7 8
Cycle, s 100.0 Reference Phase 2Offset, s 0 Reference Point EndUncoordinated No Simult. Gap E/W OnForce Mode Fixed Simult. Gap N/S On
Timer Results EBL EBT WBL WBT NBL NBT SBL SBTAssigned Phase 5 2 1 6 3 8 7 4Case Number 1.1 4.0 1.1 3.0 1.1 3.0 1.1 3.0Phase Duration, s 16.1 39.8 12.0 35.7 12.0 35.4 12.8 36.2Change Period, ( Y+R c ), s 5.0 5.0 5.0 5.0 5.0 5.0 5.0 5.0Max Allow Headway ( MAH ), s 3.1 0.0 3.1 0.0 3.1 3.1 3.1 3.1Queue Clearance Time ( g s ), s 13.1 6.9 8.1 26.6 9.8 21.2Green Extension Time ( g e ), s 0.0 0.0 0.0 0.0 0.0 1.3 0.0 2.2Phase Call Probability 1.00 1.00 1.00 1.00 1.00 1.00Max Out Probability 1.00 1.00 1.00 0.83 1.00 0.17
Movement Group Results EB WB NB SBApproach Movement L T R L T R L T R L T RAssigned Movement 5 2 12 1 6 16 3 8 18 7 4 14Adjusted Flow Rate ( v ), veh/h 355 561 546 128 601 326 159 488 174 217 409 193Adjusted Saturation Flow Rate ( s ), veh/h/ln 1781 1870 1818 1767 1766 1610 1781 1870 1610 1781 1870 1610Queue Service Time ( g s ), s 11.1 27.9 28.0 4.9 14.2 15.6 6.1 24.6 7.6 7.8 19.2 7.9Cycle Queue Clearance Time ( g c ), s 11.1 27.9 28.0 4.9 14.2 15.6 6.1 24.6 7.6 7.8 19.2 7.9Green Ratio ( g/C ) 0.43 0.35 0.35 0.38 0.31 0.39 0.37 0.30 0.37 0.38 0.31 0.42Capacity ( c ), veh/h 405 651 633 220 1085 620 294 569 602 264 584 681Volume-to-Capacity Ratio ( X ) 0.878 0.862 0.862 0.582 0.554 0.526 0.540 0.858 0.289 0.824 0.700 0.284Back of Queue ( Q ), ft/ln ( 85 th percentile) 186.5 471 454.1 92.8 223.5 221.3 107.5 414.1 113.5 178.7 304.3 115.3Back of Queue ( Q ), veh/ln ( 85 th percentile) 7.3 18.5 18.2 3.6 8.7 8.9 4.2 16.3 4.5 7.0 12.0 4.6Queue Storage Ratio ( RQ ) ( 85 th percentile) 1.24 0.00 0.00 0.62 0.00 0.00 0.61 0.00 0.00 0.55 0.00 0.00Uniform Delay ( d 1 ), s/veh 26.1 30.4 30.4 25.2 28.9 23.7 24.0 32.8 22.0 27.4 30.3 18.9Incremental Delay ( d 2 ), s/veh 18.6 14.1 14.4 2.6 2.0 3.2 1.1 11.9 0.1 17.6 3.2 0.1Initial Queue Delay ( d 3 ), s/veh 0.0 0.0 0.0 0.0 0.0 0.0 0.0 0.0 0.0 0.0 0.0 0.0Control Delay ( d ), s/veh 44.7 44.4 44.8 27.8 31.0 26.9 25.1 44.7 22.1 45.0 33.4 19.0Level of Service (LOS) D D D C C C C D C D C BApproach Delay, s/veh / LOS 44.6 D 29.3 C 36.1 D 33.1 CIntersection Delay, s/veh / LOS 36.8 D
Multimodal Results EB WB NB SBPedestrian LOS Score / LOS 2.4 B 2.4 B 3.0 C 2.8 CBicycle LOS Score / LOS 1.7 B 1.4 A 1.8 B 1.8 B
Copyright © 2017 University of Florida, All Rights Reserved. HCS7™ Streets Version 7.2.1 Generated: 6/1/2017 9:29:04 AM
Page 179
HCS7 Signalized Intersection Results Summary
General Information Intersection InformationAgency TMS Engineers, Inc. Duration, h 0.25Analyst ABC Analysis Date May 19, 2017 Area Type OtherJurisdiction Westlake, OH Time Period AM Peak PHF 0.92Urban Street Center Ridge Road Analysis Year 2039 Analysis Period 1> 7:00Intersection @ Glenmore/West Access File Name AM 39ALT Glenmore.xusProject Description Alternate Scenario
Demand Information EB WB NB SBApproach Movement L T R L T R L T R L T RDemand ( v ), veh/h 10 1150 134 181 636 30 69 10 10 30 10 10
Signal Information
GreenYellowRed
7.3 48.7 29.0 0.0 0.0 0.03.6 3.6 3.6 0.0 0.0 0.01.4 1.4 1.4 0.0 0.0 0.0
1 2 3 4
5 6 7 8
Cycle, s 100.0 Reference Phase 2Offset, s 0 Reference Point EndUncoordinated No Simult. Gap E/W OnForce Mode Fixed Simult. Gap N/S On
Timer Results EBL EBT WBL WBT NBL NBT SBL SBTAssigned Phase 2 1 6 8 4Case Number 6.3 1.0 4.0 6.0 8.0Phase Duration, s 53.7 12.3 66.0 34.0 34.0Change Period, ( Y+R c ), s 5.0 5.0 5.0 5.0 5.0Max Allow Headway ( MAH ), s 0.0 3.1 0.0 3.1 3.1Queue Clearance Time ( g s ), s 7.1 8.5 4.3Green Extension Time ( g e ), s 0.0 0.0 0.0 0.2 0.2Phase Call Probability 1.00 1.00 1.00Max Out Probability 1.00 0.00 0.00
Movement Group Results EB WB NB SBApproach Movement L T R L T R L T R L T RAssigned Movement 5 2 12 1 6 16 3 8 18 7 4 14Adjusted Flow Rate ( v ), veh/h 11 708 687 197 365 359 75 22 54Adjusted Saturation Flow Rate ( s ), veh/h/ln 730 1856 1787 1810 1856 1826 1412 1743 1542Queue Service Time ( g s ), s 0.8 31.7 32.0 5.1 9.5 9.6 4.1 0.9 1.0Cycle Queue Clearance Time ( g c ), s 0.8 31.7 32.0 5.1 9.5 9.6 6.5 0.9 2.3Green Ratio ( g/C ) 0.49 0.49 0.49 0.58 0.61 0.61 0.29 0.29 0.29Capacity ( c ), veh/h 427 904 870 270 1132 1114 448 506 505Volume-to-Capacity Ratio ( X ) 0.025 0.784 0.789 0.730 0.322 0.323 0.167 0.043 0.108Back of Queue ( Q ), ft/ln ( 85 th percentile) 6.2 472.2 453.2 113.3 147.3 142.2 61.9 16.5 42.1Back of Queue ( Q ), veh/ln ( 85 th percentile) 0.2 18.4 18.1 4.5 5.8 5.7 2.5 0.7 1.7Queue Storage Ratio ( RQ ) ( 85 th percentile) 0.00 0.00 0.00 0.00 0.00 0.00 0.00 0.00 0.00Uniform Delay ( d 1 ), s/veh 13.4 21.3 21.4 20.0 9.5 9.5 28.4 25.5 26.0Incremental Delay ( d 2 ), s/veh 0.1 6.8 7.2 8.5 0.8 0.8 0.1 0.0 0.0Initial Queue Delay ( d 3 ), s/veh 0.0 0.0 0.0 0.0 0.0 0.0 0.0 0.0 0.0Control Delay ( d ), s/veh 13.5 28.0 28.6 28.5 10.2 10.2 28.5 25.5 26.0Level of Service (LOS) B C C C B B C C CApproach Delay, s/veh / LOS 28.2 C 14.1 B 27.8 C 26.0 CIntersection Delay, s/veh / LOS 22.9 C
Multimodal Results EB WB NB SBPedestrian LOS Score / LOS 2.3 B 2.1 B 2.8 C 2.8 CBicycle LOS Score / LOS 1.6 B 1.2 A 0.6 A 0.6 A
Copyright © 2017 University of Florida, All Rights Reserved. HCS7™ Streets Version 7.2.1 Generated: 6/1/2017 9:38:58 AM
Page 180
HCS7 Two-Way Stop-Control Report
General Information Site InformationAnalyst ABC Intersection Center Ridge & East
Agency/Co. TMS Engineers, Inc. Jurisdiction Westlake, OH
Date Performed 5/19/2017 East/West Street Center Ridge Road
Analysis Year 2039 North/South Street East Access
Time Analyzed AM Peak Peak Hour Factor 0.92
Intersection Orientation East-West Analysis Time Period (hrs) 0.25
Project Description Alternate Scenario
Lanes
Major Street: East-West
Vehicle Volumes and AdjustmentsApproach Eastbound Westbound Northbound Southbound
Movement U L T R U L T R U L T R U L T R
Priority 1U 1 2 3 4U 4 5 6 7 8 9 10 11 12
Number of Lanes 0 0 2 0 0 0 2 0 0 0 1 0 0 0
Configuration T TR T R
Volume, V (veh/h) 1180 10 847 215
Percent Heavy Vehicles (%) 0
Proportion Time Blocked
Percent Grade (%) 0
Right Turn Channelized No No No No
Median Type/Storage Undivided
Critical and Follow-up HeadwaysBase Critical Headway (sec)
Critical Headway (sec)
Base Follow-Up Headway (sec)
Follow-Up Headway (sec)
Delay, Queue Length, and Level of ServiceFlow Rate, v (veh/h) 234
Capacity, c (veh/h) 419
v/c Ratio 0.56
95% Queue Length, Q₉₅ (veh) 3.3
Control Delay (s/veh) 24.0
Level of Service, LOS C
Approach Delay (s/veh) 24.0
Approach LOS C
Copyright © 2017 University of Florida. All Rights Reserved. HCS7™ TWSC Version 7.2.1 Generated: 6/1/2017 9:52:15 AMAM 39Alt East.xtw
Page 181
HCS7 Two-Way Stop-Control Report
General Information Site InformationAnalyst ABC Intersection Dover Center & Westown
Agency/Co. TMS Engineers, Inc. Jurisdiction Westlake, OH
Date Performed 5/19/2017 East/West Street Westown Boulevard
Analysis Year 2039 North/South Street Dover Center Road
Time Analyzed AM Peak Peak Hour Factor 0.92
Intersection Orientation North-South Analysis Time Period (hrs) 0.25
Project Description Alternate Scenario
Lanes
Major Street: North-South
Vehicle Volumes and AdjustmentsApproach Eastbound Westbound Northbound Southbound
Movement U L T R U L T R U L T R U L T R
Priority 10 11 12 7 8 9 1U 1 2 3 4U 4 5 6
Number of Lanes 1 0 1 0 0 0 0 0 1 0 0 0 1 0
Configuration L R LT TR
Volume, V (veh/h) 95 69 102 640 440 54
Percent Heavy Vehicles (%) 28 9 6
Proportion Time Blocked
Percent Grade (%) 0
Right Turn Channelized No No No No
Median Type/Storage Undivided
Critical and Follow-up HeadwaysBase Critical Headway (sec) 7.1 6.2 4.1
Critical Headway (sec) 6.68 6.29 4.16
Base Follow-Up Headway (sec) 3.5 3.3 2.2
Follow-Up Headway (sec) 3.75 3.38 2.25
Delay, Queue Length, and Level of ServiceFlow Rate, v (veh/h) 103 75 111
Capacity, c (veh/h) 116 551 1013
v/c Ratio 0.88 0.14 0.11
95% Queue Length, Q₉₅ (veh) 5.4 0.5 0.4
Control Delay (s/veh) 123.8 12.6 9.0
Level of Service, LOS F B A
Approach Delay (s/veh) 76.9 2.6
Approach LOS F
Copyright © 2017 University of Florida. All Rights Reserved. HCS7™ TWSC Version 7.2.1 Generated: 6/1/2017 9:57:13 AMAM 39ALT Westown.xtw
Page 182
HCS7 Signalized Intersection Results Summary
General Information Intersection InformationAgency TMS Engineers, Inc. Duration, h 0.25Analyst ABC Analysis Date May 19, 2017 Area Type OtherJurisdiction Westlake, OH Time Period PM Peak PHF 0.92Urban Street Center Ridge Analysis Year 2039 Analysis Period 1> 7:00Intersection @ Dover Center File Name PM 39ALT CenterDover-SB RTL.xusProject Description Alternate Scenario
Demand Information EB WB NB SBApproach Movement L T R L T R L T R L T RDemand ( v ), veh/h 185 533 118 108 518 120 189 367 118 140 347 173
Signal Information
GreenYellowRed
7.0 33.8 7.0 32.2 0.0 0.03.6 3.6 3.6 3.6 0.0 0.01.4 1.4 1.4 1.4 0.0 0.0
1 2 3 4
5 6 7 8
Cycle, s 100.0 Reference Phase 2Offset, s 0 Reference Point EndUncoordinated No Simult. Gap E/W OnForce Mode Fixed Simult. Gap N/S On
Timer Results EBL EBT WBL WBT NBL NBT SBL SBTAssigned Phase 5 2 1 6 3 8 7 4Case Number 1.1 4.0 1.1 3.0 1.1 3.0 1.1 3.0Phase Duration, s 12.0 38.8 12.0 38.8 12.0 37.2 12.0 37.2Change Period, ( Y+R c ), s 5.0 5.0 5.0 5.0 5.0 5.0 5.0 5.0Max Allow Headway ( MAH ), s 3.1 0.0 3.1 0.0 3.1 3.1 3.1 3.1Queue Clearance Time ( g s ), s 9.0 6.2 9.0 20.4 7.7 19.1Green Extension Time ( g e ), s 0.0 0.0 0.0 0.0 0.0 2.0 0.0 2.0Phase Call Probability 1.00 1.00 1.00 1.00 1.00 1.00Max Out Probability 1.00 1.00 1.00 0.07 1.00 0.05
Movement Group Results EB WB NB SBApproach Movement L T R L T R L T R L T RAssigned Movement 5 2 12 1 6 16 3 8 18 7 4 14Adjusted Flow Rate ( v ), veh/h 201 364 343 117 563 130 205 399 128 152 377 188Adjusted Saturation Flow Rate ( s ), veh/h/ln 1781 1870 1752 1767 1766 1610 1781 1870 1610 1781 1870 1610Queue Service Time ( g s ), s 7.0 16.0 16.1 4.2 12.6 5.2 7.0 18.4 5.3 5.7 17.1 8.0Cycle Queue Clearance Time ( g c ), s 7.0 16.0 16.1 4.2 12.6 5.2 7.0 18.4 5.3 5.7 17.1 8.0Green Ratio ( g/C ) 0.41 0.34 0.34 0.41 0.34 0.41 0.39 0.32 0.39 0.39 0.32 0.39Capacity ( c ), veh/h 360 632 592 311 1194 657 328 602 631 313 602 631Volume-to-Capacity Ratio ( X ) 0.559 0.577 0.579 0.377 0.472 0.199 0.626 0.662 0.203 0.486 0.626 0.298Back of Queue ( Q ), ft/ln ( 85 th percentile) 126.2 265.6 249.8 78.1 198.4 87.2 136.4 287.9 84.3 99.2 268.2 118.3Back of Queue ( Q ), veh/ln ( 85 th percentile) 5.0 10.5 10.0 3.1 7.7 3.5 5.4 11.3 3.4 3.9 10.6 4.7Queue Storage Ratio ( RQ ) ( 85 th percentile) 0.84 0.00 0.00 0.52 0.00 0.00 0.78 0.00 0.00 0.31 0.00 0.00Uniform Delay ( d 1 ), s/veh 22.0 27.2 27.2 20.7 26.1 19.1 24.9 29.2 20.1 22.7 28.8 20.9Incremental Delay ( d 2 ), s/veh 1.2 3.8 4.1 0.3 1.3 0.7 2.8 2.2 0.1 0.4 1.6 0.1Initial Queue Delay ( d 3 ), s/veh 0.0 0.0 0.0 0.0 0.0 0.0 0.0 0.0 0.0 0.0 0.0 0.0Control Delay ( d ), s/veh 23.1 31.0 31.3 21.0 27.4 19.7 27.7 31.4 20.1 23.1 30.3 21.0Level of Service (LOS) C C C C C B C C C C C CApproach Delay, s/veh / LOS 29.4 C 25.2 C 28.4 C 26.4 CIntersection Delay, s/veh / LOS 27.4 C
Multimodal Results EB WB NB SBPedestrian LOS Score / LOS 2.4 B 2.4 B 2.9 C 2.8 CBicycle LOS Score / LOS 1.2 A 1.2 A 1.7 B 1.7 B
Copyright © 2017 University of Florida, All Rights Reserved. HCS7™ Streets Version 7.2.1 Generated: 6/1/2017 9:36:29 AM
Page 183
HCS7 Signalized Intersection Results Summary
General Information Intersection InformationAgency TMS Engineers, Inc. Duration, h 0.25Analyst ABC Analysis Date May 19, 2017 Area Type OtherJurisdiction Westlake, OH Time Period PM Peak PHF 0.92Urban Street Center Ridge Road Analysis Year 2039 Analysis Period 1> 7:00Intersection @ Glenmore/West Access File Name PM 39ALT Glenmore.xusProject Description Alternate Scenario
Demand Information EB WB NB SBApproach Movement L T R L T R L T R L T RDemand ( v ), veh/h 10 668 40 71 779 10 58 10 10 10 10 10
Signal Information
GreenYellowRed
7.0 42.7 35.3 0.0 0.0 0.03.6 3.6 3.6 0.0 0.0 0.01.4 1.4 1.4 0.0 0.0 0.0
1 2 3 4
5 6 7 8
Cycle, s 100.0 Reference Phase 2Offset, s 0 Reference Point EndUncoordinated No Simult. Gap E/W OnForce Mode Fixed Simult. Gap N/S On
Timer Results EBL EBT WBL WBT NBL NBT SBL SBTAssigned Phase 2 1 6 8 4Case Number 6.3 1.0 4.0 6.0 8.0Phase Duration, s 47.7 12.0 59.7 40.3 40.3Change Period, ( Y+R c ), s 5.0 5.0 5.0 5.0 5.0Max Allow Headway ( MAH ), s 0.0 3.1 0.0 3.1 3.1Queue Clearance Time ( g s ), s 4.2 6.3 3.2Green Extension Time ( g e ), s 0.0 0.0 0.0 0.2 0.2Phase Call Probability 1.00 1.00 1.00Max Out Probability 1.00 0.00 0.00
Movement Group Results EB WB NB SBApproach Movement L T R L T R L T R L T RAssigned Movement 5 2 12 1 6 16 3 8 18 7 4 14Adjusted Flow Rate ( v ), veh/h 11 389 381 77 430 428 63 22 33Adjusted Saturation Flow Rate ( s ), veh/h/ln 644 1856 1818 1810 1856 1847 1412 1743 1637Queue Service Time ( g s ), s 1.0 15.2 15.2 2.2 13.7 13.7 3.1 0.8 0.0Cycle Queue Clearance Time ( g c ), s 2.7 15.2 15.2 2.2 13.7 13.7 4.3 0.8 1.2Green Ratio ( g/C ) 0.43 0.43 0.43 0.52 0.55 0.55 0.35 0.35 0.35Capacity ( c ), veh/h 336 792 776 394 1015 1010 554 615 626Volume-to-Capacity Ratio ( X ) 0.032 0.490 0.491 0.196 0.423 0.423 0.114 0.035 0.052Back of Queue ( Q ), ft/ln ( 85 th percentile) 7.5 242.9 233.6 37.6 208.8 203.2 45.3 14.8 22.3Back of Queue ( Q ), veh/ln ( 85 th percentile) 0.3 9.5 9.3 1.5 8.2 8.1 1.8 0.6 0.9Queue Storage Ratio ( RQ ) ( 85 th percentile) 0.00 0.00 0.00 0.00 0.00 0.00 0.00 0.00 0.00Uniform Delay ( d 1 ), s/veh 17.7 20.8 20.8 13.8 13.4 13.4 22.7 21.2 21.3Incremental Delay ( d 2 ), s/veh 0.2 2.2 2.2 0.1 1.3 1.3 0.0 0.0 0.0Initial Queue Delay ( d 3 ), s/veh 0.0 0.0 0.0 0.0 0.0 0.0 0.0 0.0 0.0Control Delay ( d ), s/veh 17.9 22.9 23.0 13.9 14.6 14.7 22.8 21.2 21.3Level of Service (LOS) B C C B B B C C CApproach Delay, s/veh / LOS 22.9 C 14.6 B 22.4 C 21.3 CIntersection Delay, s/veh / LOS 18.6 B
Multimodal Results EB WB NB SBPedestrian LOS Score / LOS 2.3 B 2.1 B 2.8 C 2.8 CBicycle LOS Score / LOS 1.1 A 1.3 A 0.6 A 0.5 A
Copyright © 2017 University of Florida, All Rights Reserved. HCS7™ Streets Version 7.2.1 Generated: 6/1/2017 9:38:58 AM
Page 184
HCS7 Two-Way Stop-Control Report
General Information Site InformationAnalyst ABC Intersection Center Ridge & East
Agency/Co. TMS Engineers, Inc. Jurisdiction Westlake, OH
Date Performed 5/19/2017 East/West Street Center Ridge Road
Analysis Year 2039 North/South Street East Access
Time Analyzed PM Peak Peak Hour Factor 0.92
Intersection Orientation East-West Analysis Time Period (hrs) 0.25
Project Description Alternate Scenario
Lanes
Major Street: East-West
Vehicle Volumes and AdjustmentsApproach Eastbound Westbound Northbound Southbound
Movement U L T R U L T R U L T R U L T R
Priority 1U 1 2 3 4U 4 5 6 7 8 9 10 11 12
Number of Lanes 0 0 2 0 0 0 2 0 0 0 1 0 0 0
Configuration T TR T R
Volume, V (veh/h) 678 10 860 98
Percent Heavy Vehicles (%) 0
Proportion Time Blocked
Percent Grade (%) 0
Right Turn Channelized No No No No
Median Type/Storage Undivided
Critical and Follow-up HeadwaysBase Critical Headway (sec) 6.9
Critical Headway (sec) 6.90
Base Follow-Up Headway (sec) 3.3
Follow-Up Headway (sec) 3.30
Delay, Queue Length, and Level of ServiceFlow Rate, v (veh/h) 107
Capacity, c (veh/h) 629
v/c Ratio 0.17
95% Queue Length, Q₉₅ (veh) 0.6
Control Delay (s/veh) 11.9
Level of Service, LOS B
Approach Delay (s/veh) 11.9
Approach LOS B
Copyright © 2017 University of Florida. All Rights Reserved. HCS7™ TWSC Version 7.2.1 Generated: 6/1/2017 9:51:51 AMPM 39Alt East.xtw
Page 185
HCS7 Two-Way Stop-Control Report
General Information Site InformationAnalyst ABC Intersection Dover Center & Westown
Agency/Co. TMS Engineers, Inc. Jurisdiction Westlake, OH
Date Performed 5/19/2017 East/West Street Westown Boulevard
Analysis Year 2039 North/South Street Dover Center Road
Time Analyzed PM Peak Peak Hour Factor 0.92
Intersection Orientation North-South Analysis Time Period (hrs) 0.25
Project Description Alternate Scenario
Lanes
Major Street: North-South
Vehicle Volumes and AdjustmentsApproach Eastbound Westbound Northbound Southbound
Movement U L T R U L T R U L T R U L T R
Priority 10 11 12 7 8 9 1U 1 2 3 4U 4 5 6
Number of Lanes 1 0 1 0 0 0 0 0 1 0 0 0 1 0
Configuration L R LT TR
Volume, V (veh/h) 64 65 52 600 520 43
Percent Heavy Vehicles (%) 39 11 13
Proportion Time Blocked
Percent Grade (%) 0
Right Turn Channelized No No No No
Median Type/Storage Undivided
Critical and Follow-up HeadwaysBase Critical Headway (sec)
Critical Headway (sec)
Base Follow-Up Headway (sec)
Follow-Up Headway (sec)
Delay, Queue Length, and Level of ServiceFlow Rate, v (veh/h) 70 71 57
Capacity, c (veh/h) 129 492 915
v/c Ratio 0.54 0.14 0.06
95% Queue Length, Q₉₅ (veh) 2.6 0.5 0.2
Control Delay (s/veh) 61.8 13.5 9.2
Level of Service, LOS F B A
Approach Delay (s/veh) 37.5 1.6
Approach LOS E
Copyright © 2017 University of Florida. All Rights Reserved. HCS7™ TWSC Version 7.2.1 Generated: 6/1/2017 9:59:53 AMPM 39ALT Westown.xtw
Page 186
Traffic Impact Study Westlake Elementary School, Westlake, Ohio
AppendixQ
CapacityAnalysisWorksheets‐2039AlternateScenariow/Imp.
June 5, 2017 TMS Engineers, Inc.
Page 187
HCS7 Signalized Intersection Results Summary
General Information Intersection InformationAgency TMS Engineers, Inc. Duration, h 0.25Analyst ABC Analysis Date May 19, 2017 Area Type OtherJurisdiction Westlake, OH Time Period AM Peak PHF 0.92Urban Street Dover Center @ Analysis Year 2039 Analysis Period 1> 7:00Intersection Westown File Name AM 39ALT Westown-TS.xusProject Description Alternate Access
Demand Information EB WB NB SBApproach Movement L T R L T R L T R L T RDemand ( v ), veh/h 95 69 102 640 440 54
Signal Information
GreenYellowRed
0.0 61.2 28.8 0.0 0.0 0.03.6 3.6 3.6 0.0 0.0 0.01.4 1.4 1.4 0.0 0.0 0.0
1 2 3 4
5 6 7 8
Cycle, s 100.0 Reference Phase 2Offset, s 0 Reference Point EndUncoordinated No Simult. Gap E/W OnForce Mode Fixed Simult. Gap N/S On
Timer Results EBL EBT WBL WBT NBL NBT SBL SBTAssigned Phase 4 5 2 6Case Number 9.0 0.0 14.0 8.3Phase Duration, s 33.8 0.0 66.2 66.2Change Period, ( Y+R c ), s 5.0 5.0 5.0 5.0Max Allow Headway ( MAH ), s 3.2 0.0 0.0 0.0Queue Clearance Time ( g s ), s 7.6Green Extension Time ( g e ), s 0.3 0.0 0.0 0.0Phase Call Probability 1.00Max Out Probability 0.00
Movement Group Results EB WB NB SBApproach Movement L T R L T R L T R L T RAssigned Movement 7 14 5 2 6 16Adjusted Flow Rate ( v ), veh/h 103 75 807 537Adjusted Saturation Flow Rate ( s ), veh/h/ln 1414 1497 1469 1791Queue Service Time ( g s ), s 5.6 3.8 7.0 16.6Cycle Queue Clearance Time ( g c ), s 5.6 3.8 35.0 16.6Green Ratio ( g/C ) 0.29 0.29 0.61 0.61Capacity ( c ), veh/h 407 431 940 1096Volume-to-Capacity Ratio ( X ) 0.254 0.174 0.858 0.490Back of Queue ( Q ), ft/ln ( 85 th percentile) 100.8 63.7 557.7 233.8Back of Queue ( Q ), veh/ln ( 85 th percentile) 3.3 2.4 21.4 9.0Queue Storage Ratio ( RQ ) ( 85 th percentile) 0.00 0.00 0.00 0.00Uniform Delay ( d 1 ), s/veh 27.3 26.7 17.7 10.8Incremental Delay ( d 2 ), s/veh 0.1 0.1 10.0 1.6Initial Queue Delay ( d 3 ), s/veh 0.0 0.0 0.0 0.0Control Delay ( d ), s/veh 27.5 26.8 27.6 12.3Level of Service (LOS) C C C BApproach Delay, s/veh / LOS 27.2 C 0.0 27.6 C 12.3 BIntersection Delay, s/veh / LOS 22.2 C
Multimodal Results EB WB NB SBPedestrian LOS Score / LOS 2.1 B 2.1 B 0.7 A 1.7 BBicycle LOS Score / LOS F 1.8 B 1.4 A
Copyright © 2017 University of Florida, All Rights Reserved. HCS7™ Streets Version 7.2.1 Generated: 6/1/2017 10:14:57 AM
Page 188
HCS7 Signalized Intersection Results Summary
General Information Intersection InformationAgency TMS Engineers, Inc. Duration, h 0.25Analyst ABC Analysis Date May 19, 2017 Area Type OtherJurisdiction Westlake, OH Time Period PM Peak PHF 0.92Urban Street Dover Center @ Analysis Year 2039 Analysis Period 1> 7:00Intersection Westown File Name PM 39ALT Westown-TS.xusProject Description Alternate Scenariol
Demand Information EB WB NB SBApproach Movement L T R L T R L T R L T RDemand ( v ), veh/h 64 65 52 600 420 43
Signal Information
GreenYellowRed
0.0 54.1 35.9 0.0 0.0 0.03.6 3.6 3.6 0.0 0.0 0.01.4 1.4 1.4 0.0 0.0 0.0
1 2 3 4
5 6 7 8
Cycle, s 100.0 Reference Phase 2Offset, s 0 Reference Point EndUncoordinated No Simult. Gap E/W OnForce Mode Fixed Simult. Gap N/S On
Timer Results EBL EBT WBL WBT NBL NBT SBL SBTAssigned Phase 4 5 2 6Case Number 9.0 0.0 14.0 8.3Phase Duration, s 40.9 0.0 59.1 59.1Change Period, ( Y+R c ), s 5.0 5.0 5.0 5.0Max Allow Headway ( MAH ), s 3.2 0.0 0.0 0.0Queue Clearance Time ( g s ), s 5.7Green Extension Time ( g e ), s 0.3 0.0 0.0 0.0Phase Call Probability 1.00Max Out Probability 0.00
Movement Group Results EB WB NB SBApproach Movement L T R L T R L T R L T RAssigned Movement 7 14 5 2 6 16Adjusted Flow Rate ( v ), veh/h 70 71 709 503Adjusted Saturation Flow Rate ( s ), veh/h/ln 1259 1472 1751 1825Queue Service Time ( g s ), s 3.7 3.2 7.0 17.5Cycle Queue Clearance Time ( g c ), s 3.7 3.2 29.0 17.5Green Ratio ( g/C ) 0.36 0.36 0.54 0.54Capacity ( c ), veh/h 452 528 986 987Volume-to-Capacity Ratio ( X ) 0.154 0.134 0.719 0.510Back of Queue ( Q ), ft/ln ( 85 th percentile) 64.3 53.6 410.7 256.5Back of Queue ( Q ), veh/ln ( 85 th percentile) 2.0 2.0 16.0 10.0Queue Storage Ratio ( RQ ) ( 85 th percentile) 0.00 0.00 0.00 0.00Uniform Delay ( d 1 ), s/veh 21.7 21.6 17.2 14.5Incremental Delay ( d 2 ), s/veh 0.1 0.0 4.5 1.9Initial Queue Delay ( d 3 ), s/veh 0.0 0.0 0.0 0.0Control Delay ( d ), s/veh 21.8 21.6 21.7 16.4Level of Service (LOS) C C C BApproach Delay, s/veh / LOS 21.7 C 0.0 21.7 C 16.4 BIntersection Delay, s/veh / LOS 19.8 B
Multimodal Results EB WB NB SBPedestrian LOS Score / LOS 2.1 B 2.1 B 0.7 A 1.7 BBicycle LOS Score / LOS F 1.7 B 1.3 A
Copyright © 2017 University of Florida, All Rights Reserved. HCS7™ Streets Version 7.2.1 Generated: 6/1/2017 10:12:55 AM
Page 189
Traffic Impact Study Westlake Elementary School, Westlake, Ohio
AppendixR
ODOTChannelizingIslandDesignCriteria
June 5, 2017 TMS Engineers, Inc.
Page 194
TRAFFICIMPACTSTUDY
WestlakeElementarySchool
Westlake,Ohio
June5,2017
PreparedFor:
WestlakeCitySchools‐BoardofEducation27200HilliardBoulevardWestlake,Ohio44145
PreparedBy:
TMSEngineers,Inc.2112CaseParkwaySouth
Unit#7Twinsburg,Ohio44087
___________________________________REGISTEREDENGINEERNO.E56982
CERTIFICATIONNO.2234
“This document was prepared consistent with local agency requirements and/or applicable guidelines contained in this report.”


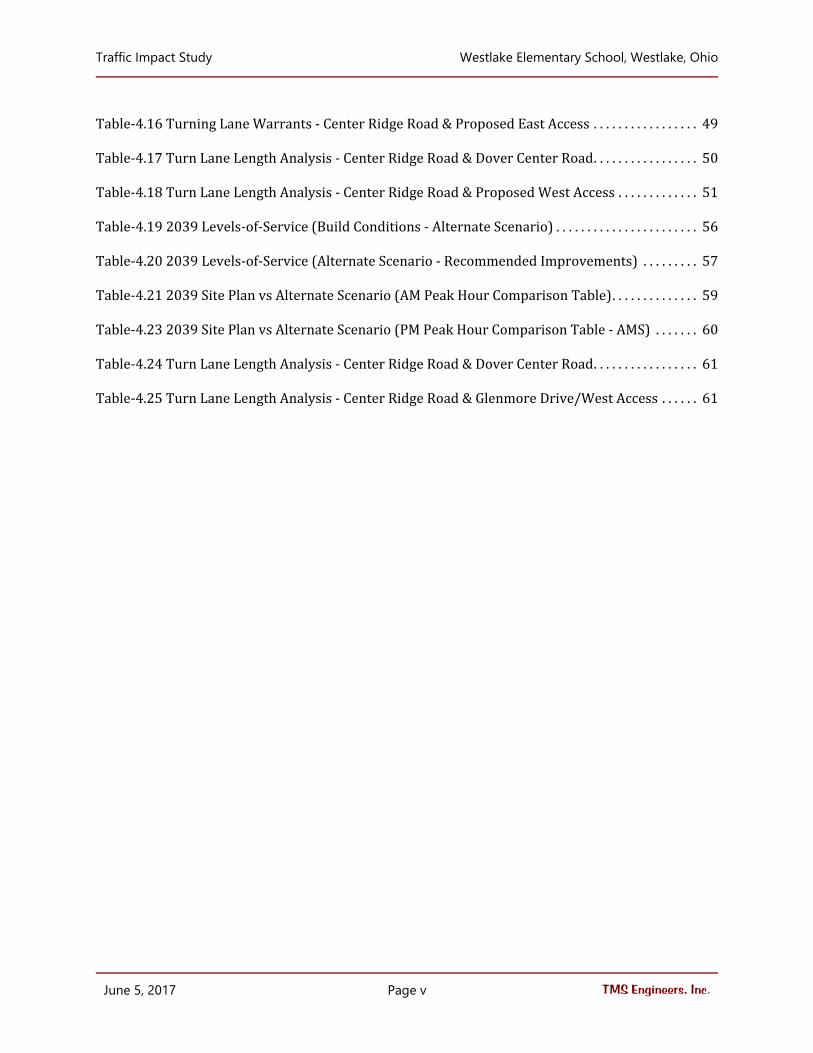

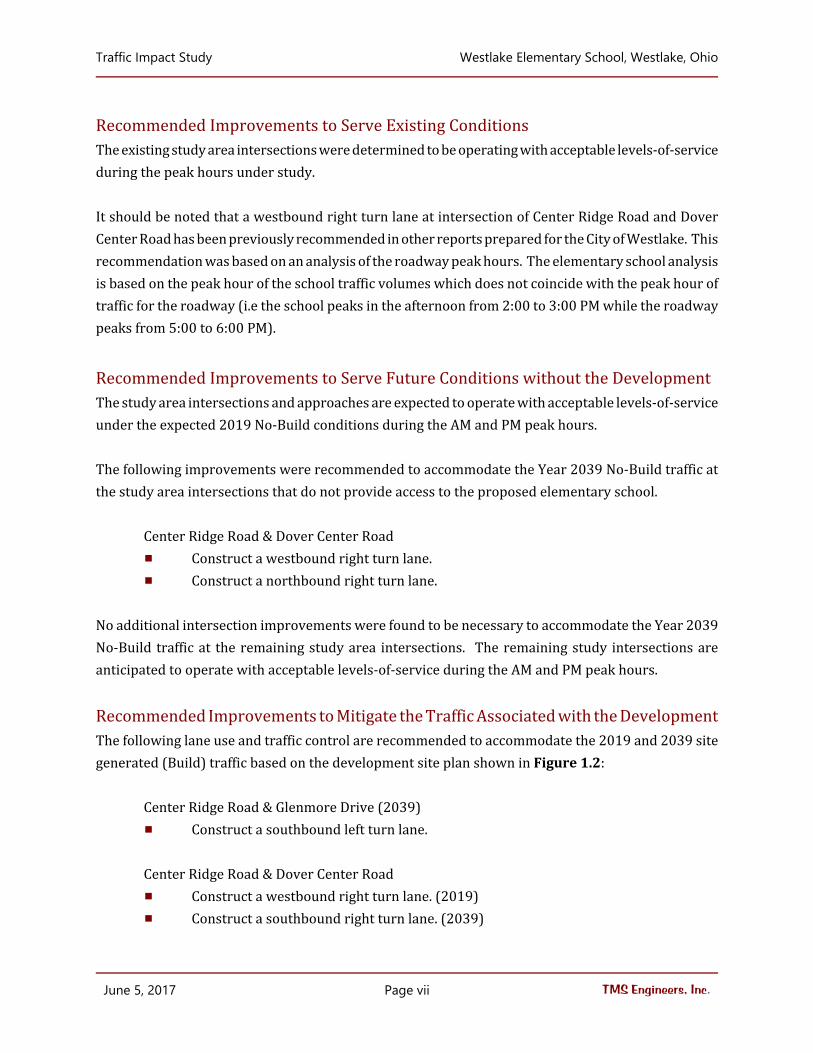
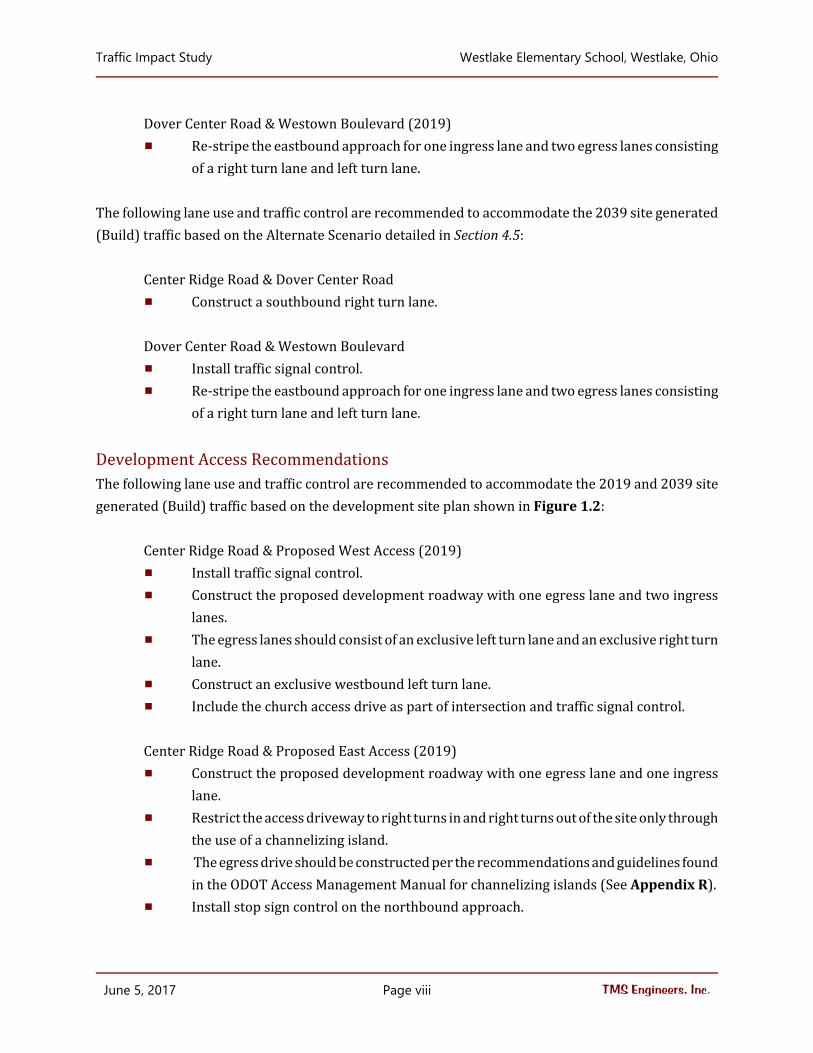
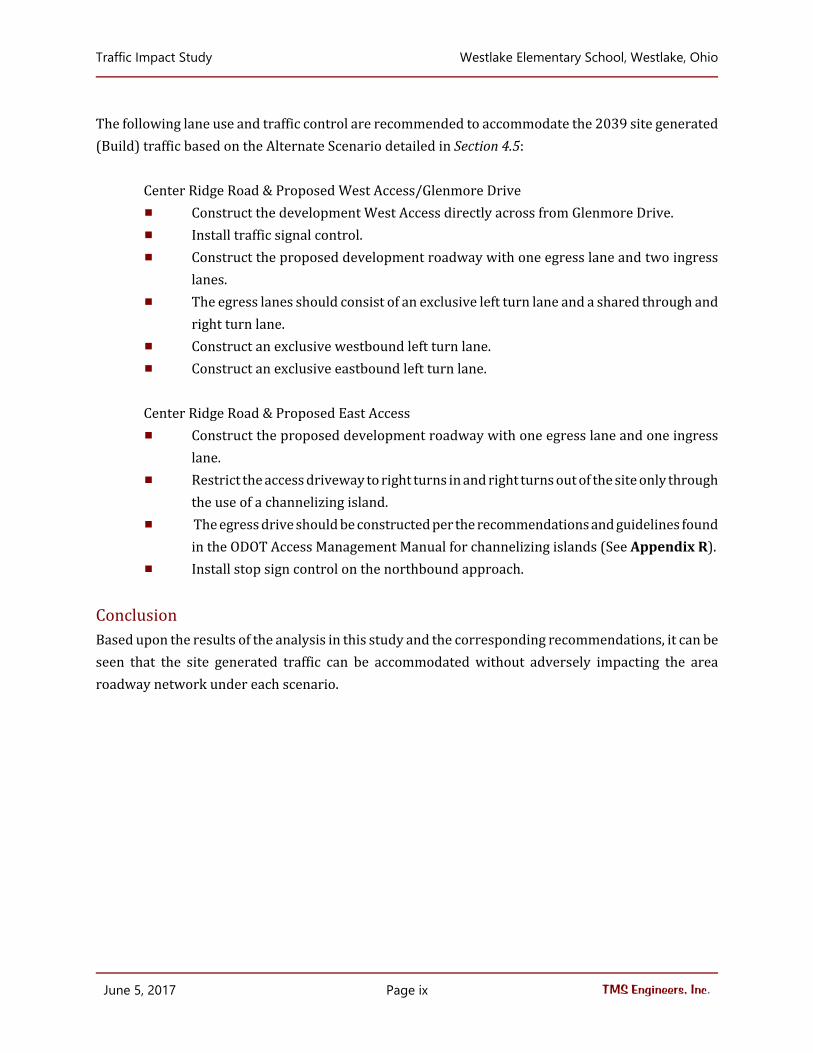

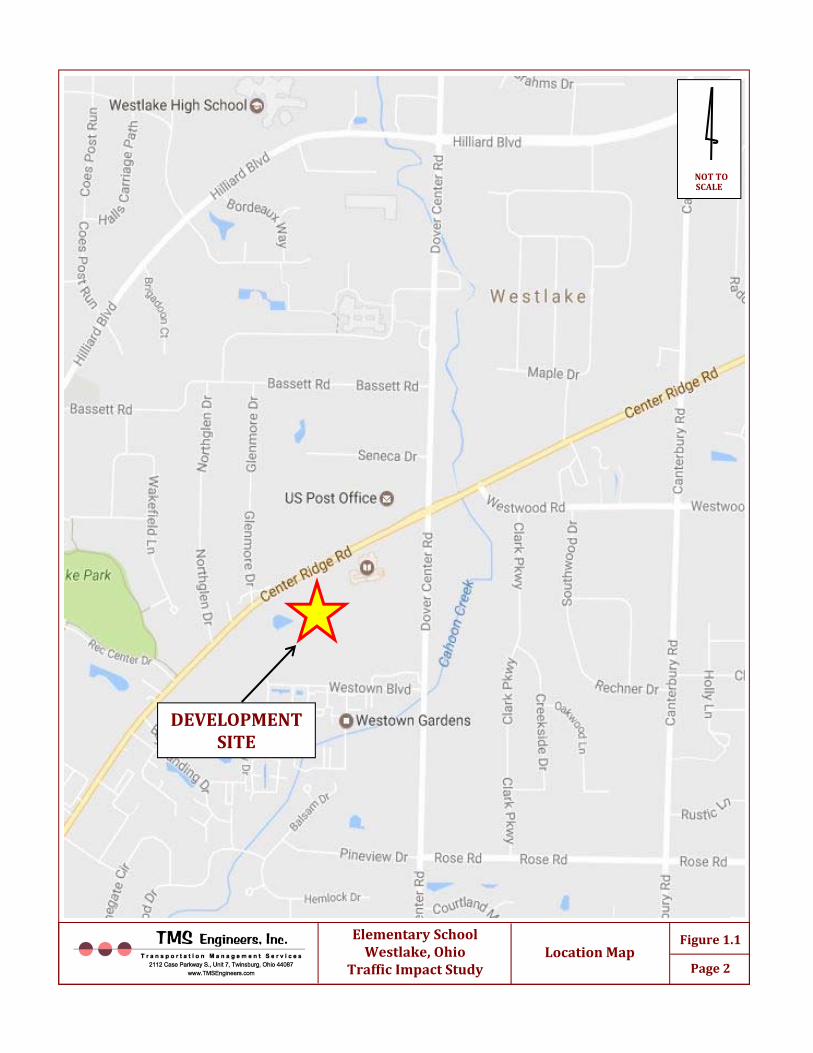
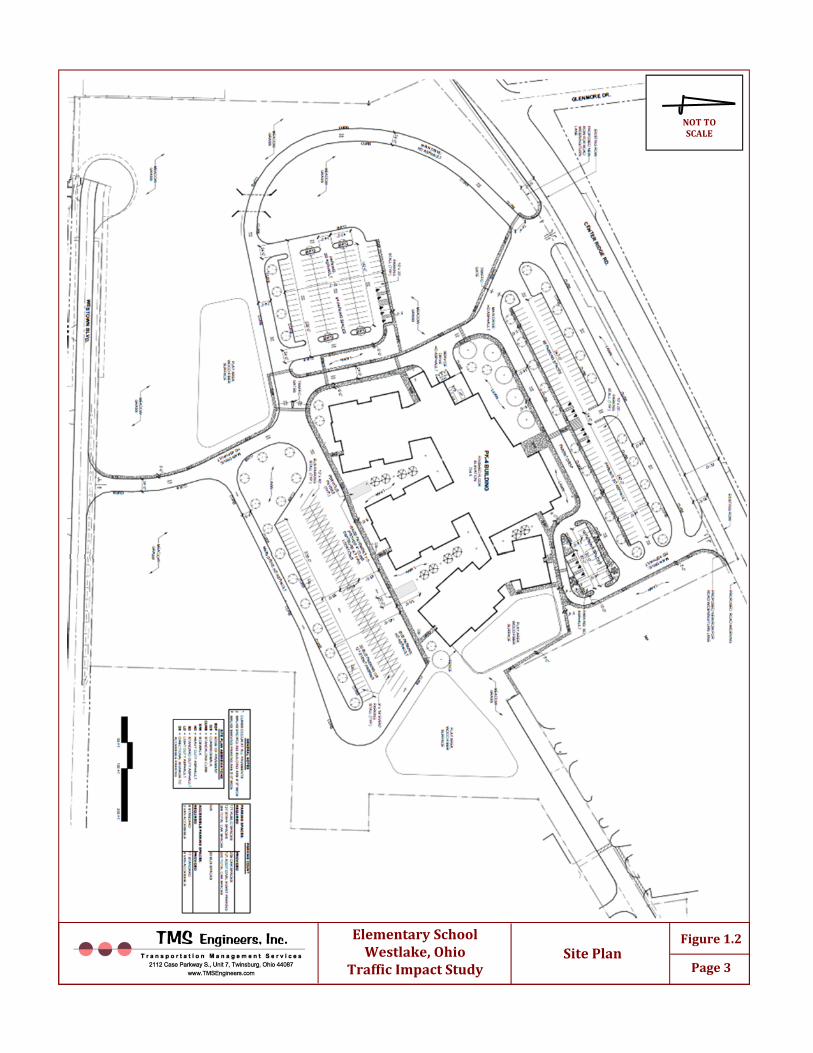
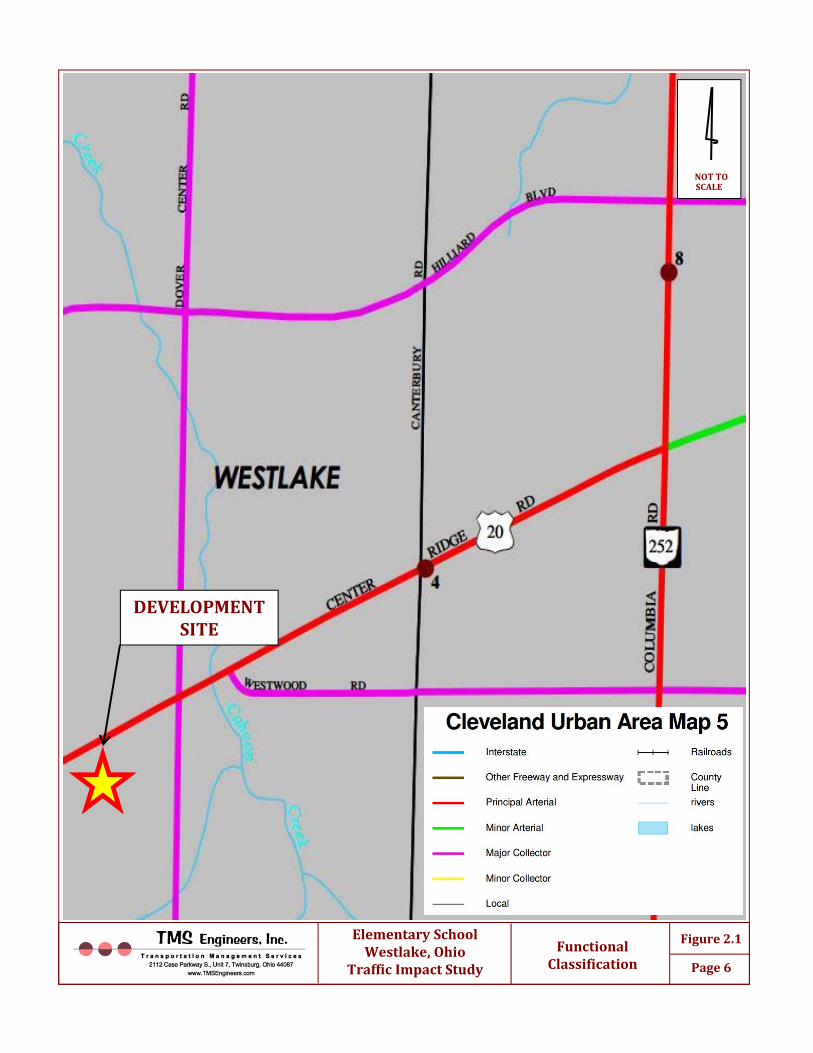
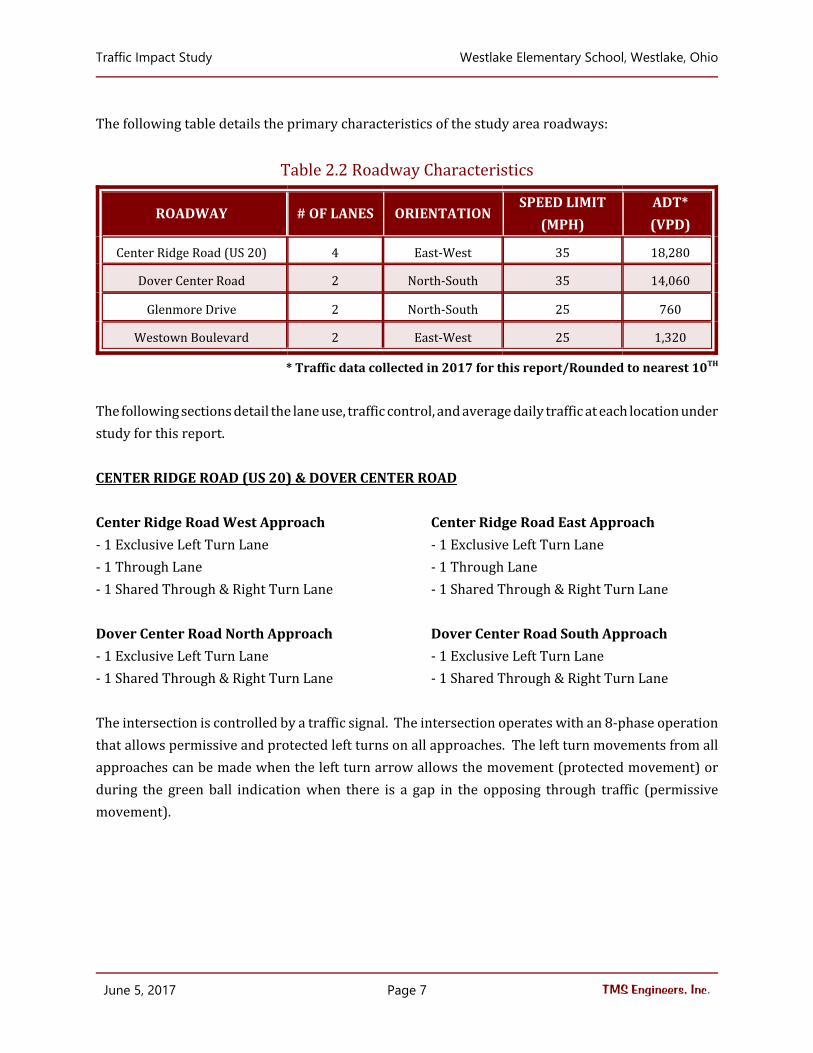
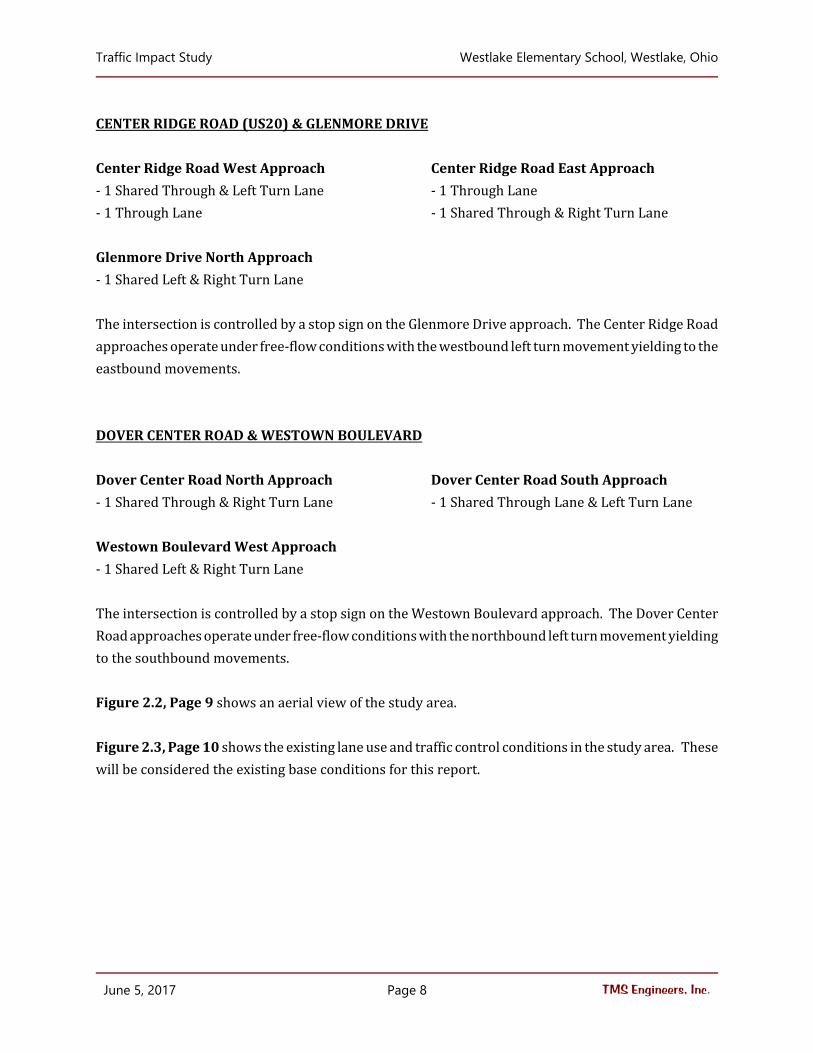

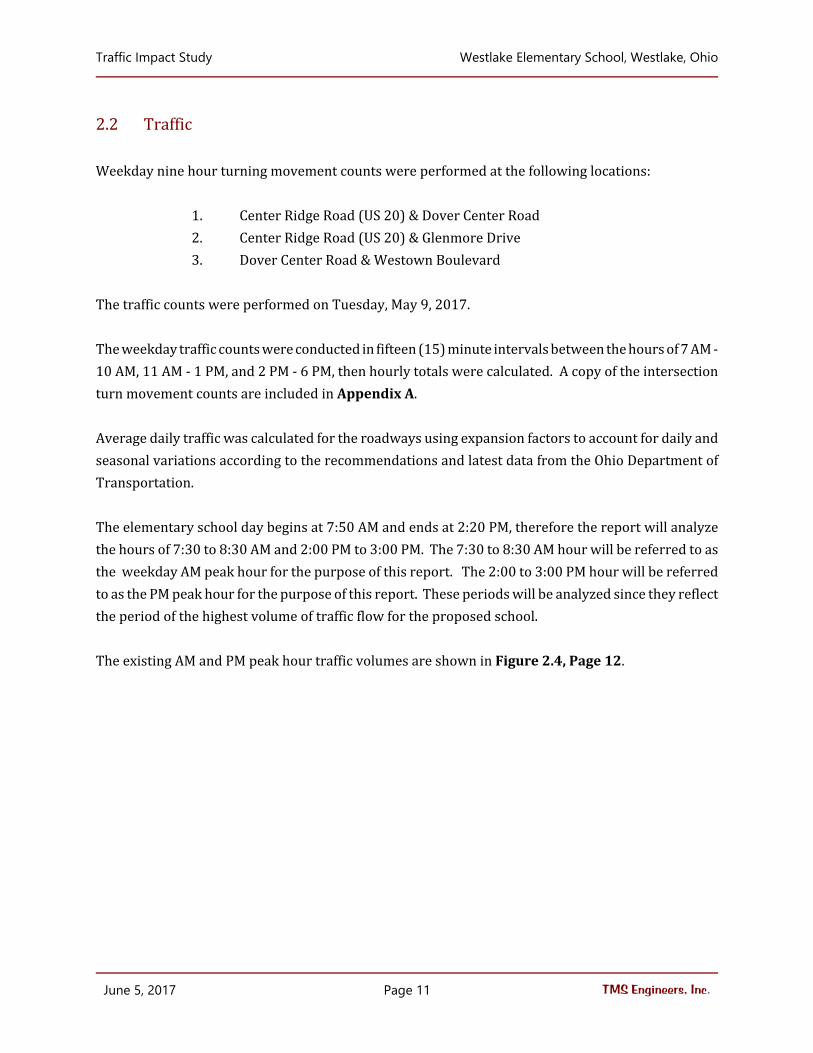
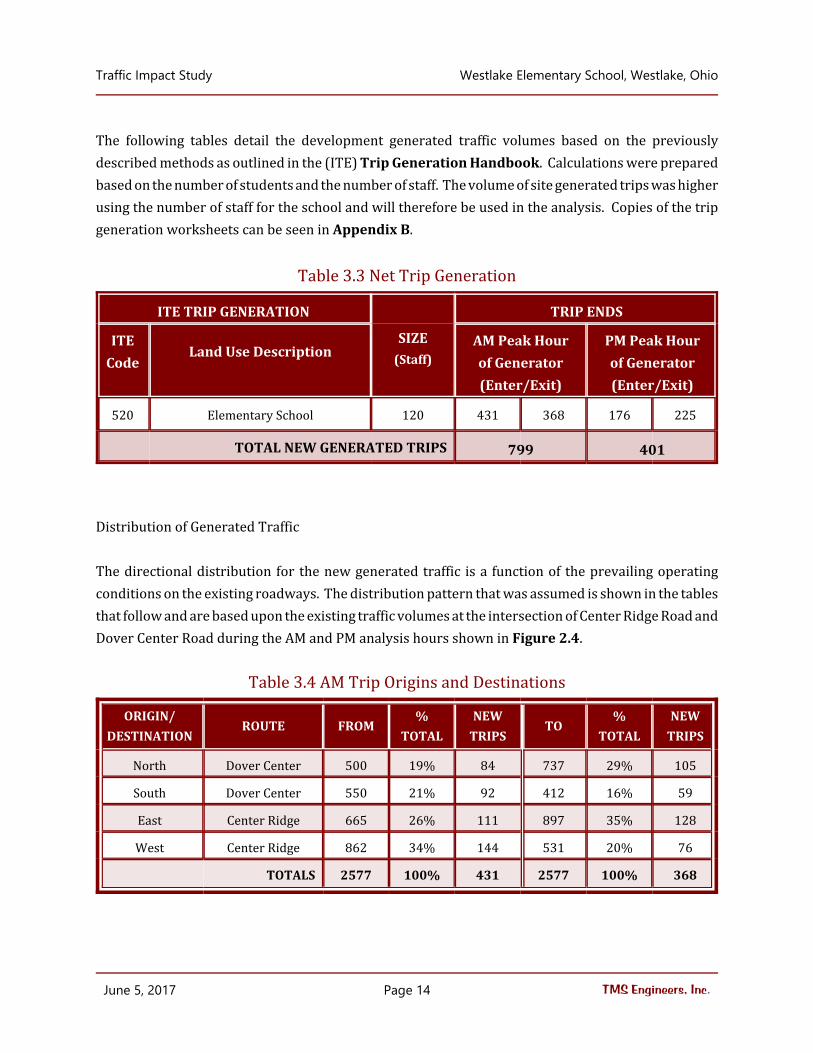
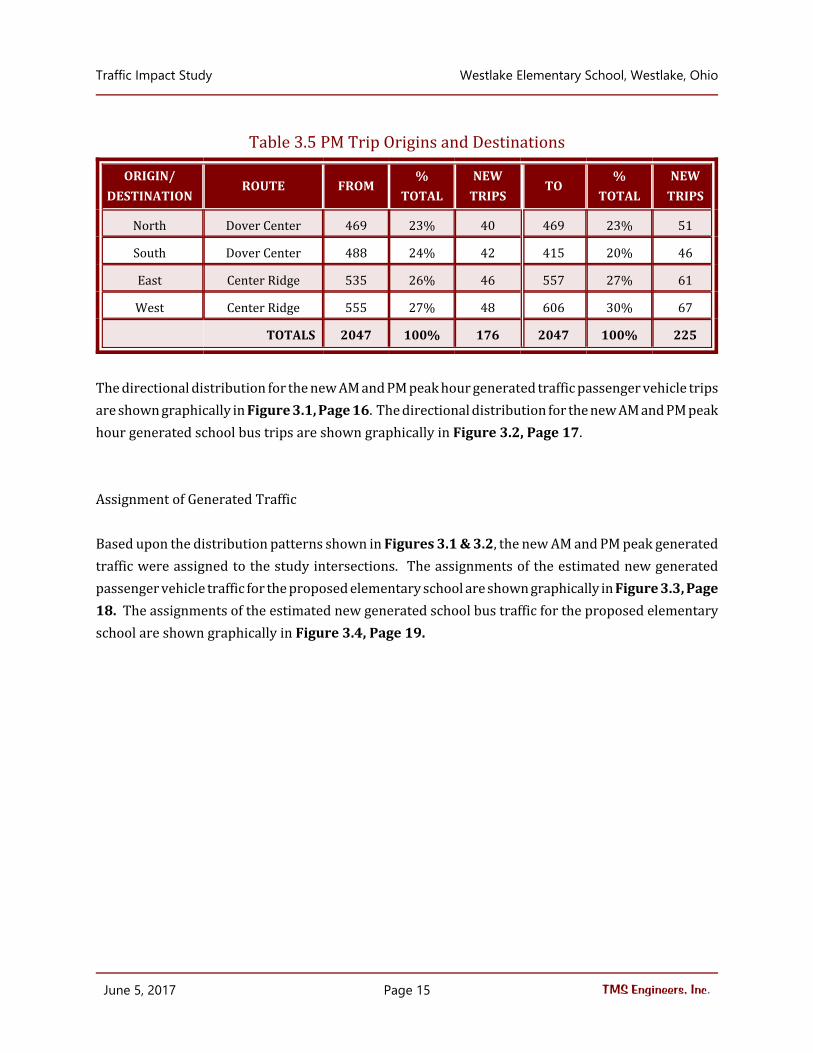


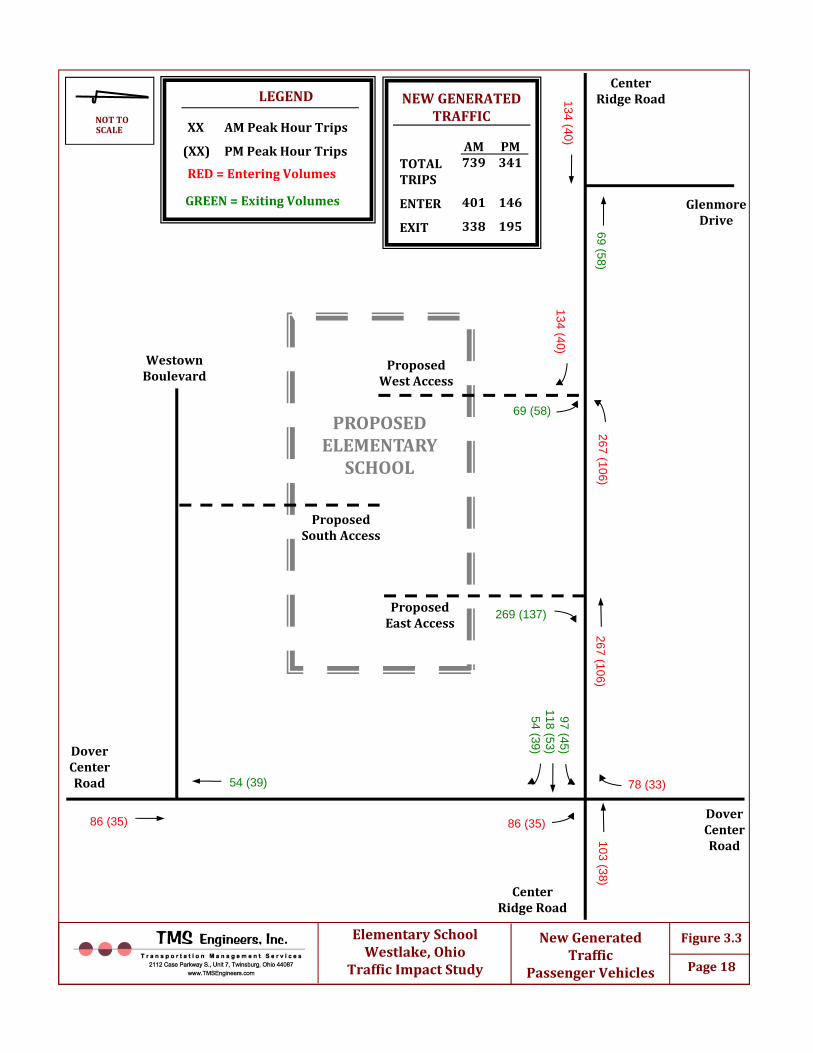

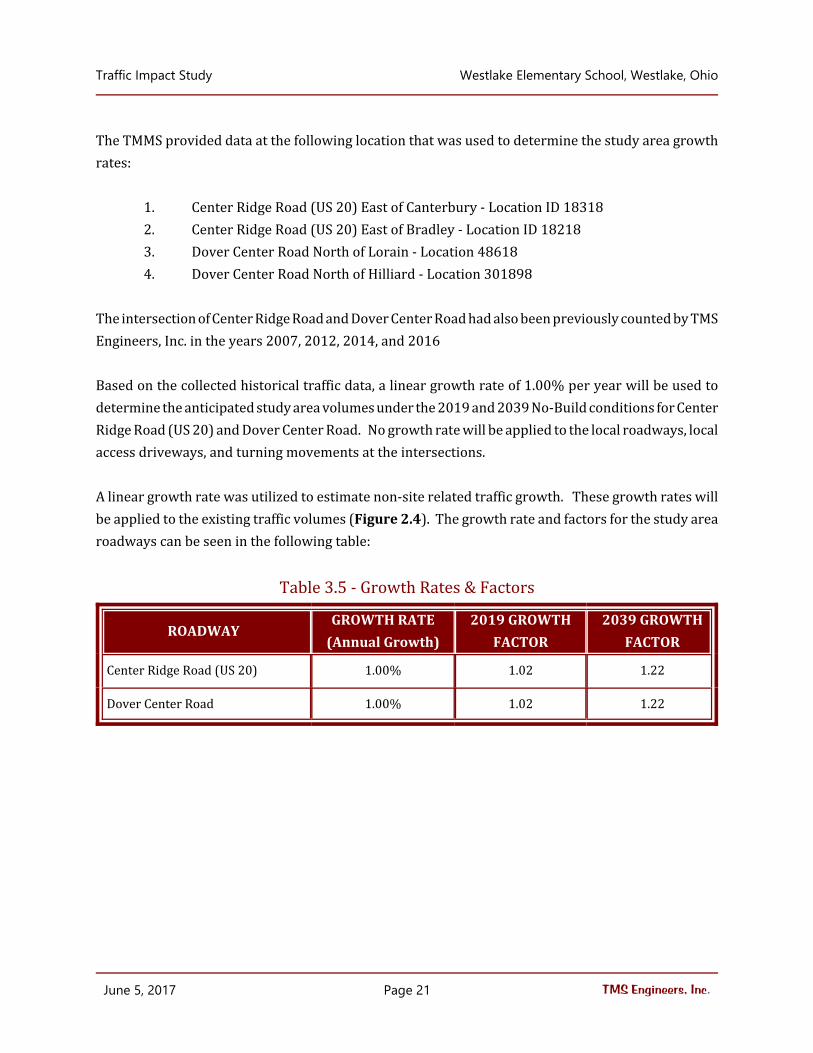


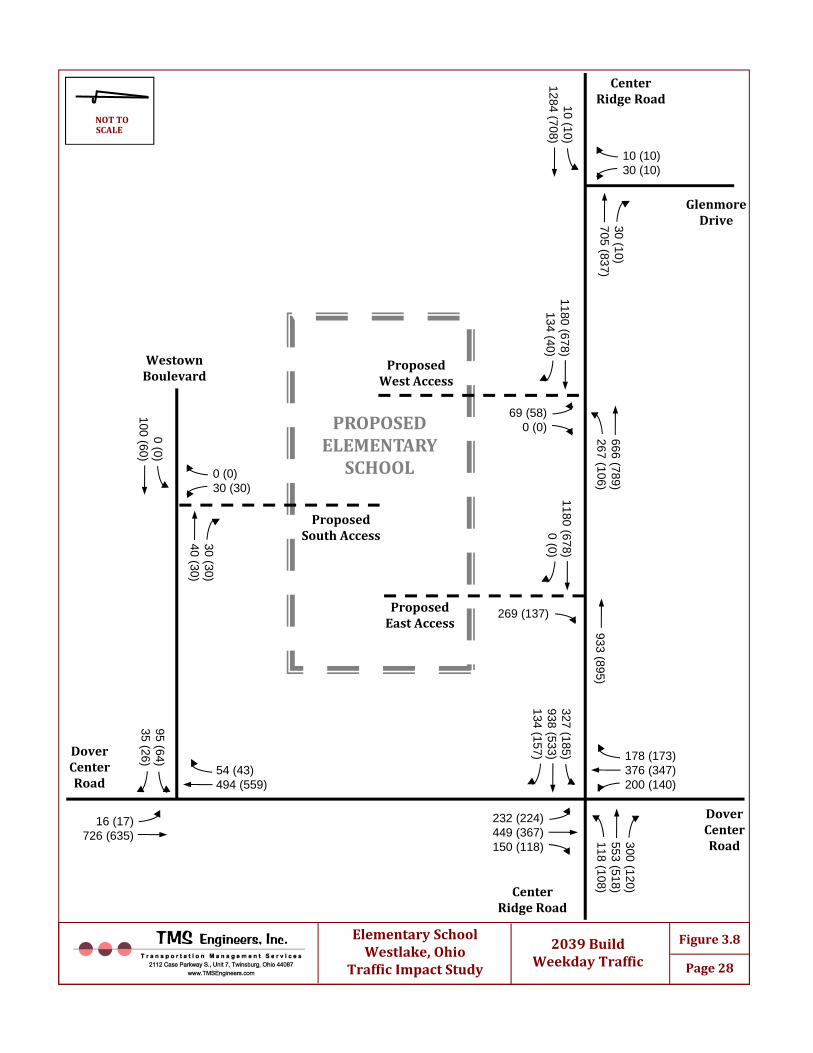
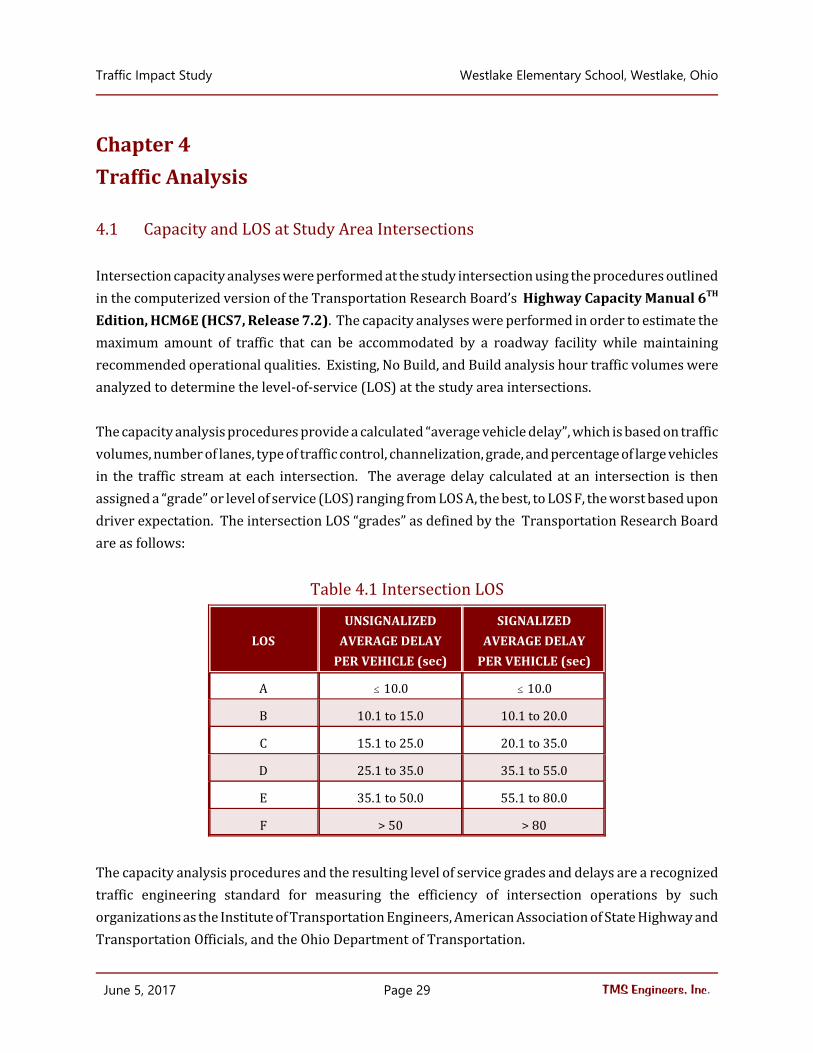
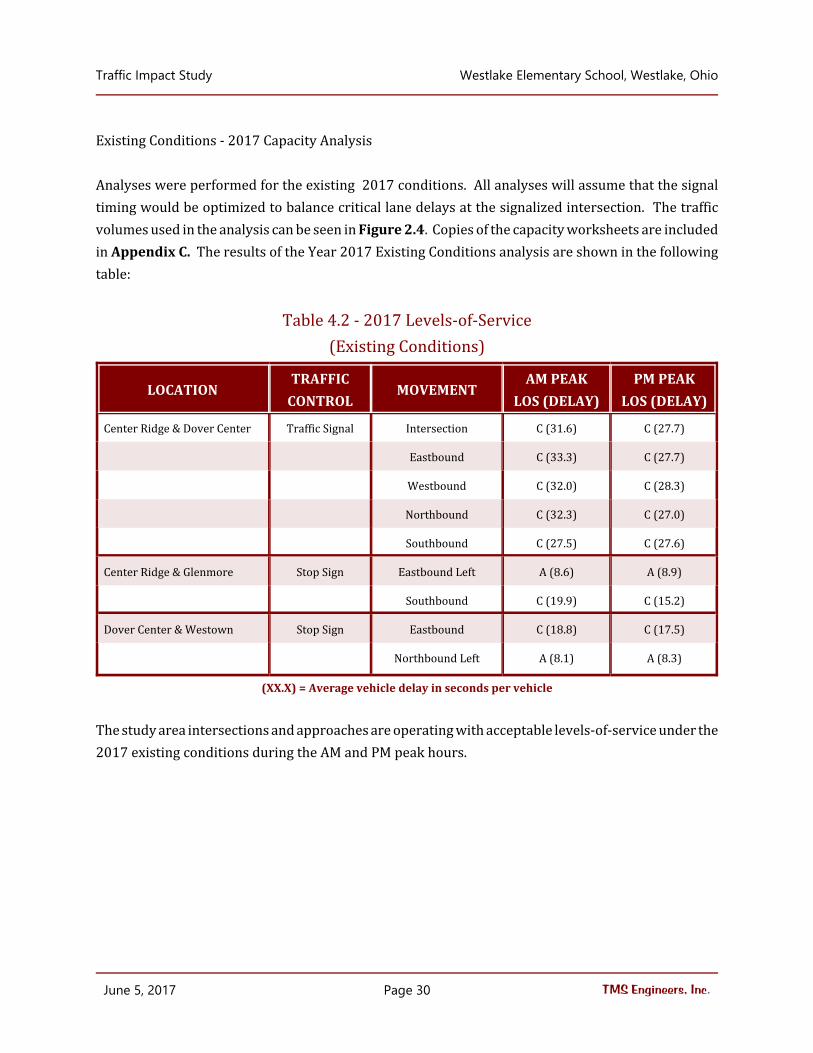


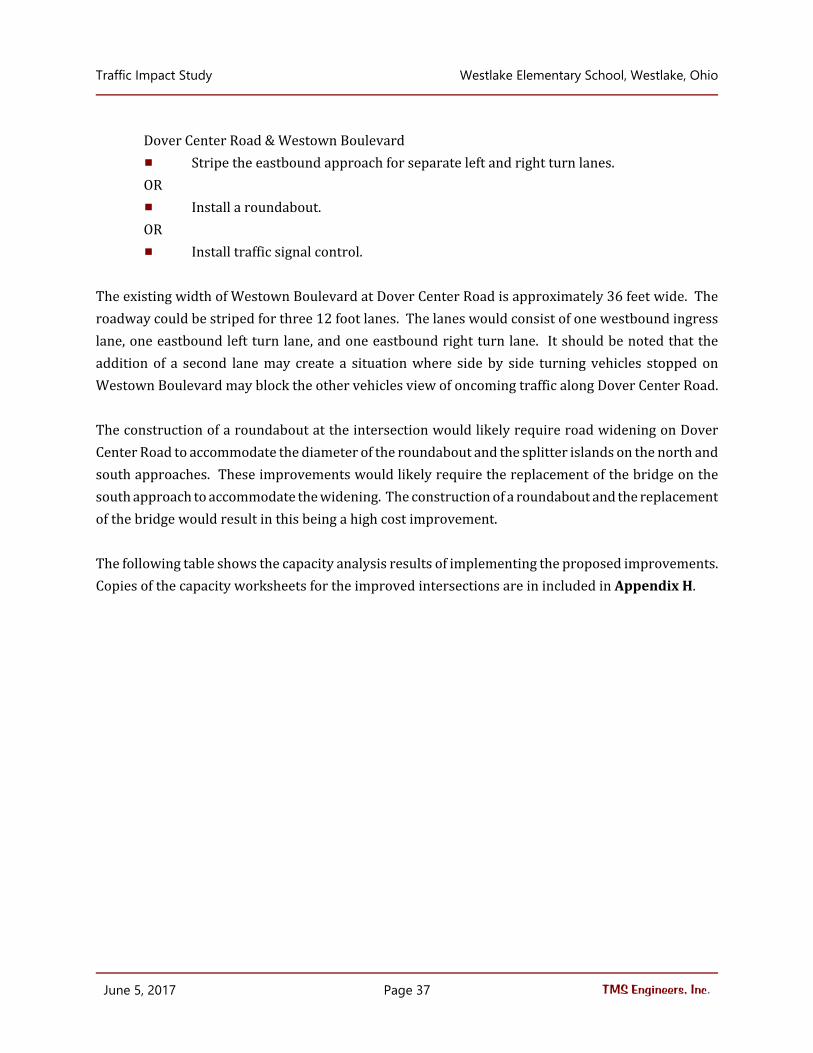
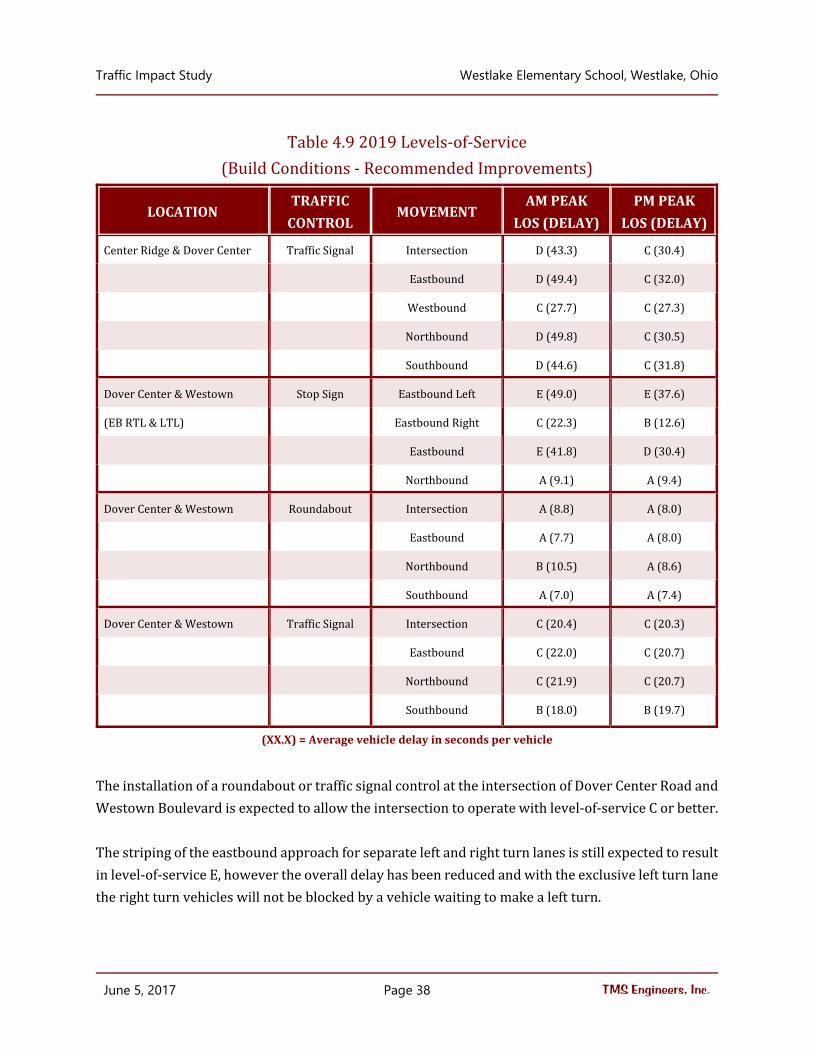

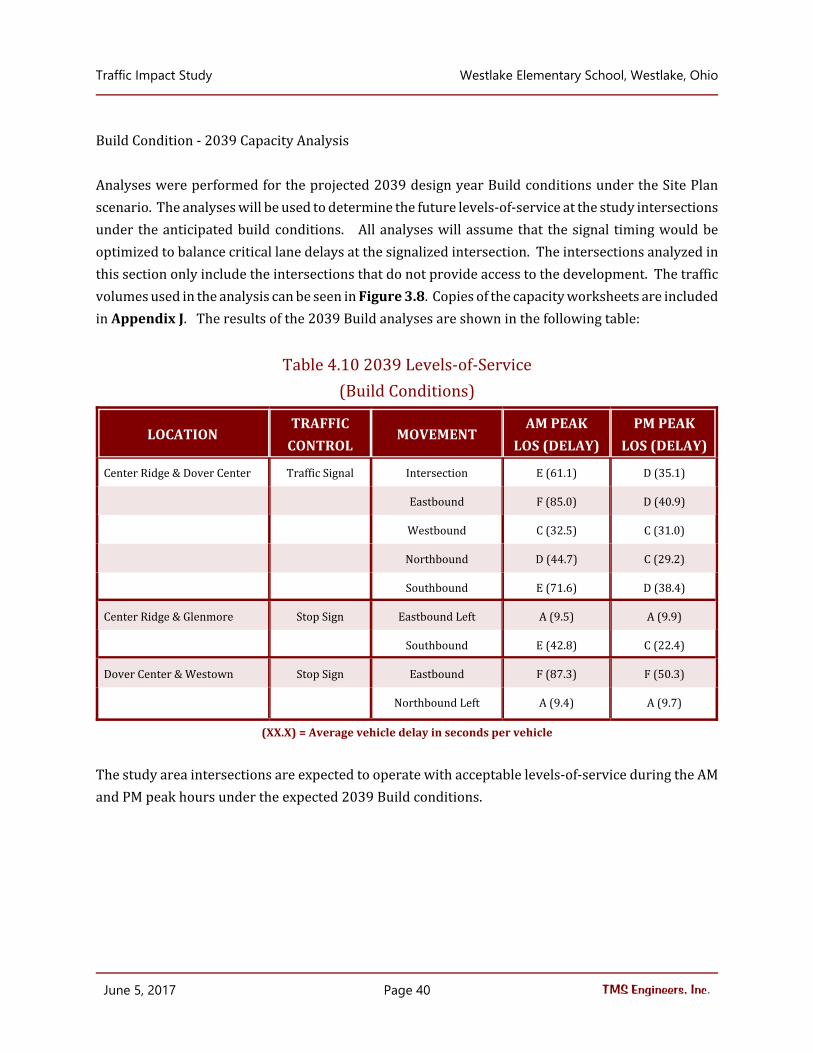
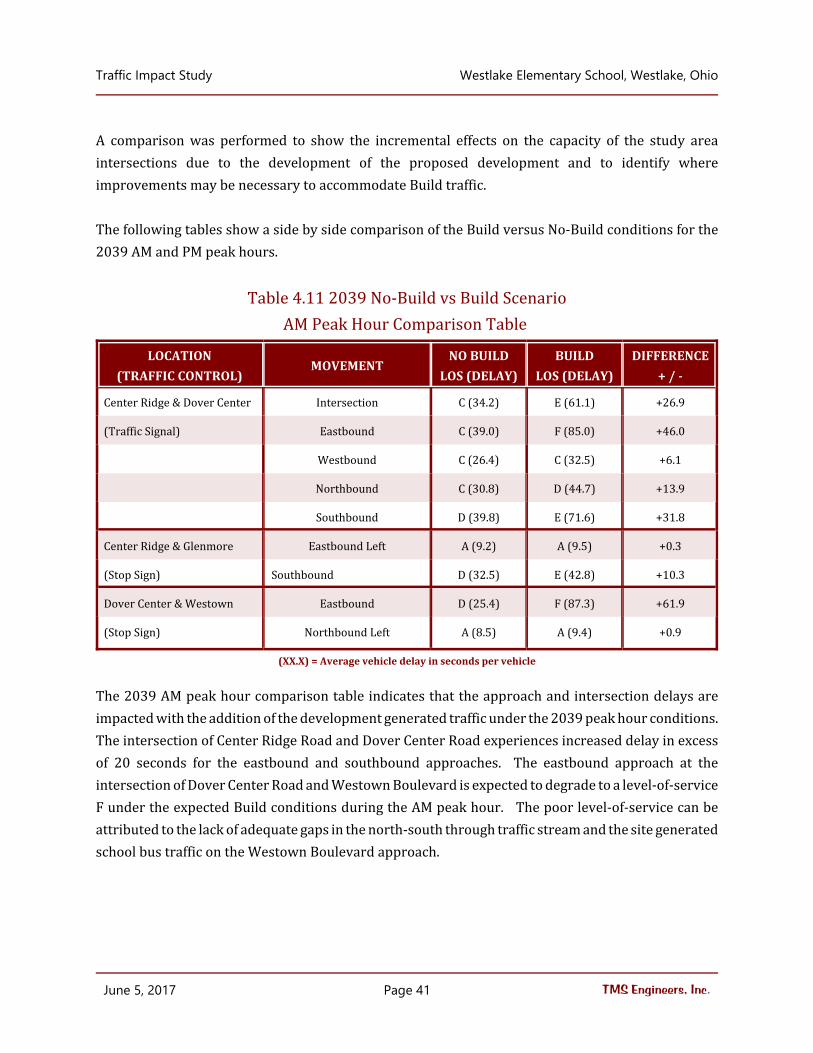
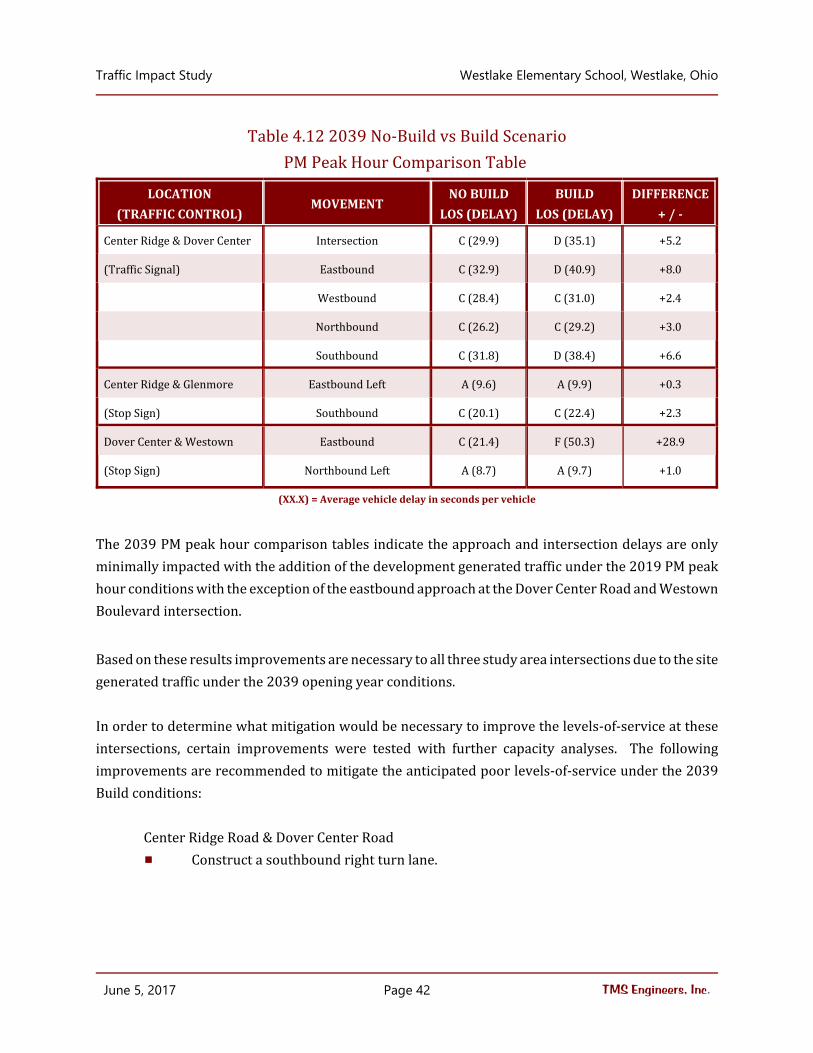
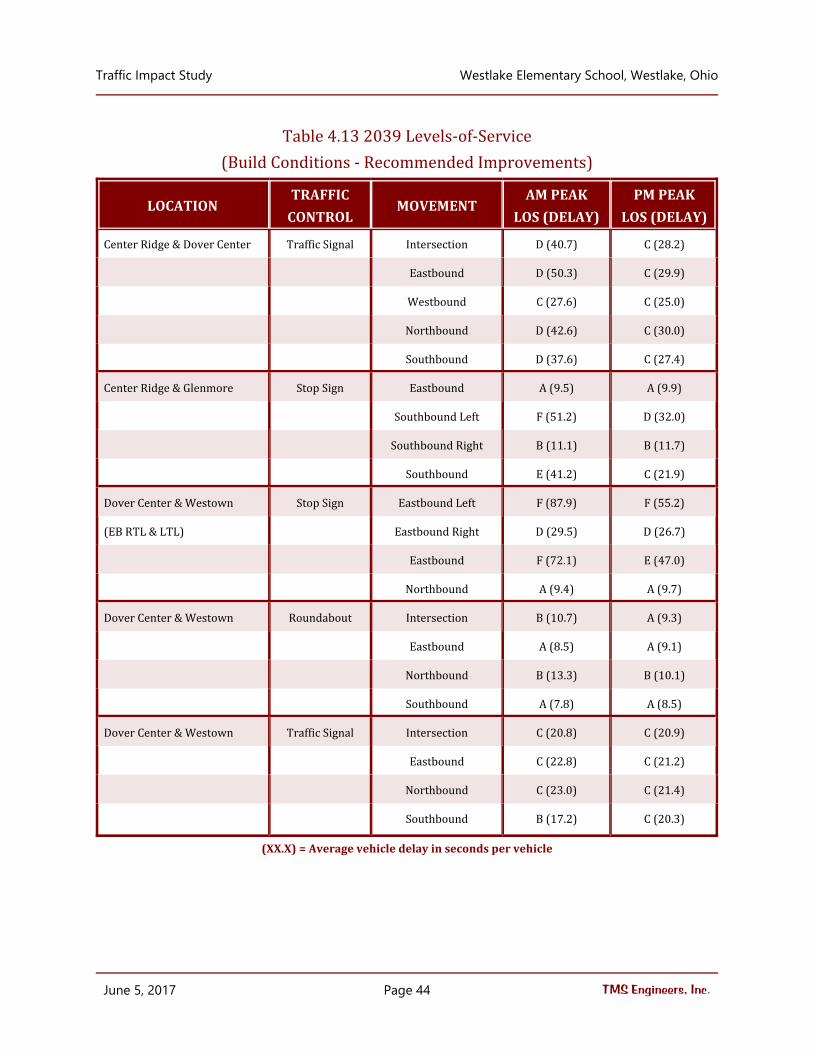
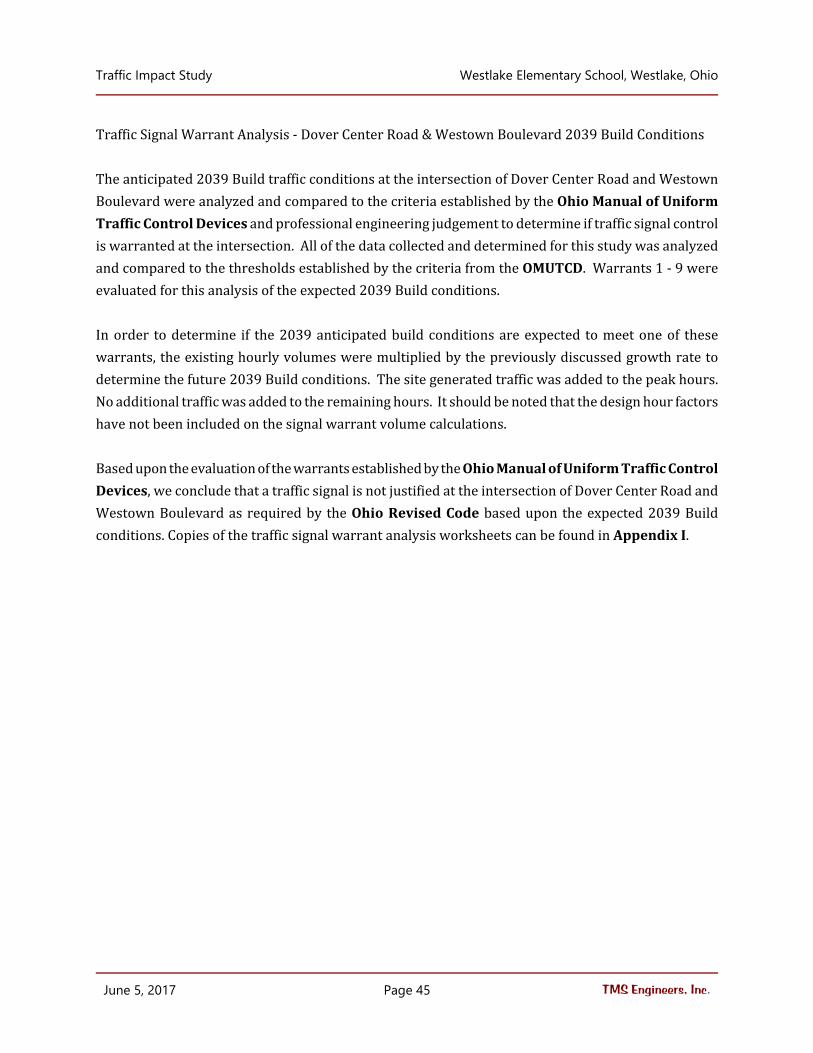
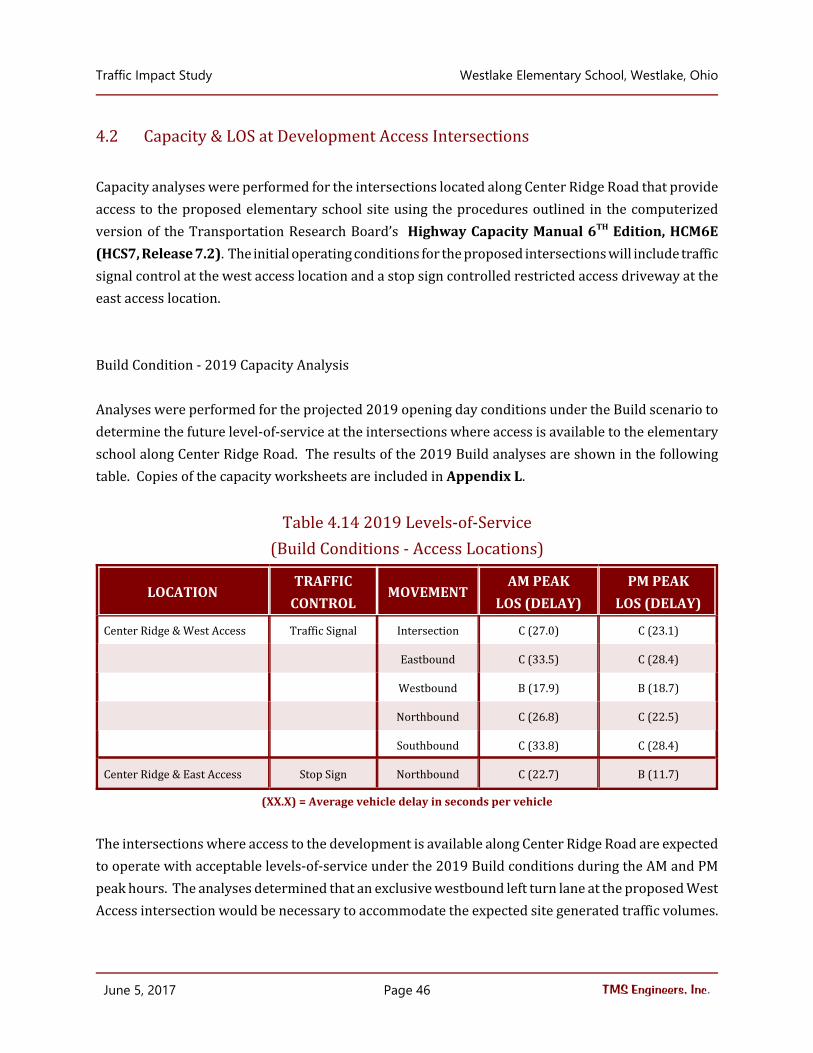

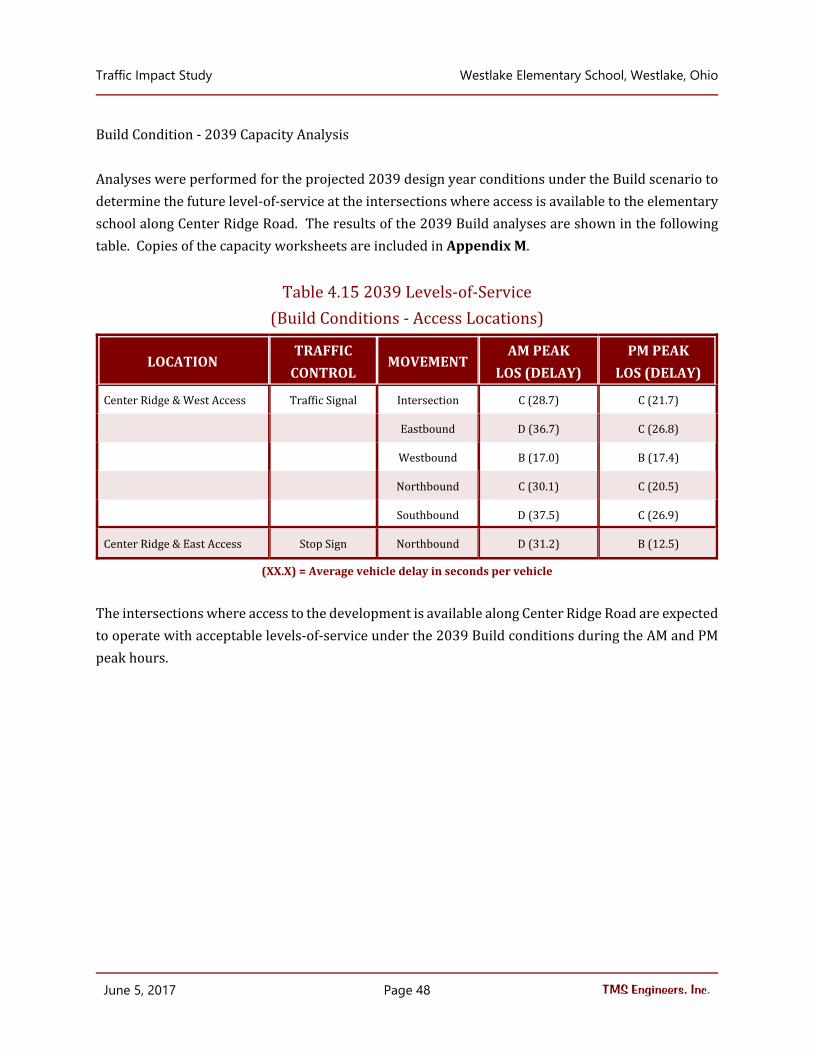
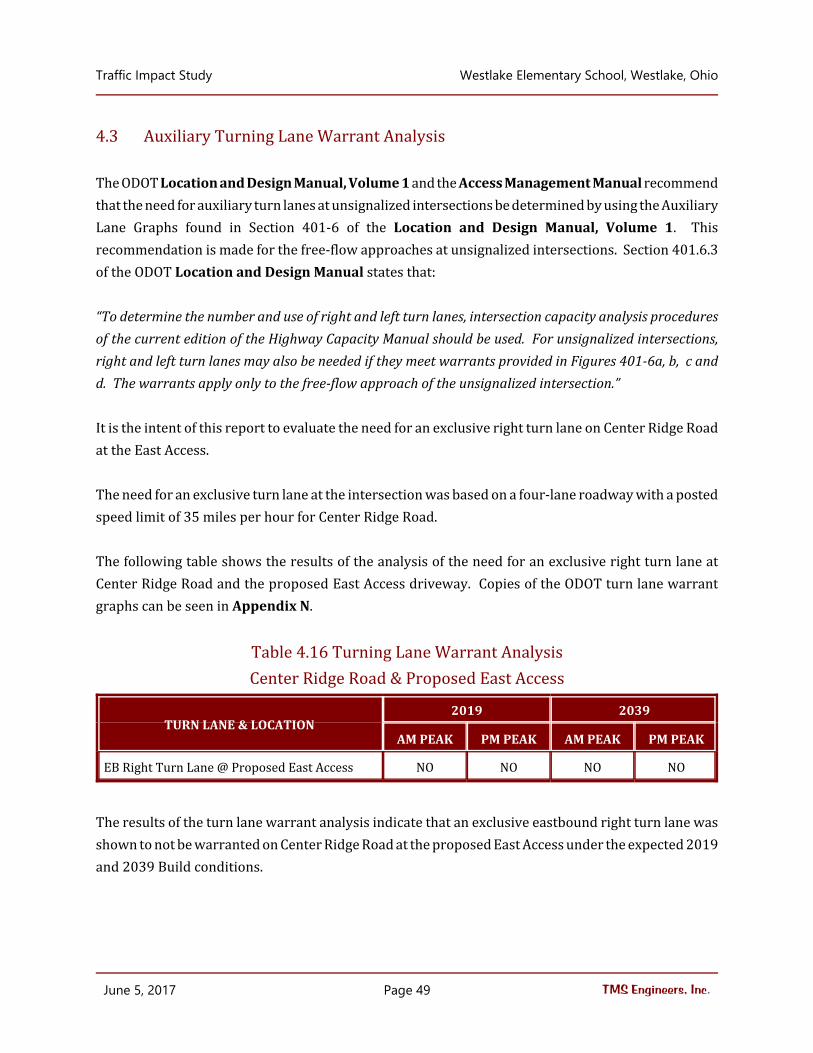
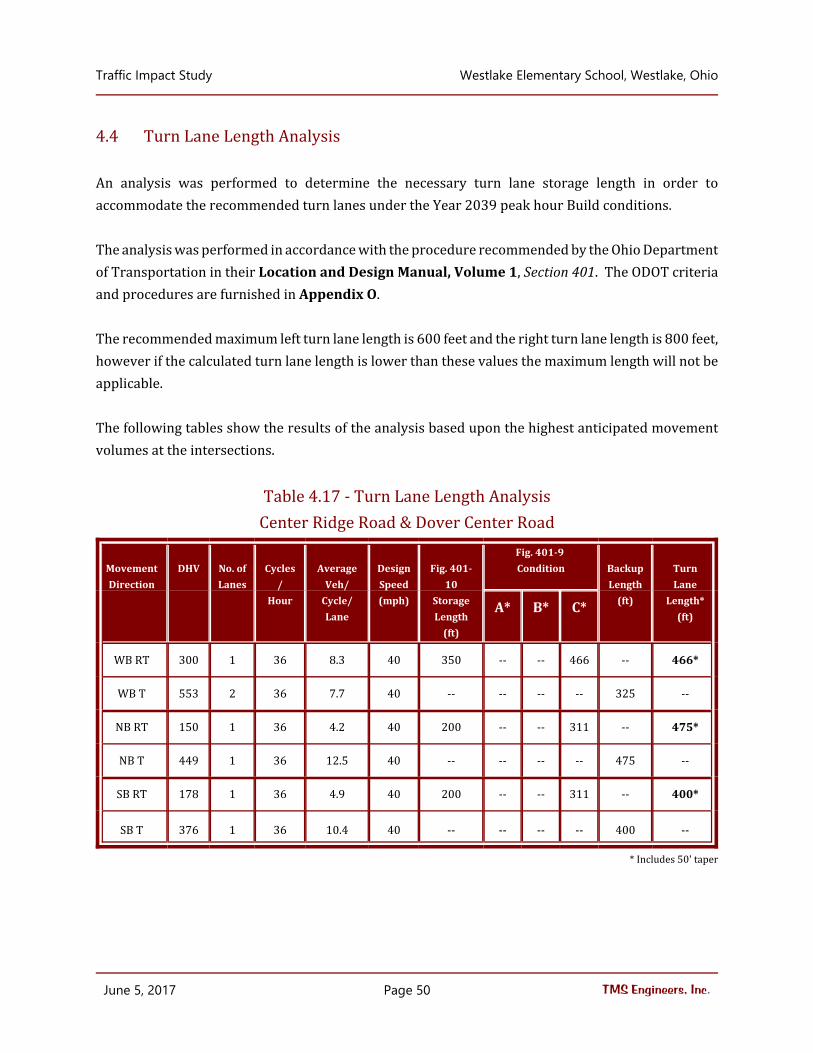
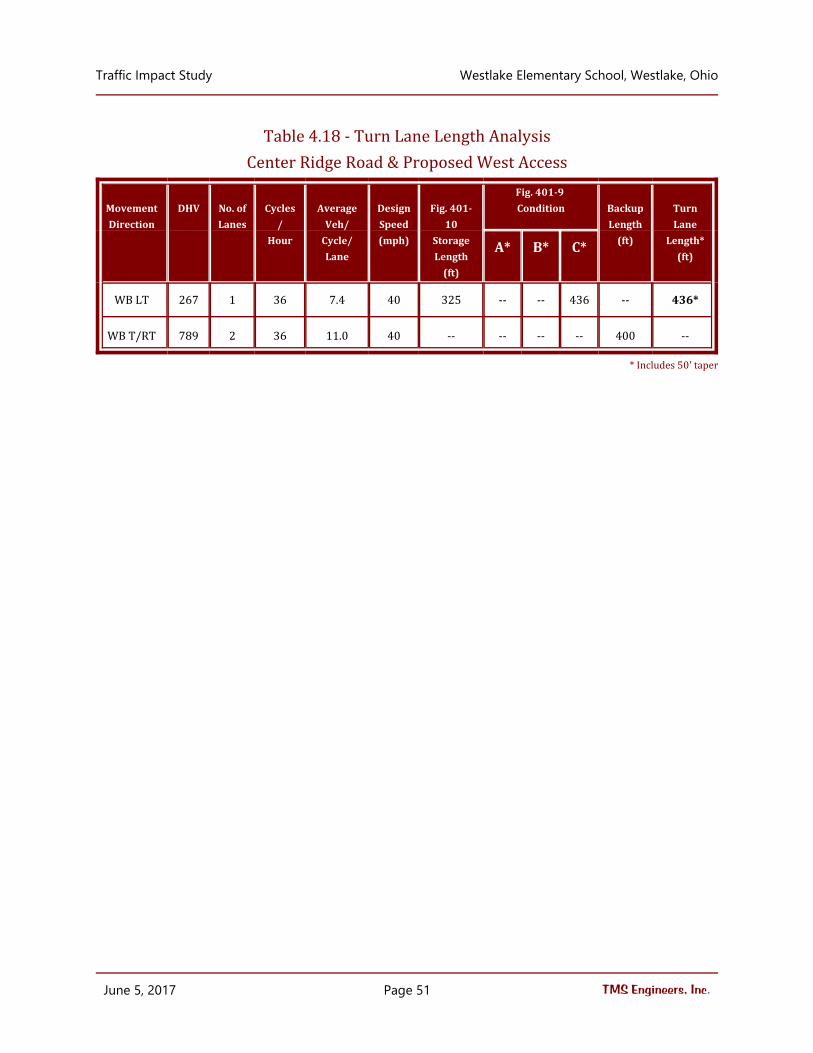
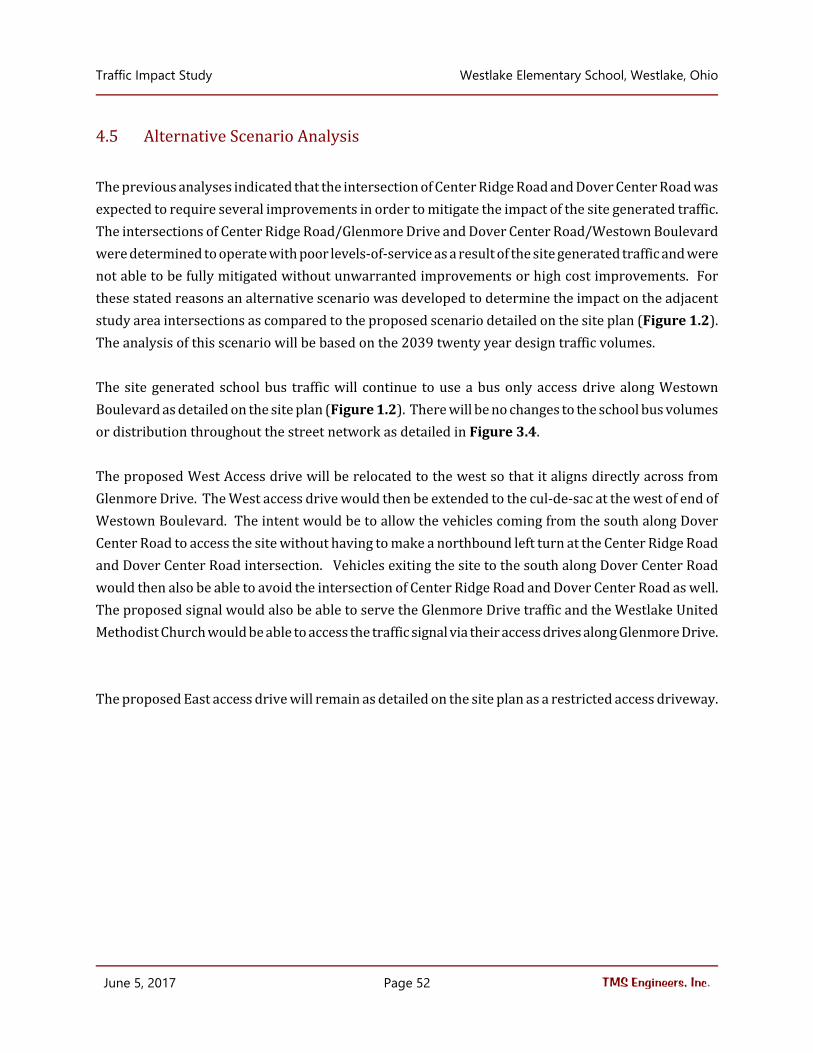

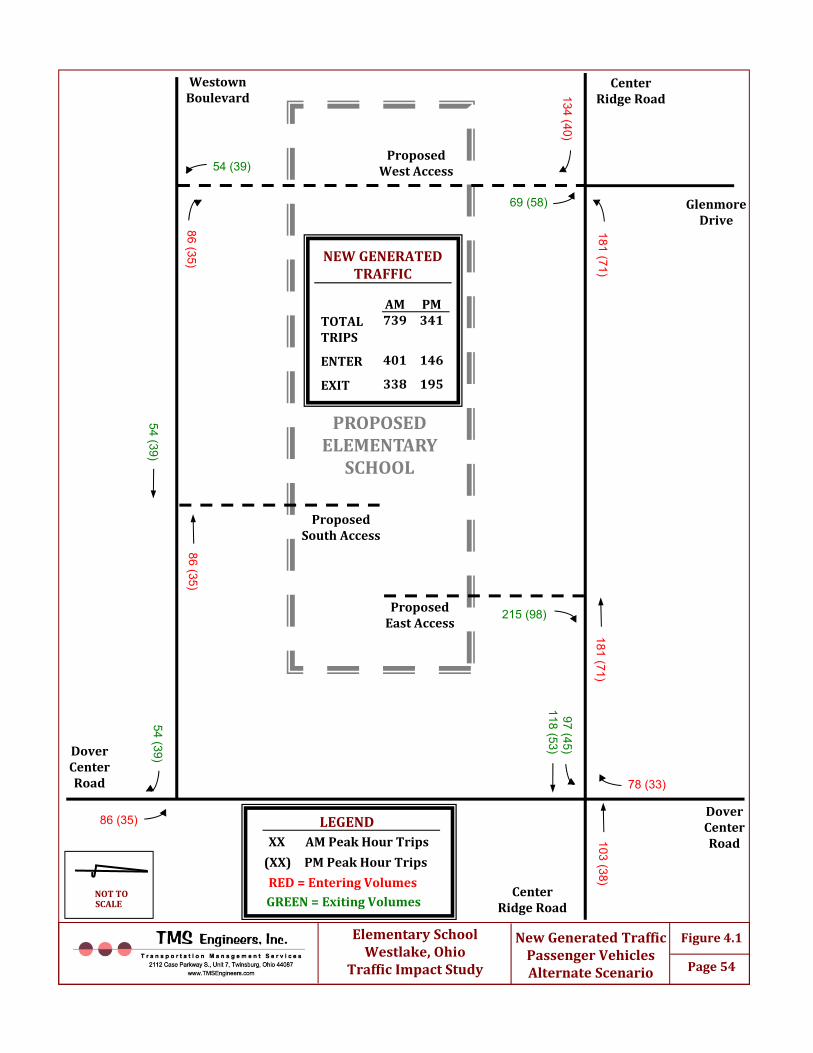
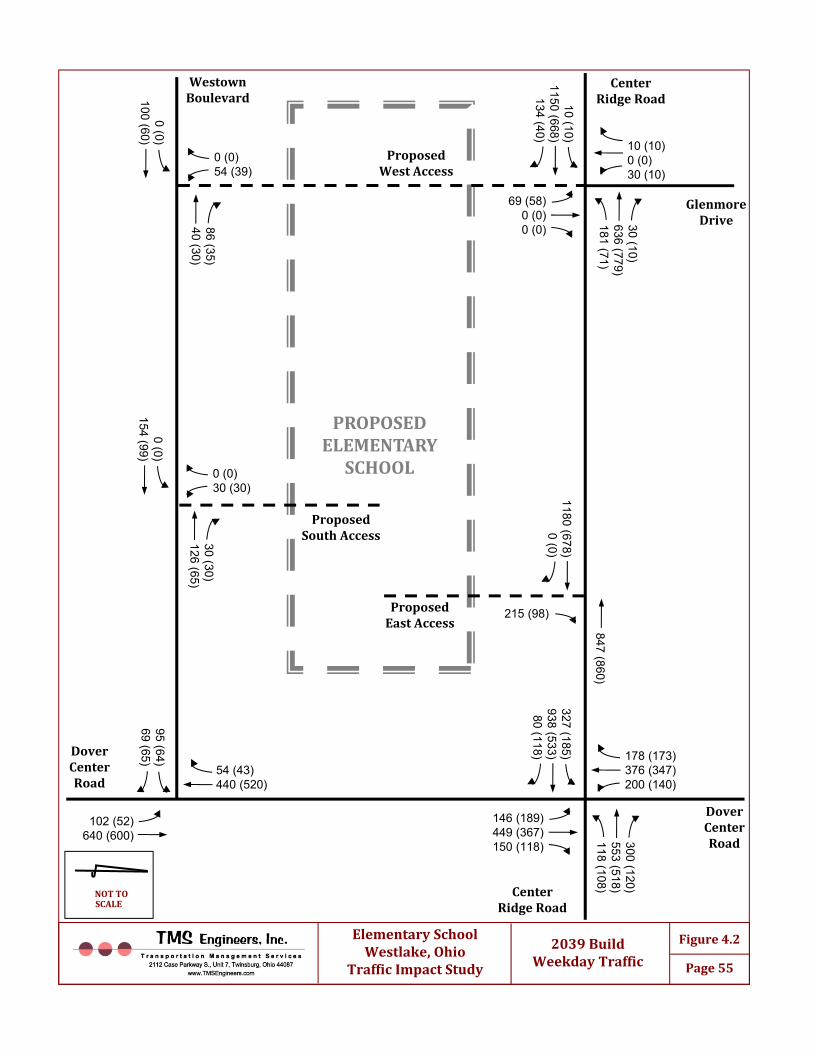

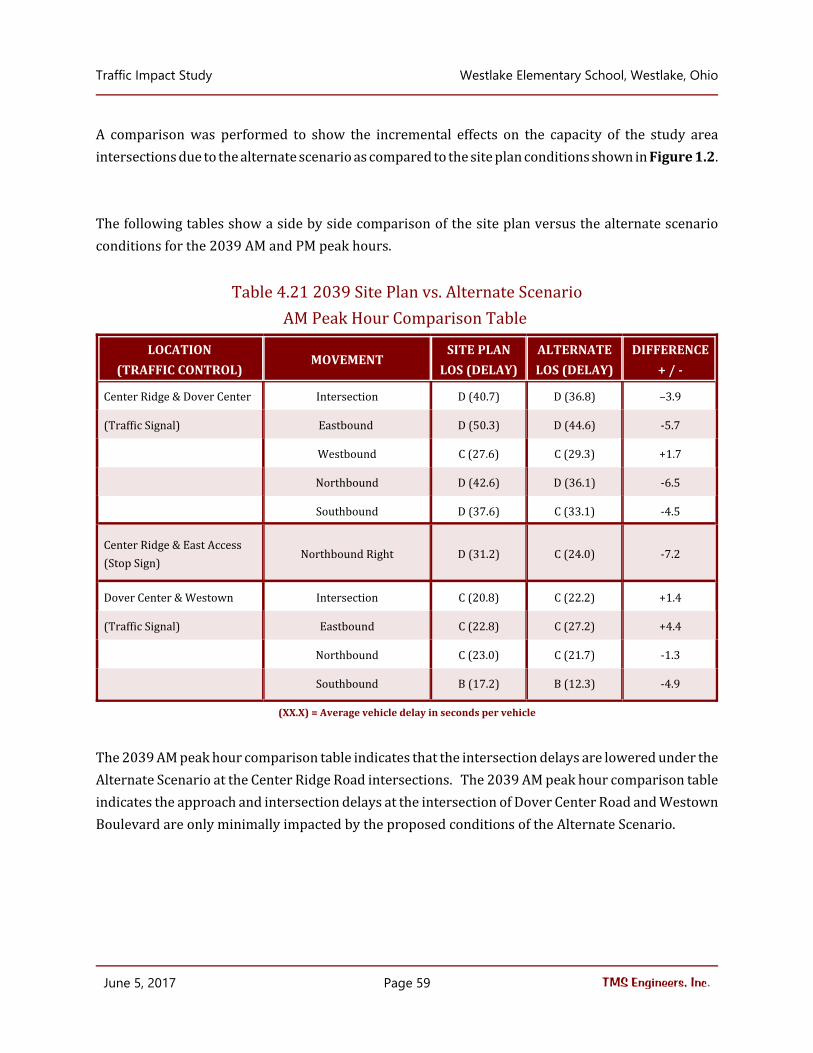
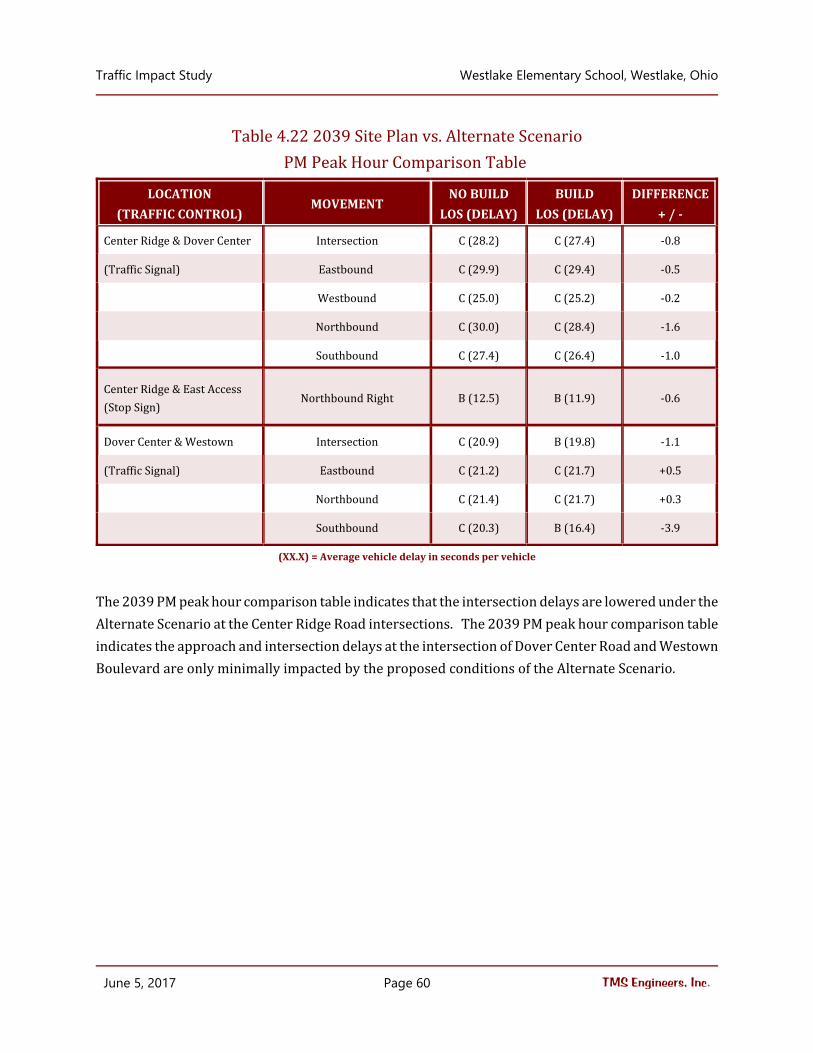
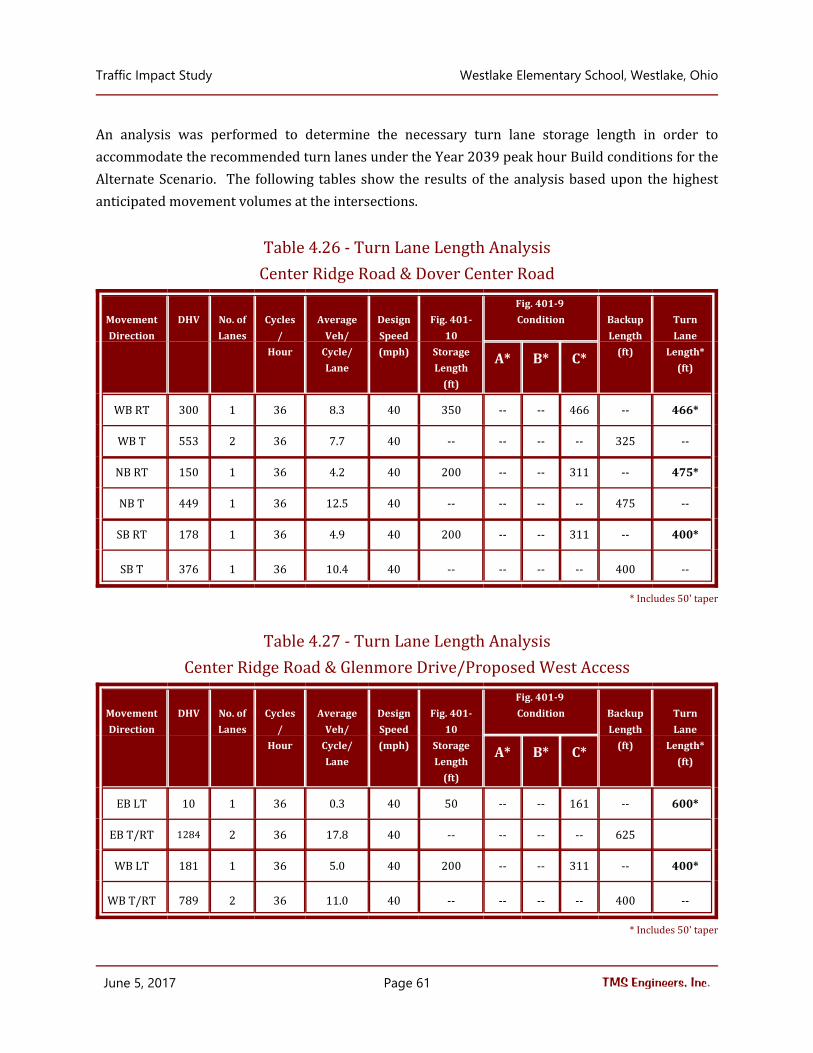
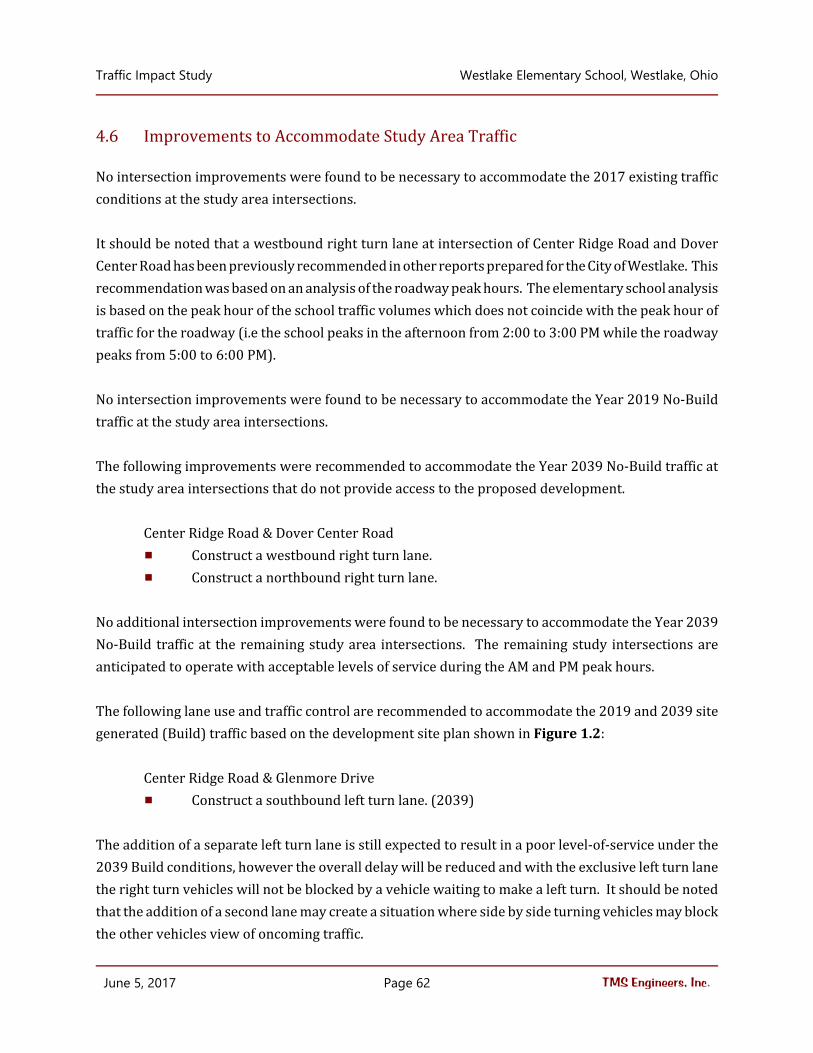
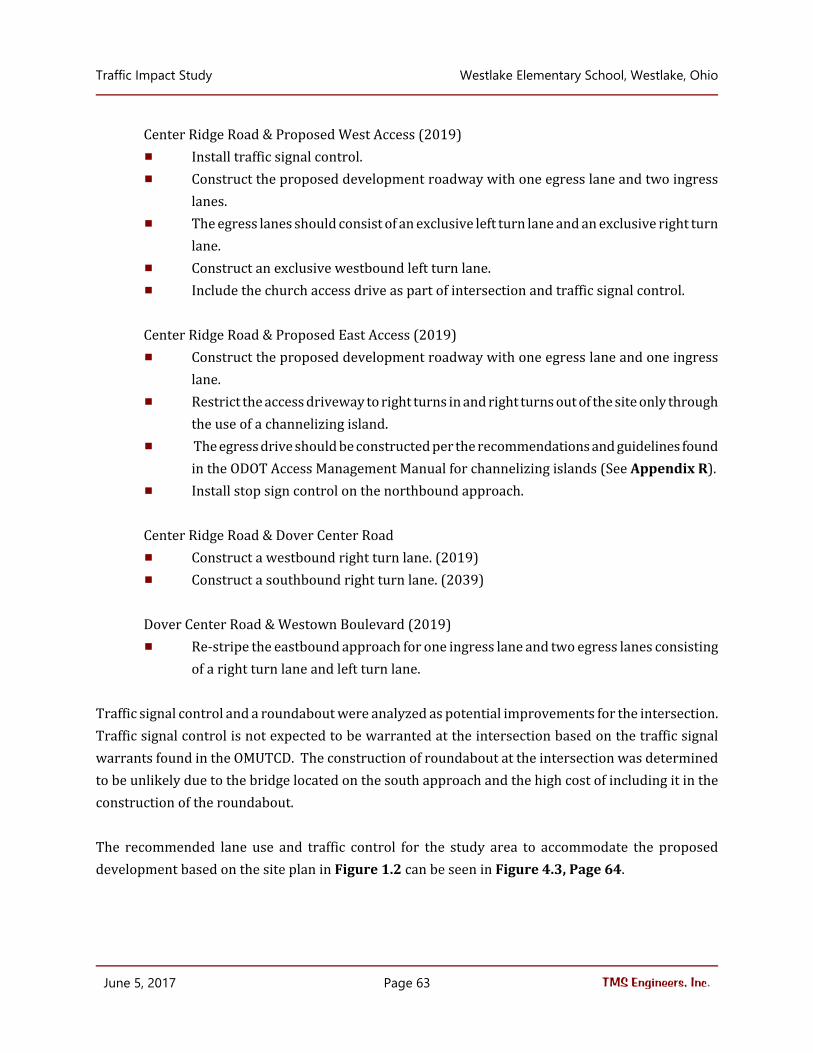
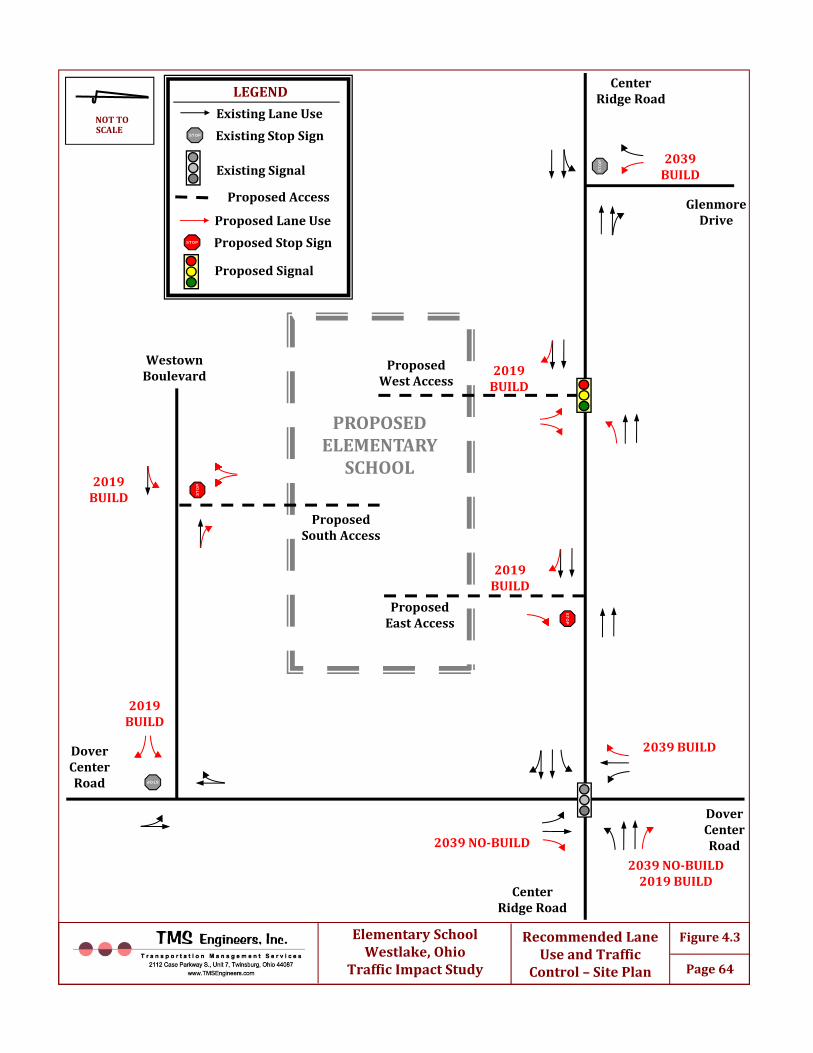

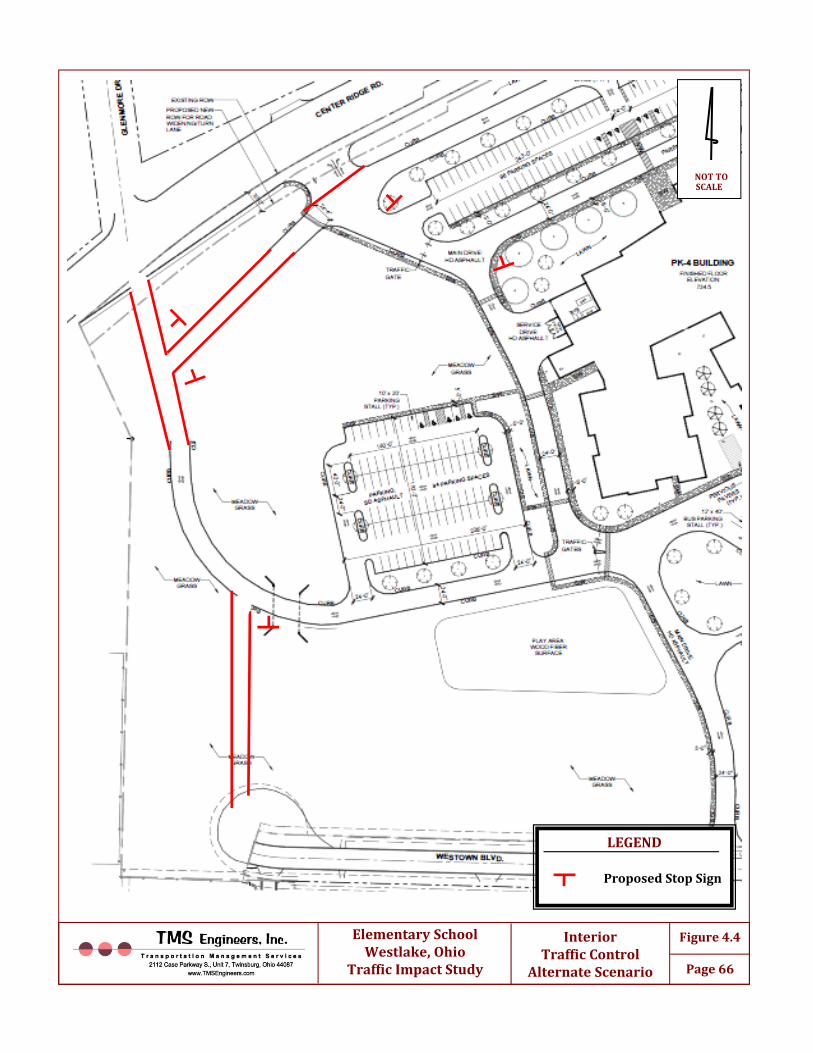
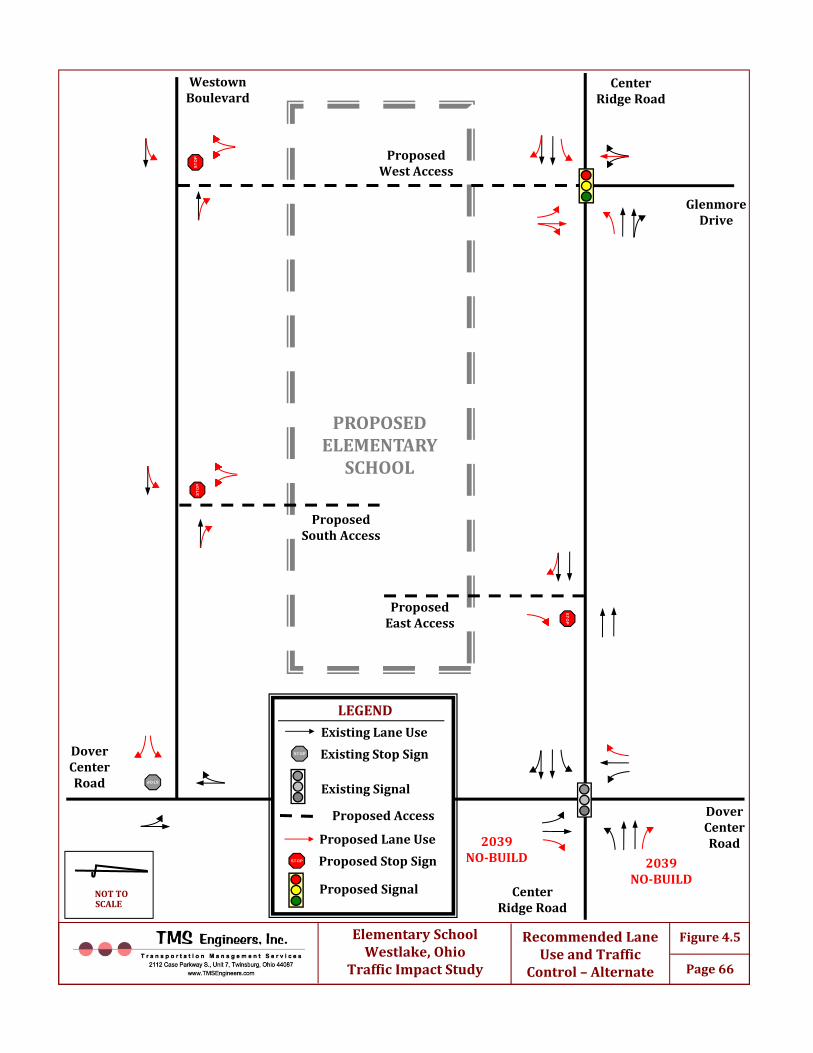
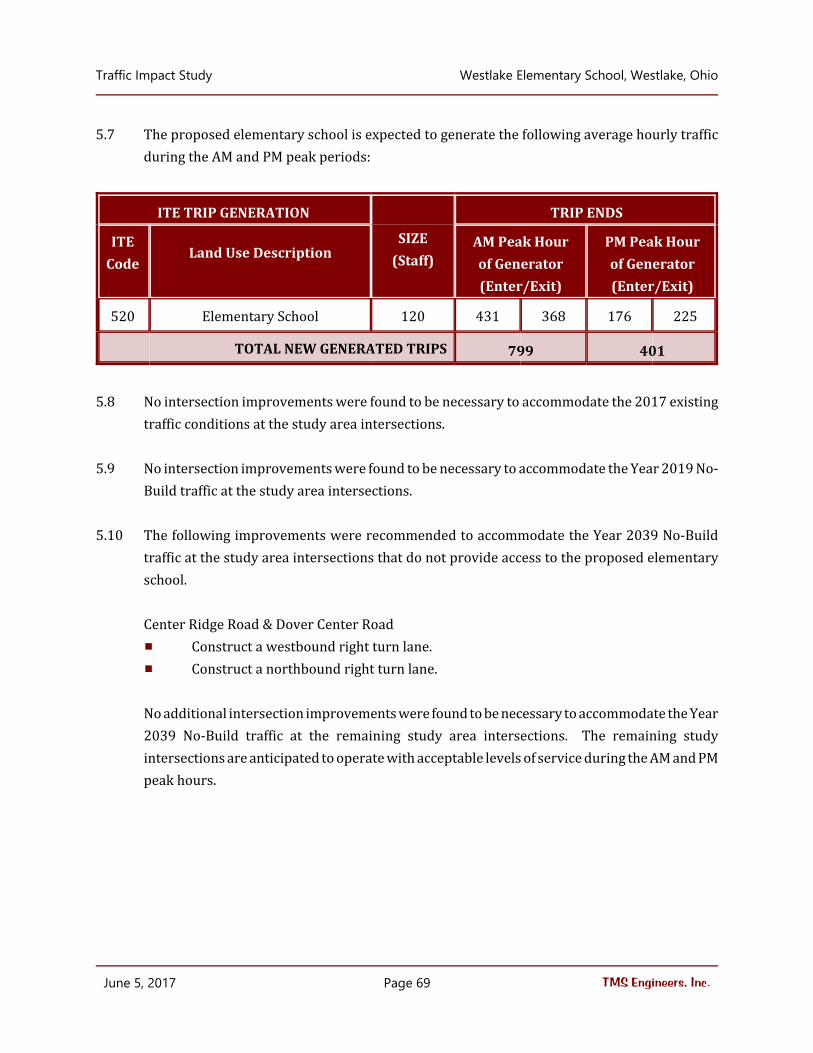


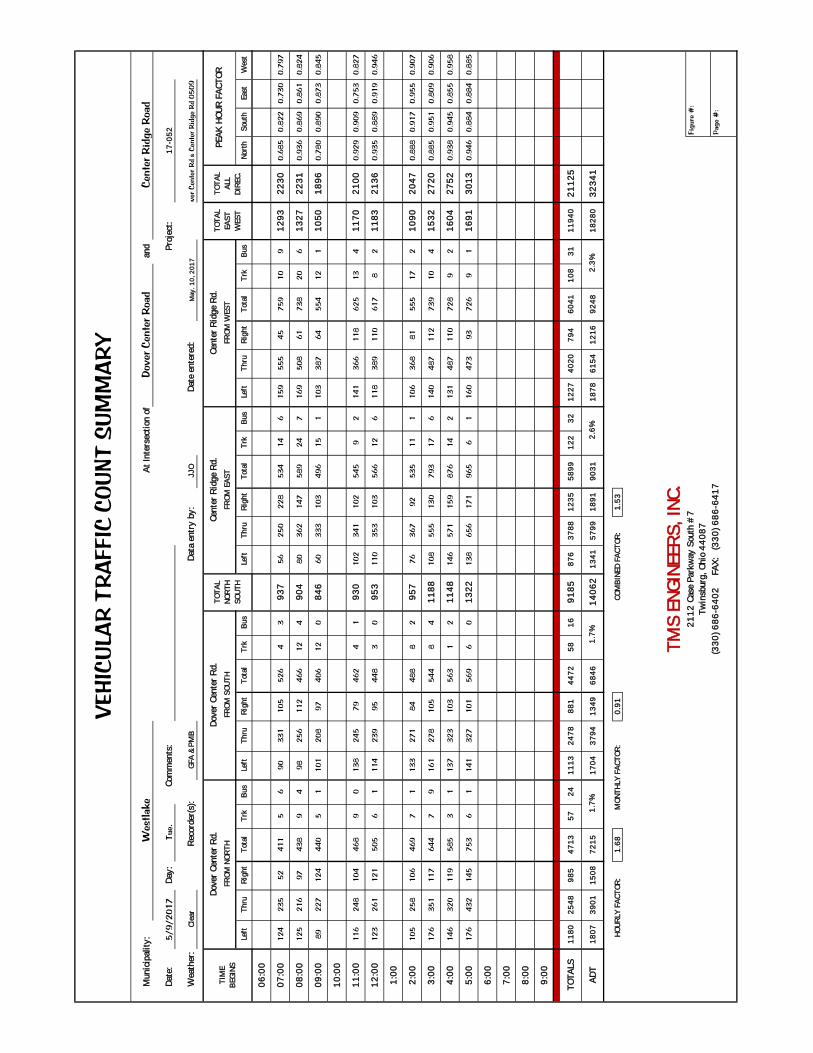
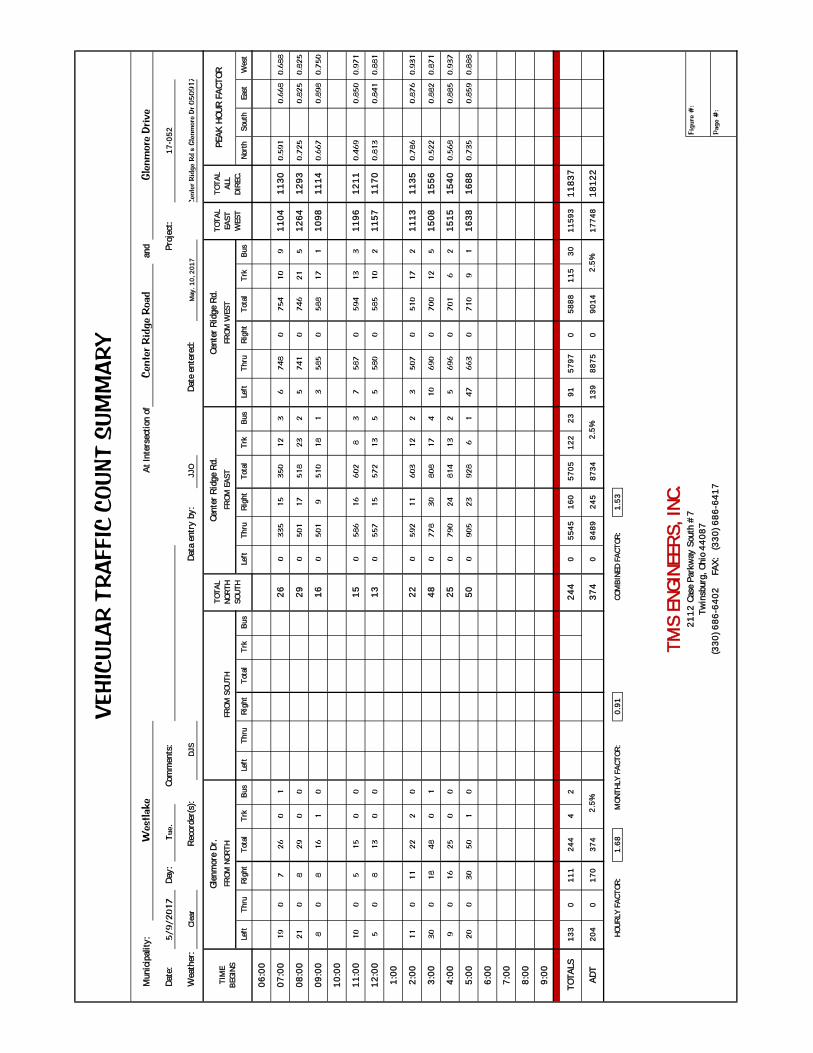
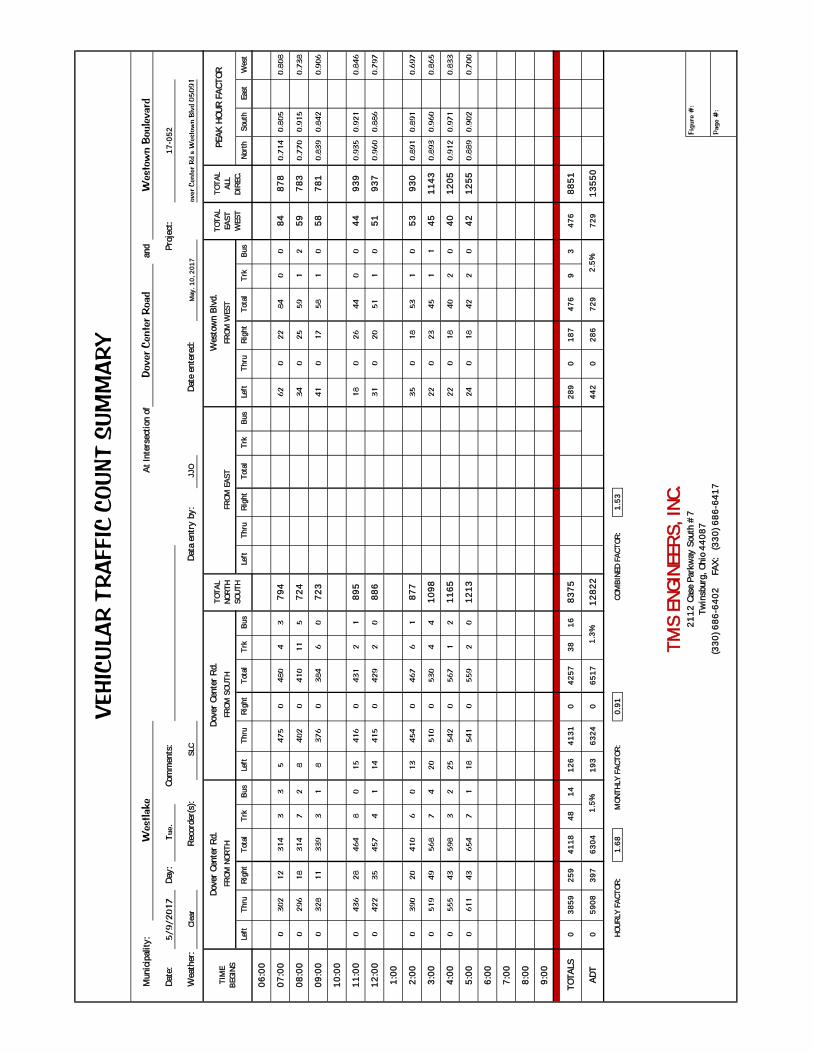

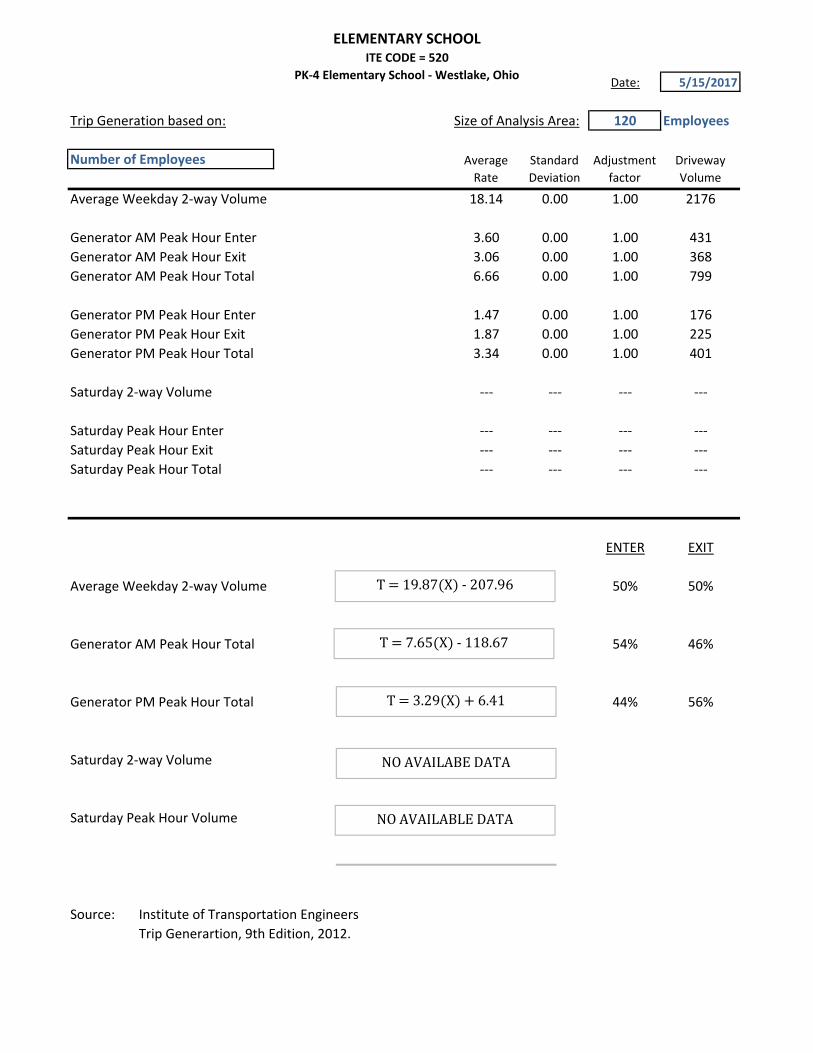


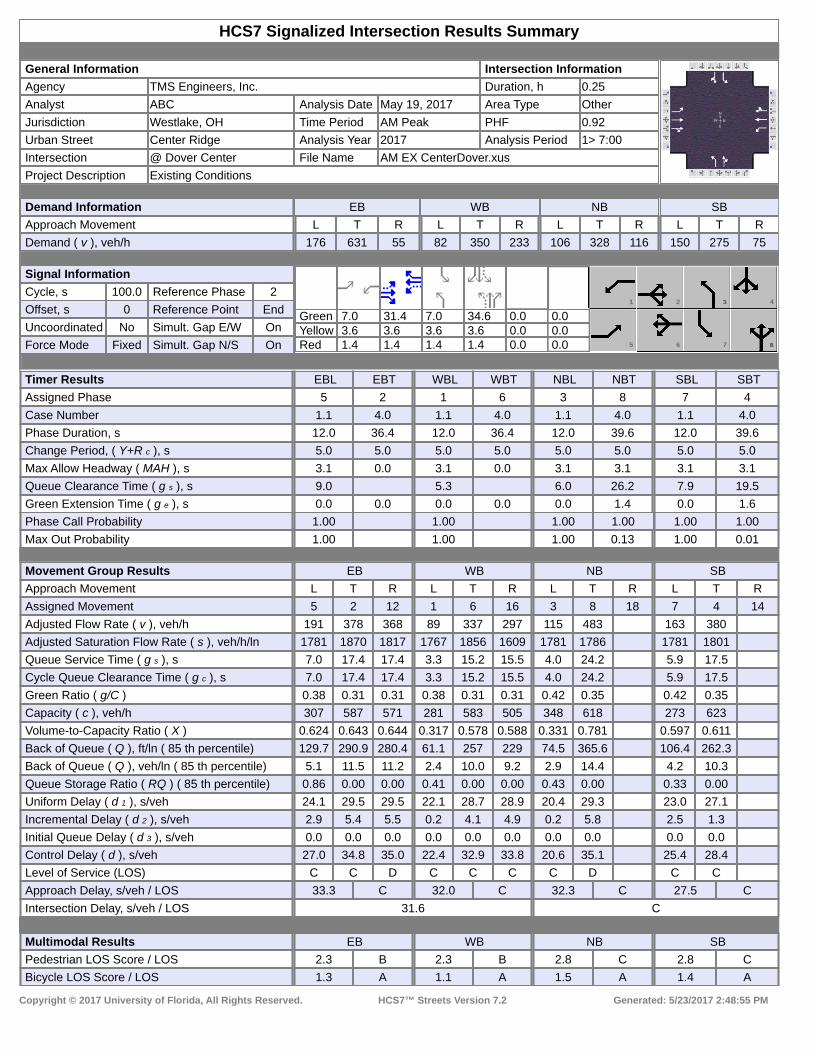

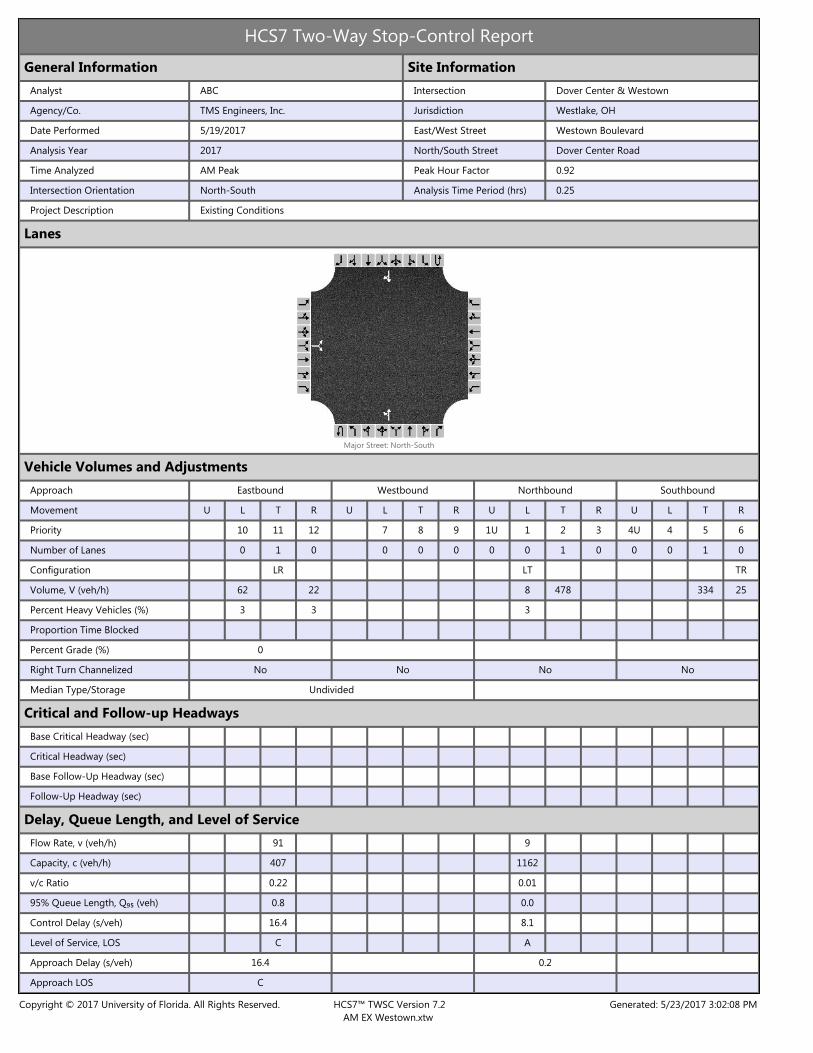


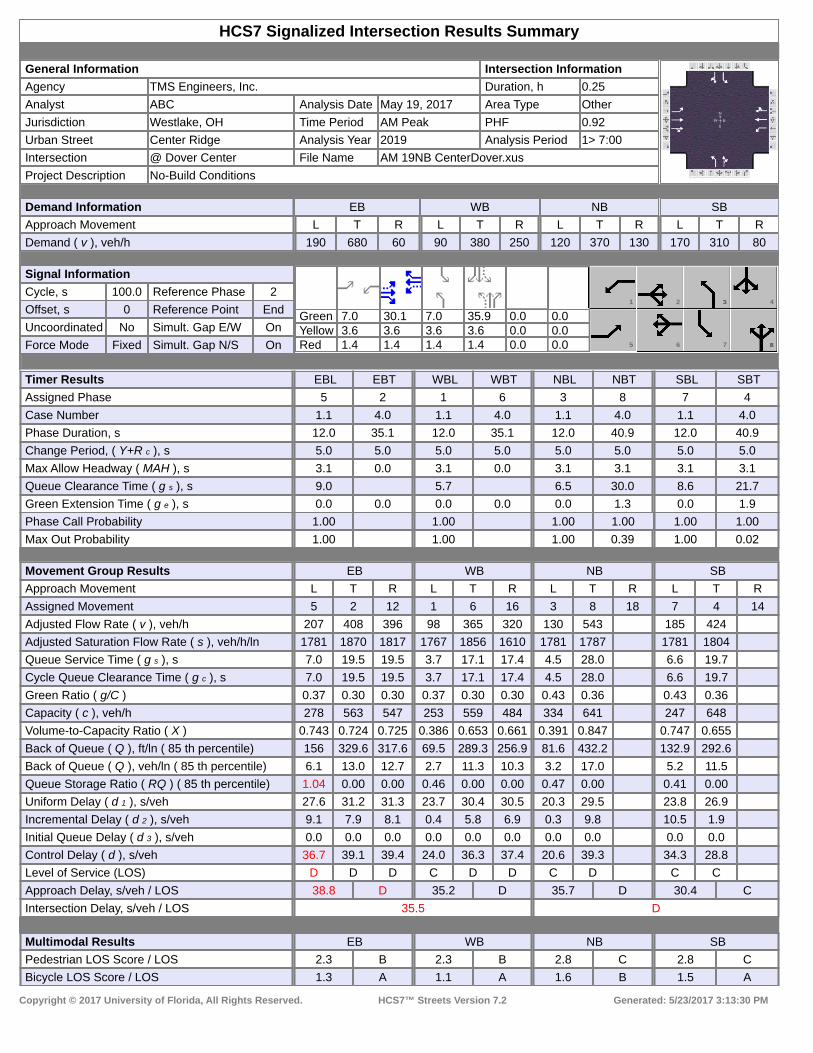


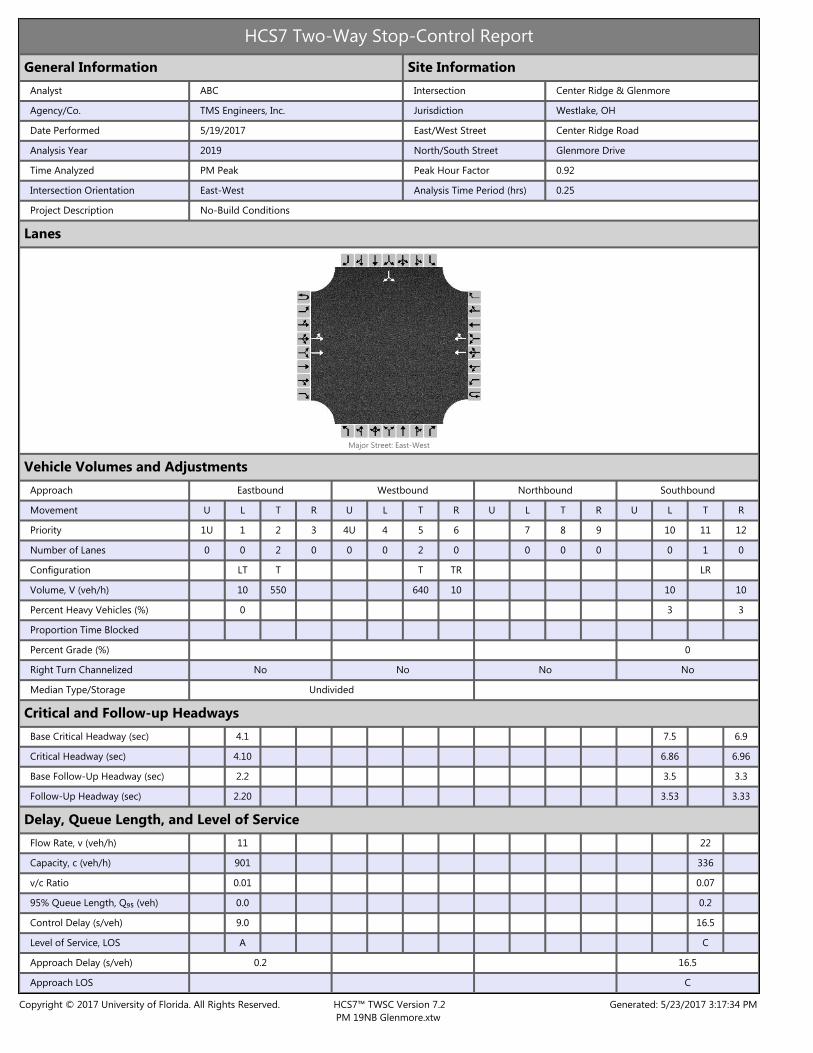


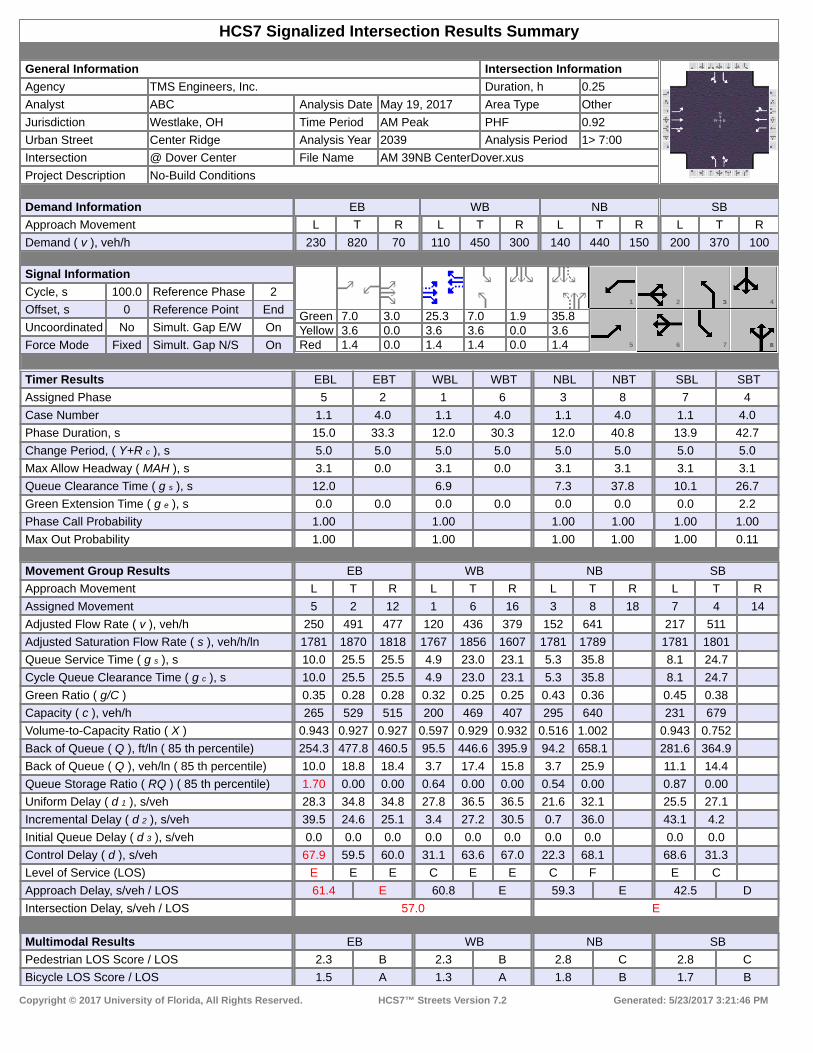


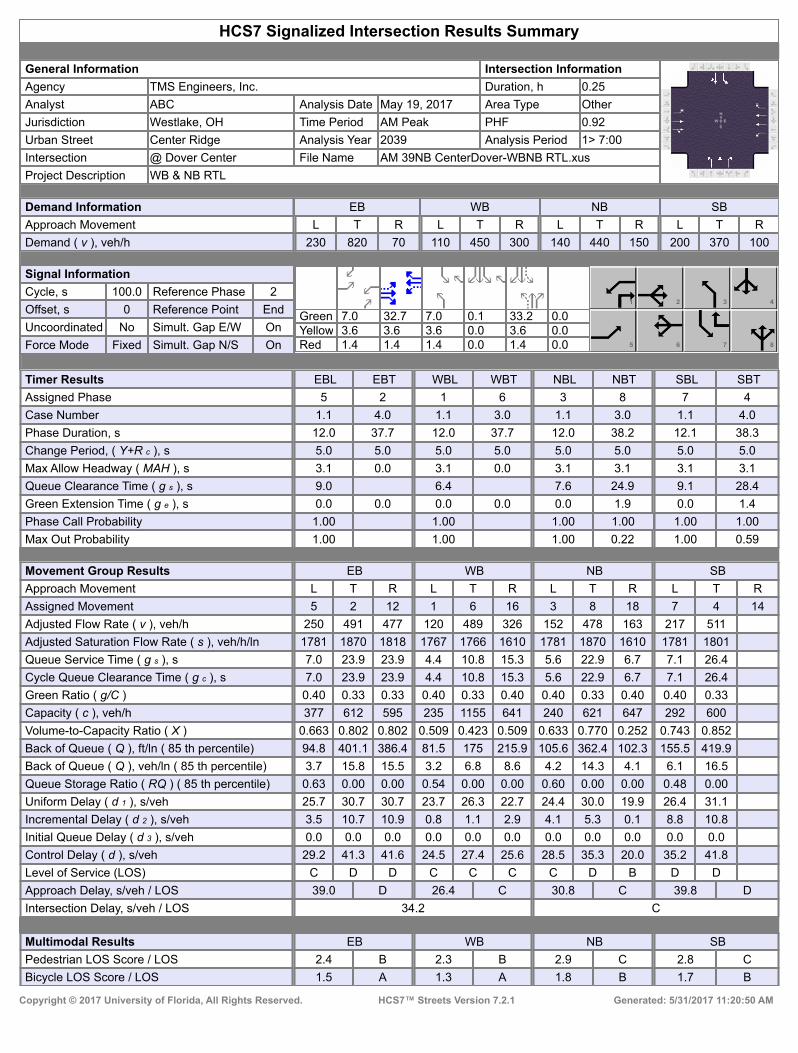
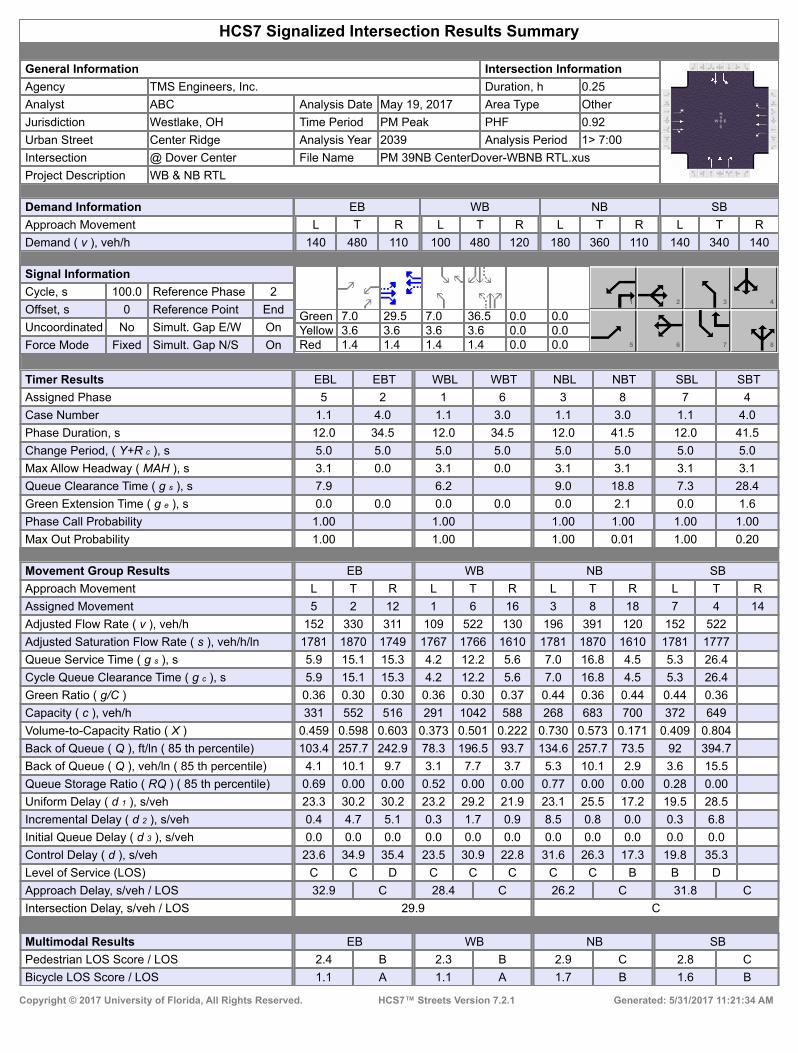
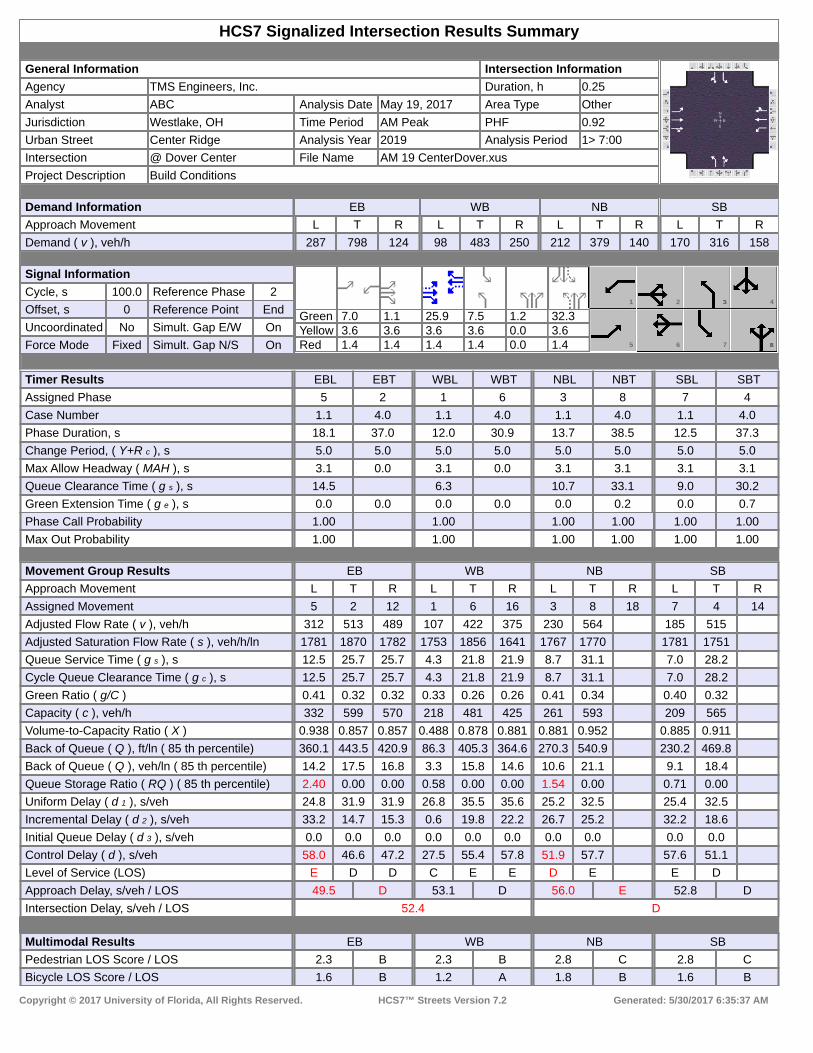


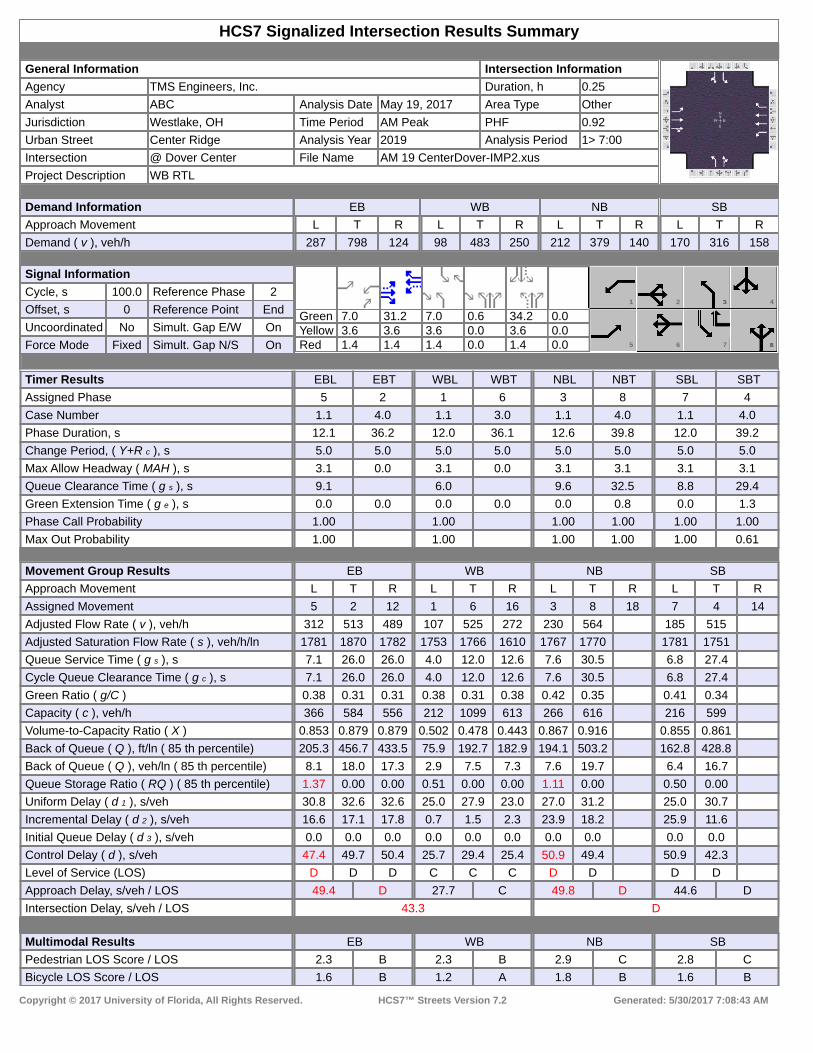
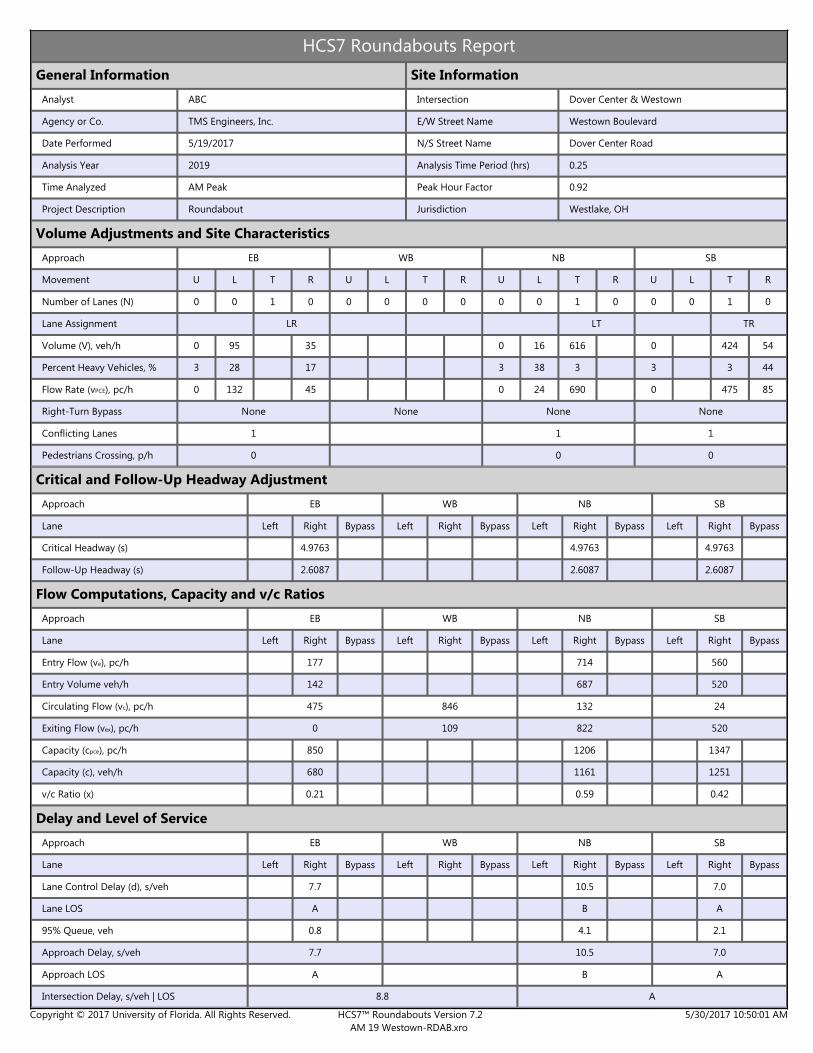
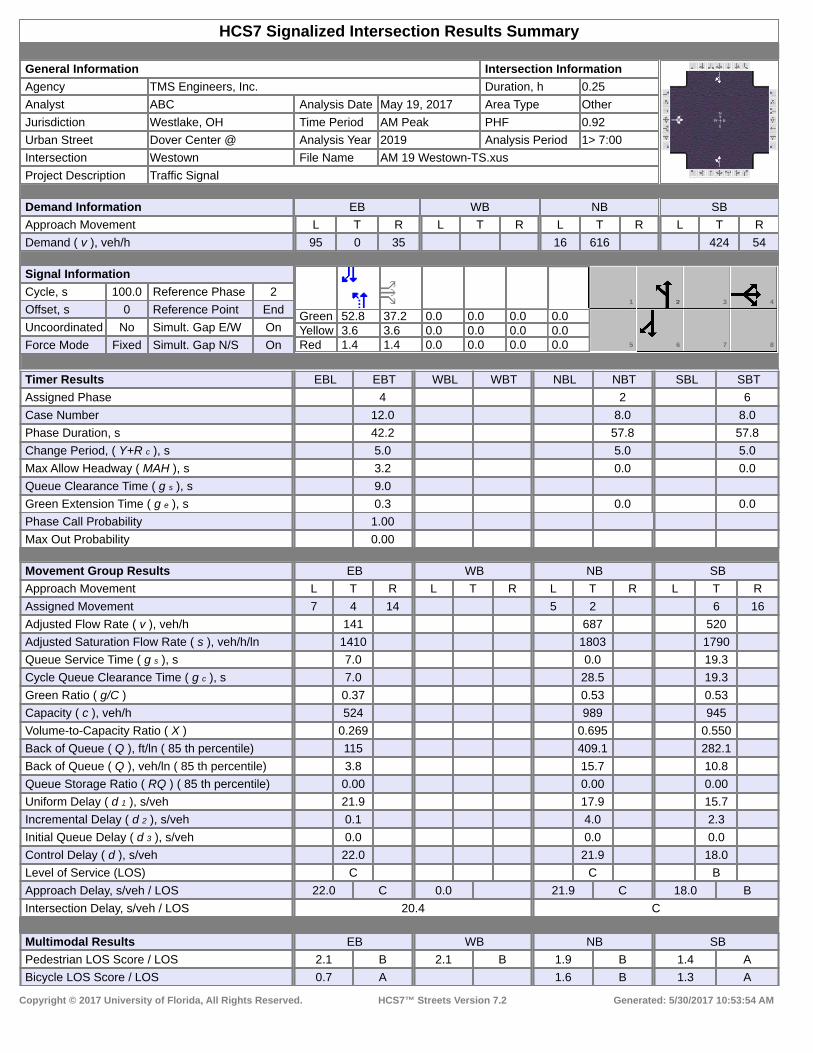
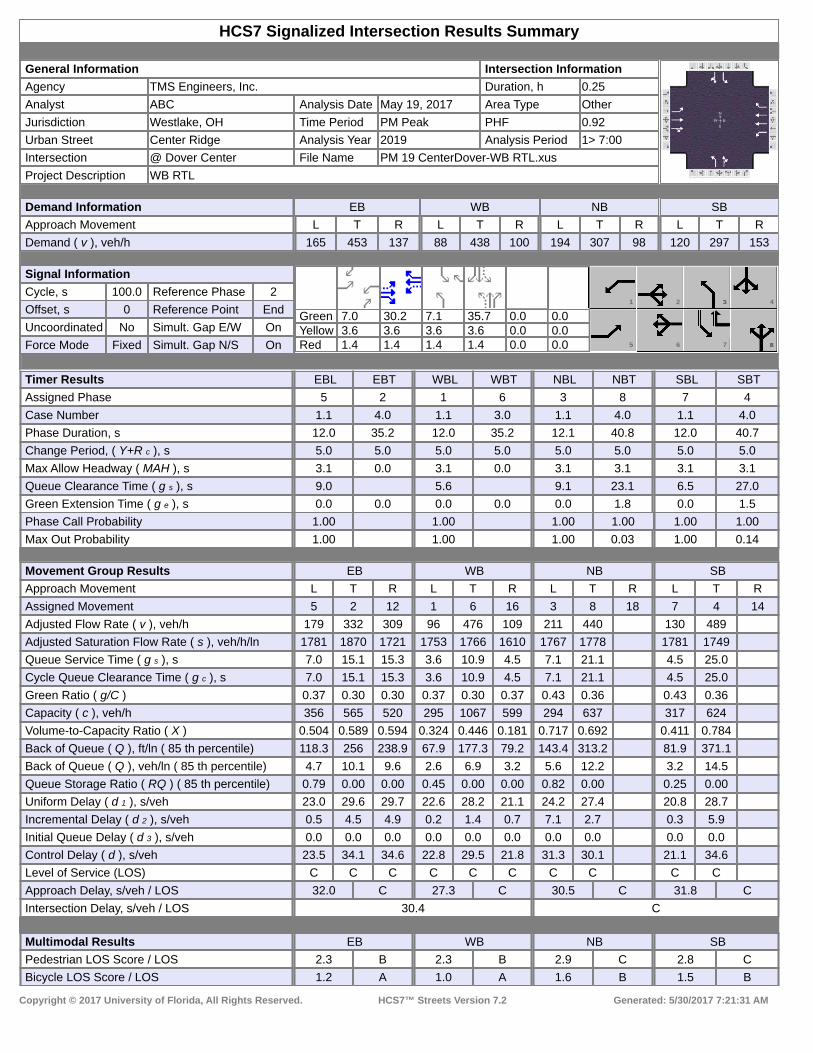


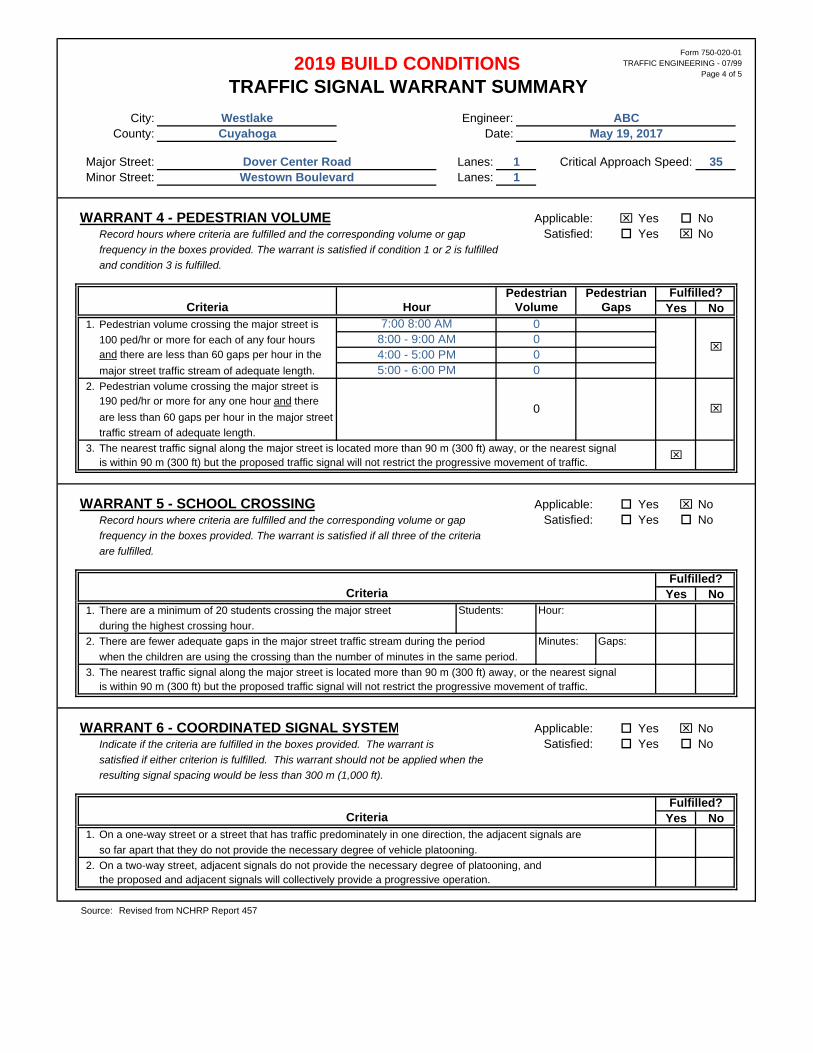


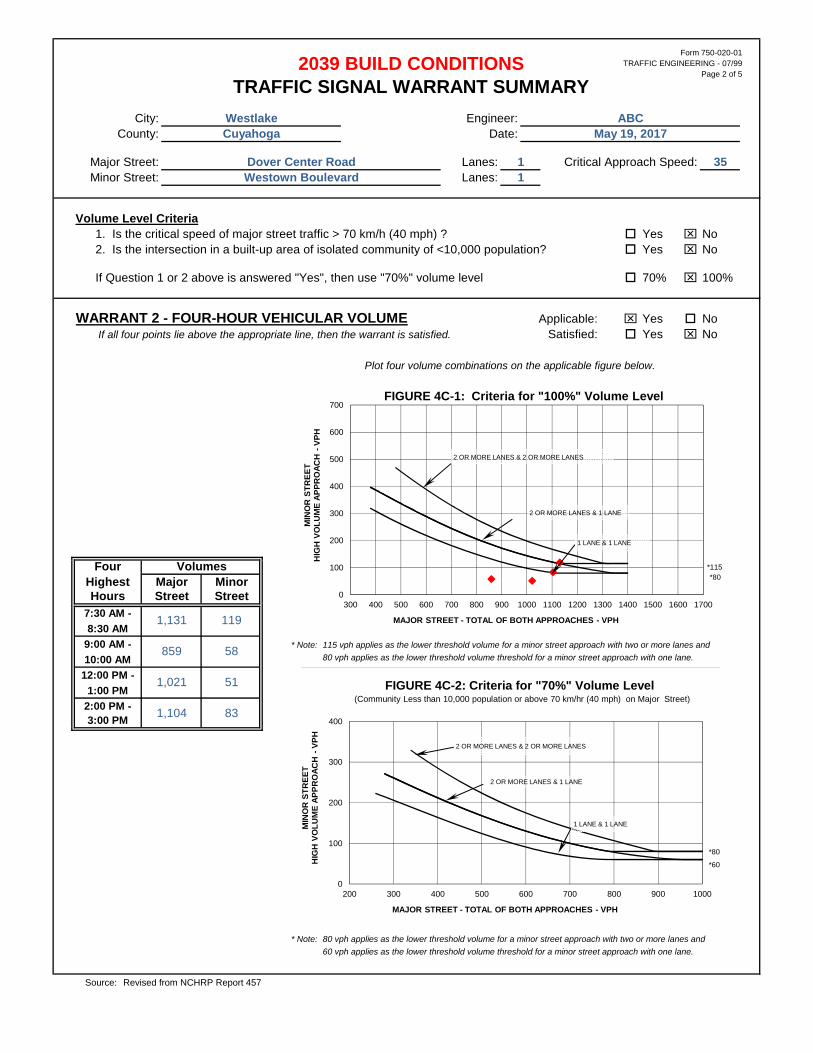
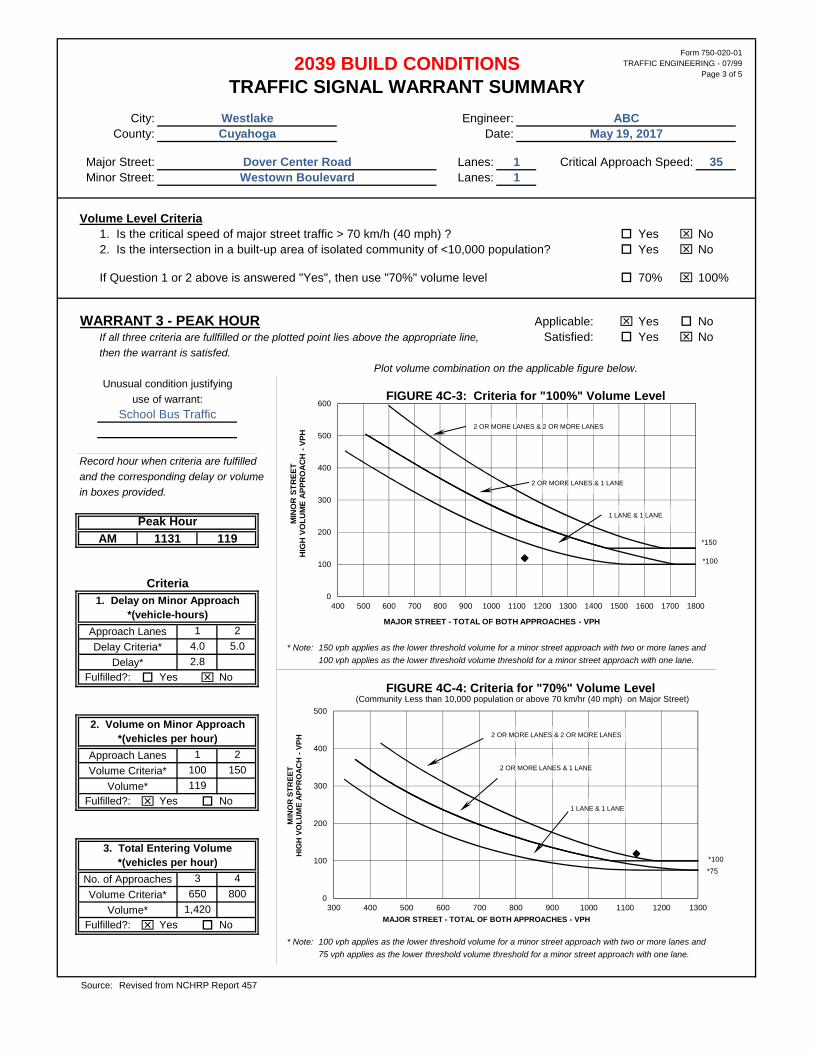

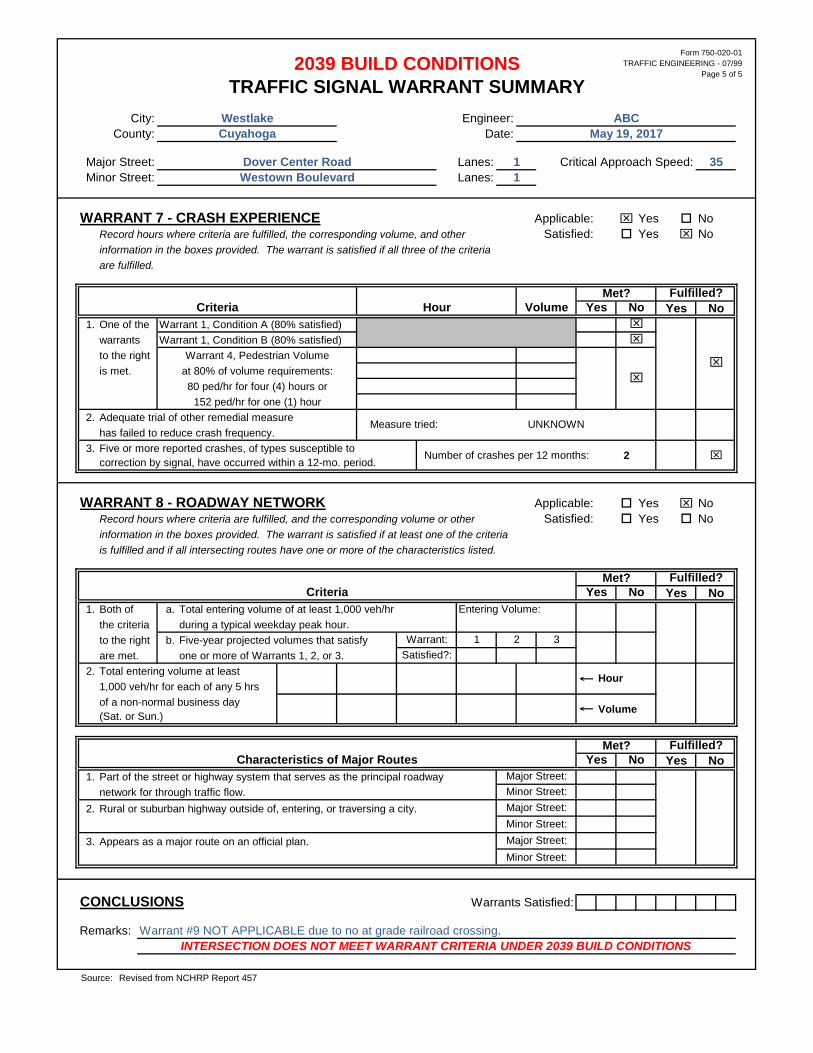


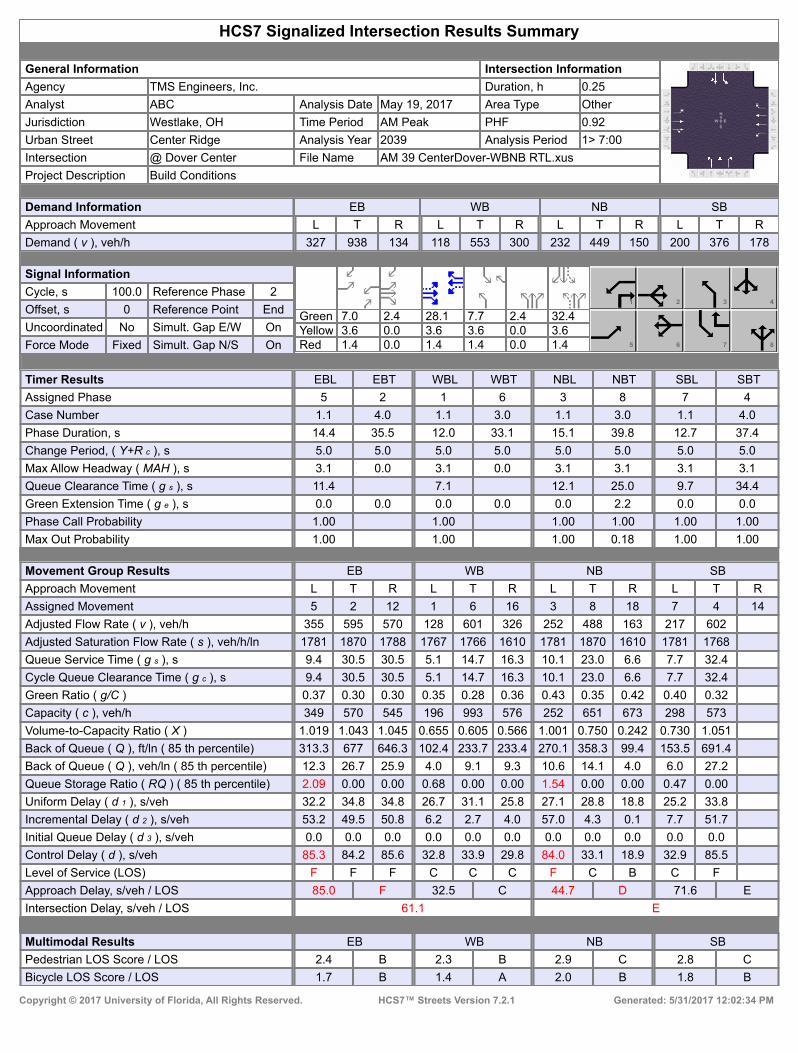


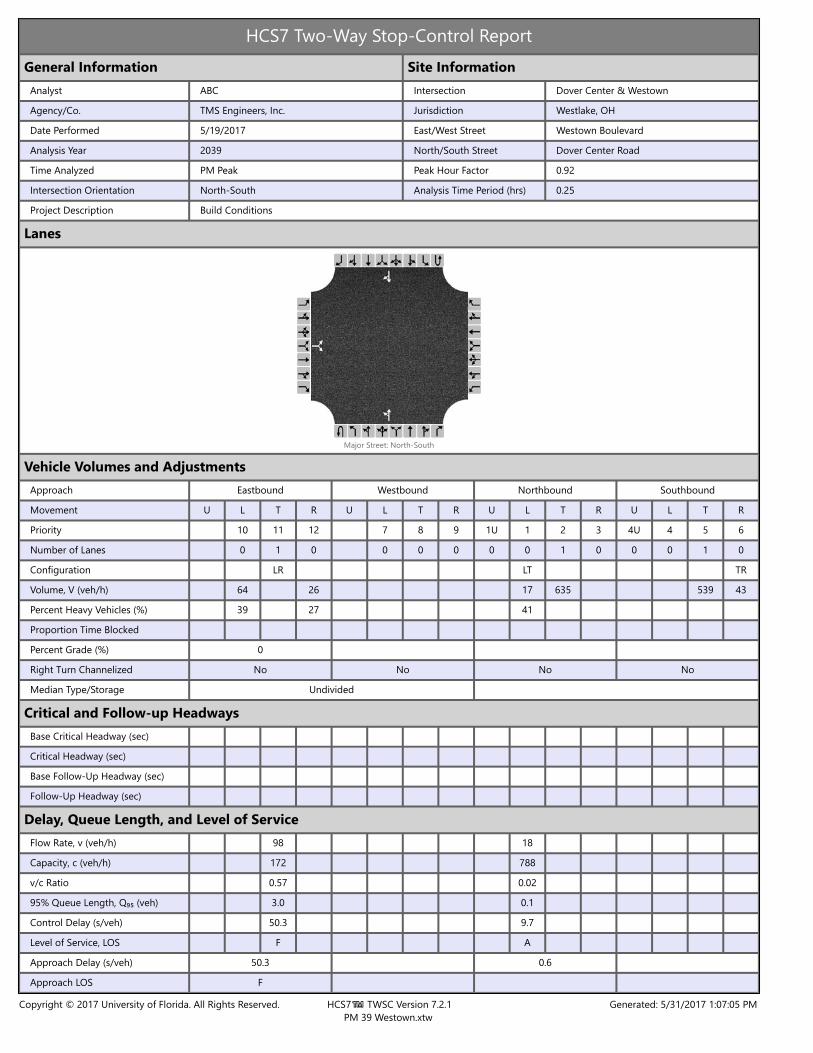


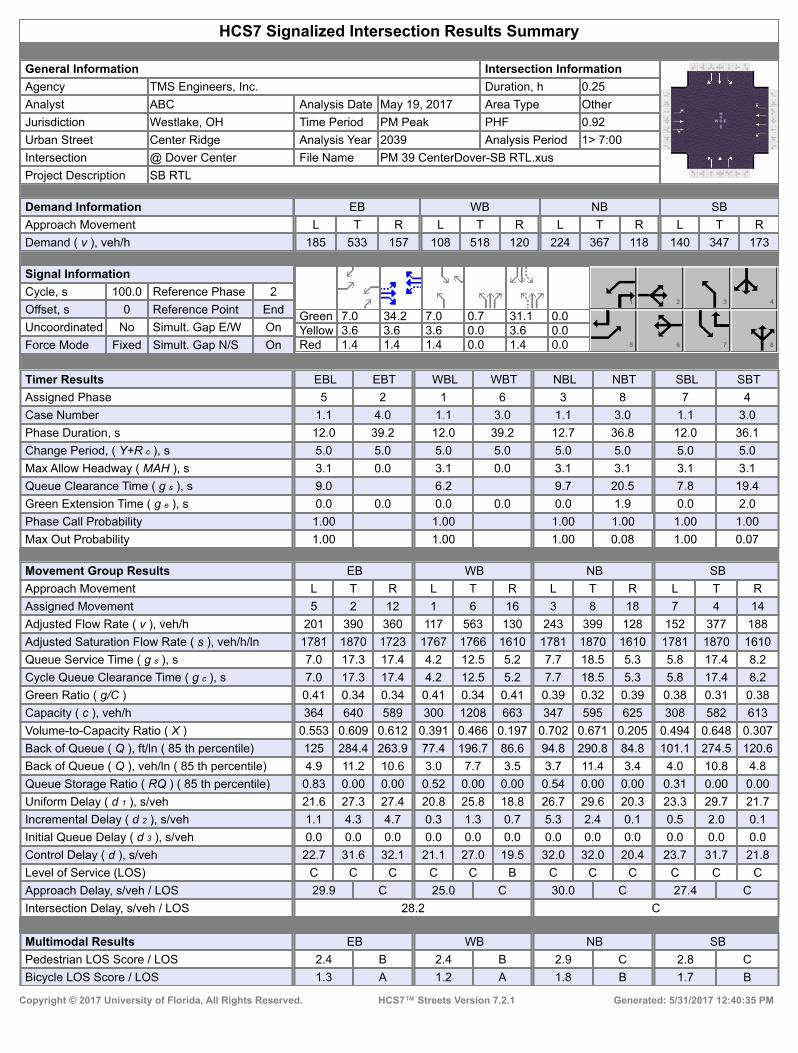
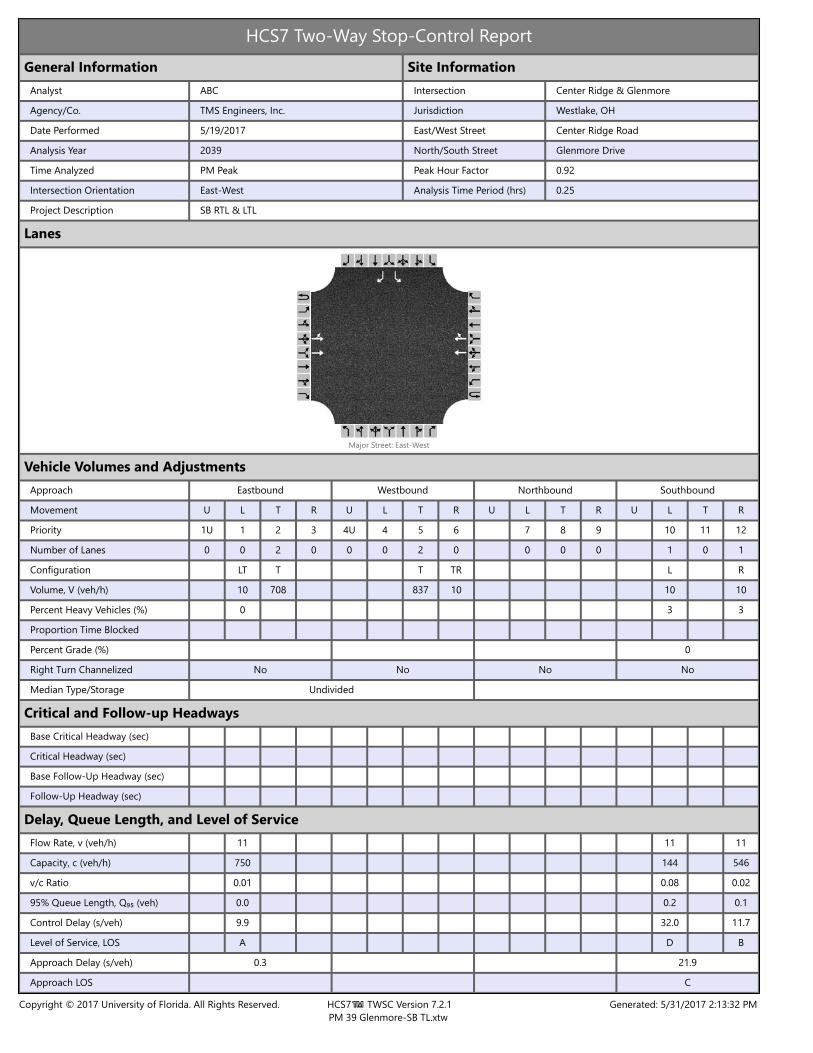

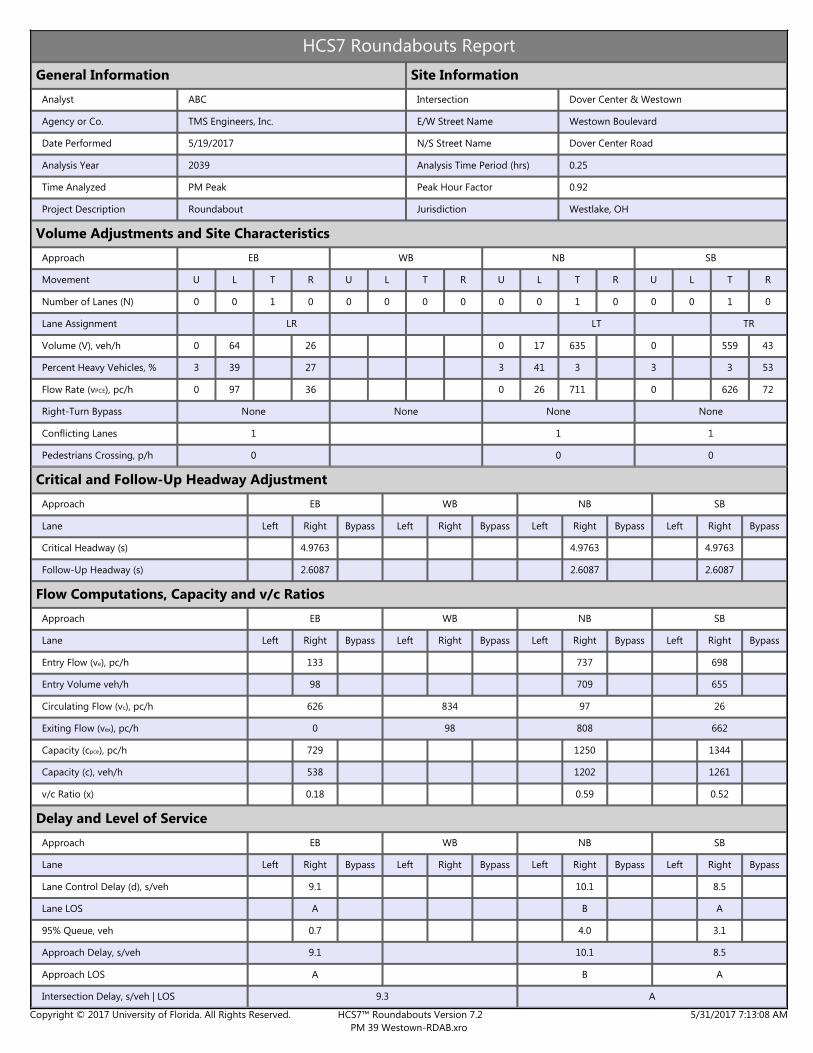
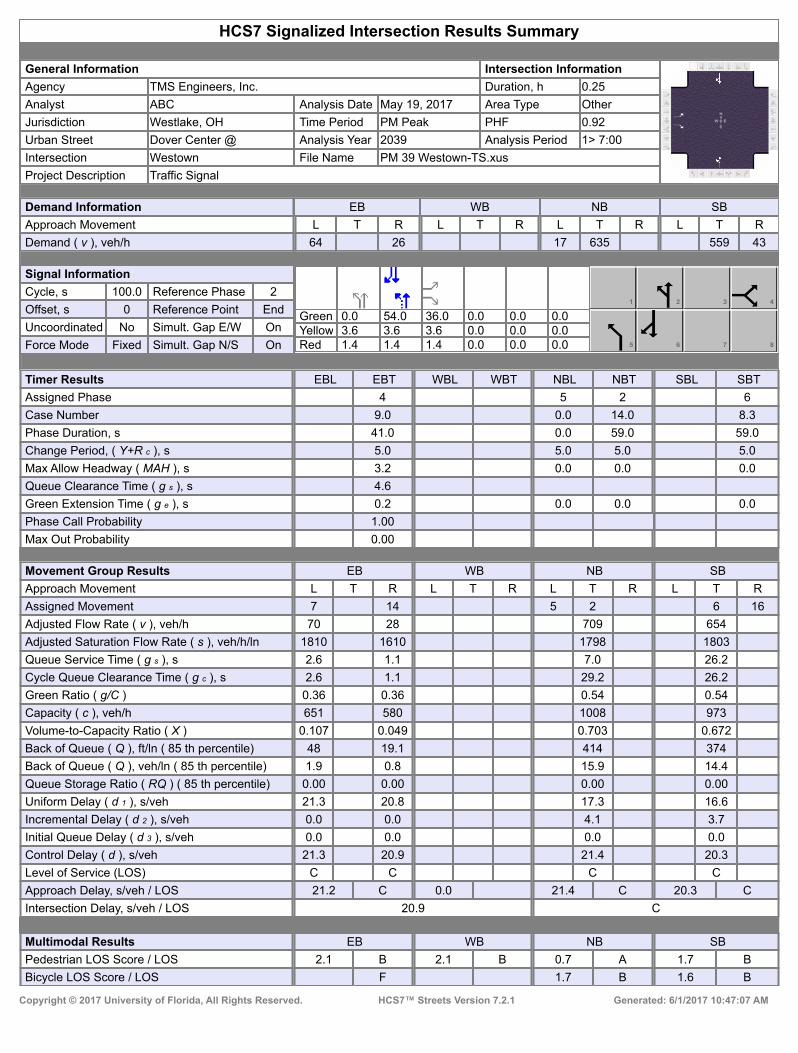


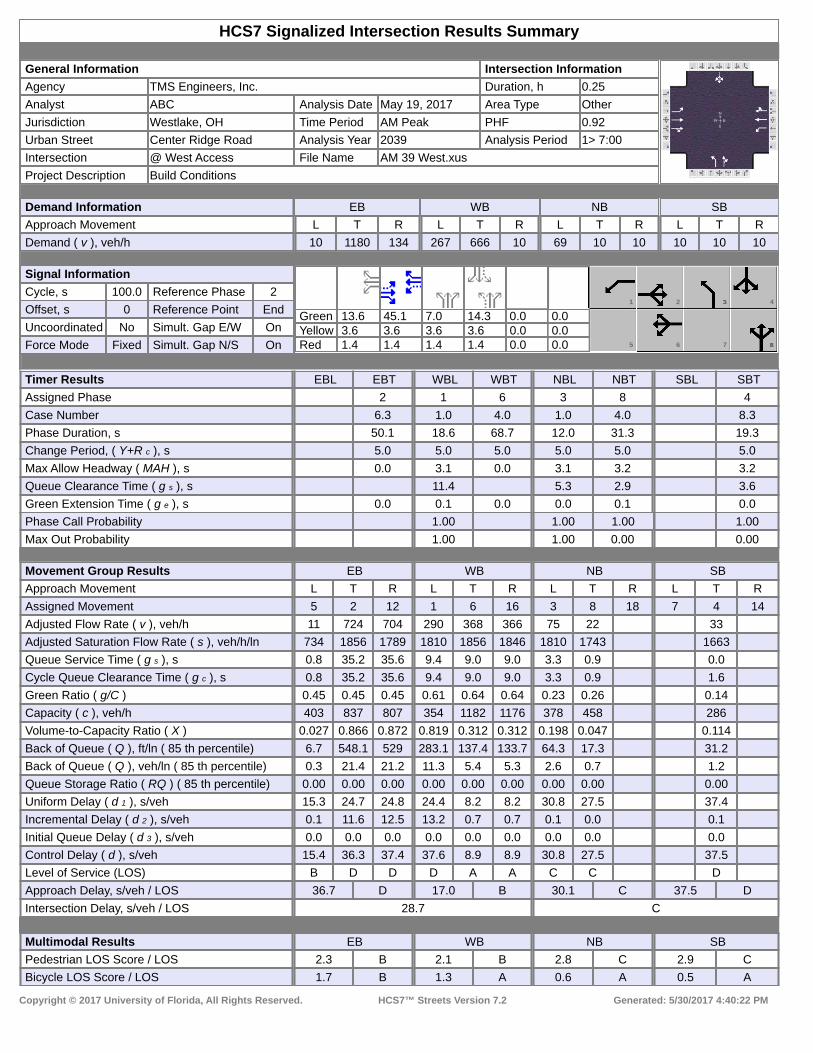

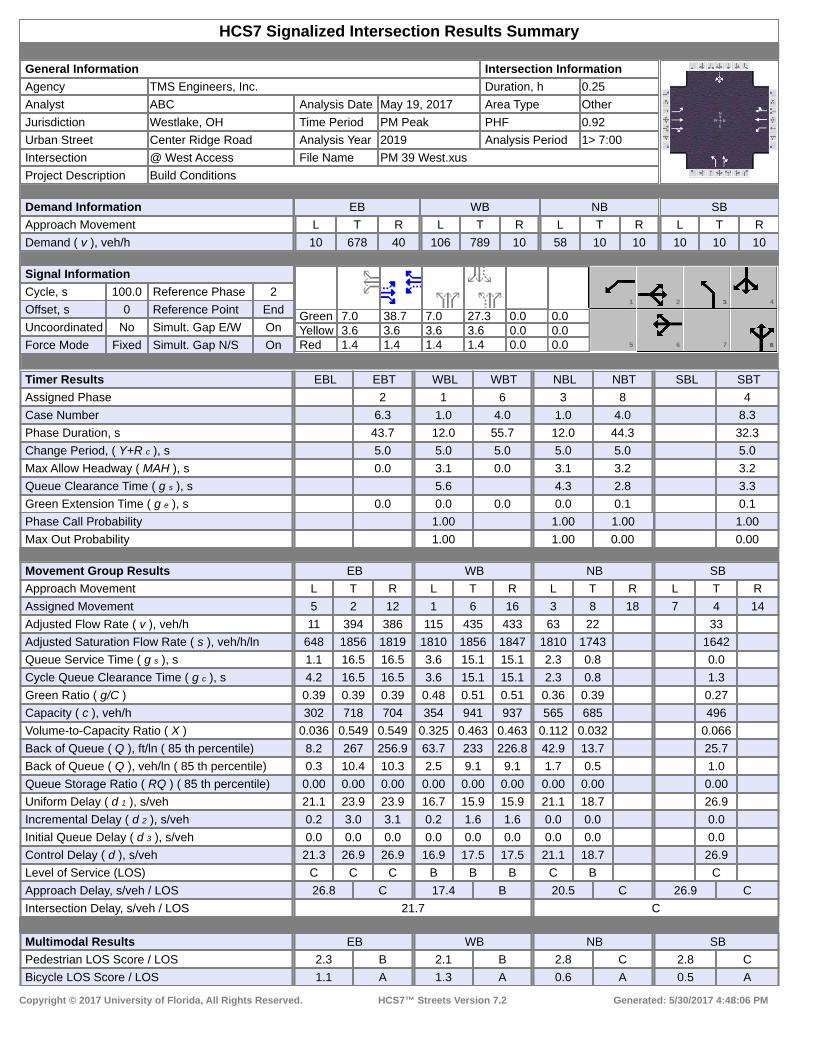

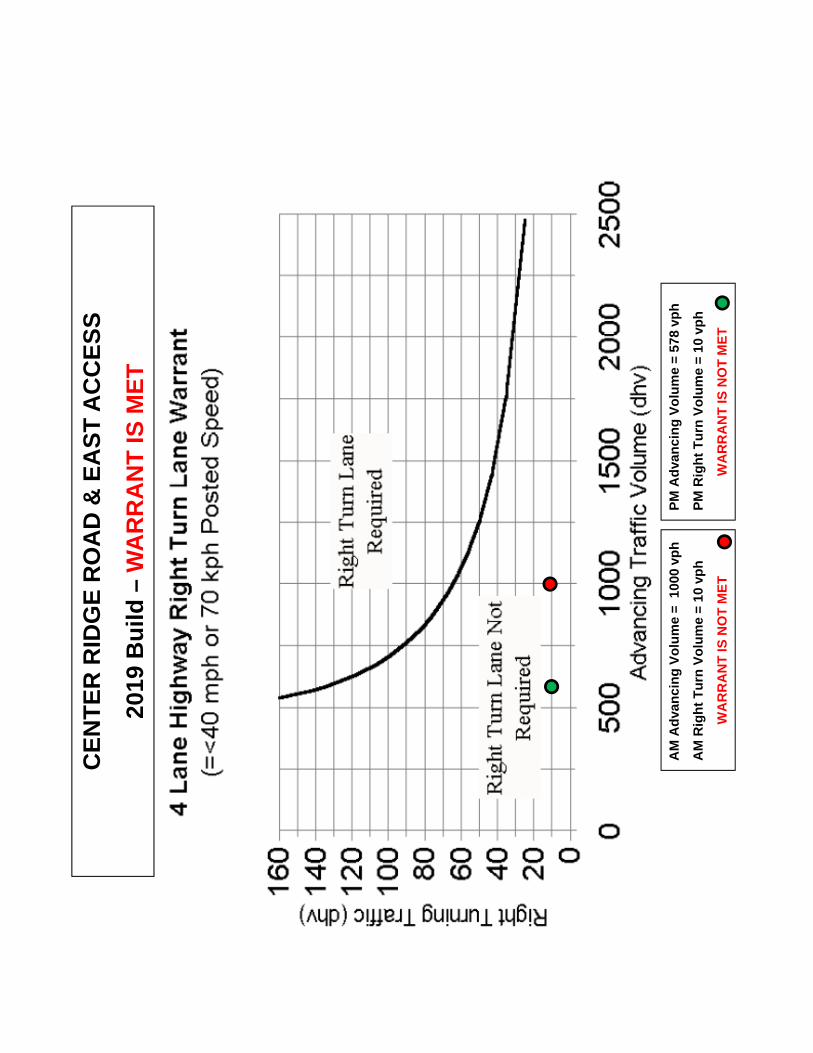
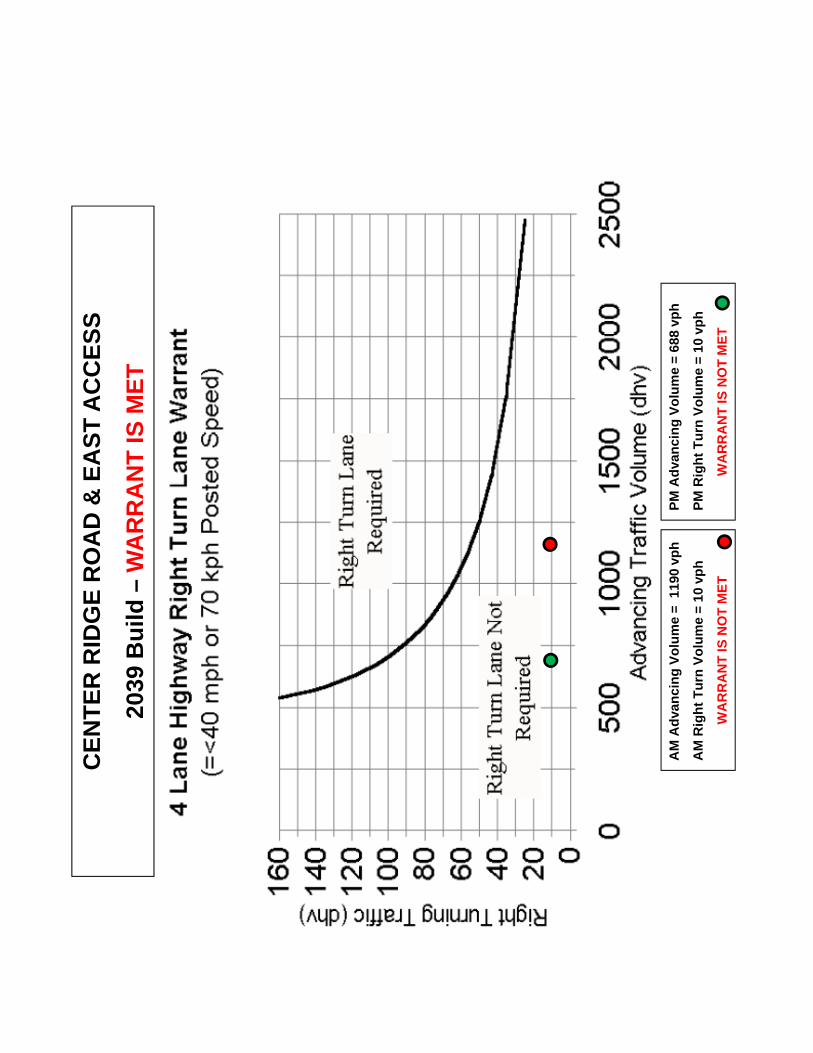


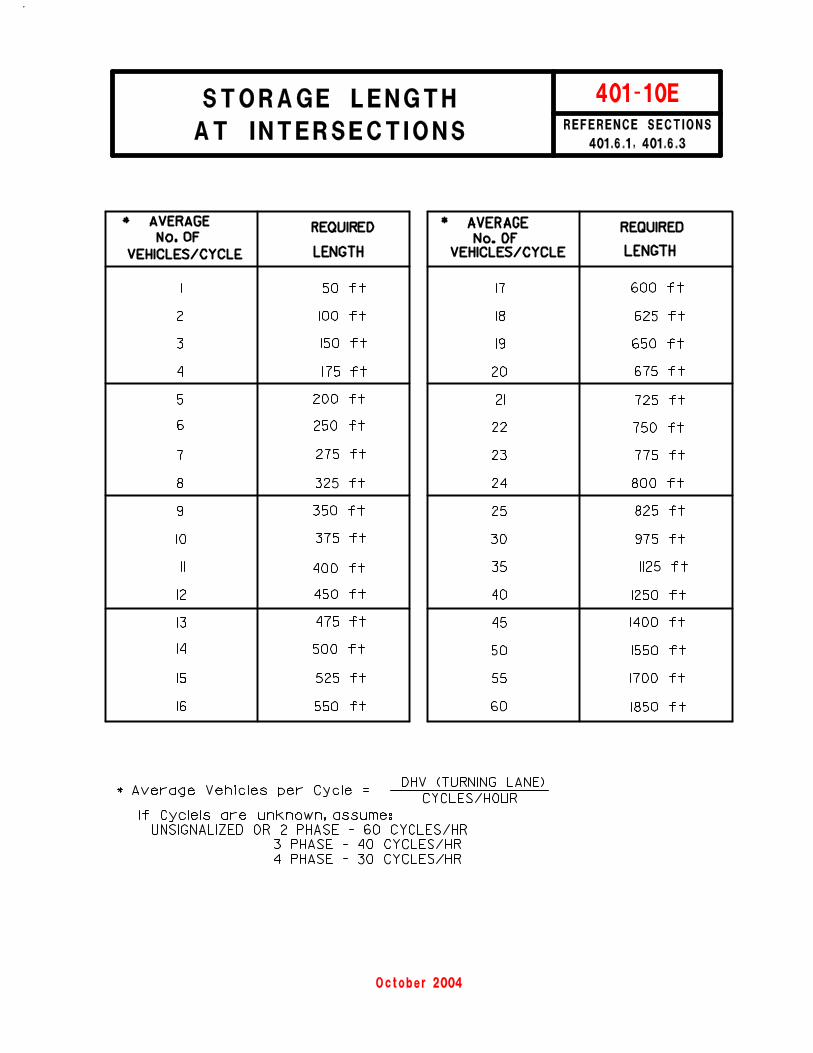
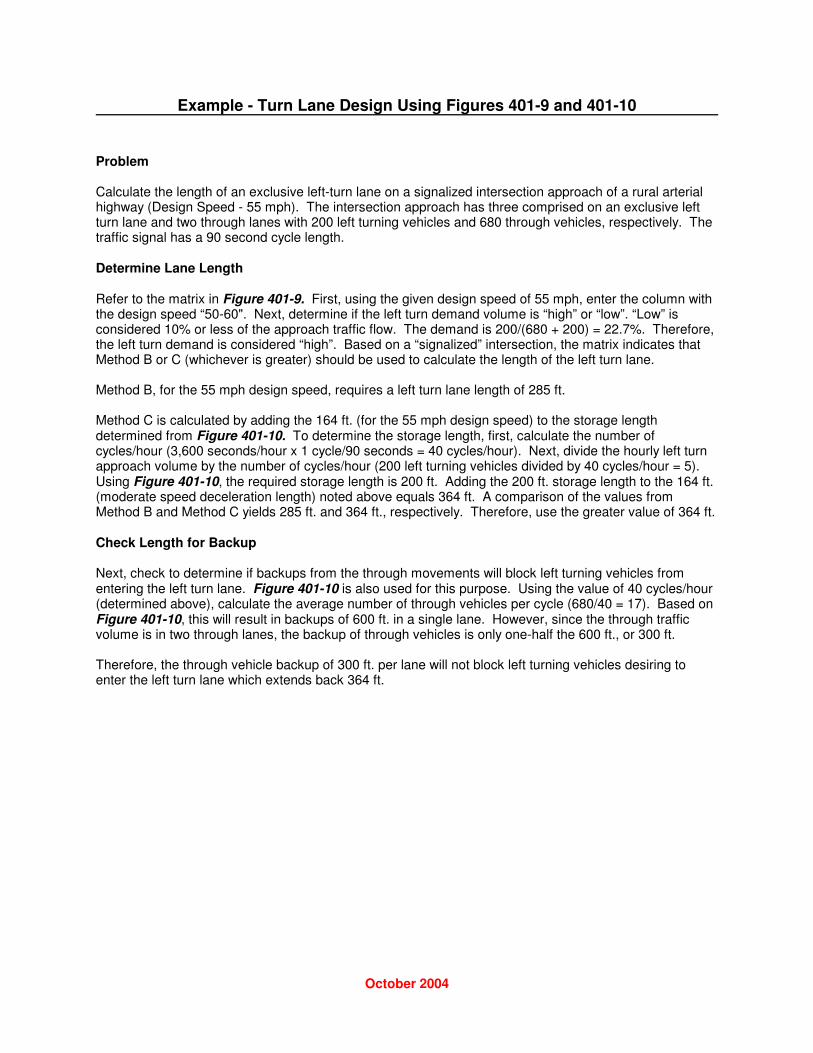


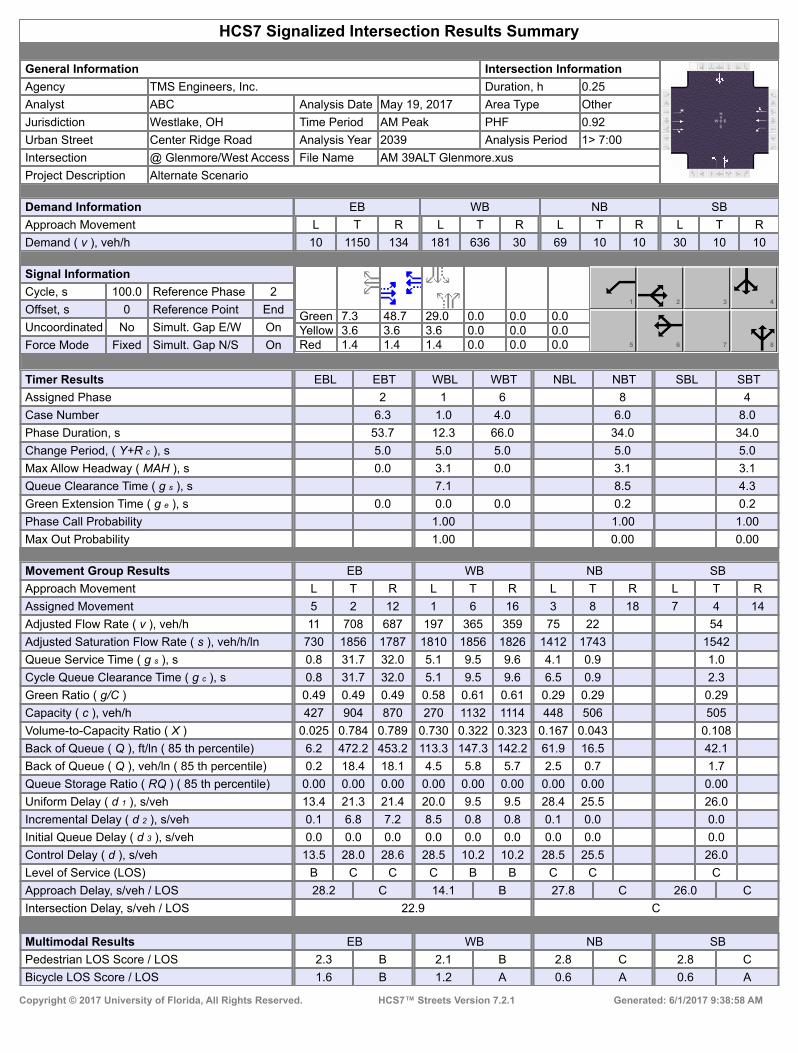
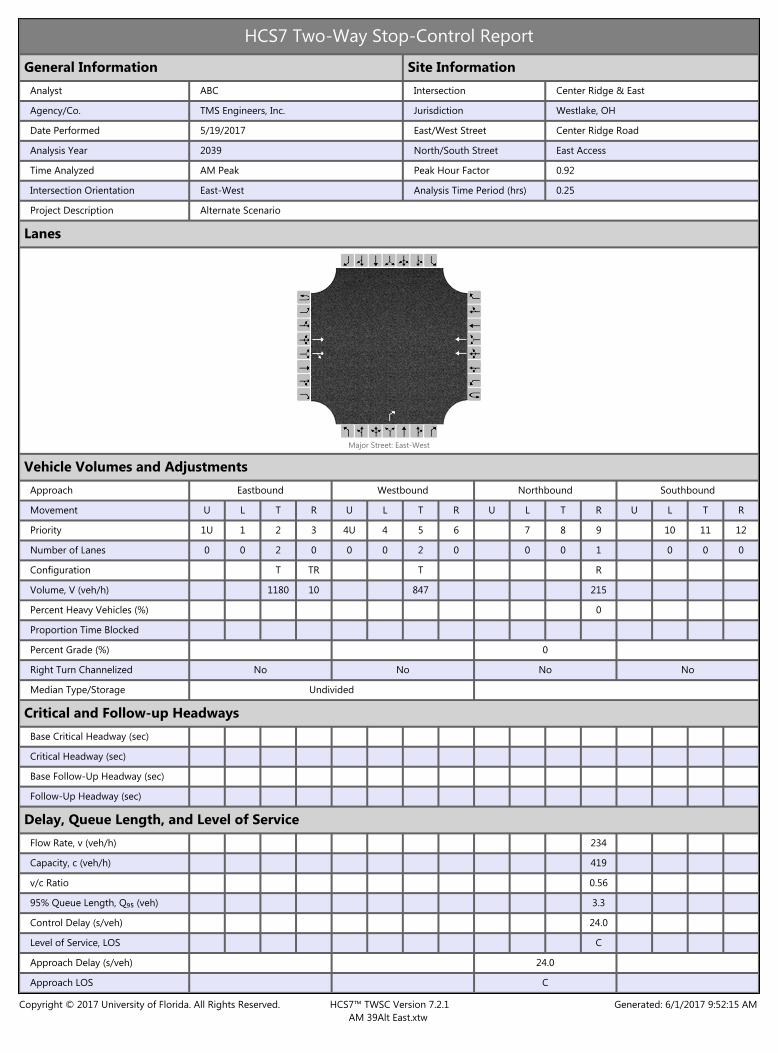

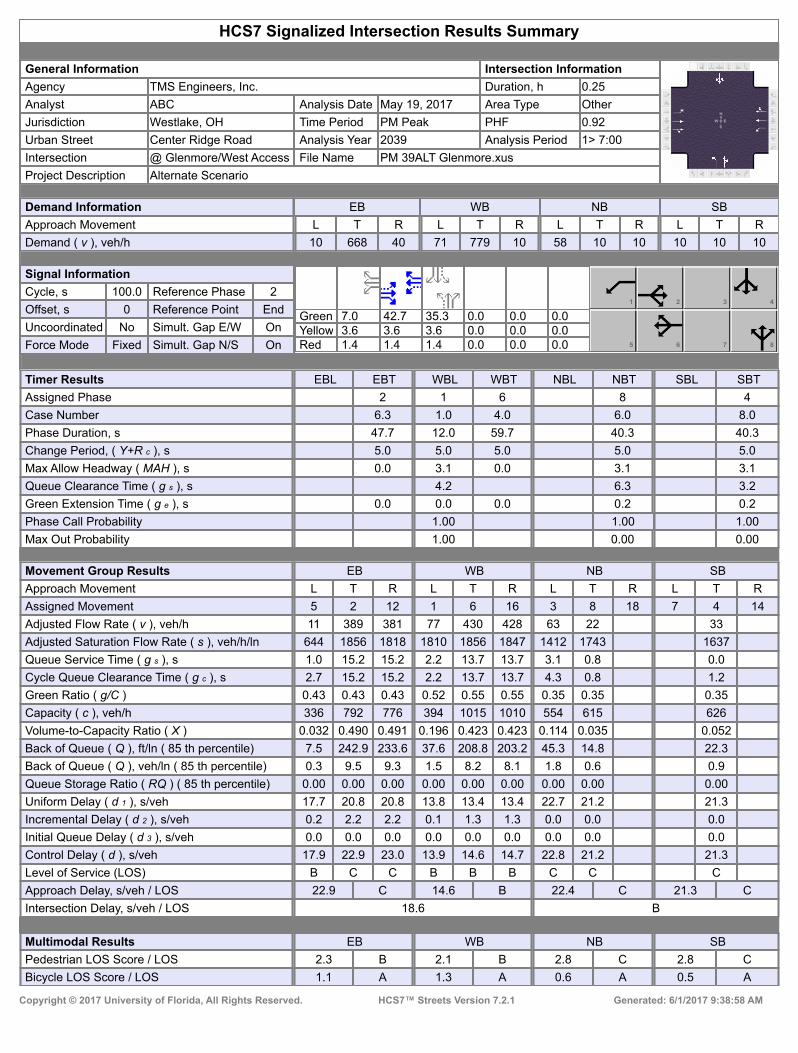


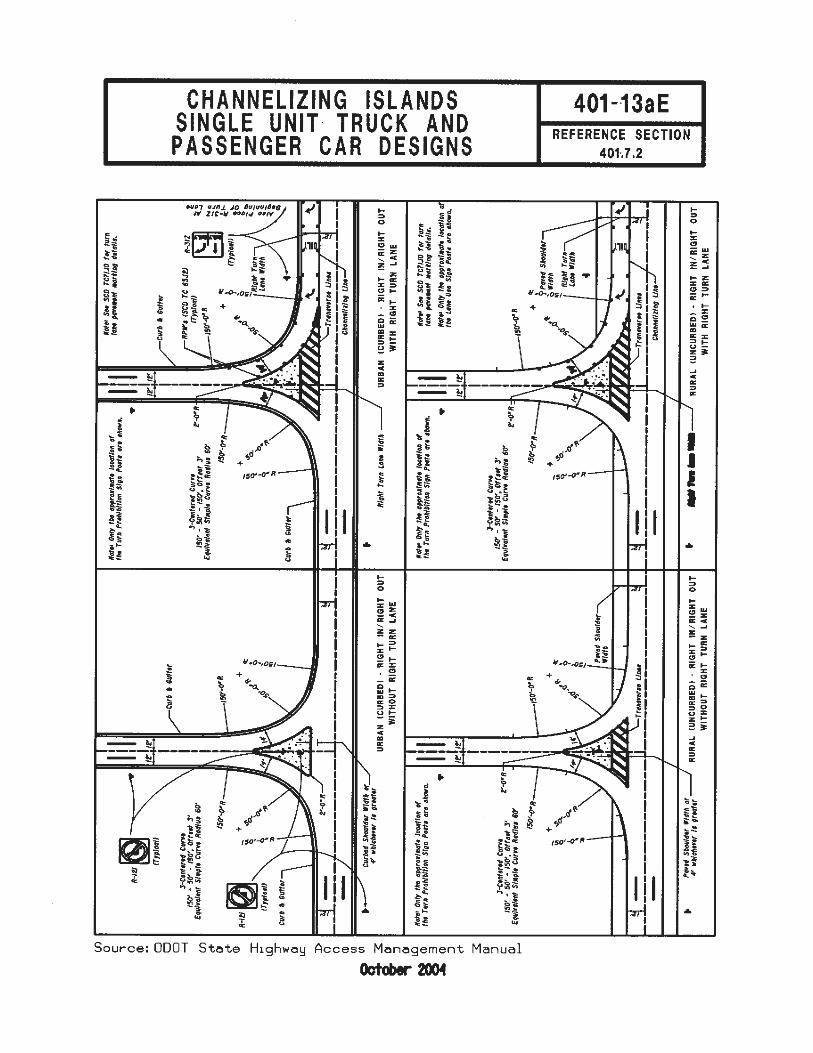
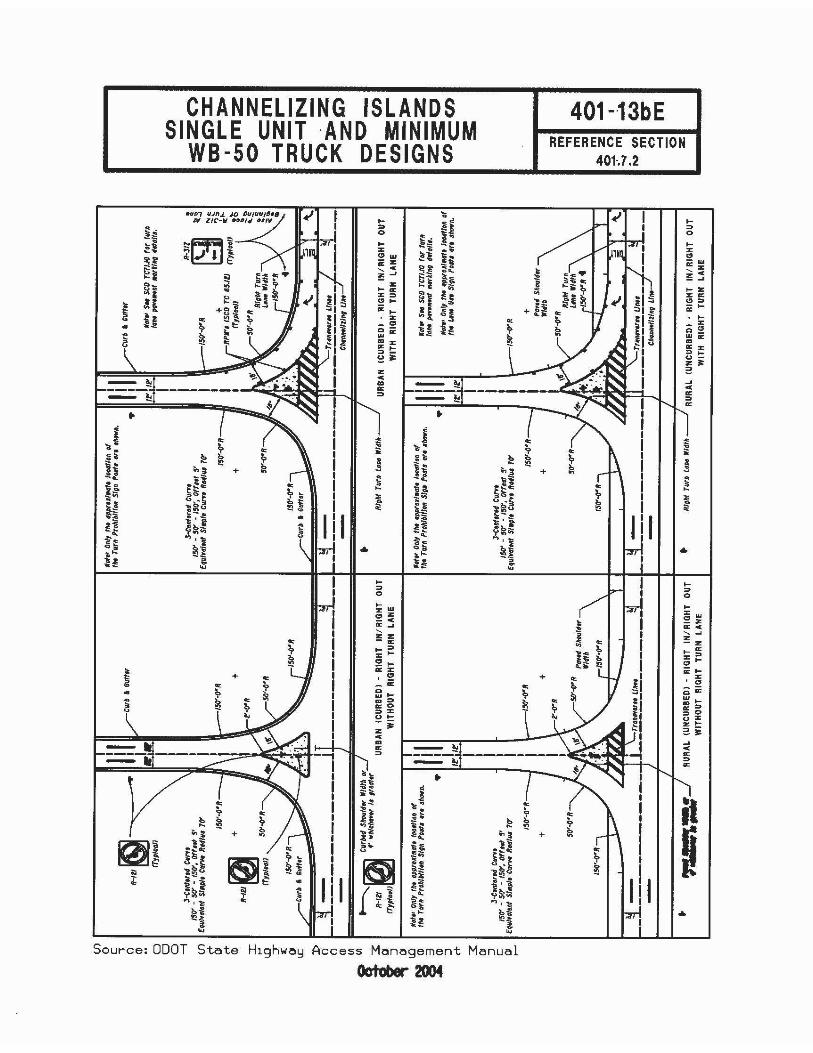

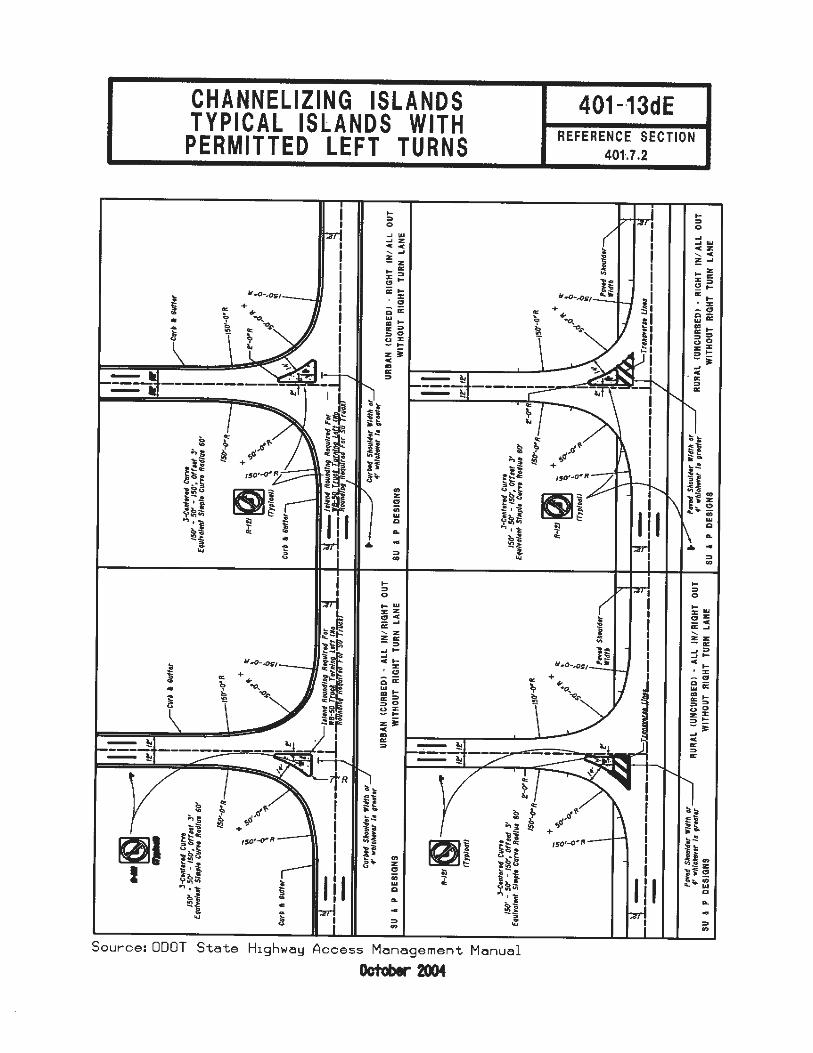


![2016 State of the City Presentation2.pptx.ppt [Read-Only] · State of the City 2016 City of Westlake, Ohio. City Mission Statement ... • The Goddard School - Expansion • Ground](https://static.documents.pub/doc/80x56/5f27cf37653207632d2b3ed3/2016-state-of-the-city-read-only-state-of-the-city-2016-city-of-westlake-ohio.jpg)


