TRAFFIC NOISE DECREASES BODY CONDITION AND STOPOVER EFFICIENCY OF MIGRATING SONGBIRDS by Heidi Elise Ware A thesis submitted in partial fulfillment of the requirements for the degree of Master of Science in Biology Boise State University December 2014
Thesis Title: Traffic Noise Decreases Body Condition and Stopover Efficiency of Migrating Songbirds Date of Final Oral Examination: 12 November 2014 The following individuals read and discussed the thesis submitted by student Heidi Elise Ware, and they evaluated her presentation and response to questions during the final oral examination. They found that the student passed the final oral examination. Jesse R. Barber, Ph.D. Chair, Supervisory Committee Jennifer Forbey, Ph.D. Member, Supervisory Committee Julie Heath, Ph.D. Member, Supervisory Committee
The final reading approval of the thesis was granted by Jesse R. Barber, Ph.D., Chair of the Supervisory Committee. The thesis was approved for the Graduate College by John R. Pelton, Ph.D., Dean of the Graduate College.
ACKNOWLEDGEMENTS
I thank Kurt Fristrup for input on study design. Thanks to Dr. Jennifer Forbey, Dr.
Clint Francis, and Dr. Julie Heath for providing comments on this manuscript. Krista
Muller of the IDFG Boise River WMA provided support and access to our study site. We
thank Brian Leavell, Dan Mennitt, Tate Mason, David Anderson, Alexis Billings, Jarrod
Zacher, Adam Keener, and Randy Nuxoll. Special thanks to the Intermountain Bird
Observatory—especially Elizeth Cinto Mejía and Mitchell Levenhagen, Andrea Ball,
Luke Eberhart-Phillips, Michael Fuss, Callie Gesmundo, Greg Kaltenecker, Lindsey
Introduction to the Field Experiment ............................................................................ 4
Introduction to the Laboratory Experiment .................................................................. 5
Traffic Noise Decreases Body Condition and Stopover Efficiency of Migrating Songbirds ...................................................................................................................... 7
Supplementary Materials and Methods ...................................................................... 22
1. Field Experiment ......................................................................................... 22
As the prevalence and intensity of anthropogenic noise has increased globally, the
scientific community has shown concern regarding if and how changes to the sensory
environment might impact organisms and ecosystems (Barber et al. 2011). There is now
substantial evidence that anthropogenic noise has detrimental impacts on a variety of
species (Barber et al. 2011; Siemers and Schaub 2010; Kight and Swaddle 2011; Francis
and Barber 2013). Early work has shown significant negative effects of roads on songbird
density and nesting success, and correlations between observed impacts and traffic noise
(e.g., Mockford and Marshall 2009; Goodwin and Shriver 2010; Crino et al. 2011;
Halfwerk et al. 2011a). Work with oil and gas development has demonstrated that gas
compressor station noise alone impacts songbird breeding distribution and community
species richness (Habib et al. 2007; Bayne et al. 2008; Francis et al. 2009). Though never
tested with road noise specifically, artificial, white noise is known to alter songbird
foraging and vigilance, highlighting these behaviors as a productive target for research in
the context of road ecology (Quinn et al. 2006).
Foraging behavior is an important part of the life history of all animals because it
has direct tradeoffs with vigilance behavior—and therefore survival—especially for prey
species (Gavin and Komers 2006). In particular, foraging and vigilance play an important
role for songbirds during migration when energy demands are high and birds are in
2
communities with unknown predator densities (Schmidt et al. 2010). Migrating birds
travel long distances during nocturnal flights, fueled by fat reserves (Berthold 1996). In
order to replenish these reserves, birds must rest and regain fat stores; this is known as
“stopover” (Berthold 1996). During this time, birds undergo hyperphagy, when they must
increase foraging to put on fat. This rise in food intake is necessary to meet amplified
energy needs during migration (Hedenstrom 2008).
Not only are energy demands high during migratory flight, but migration has also
been shown to account for more than 85% of all mortality in some songbird species
(Sillett and Holmes 2002). Therefore, understanding what factors might increase risk of
mortality during migration—and whether human influence is changing these dynamics—
is important for conservation. Migrating birds are in decline across the world (Robbins et
al. 1989; Sanderson et al. 2006), and as stopover habitat is lost or becomes increasingly
human-altered, migrants will face even greater obstacles (Carlisle et al. 2009). Because
mortality during migration is so high, and birds are facing one of the most energetically
challenging task in their lives, it is critical that we consider migration and stopover as we
work to preserve these species. Although many studies have investigated some aspect of
birds and roads (Fahrig and Rytwinski 2009; Benítez-López et al. 2010; Reijnen and
Foppen 2006; Halfwerk et al. 2011a; Goodwin and Shriver 2010), no study has yet
investigated the effects of noise alone on birds during migration. Most studies have also
focused only on distributional changes (e.g., Summers et al. 2011, but see Crino et al.
2011 and Halfwerk et al. 2011a), leaving the consequences for individuals that stayed
behind in noise exposed areas open to study.
3
Historical noise research has provided a base of knowledge on the impacts of
noise on songbirds, but much remains to be discovered relating to birds and
anthropogenic noise pollution. While Quinn and colleagues (2006) clearly demonstrated
an impact of white noise on foraging and vigilance, white noise has sound energy equally
distributed across frequency and does not occur in nature. The influence of anthropogenic
noise (which has energy concentrated primarily below 2 kHz) on the foraging and
vigilance behavior of songbirds has yet to be studied (see Schmidt et al. 2010).
Additionally, previous research has focused primarily on the effects of roads on breeding
birds. These studies hypothesized that noise was a causal mechanism underlying their
findings, but did not experimentally parse traffic noise from other influential factors such
as increased predator density (i.e., edge effects), pollution, or lighting near roads (Forman
& Deblinger 2000; Pescador & Peris 2004). In addition, the impacts of noise on
migratory songbirds have never been investigated. To test this, we created a “Phantom
Road,” testing the impacts of road noise apart from other aspects of actual roads by
playing road noise in a roadless area.
This Phantom Road project was a two-year, large-scale field study accomplished
through the efforts of my co-authors Dr. McClure, Dr. Carlisle, Dr. Barber, and myself,
along with many field technicians. Thanks to cooperation and shared technicians from the
Intermountain Bird Observatory (formerly Idaho Bird Observatory) we established two
field stations: one at our control site and one at our phantom road site. Because of the
difficulty of implementing a study of this magnitude and the unlikelihood that a study of
this scale would be replicated, both Dr. McClure (a Postdoctoral Research Associate at
the time in the Barber Lab) and I conducted concurrent, complementary and collaborative
4
studies at the site during fall migration. Based on Dr. Chris McClure’s work at the site,
the Phantom Road project has already seen one publication, in the Proceedings of the
Royal Society Series B (see McClure et al. 2013). Dr. McClure conducted point count
surveys at the site, studying the impacts of the phantom road on bird distributions.
Through this research and analysis, we discovered a one-quarter decline in bird numbers
at the site overall and found that 13 of the species studied left the site while the noise was
broadcast. Our first manuscript focused on what species were temporally expatriated
from the site due to noise exposure. Here, I concentrate on the other side of the picture,
bringing into focus the effects on birds that stayed behind in elevated background sound
levels.
Introduction to the Field Experiment
When examining the value of stopover habitat to migrants, an important
consideration is the amount of mass migrants are able to gain at a site (Carlisle et al.
2005). Migrants in stopover habitat with high quality habitat will gain mass faster than
those in poor quality habitat (Dunn 2001). Traditionally, capturing birds in mist nets has
provided the most common avenue for studying this gain. Comparison of a bird’s mass at
multiple captures is a traditional method used to measure migrant mass gain. In this
setup, a bird is weighed and banded when it is first captured at a site. If the bird is caught
again and weighed at a later date in the same season, its mass change may be calculated.
While this method is able to detect mass gain in migrants, there are confounds that have
caused its reliability to be questioned (Winker et al. 1992). For example, because not all
birds are equally likely to be recaptured, mass gain data may be representative of only a
segment of the migrant population (Winker et al. 1992). Additionally, sick or otherwise
5
injured birds may remain at a site longer than normal, thus increasing their probability of
recapture and skewing recapture mass change calculations to be lower than reality for a
given population (Winker et al. 1992).
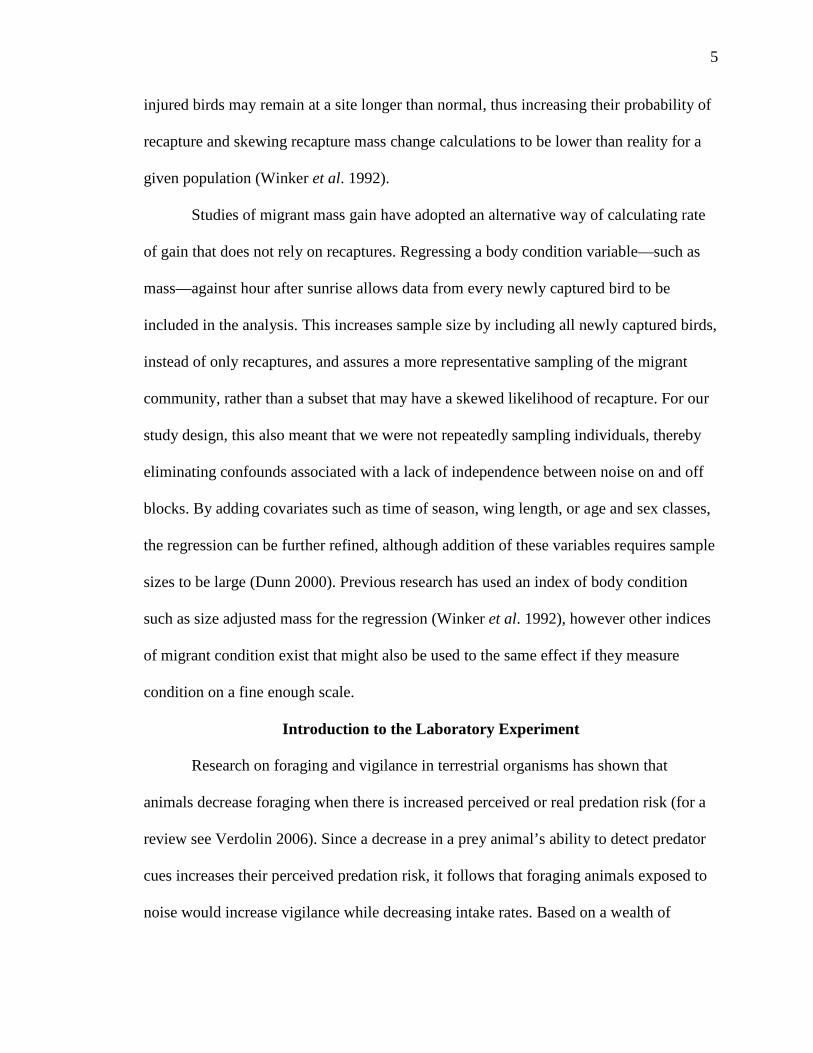
Studies of migrant mass gain have adopted an alternative way of calculating rate
of gain that does not rely on recaptures. Regressing a body condition variable—such as
mass—against hour after sunrise allows data from every newly captured bird to be
included in the analysis. This increases sample size by including all newly captured birds,
instead of only recaptures, and assures a more representative sampling of the migrant
community, rather than a subset that may have a skewed likelihood of recapture. For our
study design, this also meant that we were not repeatedly sampling individuals, thereby
eliminating confounds associated with a lack of independence between noise on and off
blocks. By adding covariates such as time of season, wing length, or age and sex classes,
the regression can be further refined, although addition of these variables requires sample
sizes to be large (Dunn 2000). Previous research has used an index of body condition
such as size adjusted mass for the regression (Winker et al. 1992), however other indices
of migrant condition exist that might also be used to the same effect if they measure
condition on a fine enough scale.
Introduction to the Laboratory Experiment
Research on foraging and vigilance in terrestrial organisms has shown that
animals decrease foraging when there is increased perceived or real predation risk (for a
review see Verdolin 2006). Since a decrease in a prey animal’s ability to detect predator
cues increases their perceived predation risk, it follows that foraging animals exposed to
noise would increase vigilance while decreasing intake rates. Based on a wealth of
6
previous research on the impacts of altering the foraging-vigilance tradeoff, we
determined that one likely avenue for reduced migrant stopover efficiency may be
explained by a change in the foraging-vigilance tradeoff. During migration, bird time
budgets are largely constrained to resting, foraging, and vigilance (Hedenstrom 2008),
therefore a change in vigilance will result either in a reduction in foraging (and
consequent changes in body condition), greatly increased energy expenditure, or missed
opportunity costs (Verdolin 2006).
The foraging-vigilance tradeoff has been investigated in birds: specifically,
foraging granivorous birds (Chaffinch, Fringilla coelebs) were found to decrease their
foraging rates and increase vigilance when exposed to white noise (Quinn et al. 2006). It
is thought that when a bird is foraging, it uses two types of vigilance: when its head is up,
it uses visual vigilance; when its head is down and visual vigilance is decreased, a bird
may use auditory vigilance instead (Quinn et al. 2006). However, when background noise
is increased to a level at which a bird is no longer able to use auditory vigilance, it must
adjust by increasing the amount of time spent being visually vigilant. Chaffinches
exposed to white noise increased their visual vigilance to compensate for loss of auditory
vigilance by raising their head more often (Quinn et al. 2006). As a result of their
increased visual vigilance, Chaffinch seed intake rates decreased. Although white noise,
which has a broad range of frequencies, does not occur in nature, this test demonstrated a
useful principle that forms a foundation for further sensory ecology research. Here, I
expand upon the principles demonstrated by Quinn et al. by exposing a granivorous
species to road noise treatments at 55 and 61 dB(A). Playing road noise at two different
levels allowed us to test whether sparrows showed a gradient response based on dB level,
7
versus a simple response to noise on/off. By testing another granivorous bird, the White-
crowned Sparrow, in the presence of road noise, we can make useful conclusions about
the effects of traffic noise on the foraging-vigilance tradeoff of birds exposed to roads.
Foraging during migration is critical to songbirds since they need to gain large
amounts of fat stores during a short stopover period. Inability to gain mass quickly could
result in a longer stopover duration and delayed migration. Studying the impacts of road
noise on mass gain of an entire migrant community may also reveal varying impacts on
different species, taxa, or foraging guilds, giving insight into community-wide impacts by
road noise.
Traffic Noise Decreases Body Condition and Stopover Efficiency
of Migrating Songbirds
To be submitted to Science
We have known for decades that human infrastructure shapes animal
distributions, communities, and behaviors (Fahrig and Rytwinski 2009; Benítez-López et
al. 2010 ). A meta-analysis of 49 datasets across four continents found that bird and
mammal populations decline within 1 and 5 km of human infrastructure, respectively,
including roads (Benítez-López et al. 2010). Observational studies of birds near actual
roads implicate traffic noise as one of the main factors causing these declines (Francis
and Barber 2013). However, without altering noise levels experimentally, previous
research could not eliminate aspects such as visual disturbance, collisions, chemical
pollution, and edge effects as possible causes (Francis and Barber 2013). Road ecology
research has also shown strong negative correlations between traffic noise levels and
songbird reproduction (e.g., Reijnen and Foppen 2006; Halfwerk et al. 2011a).
8
Furthermore, birds with song frequencies masked by traffic noise are the species most
affected by roads (Goodwin and Shriver 2010). In addition to correlational road studies,
‘natural experiments’ in gas extraction fields have shown that noisy compressor stations
alter nest success and reduce species richness compared to quieter well pad areas (Bayne
et al. 2008; Francis et al. 2009); these studies offer the best support to date that
anthropogenic noise alone can drive ecological changes. In these and other investigations
that have implicated noise as a causal factor in population declines, many individuals
remain, but at what cost? Here we parse the independent role of traffic noise
experimentally, by playing traffic sounds back through an array of speakers in a roadless
area during songbird autumn migration, creating a ‘phantom road.’ We focus on the sub-
set of individuals that remained despite the noise, allowing us to investigate the
physiological costs of noise exposure.
Proposed causes of decreased fitness for birds in traffic noise include song
masking, interference with mate evaluation, non-random distribution of territorial
individuals, disruption of parent-chick communication, reduced foraging opportunities,
and/or alterations in the foraging/vigilance trade-off (Halfwerk et al. 2011a; Francis and
Barber 2013). During the breeding season, all of these hypotheses are possible, but during
migration time budgets are streamlined. Foraging, vigilance, and rest dominate activity
(Hedenstrom 2008). Here we focus on migrating birds, allowing us to concentrate our
work on foraging and anti-predator behavior while largely excluding other possible
mechanisms of road impacts.
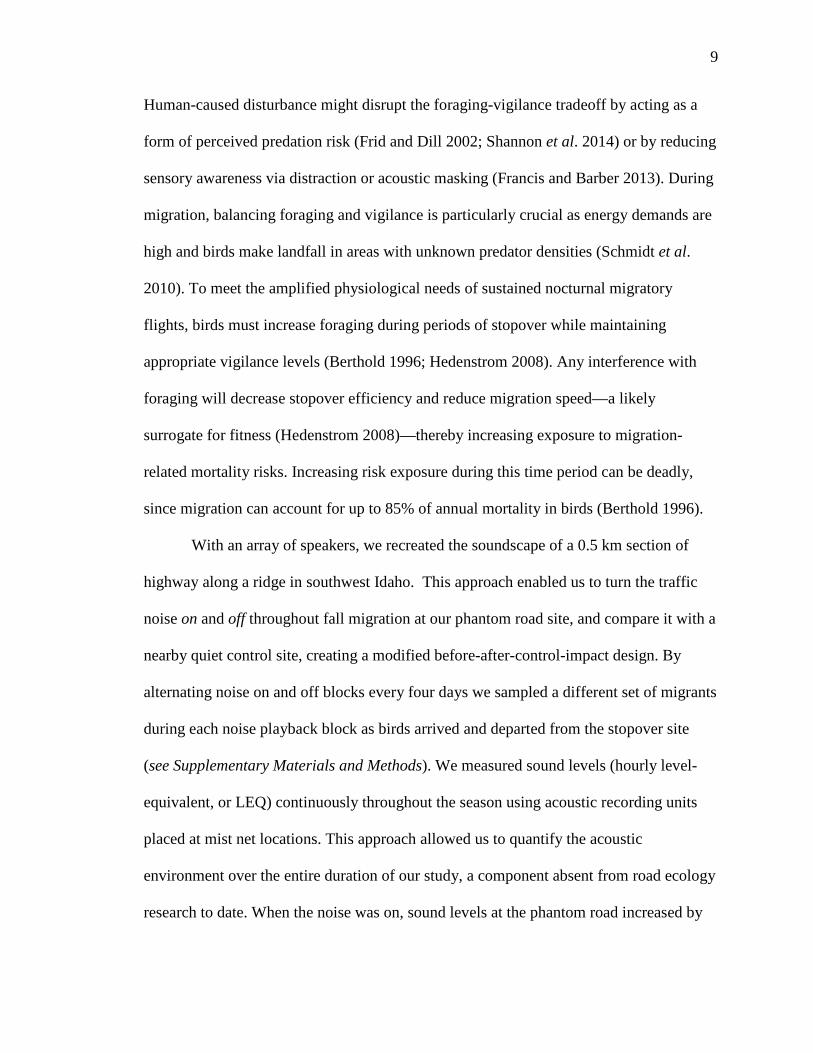
Balancing foraging and vigilance is important for all animals because this trade-
off has direct consequences for survival (Lima and Dill 1990; Purser and Radford 2011).
9
Human-caused disturbance might disrupt the foraging-vigilance tradeoff by acting as a
form of perceived predation risk (Frid and Dill 2002; Shannon et al. 2014) or by reducing
sensory awareness via distraction or acoustic masking (Francis and Barber 2013). During
migration, balancing foraging and vigilance is particularly crucial as energy demands are
high and birds make landfall in areas with unknown predator densities (Schmidt et al.
2010). To meet the amplified physiological needs of sustained nocturnal migratory
flights, birds must increase foraging during periods of stopover while maintaining
appropriate vigilance levels (Berthold 1996; Hedenstrom 2008). Any interference with
foraging will decrease stopover efficiency and reduce migration speed—a likely
surrogate for fitness (Hedenstrom 2008)—thereby increasing exposure to migration-
related mortality risks. Increasing risk exposure during this time period can be deadly,
since migration can account for up to 85% of annual mortality in birds (Berthold 1996).
With an array of speakers, we recreated the soundscape of a 0.5 km section of
highway along a ridge in southwest Idaho. This approach enabled us to turn the traffic
noise on and off throughout fall migration at our phantom road site, and compare it with a
nearby quiet control site, creating a modified before-after-control-impact design. By
alternating noise on and off blocks every four days we sampled a different set of migrants
during each noise playback block as birds arrived and departed from the stopover site
(see Supplementary Materials and Methods). We measured sound levels (hourly level-
equivalent, or LEQ) continuously throughout the season using acoustic recording units
placed at mist net locations. This approach allowed us to quantify the acoustic
environment over the entire duration of our study, a component absent from road ecology
research to date. When the noise was on, sound levels at the phantom road increased by
10
11 dB(A) to an average of 48 (s.e.=0.26) dB(A), while the control site nets averaged 2
dB(A) louder when the noise was on (mean 41dB(A) +/- 0.17; Fig. 1). When the noise
was off, background sound levels at the mist nets averaged 39 (s.e.= 0.18) dB(A) at the
control site and 37 (s.e.=0.26) dB(A) on the phantom road. Using this study design, we
previously found over a one-quarter decline in songbird abundance during noise-on
periods at the experimental site (McClure et al. 2013). Here, we look beyond abundance
results, investigating the costs for birds that remain in noisy areas.
Figure 1 Background Sound Levels. Estimated background sound levels (dB(A) 1 h LEQ) during periods when speakers were turned on at our study site in the Boise Foothills in southwestern Idaho from early August through early October 2012 and 2013. Background sound level was modeled using NMSIM (Noise Model Simulation; Wyle Laboratories, Inc., Arlington, VA) where inputs were chosen to match observed values at Acoustic Recording Units (co-located with mist nets) while the phantom road noise was playing (McClure et al. 2013). Circles represent locations of control capture sites, and squares represent capture sites along the phantom road.
Using data collected from birds caught and banded at the control and phantom
road sites, we examined differences in body condition index (BCI) of newly captured
birds across a gradient of noise exposure. BCI is a size-adjusted metric of body mass
11
(calculated as mass/natural wing chord) measured in g/mm, so small changes in BCI
represent large differences in condition (Winker et al. 1992). In preparation for
migration, birds’ body condition increases as they add the energy stores needed for long
migratory flights (Berthold 1996). We also calculated stopover efficiency by regressing
BCI of new captures against time of day. This method measures migrants’ ability to
increase body condition in preparation for migratory flight—i.e. their stopover efficiency.
Comparing stopover efficiency between sites can give a good metric of the relative value
of habitat to migrants (Winker et al. 1992; see Supplementary Materials and Methods
1.3.2 on the exclusion of recaptures in analysis). In addition to our previous point count
work, we compared mist-net capture rate (birds caught/net/hr) across site (control vs
phantom road) and noise treatment (on vs off) to further investigate whether birds were
leaving or staying when exposed to phantom road noise (see Supplementary Materials
and Methods).
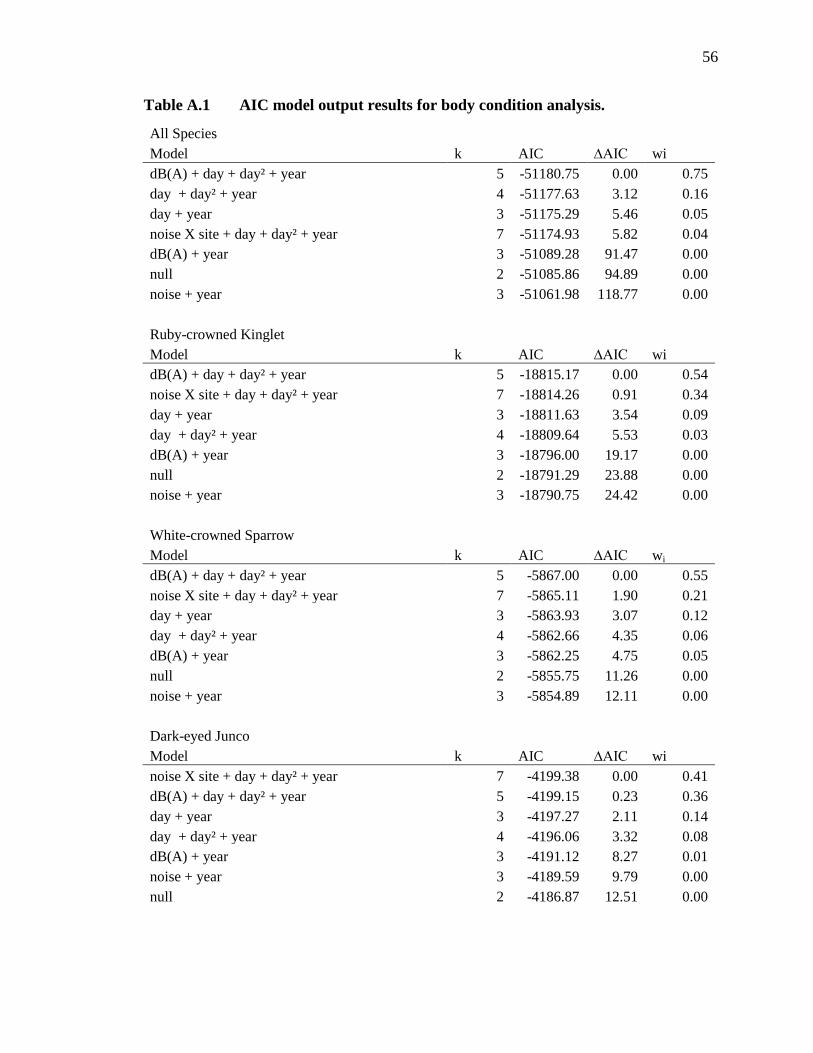
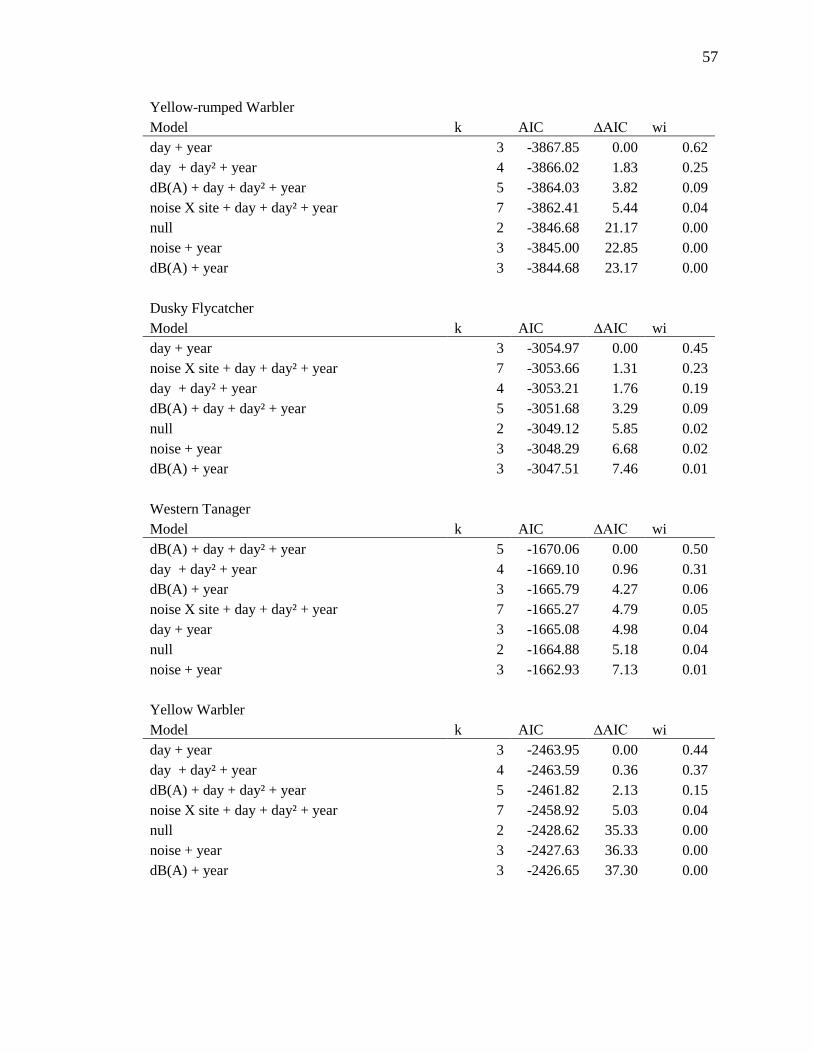
We used the same set of models (see Supplementary Materials and Methods and
Appendix A) to run three separate analyses for overall BCI, stopover efficiency, and
capture rate. For overall BCI, the global model including a continuous covariate for
dB(A) was the top model, showing that as the phantom road dB(A) increased, overall
BCI of birds remaining at the site decreased (β for dB(A)= -1.08e-04 ± 4.76e-05; Fig. 2).
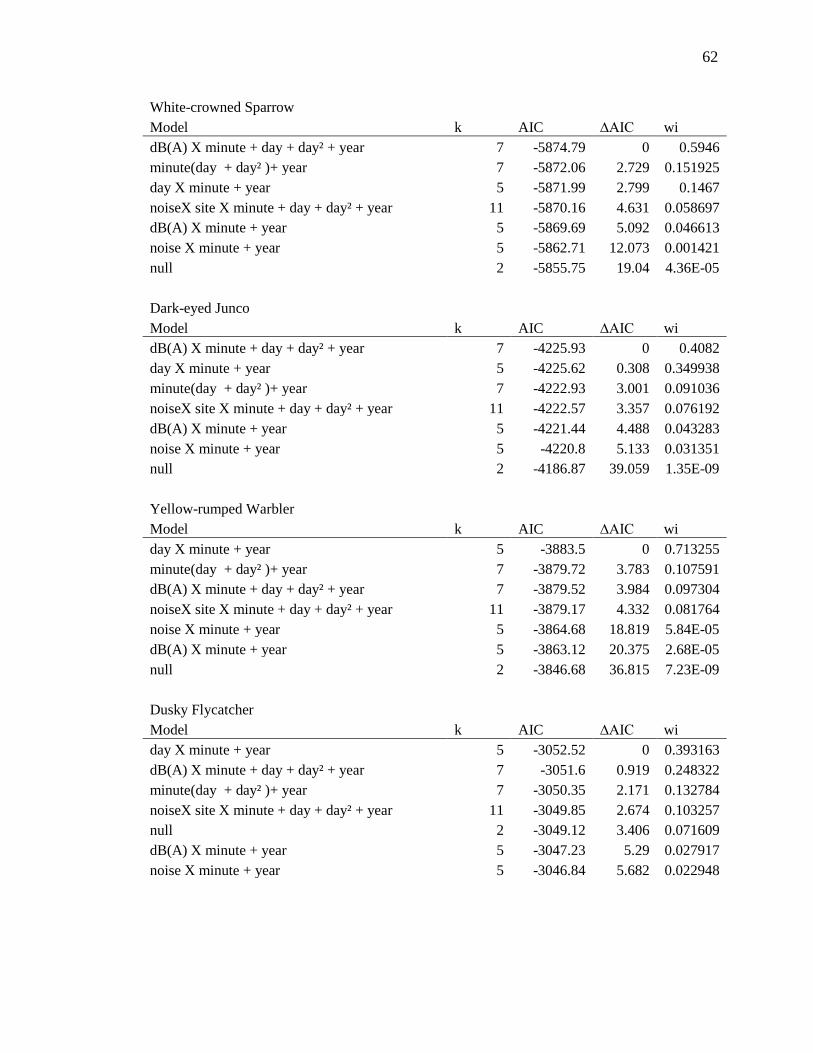
For stopover efficiency the top model was the global model, which included an
interaction between dB(A) x minute after sunrise. These model estimates show that
stopover efficiency of birds that stayed decreased when dB(A) levels increased—birds
gained condition nearly half as quickly when the phantom road was on (interaction β= -
6.76e-07 ± 4.48e-07; Fig. 3). BCI and stopover efficiency at the phantom road site when
12
the noise was off did not differ from the control site, indicating that the phantom road
was an otherwise suitable stopover location (Fig. 2 & 3; Tables A1 & A2). The top multi-
species model for capture rate was a global model including an interaction between noise
and site. Capture rate was significantly lower at the phantom road site when noise was
playing, indicating some birds left the phantom road when the noise turned on but
remained at the control site (interaction = -6.09e-03± 1.70e-03; Table A3).
Figure 2 Body Condition Index. Global Model estimate values of BCI vs. dB(A). Estimates are for all captures combined, with species as a random intercept.
13
Figure 3 Stopover Efficiency. Global Model estimate values of stopover efficiency for the control site when the road was off (dB(A) 42), control site with road on (dB(A) 43), phantom road with noise turned off (dB(A) 40), and the phantom road with the noise on (dB(A) 51). Birds gained condition at 46% of the normal rate when the phantom road was turned on.
In support of our field results, we conducted a controlled laboratory study to
investigate if traffic noise alters the foraging-vigilance tradeoff in songbirds and could
thus mechanistically underpin our field data (see Supplementary Materials and Methods).
We focused on the second most common species in our field study, white-crowned
sparrows (Zonotrichia leucophrys), to investigate the reduction in foraging and increase
in vigilance implied by our BCI data. We quantified head-down duration (i.e., foraging
rate) and head-up rate (i.e., vigilance) as these are known measures of avian visual
vigilance that change when auditory surveillance is limited, and correlate strongly with
food intake and ability to detect predator attacks (Quinn et al. 2006). Using the same
playback file that we used for the phantom road, we played 61 dB(A) and 55 dB(A)
14
traffic noise treatments, plus a silent control track (32B(A)) to foraging sparrows (n=20).
Following Quinn et al. (2006), we used video of 30-second foraging bouts to measure
foraging and vigilance behavior when birds were exposed to different levels of traffic
noise. White-crowned sparrows decreased foraging by ~8% and increased vigilance
levels by ~21% when exposed to traffic noise (61dB(A)): i.e., birds showed more head
lifts (β=0.005±0.002) and decreased the amount of time spent with their heads down
searching for seeds (β= -0.003±0.001; Fig 4) during noise playback compared to ambient
conditions. (Mean head up rate (head lifts/sec) for 61 dB(A)= 0.79±0.06, 55
dB(A)=0.77±0.05, 32 dB(A)=0.65±0.05. Mean head down duration (sec): 61
dB(A)=0.41±0.03, 55 dB(A)=0.44±0.04, 32 dB(A)=0.50±0.04.) Vigilance behavior of
individuals did not change based on the number of trials experienced, suggesting the
birds did not habituate to the noise (β=0.012 ± 0.031) (see Supplementary Materials and
Methods and Table A4). See supplementary materials and methods 2.4 for model
selection details.
Figure 4 White-crowned Sparrow Foraging and Vigilance. White-crowned sparrows foraging in traffic noise at 61 and 55 dB(A) had reduced foraging rates (a) and
15
increased vigilance (b) compared to foraging bouts in ambient conditions (32 dB(A)). Data are means ± standard error.
Previous work that has failed to find a change in animal distributions near roads
or other infrastructure has often assumed a lack of negative impacts from loud human
activities (see Francis and Barber 2013). Our results demonstrate that individuals may
remain in an area with high levels of noise yet suffer costs. Because both foraging and
vigilance behaviors are critical for survival, it is unlikely birds could compensate for a
reduction in foraging or vigilance rates without a detrimental alteration to either condition
or time budgets (Lima and Dill 1990). During energetically demanding periods in a bird’s
life, increasing vigilance has been shown to reduce survival because of increased
starvation risk (Watson et al. 2007). Birds could likely forage longer during the day to
compensate, however this could increase energy expenditure or reduce the amount of
time spent resting (Lima and Dill 1990). In contrast to song masking, which can be at
least partially overcome by frequency shifting (Mockford and Marshall 2009; Halfwerk
et al. 2011b), release from masking is not possible for the types of auditory cues
necessary for aural vigilance (Barber et al. 2011). With limited auditory information,
animals must resort to other methods such as visual scans to compensate for the increase
in perceived predation risk driven by masking of communication calls and predator-
generated sounds (Quinn et al. 2006; Gavin and Komers 2006). Migrants face greater
challenges compared to resident birds because they are exposed to an unknown risk
landscape at stopover sites and must therefore rely heavily on increased vigilance to
compensate (Thomson et al. 2006; Schmidt et al. 2010). For migrants, reduction in
condition or delay in migration could have carry-over effects into the overwintering or
breeding seasons (Harrison et al. 2010).
16
Our laboratory tests offer strong evidence that the body condition changes
measured in the field were due, at least in part, to a change in foraging and vigilance
behavior, but our field results could be due to a combination of factors. For example,
noise might also increase physiological stress levels (Blickley et al. 2012, but see Crino
et al. 2011) that could cause additional weight loss and add to the cost of remaining in
noisy areas. We showed that traffic noise directly influences foraging-vigilance behavior
in the lab. In addition to the interaction measured in the lab, in a natural setting noise may
indirectly change foraging rates through alteration of other behaviors such as prey search
time, sleep, or territoriality. For instance, the phantom road playback may have disrupted
foraging behavior by reducing the acoustic detectability of insect prey (Montgomerie and
Weatherhead 1995) or altering insect numbers. We did not test for changes in insect
abundance or distribution but because we found noise impacts on a mixed community of
both frugivorous and insectivorous birds (Table 1), altered insect numbers seem unlikely
to be contributing significantly to the patterns we observed. Effects were consistent
between the 4-day noise-on blocks throughout the season, so it is more likely that
changes in an aspect of bird behavior, rather than variation in habitat or food, drove these
immediate responses. Our experimental design was not able to rule out whether noise
disrupts territoriality or dominance hierarchies during stopover. However, because some
of the species that showed negative effects of noise (see Supplementary Materials and
Methods) are known to be non-territorial during migration (e.g., White-crowned Sparrow,
Ruby-crowned Kinglet; Poole 2005), it is unlikely that disruption of territoriality was the
main driver of our results. It is also possible that our stopover efficiency results were
driven by a change in species composition, rather than a change in body condition of
17
individuals, over the course of a day at our site. If birds with lower body condition were
leaving over the course of a morning, it is possible we would see the same change in the
relationship between community body condition and minute after sunrise as predicted by
a change in stopover efficiency. With further testing we might expect to find that noise
causes a combination of these direct and indirect effects on the time and energy budgets
of individuals that each contribute to the BCI and foraging changes we measured.
Because provisioning is a constant requirement throughout the year, other effects of noise
that occur outside of migration (e.g., Reijnen and Foppen 2006; Halfwerk et al. 2011a)
would be in addition to, rather than instead of, the impacts on foraging and BCI.
Because we turned the phantom road off overnight to match typical diel traffic
patterns, it is likely that nocturnal migrants chose to land at our site when it was quiet,
before the phantom road playbacks began in the morning. In effect, diurnally-varying
traffic noise might function as an ecological trap (Robertson and Hutto 2006) for
migrants. Though staying in traffic noise has a cost, the energetic outlay for individuals to
leave a site might be even higher. Birds with low body condition are less likely to embark
on migratory journeys than those in good condition, and may not have the ability to leave
once landed (Smith and McWilliams 2014). Average BCI was lower when the phantom
road was on; birds that stayed were in worse condition than the average migrant at our
site. If we had found reduced BCI combined with no change in capture rates, we might
infer that the reduced condition was due to slower weight gain in birds already present at
the site. However, we saw both reduced BCI and reduced bird numbers, suggesting that
birds with sufficient energetic stores chose to leave the site and escape the costs of
remaining in noise (Smith and McWilliams 2014). This decision to stay or leave is
18
critical for migrants during stopover. Notably, during nesting, birds have limited mobility
because nest desertion may have too high a cost (Székely et al. 1996), therefore birds
may not choose to leave during the breeding season as they would during migration.
Migratory songbirds are in decline worldwide, and habitat loss and degradation
have been identified as major contributing factors (Robbins et al. 1989; Sanderson et al.
2006). Recognizing traffic noise as another environmental attribute contributing to
habitat degradation might help explain the significant decrease in songbird numbers
globally. When our phantom road was turned on, the addition of traffic noise alone,
without the other variables associated with roadways, was enough to decrease the value
of a stopover site for migrants, effectively degrading habitat quality (Fig. 3). Songbird
stopover site protection is limited worldwide, and as key areas are identified, protection
from noise pollution and other forms of habitat degradation needs to be a priority
(Robbins et al. 1989; Sanderson et al. 2006).
Transportation noise continues to increase around the world and many protected
areas do not currently manage for anthropogenic noise pollution (Barber et al. 2011).
Fortunately, unlike many aspects of roads, noise impacts can be minimized without
removing the road itself. Altering the substrate or reducing speed limits on existing roads
can significantly lower decibel levels (Wayson 1998). We played the phantom road back
at levels similar to many suburban neighborhoods (55-60 dB(A); Wayson 1998). Many
protected areas and high-value habitats are already exposed to these levels, and would
likely benefit from noise relief measures (Lynch et al. 2011). While reducing noise is
nontrivial, we can collaborate with acoustical engineers to do so. Alternatively, in rare
habitats or areas where fragmentation is also a significant factor, road closures should be
19
considered, and efforts should be made on existing protected land to maintain roadless
areas wherever possible.
Our results reveal the need for attention to noise impacts beyond distributional
shifts (Francis and Barber 2013). For individuals that remain in areas disturbed by loud
human activities, noise pollution represents an invisible source of habitat loss that has
previously been ignored—traffic noise degrades habitat value but leaves no physical
signs of change. We found that noise interferes with migrant stopover efficiency. Further
understanding of this impact is key, since fuel stores are known to influence migrant
stopover behavior, speed, and success (Smith and McWilliams 2014). Unlike other
aspects of roads, the impact of noise reaches far beyond the physical footprint of human
infrastructure. For conservation efforts to be maximally effective, we must recognize
anthropogenic noise as another source of habitat degradation. When managing migratory
birds and other taxa facing habitat loss, we should ensure that the areas we protect are of
high quality, including the quality of the acoustic environment.
Table 1 Summary of songbird captures and model output results. Sample sizes of the 51 songbird species captured at the Phantom Road and control sites in southwestern Idaho during fall migration in 2012 and 2013. Twenty-one species had large enough sample sizes to allow for testing individually (those with n>100) and showed varying responses to traffic noise at the phantom road study site. Responses to increased noise are indicated as positive (+), negative (-), or no response (blank).
Species Latin name n BCI Stopover Efficiency Capture Rate
Species Latin name n BCI Stopover Efficiency Capture Rate
lazuli bunting Passerina amoena 48
golden-crowned kinglet Regulus satrapa 44
Brewer’s sparrow Spizella breweri 42
pine siskin Spinus pinus 37
“western” flycatcher species complex
Empidonax occidentalis/difficilis 29
fox sparrow Passerella iliaca 25
house wren Troglodytes aedon 22
western wood-pewee Contopus sordidulus 19
black-capped chickadee Poecile atricapillus 18
golden-crowned sparrow Zonotrichia atricapilla 11
brown creeper Certhia americana 6
gray flycatcher Empidonax wrightii 6
cedar waxwing Bombycilla cedrorum 4
willow flycatcher Empidonax traillii 4
Bullock’s oriole Icterus bullockii 3
least flycatcher Empidonax minimus 3
Lincoln’s sparrow Melospiza linconii 3
American redstart Setophaga ruticilla 2
song sparrow Melospiza melodia 2
vesper sparrow Pooecetes gramineus 2
Cape May warbler Setophaga tigrina 1
evening grosbeak Coccothraustes vespertinus 1
pacific wren Troglodytes pacificus 1
22
Species Latin name n BCI Stopover Efficiency Capture Rate
rose-breasted grosbeak Pheucticus ludovicianus 1
savannah sparrow Passerculus sandwichensis 1
Steller’s jay Cyanocitta stelleri 1
Supplementary Materials and Methods
1. Field Experiment
1.1 Study site and data collection
We conducted our study at two adjacent sites in southwestern Idaho, USA
(43°36’N, 116°05’W) during the 2012 and 2013 fall bird migration seasons. Both study
sites are located on the Idaho Fish and Game’s Boise River Wildlife Management Area
along the southernmost edge of the Boise Foothills (Figure 1). Our control site was
located on Lucky Peak and is the banding site for the Intermountain Bird Observatory’s
long-term fall migration study; it has operated for the last 17 years. The second site was
newly pioneered in 2012 for the purpose of this experimental study and is located 0.95
km east of Lucky Peak. Both the experimental and control sites are characterized by a
habitat mosaic of (i) mountain shrubland: dominated by bittercherry (P. emarginata) with
a mix of other shrubs including chokecherry (Prunus virginiana) and Scouler’s willow
(Salix scouleriana), (ii) conifer forest: dominated by Douglas-fir (Pseudotsuga menziesii)
with a mountain ninebark (Physocarpus malvaceus) understory, and (iii) shrub steppe:
consisting of mountain big sagebrush (Artemisia tridentata vaseyana), bitterbrush
(Purshia tridentata), and rabbitbrush (Chrysothamnus sp.) with a grassy understory (see
23
Carlisle et al. 2004 for more in-depth site information). Both sites are on the south-facing
slope of the ridge (Fig. 1).
Birds were netted at both sites between 19 Aug-9 Oct in 2012, and 2 Aug-8 Oct in
2013. We captured birds using Ecotone brand mist nets (12 x 2.6 m, 32-mm mesh) placed
in the mountain shrubland habitat on the southern slope in locations that would maximize
capture rates (Ralph et al. 1993). The control site at Lucky Peak had 10 nets, while the
phantom road site had 6. We placed nets so that habitat and shrub height were similar
between sites and net locations remained the same between years. We began netting at
sunrise and continued for 5 hours, except occasions with heavy precipitation or high
winds. Sunrise ranged from 0620 at the start of the season to 0800. We cleared nets on
20-30 minute intervals, depending on weather. Because of data collection activities for a
concurrent trial study at the phantom road site, we only operated nets on the first, second,
and fourth days of every four-day interval, and netted every day at the control site.
Once captured, we returned birds to the banding station where they were fitted
with standard, individually numbered aluminum USGS leg bands. We identified each
bird to species, and aged and sexed individuals based on Pyle (1997). We recorded the
date and time of capture to the nearest 10 minutes and collected additional data on each
bird following the standard protocol of the Intermountain Bird Observatory’s long-term
study (Carlisle et al. 2005). We also recorded the mass in grams, and unflattened wing
chord of each bird to the nearest millimeter.
1.2 Phantom Road
At the phantom road site, we placed 30 paired speakers in Douglas-fir trees at a
height of 4 meters from the crest of the ridge, at the interface between forest and
24
mountain shrubland habitat. We amplified the speakers (Dayton Audio—Springboro,
OH, USA—RPH16 Round 16’ PA Horns paired with MCM Electronics—Centerville,
OH, USA—40 W midrange compression drivers (+5 dB(A), 400–3000 Hz)) with Parts
Express (Springboro, OH, USA) 2 W x 2channel, 4-ohm, Class D amplifiers and played
back sound files (MP3, 128 kbps) using Olympus (Center Valley, PA, USA) LS-7 and
Roland (Los Angeles, CA, USA) R-05 audio players. We powered amplifiers and audio
players with arrays of LiFePO4 (Batteryspace, CA, USA) batteries housed in waterproof
plastic containers. One speaker of each pair pointed north into the conifer forest while the
other faced south into the mountain shrubland. We spaced the speaker pairs at
approximately 30m intervals along the ridge in order to create a “line source” of sound
that replicated an actual highway. The geometry of a sound source can have profound
impacts on the scale of noise exposure. Point sources (e.g., generators, gas-compressor
stations, a single car) lose sound energy at approximately 6 dB per doubling of distances,
whereas line sources (e.g., a busy roadway, train) fall off at approximately 3 dB per
doubling of distance.
We played traffic noise recorded within Glacier National Park. To create the
playback file, we combined files of 12 individual cars recorded at known distances,
decibel levels and speeds. We chose car pass-by events based on clarity of recording,
decibel level, and speed. We created a 1 min file of 12 car pass-by events and repeated
this file without shuffling. Because any possible habituation would have only reduced our
ability to detect changes, we see this as a minor concern. Our playback file therefore
contained 720 pass-by events per hour of cars traveling at approximately 45 miles per
hour—traffic levels and speeds found along roads in some of the most visited protected
25
areas globally. Our playback file further simulated the frequency profile of typical traffic
noise with most of the energy of the noise between 0 and 3 kHz with a peak around 1
kHz (See Figure 1B in McClure et al. 2013).
We set the speaker levels so that the 1 minute LEQ reading was ~55dB(A) (±3dB)
at 50m from the phantom road. LEQ values are the level of a constant sound over
specified time period that has the same energy of the actual, fluctuating energy over that
same time period (Barber et al. 2011). We played MP3 files of traffic noise in four-day
blocks, alternating with four days without noise playback. During noise-on days, noise
played from 0430 until 2100 local time, with a 30min fade-on and fade-off period to
approximate typical traffic flow patterns and to avoid startling birds. During noise
playback, noise levels were 11 dB(A) higher at the phantom road site and 1 dB(A) higher
at the control site. The nearest drivable dirt road was 750m from the phantom road site,
and the nearest paved road was 4km away. The drivable path near our site was a gated,
dead end road used to provide access to the study site for the research team.
We chose 4-day long noise-on and noise-off blocks because almost all species
that use our site during autumn stopover remain for fewer than 8 days on average
(Carlisle et al. 2005). Thus, each noise-on/noise-off block was likely independent as
individuals left during the course of a block—no individual bird was likely to be present
for more than one noise-on or noise-off period.
To measure dB(A) at our site, we used 6744 hours of recordings from 8 acoustic
recording units that ran simultaneously during the 2012 and 2013 fall migration seasons.
This amount of continuous recording is, to date, the most thorough quantification of the
acoustic environment to be undertaken in road ecology research. Using a custom program
26
(Damon Joyce, NPS, AUDIO2NVSPL), we converted the MP3 recordings into an hourly
sound pressure level format. We then converted those values to hourly LEQ values in
dB(A) using another custom program (Damon Joyce, NPS, Acoustic Monitoring
Toolbox). We averaged the hourly background LEQ during noise-on hours (05.00
through to 21.00) across the noise-on and noise-off blocks, creating separate noise-on and
noise-off LEQs.
We chose to use the hours of 5.00 through 21.00 for two reasons: 1) because we
only played traffic noise during those hours, and our goal was to measure the differences
between sites during noise-on and noise-off blocks, and 2) the design of the wind screens
used to protect the recorders provided shelter for nocturnal tree crickets. During night
hours, tree crickets sang from perches on top of our MP3 recording units, creating LEQs
of over 90 dB(A). Therefore, our nighttime recordings did not accurately represent the
actual background sound levels of our site and could not be used for analysis.
All birds caught during this project were mist netted and banded under the
Intermountain Bird Observatory’s federal permit (# 22929) and Idaho Department of Fish
and Game permit # 764-13-000039, and all experiments were approved by Boise State
University IACUC (# 006-AC12-007).
1.3 Analysis
We used data from 51 bird species (9,924 individuals) to build three sets of
models for 1) BCI, 2) stopover efficiency, and 3) capture rate, including combinations of
variables for dB(A), minute after sunrise, noise, site, and linear and quadratic effects of
day, plus random intercepts for year. We also built intercept-only models, and global
models that included all factors. For all three model sets, we ran competing models using
27
noise as either a continuous variable (dB(A)) or a binary (on/off) variable (noise*site
interaction models). We compared these noise models because they represent two
separate hypotheses. Models including dB(A) test the hypothesis that birds show a
functional response to noise and respond in a gradient to increasing noise intensity.
Models using an interaction term of noise*site test the hypothesis that the presence of
noise at the phantom road site, regardless of intensity, determines the response. In other
words, these competing models were used to determine whether birds were responding to
noise on a fine or coarse scale. We ranked and compared the models using Akaike’s
Information Criterion (Akaike 1974, Tables A1-A3). We considered covariates to be
useful for inference if their 85% confidence intervals excluded zero. We used 85%
confidence intervals instead of the traditional 95% because they are more appropriate
when selecting models using AIC (Arnold 2010). We used species and the nearest
acoustic recording unit as random variables. It was important to use the nearest recording
unit as a random variable because some mist nets in our study were paired, and therefore
shared one recording unit. For this study, we were interested in the avian community as a
whole, and focus our analyses at that level, but see supplementary materials and methods
3.1-3.2 for details on individual species (those with n>100; Tables 1, A1-A3).
1.3.1 Body Condition Index.
We used Body condition Index (hereafter “BCI”: calculated as the birds’
mass/wing chord) of newly captured birds as a proxy for the energetic condition of
migrants at our site. BCI and fat scores were highly correlated in the migrating songbird
community we studied, however fat scores were measured on a much coarser, categorical
scale. Running the same models for fat (measured on a 5 point scale) showed identical
28
trends compared to our BCI models, however the parameter confidence intervals
overlapped zero, likely based on the broad variation of fat stores characterized by each fat
score value. Therefore, we used BCI for our model analysis as it offered a finer index of
migrant condition. Additionally, while fat makes up the most substantial proportion of
energy stores used by migrants during nocturnal flights, protein and hydration levels also
play a role in determining a bird’s migration flight potential (Klaassen et al. 2012).
Therefore, body condition is a useful measure that incorporates condition indices such as
fat and muscle that are easily quantified through external observations, as well as less-
visible accumulations of protein. Increased mass during migration has potential to be
detrimental at high levels, however evidence shows that carrying fuel loads is likely
cheaper than previously predicted so that maximum flight range is not necessarily
lowered by normal levels of fat storage (Kvist et al. 2001). In trans-saharan migrants
crossing an ecological barrier, sedge warblers (Acrocephalus schoenobaenus) were found
to have a reduced ability to evade predators at extreme fat loads (>60% lean body mass)
(Kullberg et al. 2000). In species not facing an ecological barrier, such as the community
we studied at Lucky Peak, a bird’s risk of predation has not been found to increase within
normal body mass ranges (van der Veen 1999). In fact, Dierschke (2003) found that
lighter birds are more likely to be captured by predators than heavier individuals. For the
purposes of our analyses and interpretation, we assume that birds in our study were not
carrying above-optimal fat stores, since birds at our site do not accumulate fat scores of
such magnitude, and migrant passerines are known to adaptively regulate their fat stores
to balance the risks between starvation and predation (McNamara and Houston 1990;
Witter and Cuthill 1993).
29
1.3.2 Stopover Efficiency.
We calculated the stopover efficiency of species at our site using multiple
regression. By regressing the body condition index of each newly captured bird against
capture time (calculated as minute after sunrise), we quantified migrants’ ability to gain
body condition throughout the day, i.e. their stopover efficiency (Winker et al. 1992;
Dunn 2001; Carlisle et al. 2005; Bonter et al. 2007). In our study design, the noise-off
days at the phantom road site acted as an internal control, while the data collected at the
control site allowed further control for weather and migration variability. Using
regression based on new captures to calculate condition gain is thought to be a less-biased
method of calculating gain during stopover. The regression of new captures against time
of day is thought to accurately measure condition gain of a population at a stopover site
(Dunn 2001), however this could be biased if some migrants leave the site over the
course of the sampling period (in this case during the 5 hours after sunrise). In addition to
a problem of small sample sizes, the historic method of using the mass of a single
individual at multiple captures may be biased since an individual’s condition influences
its length of stay at a stopover site, and therefore its probability of recapture (Winker et
al. 1992).
1.3.3 Capture Rate.
We calculated the capture rate as the number of birds caught per net hour, where
one net-hour equals one net open for one hour. We considered capture rate an accurate
index of migrant relative abundance at each site, based on past research and previous
comparisons of netting and count surveys during migration at this and other sites (Wang
and Finch 2002; Carlisle et al. 2004). And, because we controlled for the habitat around
30
mist nets at the control and phantom road sites in this study, we feel confident that
capture rate is a valid comparison between sites. Since we ran the same set of models for
BCI, stopover efficiency, and capture rate, we determined that comparing capture rate of
birds netted to the BCI information was more appropriate than comparing BCI data to the
point count data collected at our site.
1.3.4 Species-Specific Models
We analyzed data using the function lmer (Bates, D., M. Maechler, and B. Bolker.
2012. lme4: Linear mixed-effects models using S4 classes in the package lme4 in
Program R (R Development Core Team 2011). We built linear mixed effect models for
all 51 species combined, then tested the same set of models on 21 species individually
(those with n>100; Tables 1, A1-A3). In addition to multi-species results we present in
the main text, seven species analyzed individually showed decreased stopover efficiency
or BCI in noise (Table A2).
2. Laboratory Methods
2.1 Captive Sparrows
We mist-netted 20 Gambel’s white-crowned sparrows (Zonotrichia leucophrys gambelii)
from Deer Flat National Wildlife Refuge in southwestern Idaho, USA under the Idaho
Department of Fish and Game permit # 764-13-000039, and approved by Boise State
University IACUC (# 006-AC12-007). We brought birds into the lab in groups of five,
captured between March 16 and April 16, 2013. We individually marked each bird with
an aluminum USGS band, under federal banding permit #22929. While birds were in
captivity, we used strips of plastic tape wrapped around their federal bands to temporarily
color mark individuals. The plastic was removed prior to release. Adjacent individual
31
cages allowed birds to remain within sight and sound of their flock mates while held in
the Sensory Ecology Lab animal housing room at Boise State University, Idaho, USA.
Birds had access to water ad libitum at all times, including during experiments, and we
provided a seed mix ad libitum in their individual cages when foraging trials or pre-trial
acclimations were not underway. The temperature-controlled housing room was set to
19°C and a 12.2:11.8 light:dark cycle with 30 minute twilights to match average outdoor
conditions at the time of experiments. We kept birds an average of 5 days, and none were
held longer than 7 days; they were released at the location of their original capture.
2.2 Experimental Set-up
We conducted experiments inside the flight room in the Sensory Ecology Lab at
Boise State University. The flight room is a 38m² room lined with anechoic foam, which
reduces the noise levels in the room to 32 dB(A). In the center of the room, we
constructed a 1.5 x 2.5 m foraging arena covered in 2 cm of medium-grain sand. White
Millet (Panicum miliaceum) seeds scattered evenly over the sand provided homogenous
foraging conditions during trials. We maintained a high density of millet seeds (~100g) in
the foraging arena so that the supply available to birds during a given trial was not
depletable, allowing them to forage at their maximal rate without influencing search time.
We placed three natural branches as perches at the edge of the foraging arena at a height
of ~0.75 m. After initial capture, we placed birds in the flight room and allowed them to
acclimate for a full day with access to seed in the foraging arena. We ensured that birds
had learned to feed on the arena, access water dishes, and sit on the perches before we
began trials.
32
During experiments, we allowed birds to feed in their individual cages for 30 min
each morning before trials, and then removed access to food 1.5 hrs before the start of an
individual’s first trial of the day. During this period without food, birds spent 50 min in
their individual cages, after which we moved a bird from its cage into the flight room and
allowed it 40 additional minutes to acclimate to the room. During this time, the foraging
arena was covered to prevent access to seed. At the beginning of each trial, we entered
the room to remove the cover over the area and to start video recording. We then returned
to an adjacent room where we could observe the trial on a live video feed and control
noise playback.
Speakers (Bird speakers; frequency response 70 Hz - 25 kHz; ± 3 dB) at opposite
ends of the flight room broadcast sound evenly (±2 dB(A)) over the foraging arena during
noise treatment trials. To allow for comparison between these results and the Phantom
Road field experiment, we used the same sound files and matched dB(A) settings for both
experiments. We used the phantom road file to create 8-minute-long sound files,
adjusting the files to match the required dB(A) levels.
2.3 Behavioral Observations
Foraging trials lasted for 8 minutes and all bird activity and foraging behavior was
video recorded during the experimental period. We used an HD video camera (Sony
HDV 1080i and Canon XA10 models) to record foraging behavior of individuals during
trials. During each foraging trial, we played one of three randomly-selected noise
treatments: 61dB(A) traffic noise, 55 dB(A) traffic noise or a silent control track, for 8
minutes. The sound files used a 5 second fade-in at the beginning and end of the traffic
33
noise so that birds were not startled by the onset of the noise treatment. At the end of the
8 minutes, we stopped the video recording and covered the foraging arena.
We randomly selected treatment order and ran a focal bird through the three, 8-
min noise trials. We covered food for 40 minutes between foraging trials to ensure birds
were hungry at the start of the next experiment. By covering the foraging arena while
allowing birds to remain in the flight room, we eliminated the need to capture and handle
birds after each trial and thereby reduced their qualitative stress levels.
During preliminary trials, we found that all birds began investigating the covered
foraging arena in search of food between 25-35 minutes after they had last eaten. We
therefore chose a 40 min wait time to make sure that all birds were ready to forage at the
start of the next trial. We chose an 8 min trial duration because birds did not forage for
the entire 8 minutes during preliminary tests or during any trial, so we assumed that they
were satiated before the end of the trial and would therefore be equally hungry at the start
of each subsequent trial (i.e., the birds did not accumulate hunger throughout the day). By
observing the sparrows’ naturally-preferred foraging schedule, we were able create an
experimental schedule that allowed for the most trials to be conducted in one day without
prolonged food deprivation.
2.4 Analysis
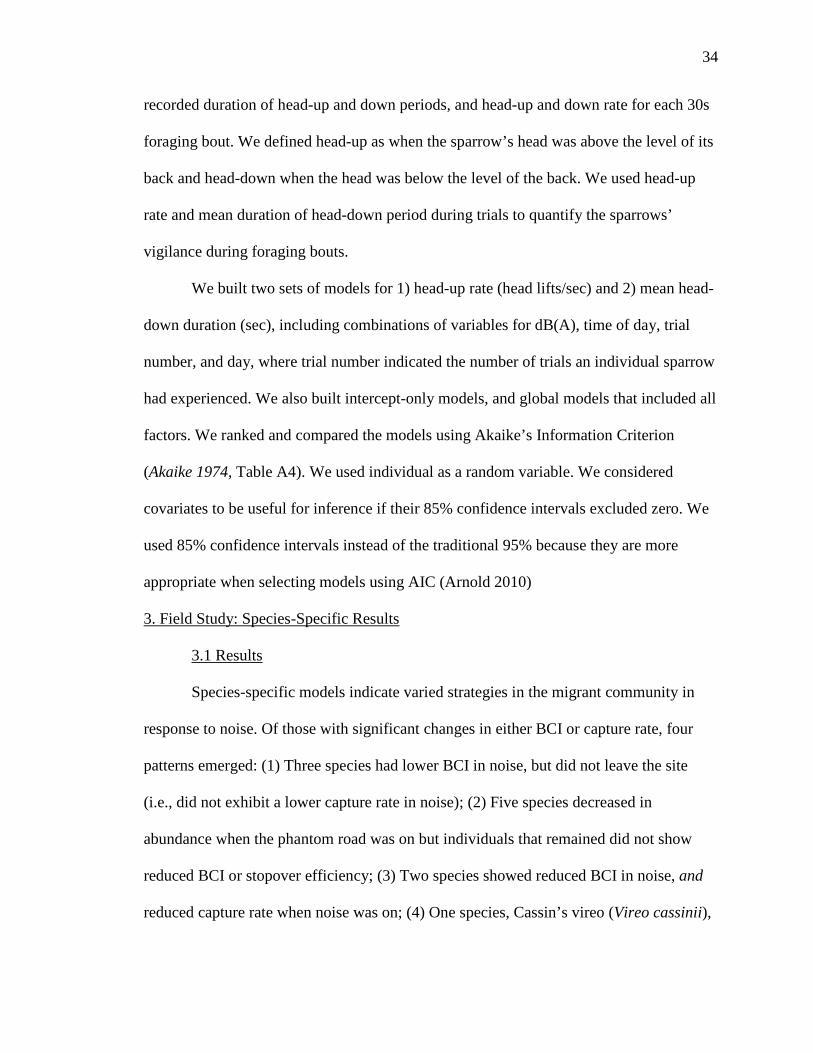
We recorded several foraging and vigilance variables based on analysis of the 30
fps HD videos for each trial. By playing back the videos frame by frame we were able to
track the exact timing of each movement during a foraging bout. For each trial, we
analyzed a 30s foraging bout. We defined the start of a foraging bout as 5 consecutive
pecks separated by less than 10s (Quinn et al. 2006). Following Quinn et al. (2006), we
34
recorded duration of head-up and down periods, and head-up and down rate for each 30s
foraging bout. We defined head-up as when the sparrow’s head was above the level of its
back and head-down when the head was below the level of the back. We used head-up
rate and mean duration of head-down period during trials to quantify the sparrows’
vigilance during foraging bouts.
We built two sets of models for 1) head-up rate (head lifts/sec) and 2) mean head-
down duration (sec), including combinations of variables for dB(A), time of day, trial
number, and day, where trial number indicated the number of trials an individual sparrow
had experienced. We also built intercept-only models, and global models that included all
factors. We ranked and compared the models using Akaike’s Information Criterion
(Akaike 1974, Table A4). We used individual as a random variable. We considered
covariates to be useful for inference if their 85% confidence intervals excluded zero. We
used 85% confidence intervals instead of the traditional 95% because they are more
appropriate when selecting models using AIC (Arnold 2010)
3. Field Study: Species-Specific Results
3.1 Results
Species-specific models indicate varied strategies in the migrant community in
response to noise. Of those with significant changes in either BCI or capture rate, four
patterns emerged: (1) Three species had lower BCI in noise, but did not leave the site
(i.e., did not exhibit a lower capture rate in noise); (2) Five species decreased in
abundance when the phantom road was on but individuals that remained did not show
reduced BCI or stopover efficiency; (3) Two species showed reduced BCI in noise, and
reduced capture rate when noise was on; (4) One species, Cassin’s vireo (Vireo cassinii),
35
had increased BCI in noise, and did not leave the site. Cassin’s finches had lower overall
BCI, but compensated by increasing their stopover efficiency. Meanwhile, though no
species had higher capture rates during noise, nine of the 21 species examined showed no
negative response to the noise.
36
Figure 5 Species-specific Stopover Efficiency Results. Output values from the global model estimates of stopover efficiency for the control site when the road was off (dB(A) 42), control site with road on (dB(A) 43), phantom road with noise turned off (dB(A) 40), and the phantom road with the noise on (dB(A) 51) for three species: white-crowned sparrow (A), MacGillivray’s warbler (B), Cassin’s finch (C), and Ruby-crowned Kinglet (D). Each showed varying BCI and stopover efficiency responses in the presence of traffic noise.
37
3.2 Interpretation
Though at first glance it seems difficult to explain these varied responses, a few
dynamics might be at play. First, variation in species’ behavior likely affects the “choice”
to stay in the noise or leave; i.e., the cost of searching for another stopover area might be
perceived as higher than remaining in a suboptimal site. Second, if some sensitive
individuals depart the noisy area and food availability remains the same, this could make
foraging more efficient for the remaining birds. Thus, individuals of some species that
remain in the noise might be able to make up for their increased vigilance by easier prey
acquisition whereas foraging behavior of other species might not allow for increased
efficiencies to offset costs to vigilance. For example, two species showed a positive
response in body condition (Cassin’s vireo and ruby-crowned kinglet). This result may be
a manifestation of birds with high fat stores deciding to remain in noise while low-
condition birds decide to leave. This may be the consequence of a difference in foraging
requirements between lean and fat birds. Fat birds with enough energy stores to migrate
the next night may not need to forage during the day, thus negating costs to their
foraging-vigilance tradeoff caused by noise. Lean birds conversely rely heavily on
foraging through the day to replenish energy stores (Berthold 1996). The cost of
remaining in noise and reducing foraging may therefore be too great, causing lean birds
to vacate the phantom road site. One species showed increased stopover efficiency
(Cassin’s finch), which suggests that that at least some individuals of a species were able
to take advantage of the reduced abundance of other migratory birds in noise. On the
other hand, American robins showed reduced capture rates in noise but individuals that
remained did not benefit from reduced competition. MacGillivray’s warblers did not
38
show reduced capture rates in noise, and were the species that showed the strongest
negative responses for both BCI and stopover efficiency, indicating that individuals
stayed but did poorly in noise. For the entire community, it is likely that sensitive
individuals were the first to leave in response to noise disturbance, while more tolerant
individuals remained (Bejder et al. 2009, reviewed in Francis & Barber 2013). Only
exploration of food availability and predator-prey dynamics with and without noise
would allow us to further elucidate the different responses of migratory birds to
experimental noise.
3.3 The Benefit of Community-Wide Analyses
While these species-specific results are interesting, our study design was
optimized to address the entire songbird community as a whole. By testing an entire
community, we were likely sampling not only the direct effect of noise on individual
species, but also the indirect effects through changes in one species impacting others in
the community. Using this community-wide approach likely allowed us to find a greater
effect of noise than a single-species study design. Without additional studies specifically
designed to address these individual patterns and their causes, it remains difficult to say
why some species chose different strategies than others when exposed to traffic noise.
Depending on the focal species chosen for a study of this kind, a single-species study
could have failed to find an effect simply because of the species chosen, while many
other species in the community may have shown an effect of noise.
39
Conclusion
Both our field and lab experiments offer evidence that traffic noise alone has a
negative impact on birds. Our field experiment showed that migrants’ stopover efficiency
declines when they are exposed to road noise. Birds’ ability to gain body condition in
noise was cut by almost half (46%) when the phantom road broadcast traffic noise. Our
lab experiment showed that white-crowned sparrows exposed to road noise decrease
foraging rates and increase vigilance. These results are a significant addition to the road
ecology literature, since previous work has never experimentally tested the impact of
traffic noise alone on birds, or used community-wide sampling to examine the effects of
noise on individuals that stay in noisy conditions. Based on our two experiments, it
follows that if the decrease in foraging seen in the lab also occurs in the field, this could
be a likely cause for the body condition declines seen in our field study. However, our
work does not explicitly verify the connection between these results, and further testing is
required if we are to strengthen the existing theoretical connection with supporting data.
To fully connect the foraging-vigilance changes seen in the lab to our field
experiment, we would need to conduct in-the-field tests of foraging and vigilance rates.
During the 2012 season, we attempted to examine foraging and vigilance behavior in
migrants by placing feeding stations with video monitors at the control and phantom road
sites. Initially, we used millet seeds, without success. As the season progressed, we
attempted various methods for eliciting foraging in front of our cameras but were not able
to accomplish this goal. We used a variety of seeds and fruits to attract birds to our
foraging trays, and also attempted to capture natural foraging behavior by pointing our
cameras at shrubs where birds were known to forage (those with many bitter cherries
40
[Prunus sp.]). The widely available food resources and large variety of foraging
strategies used by the migrant community at Lucky Peak made these passive monitoring
efforts even more difficult, since the likelihood of a bird foraging in the area in view of
the camera was very small.
To successfully measure foraging behavior in our field experiment setup, the
method most likely to be successful would probably be active monitoring of foraging
birds using video equipment. Experimenters would be required to actively search out
foraging birds, feeding at natural food concentrations, and capture video of their
behavior. This method may have worked to capture foraging behavior of individuals,
however, standardization of monitoring and quantification of foraging behavior would
present challenges. It is relatively simple to monitor foraging of ground-feeding,
granivorous birds when they are not in dense cover. However, the community at Lucky
Peak is comprised of a large variety of species, many of which forage in shrubs and trees,
or on the ground under dense cover and leaf litter.
A clear difference between foraging and vigilance behavior is not present in birds
that use other foraging strategies. Birds searching for insects often turn their head in a
variety of directions, probing in bark crevices, hanging from branches to inspect conifer
needles, reaching under leaves with head and bill, or overturning leaves on the ground.
Their bodies do not remain on a horizontal axis, making determination of ‘head lifts’
challenging, and with frequent head turning and probing it is difficult to determine
whether a bird is scanning for food or predators. Because of songbirds’ laterally placed
eyes, head movements along an axis other than the vertical plane are difficult to interpret,
and the direction of a birds’ gaze is not often apparent. In order to measure vigilance on
41
the community of songbirds we tested in our field experiment, an entirely new paradigm
for quantifying foraging and vigilance would need to be developed.
Additional lab experiments following a similar experimental set up to our
previous tests would also help solidify the connection between reduced foraging and
reduced body condition. During our laboratory experiments, each individual experienced
each of the noise treatments in a repeated measures design. Therefore, in one day, each
bird foraged in all three noise treatments. While this design worked well to reduce
variability in our data by testing a bird in all conditions on the same day, it did not allow
us to measure mass gain or loss in the lab. To test this, one would need to take birds into
captivity for a longer period of time, and expose each individual to only one noise
treatment. And unlike our experimental design where birds were provided food ad
libitum when not involved in trials, birds could be allowed to forage only while exposed
to their assigned noise treatment. Thus, birds could be weighed over a period of time to
measure whether they lost body condition steadily when exposed to road noise. Though
not as informative as a field experiment on an entire songbird community, this test would
be relatively simple to conduct, cost effective, and would help describe the underlying
mechanisms involved. Because of the difficulty in quantifying vigilance of birds with
different foraging strategies, a lab experiment of this type should be conducted on ground
feeding species.
When discussing foraging and vigilance in the context of our experiments, it is
important to differentiate between the routine vigilance we measured, versus “induced”
vigilance (Blanchard and Fritz 2007). Routine vigilance is used by animals while
monitoring their environment when there are no obvious threats, while induced vigilance
42
is a behavior, often perceived as a “startle response,” in animals caused by a threat
stimulus (Blanchard and Fritz 2007). Research shows that the routine vigilance we
measured in the lab is a good indication of a bird’s ability to avoid predators (Quinn et al.
2006), and therefore should be the focus of any future studies on foraging-vigilance
behavior in noise.
We measured a reduction in foraging and vigilance levels in birds exposed to
traffic noise. Though we only examined this tradeoff in one species with a particular
foraging strategy, many other species share similar foraging-vigilance tradeoff behaviors
(Lima and Dill 1990). Though more testing is needed, theoretically any animal that uses
as similar combination of both visual and auditory vigilance would experience
comparable shifts in foraging vigilance behavior.
In addition to solidifying the connection between our measured declines in body-
condition gain and reduced foraging, there are a variety of other research avenues opened
by our study. We found that in many species some individuals left, while others
remained. While we can hypothesize a few reasons for this, direct tests of this effect
would be informative. Though not well explored, some research indicates that variations
in individual “personalities” or “behavioral syndromes” result in a gradient of behavioral
responses to a given stimulus (Sih et al. 2004). Testing of birds in a controlled setting
could reveal whether some individuals are simply more sensitive to road noise than
others, causing them to leave the site while others remain. This can be seen in animals’
responses to other startling stimuli, when some bold individuals respond weakly to a
stimulus and more timid individuals respond more strongly (Bejder et al. 2009). It seems
43
plausible that variation in individual sensitivity to a stimulus or a birds “personality”
could influence whether it stays or goes when exposed to noise.
Aside from variation in individual sensitivity to noise, birds may have made the
decision of whether to depart from the site based on their own body condition. Previous
research has shown that birds in poor condition with few fat stores are less likely to leave
a site, since the cost of leaving is too high (Smith and McWilliams 2014, Schmaljohann
and Naef-Daenzer 2011, Klaassen et al. 2012). Whereas birds with high condition can
afford the cost of leaving a less-optimal site as well as the added costs of searching for
and acclimating to a new site (Smith and McWilliams 2014). Additionally, the influence
of noise on the foraging-vigilance tradeoff may affect birds differently based on body
condition and foraging needs.
Another direction of research that we left unexplored was the role of predators in
our system. We measured an obvious change in both numbers and condition of songbirds
at our site. Therefore, it seems highly likely that the predator community also changed in
response to the same stimulus, especially the migrant raptor community since they are
also highly mobile. Fortunately for the interpretation of our results, most organisms,
including birds, are more likely to change their behavior based on perceived predation
risk, rather than actual predation risk (Lima and Dill 1990; Verdolin 2006). Therefore, if
our field results were indeed caused by changes in foraging-vigilance behavior, it is
unlikely that varying predator numbers would have significantly altered our conclusions
from this study. Our lab results also support this conclusion since sparrows changed
vigilance levels in response to noise in the complete absence of predators—their
perceived predation risk increased, despite their actual predation risk remaining at zero.
44
One study found that passerines change their behavior and movement patterns in
response to hawk numbers during stopover, but did not investigate foraging or vigilance
behavior (Cimprich et al. 2005). An investigation into the interplay between perceived
predation risk and actual risk, and their relative importance in determining bird foraging
and vigilance in noise would be fruitful.
In our study, we found that the average body condition of birds at our site
decreased when the phantom road was on. Other research has found that compared to
body condition of all migrants at a site, migrants with lower body condition are predated
in greater proportions than birds with high body condition (Dierschke 2003). Therefore,
birds exposed to traffic noise may be at greater risk of predation because of their reduced
body condition.
Finally, testing the impact of traffic noise on prey detectability and predator attack
rates would be worthwhile. Predators that use auditory cues to detect songbird prey may
be at a disadvantage in noise. An investigation of skylarks (Alauda arvensis) and merlins
(Falco columbarius) found that falcons were less likely to attack their songbird prey
when the skylarks were singing (Cresswell 1994). Cresswell (1994) found that merlins
determined the vigilance levels of potential quarry based upon whether they were singing
or not. Larks that sang more were more vigilant, and were therefore attacked less by
advertising this vigilance (Cresswell 1994). It is uncertain whether species in the
community we studied also use vocalizations as a pursuit deterrent; however, if that is the
case, it is highly likely that traffic noise would mask these calls and therefore change
predator attack behavior. Investigation into this interaction would be intriguing, since
traffic noise could cause predators (that suffer little cost from noise exposure themselves;
45
e.g., visual hunters) to attack prey more often than normal or inadequately evaluate prey
vigilance, perhaps resulting in more unsuccessful pursuits. More predator attacks on
otherwise vigilant birds could result in more energy expenditure for both predator and
prey. Tests of this type would also need to focus on prey vigilance, determining whether
prey are able to remain adequately vigilant in traffic noise, or whether the likelihood that
they are captured increases.
Not only could traffic noise cause changes in predator-prey interactions, but the
changes we measured in bird behavior and distribution could have cascading effects
throughout the ecosystem. Like predator effects, the impacts of traffic noise could be
broad. Some potential routes for future study include: investigation of changes in insect
communities because of alteration in bird predation rates, consequent changes in rates of
insect herbivory, and therefore changes in plant chemistry and overall physiology. A
long-term absence of birds in an area could cause increased insect numbers and
detrimental effects on plants. Anthropogenic noise is known to impact Pinyon Pine
(Pinus edulis) communities by altering animal distributions, including avian seed
dispersers (Francis et al. 2012). At Lucky Peak, where cherries and other fruiting plants
rely on birds as a dispersal mechanism, a similar effect is perhaps likely.
Traffic noise may cause cascading effects that physically alter habitats, but it also
causes changes in how habitat is perceived by birds. In our study, when we turned the
phantom road on, birds were not able to increase body condition at the site. However, we
found that the phantom road site was valuable as a stopover location when the noise was
off. Birds were able to increase body condition 2.5 times faster when the noise was off at
the same site. Thus, while the habitat remained unchanged, the value of that habitat for
46
stopover decreased because of traffic noise alone. This leads to some interesting
questions about habitat degradation. If traffic noise causes habitat degradation, principles
such as habitat loss and fragmentation may come into play. Traffic noise, by degrading
habitat, may cause physically continuous chunks of habitat to become ‘patchy.’ More
research is needed to test the outcome of such “fragmentation,” especially since noise
may degrade the value of habitat for one species differently than for another.
When considering the effects of traffic noise on animal populations, we must also
pay attention to the role natural sound plays in shaping ecosystems. We don’t fully
understand all the roles sound plays, especially since natural sounds, like anthropogenic
sounds, have the potential to mask signals of organisms. Understanding how natural
soundscapes structure communities is an interesting future research direction. The role of
natural sounds during migration has been tested and found to play a role in stopover site
selection. Mukhin et al. (2008) found that nocturnal migrants will use acoustic cues alone
to determine whether a location is suitable for stopover. By playing the sounds of bird
species associated with wetland environments, they were able to trick wetland specialist
birds to land at a desert site. This highlights the importance of natural sounds (e.g.,
running water, rustling leaves, and chirping insects or amphibians) as habitat cues for
birds, especially nocturnal migrants such as songbirds that must choose where to land in
dim pre-dawn light. Traffic noise that occurs during times when birds are making habitat
selection decisions may mask important natural sounds. This could either cause birds to
pass-over the proper habitat type, or—if on a large enough scale—may eliminate acoustic
cues as a useful indicator of where birds should stopover, forcing them to choose habitat
based on other cues, or “blindly” choose a stopover location if other cues do not exist. A
47
replication of Mukhin et al.’s research, in combination with both natural and
anthropogenic noise playback, would be informative.
Though many questions remain, our research has brought to light some important
and previously unexplored aspects of road ecology. While previous research determined
that roads were having an effect on animal populations, we were able to determine that
the traffic noise alone is enough to impact wildlife. Since anthropogenic noise pollution
continues to increase, and many protected areas do not currently manage for noise
pollution, this has important implications for how we manage roads and traffic in the
future (Barber et al. 2011). Unlike other aspects of roads, noise is more easily controlled
through a few relatively simple methods, when compared to the alternative of removing
an entire road to control impacts. Altering the road substrate and tire type or changing
speed limits are cost-effective strategies known to reduce noise levels (Wayson 1998). As
the number of electric and hybrid cars increases, the impact from roads has the potential
to decrease. However, there is already legislation in place requiring the next generation of
energy-efficient cars to make additional noise (NHTSA 2013). Ecologists stand to face
an entirely new set of impacts on a different set of species than previous if sounds
become louder or incorporate a new range of frequencies. Since it is not likely that the
number of roads in the US will decrease, evidence that noise is responsible for a
substantial portion of roads’ impact could help with mitigation efforts while not
drastically changing or limiting future road projects.
As the world’s population continues to grow, increases in traffic noise—and the
global footprint of roads on the landscape—are inevitable. With the human population
projected to reach 11 billion by the year 2100 (Gerland et al. 2014), wildlife across the
48
globe will face even more threats from anthropogenic impacts. By quantifying the
impacts of various anthropogenic changes to habitat and managing for these effects, we
may be able to reduce the amount of habitat lost to wildlife. Recognizing that noise
reduces habitat quality is the first step in taking action to mitigate the impacts our roads
have on organisms.
49
REFERENCES
H. Akaike, A new look at the statistical model identification. IEEE T. Automat. Contr. 19, 716-723 (1974). T. W. Arnold, Uninformative parameters and model selection using Akaike’s Information Criterion. J. Wildlife Manage. 74, 1175–1178 (2010). J. R. Barber et al., Anthropogenic noise exposure in protected natural areas: estimating the scale of ecological consequences. Landscape Ecology. 9, 1281-1295 (2011). D. Bates, M. Maechler, and B. Bolker. 2012. lme4: Linear mixed-effects models using S4 classes. E. M. Bayne, L. Habib, S. Boutin, Impacts of chronic anthropogenic noise from energy-sector activity on abundance of songbirds in the boreal forest. Conservation Biology. 22, 1186-1193 (2008). L. Bejder, A. Samuels, H. Whitehead, H. Finn, S. Allen, Impact assessment research: Use and misuse of habituation, sensitisation and tolerance in describing wildlife responses to anthropogenic stimuli. Marine Ecology Progress Series. 395, 177–185 (2009).
A. Benítez-López, R. Alkemade, P. A. Verweij, The impacts of roads and other infrastructure on mammal and bird populations: a meta-analysis. Biol Conserv. 143, 1307-1316 (2010).
P. Berthold, Control of Bird Migration (Chapman and Hall, London, 1996)
P. Blanchard, H. Fritz, Induced or routine vigilance while foraging. Oikos. 000, 000-000 (2007). doi: 10.1111/j.2007.0030-1299.15799.x
J. L. Blickley et al., Experimental chronic noise is related to elevated fecal corticosteroid metabolites in lekking male greater sage-grouse (Centrocercus urophasianus). PLoS ONE. 7, e50462 (2012).
D. N. Bonter, T. M, Donovan, E. W. Brooks, K. A. Hobson, Daily mass changes in landbirds during migration stopover on the south shore of Lake Ontario. The Auk. 124, 122-133 (2007).
J. D. Carlisle et al., Landbird migration in the American west: recent progress and future research directions. The Condor. 111, 211-225 (2009).
50
J. D. Carlisle, G. S. Kaltenecker, D. L. Swanson, Stopover ecology of autumn landbird migrants in the Boise foothills in southwestern Idaho. The Condor. 107, 244-258 (2005).
J. D. Carlisle, S. L. Stock, G. S. Kaltenecker, D. L. Swanson, Habitat associations, relative abundance, and species richness of autumn landbird migrants in southwestern Idaho. The Condor. 106, 549-566 (2004).
D. A. Cimprich, M. S. Woodrey, F. R. Moore, Passerine migrants respond to variation in predation risk during stopover. Animal Behaviour. 69, 1173-1179 (2005).
W. Cresswell, Song as a pursuit-deterrent signal, and its occurrence relative to other anti-predation behaviours of Skylark (Alauda arvensis) on attack y Merlins (Falco columbarius). Behavioral Ecology and Sociobiology. 34, 217-223 (1994).
O. L. Crino, B. Klaassen Van Oorschot, E. E. Johnson, J. L. Malisch, C. W. Breuner, Proximity to a high traffic road: Glucocorticoid and life history consequences for nestling white-crowned sparrows. General and Comparative Endocrinology. 173, 323-332 (2011).
V. Dierschke, Predation Hazard during Migratory Stopover: Are Light or Heavy Birds under Risk? Journal of Avian Biology. 34:24-29 (2003).
E. H. Dunn, Mass change during migration stopover: a comparison of species groups and sites. Journal of Field Ornithology. 72: 419-432 (2001).
E. H. Dunn, Temporal and spatial patterns in daily mass gain of Magnolia Warblers during migratory stopover. The Auk. 117, 12-21 (2000).
L. Fahrig, T. Rytwinski. Effects of roads on animal abundance: an empirical review and synthesis. Ecol. Soc. 14, 21 (2009). R. T. T. Forman, R. D. Deblinger, The ecological road-effect zone of a Massachusets (U.S.A.) suburban highway. Conservation Biology, 14, 36-46 (2000). C. D. Francis, C. P. Ortega, A. Cruz, Noise pollution changes avian communities and species interactions. Current Biology. 19, 1415-1419 (2009). C. D. Francis, J. R. Barber, A framework for understanding noise impacts on wildlife: an urgent conservation priority. Frontiers in Ecology and the Environment. 11, 305-313 (2013). A. Frid, L. Dill, Human-caused Disturbance Stimuli as a Form of Predation Risk. Conservation Ecology. 6, 11 (2002). S. D. Gavin, P. E. Komers, Do pronghorn (Antilocapra Americana) perceive roads as a predation risk? Can. J. Zool. 84, 1775-1780 (2006). P. Gerland et al., World population stabilization unlikely this century. Science, 18 September 2014 DOI: 10.1126/science.1257469
51
S. E. Goodwin, W. G. Shriver, Effects of traffic noise on occupancy patterns of forest birds. Conservation Biology. 25, 406-411 (2010). L. Habib, E. M. Bayne, S. Boutin, Chronic industrial noise affects pairing success and age structure of Ovenbirds Seiurus aurocapilla. Journal of Applied Ecology. 44, 176-184 (2007). W. Halfwerk et al., Low-frequency songs lose their potency in noisy urban conditions. PNAS. 108, 14549-14554 (2011a). W. Halfwerk, L. J. M. Holleman, C. M. Lessells, H. Slabbekoorn, Negative impact of traffic noise on avian reproductive success. Journal of Applied Ecology. 48, 210-219 (2011b). X. A. Harrison, J. D. Blound, R. Inger, D. R. Norris, S. Bearhop, Carry-over effects as drivers of fitness differences in animals. Journal of Animal Ecology, 80:4-18 (2010). A. Hedenstrom, Adaptations to migration in birds: behavioural strategies, morphology and scaling effects. Phil. Trans. R. Soc. B. 363, 287-299 (2008). C. R. Kight, J. P. Swaddle, How and why environmental noise impacts animals: an integrative, mechanistic review. Ecology Letters. 14, 1052-1061 (2011). M. Klaassen, B. J. Hoye, B. A. Nolet, W. A. Buttemer, Ecophysiology of avian migration in the face of current global hazards. Phil. Trans. R. Soc. B. 367, 1719–1732 (2012). C. Kullberg, S. Jakobsson, T. Fransson, High migratory fuel loads impair predator evasion in Sedge Warblers. The Auk. 117, 1034-1038 (2000). A. Kvist, A. Lindstrom, M. Green, T. Piersma, G.H. Visser, Carrying large fuel loads during sustained bird flight is cheaper than expected. Nature. 413, 730-732 (2001). S. L. Lima, L. M. Dill, Behavioral decisions made under the risk of predation: a review and prospectus. Can. J. Zool. 68, 619-634 (1990). E. Lynch, D. Joyce, K. Fristrup, An assessment of noise audibility and sound levels in U.S. National Parks. Landscape Ecology. 26, 1297-1309 (2011). National Highway Traffic Safety Administration [NHTSA], Minimum sound requirements for hybrid and electric vehicles: draft environmental assessment. (U.S. Department of Transportation, Washington D.C., January 2013). C. J. W. McClure, H. E. Ware, J. Carlisle, G. Kaltenecker, J. R. Barber, An experimental investigation into the effects of traffic noise on distributions of birds: avoiding the phantom road. Proc. R. Soc. B. 280, 20132290 (2013).
52
J. M. McNamara, A. I. Houston, The value of fat reserves and the tradeoff between starvation and predation. Acta Biotheretica. 38, 37-61 (1990). E. J. Mockford, R. C. Marshall, Effects of urban noise on song and response behavior in great tits. Proc. R. Soc. B. 276, 2979-2985 (2009). R. Montgomerie, P. J. Weatherhead, How robins find worms. Animal Behavior. 54, 143-151 (1995). A. Mukhin, N. Chernetsov, D. Kishkinev, Acoustic information as a distant cue for habitat recognition by nocturnally migrating passerines during landfall. Behavioral Ecology. 19, 716-723 (2008). M. Pescador, S. Peris, Influence of roads on bird nest predation: and experimental study in the Iberian Peninsula. Landscape and Urban Planning, 82, 66-71 (2007). A. Poole, "The birds of North America online." Cornell Laboratory of Ornithology, Ithaca (2005). J. Purser, A. N. Radford, Acoustic noise induces attention shifts and reduces foraging performance in three-spined sticklebacks (Gasterosteus aculeatus). PLoS ONE. 6, e17478 (2011). P. Pyle, Identification guide to North American birds. Part 1. (Slate Creek Press, Bolinas, CA.) (1997). J. L. Quinn, M. J. Whittingham, S. J. Butler, W. Cresswell, Noise, predation risk compensation and vigilance in the chaffinch Fringilla coelebs. Journal of Avian Biology. 37, 601-608 (2006). C. J. Ralph, G. R. Geupel, P. Pyle, T. E. Martin, D. F. Desante, Handbook of field methods for monitoring landbirds. (1993) USDA Forest Service General Technical Report PSW-GTR-144. R Development Core Team. 2011 R: a language and environment for statistical computing. Vienna, Austria: R Foundation for Statistical Computing. R. Reijnen, R. U. U. D. Foppen, Impact of road traffic on breeding bird populations in The Ecology of Transportation: Managing Mobility for the Environment, J. Davenport, J. L. Davenport, Eds. (Springer, Netherlands, 2006) pp. 255-274. C. S. Robbins, J.R. Sauer, R.S. Greenberg, S. Droege, Population declines in North American birds that migrate to the neotropics. Proc. Natl. Acad. Sci. 86, 7658-7662 (1989).
53
B. A. Robertson, R. L. Hutto, A framework for understanding ecological traps and an evaluation of existing evidence. Ecology. 87, 1075-1085 (2006). F. J. Sanderson, P.F. Donald, D.J. Pain, I.J. Burfield, Long-term population declines in Afro-Palearctic migrant birds. Biol. Conserv. 131, 93-105 (2006). H. Schmaljohann, B. Naef-Daenzer, Body condition and wind support initiate the shift of migratory direction and timing of nocturnal departure in a songbird. Journal of Animal Ecology. 80, 1115-1122 (2011). K. A. Schmidt, S. R. X. Dall, J. A. van Gils, The ecology of information: an overview on the ecological significance of making informed decisions. Oikos. 119, 304-316 (2010). T. Scott Sillett, R. T. Holmes, Variation in survivorship of a migratory songbird throughout its annual cycle. Journal of Animal Ecology. 71, 296-308 (2002). G. Shannon, L. M. Angeloni, G. Wittemyer, K. M. Fistrup, K. R. Crooks, Road traffic noise modifies behaviour of a keystone species. Animal Behaviour. 94, 135-141 (2014). B. M. Siemers, A. Schaub, Hunting at the highway:traffic noise reduces foraging efficiency in acoustic predators. Proceedings of the Royal Society B, 278.1712, 1646-1652 (2011). A. Sih, A. Bell, J. C. Johnson, Behavioral syndromes: an ecological and evolutionary overview. Trends in Ecology and Evolution. 19: 372–78 (2004). A. D. Smith, S. R. McWilliams, What to do when stopping over: behavioral decisions of a migrating songbird during stopover are dictated by initial change in their body condition and mediated by key environmental conditions. Behavioral Ecology. 00, 1-13 (2014). P. D. Summers, G. M. Cunnington, L. Fahrig, Are the negative effects of roads on breeding birds caused by traffic noise? Journal of Applied Ecology. 48, 1527-1534 (2011). T. Székely, J. N. Webb, A. I. Houston, J. M. McNamara, An evolutionary approach to offspring desertion in birds in Current Ornithology , V. Nolan Jr., E. D. Ketterson, Eds. (Springer, Boston, MA, 1996), pp. 271-330. R. L. Thomson, J. T. Forsman, F. Sarda-Palomera, M. Monkkonen, Fear factor: prey habitat selection and its consequences in a predation risk landscape. Ecography. 29, 507-514 (2006). I. T. van der Veen, Effects of predation risk on diurnal mass dynamics and foraging routines of yellowhammers (Emberiza citrinella). Behavioral Ecology. 10, 545–551 (1999).
54
J. L. Verdolin, Meta-analysis of foraging and predation risk trade-offs in terrestrial systems. Behavioral Ecology and Sociobiology. 60, 457-464 (2006). Y. Wang, D. M. Finch, Consistency of mist netting and point counts in assessing landbird species richness and relative abundance during migration. The Condor. 104, 59-72 (2002). M. Watson, N.J. Aebischer, W. Cresswell, Vigilance and fitness in Grey Partridges Perdix perdix: the effects of group size and foraging-vigilance trade-offs on predation mortality. Journal of Animal Ecology. 76:211-221 (2007). R. L. Wayson, Relationship between pavement surface texture and highway traffic noise. Vol. 268. Transportation Research Board) (1998). K. Winker, D. W. Warner, A. R. Weisbrod, Daily mass gains among woodland migrants at an inland stopover site. The Auk. 109, 853-862 (1992). M. S. Witter, I. C. Cuthill, The ecological costs of avian fat storage. Philosophical Transactions: Biological Sciences. 340, 73-92 (1993).
55
APPENDIX
AIC Model Output Results
56
Table A.1 AIC model output results for body condition analysis.
All Species Model k AIC ∆AIC wi
dB(A) + day + day² + year 5 -51180.75 0.00 0.75 day + day² + year 4 -51177.63 3.12 0.16 day + year 3 -51175.29 5.46 0.05 noise X site + day + day² + year 7 -51174.93 5.82 0.04 dB(A) + year 3 -51089.28 91.47 0.00 null 2 -51085.86 94.89 0.00 noise + year 3 -51061.98 118.77 0.00
Ruby-crowned Kinglet Model k AIC ∆AIC wi
dB(A) + day + day² + year 5 -18815.17 0.00 0.54 noise X site + day + day² + year 7 -18814.26 0.91 0.34 day + year 3 -18811.63 3.54 0.09 day + day² + year 4 -18809.64 5.53 0.03 dB(A) + year 3 -18796.00 19.17 0.00 null 2 -18791.29 23.88 0.00 noise + year 3 -18790.75 24.42 0.00
White-crowned Sparrow Model k AIC ∆AIC wi
dB(A) + day + day² + year 5 -5867.00 0.00 0.55 noise X site + day + day² + year 7 -5865.11 1.90 0.21 day + year 3 -5863.93 3.07 0.12 day + day² + year 4 -5862.66 4.35 0.06 dB(A) + year 3 -5862.25 4.75 0.05 null 2 -5855.75 11.26 0.00 noise + year 3 -5854.89 12.11 0.00
Dark-eyed Junco Model k AIC ∆AIC wi
noise X site + day + day² + year 7 -4199.38 0.00 0.41 dB(A) + day + day² + year 5 -4199.15 0.23 0.36 day + year 3 -4197.27 2.11 0.14 day + day² + year 4 -4196.06 3.32 0.08 dB(A) + year 3 -4191.12 8.27 0.01 noise + year 3 -4189.59 9.79 0.00 null 2 -4186.87 12.51 0.00
57
Yellow-rumped Warbler Model k AIC ∆AIC wi
day + year 3 -3867.85 0.00 0.62 day + day² + year 4 -3866.02 1.83 0.25 dB(A) + day + day² + year 5 -3864.03 3.82 0.09 noise X site + day + day² + year 7 -3862.41 5.44 0.04 null 2 -3846.68 21.17 0.00 noise + year 3 -3845.00 22.85 0.00 dB(A) + year 3 -3844.68 23.17 0.00
Dusky Flycatcher Model k AIC ∆AIC wi
day + year 3 -3054.97 0.00 0.45 noise X site + day + day² + year 7 -3053.66 1.31 0.23 day + day² + year 4 -3053.21 1.76 0.19 dB(A) + day + day² + year 5 -3051.68 3.29 0.09 null 2 -3049.12 5.85 0.02 noise + year 3 -3048.29 6.68 0.02 dB(A) + year 3 -3047.51 7.46 0.01
Western Tanager Model k AIC ∆AIC wi
dB(A) + day + day² + year 5 -1670.06 0.00 0.50 day + day² + year 4 -1669.10 0.96 0.31 dB(A) + year 3 -1665.79 4.27 0.06 noise X site + day + day² + year 7 -1665.27 4.79 0.05 day + year 3 -1665.08 4.98 0.04 null 2 -1664.88 5.18 0.04 noise + year 3 -1662.93 7.13 0.01
Yellow Warbler Model k AIC ∆AIC wi
day + year 3 -2463.95 0.00 0.44 day + day² + year 4 -2463.59 0.36 0.37 dB(A) + day + day² + year 5 -2461.82 2.13 0.15 noise X site + day + day² + year 7 -2458.92 5.03 0.04 null 2 -2428.62 35.33 0.00 noise + year 3 -2427.63 36.33 0.00 dB(A) + year 3 -2426.65 37.30 0.00
58
Spotted Towhee Model k AIC ∆AIC wi
day + day² + year 4 -1492.68 0.00 0.32 noise X site + day + day² + year 7 -1492.65 0.03 0.31 dB(A) + day + day² + year 5 -1492.50 0.18 0.29 day + year 3 -1489.78 2.89 0.07 null 2 -1465.60 27.07 0.00 noise + year 3 -1464.32 28.36 0.00 dB(A) + year 3 -1463.96 28.72 0.00
Orange-crowned Warbler Model k AIC ∆AIC wi
day + year 3 -1906.38 0.00 0.56 day + day² + year 4 -1904.45 1.94 0.21 dB(A) + day + day² + year 5 -1902.49 3.89 0.08 null 2 -1902.11 4.27 0.07 noise + year 3 -1901.06 5.32 0.04 dB(A) + year 3 -1900.22 6.16 0.03 noise X site + day + day² + year 7 -1899.51 6.87 0.02
MacGillivray's Warbler Model k AIC ∆AIC wi
dB(A) + day + day² + year 5 -1711.34 0.00 0.60 day + year 3 -1708.63 2.71 0.15 day + day² + year 4 -1708.58 2.76 0.15 noise X site + day + day² + year 7 -1707.74 3.60 0.10 null 2 -1682.72 28.62 0.00 dB(A) + year 3 -1682.70 28.64 0.00 noise + year 3 -1682.02 29.32 0.00
Warbling Vireo Model k AIC ∆AIC wi
null 2 -1623.38 0.00 0.40 dB(A) + year 3 -1621.91 1.46 0.19 day + year 3 -1621.54 1.84 0.16 noise + year 3 -1621.43 1.95 0.15 day + day² + year 4 -1619.57 3.81 0.06 dB(A) + day + day² + year 5 -1618.06 5.31 0.03 noise X site + day + day² + year 7 -1616.59 6.79 0.01
59
Cassin's Vireo Model k AIC ∆AIC wi
noise X site + day + day² + year 7 -1094.87 0.00 0.87 day + year 3 -1089.20 5.67 0.05 day + day² + year 4 -1087.63 7.24 0.02 noise + year 3 -1087.33 7.55 0.02 null 2 -1087.05 7.83 0.02 dB(A) + day + day² + year 5 -1085.64 9.23 0.01 dB(A) + year 3 -1085.05 9.82 0.01
Hammond's Flycatcher Model k AIC ∆AIC wi
day + day² + year 4 -1140.84 0.00 0.46 day + year 3 -1139.07 1.77 0.19 dB(A) + day + day² + year 5 -1138.87 1.96 0.17 null 2 -1137.44 3.40 0.08 noise X site + day + day² + year 7 -1135.90 4.94 0.04 dB(A) + year 3 -1135.45 5.39 0.03 noise + year 3 -1135.44 5.39 0.03
Wilson's Warbler Model k AIC ∆AIC wi
day + day² + year 4 -1015.74 0.00 0.28 noise X site + day + day² + year 7 -1015.30 0.44 0.23 dB(A) + day + day² + year 5 -1014.98 0.77 0.19 day + year 3 -1013.96 1.79 0.12 null 2 -1013.16 2.59 0.08 noise + year 3 -1012.94 2.80 0.07 dB(A) + year 3 -1011.74 4.01 0.04
Nashville Warbler Model k AIC ∆AIC wi
day + year 3 -1003.66 0.00 0.60 day + day² + year 4 -1001.68 1.98 0.22 dB(A) + day + day² + year 5 -1000.03 3.63 0.10 null 2 -998.13 5.53 0.04 dB(A) + year 3 -996.57 7.09 0.02 noise X site + day + day² + year 7 -996.28 7.38 0.01 noise + year 3 -996.23 7.43 0.01
60
Townsend's Solitaire Model k AIC ∆AIC wi
null 2 -775.04 0.00 0.25 dB(A) + year 3 -774.97 0.08 0.24 day + year 3 -774.49 0.56 0.19 day + day² + year 4 -773.41 1.64 0.11 noise + year 3 -773.22 1.82 0.10 dB(A) + day + day² + year 5 -773.03 2.01 0.09 noise X site + day + day² + year 7 -768.25 6.79 0.01
Townsend's Warbler Model k AIC ∆AIC wi
day + year 3 -800.83 0.00 0.45 day + day² + year 4 -798.92 1.91 0.17 null 2 -798.23 2.60 0.12 dB(A) + day + day² + year 5 -797.80 3.03 0.10 dB(A) + year 3 -797.79 3.03 0.10 noise + year 3 -796.15 4.68 0.04 noise X site + day + day² + year 7 -793.07 7.75 0.01
Chipping Sparrow Model k AIC ∆AIC wi
day + year 3 -718.31 0.00 0.36 dB(A) + day + day² + year 5 -717.30 1.01 0.22 noise X site + day + day² + year 7 -717.06 1.26 0.19 day + day² + year 4 -716.75 1.56 0.17 null 2 -713.40 4.91 0.03 noise + year 3 -711.96 6.35 0.02 dB(A) + year 3 -711.92 6.40 0.01
American Robin Model k AIC ∆AIC wi
noise + year 3 -315.18 0.00 0.33 null 2 -315.04 0.14 0.31 dB(A) + year 3 -313.67 1.51 0.15 day + year 3 -313.06 2.11 0.11 day + day² + year 4 -311.68 3.50 0.06 dB(A) + day + day² + year 5 -310.12 5.05 0.03 noise X site + day + day² + year 7 -308.51 6.66 0.01
61
Hermit Thrush Model k AIC ∆AIC wi
day + year 3 -523.034 0 0.34822 day + day² + year 4 -521.769 1.2643 0.185061 null 2 -521.44 1.5937 0.156959 dB(A) + day + day² + year 5 -520.482 2.5521 0.097201 noise X site + day + day² + year 7 -520.013 3.0209 0.076891 noise + year 3 -519.863 3.1707 0.071342 dB(A) + year 3 -519.656 3.3777 0.064327
Cassin's Finch Model k AIC ∆AIC wi
dB(A) + day + day² + year 5 -589.958 0 0.27326 noise X site + day + day² + year 7 -589.589 0.3684 0.22729 dB(A) + year 3 -589.062 0.8953 0.174648 day + day² + year 4 -588.161 1.7963 0.111305 null 2 -587.781 2.1762 0.092049 day + year 3 -587.677 2.2805 0.087372 noise + year 3 -585.794 4.1637 0.034075
Table A.2 AIC model output results for stopover efficiency analysis.
All Species Model k AIC ∆AIC wi
dB(A) X minute + day + day² + year 7 -51270.02 0.00 0.57 day X minute + year 5 -51268.08 1.94 0.22 minute(day + day² )+ year 7 -51267.95 2.07 0.20 noise X site X minute + day + day² + year 11 -51261.53 8.49 0.01 dB(A) X minute + year 5 -51183.05 86.97 0.00 noise X minute + year 5 -51176.51 93.51 0.00 null 2 -51085.86 184.16 0.00
Ruby-crowned Kinglet Model k AIC ∆AIC wi
dB(A) X minute + day + day² + year 7 -18935.33 0.00 0.84 day X minute + year 5 -18931.44 3.89 0.12 noiseX site X minute + day + day² + year 11 -18928.16 7.17 0.02 minute(day + day² )+ year 7 -18928.03 7.30 0.02 dB(A) X minute + year 5 -18914.48 20.85 0.00 noise X minute + year 5 -18908.90 26.43 0.00 null 2 -18791.29 144.04 0.00
62
White-crowned Sparrow Model k AIC ∆AIC wi
dB(A) X minute + day + day² + year 7 -5874.79 0 0.5946 minute(day + day² )+ year 7 -5872.06 2.729 0.151925 day X minute + year 5 -5871.99 2.799 0.1467 noiseX site X minute + day + day² + year 11 -5870.16 4.631 0.058697 dB(A) X minute + year 5 -5869.69 5.092 0.046613 noise X minute + year 5 -5862.71 12.073 0.001421 null 2 -5855.75 19.04 4.36E-05
Dark-eyed Junco Model k AIC ∆AIC wi
dB(A) X minute + day + day² + year 7 -4225.93 0 0.4082 day X minute + year 5 -4225.62 0.308 0.349938 minute(day + day² )+ year 7 -4222.93 3.001 0.091036 noiseX site X minute + day + day² + year 11 -4222.57 3.357 0.076192 dB(A) X minute + year 5 -4221.44 4.488 0.043283 noise X minute + year 5 -4220.8 5.133 0.031351 null 2 -4186.87 39.059 1.35E-09
Yellow-rumped Warbler Model k AIC ∆AIC wi
day X minute + year 5 -3883.5 0 0.713255 minute(day + day² )+ year 7 -3879.72 3.783 0.107591 dB(A) X minute + day + day² + year 7 -3879.52 3.984 0.097304 noiseX site X minute + day + day² + year 11 -3879.17 4.332 0.081764 noise X minute + year 5 -3864.68 18.819 5.84E-05 dB(A) X minute + year 5 -3863.12 20.375 2.68E-05 null 2 -3846.68 36.815 7.23E-09
Dusky Flycatcher Model k AIC ∆AIC wi
day X minute + year 5 -3052.52 0 0.393163 dB(A) X minute + day + day² + year 7 -3051.6 0.919 0.248322 minute(day + day² )+ year 7 -3050.35 2.171 0.132784 noiseX site X minute + day + day² + year 11 -3049.85 2.674 0.103257 null 2 -3049.12 3.406 0.071609 dB(A) X minute + year 5 -3047.23 5.29 0.027917 noise X minute + year 5 -3046.84 5.682 0.022948
63
Western Tanager Model k AIC ∆AIC wi
dB(A) X minute + day + day² + year 7 -1669.27 0 0.643712 minute(day + day² )+ year 7 -1666.41 2.853 0.154586 null 2 -1664.88 4.389 0.071719 dB(A) X minute + year 5 -1663.99 5.279 0.045959 day X minute + year 5 -1663.33 5.935 0.033107 noise X minute + year 5 -1662.9 6.371 0.026622 noiseX site X minute + day + day² + year 11 -1662.71 6.554 0.024295
Yellow Warbler Model k AIC ∆AIC wi
minute(day + day² )+ year 7 -2480.03 0 0.993151 day X minute + year 5 -2469.37 10.658 0.004816 dB(A) X minute + day + day² + year 7 -2467.47 12.56 0.001861 noiseX site X minute + day + day² + year 11 -2462.72 17.311 0.000173 noise X minute + year 5 -2429.59 50.439 1.11E-11 dB(A) X minute + year 5 -2429.58 50.447 1.1E-11 null 2 -2428.62 51.411 6.81E-12
Spotted Towhee Model k AIC ∆AIC wi
noiseX site X minute + day + day² + year 11 -1492.57 0 0.794264 dB(A) X minute + day + day² + year 7 -1488.92 3.65 0.128049 minute(day + day² )+ year 7 -1486.92 5.656 0.046966 day X minute + year 5 -1486.07 6.505 0.03072 null 2 -1465.6 26.969 1.11E-06 noise X minute + year 5 -1463.31 29.265 3.51E-07 dB(A) X minute + year 5 -1460.28 32.293 7.72E-08
Orange-crowned Warbler Model k AIC ∆AIC wi
day X minute + year 5 -1906.36 0 0.727415 minute(day + day² )+ year 7 -1902.46 3.901 0.103441 null 2 -1902.11 4.255 0.08666 dB(A) X minute + day + day² + year 7 -1900 6.361 0.030235 noise X minute + year 5 -1899.46 6.902 0.023069 noiseX site X minute + day + day² + year 11 -1898.89 7.475 0.017322 dB(A) X minute + year 5 -1898.13 8.233 0.011858
64
MacGillivray's Warbler Model k AIC ∆AIC wi
dB(A) X minute + day + day² + year 7 -1720.25 0 0.872978 day X minute + year 5 -1714.83 5.423 0.057998 noise X site X minute + day + day² + year 11 -1714.29 5.962 0.044297 minute(day + day² )+ year 7 -1713.12 7.128 0.024727 dB(A) X minute + year 5 -1689.71 30.545 2.03E-07 noise X minute + year 5 -1689.08 31.171 1.49E-07 null 2 -1682.72 37.529 6.19E-09
Warbling Vireo Model k AIC ∆AIC wi
dB(A) X minute + year 5 -1624.28 0 0.340729 null 2 -1623.38 0.906 0.216608 day X minute + year 5 -1622.93 1.349 0.173571 noise X minute + year 5 -1622.93 1.352 0.173311 dB(A) X minute + day + day² + year 7 -1621.03 3.249 0.067127 minute(day + day² )+ year 7 -1619.11 5.176 0.025613 noise X site X minute + day + day² + year 11 -1614.85 9.438 0.003041
Cassin's Vireo Model k AIC ∆AIC wi
noise X site X minute + day + day² + year 11 -1100.18 0 0.454453 day X minute + year 5 -1099.28 0.903 0.289338 minute(day + day² )+ year 7 -1096.83 3.353 0.084995 noise X minute + year 5 -1096.7 3.489 0.079408 dB(A) X minute + day + day² + year 7 -1095.95 4.23 0.054822 dB(A) X minute + year 5 -1095.13 5.052 0.036346 null 2 -1087.05 13.139 0.000637
Hammond's Flycatcher Model k AIC ∆AIC wi
null 2 -1137.44 0 0.31947 minute(day + day² )+ year 7 -1136.94 0.495 0.249426 day X minute + year 5 -1136.89 0.546 0.243146 dB(A) X minute + day + day² + year 7 -1135.64 1.795 0.130212 dB(A) X minute + year 5 -1132.59 4.85 0.028266 noise X minute + year 5 -1132.29 5.152 0.024305 noise X site X minute + day + day² + year 11 -1129.19 8.246 0.005174
65
Wilson's Warbler Model k AIC ∆AIC wi
minute(day + day² )+ year 7 -1015.4 0 0.329316 dB(A) X minute + day + day² + year 7 -1014.68 0.72 0.229756 day X minute + year 5 -1014.13 1.266 0.174865 null 2 -1013.16 2.24 0.107449 noise X site X minute + day + day² + year 11 -1012.88 2.513 0.093739 dB(A) X minute + year 5 -1011.07 4.33 0.037789 noise X minute + year 5 -1010.4 4.996 0.027086
Nashville Warbler Model k AIC ∆AIC wi
day X minute + year 5 -1006.02 0 0.617357 minute(day + day² )+ year 7 -1003.47 2.5434 0.173079 dB(A) X minute + day + day² + year 7 -1001.82 4.1993 0.075626 noise X minute + year 5 -1001.45 4.5719 0.062771 dB(A) X minute + year 5 -1001.27 4.7505 0.057409 null 2 -998.131 7.8869 0.011965 noise X site X minute + day + day² + year 11 -994.334 11.683 0.001793
Townsend's Solitaire Model k AIC ∆AIC wi
day X minute + year 5 -776.613 0 0.349795 dB(A) X minute + year 5 -775.762 0.8506 0.228617 null 2 -775.043 1.5693 0.159604 dB(A) X minute + day + day² + year 7 -774.311 2.3013 0.110686 noise X minute + year 5 -773.48 3.133 0.073028 minute(day + day² )+ year 7 -773.461 3.1521 0.072334 noise X site X minute + day + day² + year 11 -768.46 8.1529 0.005935
Townsend's Warbler Model k AIC ∆AIC wi
day X minute + year 5 -799.693 0 0.337532 dB(A) X minute + year 5 -798.55 1.143 0.190597 null 2 -798.227 1.4664 0.16214 noise X minute + year 5 -797.481 2.2119 0.111688 minute(day + day² )+ year 7 -797.31 2.3834 0.10251 dB(A) X minute + day + day² + year 7 -797.081 2.612 0.091438 noise X site X minute + day + day² + year 11 -790.869 8.8237 0.004095
66
Chipping Sparrow Model k AIC ∆AIC wi
day X minute + year 5 -722.328 0 0.468486 dB(A) X minute + day + day² + year 7 -721.133 1.1953 0.257716 minute(day + day² )+ year 7 -720.594 1.7344 0.196823 noise X site X minute + day + day² + year 11 -717.811 4.5171 0.048958 dB(A) X minute + year 5 -715.114 7.2145 0.012708 noise X minute + year 5 -714.618 7.7107 0.009916 null 2 -713.399 8.9289 0.005393
American Robin Model k AIC ∆AIC wi
null 2 -315.036 0 0.34235 day X minute + year 5 -314.433 0.6033 0.253201 minute(day + day² )+ year 7 -313.521 1.5149 0.160514 noise X minute + year 5 -313.149 1.8866 0.133291 dB(A) X minute + year 5 -312.44 2.5956 0.093507 dB(A) X minute + day + day² + year 7 -308.979 6.0573 0.016563 noise X site X minute + day + day² + year 11 -302.257 12.7792 0.000575
Hermit Thrush Model k AIC ∆AIC wi
null 2 -521.44 0 0.476845 day X minute + year 5 -519.753 1.687 0.20514 minute(day + day² )+ year 7 -519.732 1.7081 0.202987 dB(A) X minute + day + day² + year 7 -516.74 4.7 0.045476 noise X minute + year 5 -515.871 5.569 0.02945 dB(A) X minute + year 5 -515.7 5.7395 0.027043 noise X site X minute + day + day² + year 11 -514.245 7.1954 0.013059
Cassin's Finch Model k AIC ∆AIC wi
dB(A) X minute + day + day² + year 7 -590.127 0 0.532096 dB(A) X minute + year 5 -588.234 1.8938 0.206422 null 2 -587.781 2.346 0.16465 minute(day + day² )+ year 7 -584.84 5.2879 0.037821 day X minute + year 5 -584.679 5.4483 0.034907 noise X minute + year 5 -582.626 7.5018 0.012502 noise X site X minute + day + day² + year 11 -582.476 7.6515 0.011601
67
Table A.3 AIC model output results for capture rate analysis.
All Species Model k AIC ∆AIC wi
noise X site + day + day² + year
-121739.60 0.00 0.97 dB(A) + day + day² + year
-121732.40 7.20 0.03
day + day² + year
-121728.00 11.60 0.00 day + year
-121718.50 21.10 0.00
noise X site + year
-121660.80 78.80 0.00 dB(A) + year
-121653.60 86.00 0.00
noise + year
-121649.00 90.60 0.00 null
-121647.6 92 1.02E-20
Ruby-crowned Kinglet Model k AIC ∆AIC wi
noise X site + day + day² + year 9 4241.82 0.00 0.79 day + day² + year 6 4245.46 3.64 0.13 dB(A) + day + day² + year 7 4246.45 4.63 0.08 day + year 5 4317.38 75.57 0.00 noise X site + year 7 4523.72 281.90 0.00 dB(A) + year 5 4527.71 285.89 0.00 null 4 4528.53 286.71 0.00 noise + year 5 4528.893 287.078 3.64E-63
White-crowned Sparrow Model k AIC ∆AIC wi
day + day² + year 6 -1386.557 0 0.529979 dB(A) + day + day² + year 7 -1386.099 0.458 0.421508 noise X site + day + day² + year 9 -1381.775 4.782 0.048513 day + year 5 -1344.032 42.525 3.09E-10 null 4 -1317.029 69.528 4.23E-16 dB(A) + year 5 -1315.696 70.861 2.17E-16 noise + year 5 -1315.124 71.433 1.63E-16 noise X site + year 7 -1312.17 74.387 3.73E-17
Dark-eyed Junco Model k AIC ∆AIC wi
day + day² + year 6 -3748.552 0 0.521856 noise X site + day + day² + year 9 -3747.349 1.203 0.285971 dB(A) + day + day² + year 7 -3746.554 1.998 0.192172 day + year 5 -3680.84 67.712 1.03E-15 null 4 -3496.428 252.124 9.32E-56 dB(A) + year 5 -3494.85 253.702 4.24E-56
68
noise + year 5 -3494.508 254.044 3.57E-56 noise X site + year 7 -3492.91 255.642 1.61E-56
Yellow-rumped Warbler Model k AIC ∆AIC wi
day + day² + year 6 -5738.339 0 0.316208 dB(A) + day + day² + year 7 -5738.321 0.018 0.313375 noise X site + day + day² + year 9 -5737.667 0.672 0.225969 day + year 5 -5736.153 2.186 0.105996 null 4 -5732.305 6.034 0.015478 dB(A) + year 5 -5731.954 6.385 0.012986 noise X site + year 7 -5731.429 6.91 0.009988 noise + year 5 -5730.43 7.909 0.006061
Dusky Flycatcher Model k AIC ∆AIC wi
noise X site + day + day² + year 9 -10363.08 0 0.941261 dB(A) + day + day² + year 7 -10356.41 6.67 0.033523 day + day² + year 6 -10355.84 7.24 0.025209 day + year 5 -10339.4 23.68 6.79E-06 noise X site + year 7 -10104.94 258.14 8.3E-57 noise + year 5 -10104.21 258.87 5.77E-57 dB(A) + year 5 -10097.68 265.4 2.2E-58 null 4 -10096.75 266.33 1.38E-58
Western Tanager Model k AIC ∆AIC wi
day + day² + year 6 -5496.723 0 0.513612 noise X site + day + day² + year 9 -5495.388 1.335 0.263478 dB(A) + day + day² + year 7 -5495.039 1.684 0.221289 day + year 5 -5485.206 11.517 0.001621 null 4 -5459.489 37.234 4.22E-09 noise + year 5 -5458.925 37.798 3.18E-09 dB(A) + year 5 -5458.221 38.502 2.24E-09 noise X site + year 7 -5456.57 40.153 9.81E-10
Yellow Warbler Model k AIC ∆AIC wi
day + day² + year 6 -9632.233 0 0.673848 dB(A) + day + day² + year 7 -9630.365 1.868 0.264808 noise X site + day + day² + year 9 -9627.44 4.793 0.061344 day + year 5 -9579.675 52.558 2.6E-12
69
null 4 -9349.902 282.331 3.32E-62 dB(A) + year 5 -9348.424 283.809 1.59E-62 noise + year 5 -9348.151 284.082 1.38E-62 noise X site + year 7 -9345.328 286.905 3.37E-63
Spotted Towhee Model k AIC ∆AIC wi
dB(A) + day + day² + year 7 -11871.91 0 0.641802 day + day² + year 6 -11870.48 1.43 0.313965 noise X site + day + day² + year 9 -11866.56 5.35 0.044225 day + year 5 -11849.49 22.42 8.69E-06 dB(A) + year 5 -11812.95 58.96 1.01E-13 null 4 -11812.86 59.05 9.66E-14 noise + year 5 -11811.05 60.86 3.91E-14 noise X site + year 7 -11809.05 62.86 1.44E-14
Orange-crowned Warbler Model k AIC ∆AIC wi
noise X site + day + day² + year 9 -12375 0 0.61388 dB(A) + day + day² + year 7 -12372.76 2.24 0.200297 day + day² + year 6 -12372.61 2.39 0.185824 null 4 -12329.39 45.61 7.66E-11 noise + year 5 -12329.16 45.84 6.82E-11 noise X site + year 7 -12328.86 46.14 5.87E-11 dB(A) + year 5 -12328.38 46.62 4.62E-11 day + year 5 -12328.2 46.8 4.22E-11
MacGillivray's Warbler Model k AIC ∆AIC wi
day + day² + year 6 -13059.41 0 0.627627 dB(A) + day + day² + year 7 -13058.02 1.39 0.313233 noise X site + day + day² + year 9 -13054.65 4.76 0.058087 day + year 5 -13046.63 12.78 0.001053 null 4 -12863.21 196.2 1.56E-43 dB(A) + year 5 -12862.04 197.37 8.7E-44 noise + year 5 -12861.39 198.02 6.28E-44 noise X site + year 7 -12858.56 200.85 1.53E-44
Warbling Vireo Model k AIC ∆AIC wi
day + day² + year 6 -11895.10 0.00 0.54 noise X site + day + day² + year 9 -11893.60 1.50 0.25
70
dB(A) + day + day² + year 7 -11893.10 2.00 0.20 day + year 5 -11887.05 8.05 0.01 noise + year 5 -11826.04 69.06 0.00 null 4 -11824.79 70.31 0.00 noise X site + year 7 -11824.75 70.35 0.00 dB(A) + year 5 -11822.86 72.24 0.00
Cassin's Vireo Model k AIC ∆AIC wi
day + day² + year 6 -14579.84 0 0.55744 dB(A) + day + day² + year 7 -14578.81 1.03 0.333071 noise X site + day + day² + year 9 -14575.93 3.91 0.078914 null 4 -14572.37 7.47 0.013308 dB(A) + year 5 -14570.95 8.89 0.006543 day + year 5 -14570.64 9.2 0.005603 noise + year 5 -14570.46 9.38 0.005121 noise X site + year 7 -14568.54 11.3 0.001961
Hammond's Flycatcher Model k AIC ∆AIC wi
noise X site + day + day² + year 9 -16111.58 0 0.718425 day + day² + year 6 -16109.03 2.55 0.20075 dB(A) + day + day² + year 7 -16107.21 4.37 0.080807 noise X site + year 7 -16089.14 22.44 9.63E-06 null 4 -16087.67 23.91 4.62E-06 noise + year 5 -16085.99 25.59 1.99E-06 day + year 5 -16085.69 25.89 1.72E-06 dB(A) + year 5 -16085.68 25.9 1.71E-06
Wilson's Warbler Model k AIC ∆AIC wi
noise X site + day + day² + year 9 -16362.14 0 0.678254 dB(A) + day + day² + year 7 -16360.16 1.98 0.252023 day + day² + year 6 -16357.59 4.55 0.069722 day + year 5 -16325.39 36.75 7.1E-09 noise + year 5 -16313 49.14 1.45E-11 dB(A) + year 5 -16310.2 51.94 3.57E-12 noise X site + year 7 -16309.36 52.78 2.35E-12 null 4 -16309.32 52.82 2.3E-12
71
Nashville Warbler Model k AIC ∆AIC wi
day + year 5 -14961.77 0 0.471212 day + day² + year 6 -14960.8 0.97 0.290124 dB(A) + day + day² + year 7 -14960.05 1.72 0.199399 noise X site + day + day² + year 9 -14956.8 4.97 0.039264 null 4 -14919.73 42.04 3.5E-10 dB(A) + year 5 -14918.7 43.07 2.09E-10 noise + year 5 -14917.99 43.78 1.47E-10 noise X site + year 7 -14915.44 46.33 4.1E-11
Townsend's Solitaire Model k AIC ∆AIC wi
day + day² + year 6 -13636.33 0 0.459105 day + year 5 -13635.5 0.83 0.303165 dB(A) + day + day² + year 7 -13634.65 1.68 0.1982 noise X site + day + day² + year 9 -13631.42 4.91 0.03942 null 4 -13618.35 17.98 5.72E-05 noise + year 5 -13616.83 19.5 2.68E-05 dB(A) + year 5 -13616.75 19.58 2.57E-05 noise X site + year 7 -13613.6 22.73 5.32E-06
Townsend's Warbler Model k AIC ∆AIC wi
day + day² + year 6 -13463.09 0 0.420621 day + year 5 -13461.55 1.54 0.194753 dB(A) + day + day² + year 7 -13461.11 1.98 0.156293 noise X site + day + day² + year 9 -13459.78 3.31 0.080377 null 4 -13459.67 3.42 0.076076 noise + year 5 -13458.57 4.52 0.043892 dB(A) + year 5 -13457.67 5.42 0.027987 noise X site + year 7 -13455.78 7.31 0.010878
Chipping Sparrow Model k AIC ∆AIC wi
day + day² + year 6 -15817.23 0 0.476263 dB(A) + day + day² + year 7 -15815.79 1.44 0.231822 day + year 5 -15815.61 1.62 0.21187 noise X site + day + day² + year 9 -15812.2 5.03 0.038512 null 4 -15811 6.23 0.021136 dB(A) + year 5 -15809.79 7.44 0.011542 noise + year 5 -15809.26 7.97 0.008855
72
noise X site + year 7 -15805.62 11.61 0.001435
American Robin Model k AIC ∆AIC wi
dB(A) + day + day² + year 7 -15527.37 0 0.986455 dB(A) + year 5 -15517.25 10.12 0.00626 day + day² + year 6 -15516.47 10.9 0.004238 day + year 5 -15514.85 12.52 0.001885 noise X site + day + day² + year 9 -15513.77 13.6 0.001099 null 4 -15507.19 20.18 4.09E-05 noise + year 5 -15506.01 21.36 2.27E-05 noise X site + year 7 -15504.1 23.27 8.73E-06
Hermit Thrush Model k AIC ∆AIC wi
day + day² + year 6 -17289.49 0 0.600972 dB(A) + day + day² + year 7 -17288.25 1.24 0.32329 noise X site + day + day² + year 9 -17285.07 4.42 0.065927 day + year 5 -17281.26 8.23 0.009811 null 4 -17240.58 48.91 1.44E-11 dB(A) + year 5 -17238.91 50.58 6.25E-12 noise + year 5 -17238.84 50.65 6.03E-12 noise X site + year 7 -17235.4 54.09 1.08E-12
Cassin's Finch Model k AIC ∆AIC wi
dB(A) + day + day² + year 7 -15038.74 0 0.876229 day + day² + year 6 -15034.39 4.35 0.099547 noise X site + day + day² + year 9 -15031.53 7.21 0.023822 day + year 5 -15022.06 16.68 0.000209 dB(A) + year 5 -15021.38 17.36 0.000149 null 4 -15018.24 20.5 3.1E-05 noise + year 5 -15016.38 22.36 1.22E-05 noise X site + year 7 -15015.49 23.25 7.83E-06
73
Table A.4 AIC model output results for foraging and vigilance analysis
Foraging: head down duration (sec) Model k AIC ∆AIC wi