Traffic Related Nanoparticles: Results of an On-Road Exposure study. Hinds, William 1 ; Zhu, Y 1 ; and Cascio, W 2 . 1 UCLA, Los Angeles, California, USA 2 East Carolina University, Greenville, North Carolina, USA Summary In urban areas the biggest and most widespread source of nanoparticles is motor vehicles, particularly on limited access, multi-lane highways (freeways). Typical daily commuters on these highways get the majority of their exposure to nanoparticles during their highway travel. Solid nanoparticles deposit in the alveolar region of the lungs and may translocate to the bloodstream and other organs including the cardiovascular system. They can penetrate cell membranes as intact particles and damage cell organelles. Concentrated ambient ultrafine particles (diameter <100 nm) are associated with pulmonary and cardiovascular effects. A recent study found that the relative risk of myocardial infarction (MI) was increased two to threefold by time spent in traffic one or two hours prior to the MI onset compared with control periods (Peters, 2004). These considerations led us to undertake a human subject study of short-term cardiovascular response to 2-hour exposures to freeway air on a diesel vehicle dominated (I-710) and a gasoline vehicle dominated (I-405) interstate highways in the Los Angeles area. A nine- passenger van was modified with a high-efficiency (HEPA) filtration system that delivered filtered or unfiltered air to a two-person exposure chamber inside the van. Nineteen volunteer subjects (average age 71 years) rode for two hours exposed at different times to filtered and unfiltered air on each freeway. Double-blind cardiovascular health assessments included 24- hour ambulatory ECG for the assessment of heart rate variability and heart rhythm; blood pressure, lung function, and blood biochemistry to assess systemic inflammatory markers (fibrinogen, IL-6, CRP, MPO, MCP-1); vascular response or injury (sE-selectin, VEGF, sVCAM, sICAM, MMP9, MPO, t-PAI-1), and myocardial response to hemodynamic changes (NT-proBNP). The van was equipped with on-board instruments included those for measuring in near real- time particle size distributions (8-290 nm), number concentration, PM 2.5 and PM 10 mass concentrations, elemental carbon, particle PAHs, NOx, CO, and CO 2 . Van speed and position was recorded by a GPS and type and frequency of nearby vehicles by a wide-angle camcorder. Instruments were powered by 230 kg (500 lb) of deep-cycle, gel-type marine batteries and a pure sine wave inverter. Ultrafine particle concentrations were significantly higher on the diesel dominated freeway than the gasoline dominated freeway (Zhu et al, 2008). Mean unfiltered particle number concentration was 107,500 and 77,800 particles/cm 3 and mean PM 2.5 mass concentration was 51.4 and 44.5 μg/m 3 for I-710 and I-405 freeways respectively. Ultrafine particle concentrations increased with the number of nearby heavy duty diesel trucks, Figure 1. The ratio of ultrafine particles to total particles was higher on the diesel dominated freeway than the gasoline dominated highway. Traffic moving at 64-80 km/hr (40-50 mph) gave the highest ultrafine particle concentrations. As shown in Figure 2, the particle size distribution on the diesel dominated highway showed a pronounced peak at 20 nm and a submerged peak at 70 nm; on I-405 both peaks are submerged in a broad distribution from 10 to 200 nm.
Transcript
Traffic Related Nanoparticles: Results of an On-Road Exposure study. Hinds, William1; Zhu, Y1; and Cascio, W2.
1 UCLA, Los Angeles, California, USA 2 East Carolina University, Greenville, North Carolina, USA
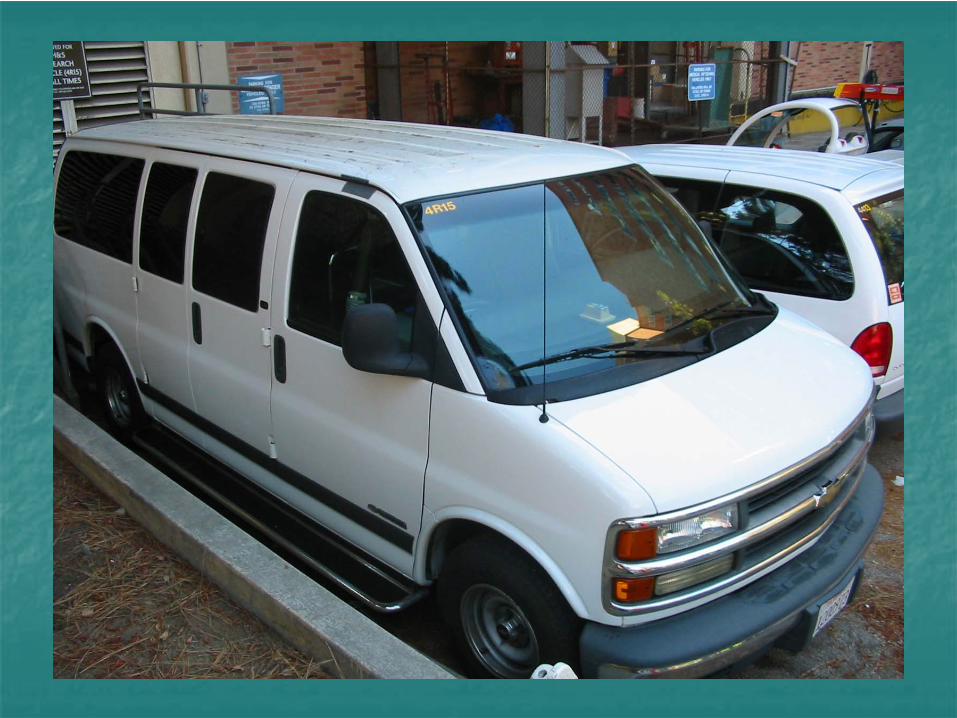
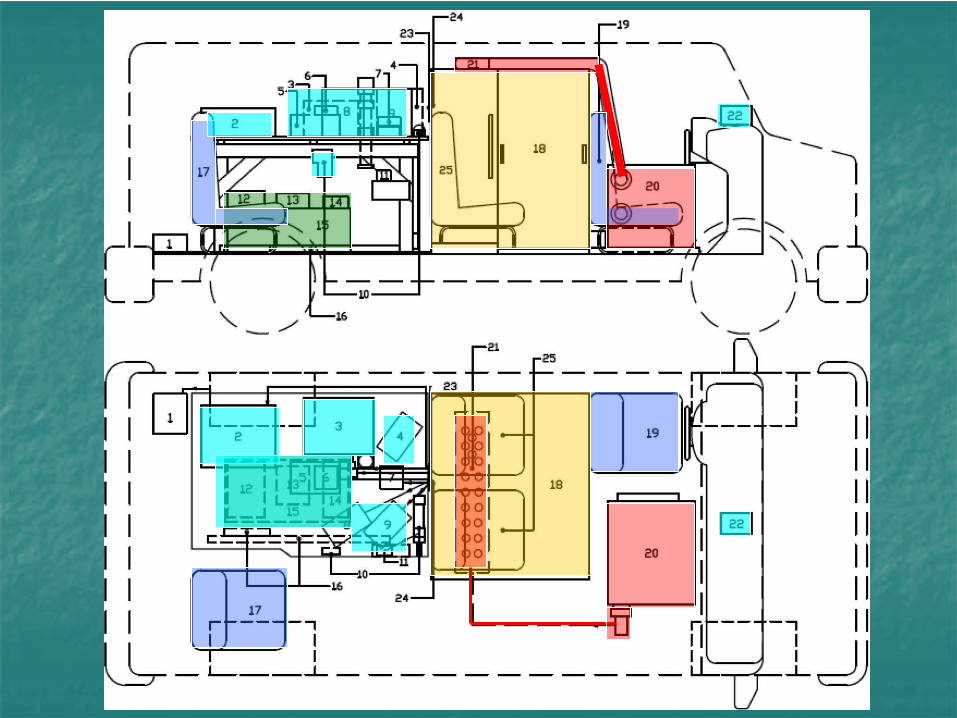
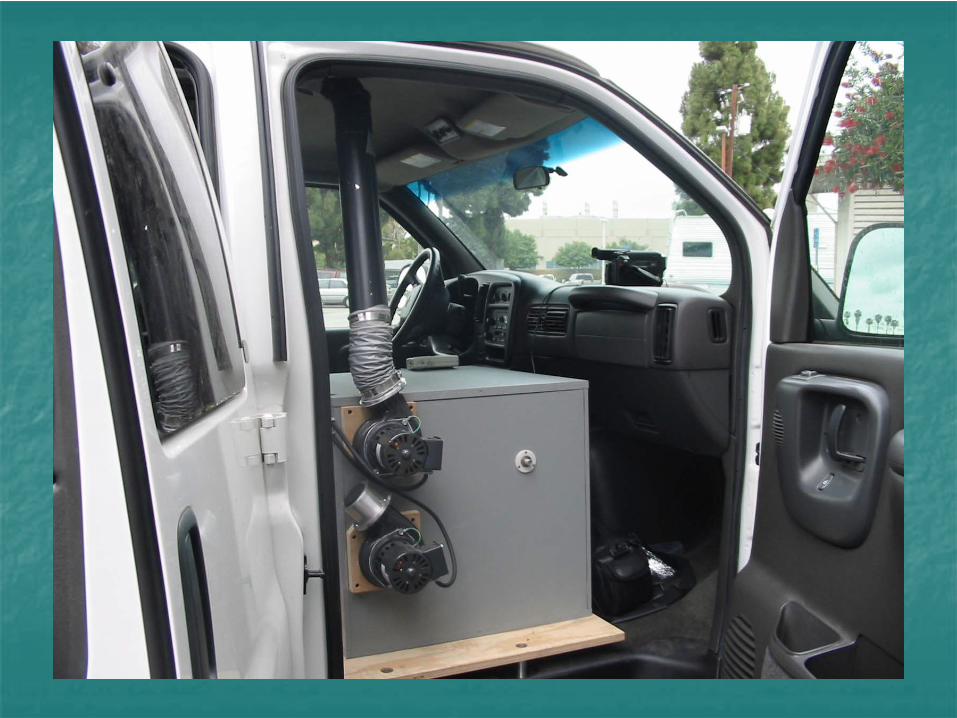
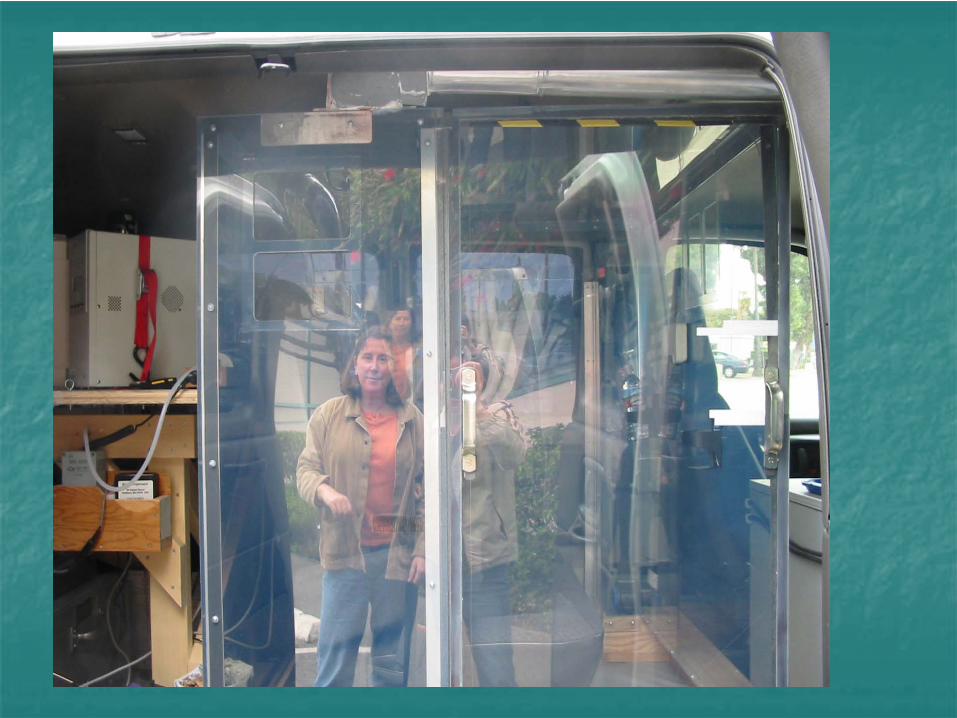
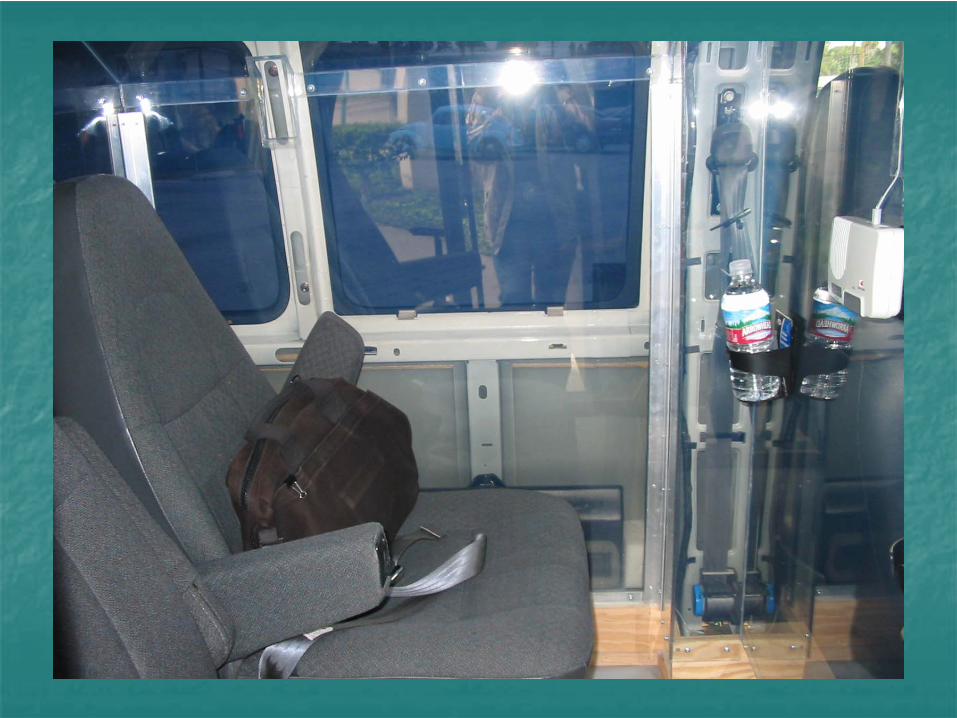
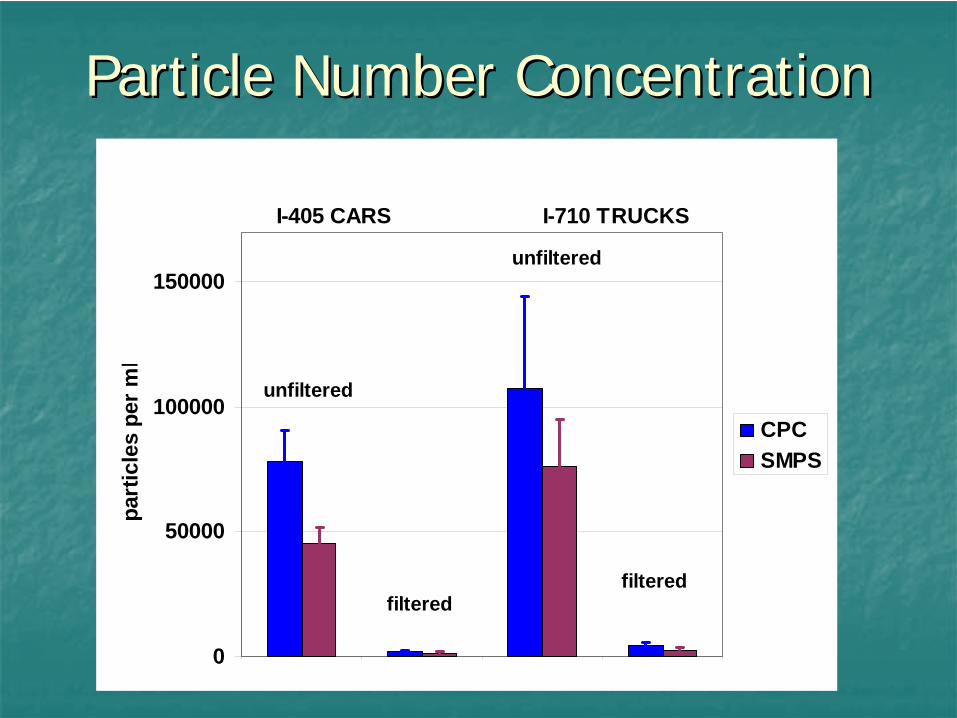
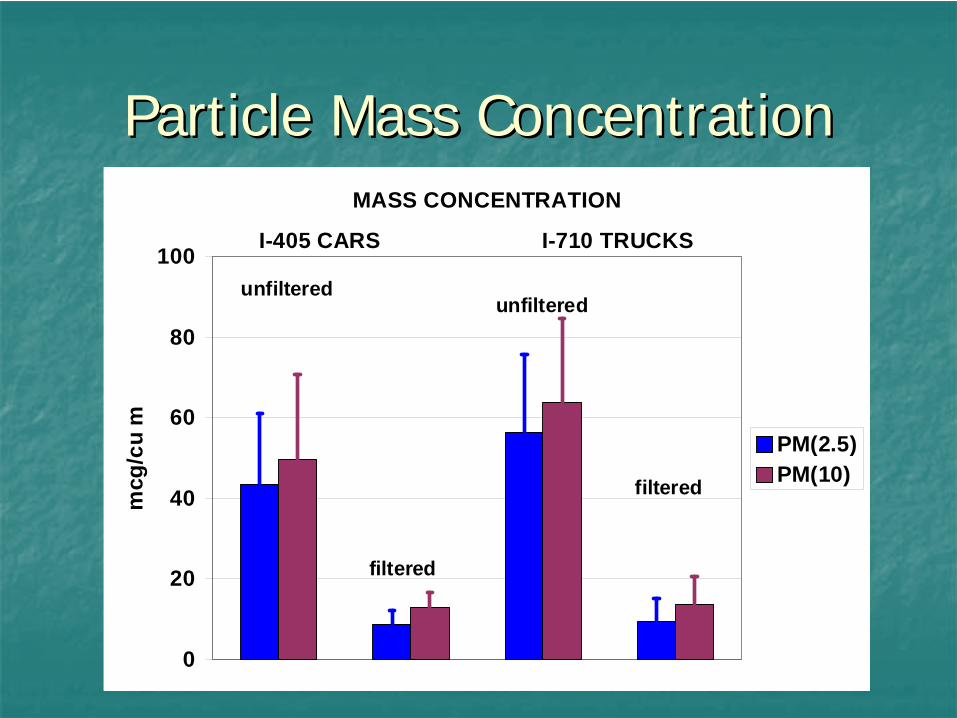
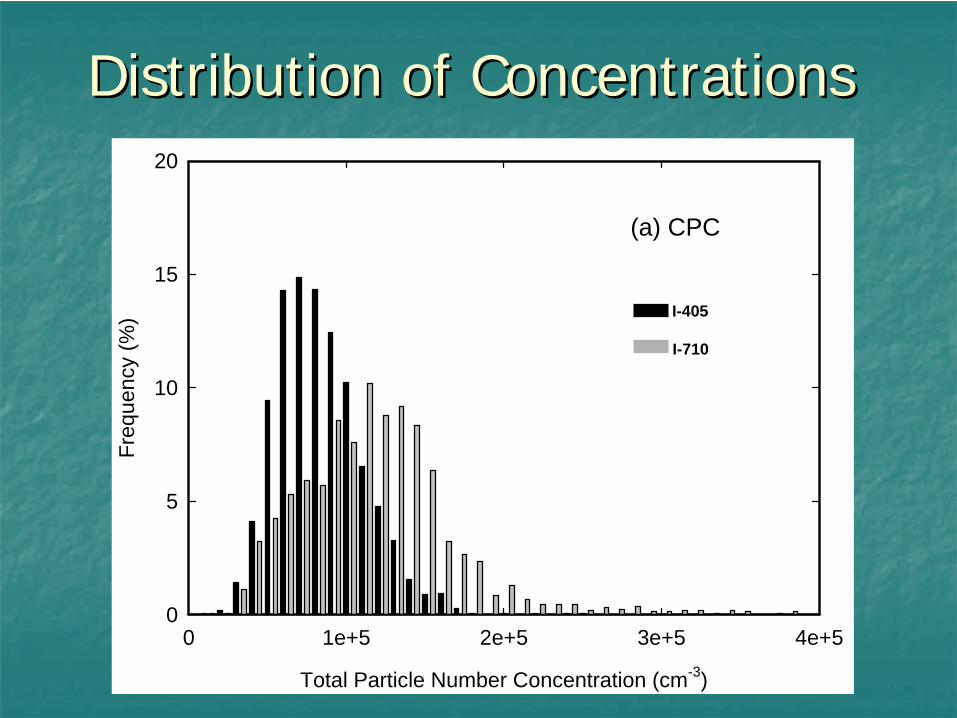
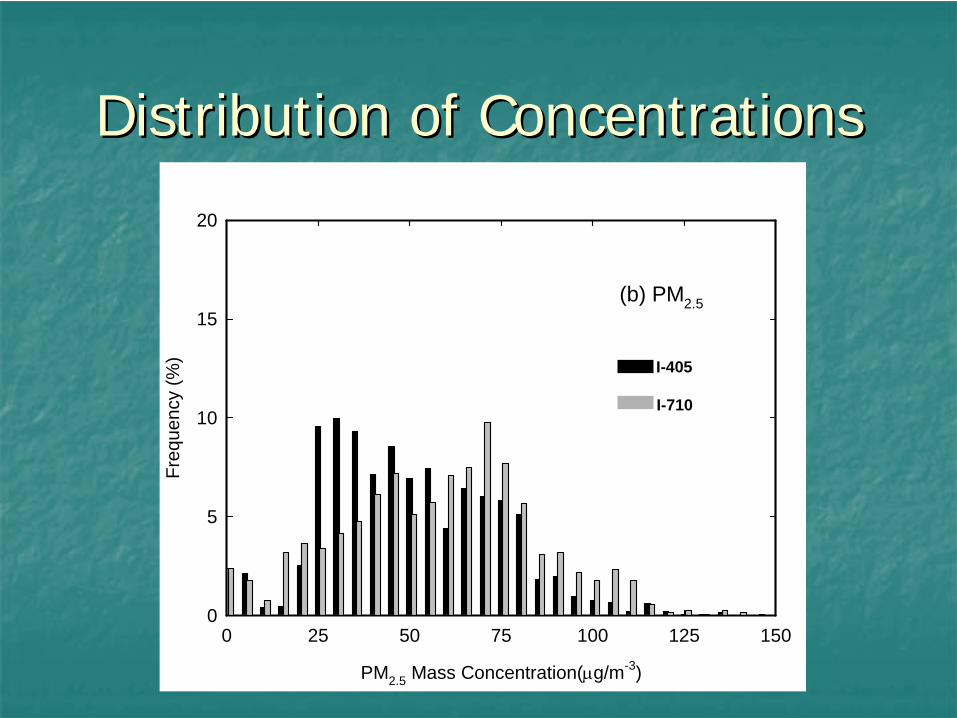
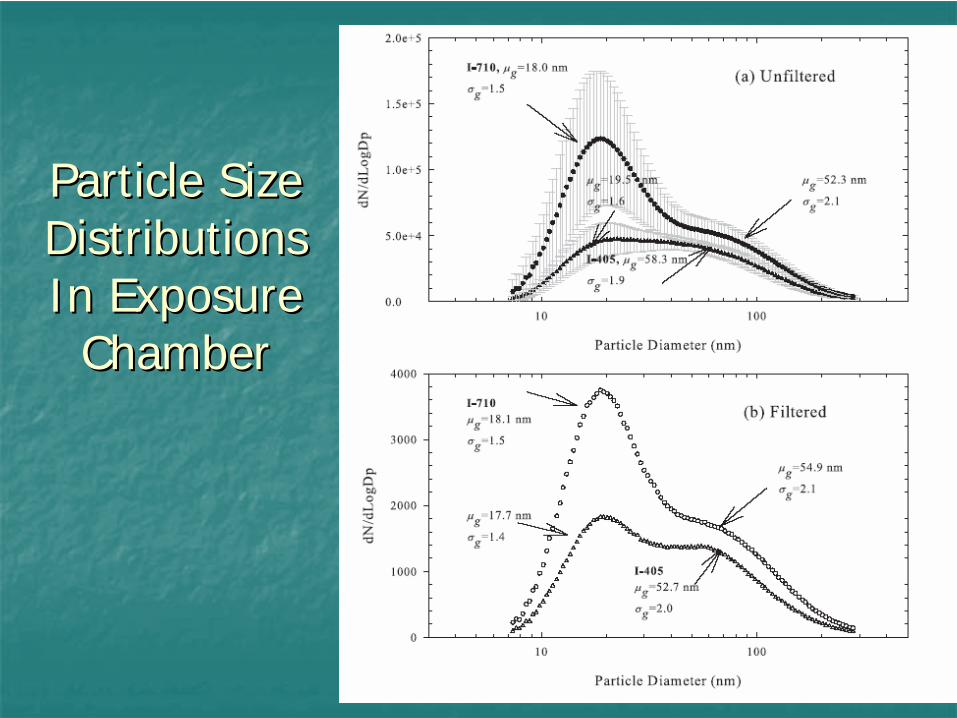
Summary In urban areas the biggest and most widespread source of nanoparticles is motor vehicles, particularly on limited access, multi-lane highways (freeways). Typical daily commuters on these highways get the majority of their exposure to nanoparticles during their highway travel. Solid nanoparticles deposit in the alveolar region of the lungs and may translocate to the bloodstream and other organs including the cardiovascular system. They can penetrate cell membranes as intact particles and damage cell organelles. Concentrated ambient ultrafine particles (diameter <100 nm) are associated with pulmonary and cardiovascular effects. A recent study found that the relative risk of myocardial infarction (MI) was increased two to threefold by time spent in traffic one or two hours prior to the MI onset compared with control periods (Peters, 2004). These considerations led us to undertake a human subject study of short-term cardiovascular response to 2-hour exposures to freeway air on a diesel vehicle dominated (I-710) and a gasoline vehicle dominated (I-405) interstate highways in the Los Angeles area. A nine-passenger van was modified with a high-efficiency (HEPA) filtration system that delivered filtered or unfiltered air to a two-person exposure chamber inside the van. Nineteen volunteer subjects (average age 71 years) rode for two hours exposed at different times to filtered and unfiltered air on each freeway. Double-blind cardiovascular health assessments included 24-hour ambulatory ECG for the assessment of heart rate variability and heart rhythm; blood pressure, lung function, and blood biochemistry to assess systemic inflammatory markers (fibrinogen, IL-6, CRP, MPO, MCP-1); vascular response or injury (sE-selectin, VEGF, sVCAM, sICAM, MMP9, MPO, t-PAI-1), and myocardial response to hemodynamic changes (NT-proBNP). The van was equipped with on-board instruments included those for measuring in near real-time particle size distributions (8-290 nm), number concentration, PM2.5 and PM10 mass concentrations, elemental carbon, particle PAHs, NOx, CO, and CO2. Van speed and position was recorded by a GPS and type and frequency of nearby vehicles by a wide-angle camcorder. Instruments were powered by 230 kg (500 lb) of deep-cycle, gel-type marine batteries and a pure sine wave inverter. Ultrafine particle concentrations were significantly higher on the diesel dominated freeway than the gasoline dominated freeway (Zhu et al, 2008). Mean unfiltered particle number concentration was 107,500 and 77,800 particles/cm3 and mean PM2.5 mass concentration was 51.4 and 44.5 μg/m3
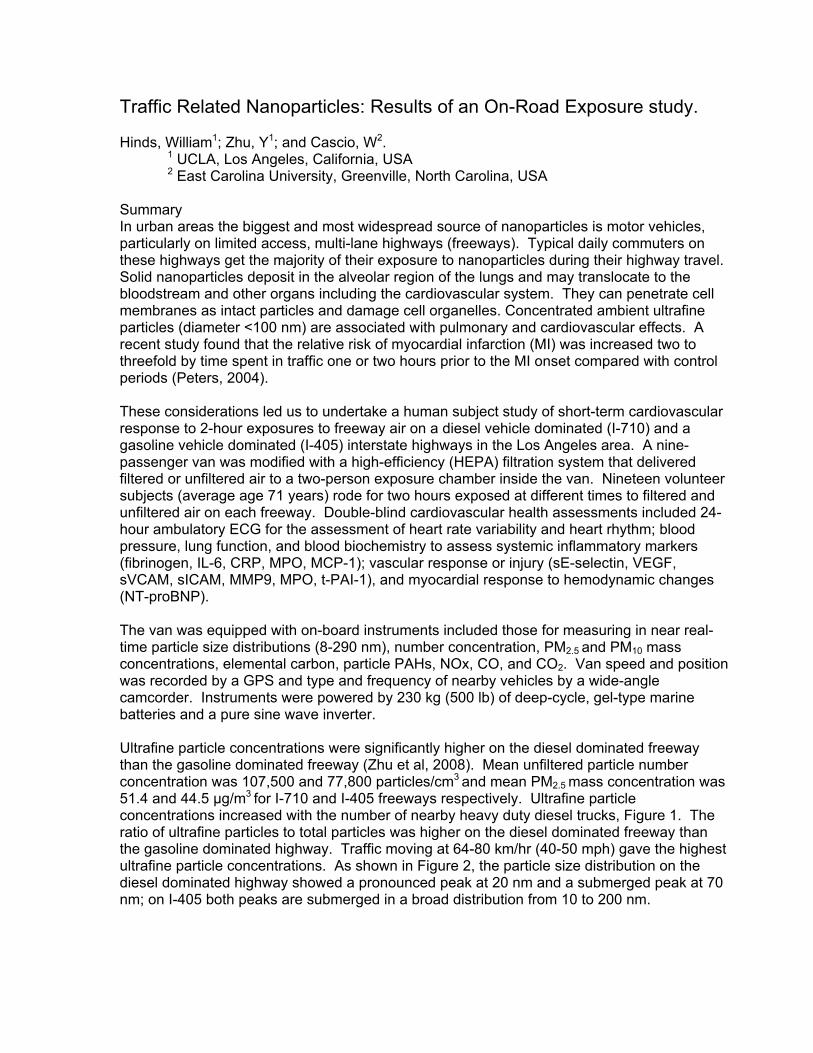
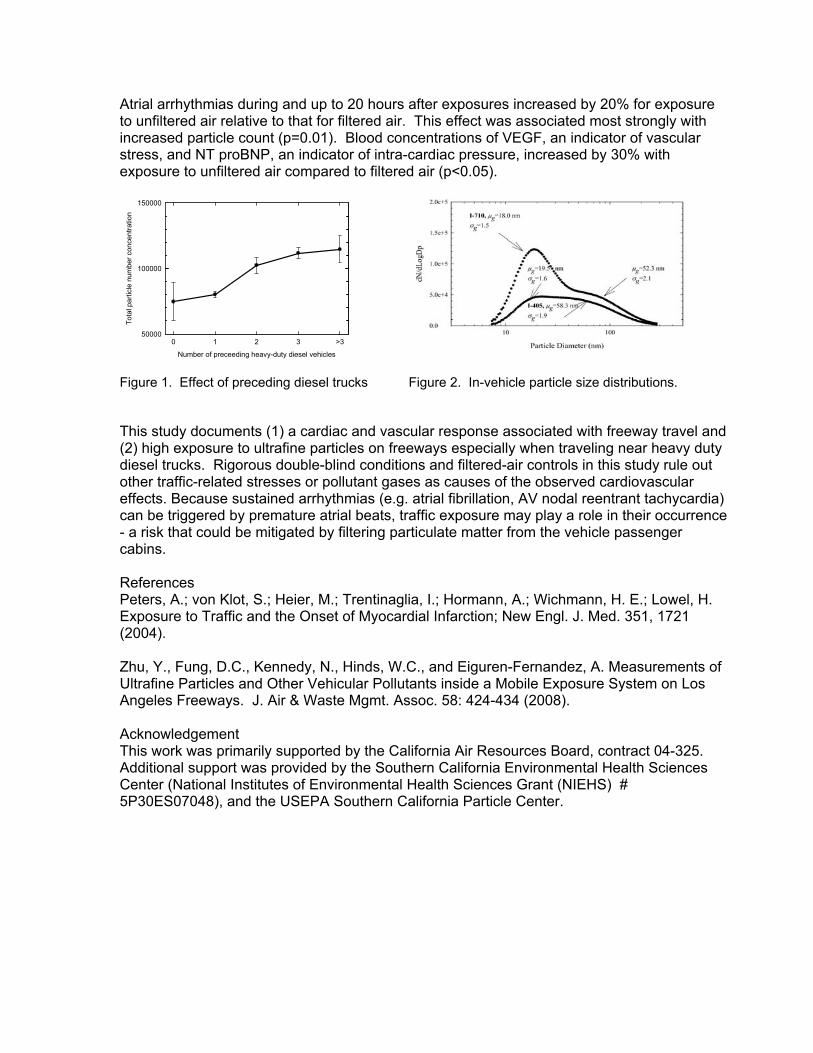
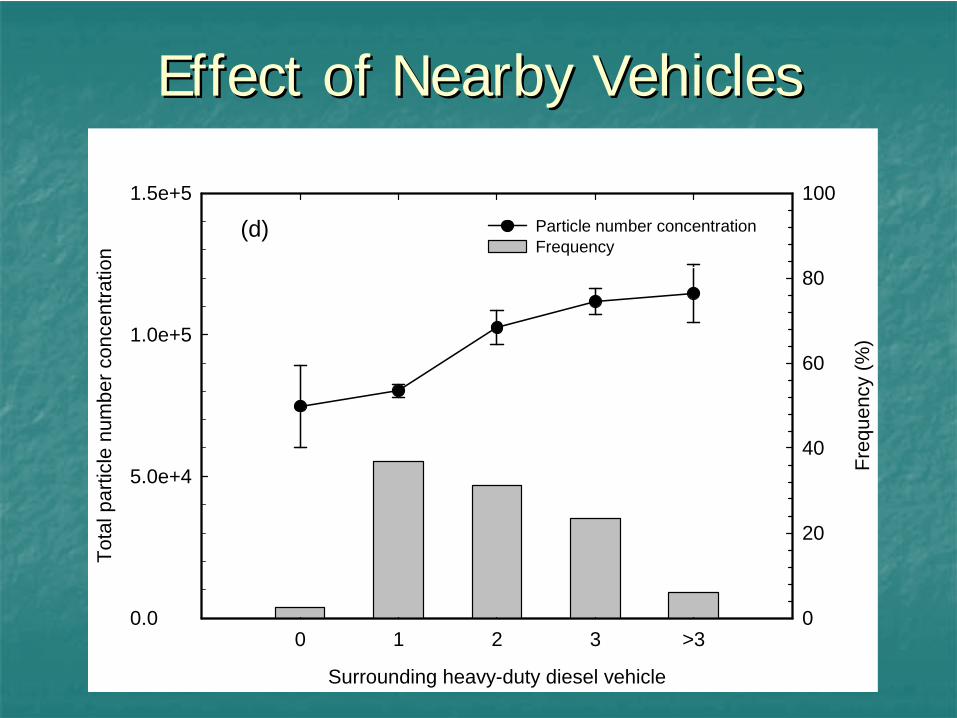
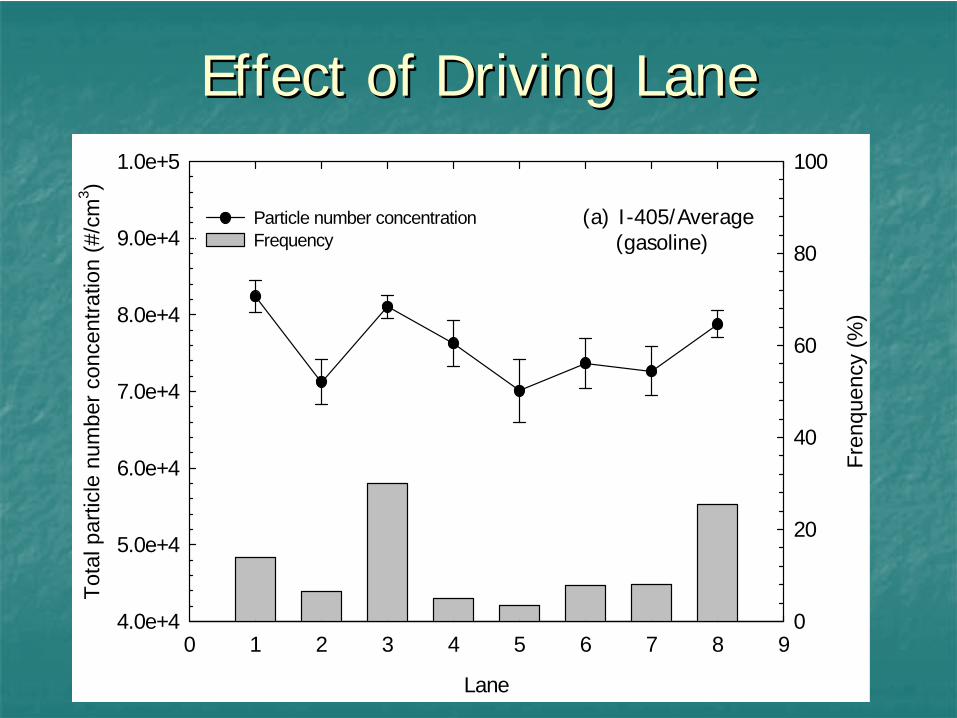
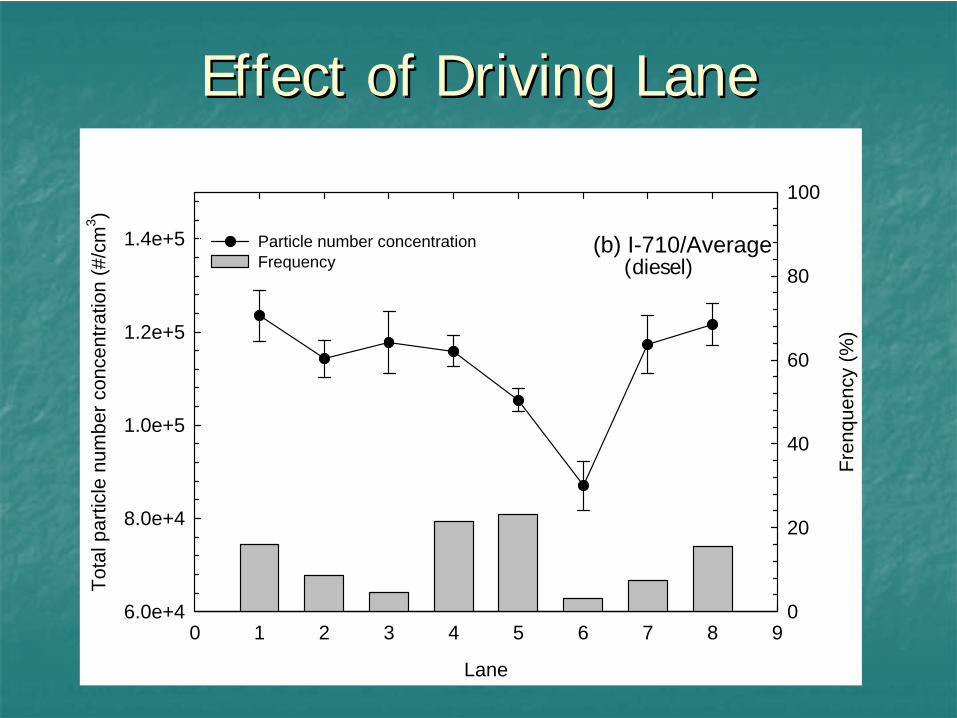
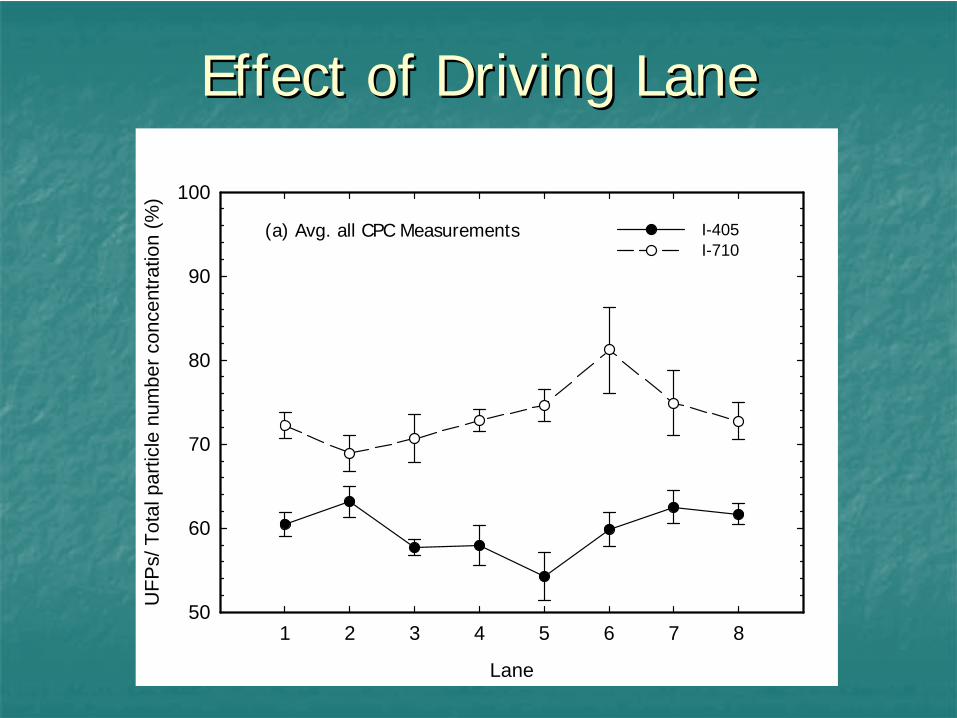
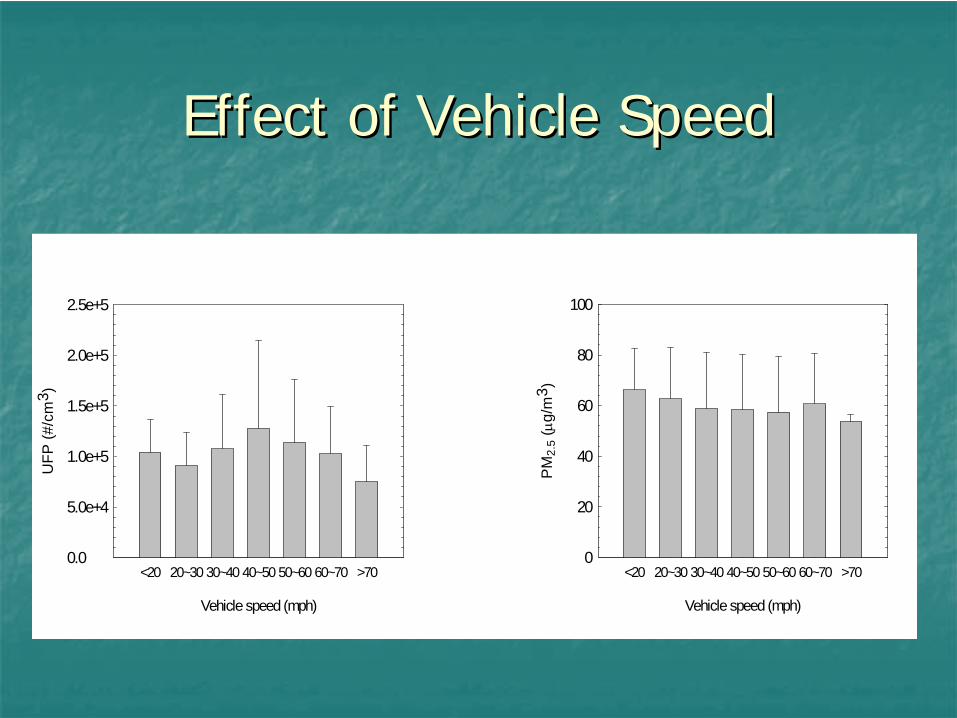
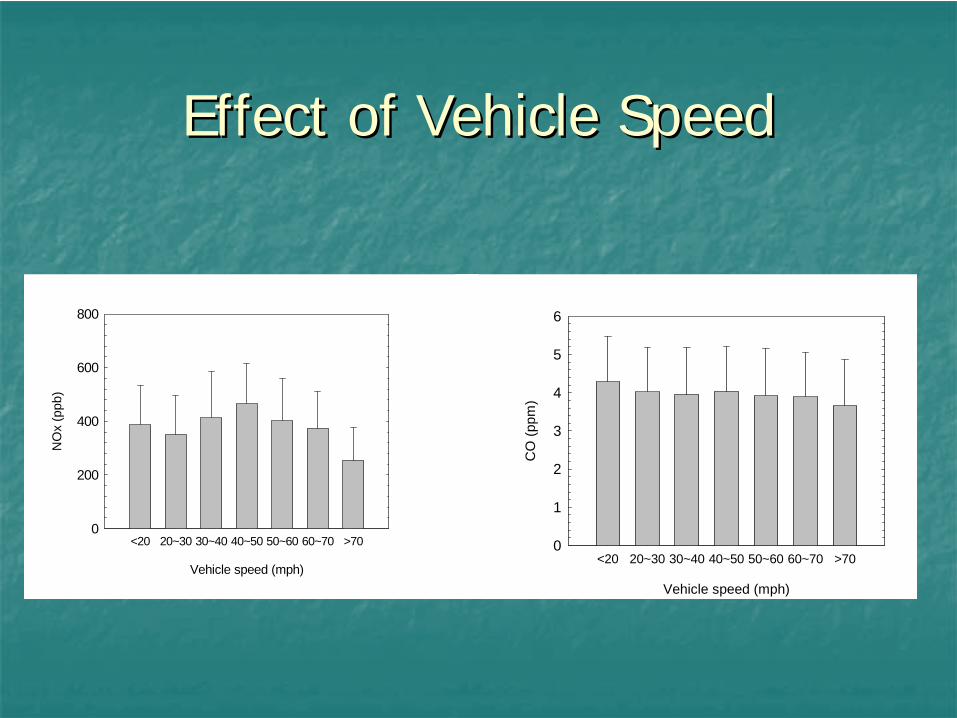
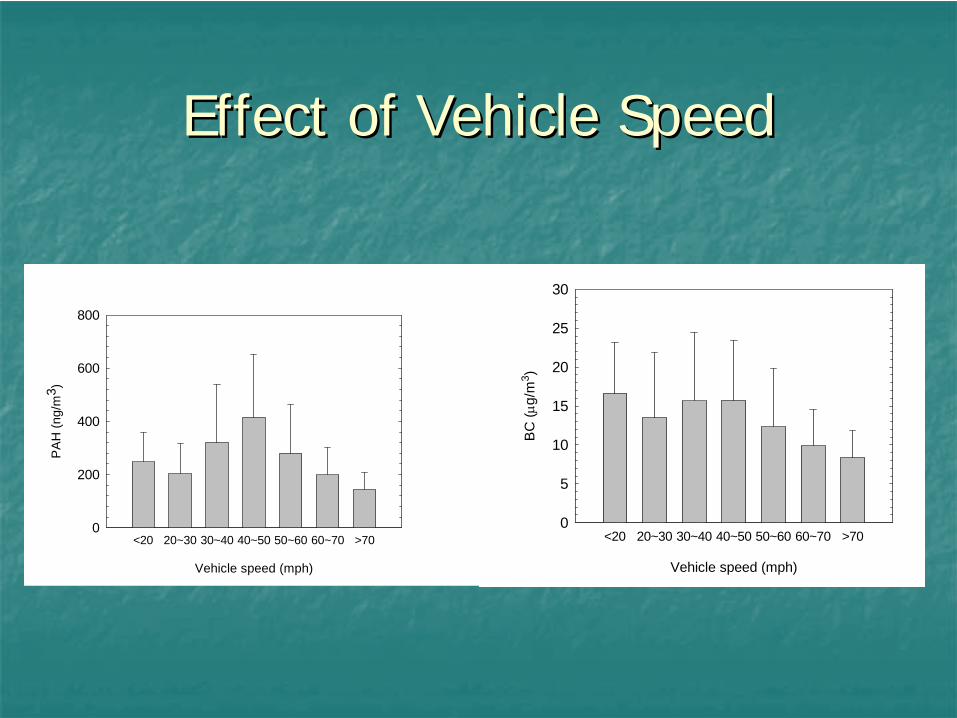
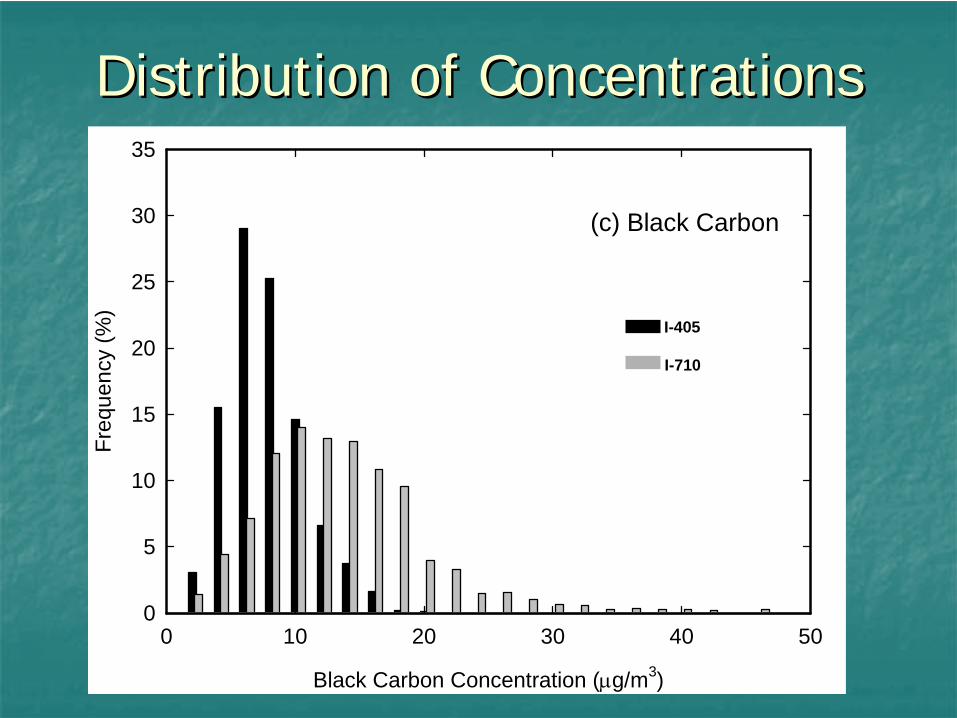
for I-710 and I-405 freeways respectively. Ultrafine particle concentrations increased with the number of nearby heavy duty diesel trucks, Figure 1. The ratio of ultrafine particles to total particles was higher on the diesel dominated freeway than the gasoline dominated highway. Traffic moving at 64-80 km/hr (40-50 mph) gave the highest ultrafine particle concentrations. As shown in Figure 2, the particle size distribution on the diesel dominated highway showed a pronounced peak at 20 nm and a submerged peak at 70 nm; on I-405 both peaks are submerged in a broad distribution from 10 to 200 nm.
Atrial arrhythmias during and up to 20 hours after exposures increased by 20% for exposure to unfiltered air relative to that for filtered air. This effect was associated most strongly with increased particle count (p=0.01). Blood concentrations of VEGF, an indicator of vascular stress, and NT proBNP, an indicator of intra-cardiac pressure, increased by 30% with exposure to unfiltered air compared to filtered air (p<0.05).
This study documents (1) a cardiac and vascular response associated with freeway travel and (2) high exposure to ultrafine particles on freeways especially when traveling near heavy duty diesel trucks. Rigorous double-blind conditions and filtered-air controls in this study rule out other traffic-related stresses or pollutant gases as causes of the observed cardiovascular effects. Because sustained arrhythmias (e.g. atrial fibrillation, AV nodal reentrant tachycardia) can be triggered by premature atrial beats, traffic exposure may play a role in their occurrence - a risk that could be mitigated by filtering particulate matter from the vehicle passenger cabins. References Peters, A.; von Klot, S.; Heier, M.; Trentinaglia, I.; Hormann, A.; Wichmann, H. E.; Lowel, H. Exposure to Traffic and the Onset of Myocardial Infarction; New Engl. J. Med. 351, 1721 (2004). Zhu, Y., Fung, D.C., Kennedy, N., Hinds, W.C., and Eiguren-Fernandez, A. Measurements of Ultrafine Particles and Other Vehicular Pollutants inside a Mobile Exposure System on Los Angeles Freeways. J. Air & Waste Mgmt. Assoc. 58: 424-434 (2008). Acknowledgement This work was primarily supported by the California Air Resources Board, contract 04-325. Additional support was provided by the Southern California Environmental Health Sciences Center (National Institutes of Environmental Health Sciences Grant (NIEHS) # 5P30ES07048), and the USEPA Southern California Particle Center.
1414thth ETH Conference onETH Conference on Combustion Generated NanoparticlesCombustion Generated Nanoparticles
Traffic Related Nanoparticles: Traffic Related Nanoparticles: Results of an OnResults of an On--Road Exposure StudyRoad Exposure Study
William C. Hinds, ScD. William C. Hinds, ScD. UCLA, Los Angeles, California, USAUCLA, Los Angeles, California, USA
Zurich1-4 August, 2010
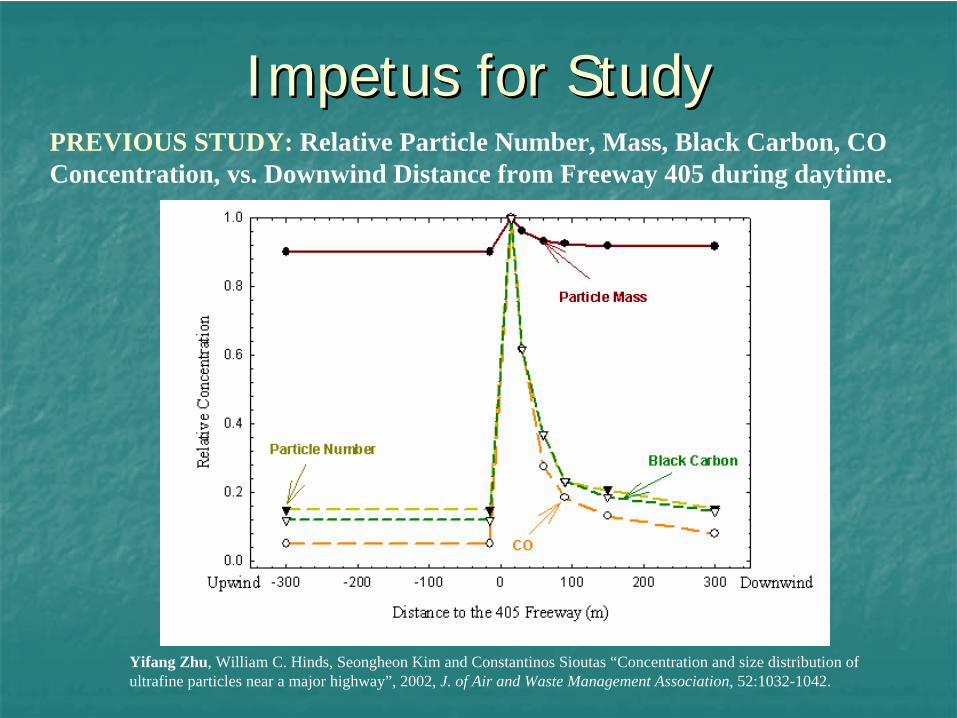
Impetus for StudyImpetus for StudyPREVIOUS STUDY: Relative Particle Number, Mass, Black Carbon, CO Concentration, vs. Downwind Distance from Freeway 405 during daytime.
Yifang Zhu, William C. Hinds, Seongheon Kim and Constantinos Sioutas “Concentration and size distribution of ultrafine particles near a major highway”, 2002, J. of Air and Waste Management Association, 52:1032-1042.
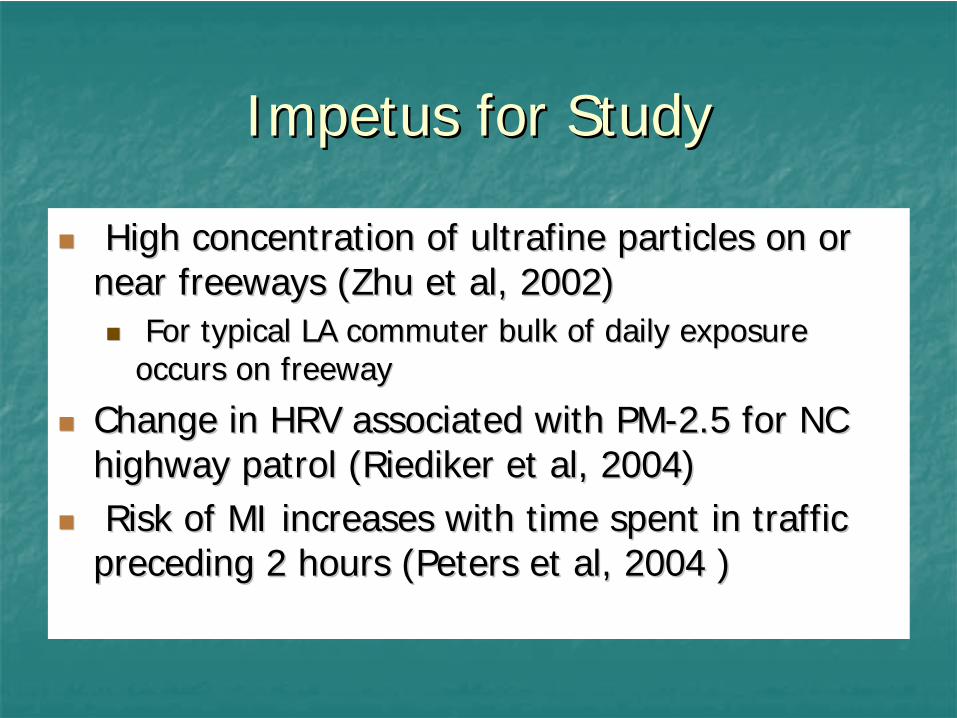
Impetus for StudyImpetus for Study
High concentration of ultrafine particles on or High concentration of ultrafine particles on or
near freeways (Zhu et al, 2002)near freeways (Zhu et al, 2002)
For typical LA commuter bulk of daily exposure For typical LA commuter bulk of daily exposure occurs on freewayoccurs on freeway
Change in HRV associated with PMChange in HRV associated with PM--2.5 for NC 2.5 for NC highway patrol highway patrol ((RiedikerRiediker et al, 2004)et al, 2004)
Risk of MI increases with time spent in traffic Risk of MI increases with time spent in traffic
preceding 2 hours (Peters et al, 2004 )preceding 2 hours (Peters et al, 2004 )
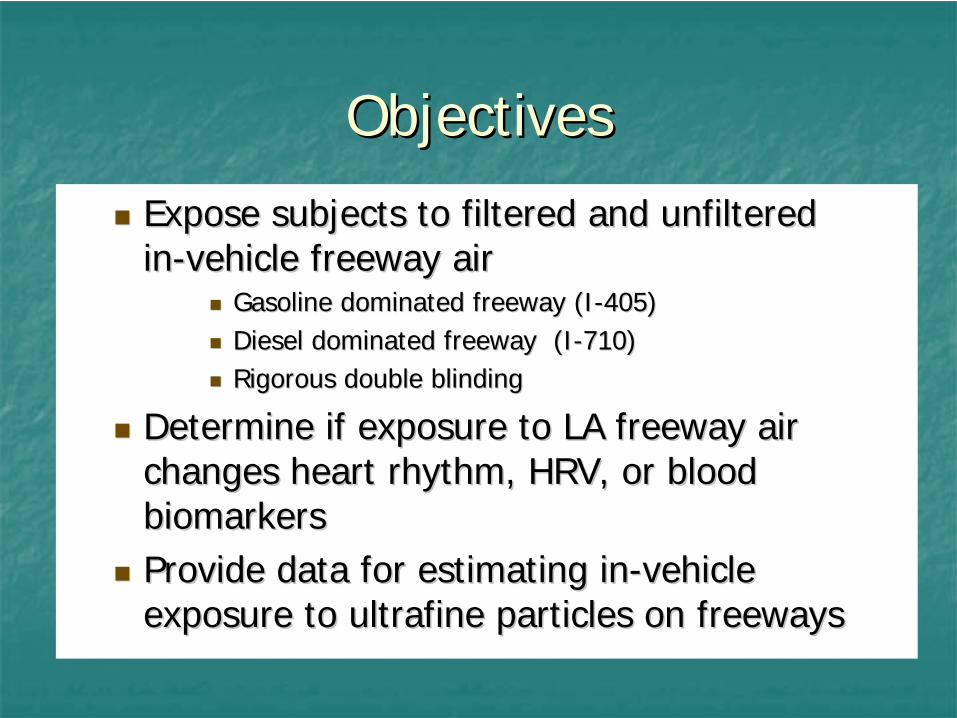
ObjectivesObjectives
Expose subjects to filtered and unfiltered Expose subjects to filtered and unfiltered inin--vehicle freeway airvehicle freeway air
Determine if exposure to LA freeway air Determine if exposure to LA freeway air changes heart rhythm, HRV, or blood changes heart rhythm, HRV, or blood biomarkersbiomarkers
Provide data for estimating inProvide data for estimating in--vehicle vehicle exposure to ultrafine particles on freewaysexposure to ultrafine particles on freeways
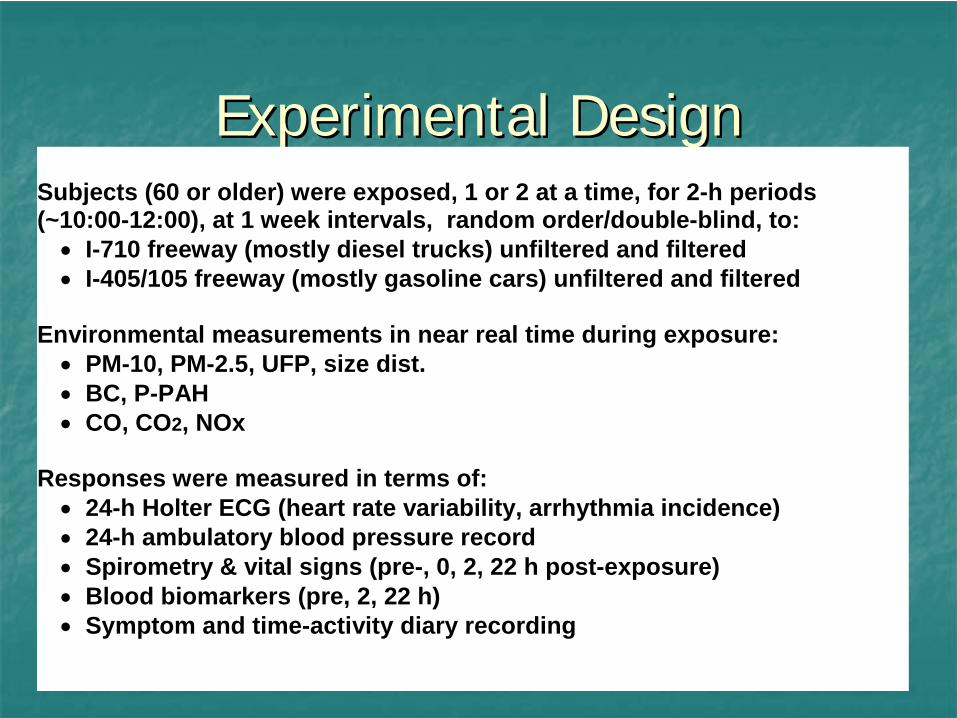
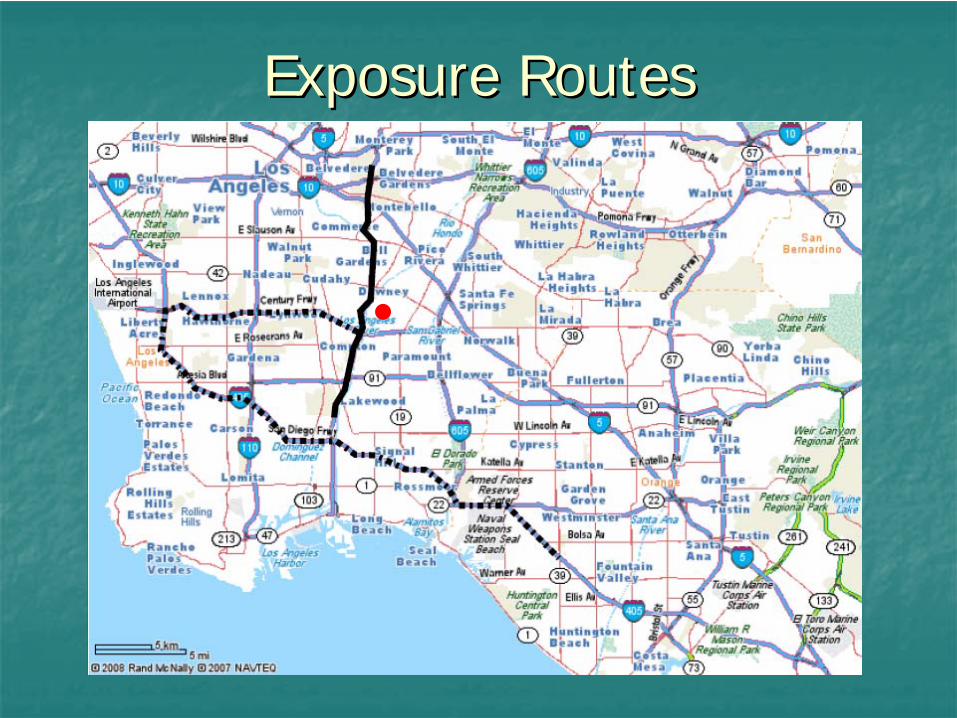
Experimental DesignExperimental Design Subjects (60 or older) were exposed, 1 or 2 at a time, for 2-h periods (~10:00-12:00), at 1 week intervals, random order/double-blind, to: I-710 freeway (mostly diesel trucks) unfiltered and filtered I-405/105 freeway (mostly gasoline cars) unfiltered and filtered
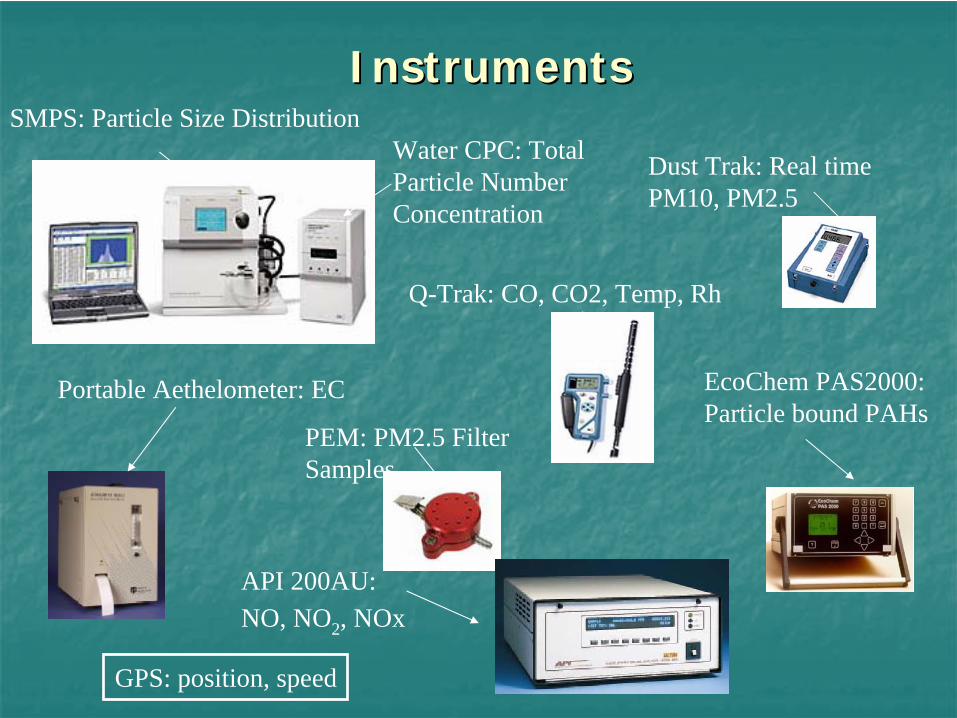
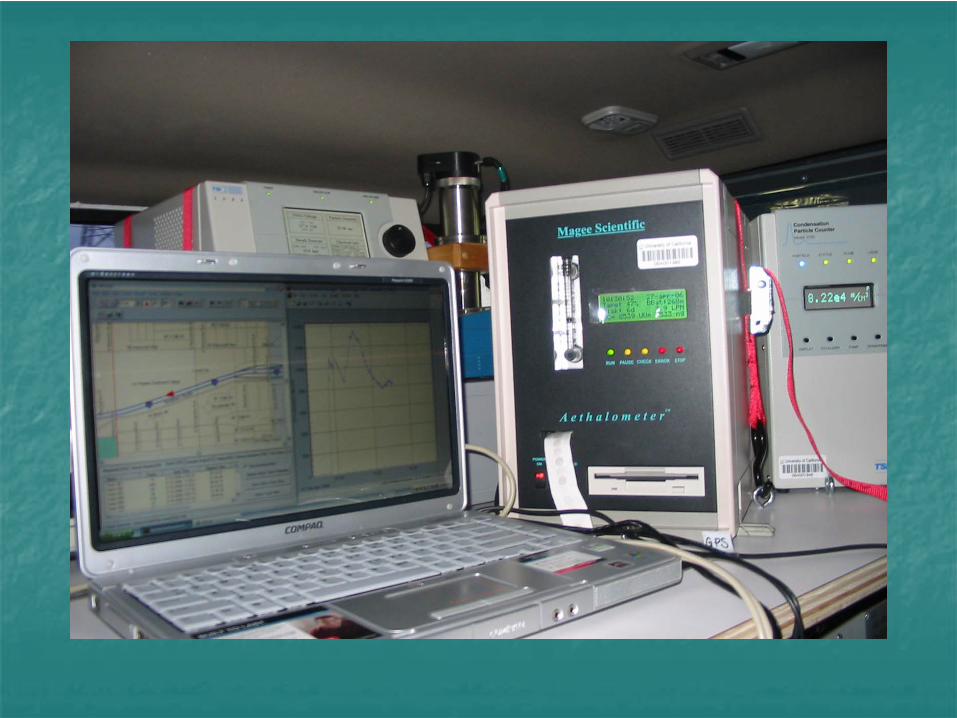
Environmental measurements in near real time during exposure: PM-10, PM-2.5, UFP, size dist. BC, P-PAH CO, CO2, NOx
Responses were measured in terms of: 24-h Holter ECG (heart rate variability, arrhythmia incidence) 24-h ambulatory blood pressure record Spirometry & vital signs (pre-, 0, 2, 22 h post-exposure) Blood biomarkers (pre, 2, 22 h) Symptom and time-activity diary recording
InstrumentsInstrumentsSMPS: Particle Size Distribution
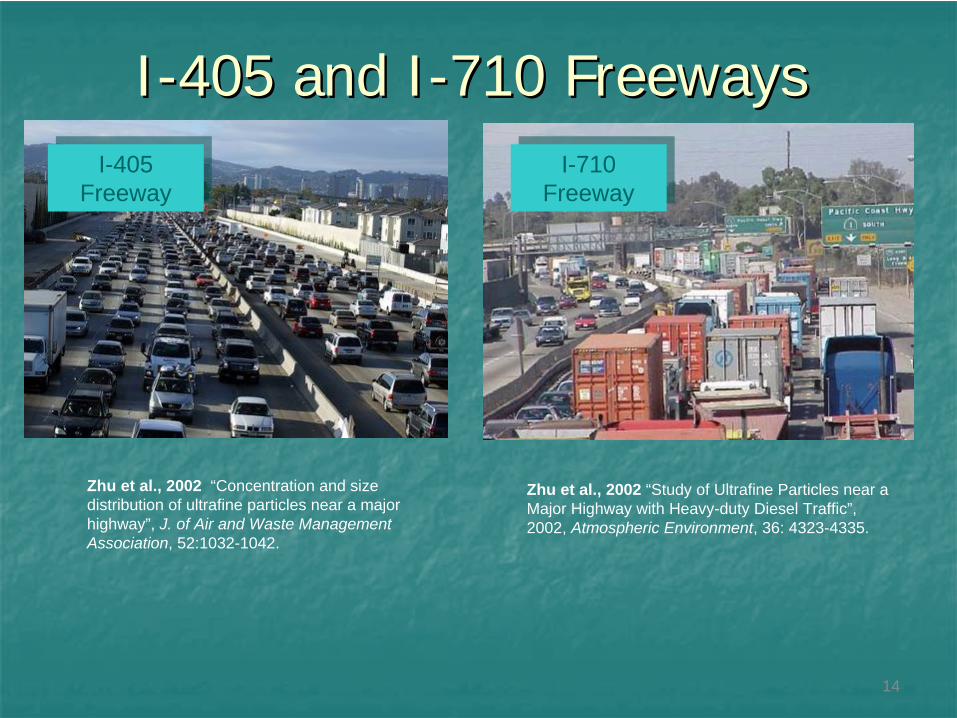
Zhu et al., 2002 “Concentration and size distribution of ultrafine particles near a major highway”, J. of Air and Waste Management Association, 52:1032-1042.
Zhu et al., 2002 “Study of Ultrafine Particles near a Major Highway with Heavy-duty Diesel Traffic”, 2002, Atmospheric Environment, 36: 4323-4335.
II--405 and I405 and I--710 Freeways710 Freeways
Environmental Environmental Results Results
Particle Number ConcentrationParticle Number Concentration
0
50000
100000
150000
part
icle
s pe
r ml
CPCSMPS
I-405 CARS I-710 TRUCKS
unfiltered
filtered
unfiltered
filtered
Particle Mass ConcentrationParticle Mass ConcentrationMASS CONCENTRATION
0
20
40
60
80
100
mcg
/cu
m
PM(2.5)PM(10)
I-405 CARS I-710 TRUCKS
unfiltered
filtered
unfiltered
filtered
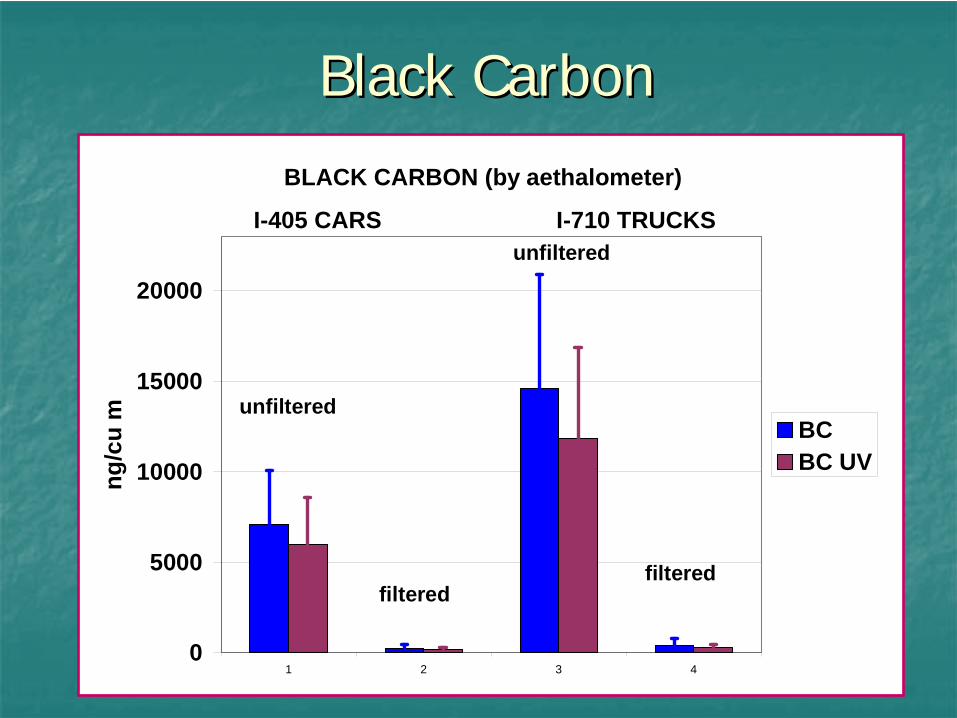
Black CarbonBlack CarbonBLACK CARBON (by aethalometer)
0
5000
10000
15000
20000
1 2 3 4
ng/c
u m
BCBC UV
I-405 CARS I-710 TRUCKS
unfiltered
filtered
unfiltered
filtered
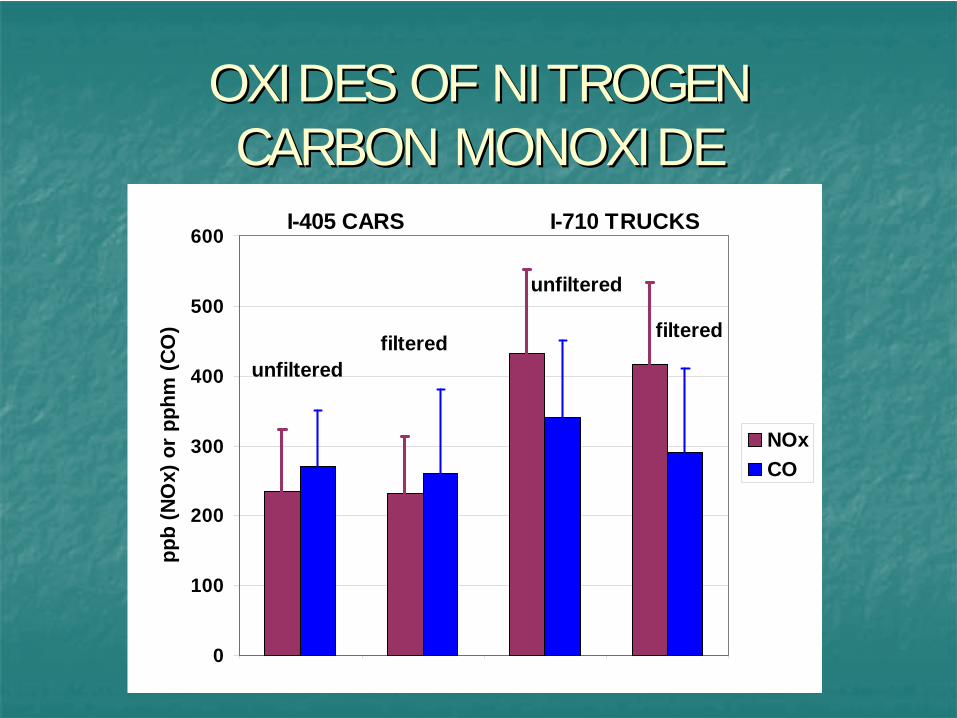
OXIDES OF NITROGEN OXIDES OF NITROGEN CARBON MONOXIDECARBON MONOXIDE
Effect of Nearby VehiclesEffect of Nearby Vehicles
Surrounding heavy-duty diesel vehicle
0 1 2 3 >3
Tota
l par
ticle
num
ber c
once
ntra
tion
0.0
5.0e+4
1.0e+5
1.5e+5
Freq
uenc
y (%
)
0
20
40
60
80
100Particle number concentrationFrequency
(d)
Effect of Driving LaneEffect of Driving Lane
Lane
0 1 2 3 4 5 6 7 8 9
Tota
l par
ticle
num
ber c
once
ntra
tion
(#/c
m3 )
4.0e+4
5.0e+4
6.0e+4
7.0e+4
8.0e+4
9.0e+4
1.0e+5
Fren
quen
cy (%
)
0
20
40
60
80
100
Particle number concentrationFrequency
(a) I-405/Average(gasoline)
Lane
0 1 2 3 4 5 6 7 8 9
Tota
l par
ticle
num
ber c
once
ntra
tion
(#/c
m3 )
6.0e+4
8.0e+4
1.0e+5
1.2e+5
1.4e+5
Fren
quen
cy (%
)
0
20
40
60
80
100
Particle number concentrationFrequency
(b) I-710/Average
Effect of Driving LaneEffect of Driving Lane
(diesel)
Lane
1 2 3 4 5 6 7 8
UFP
s/ T
otal
par
ticle
num
ber c
once
ntra
tion
(%)
50
60
70
80
90
100
I-405I-710
(a)
Effect of Driving LaneEffect of Driving Lane
(a) Avg. all CPC Measurements
Effect of Vehicle SpeedEffect of Vehicle Speed
Vehicle speed (mph)
<20 20~30 30~40 40~50 50~60 60~70 >70
UFP
(#/c
m3 )
0.0
5.0e+4
1.0e+5
1.5e+5
2.0e+5
2.5e+5
Vehicle speed (mph)
<20 20~30 30~40 40~50 50~60 60~70 >70
PM
2.5
( g/
m3 )
0
20
40
60
80
100
Effect of Vehicle SpeedEffect of Vehicle Speed
Vehicle speed (mph)
<20 20~30 30~40 40~50 50~60 60~70 >70
NO
x (p
pb)
0
200
400
600
800
Vehicle speed (mph)
<20 20~30 30~40 40~50 50~60 60~70 >70
CO
(ppm
)0
1
2
3
4
5
6
Effect of Vehicle SpeedEffect of Vehicle Speed
Vehicle speed (mph)
<20 20~30 30~40 40~50 50~60 60~70 >70
PA
H (n
g/m
3 )
0
200
400
600
800
Vehicle speed (mph)
<20 20~30 30~40 40~50 50~60 60~70 >70B
C (
g/m
3 )0
5
10
15
20
25
30
Distribution of ConcentrationsDistribution of Concentrations
Total Particle Number Concentration (cm-3)
0 1e+5 2e+5 3e+5 4e+5
Freq
uenc
y (%
)
0
5
10
15
20
(a) CPC
I-405
I-710
Distribution of ConcentrationsDistribution of Concentrations
(b) PM2.5
Black Carbon Concentration (g/m3)
0 10 20 30 40 50
Freq
uenc
y (%
)
0
5
10
15
20
25
30
35
(c) Black Carbon
I-405
I-710
Distribution of ConcentrationsDistribution of Concentrations
(b) PM2.5
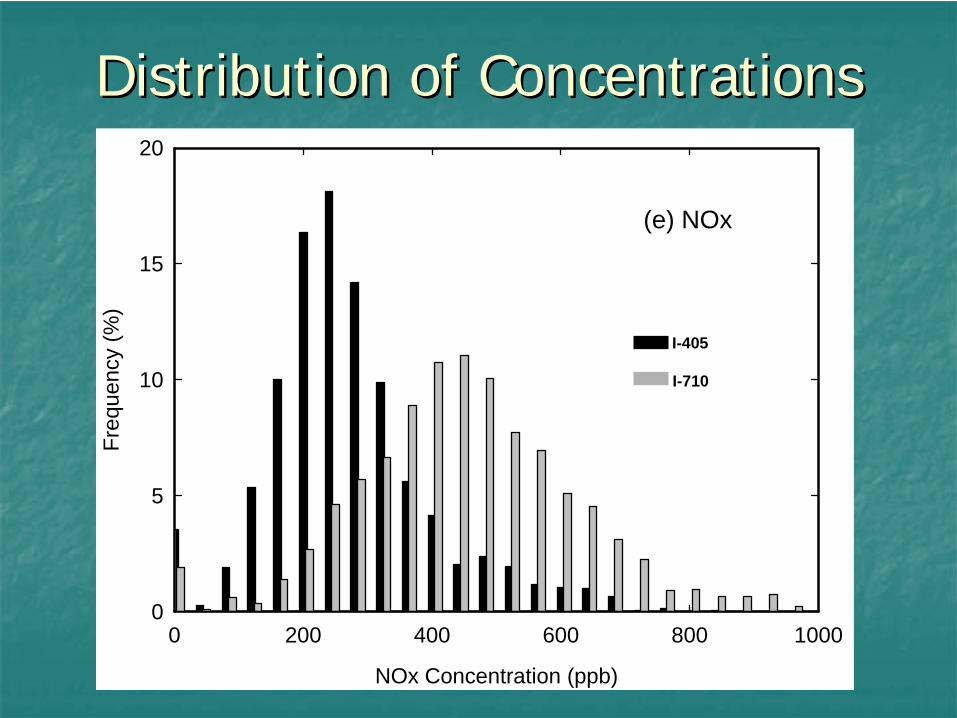
NOx Concentration (ppb)
0 200 400 600 800 1000
Freq
uenc
y (%
)
0
5
10
15
20
(e) NOx
I-405
I-710
Distribution of ConcentrationsDistribution of Concentrations
PM2.5 Mass Concentration(g/m-3)
0 25 50 75 100 125 150
Freq
uenc
y (%
)
0
5
10
15
20
(b) PM2.5
I-405
I-710
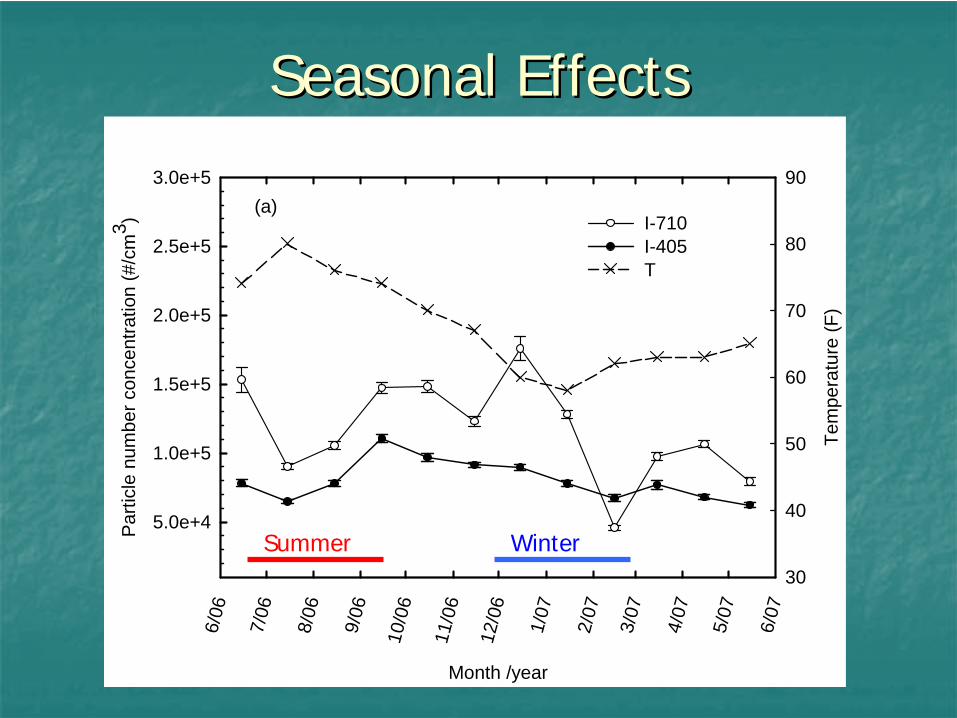
Seasonal EffectsSeasonal Effects
Month /year
6/06
7/06
8/06
9/06
10/0
6
11/0
6
12/0
6
1/07
2/07
3/07
4/07
5/07
6/07
Par
ticle
num
ber c
once
ntra
tion
(#/c
m3 )
5.0e+4
1.0e+5
1.5e+5
2.0e+5
2.5e+5
3.0e+5
Tem
pera
ture
(F)
30
40
50
60
70
80
90
I-710I-405T
(a)
Summer Winter
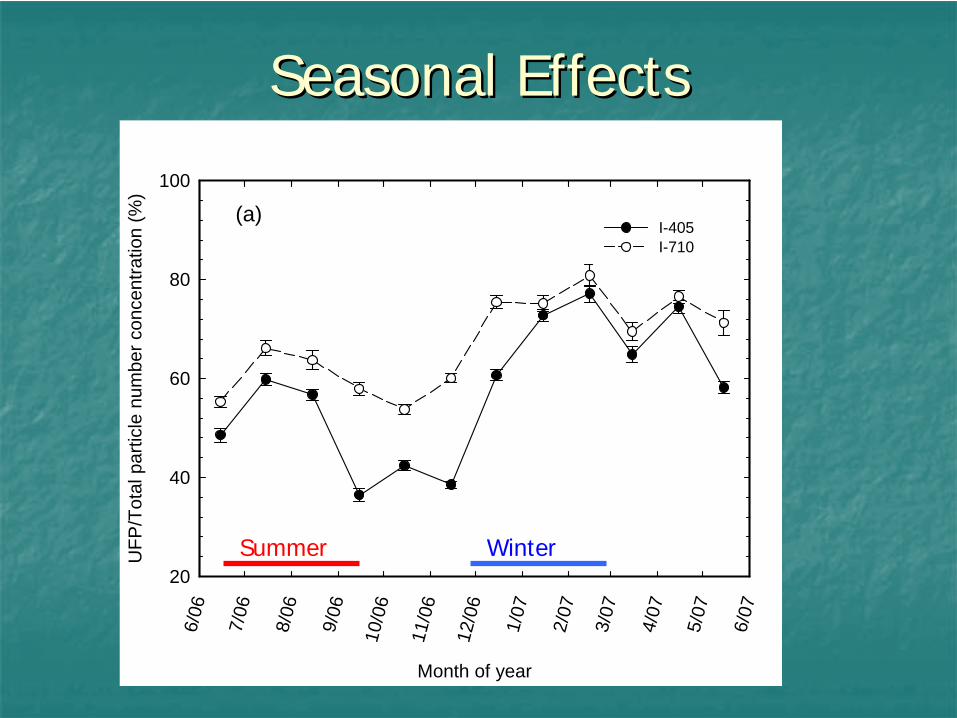
Seasonal EffectsSeasonal Effects
Month of year
6/06
7/06
8/06
9/06
10/0
6
11/0
6
12/0
6
1/07
2/07
3/07
4/07
5/07
6/07
UFP
/Tot
al p
artic
le n
umbe
r con
cent
ratio
n (%
)
20
40
60
80
100
I-405I-710
(a)
Summer Winter
Particle Size Particle Size Distributions Distributions In Exposure In Exposure
ChamberChamber
I-710
I-405
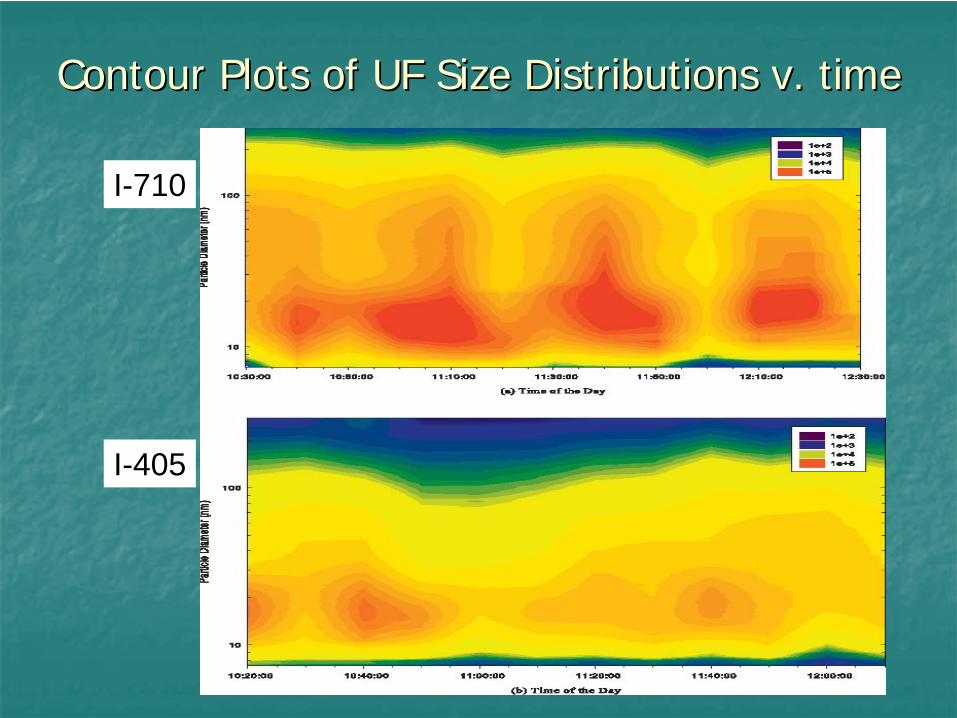
Contour Plots of UF Size Distributions v. timeContour Plots of UF Size Distributions v. time
Summary of Study ResultsSummary of Study Results
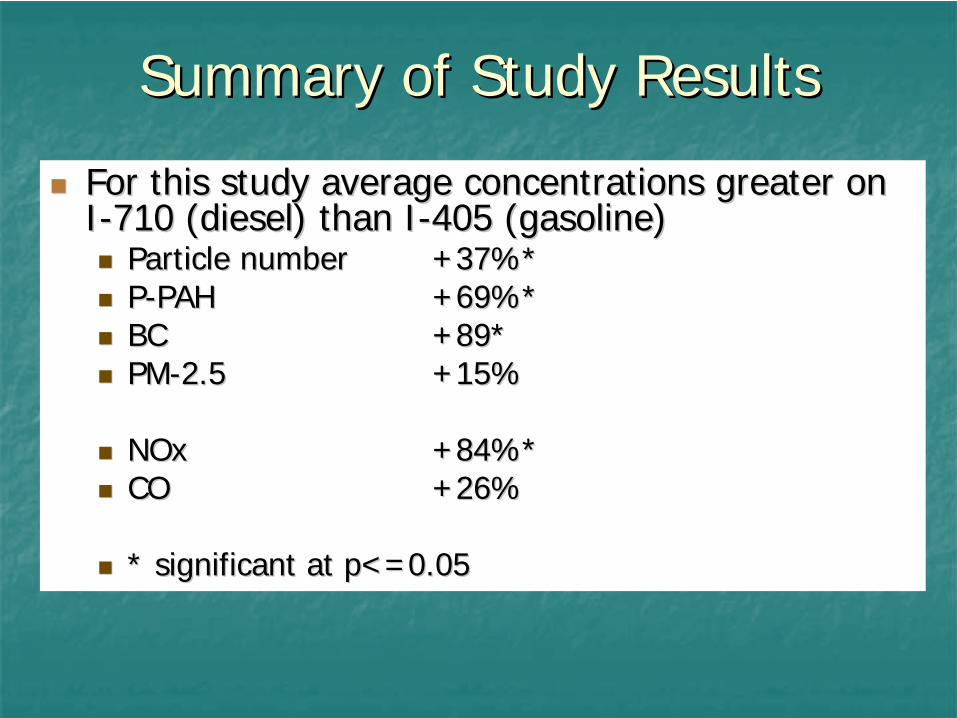
For this study average concentrations greater on For this study average concentrations greater on II--710 (diesel) than I710 (diesel) than I--405 (gasoline)405 (gasoline)
Particle numberParticle number +37%*+37%*
PP--PAHPAH +69%*+69%*
BCBC +89*+89*
PMPM--2.52.5 +15%+15%
NOxNOx +84%*+84%*
COCO +26%+26%
* significant at p<=0.05* significant at p<=0.05
PHYSIOLOGIC RESULTSPHYSIOLOGIC RESULTS
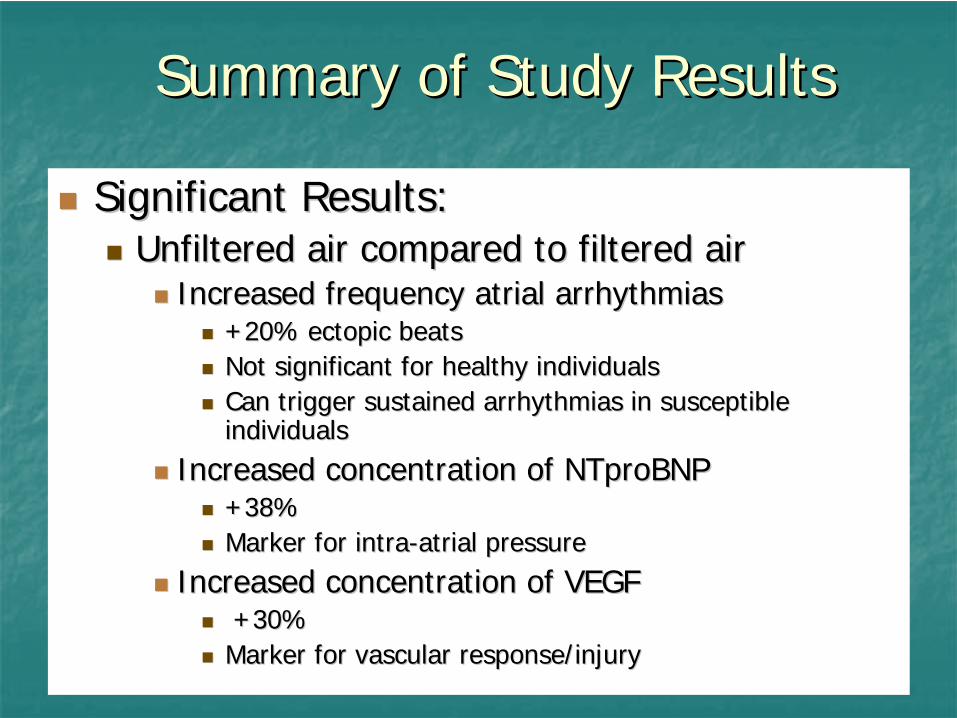
Significant Results:Significant Results:
Unfiltered air compared to Unfiltered air compared to filtered airfiltered air
Increased frequency atrial arrhythmiasIncreased frequency atrial arrhythmias
+20% ectopic beats+20% ectopic beats
Not significant for healthy individualsNot significant for healthy individuals
Can trigger sustained arrhythmias in susceptible Can trigger sustained arrhythmias in susceptible individualsindividuals
Increased concentration of Increased concentration of NTproBNPNTproBNP
+38%+38%
Marker for intraMarker for intra--atrial pressure atrial pressure
Increased concentration of VEGFIncreased concentration of VEGF
+30%+30%
Marker for vascular response/injuryMarker for vascular response/injury
Summary of Study ResultsSummary of Study Results
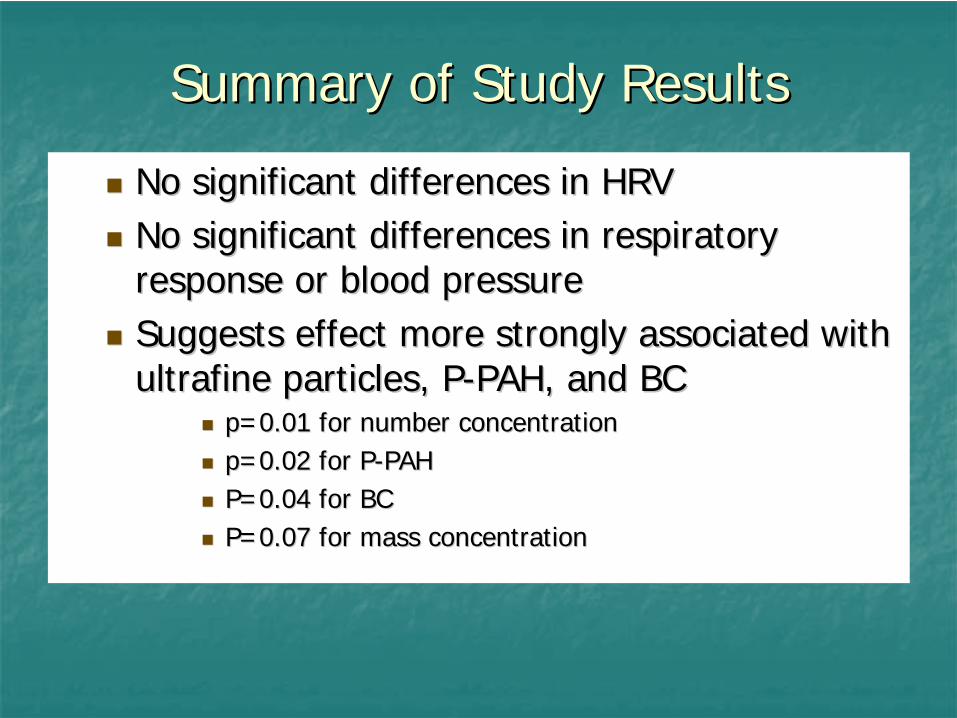
No significant differences in HRVNo significant differences in HRV
No significant differences in respiratory No significant differences in respiratory response or blood pressureresponse or blood pressure
Suggests effect more strongly associated with Suggests effect more strongly associated with ultrafine particles, Pultrafine particles, P--PAH, and BCPAH, and BC
p=0.01 for number concentrationp=0.01 for number concentration
p=0.02 for Pp=0.02 for P--PAHPAH
P=0.04 for BCP=0.04 for BC
P=0.07 for mass concentrationP=0.07 for mass concentration
Summary of Study ResultsSummary of Study Results
Summary of Study ResultsSummary of Study Results
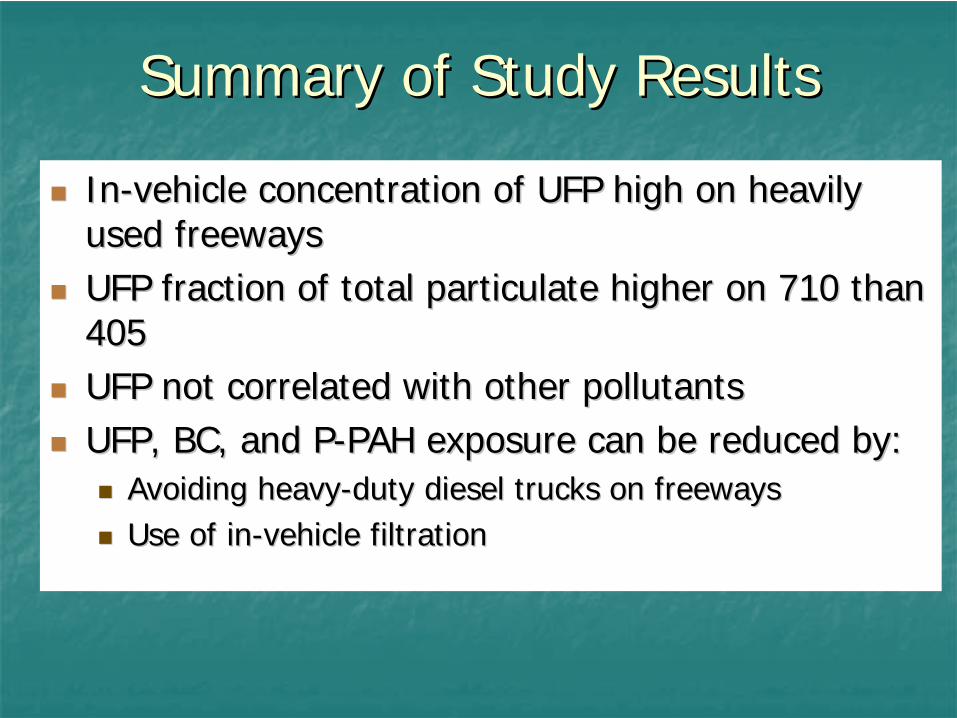
InIn--vehicle concentration of UFP high on heavily vehicle concentration of UFP high on heavily used freewaysused freeways
UFP fraction of total particulate higher on 710 than UFP fraction of total particulate higher on 710 than 405405
UFP not correlated with other pollutantsUFP not correlated with other pollutants
UFP, BC, and PUFP, BC, and P--PAH exposure can be reduced by:PAH exposure can be reduced by:
Avoiding heavyAvoiding heavy--duty diesel trucks on freewaysduty diesel trucks on freeways
Use of inUse of in--vehicle filtrationvehicle filtration
Major funding was provided by:Major funding was provided by:
California Air Resources Board California Air Resources Board (Contract # 04(Contract # 04--324), 324),
additional support by Southern California additional support by Southern California Environmental Health Sciences Center (National Environmental Health Sciences Center (National Institutes of Health Grant # 5P30ES07048Institutes of Health Grant # 5P30ES07048--12), and12), and
USEPA Southern California Particle CenterUSEPA Southern California Particle Center
Contributions by faculty and staff at:Contributions by faculty and staff at:
Principal InvestigatorWilliam C. Hinds, University of CA, Los Angeles
Co-InvestigatorsWayne Cascio, Brody School of Medicine at E. Carolina University, Greenville, NCNola Kennedy, University of CA, Los AngelesWilliam Linn, Los Amigos Research & Education Institute, Los Angeles, CADaniel Stram, University of Southern California, Los Angeles, CAYifang Zhu, Texas A&M, Kingsville, TX
Technical Support StaffDavid Fung, University of California, Los AngelesArantza Eiguren-Fernandez, University of CA, Los AngelesTrudy Webb, Los Amigos Research & Education Institute, Downey, CAMari Avila, Los Amigos Research & Education Institute, Downey, CALaxmansa Katwa, Brody School of Medicine at E. Carolina University, Greenville, NCAmanda Gould, Brody School of Medicine at E. Carolina University, Greenville, NCJoseph Cascio, Brody School of Medicine at E. Carolina University, Greenville, NCTaylor Blanchley, Brody School of Medicine at E. Carolina University, Greenville, NC