23
TRAFFIC-SIGNAGE DETECTION AND RECOGNITION BASED ON K-MEANS CLUSTERING AND SUPPORT VECTOR MACHINE CLASSIFICATION KELVIN QUEK WEI LUO UNIVERSITI TEKNOLOGI MALAYSIA

TRAFFIC-SIGNAGE DETECTION AND RECOGNITION BASED ON K-MEANSCLUSTERING AND SUPPORT VECTOR MACHINE CLASSIFICATION
KELVIN QUEK WEI LUO
UNIVERSITI TEKNOLOGI MALAYSIA

TRAFFIC-SIGNAGE DETECTION AND RECOGNITION BASED ON K-MEANSCLUSTERING AND SUPPORT VECTOR MACHINE CLASSIFICATION
KELVIN QUEK WEI LUO
A project report submitted in partial fulfilment of therequirements for the award of the degree of
Master of Engineering (Electrical - Computer & Microelectronic System)
Faculty of Electrical EngineeringUniversiti Teknologi Malaysia
DECEMBER 2015

iii
I would like to dedicate my thesis to my beloved parents, wife, and sister.

iv
ACKNOWLEDGEMENT
Many people have made this thesis possible. I would like to take thisopportunity to express my profound sense of gratitude and respect to all who has helpedme through the duration of this thesis. First of all, I would like to thank my supervisor,Associate Professor Dr. Muhammad Nadzir bin Marsono, whose guidance has helpedme to address every problem I faced. This work would not have been possible withoutthe encouragement and teaching from him. Most of the novel ideas and solutions foundin this thesis are the result of our numerous stimulating discussions. Dr. Nadzir’sfeedback and editorial comments were also invaluable for the writing of this thesis.
I would like to thank my parents, wife, and sister for their constant support andlove throughout my schooling. Without their sacrifices and support, I would not be theperson I am today.
Lastly, my sincere appreciation to all my colleagues and friends mainly FongHiong Weng, Ong Wen Jian, Chin Teck Loong, and Ee Poey Guan who have providedme valuable feedback and technical support.
v
ABSTRACT
Traffic signage detection and recognition are essential components in theintelligent vision based transportation system by which in-vehicle is able to recognizethe traffic signage in various shapes and interpret the contents such as speed limit,stop, and yield. The main challenge of traffic signage detection and recognition isto find a way to extract specific information from an image and classify it to theright category. Since the traffic signage images may contain shading and noise,the quality of the images can be varied from one to another. Besides, machinelearning kernel for signage recognition is compute-intensive and requires extremelylong precessing time to classify an image. In this project, an intelligent traffic signagedetection and recognition system which uses k-means as signage detection and supportvector machine (SVM) as classification model is proposed. The objective of thisproject is to develop a color segmentation algorithm which is invariant to differentillumination levels and to optimized the performance of recognition algorithm in termof speedup. The new model has successfully implemented in the software environmentto compared its performance with existing works. Experimental results show an overalldetection rate of 97.6% is achieved. The linear kernel outperforms the RBF kernel by3% with 92% of correct classification rate. Combining all the modules, the singleframe processing time is successfully speedup by 333× and the memory utilizationis reduced by 99.8%. The proposed method has excelled the previous works and ispreferable for future hardware implementation.

vi
ABSTRAK
Pengesanan isyarat lalu lintas dan pengiktirafan adalah komponen-komponenpenting dalam sistem pengangkutan pintar dimana kenderaan dapat mengenali tanda-tanda lalu lintas dalam pelbagai corak dan mentafsir isi kandunganya seperti hadkelajuan, berhenti, dan beri laluan. Cabaran terutama dalam pengesanan isyarat lalulintas adalah memperolehan maklumat tertentu dari imej dan mengelaskan kepadakategori yang betul. Imej isyarat lalu lintas mungkin mengandungi bayang andkekacauan signal, kualiti imej akan terjejas. Selain itu, support vector machine (SVM)kernel adalah amat intensif dalam pengiraan dan mempunyai masa precessing sangatpanjang untuk mengelas imej. Dalam projek ini, pengesanan isyarat lalu lintas danpengiktirafan sistem pintar yang menggunakan k-means sebagai sistem pengesananisyarat lalu lintas dan SVM sebagai model klasifikasi telah dicadangkan. Objektifprojek ini adalah untuk membangunkan satu algoritma segmentasi warna yang takberubah ke tahap pencahayaan yang berbeza dan meningkatkan prestasi algoritmapengiktirafan dari segi kelajuan. Model yang baru init telah berjaya dilaksanakandalam perisian dan dibandingkan dengan kerja-kerja lain yang sedia ada. Hasil ujikaji menunjukkan kadar pengesanan sebanyak 97.6% telah dicapai. Selain itu, kadarketepatan klasifikasi linear kernel adalah sebanyak 92%, ini telah melebihi RBF kernelsebanyak 3%. Menggabungkan semua modul, kadar pemprosesan yang diambil telahberjaya meningkat sebanyak 333× dan penggunaan memori telah berjaya dikurangkansebanyak 99.8%. Kaedah yang dicadangkan telah cemerlang kerja-kerja sebelum inidan adalah lebih baik untuk pelaksanaan perkakasan pada masa depan.

vii
TABLE OF CONTENTS
CHAPTER TITLE PAGE
DECLARATION iiDEDICATION iiiACKNOWLEDGEMENT ivABSTRACT vABSTRAK viTABLE OF CONTENTS viiLIST OF TABLES ixLIST OF FIGURES xLIST OF ABBREVIATIONS xiiLIST OF APPENDICES xiii
1 INTRODUCTION 11.1 Problem Background 11.2 State-of-the-Arts 31.3 Problem Statement 41.4 Objective and Scope 51.5 Scope of Work 61.6 Organization 8
2 LITERATURE REVIEW 92.1 Background Theories 9
2.1.1 K-means 112.1.2 Support Vector Machine (SVM) 13
2.2 Traffic Signage Detection 152.2.1 Shadow and Highlight Invariant Color
Segmentation Algorithm 162.2.2 Thresholding on HSI Color Space 162.2.3 L*a*b Color Space for Color Image
Processing 18

viii
2.3 Traffic Signage Recognition 182.3.1 SVM Classification Using Direct Binary
Representation 192.3.2 Shape Classification 19
2.4 Chapter Summary 20
3 RESEARCH METHODOLOGY 223.1 Top-level View 223.2 Proposed TSDR 24
3.2.1 Region of Interest (ROI) Extraction 253.2.2 Image Re-sizing 273.2.3 Dimension Reduction - Principle Compo-
nent Analysis (PCA) 303.2.4 Classification - Support Vector Machine
(SVM) 323.3 Chapter Summary 35
4 RESULTS AND DISCUSSIONS 374.1 Experimental Setup 374.2 Simulation Results 39
4.2.1 Traffic Signage Detection 394.2.2 Traffic Signage Recognition with Gray
Scale Representation 414.2.3 SVM Classification with Eigen Vector
Representation 434.2.4 Classification with RBF Kernel 46
4.3 Chapter Summary 47
5 CONCLUSION 495.1 Research Outcomes 495.2 Future Works 50
REFERENCES 51Appendix A 53

ix
LIST OF TABLES
TABLE NO. TITLE PAGE
1.1 Characteristics of TSDR. 22.1 Different shapes and colors of Swedish traffic signage. 104.1 Desired output classes of traffic signage shapes. 394.2 Desired output classes of speed limit traffic signage. 394.3 Detection results based on k-means clustering in L*a*b color
space. 404.4 Example of traffic signage detection. 404.5 Failure analysis of 2 examples that were not able to detect the
stop signage. 414.6 Classification results of traffic signage shapes on 3 pairs of
training and testing data set with gray scale representation. 424.7 Classification results of speed limit signage on 2 pairs of
training and testing data set with gray scale representation. 424.8 Stop signage images that were classified incorrectly with gray
scale representation. 434.9 Speed limit signage images that were classified incorrectly
with eigen vector representation. 434.10 Classification results of traffic signage shapes on 3 pairs of
training and testing data set with eigen vector representation. 444.11 Classification results of speed limit signage on 2 pairs of
training and testing data set with eigen vector representation. 444.12 SVM classification run time analysis. 444.13 SVM classification memory usage analysis. 454.14 The correct classification rate of traffic signage shapes using
RBF kernel. 46
x
LIST OF FIGURES
FIGURE NO. TITLE PAGE
1.1 TSDR system on BMW heads-up display and Mercedes-Benz. 1
1.2 High level overview of proposed TSDR. 41.3 Speed limit traffic signage. 41.4 Sequence of TSDR system. 71.5 Swedish road traffic signage - warning signage. 71.6 Swedish road traffic signage - prohibitory signage. 82.1 The traffic signage detection and recognition system. 112.2 Clustering process using the standard k-means algorithm. 122.3 Block diagram of supervised learning. 132.4 An overview of SVM process. 142.5 Linear classification for two-dimensional input vectors. 152.6 Hue-Saturation histogram. 172.7 DtBs for a triangular shape (from the left: D1, D2, D3, D4). 203.1 A block diagram of the wrapper function. 223.2 (a) The captured image, (b) Color segmented image with the
ROI preserved, (c) The re-sized image. Database obtainedfrom (H. Fleyeh 2011). 23
3.3 A structure of TSDR based on artificial intelligence andimage processing technology. 24
3.4 An example of color segmentation. 263.5 Illustration of color segmentation. (a) Original image (b)
L*a*b color space (c), (d), (e), (f), (g), (h), (i), and (j) arethe output images generated from k-means clustering. 27
3.6 Different signage dimensions captured from various dis-tances. 28
3.7 (a) Extracted traffic signage (640×480) (b) Re-sized trafficsignage (191x191). 30
3.8 Overview of PCA process. 313.9 Example of x and x′ . 33

xi
3.10 Overview of image precessing. 364.1 Examples of detected traffic signage and their corresponding
categories of signage for recognition. 384.2 Amount of information per number of eigen vectors for data
reduction. 454.3 The RBF kernel accuracy with respect to parameter γ. 47

xii
LIST OF ABBREVIATIONS
ADAC - Allgemeiner Deutscher Automobil-Club
AI - Artificial Intelligent
ANN - Artificial Neural Network
DtB - Distance to Blob
GPS - Global Positioning System
HSV - Hue, Saturation, and Value
Lab - Luminosity, Chromaticity-layer a, and Chromaticity-layerbPCA - Principle Component Analysis
RBF - Radial Basis Function
RGB - Red, Green, and Blue
ROI - Region of Interest
SVM - Support Vector Machine
TSDR - traffic signage Detection and Recognition

xiii
LIST OF APPENDICES
APPENDIX TITLE PAGE
A MATLAB Programming 53

CHAPTER 1
INTRODUCTION
1.1 Problem Background
Intelligent traffic signage detection and recognition (TSDR) is an essentialcomponent in modern vehicles, providing drivers with safety and precautioninformation. The visibility of traffic signage is important for driver’s safety to indicatethe state of the road, guiding and warning drivers. The first TSDR system was appearedin late 2008 on the redesigned BMW 7-Series, and the following year on the Mercedes-Benz S-Class (Figure 1.1). At that time, these systems were only able to detect theround speed limit signage found all across Europe [1] using a combination of camerasand maps. Objects detected by the cameras are matched with navigation-system mapsfor confirmation. Second generation systems are improved to detect no overtakingsignage. The system is available on the 2011 Volkswagen Phaeton and 2012 Volvo, asa technology called traffic signage information.
Figure 1.1: TSDR system on BMW heads-up display and Mercedes-Benz [2].
The study of traffic signage recognition system has been of great interestsfor recent researches primarily on traffic signage classification. According to the

2
US Census Bureau in 2009 alone, 10.8 million motor vehicle accidents occurredresulting in almost 36 thousand fatalities. Hence, research on different types of TSDRsolutions is very important in developing an accurate, reliable and cost effective trafficsignage recognition system. Due to the complex outdoor environment, variations inweather, lighting conditions, and partial occlusions remain as the greatest challengein vision based traffic signage recognition system. A test has been carried out byAllgemeiner Deutscher Automobil-Club (ADAC) on several existing TSDR systems.Results show that all systems are having problems with variable speed-limit signagethat are increasingly used on major highways [2].
TSDR system can varies in two different ways based on the technology applies:
1. Distributed computing. A software based system that can be located on anetwork communication system by passing messages. The components interactwith each other to obtain the traffic signage information.
2. Artificial intelligent (AI) and image processing. A hardware system thatuses digital camera to detect physical signage and transforms the image to arecognizable feature via image processing.
Table 1.1 shows the characteristics of TSDR based on different technologies.
Table 1.1: Characteristics of TSDR.
Properties AI and image processing Distributed computing
Data Type Physical signage and digital image Digital data
Data Receiver Digital camera Network services
Environment Hard environment Soft environment
Technologies AI and image processing Distributed and pervasive application
Accuracy Coarse classification Refined classification
Feasibility Feasible Immature
This project is to implement a TSDR based on AI and image processingtechniques. Despite distributed computing method can provide a refined recognitionof traffic signage, the implementation requires related facilities and services, suchas network services and global positioning system (GPS). In contrast, AI and imageprocessing technology uses in-vehicle digital camera to capture live images. The focus
3
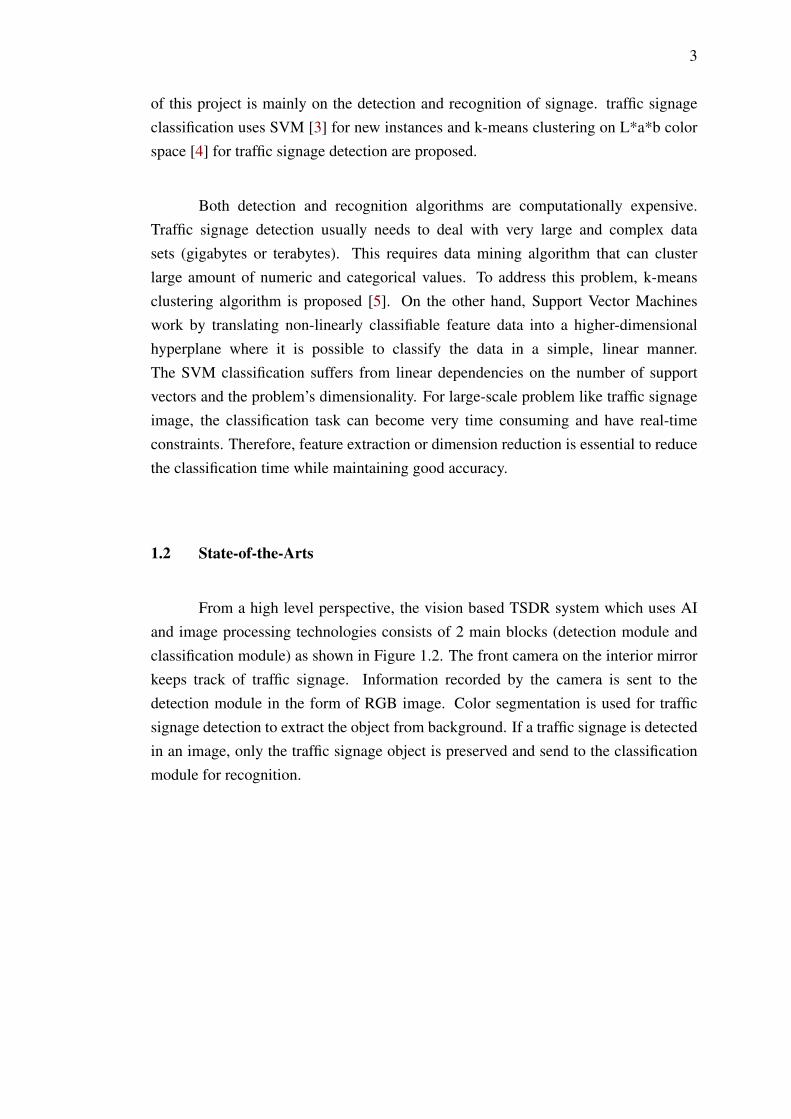
of this project is mainly on the detection and recognition of signage. traffic signageclassification uses SVM [3] for new instances and k-means clustering on L*a*b colorspace [4] for traffic signage detection are proposed.
Both detection and recognition algorithms are computationally expensive.Traffic signage detection usually needs to deal with very large and complex datasets (gigabytes or terabytes). This requires data mining algorithm that can clusterlarge amount of numeric and categorical values. To address this problem, k-meansclustering algorithm is proposed [5]. On the other hand, Support Vector Machineswork by translating non-linearly classifiable feature data into a higher-dimensionalhyperplane where it is possible to classify the data in a simple, linear manner.The SVM classification suffers from linear dependencies on the number of supportvectors and the problem’s dimensionality. For large-scale problem like traffic signageimage, the classification task can become very time consuming and have real-timeconstraints. Therefore, feature extraction or dimension reduction is essential to reducethe classification time while maintaining good accuracy.
1.2 State-of-the-Arts
From a high level perspective, the vision based TSDR system which uses AIand image processing technologies consists of 2 main blocks (detection module andclassification module) as shown in Figure 1.2. The front camera on the interior mirrorkeeps track of traffic signage. Information recorded by the camera is sent to thedetection module in the form of RGB image. Color segmentation is used for trafficsignage detection to extract the object from background. If a traffic signage is detectedin an image, only the traffic signage object is preserved and send to the classificationmodule for recognition.

4
Figure 1.2: High level overview of proposed TSDR.
1.3 Problem Statement
Traffic signage present in unique colors and shapes to attract driver’s attentionand both characteristics determine the meaning of each traffic signage. Practically,traffic signage normally appears at the side of or above the roads as shown in Figure1.3.
Figure 1.3: Speed limit traffic signage.

5
Traffic signage detection and recognition involves classification phase toidentify the content of the extracted traffic signage using various data miningtechniques. The captured images for recognition may contains shading, occlusion,under-illumination, over-illumination, noise, and undesired background that can resultin failure of traffic signage recognition if the detection algorithm is not robust. Thus,taking advanced method to precisely pre-process the traffic signage information isessential to be able to extract the region of interest (ROI) and preserve the informationfor recognition in the later stage.
Color segmentation by shadow and highlight invariant algorithm is a widelyused approach in TSDR [6] in which RGB image is converted to HSV color space .On the other hand, a method based on color information using fuzzy detection of therelevant hue and saturation components is proposed [7]. These algorithms work wellon normal illumination conditions but deteriorate in low lighting conditions such asimages obtained from night driving.
Apart from segmentation, classification is another major challenge in TSDRsystems. The major issue of classification lies in learning of finding an optimalseparation between classes and nearest neighbor approach to seek for similar trainingsamples on huge number of attributes. Increasing of data size per training set andtesting set requires expensive computation cost where it stretches the computationaltime significantly. On a limited processing capacity system, accuracy and efficiencyhave becoming a major problem in real-time application. Fixed size block of 28×28pixels in gray-scale is used for candidate image [8]. This means the amount ofattributes per training set and testing set is as many as 961. There is a need to reduce thefeature vector dimension in order to improve the processing time. Motivated by bothproblems and advantages, this leads to develop a strategy to optimize the detection andrecognition process.
1.4 Objective and Scope
1. To design a TSDR system that is able to detect and identify different signage overa considerable database. The system is expected to be able to accept a 640×480RGB image and transform it into a form of data that is usable for classification.
2. To study and optimize the processing time of the proposed TSDR system. Oneof the main objective is to explore the total processing time of classification,

6
in millisecond, for gray scale representation. The test time is compared withsimplified data set known as eigen vector representation. The results areanalyzed to identify the compute-intensive component.
3. To analyze the overall accuracy and compare the proposed TSDR system withrelevant published researches in term of accuracy. The traffic signage imagesgenerated from the detection model is tested on various SVM recognition modelto compare the performance difference from various aspects. Besides, the overalldetection rate of the k-means clustering is studied to understand the invarianceproperties of the proposed color space.
1.5 Scope of Work
In this project, a traffic signage detection and recognition system is developed.The system consists of 3 stages as shown in Figure 1.4
1. Traffic regulatory signage detection by color segmentation using k-meansclustering to extract the targeted color of the specific traffic signage. Color isa distinct property of traffic signage making them easily distinguish from otherobjects, thus color information is used for signage detection.
2. SVM is a compute-intensive algorithm, instead of testing and training a fullscaled image, feature extraction by Principle Component Analysis (PCA) isapplied to reduce the size of the data for SVM classifier in order to achievehigher throughput in shorter time.
3. At this final stage, the extracted signage is classified in a supervised learningmachine to categorize the traffic signage according to their shapes and innercontents. Support Vector Machine (SVM) learning machine [3] is chosen due toits advantages comparing to neural network [1].

7
Figure 1.4: Sequence of TSDR system.
The experiments is conducted on European traffic signage in the form oftriangle, octagon, and circle. The traffic signage in each image is extracted byexploiting color segmentation algorithm. Next, the extracted signage are sent forclassification and the output is analyzed the to assess the overall accuracy. As forthe performance analysis, reduced dimension method is used to train and test theSVM recognition model. The output of the SVM decision function is analyzed andcompared with the existing designs. Figure 1.5 and Figure 1.6 shows the some exampleof Swedish road traffic regulatory signage.
Figure 1.5: Swedish road traffic signage - warning signage [9].

8
Figure 1.6: Swedish road traffic signage - prohibitory signage [9].
1.6 Organization
This thesis consists of five chapters. The first chapter gives an overview of theproject as well as the problem statements and objectives of the project.
Chapter 2 covers the literature review and discuss on the researches of k-meansand SVM algorithm.
Chapter 3 covers the system overview of this project. It describes the variousmodules development and basic operation of each module. All two modules andenhancement will be described briefly in this chapter.
Chapter 4 will discuss on the system architecture and research methodology.Detection and recognition modules development and basic operation of each modulewill be explained in detail.
Chapter 5 explains the results and analysis of each experiment. Theimprovement in system performance is also discussed in this chapter.
Chapter 6 summarized the project outcome. Future works are suggested tofurther enhance the design.

REFERENCES
1. M. L. Eichner and T. P. Breckon, “Integrated Speed Limit Detection andRecognition from Real-Time Video,” IEEE Intelligent Vehicles Symposium,no. 10220151, pp. 626–631, 2008.
2. “ADAC: Car IT,” December 2010.
3. S. Maldonado-Bascon, S. Lafuente-Arroyo, P. Gil-Jimenez, H. Gomez-Moreno, and F. Lopez-Ferreras, “Road-Sign Detection and RecognitionBased on Support Vector Machines,” IEEE Intelligent Transportation Systems,no. 9490284, pp. 264–278, 2007.
4. G. Siogkas and E. Dermatas, “Detection, Tracking and Classification ofRoad Signs in Adverse Conditions,” IEEE Electrotechnical Conference,no. 9075001, pp. 537–540, 2006.
5. Z. Huang, “Extensions to the k-Means Algorithm for Clustering Large DataSets with Categorical Values,” Data Mining and Knowledge Discovery, vol. 2,pp. 283–304, 1998.
6. H. Fleyeh, “Shadow And Highlight Invariant Colour Segmentation AlgorithmFor Traffic Signs,” IEEE Cybernetics and Intelligent Systems, no. 9220901,pp. 1–7, 2006.
7. C. Paulo, “Automatic Detection and Classification of Traffic Signs,” IEEE
Image Analysis for Multimedia Interactive Services, no. 9863768, p. 11, 2007.
8. S. Perez-Perez, S. Gonzalez-Reyna, S. Ledesma-Orozco, and J. Avina-Cervantes, “Principal component analysis for speed limit Traffic SignRecognition,” IEEE Power, Electronics and Computing, no. 14026194, pp. 1–5, 2013.
9. “Wiki: Road signs in Sweden.”
10. H. Fleyeh, “Road and Traffic Sign Detection and Recognition,” Proc. 10th
EWGT Meet./16th Mini-EURO Conf., pp. 644–653, 2005.
11. T. Kanungo, D. Mount, N. Netanyahu, and C. Piatko, “An Efficient k-MeansClustering Algorithm: Analysis and Implementation,” IEEE Pattern Analysis

52
and Machine Intelligence, vol. 24, no. 7324832, pp. 881–892, 2002.
12. V. Faber, “Clustering and the continuous k-means algorithm,” Los Alamos
Science, pp. 138–144, 1994.
13. M. Shi, W. Haifeng, and H. Fleyeh, “Support Vector Machines for TrafficSigns Recognition,” IEEE Neural Networks, IEEE World Congress on
Computational Intelligence, no. 10365646, pp. 3820–3827, 2008.
14. “Wiki: Support Vector Machine.”
15. “H. Fleyeh. Traffic Signs Database [Online],” November.
16. S. Vij, I. Amritsar, S. Sharma, and C. Marwaha, “PerformanceEvaluation of Color Image Segmentation Using K means Clustering andWatershed Technique,” IEEE Computing, Communications and Networking
Technologies, no. 14063478, pp. 1–4, 2013.
17. L. Chengjun, “Gabor-based Kernel PCA with Fractional Power PolynomialModels for Face Recognition,” IEEE Pattern Analysis and Machine
Intelligence, vol. 26, no. 8004314, pp. 572–581, 2004.
18. M. Turk, “Eigenfaces for Recognition,” IEEE Cognitive Neuroscience, vol. 3,no. 0898-929X, pp. 71–86, 1991.
19. “LIBSVM: a Library for Support Vector Machines,” November 2006.


