1 Cor PHOSPHORUS CONTROL ACTION PLAN and Total Maximum Daily (Annual Phosphorus) Load Report Trafton Lake- Limestone Aroostook County, Maine Trafton Lake PCAP - TMDL Report Maine DEPLW - 0802 Maine Department of Environmental Protection and Maine Association of Conservation Districts EPA Final Review Document – October 13, 2006
Transcript
EPA Final Review Document Trafton Lake PCAP-TMDL Report
1
Cor
PHOSPHORUS CONTROL ACTION PLAN and Total Maximum Daily (Annual Phosphorus) Load Report
Trafton Lake- Limestone Aroostook County, Maine
Trafton Lake PCAP - TMDL Report
Maine DEPLW - 0802
Maine Department of Environmental Protection and Maine Association of Conservation Districts
EPA Final Review Document – October 13, 2006
EPA Final Review Document Trafton Lake PCAP-TMDL Report
Project Premise and Study Methodology……….………………….……………….. 6-7
DESCRIPTION of WATERBODY and WATERSHED Figure 1: Map of Trafton Lake Watershed……….……..…………………………... 8 Drainage System..………………………………………………………..................... 9 Water Quality Information…….……….……………………………………………… 9-10 Principal Uses & Human Development………….. ………………………………… 10 General Soils Description……………………….…………….…………………........ 10
Figure 2: Trafton Lake Watershed Soil Erodibility ………………………………… 10 Fish Assemblage and Fisheries Status……. ……..……………………………….. 11 Land Use Inventory……………………………………………………………………. 12
Figure 3: Trafton Lake Watershed Land Uses …………………………………….. 12 Descriptive Land Use and Phosphorus Export Estimates
Developed Lands Table 1: Land Use Inventory and Phosphorus Loads……………………………... 13 Agriculture…………………………………………………………………………........ 14
Actively Managed Forest Land……………………………………………………….. 14 Shoreline Development ……………………………………………………………….. 14
Phosphorus Loading from Non-Developed Lands and Water
Inactive/Passively Managed Forests………………………………………………… 15 Other Non-Developed Land Areas………………...……………………………..….. 15 Atmospheric Deposition (Open Water)…………………………………………….... 15 PHOSPHORUS LOADS – Watershed, Sediment and In-Lake Capacity………..….. 16
PHOSPHORUS CONTROL ACTION PLAN…………………………………………… 17
Recent and Current NPS/BMP Efforts…………………………………................... 17 Recommendations for Future Work…………………………………………………. 17-20 Water Quality Monitoring Plan………………………...………………..................... 20 PCAP CLOSING STATEMENT…………………………………………………………. 20
EPA Final Review Document Trafton Lake PCAP-TMDL Report
3
APPENDICES
TRAFTON LAKE (Limestone)
Total Maximum Daily (Annual Phosphorus) Load
Introduction to Maine Lake TMDLs and PCAPs ……………………….....…… 22
Water Quality, Priority Ranking, and Algae Bloom History ………………….. 23
Water Quality Standards and Target Goals …………………………………… 24
Estimated Phosphorus Export by Land Use Class (Table 2) ………….……. 24-27
Linking Water Quality and Pollutant Sources ……………...……………….… 27-28
Future Development…………………………………………………………. 28
Internal Lake Sediment Phosphorus Mass ………….….………………… 28
Total Phosphorus Retention Model………………………………………… 29
Load (LA) and Wasteload (WLA) Allocations …….…..…………………... 30
Margin of Safety and Seasonal Variation….………………………………. 30
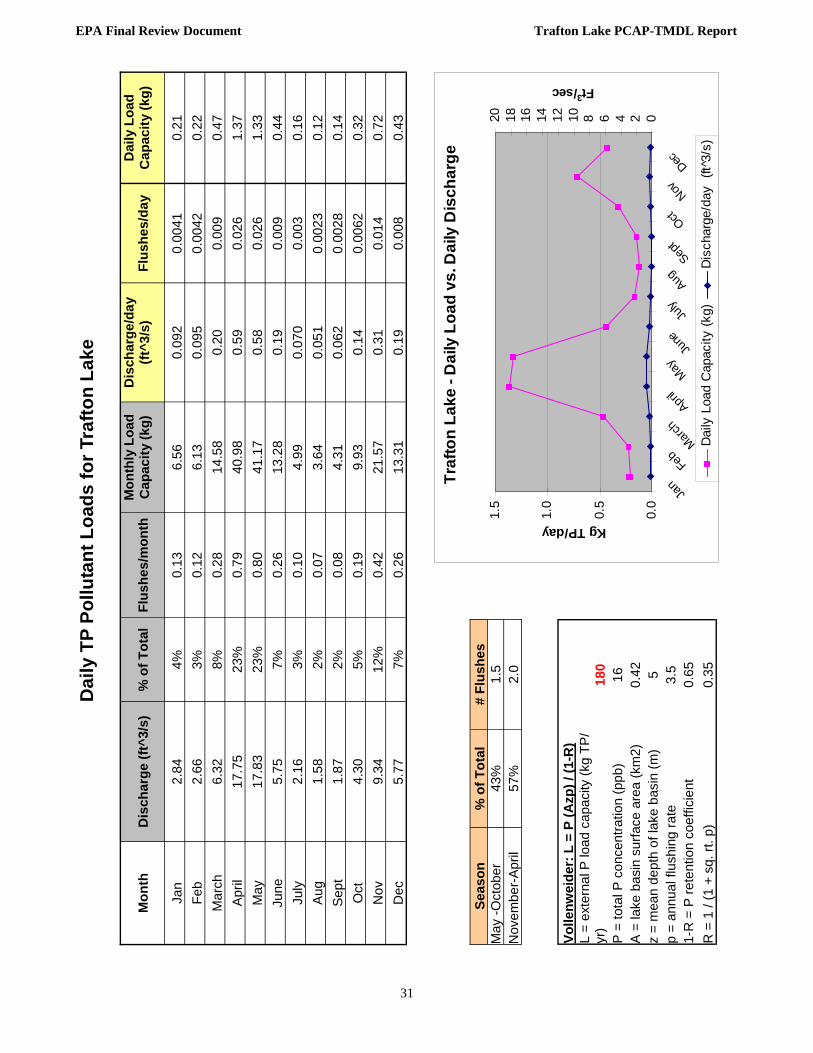
Daily TP Pollutant Loads for Trafton Lake ………………….………………31-32
Public Participation ………………………………………………………………. 33
Stakeholder and Public Review Process and Comments …………………… 33-34
Literature - Lake Specific and General References ……….……….………… 35-40
ACKNOWLEDGMENTS In addition to Maine DEP (Division of Environmental Assessment - Lakes Assessment Section and Watershed Management Division-Augusta and Presque Isle) and U.S. EPA New England Region I staff, the following individuals, groups and agencies were instrumental in the preparation of this Trafton Lake combined Phosphorus Control Action Plan and Total Maximum Daily Load report: MACD staff (Forrest Bell, Jennifer Jespersen, Tricia Rouleau, and Fred Dillon); Maine Department of Agriculture (David Rocque); Maine Forest Service (Chris Martin); Maine Department of Inland Fisheries and Wildlife (Dave Basley); and the Central Aroostook Soil and Water Conservation District (Linda Alverson).
EPA Final Review Document Trafton Lake PCAP-TMDL Report
4
Background
TRAFTON LAKE (Midas No. 9779) is a 103-acre lightly-colored lake located in the Town of Limestone in Aroostook County, Maine. Trafton Lake has a direct drainage area (see map at right and on p. 8) of approximately 3.9 square miles; a maximum depth of 50 feet (15 meters), a mean depth of 15 feet (5 meters); and a flushing rate of 3.5 times per year .
Historical Information
Trafton Lake is an impounded waterbody which was created in 1969 by Public Law 566 to provide spring flood protection and recreation (CASWCD and USDA/SCS 1967). Nutrient contamination has been documented in the lake since sampling began in 1977. This contamination is due in large part to the contribution of phosphorus that is prevalent in area soils. Considered a non-point source (NPS) of pollution, phosphorus stems primarily from soil erosion in the surrounding watershed and stormwater runoff from area roads. A 2002 Watershed Survey for Trafton Lake identified 126 separate NPS problem sites (Easler 2002). The survey found that water quality is affected largely by agriculture, and poorly maintained State roads. Soil erosion can have far reaching impacts, as soil particles effectively transport phosphorus, which serves to “fertilize” the lake and decreases water clarity. Because Trafton Lake is an impounded stream, it collects a substantial amount of sediments over time. These nutrient rich sediments can be a source of high phosphorus as a result of internal loading (VLMP 2005), especially during the warm summer months. Excess phosphorus can also harm fish habitat and lead to nuisance algae blooms—floating mats of green scum—or dead and dying algae. Although there have been efforts to reduce erosion and phosphorus loading in the watershed, phosphorus levels are still high enough to affect water quality and promote algal growth. Trafton Lake is listed by DEP as “water quality limited” which means that it is well below the minimum standard. It is also listed on Maine’s 303(d) list of impaired waterbodies.
Trafton Lake - limestone Phosphorus Control Action Plan
Summary Fact Sheet
Key Terms • Colored lakes or ponds occur when dissolved organic acids, such as tannins or lignins, impart a tea color to
the water, reflected in reduced water transparencies and increased phosphorus values.
• Flushing rate refers to how often the water in the entire lake is replaced on an annual basis.
• Phosphorus: is one of the major nutrients needed for plant growth. It is naturally present in small amounts and limits the plant growth in lakes. Generally, as phosphorus increases, the amount of algae also increases.
• Watershed is a drainage area or basin in which all land and water areas drain or flow toward a central collector such as a stream, river, or lake at a lower elevation.
Trafton Lake Historcial Water Clarity
0
1
2
3
4
1977
1979
1980
1981
1982
1998
2001
2002
2003
2004
2005
Met
ers
Bel
ow S
urfa
ce
DEP Standard Trafton Lake Min.TransparencyTrend (Average Annual)
Water clarity measurements taken since 1977 show how water quality has gradually declined in Trafton Lake with time.
EPA Final Review Document Trafton Lake PCAP-TMDL Report
5
What We Learned
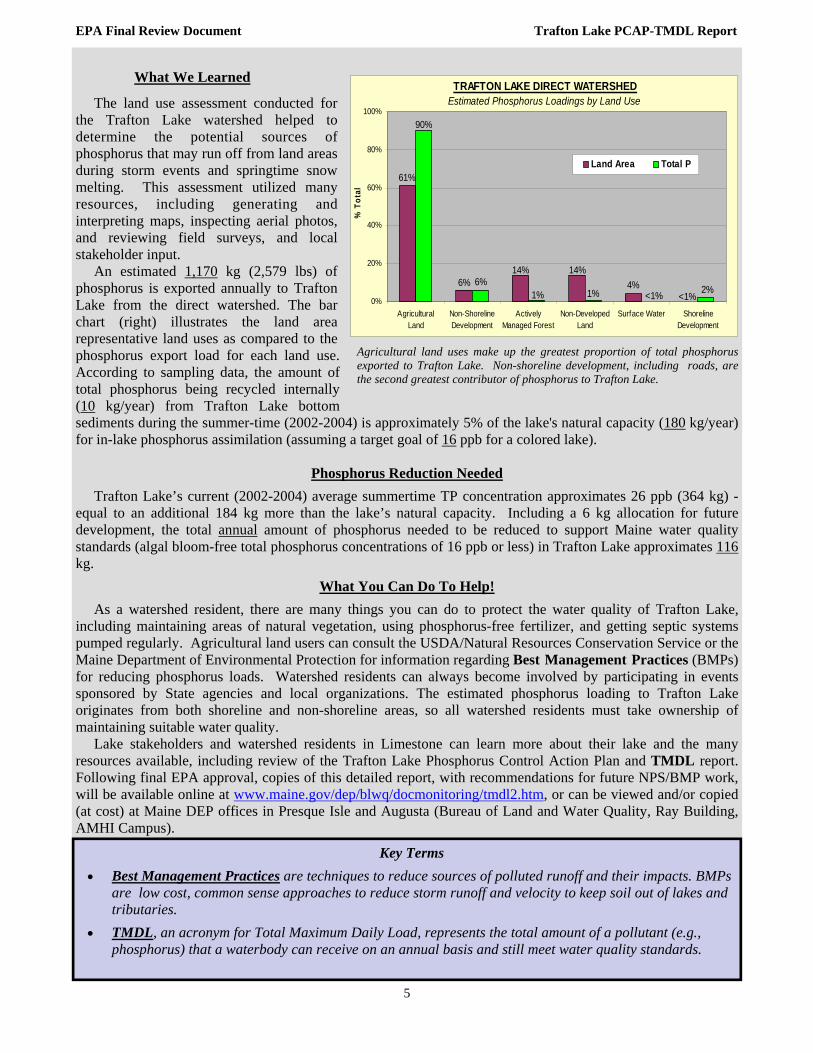
The land use assessment conducted for the Trafton Lake watershed helped to determine the potential sources of phosphorus that may run off from land areas during storm events and springtime snow melting. This assessment utilized many resources, including generating and interpreting maps, inspecting aerial photos, and reviewing field surveys, and local stakeholder input. An estimated 1,170 kg (2,579 lbs) of phosphorus is exported annually to Trafton Lake from the direct watershed. The bar chart (right) illustrates the land area representative land uses as compared to the phosphorus export load for each land use. According to sampling data, the amount of total phosphorus being recycled internally (10 kg/year) from Trafton Lake bottom sediments during the summer-time (2002-2004) is approximately 5% of the lake's natural capacity (180 kg/year) for in-lake phosphorus assimilation (assuming a target goal of 16 ppb for a colored lake).
Phosphorus Reduction Needed
Trafton Lake’s current (2002-2004) average summertime TP concentration approximates 26 ppb (364 kg) - equal to an additional 184 kg more than the lake’s natural capacity. Including a 6 kg allocation for future development, the total annual amount of phosphorus needed to be reduced to support Maine water quality standards (algal bloom-free total phosphorus concentrations of 16 ppb or less) in Trafton Lake approximates 116 kg.
What You Can Do To Help!
As a watershed resident, there are many things you can do to protect the water quality of Trafton Lake, including maintaining areas of natural vegetation, using phosphorus-free fertilizer, and getting septic systems pumped regularly. Agricultural land users can consult the USDA/Natural Resources Conservation Service or the Maine Department of Environmental Protection for information regarding Best Management Practices (BMPs) for reducing phosphorus loads. Watershed residents can always become involved by participating in events sponsored by State agencies and local organizations. The estimated phosphorus loading to Trafton Lake originates from both shoreline and non-shoreline areas, so all watershed residents must take ownership of maintaining suitable water quality.
Lake stakeholders and watershed residents in Limestone can learn more about their lake and the many resources available, including review of the Trafton Lake Phosphorus Control Action Plan and TMDL report. Following final EPA approval, copies of this detailed report, with recommendations for future NPS/BMP work, will be available online at www.maine.gov/dep/blwq/docmonitoring/tmdl2.htm, or can be viewed and/or copied (at cost) at Maine DEP offices in Presque Isle and Augusta (Bureau of Land and Water Quality, Ray Building, AMHI Campus).
Key Terms
• Best Management Practices are techniques to reduce sources of polluted runoff and their impacts. BMPs are low cost, common sense approaches to reduce storm runoff and velocity to keep soil out of lakes and tributaries.
• TMDL, an acronym for Total Maximum Daily Load, represents the total amount of a pollutant (e.g., phosphorus) that a waterbody can receive on an annual basis and still meet water quality standards.
Agricultural land uses make up the greatest proportion of total phosphorus exported to Trafton Lake. Non-shoreline development, including roads, are the second greatest contributor of phosphorus to Trafton Lake.
TRAFTON LAKE DIRECT WATERSHEDEstimated Phosphorus Loadings by Land Use
61%
14%4%
<1%6%
14%
1% 1% <1%6%
2%
90%
0%
20%
40%
60%
80%
100%
AgriculturalLand
Non-ShorelineDevelopment
ActivelyManaged Forest
Non-DevelopedLand
Surface Water ShorelineDevelopment
% T
otal
Land Area Total P
EPA Final Review Document Trafton Lake PCAP-TMDL Report
6
Project Premise This lakes PCAP-TMDL project, funded through a Clean Water Act Section 319-grant from the United States Environmental Protection Agency (EPA), was directed and administered by the Maine Department of Environmental Protection (Maine DEP) under contract with the Maine Association of Conservation Districts (MACD), from 2005 to 2006. The objectives of this project were twofold: First, a comprehensive land use inventory was undertaken to assist Maine DEP in developing a Phosphorus Control Action Plan (PCAP) and a Total Maximum Daily Load (TMDL) report for the Trafton Lake watershed. Simply stated, a TMDL is the total amount of phosphorus that a lake can receive without harming water quality. Maine DEP, with assistance from the MACD, will fully address and incorporate public comments before final submission to the US EPA. (For more specific information on the TMDL process and results, refer to the Appendices or contact Dave Halliwell at the Maine DEP Augusta Office at 287-7649 or at [email protected]). Secondly, watershed assessment work was conducted by the Maine DEP-MACD project team to help assess total phosphorus reduction techniques that would be beneficial for the Trafton Lake watershed. The results of this assessment include recommendations for future conservation work in the watershed to help citizens, organizations, and agencies restore and protect Trafton Lake. Note: To protect the confidentiality of landowners in the Trafton Lake watershed, site-specific information has not generally been provided as part of this PCAP-TMDL report. This Phosphorus Control Action Plan (PCAP) report compiles and refines land use data derived from various sources, including the Maine Office of Geographic Information Systems, the Central Aroostook Soil & Water Conservation District (CA-SWCD), and the Maine Forest Service (MFS). Local citizens, active and/or developing watershed organizations, and conservation agencies will benefit from this compilation of both historical and recently collected data as well as the watershed assessment and the NPS Best Management Practice (BMP) recommendations. Above all, this document is intended to help Trafton Lake stakeholder groups to effectively prioritize future BMP work in order to obtain the funding resources necessary for further NPS pollution mitigation work in their watershed.
Total Phosphorus (TP) - is one of the major nutrients needed for plant growth. It is generally present in small amounts and limits the plant growth in lakes. Generally, as the amount of lake phosphorus increases, the amount of algae also increases.
Nonpoint Source (NPS) Pollution - is polluted runoff that cannot be traced to a specific origin or starting point, but accumulates from overland flow from many different watershed sources
EPA Final Review Document Trafton Lake PCAP-TMDL Report
7
Study Methodology Trafton Lake background information was obtained using several methods, including a review of previous surveys of the lake and watershed, numerous phone conversations and personal interviews with municipal officials, regional organizations and state agencies, input from local stakeholders, and a field visit to the lake.
Land use data were determined using several methods, including (1) Geographic Information System (GIS) map analysis, (2) analysis of topographic maps and (3) analysis of aerial photographs. Watershed boundaries, as well as developed and non-developed land use area (i.e., forest, wetland, grassland) were initially determined using a combination of steps 1 and 2. The GIS land use layer used for this analysis was created at the request of the Maine DEP Bureau of Land and Water Quality (BLWQ). It includes those classes in each layer which are best suited to calculating impermeability of watersheds. Though released in 2006, the Maine Land Cover Data (MELCD) used for this analysis is a land cover map for Maine primarily derived from Landsat Thematic Mapping imagery from the years 1999-2001, which was further refined using panchromatic imagery from the spring and summer months of 2004. Land uses within these maps were further refined by MACD based on the 2002 Watershed Survey (Easler 2002) and by the Central Aroostook Soil and Water Conservation District (CA-SWCD) and local stakeholders using method 3.
Final adjusted phosphorus loading numbers (see Table 2, page 25) were modeled using overlays of soils, and slope. All of the land use coverage data for agricultural areas was re-configured using aerial overlays in conjunction with ground-truthing by local stakeholders throughout the watershed.
Roadway widths were estimated from previous PCAP reports where actual measurements were made for the various road types. In general, state-owned roads were found to be 22 meters wide; town-owned roads were found to be 16 meters wide; and privately-owned roads were found to be 6 meters wide. GIS was used to calculate total road surface area.
Agricultural information within the Trafton Lake watershed was reviewed by the CA-SWCD. Information regarding forest harvest operations were reviewed by the Maine Forest Service, Department of Conservation.
Study Limitations Land use data gathered for the Trafton Lake watershed is as accurate as possible given all of the available information and resources utilized. However, final numbers for the land use analysis and phosphorus loading numbers are approximate, and should be viewed only as carefully researched estimations.
GIS—or geographic information system combines layers of information about a place to give you a better understanding of that place. The information is often represented as computer generated maps.
Ground-truthing involves conducting field reconnaissance in a watershed to confirm the relative accuracy of computer generated maps.
EPA Final Review Document Trafton Lake PCAP-TMDL Report
8
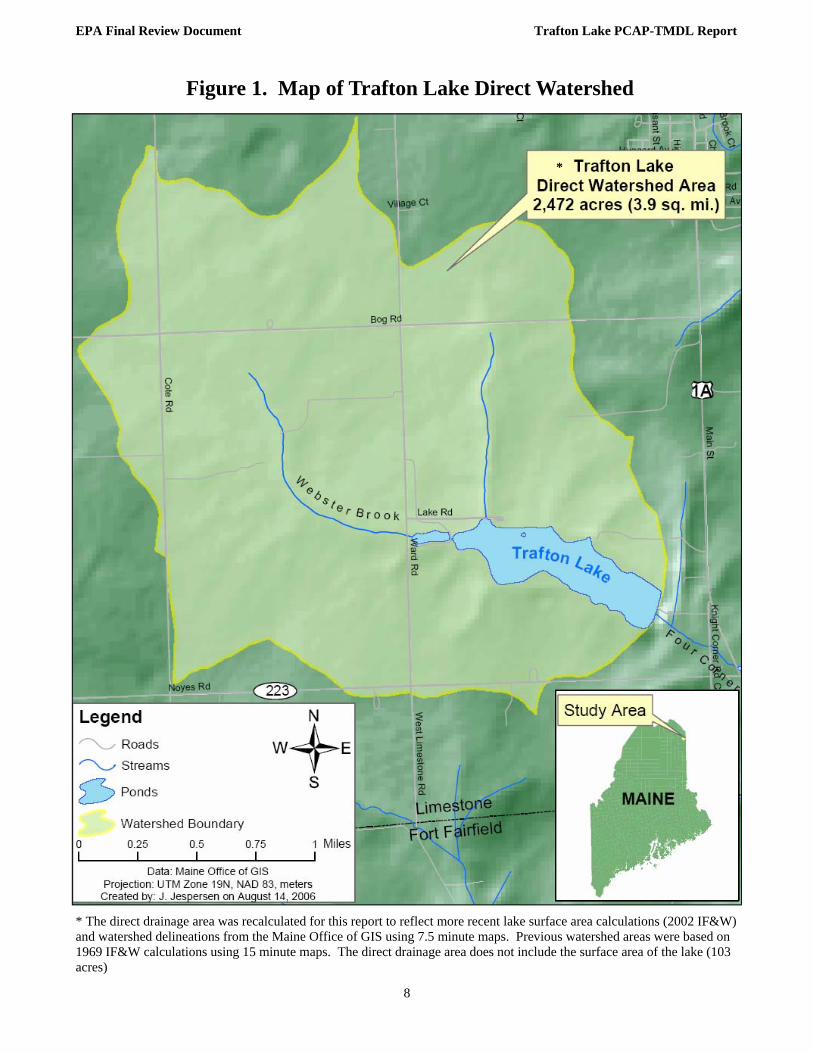
Figure 1. Map of Trafton Lake Direct Watershed
* The direct drainage area was recalculated for this report to reflect more recent lake surface area calculations (2002 IF&W) and watershed delineations from the Maine Office of GIS using 7.5 minute maps. Previous watershed areas were based on 1969 IF&W calculations using 15 minute maps. The direct drainage area does not include the surface area of the lake (103 acres)
*
EPA Final Review Document Trafton Lake PCAP-TMDL Report
9
TRAFTON LAKE Phosphorus Control Action Plan
DESCRIPTION of WATERBODY (MIDAS Number 9779) and WATERSHED
TRAFTON LAKE is a 103-acre (42 hectare) (2002 IF&W survey, per L. Bacon) colored waterbody situated in the town of Limestone (DeLorme Atlas, Map 65), within Aroostook County, Maine. Trafton Lake has a direct watershed area (see Figure 1) of approximately 2,472 acres (3.9 square miles) exclusive of lake surface area. The Trafton Lake direct watershed is located 100% within the town of Limestone. Trafton Lake has a maximum depth of 50 feet (15 meters), overall mean depth of 15 feet (5 meters), and a flushing rate of 3.5 times/year. Note: Direct watershed area and flushing rate were updated for this report based on the revised watershed area from the Maine Office of GIS, and revised volume estimates based on a 2002 IF&W survey reflecting an increase in the lake surface area from 1969 measurements-personal communication Linda Bacon.
Drainage System: Trafton Lake was created in 1967 by the damming of Webster Brook under Public Law 566 to provide spring flood protection and recreation (CASWCD and USDA/SCS 1967). Today, the lake provides irrigation for local agricultural fields (Kathy Hoppe personal communication). Trafton Lake is fed by Webster Brook to the west, which flows through two small ponds. The eastern most, and larger of the ponds located east of Ward Road is privately owned, dammed, and used for irrigating local agricultural fields. Trafton Lake is also fed by an unnamed brook from the north. Water levels in Trafton Lake fluctuate seasonally as water is withdrawn for irrigation. The only outflow is to Four Corners Brook through the man-made earthen dam outlet on the south eastern end of the lake. This brook flows south east from Trafton Lake into Canada where it meets up with the Aroostook River near Four Falls. A public boat launch, located at the town recreational area and RV park, is located on the north west end of the lake.
Trafton Lake Water Quality Information
Trafton Lake is listed on the Maine DEP’s 2004 303(d) list of lakes that do not meet State water quality standards. Therefore, a combined Phosphorus Control Action Plan and TMDL report was prepared for Trafton Lake during the winter/spring of 2006. Based on Secchi disk transparencies (SDT), measures of total phosphorus (TP), and chlorophyll-a, (Chla), the water quality of Trafton Lake is considered to be poor and the potential for nuisance summertime algae blooms is high (Maine VLMP 2005). Together, these water quality data document a trend of increasing trophic state, in direct violation of the Maine DEP Class GPA lakes water quality criteria requiring a stable or decreasing trophic state. A variety of nonpoint sources of pollution may be contributing to the poor water quality in Trafton Lake. The water quality of Trafton Lake is heavily influenced by runoff
Trafton Lake Direct Watershed: The direct watershed refers to the land area that drains to a waterbody without first passing through an associated lake or pond.
Secchi Disk Transparency - a vertical measure of the transparency of water (ability of light to penetrate water) obtained by lowering a black and white disk into the water until it is no longer visi-ble.
Chlorophyll-a is a measurement of the green pigment found in all plants including microscopic plants such as algae. It is used as an estimate of algal biomass; the higher the Chl-a number, the higher the amount of algae in the lake.
Trophic state - the degree of eutrophication of a lake. Transparency, chlorophyll-a levels, phosphorus concentrations, amount of macrophytes, and quantity of dissolved oxygen in the hypolimnion can all be used to assess trophic state.
EPA Final Review Document Trafton Lake PCAP-TMDL Report
10
events from the watershed. During storm events, nutrients such as phosphorus – naturally found in Maine soils - drain into the lake from the surrounding watershed by way of streams and overland flow, eventually being deposited and stored in lake sediments (10 kg based on 2002-2004 measurements). Years of soil erosion have resulted in a buildup of sediment in Trafton Lake, which contributes to internal phosphorus loading. The potential for TP to leave bottom sediments and become available to algae in the water column is high based on very high dissolved oxygen deficiencies in deep areas of the lake (Maine VLMP 2005). Phosphorus is naturally limited in lakes and can be thought of as a fertilizer, a primary food for plants, including algae. When lakes receive excess phosphorus from NPS pollution, it “fertilizes” the lake by feeding the algae. Too much phosphorus can result in nuisance algae blooms, which can damage the ecology and aesthetics of a lake, as well as the economic well-being of the entire lake watershed. A 2002 Watershed Survey for Trafton Lake identified 126 separate NPS problem sites (Easler 2002). The survey found that water quality is affected largely by agriculture and poorly maintained State roads. Other less significant sources of NPS pollution stemmed from lack of vegetative buffers at the town recreational area on the shores of the lake, town roads, residential properties and the dam at the outflow.
Principle Uses & Human Development:
Developed land in the Trafton Lake watershed includes agricultural land, operated forest, residential areas, roads, and parks/cemeteries. The most prevalent of these human uses of the watershed are agricultural (62%). With slightly more than 82% (2,106 acres) of the land area consisting of developed land, NPS pollution is a significant concern for the watershed. Consequently, Trafton Lake is on the State’s 303(d) list due primarily to excessive phosphorus (sediments), lake enrichment and the historical prevalence of nuisance algal blooms.
General Soils Description
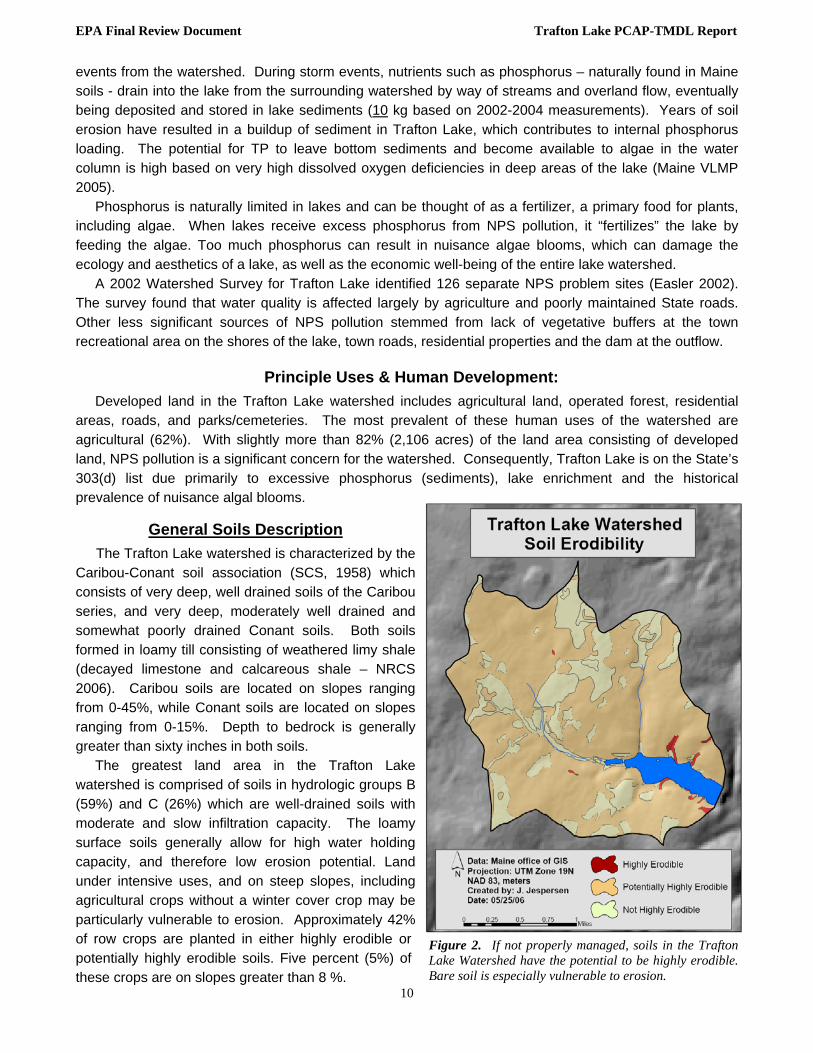
The Trafton Lake watershed is characterized by the Caribou-Conant soil association (SCS, 1958) which consists of very deep, well drained soils of the Caribou series, and very deep, moderately well drained and somewhat poorly drained Conant soils. Both soils formed in loamy till consisting of weathered limy shale (decayed limestone and calcareous shale – NRCS 2006). Caribou soils are located on slopes ranging from 0-45%, while Conant soils are located on slopes ranging from 0-15%. Depth to bedrock is generally greater than sixty inches in both soils. The greatest land area in the Trafton Lake watershed is comprised of soils in hydrologic groups B (59%) and C (26%) which are well-drained soils with moderate and slow infiltration capacity. The loamy surface soils generally allow for high water holding capacity, and therefore low erosion potential. Land under intensive uses, and on steep slopes, including agricultural crops without a winter cover crop may be particularly vulnerable to erosion. Approximately 42% of row crops are planted in either highly erodible or potentially highly erodible soils. Five percent (5%) of these crops are on slopes greater than 8 %.
Figure 2. If not properly managed, soils in the Trafton Lake Watershed have the potential to be highly erodible. Bare soil is especially vulnerable to erosion.
EPA Final Review Document Trafton Lake PCAP-TMDL Report
11
Trafton Lake Fish Assemblage & Fisheries Status
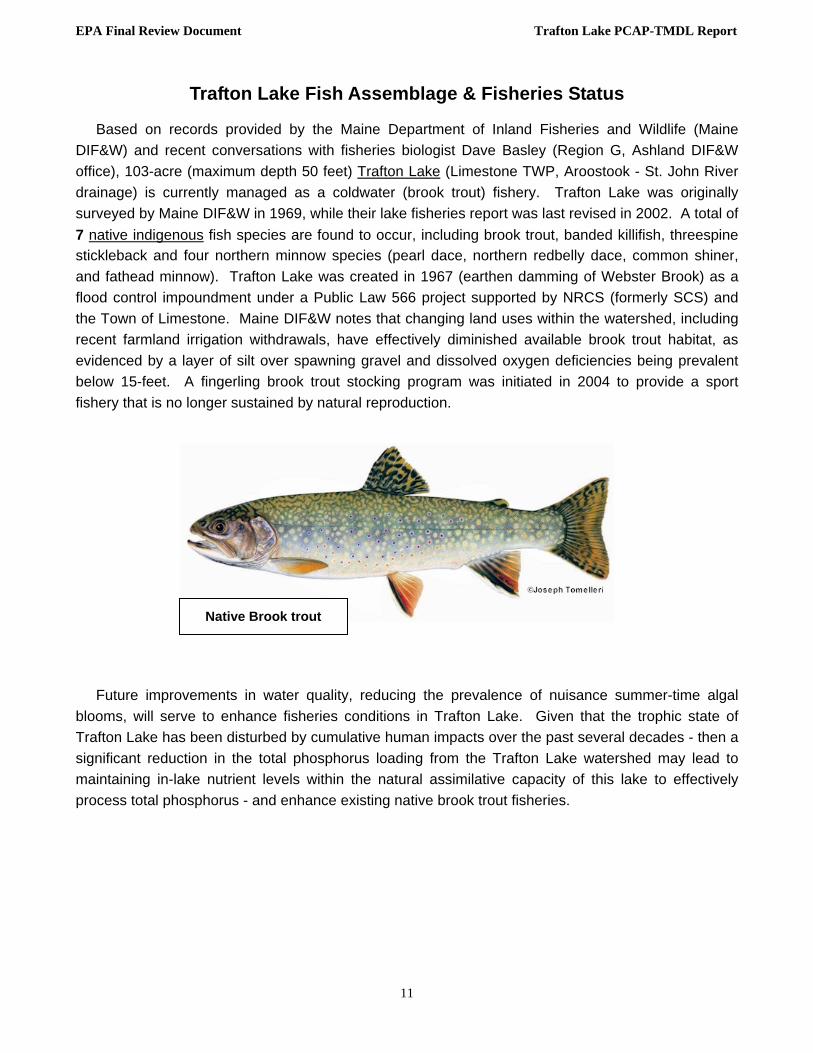
Based on records provided by the Maine Department of Inland Fisheries and Wildlife (Maine DIF&W) and recent conversations with fisheries biologist Dave Basley (Region G, Ashland DIF&W office), 103-acre (maximum depth 50 feet) Trafton Lake (Limestone TWP, Aroostook - St. John River drainage) is currently managed as a coldwater (brook trout) fishery. Trafton Lake was originally surveyed by Maine DIF&W in 1969, while their lake fisheries report was last revised in 2002. A total of 7 native indigenous fish species are found to occur, including brook trout, banded killifish, threespine stickleback and four northern minnow species (pearl dace, northern redbelly dace, common shiner, and fathead minnow). Trafton Lake was created in 1967 (earthen damming of Webster Brook) as a flood control impoundment under a Public Law 566 project supported by NRCS (formerly SCS) and the Town of Limestone. Maine DIF&W notes that changing land uses within the watershed, including recent farmland irrigation withdrawals, have effectively diminished available brook trout habitat, as evidenced by a layer of silt over spawning gravel and dissolved oxygen deficiencies being prevalent below 15-feet. A fingerling brook trout stocking program was initiated in 2004 to provide a sport fishery that is no longer sustained by natural reproduction. Future improvements in water quality, reducing the prevalence of nuisance summer-time algal blooms, will serve to enhance fisheries conditions in Trafton Lake. Given that the trophic state of Trafton Lake has been disturbed by cumulative human impacts over the past several decades - then a significant reduction in the total phosphorus loading from the Trafton Lake watershed may lead to maintaining in-lake nutrient levels within the natural assimilative capacity of this lake to effectively process total phosphorus - and enhance existing native brook trout fisheries.
Native Brook trout
EPA Final Review Document Trafton Lake PCAP-TMDL Report
12
Land Use Inventory
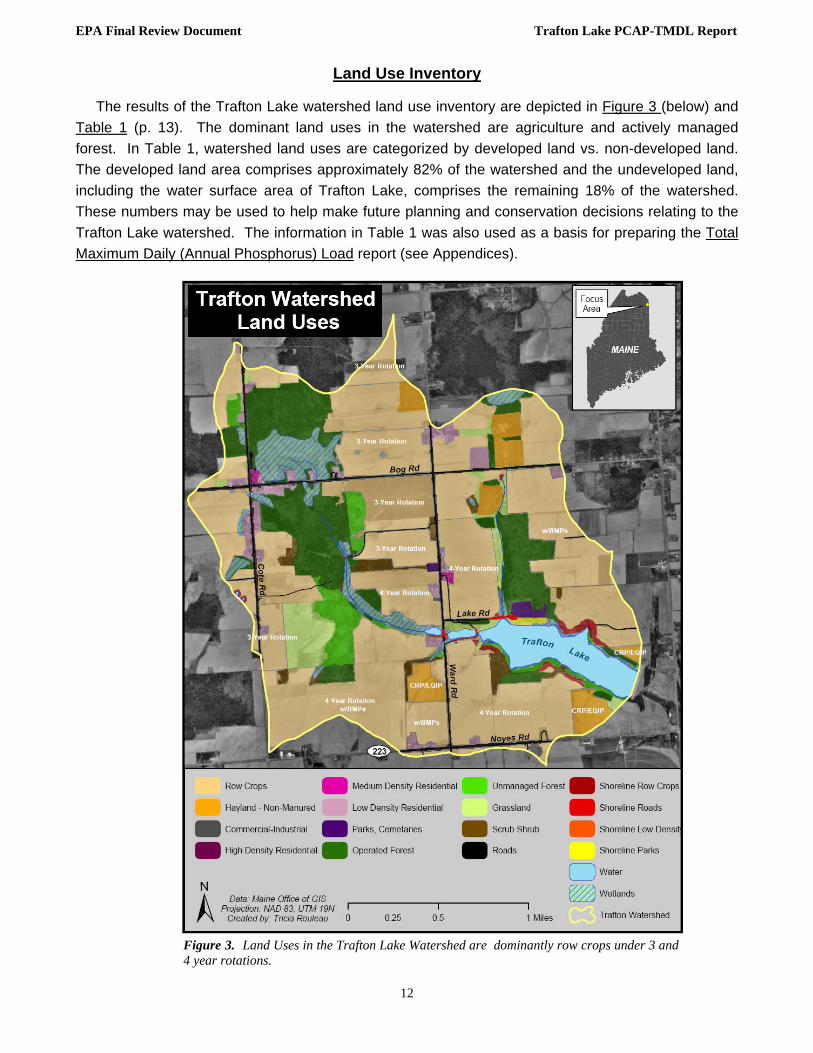
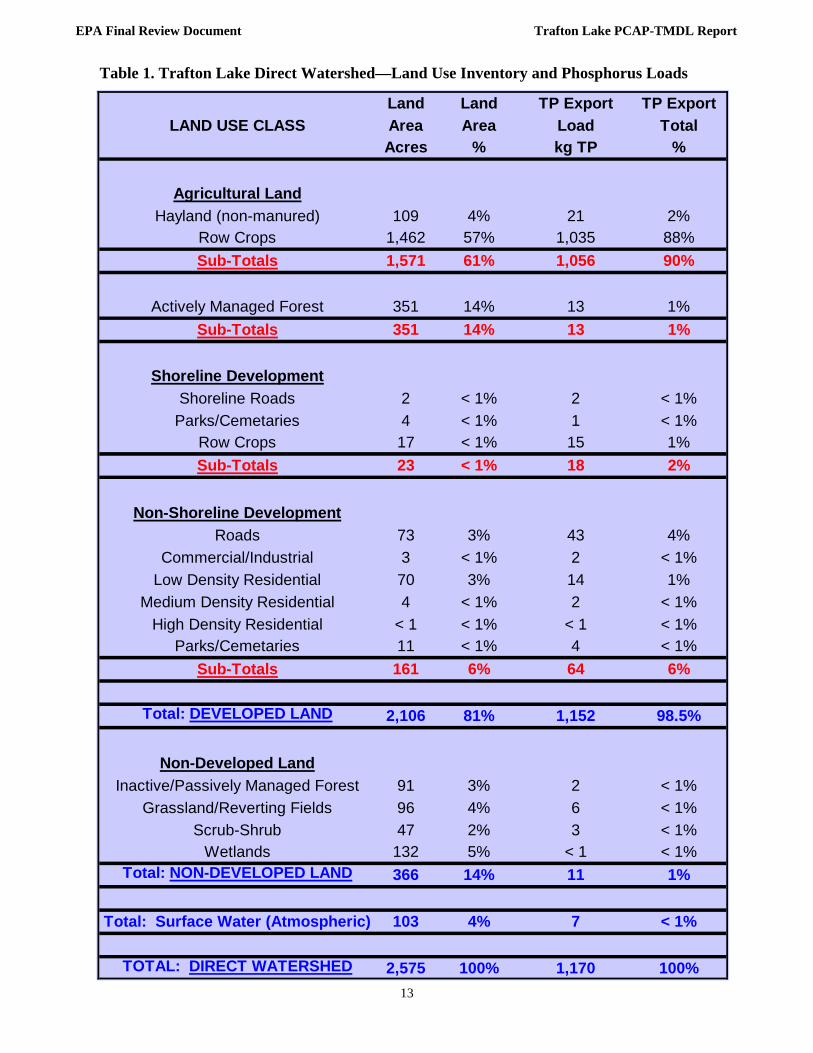
The results of the Trafton Lake watershed land use inventory are depicted in Figure 3 (below) and Table 1 (p. 13). The dominant land uses in the watershed are agriculture and actively managed forest. In Table 1, watershed land uses are categorized by developed land vs. non-developed land. The developed land area comprises approximately 82% of the watershed and the undeveloped land, including the water surface area of Trafton Lake, comprises the remaining 18% of the watershed. These numbers may be used to help make future planning and conservation decisions relating to the Trafton Lake watershed. The information in Table 1 was also used as a basis for preparing the Total Maximum Daily (Annual Phosphorus) Load report (see Appendices).
Figure 3. Land Uses in the Trafton Lake Watershed are dominantly row crops under 3 and 4 year rotations.
EPA Final Review Document Trafton Lake PCAP-TMDL Report
13
Table 1. Trafton Lake Direct Watershed—Land Use Inventory and Phosphorus Loads
Land Land TP Export TP ExportLAND USE CLASS Area Area Load Total
EPA Final Review Document Trafton Lake PCAP-TMDL Report
14
Descriptive Land Use and Phosphorus Export Estimates Agriculture: Agricultural land is estimated to comprise 1,588 acres (62%) of the watershed area in-cluding: non-manured hayland (4%), non-shoreline row crops (57%), and shoreline row crops (1%). These agricultural land uses are estimated to contribute 1,071 kg, or 91% of the total phosphorus loading to Trafton Lake. Row crops are the largest agricultural contributor, accounting for approxi-mately 88% of the total phosphorus load to Trafton Lake. These data were mapped using GIS soft-ware and verified by aerial photography and corrected by staff at the Central Aroostook Soil and Wa-ter Conservation District along with local stakeholders. Actively Managed Forest Land: The estimated operated forest land for the Trafton Lake direct watershed consists of 351 acres. Behind row crops, this is the second largest land use class among the developed land. This estimate is based on a GIS analysis of land uses and represents 14% of the total land area, contributing about 1% of the total phosphorus load to Trafton Lake. Properly managed forestry operations prevent erosion and sedi-mentation from logging sites by using well thought out skidding systems, proper placing of log land-ings, and seeding and stabilizing bare soils following harvest operations. Sustainable forest manage-ment can enhance water quality through sequestering excess nutrients, particularly in forested riparian areas. Harvested forest acres in Maine typically regenerate as forest, whether or not they are under any type of planned forest management or under the supervision of a Licensed Forester. load. Shoreline Development consists of all lands within the immediate shoreland area (250 feet) of Traf-ton Lake. This type of development can have a large total phosphorus loading impact in comparison to their relatively small percentage of the total land area in the watershed. Since there is no residen-tial development along the immediate shoreline, nonpoint source inputs along the shoreline stem pri-marily from agricultural land. Shoreline land uses are estimated to consist of less than 1% of the total watershed land area and contribute about 2% of the total phosphorus load to Trafton Lake. Row crops make up the largest area (17 acres) and contribute the most phosphorus of all developed land use classes in the shore zone. Shoreline Roads: NPS pollution associated with shoreline roads (roads within 250 feet of the shore-line) can vary widely, depending upon road type, slope and proximity to a surface water resource. For the Trafton Lake TMDL, total phosphorus loading from shoreline roads was estimated using GIS land use data to determine the overall area occupied by this category. The average width for shoreline roads in the Trafton Lake watershed was estimated to be about 22 meters for state-owned roads and 16 meters for town-owned roads (based on the findings from previous Maine lake PCAP reports). Based on these factors, shoreline roads were determined to cover about 2 acres and contribute less than 1% of the total phosphorus load to the direct watershed. Overall, shoreline development comprises just < 1% of the total watershed area and contributes approximately 18 kg of total phosphorus annually, accounting for 2% of the estimated phosphorus load.
• To convert kilograms (kg) of total phosphorus to pounds - multiply by 2.2046
EPA Final Review Document Trafton Lake PCAP-TMDL Report
15
Non-Shoreline Development and Land Uses
Non-Shoreline Development consists of all lands outside the immediate shoreline of Trafton Lake - including public and private roads, low density residential areas and commercial/industrial areas. The total land area covered by these land-uses was calculated with GIS land use data and corrected by CA-SWCD staff and local stakeholders.
Roads: Road widths were estimated from previous PCAP reports and from on-screen viewing of ae-rial photography (private roads were estimated to be 6 meters (average width) to determine the amount of total phosphorus loading from this land use category. Based on these factors, non-shoreline roads contribute an estimated 43 kg/year, or 4% of the total phosphorus load to Trafton Lake’s direct watershed. This is the second greatest contributor behind row crops.
Commercial/Industrial: Commercial and industrial land uses (such as large barns) make up a small fraction of the Trafton Lake watershed (< 1%). This land use consists of approximately 3 acres, and contributes an estimated 2 kg/year (< 1%) of total phosphorus to the Trafton Lake direct watershed.
Residential: Low density residential land use consists of approximately 70 acres and contributes an estimated 14 kg/year of the total phosphorus loading to the Trafton Lake direct watershed. Medium density residential land use consists of approximately 4 acres, while high density residential accounts for < 1 acre of the land are in the Trafton Lake watershed. Combined, these residential land use classes account for about 3% of the land area and 1% of the total phosphorus load to Trafton Lake.
Parks/Cemeteries: This land use class consists of approximately 11 acres and contributes an esti-mated 4 kg/year (< 1%) of the total phosphorus loading to the Trafton Lake direct watershed.
Phosphorus Loading from Non-Developed Lands and Water Inactive/Passively Managed Forests: Of the total non-developed land area within the Trafton Lake watershed, 91 acres are forested, characterized by privately-owned non-managed deciduous and mixed forest plots. Less than 1% of the phosphorus load (2 kg/year) is estimated to be derived from non-commercial forested areas within Trafton Lake’s direct drainage area.
Other Non-Developed Land Areas: Combined grasslands/reverting fields, scrub-shrub, and wet-lands account for the remaining 11% of the land area and less than 1% of the total phosphorus export load.
Atmospheric Deposition (Open Water): Surface waters for Trafton Lake’s direct watershed comprise 4% of the total land area (103 acres) and account for an estimated 7 kg of total phosphorus per year, representing less than 1% of the total direct watershed load entering Trafton Lake. The total phosphorus loading coefficient chosen (0.16 kg/ha) is similar to that used for central Maine lakes in Kennebec County. This value represents the median of a range of values from Reckhow (1980) of 0.11 kg/ha to 0.21 kg/ha. The upper range generally reflects a watershed that is 50 percent forested, combined with agricultural areas interspersed with urban/suburban land uses.
EPA Final Review Document Trafton Lake PCAP-TMDL Report
16
PHOSPHORUS LOADS – Watershed, Sediment and In-Lake Capacity
Supporting documentation for the phosphorus loading analysis includes water quality monitoring data from Maine DEP and the Volunteer Lake Monitoring Program, and the development of a phosphorus retention model (see Appendices for detailed information). Please note that two methods were used in our total phosphorus loading analysis to assist with the preparation of this report: 1) a GIS-based model to provide a relative estimation of impacts from watershed land uses for the development of phosphorus reduction strategies by stakeholders; and 2) an in-lake phosphorus concentration model to determine the phosphorus reduction needed for the Trafton Lake TMDL. These two methods may yield different overall phosphorus loading results depending on the available water quality data and particular characteristics of the watersheds and water bodies being modeled.
1. GIS-Based Land Use and Indirect Load Method
Watershed Land Uses: Total phosphorus loadings to Trafton Lake originate from a combination of external watershed and internal lake sediment sources. Watershed total phosphorus sources, totaling approximately 1,170 kg (2,579 lbs) annually (corrected GIS) have been identified and accounted for by land use (See Table 2 - page 25). In contrast, average annual internal lake sediment P-loadings of 10 kg were estimated to be present during the 2002-2004 growing seasons.
2. In-Lake Concentration Method (TMDL)
Lake Capacity: The assimilative capacity for all existing and future non-point pollution sources for Trafton Lake is 180 kg of total phosphorus per year, based on a target goal of 16 ppb (See Phosphorus Retention Model - page 29). Target Goal: A change in 1 ppb in phosphorus concentration in Trafton Lake is equivalent to 11 kg. The difference between the target goal of 16 ppb and the measured average summertime total phosphorus concentration (26 ppb) is 10 ppb or 110 kg (10 ppb x 11 kg).
Future Development: The annual total phosphorus contribution to account for future development for Trafton Lake is 6 kg (0.50 x 11) (see page 28 for more information).
Reduction Needed: Given the target goal and a 6 kg allocation for future development, the total amount of phosphorus needed to be reduced, on an annual basis, to restore water quality standards in Trafton Lake approximates 116 kg (110 + 6).
EPA Final Review Document Trafton Lake PCAP-TMDL Report
17
PHOSPHORUS CONTROL ACTION PLAN
Recent and Current NPS/BMP Efforts
The Aroostook County– Central Aroostook USDA/Natural Resources Conservation Service (USDA/NRCS) and the Central Aroostook Soil and Water Conservation District (CA-SWCD) has an ongoing relationship with land owners in the Trafton Lake watershed and has helped them establish voluntary conservation management plans to reduce nutrient export from agricultural operations. Current agricultural land use practices used throughout the watershed include implementation of both 3-year crop rotations (potato-grain-grass) on approximately 260 acres of land, and 4-year rotations (potato-grain-potato-broccoli) on approximately 570 acres of agricultural land. Other BMPs include diversion ditches and grassed waterways created to redirect flow from approximately 170 acres of row crops in close proximity to Trafton Lake. Additionally, at least 55 acres of land have been placed in Conservation Reserve through the USDA/NRCS CRP program. Survey of several existing agricultural BMPs during a 2002 watershed survey (Easler 2002) showed that there is room for improvement. For example, grassed waterways were filled in and no longer doing the job they were built for. Agricultural land near the shores of Trafton Lake were found to have insufficient vegetative buffers (less than 100-250’). Reduction of nonpoint inputs to Trafton Lake, through BMP installation and proper maintenance, is crucial to achieving suitable long-term water quality. Continued efforts for installing BMPs and reducing NPS pollution in the Trafton Lake watershed are imperative given the current poor water quality conditions. Due to a buildup of sediment in the lake over the years, Trafton Lake is still influenced by historical land management practices in the watershed, and new phosphorus is introduced each year. In 2002, the Town of Limestone, in cooperation with the Limestone Development Foundation (LDF), hired a consultant to conduct a Watershed Survey for the Trafton Lake Watershed. The survey identified many locations throughout the water where specific land uses were contributing to NPS pollution, and recommended BMPs to remedy the problems. In 2004 the LDF applied for a Federal 319 Grant to help fund BMP implementation but the application was not successful (Greg Ward, personal communication). Other discussions to reduce phosphorus in Trafton Lake involved withdrawing nutrient laden water from the surface of the lake for irrigation. While local farmers were more than willing to cooperate, calculations and discussions among DEP staff showed that this method of withdrawal would not do much to change the high P concentrations during the summer (Bouchard 2004). Local interest in dredging the pond to remove phosphorus laden bottom sediments is not a recommended activity. DEP permits are strictly limited to highly polluted sites such as super-fund sites. It would be more effective to install lower cost, traditional BMPs throughout the watershed, thereby limiting the amount of sediment being delivered to the lake.
Recommendations for Future NPS/BMP Work
Trafton Lake has impaired water quality primarily due to historical high phosphorus inputs from nonpoint source (NPS) pollution and resultant internal lake sediment recycling of phosphorus. Specific recommendations regarding recent and current efforts in the watershed, Best Management Practices (BMPs), and actions to reduce (1) external watershed and (2) accumulated bottom sediment phosphorus total phosphorus loadings in order to improve water quality conditions in Trafton Lake are as follows:
EPA Final Review Document Trafton Lake PCAP-TMDL Report
18
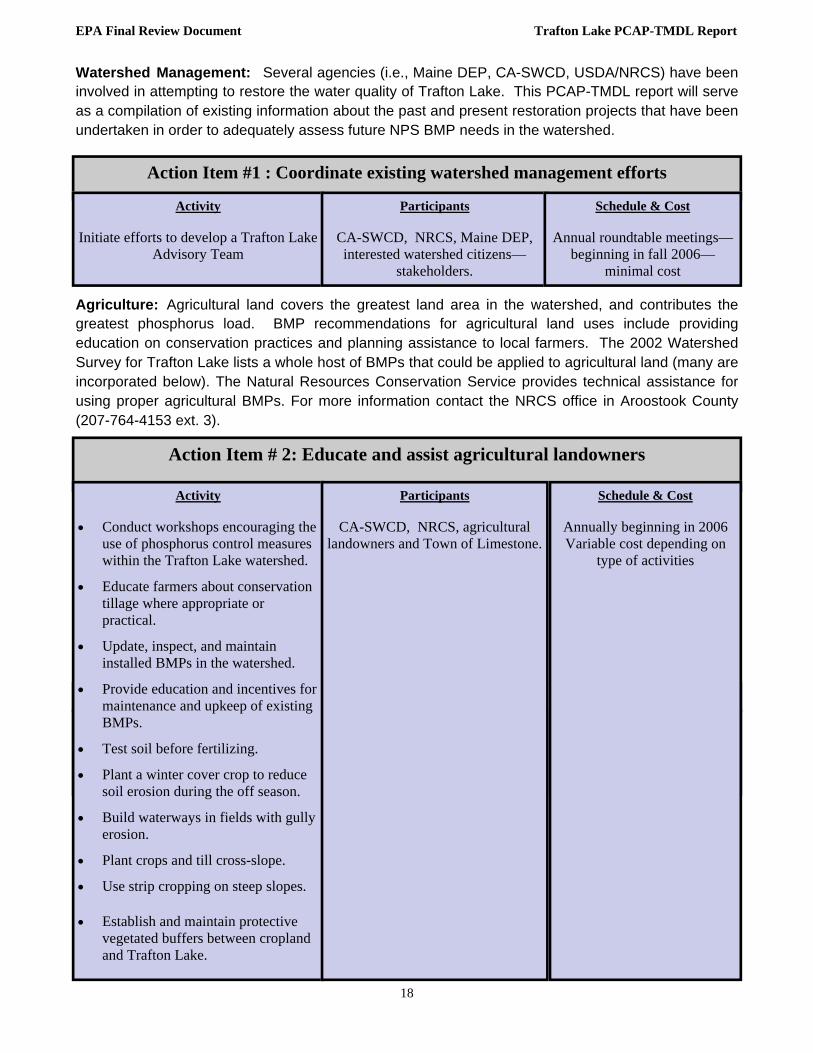
Watershed Management: Several agencies (i.e., Maine DEP, CA-SWCD, USDA/NRCS) have been involved in attempting to restore the water quality of Trafton Lake. This PCAP-TMDL report will serve as a compilation of existing information about the past and present restoration projects that have been undertaken in order to adequately assess future NPS BMP needs in the watershed.
Agriculture: Agricultural land covers the greatest land area in the watershed, and contributes the greatest phosphorus load. BMP recommendations for agricultural land uses include providing education on conservation practices and planning assistance to local farmers. The 2002 Watershed Survey for Trafton Lake lists a whole host of BMPs that could be applied to agricultural land (many are incorporated below). The Natural Resources Conservation Service provides technical assistance for using proper agricultural BMPs. For more information contact the NRCS office in Aroostook County (207-764-4153 ext. 3).
Activity Initiate efforts to develop a Trafton Lake
Advisory Team
Participants
CA-SWCD, NRCS, Maine DEP, interested watershed citizens—
stakeholders.
Schedule & Cost
Annual roundtable meetings—beginning in fall 2006—
minimal cost
EPA Final Review Document Trafton Lake PCAP-TMDL Report
19
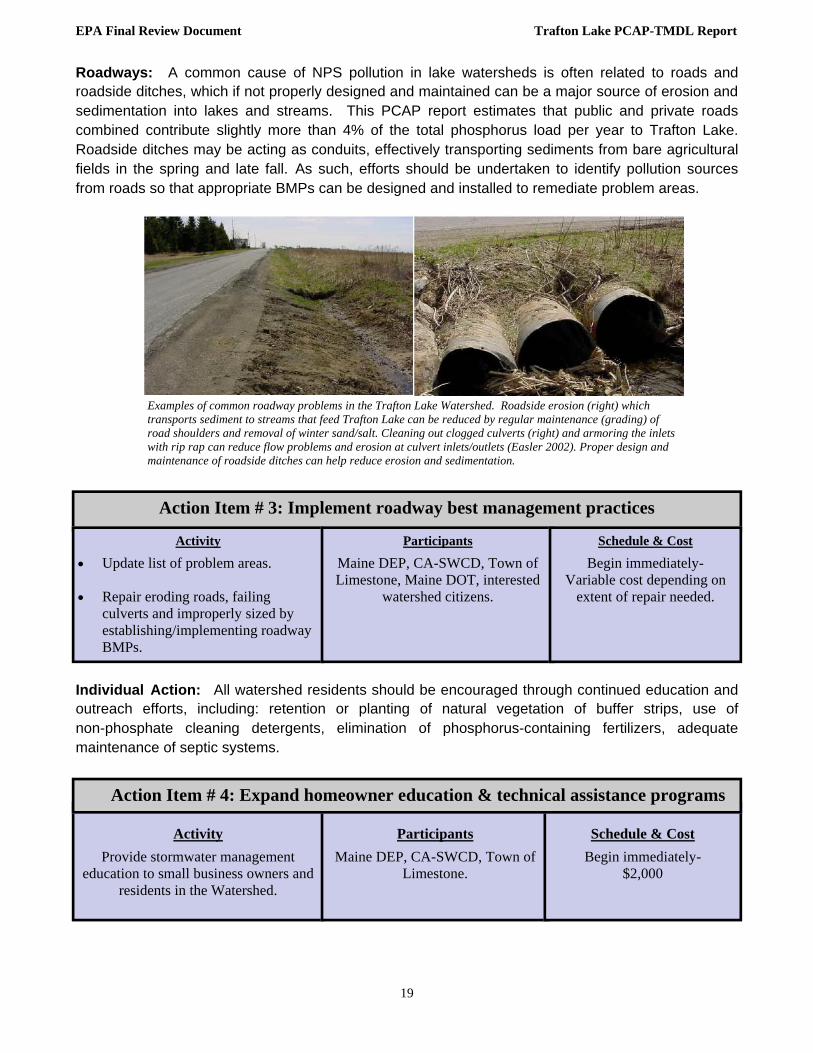
Roadways: A common cause of NPS pollution in lake watersheds is often related to roads and roadside ditches, which if not properly designed and maintained can be a major source of erosion and sedimentation into lakes and streams. This PCAP report estimates that public and private roads combined contribute slightly more than 4% of the total phosphorus load per year to Trafton Lake. Roadside ditches may be acting as conduits, effectively transporting sediments from bare agricultural fields in the spring and late fall. As such, efforts should be undertaken to identify pollution sources from roads so that appropriate BMPs can be designed and installed to remediate problem areas.
Individual Action: All watershed residents should be encouraged through continued education and outreach efforts, including: retention or planting of natural vegetation of buffer strips, use of non-phosphate cleaning detergents, elimination of phosphorus-containing fertilizers, adequate maintenance of septic systems.
Action Item # 3: Implement roadway best management practices
Activity
• Update list of problem areas. • Repair eroding roads, failing
culverts and improperly sized by establishing/implementing roadway BMPs.
Participants
Maine DEP, CA-SWCD, Town of Limestone, Maine DOT, interested
watershed citizens.
Schedule & Cost
Begin immediately- Variable cost depending on
extent of repair needed.
Examples of common roadway problems in the Trafton Lake Watershed. Roadside erosion (right) which transports sediment to streams that feed Trafton Lake can be reduced by regular maintenance (grading) of road shoulders and removal of winter sand/salt. Cleaning out clogged culverts (right) and armoring the inlets with rip rap can reduce flow problems and erosion at culvert inlets/outlets (Easler 2002). Proper design and maintenance of roadside ditches can help reduce erosion and sedimentation.
Activity
Provide stormwater management education to small business owners and
EPA Final Review Document Trafton Lake PCAP-TMDL Report
20
Municipal Action: Municipal officials should be trained in current erosion and sediment control methods in order to ensure public compliance with local and state water quality laws and ordinances (Shoreland Zoning, Erosion and Sedimentation Control Law, plumbing code). This can be achieved through education and enforcement action, when necessary.
WATER QUALITY MONITORING PLAN
Historically, the water quality of Trafton Lake has been monitored via measures of Secchi disk transparencies during the open water months since 1977 (Maine DEP and VLMP). Continued long-term water quality monitoring (water transparencies) for Trafton Lake will be conducted monthly, from May to October, through the continued efforts of Maine DEP and VLMP. Under this planned, post-TMDL water quality-monitoring plan, sufficient data will be acquired to adequately track seasonal and inter-annual variation and long-term trends in water quality in Trafton Lake. A post-TMDL adaptive management status report will be prepared 5 to 10 years following EPA approval.
PCAP CLOSING STATEMENT
The Maine Association of Conservation Districts and the Central Aroostook Soil and Water Conservation District, in cooperation with lake stakeholders, have initiated the process of addressing nonpoint source pollution in the Trafton Lake watershed. Technical assistance by the USDA/NRCS, the ME-DEP, and the CA-SWCD is available to watershed towns (Limestone) to mitigate phosphorus export from existing NPS pollution sources and to prevent excess loading from future sources. The Town of Limestone has initiated efforts to address NPS pollution in the Trafton Lake watershed, and recognizes the inherent value of the lake and its vital link to the community by providing strong support to restoration efforts. The town should continue with efforts to cooperate with the NRCS, ME-DEP, and the CA-SWCD in the pursuit of local and regional lake protection and improvement strategies. This teamwork approach will result in an eventual and overall improvement in Trafton Lake through NPS-BMP implementation and increased public involvement and awareness.
Action Item # 5: BMP training for municipal officials Activity
• Town officials should participate in ME-DEP training opportunities in Erosion and Sediment Control BMPs.
• Municipal officials should ensure
compliance with local and state water quality laws and ordinances.
Participants
Maine DEP, Maine DOT, CA-SWCD, Town of Limestone, interested watershed citizens.
Schedule & Cost
Annually beginning 2007 Variable cost depending on
extent of repair needed.
EPA Final Review Document Trafton Lake PCAP-TMDL Report
21
APPENDICES
TRAFTON LAKE (Limestone)
Total Maximum Daily (Annual Phosphorus) Load
Introduction to Maine Lake TMDLs and PCAPs ……………………...…… 22
Water Quality, Priority Ranking, and Algae Bloom History ………………….. 23
EPA Final Review Document Trafton Lake PCAP-TMDL Report
22
Maine Lake TMDLs and Phosphorus Control Action Plans (PCAPs)
You may be wondering what the acronym 'TMDL' represents and what it is all about. TMDL is actually short for 'Total Maximum Daily Load’ as historically applied to point-source pollutants. This information, no doubt, does little to clarify TMDLs in most people's minds. However, when we think of this as an annual phosphorus load (Annual Total Phosphorus Load), it begins to make more sense, for nonpoint source pollution. Following EPA guidance (Spring 2006), we now report daily and annual phosphorus loads.
Simply stated, excess nutrients or phosphorus in lakes promote nuisance algae growth/blooms - resulting in the violation of water quality standards as measured by water clarity depths of less than 2 meters. A lake TMDL is prepared to estimate the total amount of total phosphorus that a lake can accept on an annual basis without harming water quality. Historically, development of TMDLs was first mandated by the Clean Water Act in 1972, and was applied primarily to point sources of water pollution. As a result of public pressure to further clean up water bodies, lake and stream TMDLs are now being prepared for watershed-generated Non-Point Sources (NPS) of pollution.
Nutrient enrichment of lakes through excess total phosphorus originating from watershed soil erosion has been generally recognized as the primary source of NPS pollution. Major land use activities contributing to the external phosphorus load in lakes include residential-commercial developments, roadways, agriculture, and commercial forestry. Statewide, there are 32 lakes in Maine which do not meet water quality standards due to excessive amounts of in-lake total phosphorus - the great majority of which are located in south-central Maine.
The first Maine lake TMDL was developed (1995) for Cobbossee Lake by the Cobbossee Watershed District (CWD) - under contract with Maine DEP and U.S. EPA. Recently (June 2006), Cobbossee Lake was officially removed from the TMDL listing of “impaired” waterbodies, in light of 8 years of above standard water clarity measures. TMDLs have been approved by U.S. EPA for Madawaska Lake (Aroostook County), Sebasticook Lake, East Pond (Belgrade Lakes), China Lake, Webber, Threemile and Threecornered ponds (Kennebec County), Mousam Lake, the Highland lakes in Falmouth and Bridgton, Annabessacook Lake, Pleasant Pond, Upper Narrows Pond and Little Cobbossee Lake (under contract with CWD), Sabattus, Toothaker, and Unity ponds and Long Lake (with assistance from Lakes Environmental Association), Togus Pond, Duckpuddle Pond, Lovejoy Pond, Lilly Pond, Sewall Pond, Cross Lake, and Daigle Pond. PCAP-TMDLs are presently being prepared by Maine DEP, with assistance from the Maine Association of Conservation Districts (MACD) and County Soil and Water Conservation Districts (SWCD’s) - for Hermon and Hammond Ponds, and Monson Pond. PCAP-TMDL studies have also been initiated for Echo Lake, as well as several other remaining 2004 303(d) listed PCAP-TMDL waterbodies in Aroostook County.
Lake PCAP-TMDL reports are based in part on available water quality data, including seasonal measures of total phosphorus, chlorophyll-a, Secchi disk transparencies, and dissolved oxygen-water temperature profiles. Actual reports include: a lake description; watershed GIS assessment and estimation of NPS pollutant sources; selection of a total phosphorus target goal (acceptable amount); allocation of watershed/land-use phosphorus loadings, and a public participation component to allow for stakeholder review.
PCAP-TMDLs are important tools for maintaining and protecting acceptable lake water quality and are designed to 'get a handle' on the magnitude of the NPS pollution problem and to develop plans for implementing Best Management Practices (BMPs) to effectively address the lake’s water pollution problem. Landowners and watershed groups are eligible to receive technical and financial assistance from state and federal natural resource agencies to reduce watershed total phosphorus loadings to the lake. Note: for non-stormwater regulated lake watersheds, the development of phosphorus-based lake PCAP-TMDLs are not generally intended by Maine DEP to be used for regulatory purposes.
For further information, contact Dave Halliwell, Maine Department of Environmental Protection,
Lakes PCAP-TMDL Program Manager, SHS #17, Augusta, ME 04333 (207-287-7649). E-mail: [email protected]
EPA Final Review Document Trafton Lake PCAP-TMDL Report
23
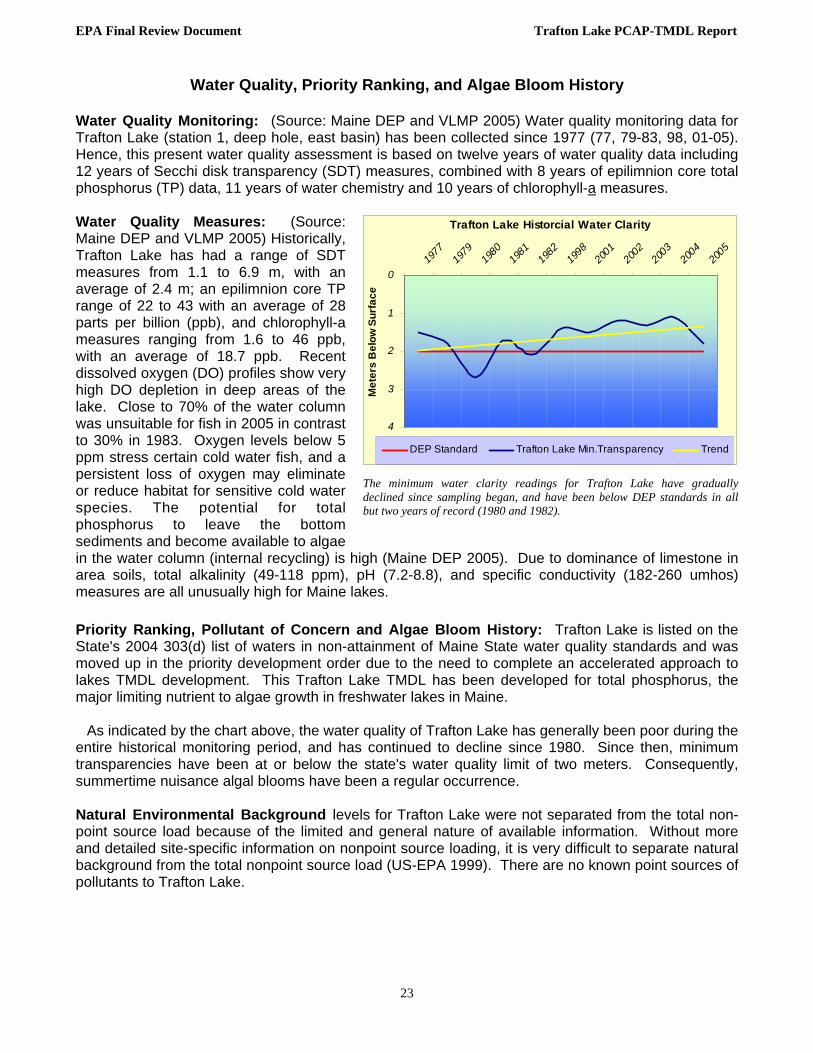
Water Quality, Priority Ranking, and Algae Bloom History Water Quality Monitoring: (Source: Maine DEP and VLMP 2005) Water quality monitoring data for Trafton Lake (station 1, deep hole, east basin) has been collected since 1977 (77, 79-83, 98, 01-05). Hence, this present water quality assessment is based on twelve years of water quality data including 12 years of Secchi disk transparency (SDT) measures, combined with 8 years of epilimnion core total phosphorus (TP) data, 11 years of water chemistry and 10 years of chlorophyll-a measures. Water Quality Measures: (Source: Maine DEP and VLMP 2005) Historically, Trafton Lake has had a range of SDT measures from 1.1 to 6.9 m, with an average of 2.4 m; an epilimnion core TP range of 22 to 43 with an average of 28 parts per billion (ppb), and chlorophyll-a measures ranging from 1.6 to 46 ppb, with an average of 18.7 ppb. Recent dissolved oxygen (DO) profiles show very high DO depletion in deep areas of the lake. Close to 70% of the water column was unsuitable for fish in 2005 in contrast to 30% in 1983. Oxygen levels below 5 ppm stress certain cold water fish, and a persistent loss of oxygen may eliminate or reduce habitat for sensitive cold water species. The potential for total phosphorus to leave the bottom sediments and become available to algae in the water column (internal recycling) is high (Maine DEP 2005). Due to dominance of limestone in area soils, total alkalinity (49-118 ppm), pH (7.2-8.8), and specific conductivity (182-260 umhos) measures are all unusually high for Maine lakes. Priority Ranking, Pollutant of Concern and Algae Bloom History: Trafton Lake is listed on the State's 2004 303(d) list of waters in non-attainment of Maine State water quality standards and was moved up in the priority development order due to the need to complete an accelerated approach to lakes TMDL development. This Trafton Lake TMDL has been developed for total phosphorus, the major limiting nutrient to algae growth in freshwater lakes in Maine. As indicated by the chart above, the water quality of Trafton Lake has generally been poor during the entire historical monitoring period, and has continued to decline since 1980. Since then, minimum transparencies have been at or below the state's water quality limit of two meters. Consequently, summertime nuisance algal blooms have been a regular occurrence.
Natural Environmental Background levels for Trafton Lake were not separated from the total non-point source load because of the limited and general nature of available information. Without more and detailed site-specific information on nonpoint source loading, it is very difficult to separate natural background from the total nonpoint source load (US-EPA 1999). There are no known point sources of pollutants to Trafton Lake.
Trafton Lake Historcial Water Clarity
0
1
2
3
4
1977
1979
1980
1981
1982
1998
2001
2002
2003
2004
2005
Met
ers
Bel
ow S
urfa
ce
DEP Standard Trafton Lake Min.Transparency Trend
The minimum water clarity readings for Trafton Lake have gradually declined since sampling began, and have been below DEP standards in all but two years of record (1980 and 1982).
EPA Final Review Document Trafton Lake PCAP-TMDL Report
24
WATER QUALITY STANDARDS & TARGET GOALS Maine State Water Quality Standard for nutrients which are narrative, are as follows (July 1994 Maine Revised Statutes Title 38, Article 4-A): “Great Ponds Class A (GPA) waters shall have a stable or decreasing trophic state (based on appropriate measures, e.g., total phosphorus, chlorophyll-a, Secchi disk transparency) subject only to natural fluctuations, and be free of culturally induced algae blooms which impair their potential use and enjoyment.” Maine DEP’s functional definition of nuisance algae blooms include episodic occurrence of Secchi disk transparencies (SDTs) < 2 meters for lakes with low levels of apparent color (<30 SPU) and for higher color lakes where low SDT readings are accompanied by elevated chlorophyll-a levels (>8 ppb). Trafton Lake is a lightly-colored lake (average color 31 SPUs), with low late summer SDT readings (recent annual average of 1.3 meters 98, 01-05), in association with high chlorophyll-a levels (25.3 ppb recent late summer average). Currently, Trafton Lake does not meet water quality standards primarily due to non-attainment of water transparency measures over time. This water quality assessment uses historic documented conditions as the primary basis for comparison. Designated Uses and Antidegradation Policy: Trafton Lake is designated as a GPA (Great Pond Class A) water in the Maine DEP state water quality regulations. Designated uses for GPA waters in general include: water supply; primary/secondary contact recreation (swimming and fishing); hydro-electric power generation; navigation; and fish and wildlife habitat. No change of land use in the watershed of a Class GPA water body may, by itself or in combination with other activities, cause water quality degradation that would impair designated uses of downstream GPA waters or cause an increase in their trophic state. Maine's anti-degradation policy requires that "existing in-stream water uses, and the level of water quality necessary to sustain those uses, must be maintained and protected." Numeric Water Quality Target: The numeric (in-lake) water quality target for Trafton Lake is set at 16 ppb total phosphorus (180 kg/yr). Since numeric criteria for phosphorus do not exist in Maine's state water quality regulations - and would be less accurate targets than those derived from this study - we employed best professional judgment to select a target in-lake total phosphorus concentration that would attain the narrative water quality standard. Spring-time (late May - June) total phosphorus levels in Trafton Lake historically approximated 22 ppb, while summertime levels averaged 39 ppb (1977-81,1982). Current data show that summertime levels (1998, 2001-2005) are much lower than their historical average, at 26 ppb. In summary, the numeric water quality target goal of 16 ppb for total phosphorus in Trafton Lake was based on observed late spring - early summer pre-water column stratification measures, generally corresponding to non-bloom conditions, as reflected in suitable (water quality attainment) measures of both Secchi disk transparency (> 2.0 meters) and chlorophyll-a (< 8.0 ppb).
ESTIMATED PHOSPHORUS EXPORT BY LAND USE CLASS
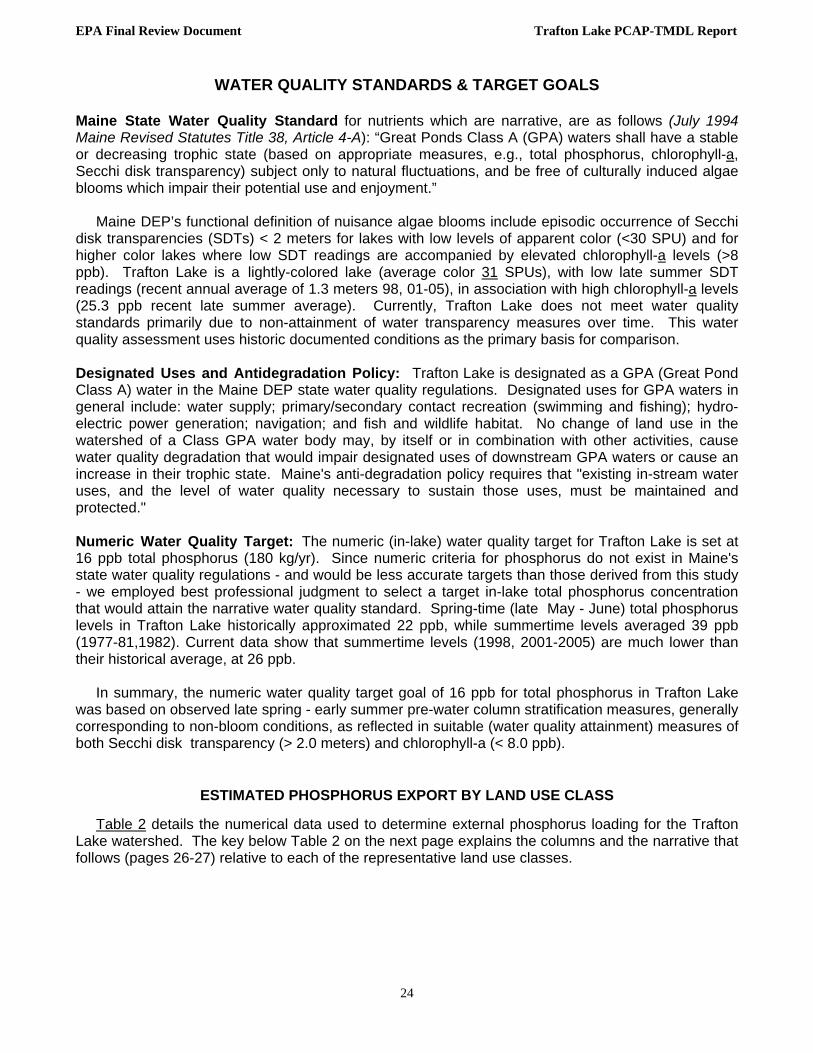
Table 2 details the numerical data used to determine external phosphorus loading for the Trafton Lake watershed. The key below Table 2 on the next page explains the columns and the narrative that follows (pages 26-27) relative to each of the representative land use classes.
EPA Final Review Document Trafton Lake PCAP-TMDL Report
25
Key for Columns in Table 2
Land Use Class: The land use category that was analyzed for this report
Land Area in Acres: The area of each land use as determined by GIS mapping, and aerial photography.
Land Area %: The percentage of the watershed covered by the land use. TP Coeff. Range kg/ha: The range of the total phosphorus coefficient values listed in the literature associated with the corresponding land use.
*TP Coeff. Value kg/ha: The selected coefficient for each land use category. The total phosphorus coefficient is determined from previous research – usually the median value, if listed by the author. The coefficient is often adjusted using best professional judgment based on conditions including soil type, slope, and best management practices (BMPs) (see pages 25 and 26 for more information).
Land Area in Hectares: Conversion, 1.0 acre = 0.404 hectares
TP Export Load kg TP : Uses GIS to incorporate soils and slopes into the final phosphorus loading number using total hectares.
TP Export Total %: The percentage of estimated phosphorus exported by the land use.
Table 2. Trafton Lake Direct Watershed - Estimated Phosphorus Export by Land Use Land Land TP Coeff. TP Coeff. Land TP Export TP Export
LAND USE CLASS Area Area Range Value Area Load Total
EPA Final Review Document Trafton Lake PCAP-TMDL Report
26
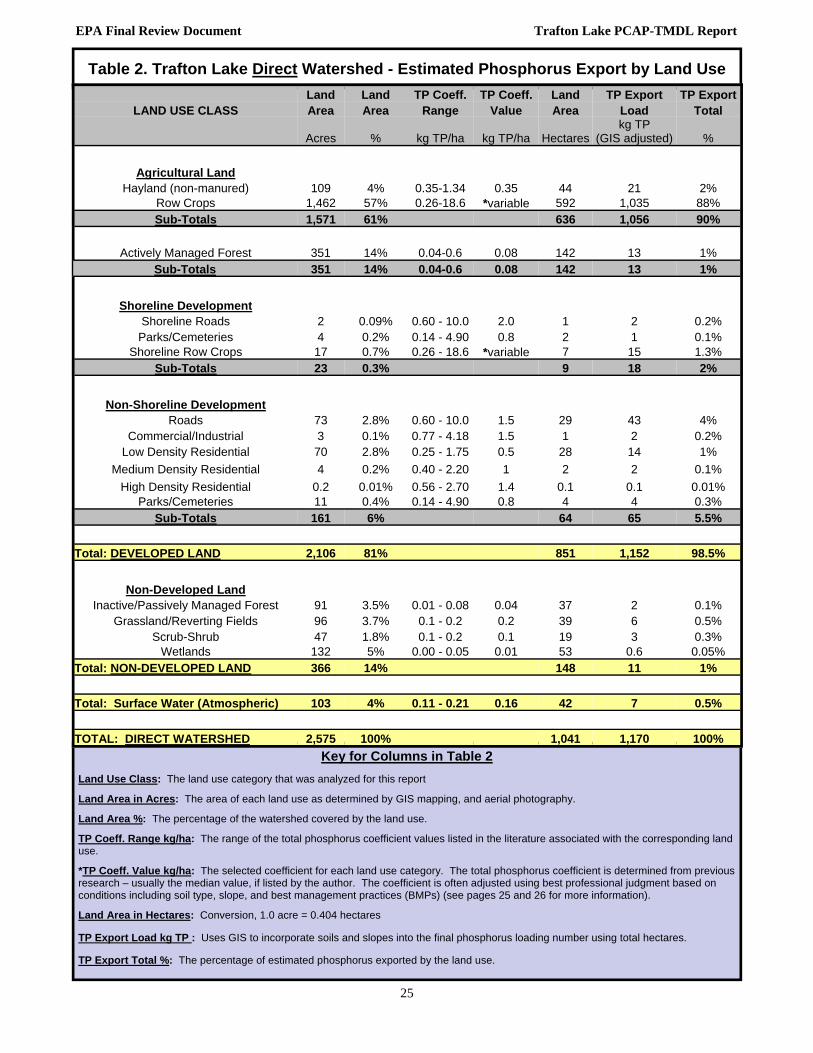
Total Phosphorus Land Use Loads
Estimates of total phosphorus export from different land uses found in the Trafton Lake watershed as presented on the previous page in Table 2 represent the extent of the current direct watershed phosphorus loading to the lake (1,170 kg/yr).
Total phosphorus loading measures are provided as a range of values to reflect the degree of uncertainty generally associated with such relative estimates (Walker 2000). The watershed total phosphorus loading values were primarily determined using literature and locally-derived export coefficients as found in Schroeder (1979), Reckhow et al. (1980), Dennis (1986), Dennis et al. (1992), and Bouchard et al. (1995) for residential properties, roadways, agriculture and other types of land uses. Export coefficients for agricultural land with BMPs were adjusted using carefully researched reduction methods including the EPA STEPL model. Agriculture: Phosphorus loading coefficients as applied to agricultural land uses were adopted from: Dennis and Sage (1981): non-manured hayland (0.64 kg/ha/yr), and Reckhow et al. (1980): row crops/tillage/cultivation (2.24 kg TP/ha/yr). The land use coefficient used for row crops under 3-year rotation (1.17 kg TP/ha/yr) is based on the mean for one year of row crops and two years of grain or grass (0.64 kg TP/ha/yr). Since row crops under 4-year rotations remain in either potato or broccoli for 3 of the 4 years, and in grain for the fourth, the reduction is not as great as the 3-year rotation. Thus, the coefficient used for crops in 4-year rotation (1.84 kg TP/ha/yr) represents an 18% reduction from the original coefficient of 2.24 kg TP/ha/yr. The coefficient used for agricultural land in which other types of BMPs (e.g. grassed waterways and diversion ditches) were implemented (1.66 kg TP/ha/yr) was adjusted using the EPA STEPL model which incorporates annual rainfall, soil P concentration, hydrological soil group, and the percent of area the BMP covers. The coefficient used for all non-manured hayland in the watershed may actually underestimate its impact since some hayland may receive commercial fertilizer. Actively Managed Forest Land: The phosphorus loading coefficient applied to actively managed forest land (0.08 kg/ha/yr) was changed beginning with the Long Lake PCAP-TMDL report following consultation with Lakes Environment Association and Maine Forest Service staff. The rationale for this change was based on the fact that properly managed harvest areas will generally act as phosphorus sinks during periods of regeneration. According to the Maine Forest Service, of the nearly 3,500 water quality inspections conducted throughout the state in 2003, approximately 7% of the harvested sites posed “unacceptable” risks to water quality. PCAP-TMDL reports prior to the Long Lake report identified a “worst case” upper limit phosphorus loading coefficient of 0.6 kg/ha/yr for operated forestland. Therefore, for any given watershed in Maine we determined that applying this “worst case” coefficient to 7% of operated forest land while applying the “best case” coefficient (0.04 kg/ha/yr) to the remaining operated forest land would provide a relatively accurate estimate of total phosphorus loading from operated forest land. Combining worst case and best case coefficients yields the new phosphorus loading coefficient for operated forest land of 0.08 kg/ha/yr [(0.07 x 0.6) + (0.93 x 0.04)]. This category may be underestimated since some of the wetland areas may have been harvested in the past (Linda Alverson, personal communication). Residential Development: The phosphorus loading coefficients for residential land uses, including; low density residential (0.5 kg/ha/yr), medium density residential (1.0 kg TP/ha/yr), and high density residential (1.4 kg TP/ha/yr) were developed from information on residential lot stormwater export of phosphorus as derived from Dennis et al (1992), and first implemented in the 1995 Cobbossee Lake TMDL. Private and Public Roads: The total phosphorus loading coefficient for private and public roads (2.0 kg/ha/yr for private/camp roads and 1.5 kg/ha/yr for public roads) was chosen, in part, from previous studies of rural Maine highways (Dudley et al. 1997) and phosphorus research by Jeff Dennis (Maine DEP).
EPA Final Review Document Trafton Lake PCAP-TMDL Report
27
Parks/Cemeteries: The phosphorus loading coefficient for parks and cemeteries (0.80 kg TP/ha/yr) is based on unpublished research from Wagner-Mitchell-Monagle (ENSR 1989). Total Developed Lands Phosphorus Loading: A total of 98.5% (1,152 kg) of the phosphorus loading to Trafton Lake is estimated to have been derived from the cumulative effect of the preceding cultural land use classes: agriculture (90% - 1,056 kg); forestry (1%-13 kg); shoreline development 2% - 18 kg); and non-shoreline development (6% - 65 kg) as depicted in Table 2. Non-Developed Lands Phosphorus Loading: The phosphorus export coefficient for inactive/passively managed forest land (0.04 kg/ha/yr) is based on a New England regional study (Likens et al 1977) and phosphorus availability recommendation by Jeff Dennis (Maine DEP). The phosphorus export coefficient for grassland/reverting fields (0.20 kg/ha/yr) and scrub/shrub (0.10 kg/ha/yr) is based on research by Bouchard in 1995 (0.20 kg/ha/yr). The export coefficient for wetlands is based on research by Bouchard 1995 and Monagle 1995 (0.01 kg/ha/yr). The number of acres in this category may be overestimated since some of the forested wetlands may have been harvested in the past (Linda Alverson, personal communication). The phosphorus loading coefficient chosen for surface waters (atmospheric deposition -0.16 kg/ha/yr), was originally used in the China Lake TMDL (Kennebec County), and subsequent PCAP-TMDL lake studies in Maine. Shoreline Erosion: Undeveloped areas of the lake shoreline that may be eroding due to natural causes (i.e., wind, wave and ice action) are not included as a source of phosphorus due to the difficulty in quantifying impact area and assigning suitable phosphorus loading coefficients.
Phosphorus Load Summary
It is our professional opinion that the selected export coefficients are appropriate for the Trafton Lake watershed. Results of the land use analysis indicate that a best estimate of the present total phosphorus loading from external nonpoint source nutrient pollution approximates 1,170 kg/yr.
LINKING WATER QUALITY and POLLUTANT SOURCES Annual/Daily Load Capacity: Total Phosphorus (TP) serves as a surrogate measure of Maine’s narrative water quality standards for lake trophic status. The TP TMDL is originally calculated as an annual load (kg TP/yr), which is based on an in-lake numeric water quality target (ppb or ug/l TP) and the annual flushing rate of the lake, using generally accepted response models for lakes. It is appropriate and justifiable to express the Trafton Lake TMDL as an annual load because the lake basin has an annual flushing rate of 3.5 (see discussion of seasonal variation on page 30). The annual flushing rate, or the theoretical rate at which water in a lake is replaced on an annual basis, is calculated as:
# Flushes/year = (Watershed area * Runoff/year) / Lake volume
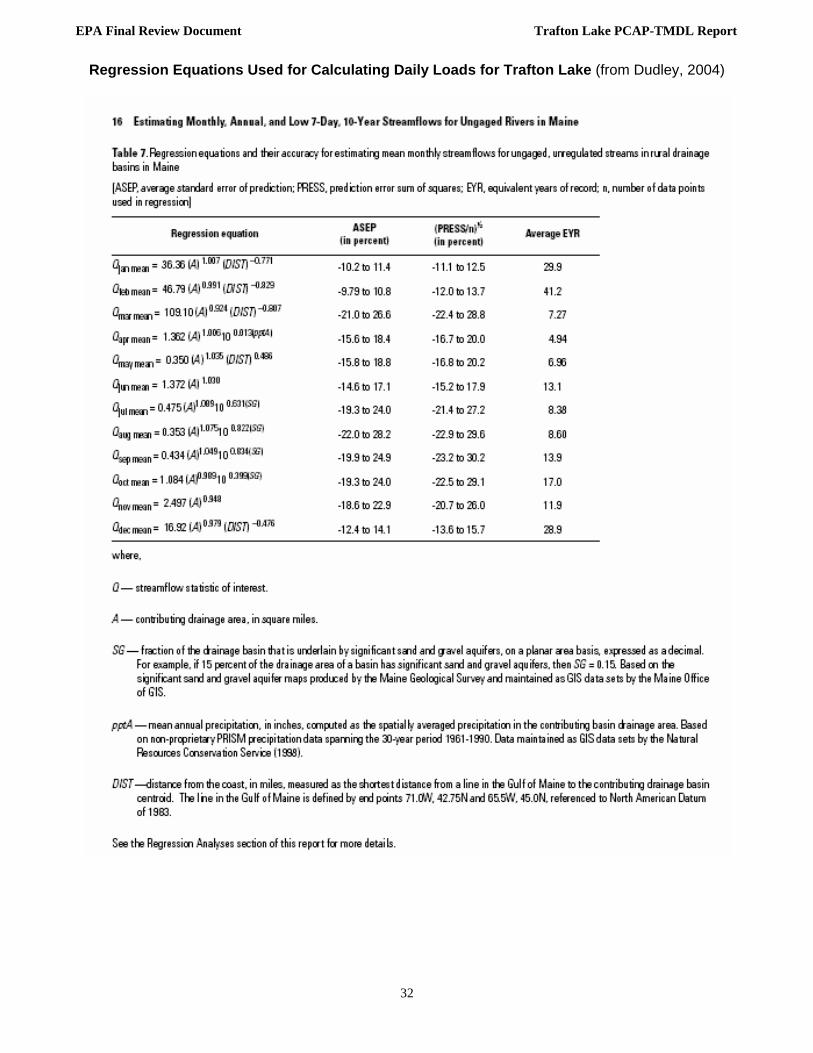
This TMDL also presents daily pollutant loads of TP in addition to the annual load. Daily flushing rates were determined by first calculating the monthly discharge from Dudley (2004). A number of parameters were required for input into these formulas including: Drainage area; % of significant sand and gravel aquifers; distance from the watershed to a predetermined line off the Maine coast; and mean annual precipitation. These parameters were determined using GIS (ArcMap 8.3).
Once the monthly discharge was determined, this information was used to ascertain the following:
% Total Monthly Discharge = (Total monthly discharge/ Total annual discharge) *100
# Flushes/month = (Total # of flushes/year * % of total monthly discharge)
# Flushes/day = (Flushes/month)/(Days/month)
EPA Final Review Document Trafton Lake PCAP-TMDL Report
28
The majority of the parameters used for calculating the annual loading capacity (kg TP/yr) on page 31 (Dillon and Rigler 1974, where L= (Azp)/(1-R)), remain unchanged for use in calculating the daily loading capacity. The exception is p, where p now equals flushes/month. Thus, the monthly loading capacity is expressed as a proportion of the annual loading capacity, based on the discharge expected for that month.
The daily loading capacity was then calculated as follows:
The daily loads for Trafton Lake are presented on page 31. Assimilative Loading Capacity: The Trafton Lake basin lake assimilative capacity is capped at 180 kg TP/yr, as derived from the empirical phosphorus retention model based on a target goal of 16 ppb. This value reflects the modeled annual phosphorus loading responsible for current trophic state conditions, based on a long term goal of maintaining average phosphorus concentrations at or below 16 ppb. This TMDL target concentration is expected to be met at all times (daily, monthly, seasonally, and annually). However, because the annual load of TP as a TMDL target is more easily aligned with the design of best management practices used to implement nonpoint source and stormwater TMDLs for lakes than daily loads of specific pollutants, this TMDL report recommends that the annual load target in the TMDL be used to guide implementation efforts. Ultimate compliance with water quality standards for the TMDL will be determined by measuring in-lake water quality to determine when standards are attained. Future Development: The Maine DEP water quality goal of maintaining a stable trophic state includes a reduction of current P-loading which accounts for both recent P-loading as well as potential future development in the watershed. The methods used by Maine DEP to estimate future growth (Dennis et al. 1992) are inherently conservative, as they provide for relatively high-end regional growth estimates and largely non-mitigated P-export from new development. This provides an additional non-quantified margin of safety to ensure the attainment of state water quality goals. Previously unaccounted P-loading from anticipated future development on Trafton Lake watershed approximates 6.0 kg annually (0.5 x 1 ppb change in trophic state or 11 kg).
Human population growth will continue to occur in the Trafton Lake watershed, contributing new sources of phosphorus to the lake. Hence, existing phosphorus source loads must be reduced by at least 11 kg to allow for anticipated new sources of phosphorus to Trafton Lake.
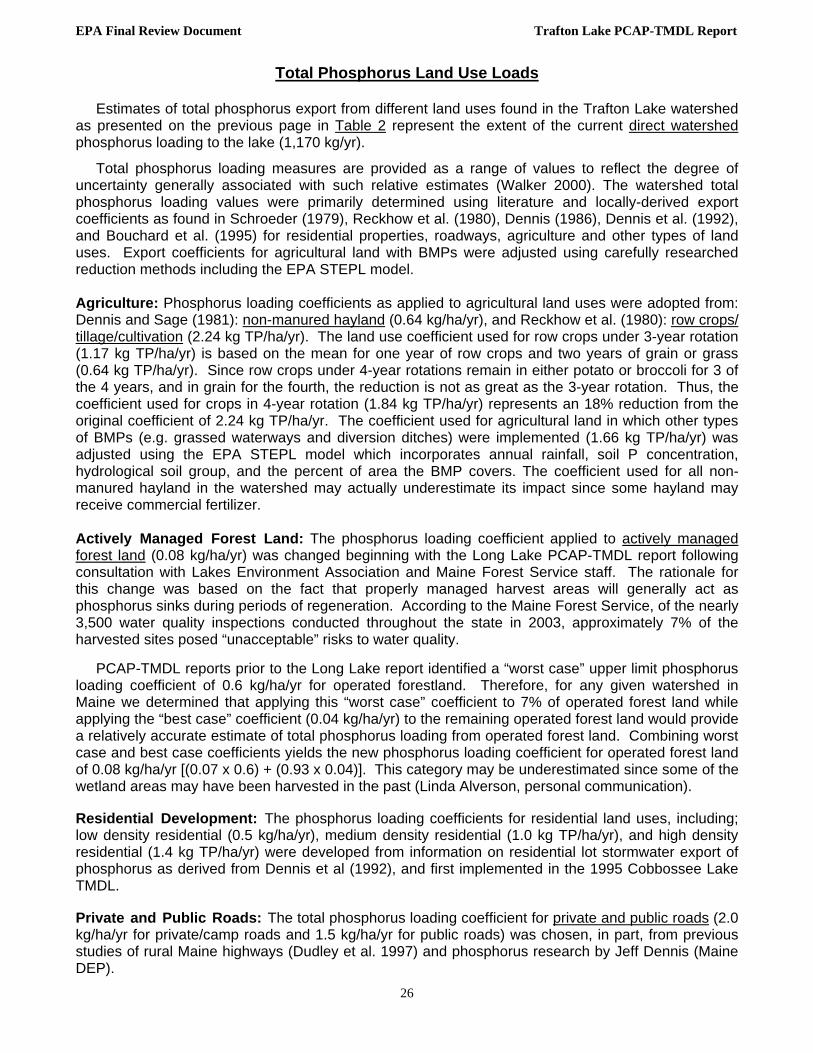
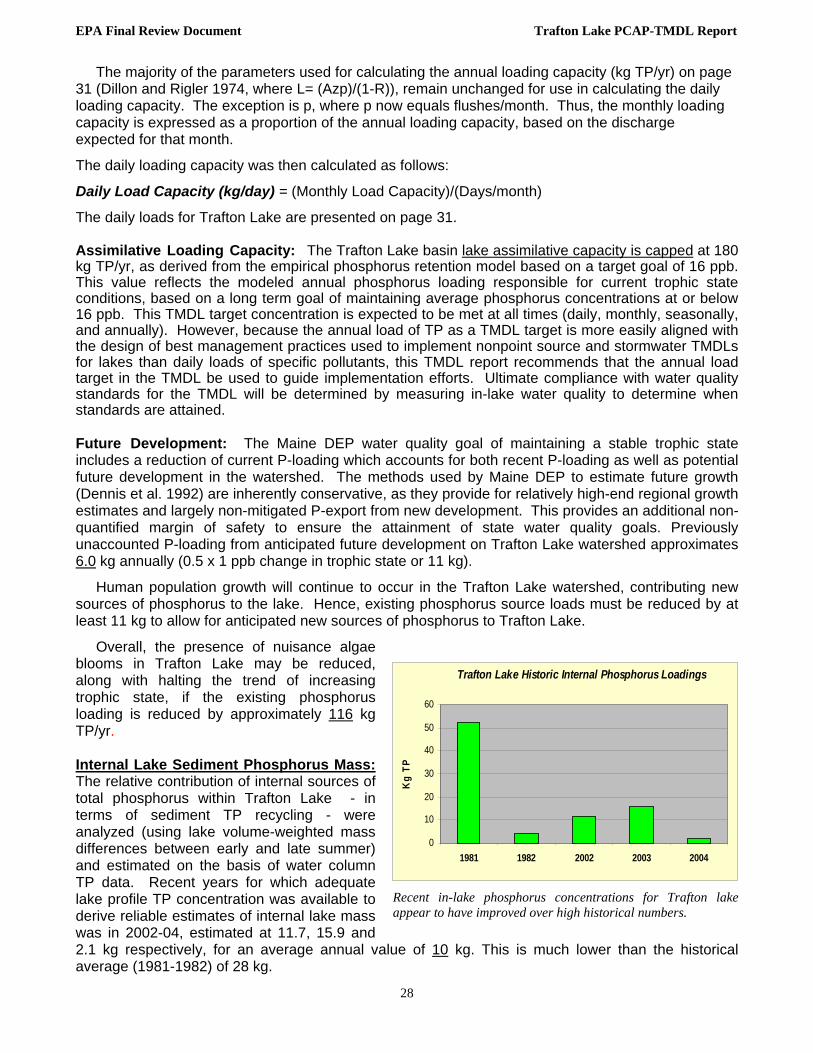
Overall, the presence of nuisance algae blooms in Trafton Lake may be reduced, along with halting the trend of increasing trophic state, if the existing phosphorus loading is reduced by approximately 116 kg TP/yr. Internal Lake Sediment Phosphorus Mass: The relative contribution of internal sources of total phosphorus within Trafton Lake - in terms of sediment TP recycling - were analyzed (using lake volume-weighted mass differences between early and late summer) and estimated on the basis of water column TP data. Recent years for which adequate lake profile TP concentration was available to derive reliable estimates of internal lake mass was in 2002-04, estimated at 11.7, 15.9 and 2.1 kg respectively, for an average annual value of 10 kg. This is much lower than the historical average (1981-1982) of 28 kg.
Trafton Lake Historic Internal Phosphorus Loadings
0
10
20
30
40
50
60
1981 1982 2002 2003 2004
Kg
TP
Recent in-lake phosphorus concentrations for Trafton lake appear to have improved over high historical numbers.
EPA Final Review Document Trafton Lake PCAP-TMDL Report
29
Linking Pollutant Loading to a Numeric Target: The basin loading assimilative capacity for lightly-colored Trafton Lake was set at 180 kg/yr of total phosphorus to meet the numeric water quality target of 16 ppb of total phosphorus. A phosphorus retention model, calibrated to in-lake phosphorus data, was used to link phosphorus loading to numeric target. Supporting Documentation for the Trafton Lake TMDL Analysis includes the following: Maine DEP and VLMP water quality monitoring data, and specification of a phosphorus retention model – including both empirical models and retention coefficients.
Trafton Lake Total Phosphorus Retention Model (after Dillon and Rigler 1974 and others)
L = P (A z p) / (1-R) where, 1 ppb change = 11 kg
180 = L = external total phosphorus load capacity (kg TP/year) 16 = P = total phosphorus concentration (ppb) = Target Goal = 16 ppb 0.42 = A = lake basin surface area (km2) = 42ha or 103 acres 5.0 = z = mean depth of lake basin (m) A z p = 7.35 3.50 = p = annual flushing rate (flushes/year) 0.65 = 1- R = phosphorus retention coefficient, where: 0.35 = R = 1 / (1+ sq. rt. p) (Larsen and Mercier 1976)
Previous use of the Vollenweider (Dillon and Rigler 1974) type empirical model for Maine lakes, e.g., Cobbossee, Madawaska, Sebasticook, East, China, Mousam, Highland (Falmouth), Webber, Threemile, Threecornered, Annabessacook, Pleasant, Sabattus, Toothaker, Unity, Upper Narrows, Highland (Bridgton), Little Cobbossee, Long (Bridgton), Togus, Duckpuddle, Lovejoy, Lilly, Sewall, Cross and Daigle PCAP-TMDL reports (Maine DEP 2000-2006) have all shown this approach to be effective in linking watershed total phosphorus (external) loadings to existing in-lake total phosphorus concentrations. Strengths and Weaknesses in the Overall TMDL Analytical Process: The Trafton Lake TMDL was developed using existing lake water quality monitoring data, derived watershed export coefficients (Reckhow et al. 1980, Maine DEP 1981 and 1989, Dennis 1986, Dennis et al. 1992, Bouchard et al. 1995, Soranno et al. 1996, and Mattson and Isaac 1999) and a phosphorus retention model which incorporates both empirically derived and observed retention coefficients (Vollenweider 1969, Dillon 1974, Dillon and Rigler 1974 a and b, and 1975, Kirchner and Dillon 1975). Use of the Larsen and Mercier (1976) total phosphorus retention term, based on localized data (northeast and north-central U.S.) from 20 lakes in the US-EPA National Eutrophication Survey (US-EPA-New England) provides a more accurate model for northeastern regional lakes. Strengths:
Approach is commonly accepted practice in lake management
Makes best use of available water quality monitoring data
Based upon experience with other lakes in the northeastern U.S. region, the empirical phosphorus retention model was determined to be appropriate for the application lake.
Weaknesses:
Inherent uncertainty of TP load estimates (Reckhow 1979, Walker 2000) and associated variability and generality of TP loading coefficients.
Critical Conditions occur in Trafton Lake during the summertime, when the potential (both occurrence and frequency) of nuisance algae blooms are greatest. The loading capacity of 16 ppb of total phosphorus was set to achieve desired water quality standards during this critical time period, and will also provide adequate protection throughout the year (see Seasonal Variation).
EPA Final Review Document Trafton Lake PCAP-TMDL Report
30
LOAD ALLOCATIONS (LA’s) - The load allocation for Trafton Lake equals 180 kg TP on an annual basis and represents, in part, that portion of the lake’s assimilative capacity allocated to non-point (overland) sources of phosphorus (from Table 2). Direct external TP sources (totaling 1,170 kg annually) have been identified and accounted for in the land-use breakdown portrayed in Table 2 (corrected GIS). Further reductions in non-point source phosphorus loadings are expected from the continued implementation of NPS best management practices (see summary, pages 16-18). As previously mentioned, it was not possible to separate natural background from non-point pollution sources in this watershed because of the limited and general nature of the available information. As in other Maine TMDL lakes (see Sebasticook Lake, East Pond, China Lake, and subsequent TMDLs), in-lake nutrient loadings in Trafton Lake originate from a combination of direct external and internal (lake sediment) sources of total phosphorus. WASTE LOAD ALLOCATIONS (WLA's): Since there are no existing point source discharges subject to NPDES permit requirements in the Trafton Lake watershed, the WLA is set at 0 (zero), and all of the loading capacity is allocated as a gross allotment to the “load allocation”. MARGIN OF SAFETY (MOS): The TMDL expressed in terms of annual and daily loads includes an implicit MOS through the relatively conservative selection of the numeric water quality target (based on a state-side database for lakes, supported by in-lake data). Based on both the Trafton Lake historical records and a summary of statewide Maine lakes water quality data for colored (> 30 SPU) lakes - the target of 16 ppb (180 kg/yr in Trafton Lake) represents a highly conservative goal to assure future attainment of Maine DEP water quality goals of non-sustained and non-repeated blue-green summer-time algae blooms due to NPS pollution or cultural eutrophication and stable or decreasing trophic state. The statewide data base for colored Maine lakes indicate that summer nuisance algae blooms (growth of algae which causes water transparency to be less than 2 meters) are more likely to occur at 18 ppb or above. SEASONAL VARIATION: The Trafton Lake TMDL is protective of all seasons, as the allowable annual load was developed to be protective of the most sensitive time of year – during the summer, when conditions most favor the growth of algae and aquatic macrophytes. With an average flushing rate of 3.5 flushes/year, the average annual phosphorus loading is most critical to the water quality in Trafton Lake. Maine DEP lake biologists, as a general rule, use more than six flushes annually (bi-monthly) as the cutoff for considering seasonal variation as a major factor (to distinguish lakes vs. rivers) in the evaluation of total phosphorus loadings in aquatic environments in Maine. Furthermore, non-point source best management practices (BMPs) proposed for the Trafton Lake watershed have been designed to address total phosphorus loading during all seasons. This variation is further accounted for in calculations of seasonal (May-October, November– April), monthly, and daily TP load calculations (p. 31). These numbers are derived from formulas developed by Dudley (2004) for ungaged rivers in Maine, and are based on several physical and geographic parameters including: 1) drainage area of the waterbody, 2) percent of sand and gravel aquifers in the drainage area, 3) distance from a stationary line along the Maine coast, and 4) mean annual precipitation. Daily loading rates are then determined using variables from Dillon and Rigler (1974 - p. 32) for calculating the external total phosphorus load capacity (pp. 27-28) for the lake. Picturesque Trafton Lake on a sunny day in the fall.
EPA Final Review Document Trafton Lake PCAP-TMDL Report
31
Dai
ly T
P Po
lluta
nt L
oads
for T
rafto
n La
ke
Traf
ton
Lake
- D
aily
Loa
d vs
. Dai
ly D
isch
arge
0.0
0.5
1.0
1.5
Jan
Feb
March
April
MayJu
ne
July
AugSep
t
OctNovDec
Kg TP/day
02468101214161820
Ft3/sec
Dai
ly L
oad
Cap
acity
(kg)
Dis
char
ge/d
ay (
ft3̂/
s)
Seas
on
% o
f Tot
al
# Fl
ushe
s M
ay -O
ctob
er
43%
1.
5 N
ovem
ber-
April
57
%
2.0
Volle
nwei
der:
L =
P (A
zp) /
(1-R
)
L =
exte
rnal
P lo
ad c
apac
ity (k
g TP
/yr
) 18
0 P
= to
tal P
con
cent
ratio
n (p
pb)
16
A =
lake
bas
in s
urfa
ce a
rea
(km
2)
0.42
z
= m
ean
dept
h of
lake
bas
in (m
) 5
p =
annu
al fl
ushi
ng ra
te
3.5
1-R
= P
rete
ntio
n co
effic
ient
0.
65
R =
1 /
(1 +
sq.
rt. p
) 0.
35
Mon
th
Dis
char
ge (f
t^3/
s)
% o
f Tot
al
Flus
hes/
mon
th
Mon
thly
Loa
d C
apac
ity (k
g)
Dis
char
ge/d
ay
(ft^3
/s)
Flus
hes/
day
Dai
ly L
oad
Cap
acity
(kg)
Jan
2.84
4%
0.
13
6.56
0.
092
0.00
41
0.21
Fe
b 2.
66
3%
0.12
6.
13
0.09
5 0.
0042
0.
22
Mar
ch
6.32
8%
0.
28
14.5
8 0.
20
0.00
9 0.
47
Apr
il 17
.75
23%
0.
79
40.9
8 0.
59
0.02
6 1.
37
May
17
.83
23%
0.
80
41.1
7 0.
58
0.02
6 1.
33
June
5.
75
7%
0.26
13
.28
0.19
0.
009
0.44
Ju
ly
2.16
3%
0.
10
4.99
0.
070
0.00
3 0.
16
Aug
1.
58
2%
0.07
3.
64
0.05
1 0.
0023
0.
12
Sep
t 1.
87
2%
0.08
4.
31
0.06
2 0.
0028
0.
14
Oct
4.
30
5%
0.19
9.
93
0.14
0.
0062
0.
32
Nov
9.
34
12%
0.
42
21.5
7 0.
31
0.01
4 0.
72
Dec
5.
77
7%
0.26
13
.31
0.19
0.
008
0.43
EPA Final Review Document Trafton Lake PCAP-TMDL Report
32
Regression Equations Used for Calculating Daily Loads for Trafton Lake (from Dudley, 2004)
EPA Final Review Document Trafton Lake PCAP-TMDL Report
33
PUBLIC PARTICIPATION: Adequate (‘full and meaningful’) public participation in the Trafton Lake PCAP-TMDL development process was ensured - during which land use and phosphorus load reductions were discussed - through the following avenues:
1) September 26, 2005: MACD staff traveled to Aroostook County to meet with staff from Maine DEP and the CA-SWCD to gather information and discuss the water quality of Trafton Lake.
2) September 27, 2005: MACD staff met with Maine DEP and CA-SWCD staff in the field and were given a tour of the Trafton Lake watershed.
3) May 25, 2006: MACD staff contacted the CA-SWCD to discuss BMPs that have been installed in the watershed.
4) May 26, 2006: MACD staff contacted the Limestone Development Foundation to determine if any recent BMPs or funding had come about as a result of the 2002 watershed survey.
5) May 26, 2006: MACD staff contacted the Town of Limestone to discuss current BMP activities within the town and at the RV park on Trafton Lake.
6) June 2, 2006: MACD staff put together several land use maps to send to CA-SWCD for review.
7) June 7, 2006: CA-SWCD staff Linda Alverson held a public meeting to collect information about current agricultural conservation practices and to get local feedback regarding the land use maps created by MACD.
8) June 13, 2006: MACD staff incorporated all land use changes from the June 7th public meeting into a revised map which was used for the GIS model.
9) July 20, 2006: MACD sent the CA-SWCD a pre-draft of the TMDL document for review.
10) August 8-9, 2006: MACD staff incorporated comments from the CA-SWCD into the TMDL for Stakeholder review.
STAKEHOLDER AND PUBLIC REVIEW PROCESS
A two-week stakeholder review was distributed both electronically and by mail on August 14, 2006 to the following individuals who expressed a specific interest, participated in the field work or helped develop the draft Trafton Lake PCAP-TMDL report: Maine DEP (Kathy Hoppe); Central Aroostook SWCD (Linda Alverson); Maine Forest Service (Chris Martin); Maine Department of Agriculture (David Rocque); Maine Department of Inland Fisheries and Wildlife (Dave Basley), St. John Valley-Aroostook RC&D (Skip Babineau), USDA/Natural Resources Conservation Service (Ken Hill); Town of Limestone (Donna Bernier and Mike Coty); Limestone Development Foundation (Greg Ward); Maine Potato Board (Tim Hobbs); and land owners and or producers (Emily Smith, Fred Griffith, Tom Devoe, John Tweed, Scott Smith, Lloyd Leavitt, and Cyrus Morrus). The following statement was advertised in the Bangor Daily News over a month long (two weekend) period (September 16-17 and September 30-October 1), and the Aroostook Republican over a four week period beginning September 13, 2006:
EPA Final Review Document Trafton Lake PCAP-TMDL Report
34
TRAFTON LAKE - Limestone, Maine
In accordance with Section 303(d) of the Clean Water Act, and implementation regulations in 40 CFR Part 130 - the Maine Department of Environmental Protection has prepared a combined Phos-phorus Control Action Plan (PCAP) and Total Maximum Daily Load (TMDL) nutrient report (DEPLW 2006-0802) for the TRAFTON LAKE WATERSHED, located within the Town of Limestone. This PCAP-TMDL report identifies and provides best estimates of non-point source phosphorus loads for all repre-sentative land use classes in the TRAFTON LAKE direct watershed and the total phosphorus reduc-tions required to restore and maintain acceptable water quality conditions. A Public Review draft of this report may be viewed at Maine DEP Northern Maine Regional offices in Presque Isle (1235 Cen-tral Drive, Skyway Park) or at the Central Maine DEP offices in Augusta (Ray Building, Hospital Street - Route 9, Land & Water Bureau) or on-line: http://www.maine.gov/dep/blwq/comment.htm. Please send all comments, in writing by October 11, 2006 to Dave Halliwell, Lakes TMDL Program Manager, Maine DEP, State House Station #17, Augusta, ME 04333. or e-mail: [email protected]
PUBLIC REVIEW Comments Received
US-EPA Region 1 reviewed the document and recommended several minor edits to the historical information (p. 4) and TP load allocations (p. 30). All EPA comments were incorporated into this final draft submittal.
Dave Basley (Maine DIF&W, Region G, Ashland Office) reviewed the Public Review document and provided comments recognizing the high inputs from agriculture land, and recommendation of the possible release of nutrient laden water during high spring flows (as discussed on p. 17).
RESPONSE -from Jennifer Jespersen, MACD (Trafton Lake Project Manager)
Thank you for your comments regarding the Trafton Lake TMDL. Your second comment was addressed during the Stakeholder Review Process and incorporated into the report under ‘Recent and Current NPS/BMP Efforts’ (p. 17) - “Other discussions to reduce phosphorus in Trafton Lake involved withdrawing nutrient laden water from the surface of the lake for irrigation. While local farmers were more than willing to cooperate, calculations and discussions among DEP staff showed that this method of withdrawal would not do much to change the high P concentrations during the summer (Bouchard 2004).”
The following was also submitted by DIF&W (Maine DIF&W Weekly Fishing Report, Summer 2006):
Trafton Lake in Limestone is a 103-acre impoundment created in 1969 behind a flood control structure on Webster Stream. The Town of Limestone developed a recreation facility, including a public boat ramp, as part of the flood control project. Webster Stream supported a wild brook trout fishery and a sport fishery for trout soon became established in Trafton Lake. By the year 2000, wild brook trout numbers dwindled to the point that little fishing activity was occurring at the lake. The decrease in trout numbers was confirmed through our biological sampling. We determined that cultural development had degraded spawning habitat to the extent that wild popu-lations were no longer able to support a fishery. There was also the question that water quality had deteriorated in the lake such that it was no longer capable of sustaining brook trout through the hot summer months. Rather than see this locally important trout fishery disappear, regional fishery staff recommended the implementation of a brook trout stocking program. The proposal was given a favorable review by IF&W fishery biologists and was presented at a public meeting for comment. The Advisory Council member and two members of the public in attendance at this meeting also gave thumbs up approval to try to improve the fishery with hatchery trout. The existing regulation of No Live Fish As Bait and general law bag and length limits were considered appropriate to regulate the fishery. As the result of management recommendations made by regional fishery staff, anglers are once again visiting Trafton Lake and taking advantage of the recreational facility. A long grass beach area offers excellent opportunity for families with young children to enjoy the sport of fishing. Anglers are reporting the trout fishing as being "exceptional".
EPA Final Review Document Trafton Lake PCAP-TMDL Report
35
LITERATURE Lake Specific References
Bouchard, R.J., 2004. Cursory review of Trafton Irrigation and P effects. Maine Department of Environmental Protection, March 25, 2004 (unpublished).
CASWCD and USDA/SCS. Central Aroostook Soil and Water Conservation District and the United
States Department of Agriculture/Soil Conservation Service. 1967. Limestone Stream Watershed Project-Multi-purpose Structure Dam No. 3. Webster Brook Site, Limestone, ME.
Ferwerda, J., LaFlamme, K., Kalloch, N., and Rourke, R. 1997. The Soils of Maine. Maine Agricultural
and Forest Experiment Station, University of Maine, Orono, Maine. Greg Ward, Personal Communication. Email. Acting Director, Limestone Development Foundation. 30
May 2006. Maine VLMP. 2005. Maine Volunteer Lake Monitoring Program. Water Quality Summary: Trafton
Lake, Limestone Aroostook County, Midas 9779. Maine DEP, Augusta Maine. NRCS, 2006. Natural Resources Conservation Service. Official Soil Series Descriptions (OSD). http://
ortho.ftw.nrcs.usda.gov/cgi-bin/osd/osdname.cgi. Accessed May 24, 2006. United States Department of Agriculture, Soil Conservation Service. 1964. Soil Survey-Aroostook
County, Maine: Northeastern Part, Series 1958, No. 27. General References Barko, J.W., W.F. James, and W.D. Taylor. 1990. Effects of alum treatment on phosphorus and
phytoplankton dynamics in a north-temperate reservoir: a synopsis. Lake and Reservoir Management 6:1-8.
Basile, A.A. and M.J. Vorhees. 1999. A practical approach for lake phosphorus Total Maximum Daily
Load (TMDL) development. US-EPA Region I, Office of Ecosystem Protection, Boston, MA (July 1999).
Bostrom, B., G. Persson, and B. Broberg. 1988. Bioavailability of different phosphorus forms in
freshwater systems. Hydrobiologia 170:133-155. Bouchard, R., M. Higgins, and C. Rock. 1995. Using constructed wetland-pond systems to treat
agricultural runoff: a watershed perspective. Lake and Reservoir Management 11(1):29-36. Butkus, S.R., E.B. Welch, R.R. Horner, and D.E. Spyridakis. 1988. Lake response modeling using
biologically available phosphorus. Journal of the Water Pollution Control Federation 60:1663-69. Carlton, R.G. and R.G. Wetzel. 1988. Phosphorus flux from lake sediments: effect of epipelic algal
oxygen production. Limnology and Oceanography 33(4):562-570. Chapra, S.C. 1997. Surface Water-Quality Modeling. McGraw-Hill Companies, Inc. Correll, D.L., T.L. Wu, E.S. Friebele, and J. Miklas. 1978. Nutrient discharge from Rhode Island
watersheds and their relationships to land use patterns. In: Watershed Research in Eastern North America: A workshop to compare results. Volume 1, February 28 - March 3, 1977. (mixed pine/hardwoods)
EPA Final Review Document Trafton Lake PCAP-TMDL Report
36
Dennis, W.K. and K.J. Sage. 1981. Phosphorus loading from agricultural runoff in Jock Stream, tributary to Cobbossee Lake, Maine: 1977-1980. Cobbossee Watershed District, Winthrop.
Dennis, J. 1986. Phosphorus export from a low-density residential watershed and an adjacent
forested watershed. Lake and Reservoir Management 2:401-407. Dennis, J., J. Noel, D. Miller, C. Elliot, M.E. Dennis, and C. Kuhns. 1992. Phosphorus Control in Lake
Watersheds: A Technical Guide to Evaluating New Development. Maine Department of Environmental Protection, Augusta, Maine.
Dillon, P.J. 1974. A critical review of Vollenweider’s nutrient budget model and other related models.
Water Resources Bulletin 10:969-989. Dillon, P.J. and F.H. Rigler. 1974a. The phosphorus-chlorophyll relationship for lakes. Limnology and
Oceanography 19:767-773. Dillon, P.J. and F.H. Rigler. 1974b. A test of a simple nutrient budget model predicting the
phosphorus concentration in lake water. Journal of the Fisheries Research Board of Canada 31:1771-1778.
Dillon, P.J. and F.H. Rigler. 1975. A simple method for predicting the capacity of a lake for
development based on lake trophic status. Journal of the Fisheries Research Board of Canada 32:1519-1531.
Dudley, R.W. 2004. Estimating Monthly, Annual, and Low 7-Day, 10-Year Streamflows for Ungaged
Rivers in Maine. U.S. Geological Survey, Scientific Investigations Report 2004-5026, Augusta, Maine.
Dudley, R.W., S.A. Olson, and M. Handley. 1997. A preliminary study of runoff of selected contaminants from rural Maine highways. U.S. Geological Survey, Water-Resources Investigations Report 97-4041 (DOT, DEP, WRI), 18 pages.
Gasith, Avital and Sarig Gafny. 1990. Effects of water level fluctuation on the structure and function of
the littoral zone. Pages 156-171 (Chapter 8) in: M.M. Tilzer and C. Serruya (eds.), Large Lakes: Ecological Structure and Function, Springer-Verlag, NY.
Heidtke, T.M. and M.T. Auer. 1992. Partitioning phosphorus loads: implications for lake restoration.
Journal of Water Resources Plan. Mgt. 118(5):562-579.
James, W.F., R.H. Kennedy, and R.F. Gaubush. 1990. Effects of large-scale metalimnetic migrations on phosphorus dynamics in a north-temperate reservoir. Canadian Journal of Fisheries and Aquatic Sciences 47:156-162.
James, W.F. and J.W. Barko. 1991. Estimation of phosphorus exchange between littoral and pelagic
zones during nighttime convective circulation. Limnology and Oceanography 36(1):179-187. Jemison, J.M. Jr., M.H. Wiedenhoeft, E.B. Mallory, A. Hartke, and T. Timms. 1997. A Survey of Best
Management Practices on Maine Potato and Dairy Farms: Final Report. University of Maine Agricultural and Forest Experiment Station, Misc. Publ. 737, Orono, Maine.
Kallqvist, Torsten and Dag Berge. 1990. Biological availability of phosphorus in agricultural runoff compared to other phosphorus sources. Verh. Internat. Verein. Limnol. 24:214-217.
EPA Final Review Document Trafton Lake PCAP-TMDL Report
37
Kirchner, W.B. and P.J. Dillon. 1975. An empirical method of estimating the retention of phosphorus in lakes. Water Resources Research 11:182-183.
Larsen, D.P. and H.T. Mercier. 1976. Phosphorus retention capacity of lakes.
Journal of the Fisheries Research Board of Canada 33:1742-1750.
Lee, G.F., R.A. Jones, and W. Rast. 1980. Availability of phosphorus to phytoplankton and its implications for phosphorus management strategies. Pages 259-308 (Ch.11) in: Phosphorus Management Strategies for Lakes, Ann Arbor Science Publishers, Inc.
Likens, G.E., F.H. Bormann, R.S. Pierce, J.S. Eaton, and N.M. Johnson. 1977. Bio-Geochemistry of a
Forested Ecosystem. Springer-Verlag, Inc. New York, 146 pages. Maine Department of Environmental Protection. 1999. Cobbossee Lake (Kennebec County, Maine)
Final TMDL Addendum (to Monagle 1995). Maine Department of Environmental Protection, Augusta, Maine.
Marsden, Martin, W. 1989. Lake restoration by reducing external phosphorus loading: the influence of
sediment phosphorus release (Special Review). Freshwater Biology 21(2):139-162. Martin, T.A., N.A. Johnson, M.R. Penn, and S.W. Effler. 1993. Measurement and verification of rates
of sediment phosphorus release for a hypereutrophic urban lake. Hydrobiologia 253:301-309. Mattson, M.D. and R.A. Isaac. 1999. Calibration of phosphorus export coefficients for total maximum
daily loads of Massachusetts lakes. Journal of Lake and Reservoir Management 15(3):209-219. Michigan Department of Environmental Quality. 1999. Pollutant Controlled Calculation and
Documentation for Section 319 Watersheds Training Manual. Michigan DEQ, Surface Water Quality Division, Nonpoint Source Unit.
Monagle, W.J. 1995. Cobbossee Lake Total Maximum Daily Load (TMDL): Restoration of Cobbossee
Lake through reduction of non-point sources of phosphorus. Prepared for ME-DEP by Cobbossee Watershed District.
Nurnberg, G.K. 1984. The prediction of internal phosphorus load in lakes with anoxic hypolimnia.
Limnology and Oceanography 29:111-124. Nurnberg, G.K. 1987. A comparison of internal phosphorus loads in-lakes with anoxic hypolimnia:
Laboratory incubation versus in situ hypolimnetic phosphorus accumulation. Limnology and Oceanography 32(5):1160-1164.
Nurnberg, G.K. 1988. Prediction of phosphorus release rates from total and reductant-soluble
phosphorus in anoxic lake sediments. Canadian Journal of Fisheries and Aquatic Sciences 45:453-462.
Nurnberg, G.K. 1995. Quantifying anoxia in lakes. Limnology and Oceanography 40(6):1100-1111.
Reckhow, K.H. 1979. Uncertainty analysis applied to Vollenweider’s phosphorus loading criteria. Journal of the Water Pollution Control Federation 51(8):2123-2128.
Reckhow, K.H., M.N. Beaulac, and J.T. Simpson. 1980. Modeling phosphorus loading and lake response under uncertainty: a manual and compilation of export coefficients. EPA 440/5-80-011, US-EPA, Washington, D.C.
EPA Final Review Document Trafton Lake PCAP-TMDL Report
38
Reckhow, K.H., J.T. Clemens, and R.C. Dodd. 1990. Statistical evaluation of mechanistic water-quality models. Journal Environmental Engineering 116:250-265.
Riley, E.T. and E.E. Prepas. 1985. Comparison of phosphorus-chlorophyll relationships in mixed and
stratified lakes. Canadian Journal of Fisheries and Aquatic Sciences 42:831-835. Rippey, B., N.J. Anderson, and R.H. Foy. 1997. Accuracy of diatom-inferred total phosphorus
concentrations and the accelerated eutrophication of a lake due to reduced flushing and increased internal loading. Canadian Journal of Fisheries and Aquatic Sciences 54:2637-2646.
Schroeder, D.C. 1979. Phosphorus Export From Rural Maine Watersheds. Land and Water
Resources Center, University of Maine, Orono, Completion Report. Singer, M.J. and R.H. Rust. 1975. Phosphorus in surface runoff from a
(northeastern United States) deciduous forest. Journal of Environmental Quality 4(3):307-311. Sonzogni, W.C., S.C. Chapra, D.E. Armstrong, and T.J. Logan. 1982. Bioavailability of phosphorus
inputs to lakes. Journal of Environmental Quality 11(4):555-562. Soranno, P.A., S.L. Hubler, S.R. Carpenter, and R.C. Lathrop. 1996. Phosphorus loads to surface
waters: a simple model to account for spatial pattern. Ecological Applications 6(3):865-878. Sparks, C.J. 1990. Lawn care chemical programs for phosphorus: information, education, and
regulation. U.S. Environmental Protection Agency, Enhancing States' Lake Management Programs, pages 43-54. [Golf course application]
Stefan, H.G., G.M. Horsch, and J.W. Barko. 1989. A model for the estimation of convective exchange
in the littoral region of a shallow lake during cooling. Hydrobiologia 174:225-234. Tietjen, Elaine. 1986. Avoiding the China Lake Syndrome. Reprinted from Habitat - Journal of the
Maine Audubon Society, 4 pages. U.S. Environmental Protection Agency. 1999. Regional Guidance on Submittal Requirements for
Lake and Reservoir Nutrient TMDLs. US-EPA Office of Ecosystem Protection, New England Region, Boston, MA.
U.S. Environmental Protection Agency. 2000a. Cobbossee (Cobbosseecontee) Lake TMDL Final
Approval Documentation #1. US-EPA/NES, January 26, 2000. U.S. Environmental Protection Agency. 2000b. Madawaska Lake TMDL Final Approval Documentation #2. US-EPA/NES, July 24, 2000. U.S. Environmental Protection Agency. 2001a. Sebasticook Lake TMDL Final Approval Documentation #3. US-EPA/NES, March 8, 2001. U.S. Environmental Protection Agency. 2001b. East Pond (Belgrade Lakes) TMDL Final Approval Documentation #4. US-EPA/NES, October 9, 2001. U.S. Environmental Protection Agency. 2001c. China Lake TMDL Final Approval Documentation #5. US-EPA/NES, November 5, 2001. U.S. Environmental Protection Agency. 2003a. Highland (Duck) Lake PCAP-TMDL Final Approval Documentation #6. US-EPA/NES, June 18, 2003.
EPA Final Review Document Trafton Lake PCAP-TMDL Report
39
U.S. Environmental Protection Agency. 2003b. Webber Pond PCAP-TMDL Final Approval Documentation #7. US-EPA/NES, September 10, 2003. U.S. Environmental Protection Agency. 2003c. Threemile Pond PCAP-TMDL Final Approval Documentation #8. US-EPA/NES, September 10, 2003. U.S. Environmental Protection Agency. 2003d. Threecornered Pond PCAP-TMDL Final Approval Documentation #9. US-EPA/NES, September 10, 2003. U.S. Environmental Protection Agency. 2003e. Mousam Lake PCAP-TMDL Final Approval Documentation #10. US-EPA/NES, September 29, 2003. U.S. Environmental Protection Agency. 2004a. Annabessacook Lake PCAP-TMDL Final Approval Documentation #11. US-EPA/NES, May 18, 2004. U.S. Environmental Protection Agency. 2004b. Pleasant (Mud) Pond PCAP-TMDL Final Approval Documentation #12. US-EPA/NES, May 20, 2004. (also Cobbossee Stream) U.S. Environmental Protection Agency. 2004c. Sabattus Pond PCAP-TMDL Final Approval Documentation #13. US-EPA/NES, August 12, 2004. U.S. Environmental Protection Agency. 2004d. Highland Lake (Bridgton) PCAP-TMDL Final
Approval Documentation #14. US-EPA/NES, August 12, 2004. U.S. Environmental Protection Agency. 2004e. Toothaker Pond (Phillipston) PCAP-TMDL Final
Approval Documentation #15. US-EPA/NES, September 16, 2004. U.S. Environmental Protection Agency. 2004f. Unity (Winnecook) Pond PCAP-TMDL
Approval Documentation #16. US-EPA/NES, September 16, 2004. U.S. Environmental Protection Agency. 2005a. Upper Narrows Pond PCAP-TMDL Final Approval Documentation #17. US-EPA/NES, January 10, 2005. U.S. Environmental Protection Agency. 2005b. Little Cobbossee Lake PCAP-TMDL Final
Approval Documentation #18. US-EPA/NES, March 16, 2005. U.S. Environmental Protection Agency. 2005c. Long Lake (Bridgton) PCAP-TMDL Final Approval Documentation #19. US-EPA/NES, May 23, 2005. U.S. Environmental Protection Agency. 2005d. Togus (Worrontogus) Pond PCAP-TMDL Final
Approval Documentation #20. US-EPA/NES, September 1, 2005. U.S. Environmental Protection Agency. 2005e. Duckpuddle Pond PCAP-TMDL Final Approval Documentation #21. US-EPA/NES, September 1, 2005. U.S. Environmental Protection Agency. 2005f. Lovejoy Pond PCAP-TMDL Final Approval Documentation #22. US-EPA/NES, September 21, 2005. U.S. Environmental Protection Agency. 2006a. Lilly Pond PCAP-TMDL Final Approval Documentation #23. US-EPA/NES, December 29, 2005. U.S. Environmental Protection Agency. 2006b. Sewall Pond PCAP-TMDL Final Approval Documentation #24. US-EPA/NES, March 10, 2006.
EPA Final Review Document Trafton Lake PCAP-TMDL Report
40
U.S. Environmental Protection Agency. 2006c. Cross Lake PCAP-TMDL Final Approval Documentation #25. US-EPA/NES, September 28, 2006 (also Daigle and Dickey
Brooks). U.S. Environmental Protection Agency. 2006d. Daigle Pond PCAP-TMDL Final Approval Documentation #26. US-EPA/NES, September 28, 2006 (also Daigle Brook). Vollenweider, R.A. 1969. Possibility and limits of elementary models concerning the budget of
substances in lakes. Arch. Hydrobiol. 66:1-36. Walker, W.W., Jr. 2000. Quantifying Uncertainty in Phosphorus TMDL's for Lakes. March 8, 2001
Draft Prepared for NEIWPCC and EPA Region. ____________________________________________________________________________