Tragedy of the Spectrum Commons — a myth or reality? Manuela Dal Borgo Draft January 14, 2014 Abstract The tragedy of the spectrum commons is a topical subject in licence-exempt wireless communication. The UK government has recently asked Ofcom to open up bandwidths for short-term spectrum access for research and development initiatives to increase the efficiency of spectrum utilization.The collection and analysis of data to assess congestion as a function of pricing, investment in research and development, manufacturing incentives and the distribution of devices is not within the boundaries of this present study because it is very difficult and costly. For this reason companies, such as ABIresearch, have emerged to provide such data collection services, which include taking devices apart and pricing each component (called tear downs). In view of these obstacles, we present a mathematical model whose arguments stem from well-known market trends. We build a model from a game theoretic point of view of the the tragedy of the commons that represents the unmanaged wireless communications environment. The primary purpose of this investigation is to determine what forces are likely to lead to or prevent a tragedy in the utilization of licence-exempt spectrum. Background Garret Hardin, a prominent biologist introduced the expression “Tragedy of the Commons” to describe the inevitable overuse of a free but finite shared resource (Hardin, 1968). The solutions he proposed were privatization and government intervention to prevent the irreversible depletion of non-renewable resources, such as fish populations or forests, by extracting or by introducing (i.e. pollution) too much of something. Hardin’s thesis was a strict contradiction to Adam Smith’s assumption of an invisible hand (Hardin, 1998). Smith argued that a selfish individual “neither intends to promote the public interest, nor knows how much he is promoting it”yet 1
Transcript
Tragedy of the Spectrum Commons — a myth or reality?
Manuela Dal Borgo
Draft January 14, 2014
Abstract
The tragedy of the spectrum commons is a topical subject in licence-exempt wireless
communication. The UK government has recently asked Ofcom to open up bandwidths
for short-term spectrum access for research and development initiatives to increase the
efficiency of spectrum utilization.The collection and analysis of data to assess congestion
as a function of pricing, investment in research and development, manufacturing incentives
and the distribution of devices is not within the boundaries of this present study because
it is very difficult and costly. For this reason companies, such as ABIresearch, have
emerged to provide such data collection services, which include taking devices apart and
pricing each component (called tear downs). In view of these obstacles, we present a
mathematical model whose arguments stem from well-known market trends. We build
a model from a game theoretic point of view of the the tragedy of the commons that
represents the unmanaged wireless communications environment. The primary purpose
of this investigation is to determine what forces are likely to lead to or prevent a tragedy
in the utilization of licence-exempt spectrum.
Background
Garret Hardin, a prominent biologist introduced the expression “Tragedy of the Commons” to
describe the inevitable overuse of a free but finite shared resource (Hardin, 1968). The solutions
he proposed were privatization and government intervention to prevent the irreversible depletion
of non-renewable resources, such as fish populations or forests, by extracting or by introducing
(i.e. pollution) too much of something. Hardin’s thesis was a strict contradiction to Adam
Smith’s assumption of an invisible hand (Hardin, 1998). Smith argued that a selfish individual
“neither intends to promote the public interest, nor knows how much he is promoting it”yet
1
as a result of each individual’s revenue maximizing behavior, each “directs that industry in a
manner as its produce might be of the greatest value, he intends only his own gain, and he
is in this, as in many other cases, led by an invisible hand to promote an end which was no
part of his intention.” (Smith, 1776: 4.2) Hardin had conversely concluded that “Ruin is the
destination toward which all men rush, each pursuing his own best interest in a society that
believes in the freedom of the commons. Freedom in a commons brings ruin to all.”(Hardin,
1968: 1244).
Elinor Ostrom and those who followed in her footsteps showed that in fact Hardin’s thesis
was limited to cases of open access (rather than to managed commons) that assumed little or
no communication, in an environment where some individuals were never allowed to take joint
benefits into account. (Ostrom, 1990; Ostrom, Gardner, and Walker, 1994; Gibson, Andersson,
Ostrom and Shivakumar, 2005) These discussions revolve largely around non-renewable scarce
natural resources which are bound only by location. What about renewable resources where
exploitation is bound by space and also time? Wireless spectrum is a renewable resource that
if overused today is still available tomorrow, but unlike fish or pasture, unused Wi-Fi access
today cannot be used tomorrow. This form of tragedy is momentary, or is it?
The ancient Greek historian Thucydides in the 5th century BC describes tragedy as a pro-
cess that emerges from a collective action problem. Archidamos, the King of Sparta argues that
the vote of the Peloponnesian confederacy (ksympantas) to go to war is a result of the private
interests of individual states (heneka ton idion, 1.82.6). Thucydides described the problem
of collective action in terms of voters who are unable to communicate with one another in
order to devise mechanisms to manage their common interest (1.3.4, in Trojan war; 8.66.3, in
Athens’ stasis, 8.1 tragedy). In a confederacy states individually pursue their private interests
since they lack the ability to communicate and coordinate with one another, and thus they
destroy the common interest. Thucydides adds that this is the result of a fundamental igno-
rance with regard to the cause of the collective’s weakening (1.3.4; 141, if states, the cause
is the physical distance from one another; 8.66.3, if citizens, because it is “impossible for ev-
eryone to know everyone else”, 8.1 or everyone’s physical distance from the object of judgment).
“Each thinks that their inertia [private-interest] will do no harm, and that it is someone
else’s responsibility rather than theirs to make some provision for the future: the result is that
with all individually sharing this same notion they fail as a body to see their common interest
going to ruin.” (1.141, trans. M. Hammond)
2
Each state in the Peloponnesian confederacy has equal voting power. A vote represents a
state’s investment of resources and commitment to the common interest, much like a manu-
facturer’s investment in new technology when there is still demand for his inferior technology.
Assume an individual state voting in the common interest today comes at a cost c to its private
interest. Nonetheless, when a state votes in its private interest there exists a collective invisible
cost to the common interest, which is divided among the states. Over a repeated number of
meetings to vote, the common interest becomes less valuable every time a state votes in its
private interest.
Assume the value of the confederacy’s common interest is v and that equal voting power is
translated as an equal division of the common interest among the states (1.120.1, 1.141). I now
use common and public interchangeably. Following the description, Thucydides first assumes
there are two states. According to Thucydides, each state individually believes that it is some
other state’s responsibility to use its vote in the public interest.1 When one state votes in its
private interest, its payoff is v/2, if the other state votes in the public interest. Then the benefit
to the other state when it votes in the public interest is (v/2) − c. Even if the value of the
common interest is shared (v/2), a state which votes in the public interest will always incur
a cost c to itself. If both states vote in the public interest, they both get (v/2) − c, whereas
if they both vote in their private interest they ruin the common interest, which we value as
0. This 2x2 game describes the free-rider problem (Ober (2008), (2009), (2010)), where one
player piggy-backs on the efforts of another. In this case a state obtains the benefits of the
confederacy without contributing to its provision. The payoff matrix below summarizes the
problem.
Free-rider =
( Public Private
Public (v/2)− c, (v/2)− c (v/2)− c∗, (v/2)∗
Private (v/2)∗, (v/2)− c∗ 0, 0
)1The notation follows that set out in Maynard-Smith (1982). Two animals are contesting a resource of value
v. In biology, v stands for “value” that translates as “the Darwinian fitness of an individual obtaining the
resource would be increased by v”. The resource in this case can be territory for favorable breeding. v is the
gain in fitness to the winner, or equivalently, the additional offspring from mating there rather than elsewhere.
Among an infinite population, the contest between two players is assumed to be determined by a pairing off at
random. With respect to Thucydides, this is analogous to conceptualizing what one player thinks some other
player should be doing. In this way players cannot condition their play on whether they are “player 1” or
“player 2”. This is a game which is symmetric in strategies and payoffs. (Gintis 2009)
3
There are two equilibrium solutions: (Private, Public) and (Public, Private). That is to
say that each state considers that another state will vote sometimes in the public interest and
sometimes in its private interest. This strategic environment has an evolutionary stable strategy
because (v/2) > c, such that it is worth risking one’s private interests to ensure the common
interest. (Maynard-Smith, Price, 1973; Maynard-Smith, 1982: 15, 181-2.) Although this may
be the game that the states believe to be in, the reality is that both are always choosing to vote
independently in their private interest. 2 A state is unable to observe another state acting in
the public interest or even what concerns the public interest “due to infrequent meetings”, and
so independently assumes that the other state knows it is acting in its private interest. When
all the states share the same notion, over time (i.e. a series of votes) the invisible cost to the
common interest forces v to decrease in value. Each state’s share of the common interest (v/2)
must always be greater than the cost to its private interest c. Otherwise there is no incentive
to choose to vote in the public interest. If (v/2) < c,3 the problem has dynamically evolved
into a Prisoner’s Dilemma.
Prisoner’s Dilemma =
( Public Private
Public (v/2)− c, (v/2)− c (v/2)− c, (v/2)∗
Private (v/2)∗, (v/2)− c 0∗, 0∗
)
The equilibrium of this interaction is (Private, Private), such that states do not benefit
from voting in the common interest, no matter what. The case above is for a population of
two states, where one state considers how another state actually behaves. Thucydides takes
it one step further and generalizes the two state interaction to the case of many states. 4
2Thucydides describes interaction comprehensively, as a player’s version of the interaction, in contrast to the
actual interaction. The mismatch between the modeling and the real is repeatedly discussed in the application
of game theory to literature. Rapoport (1960) 238, in Shakespeare’s Othello, “if [Othello] believes Desdemona,
he may as well believe her version of the game ... and decide which game is in fact being played.”; Melhmann
(2000) 77, in Goethe’s Faust, Mephisto “realizes that his view of the game was false”.3In the case (v/2) ≤ c, then there are three equilibria and this environment describes the gradual shift toward
defection: before defection there is indifference.4By a constructio ad sensum, “all” becomes “each” (1.141.6.4-6) and to reiterate the point he proceeds
with the inverse meaning, where “each” becomes “all” (1.141.7.5-7). In between these statements, there are
two gnomai (i.e. assumptions): 1. The states vote at a great common cost for private revenge and also vote to
minimize private cost 2. Meetings are infrequent whereby they spend little time on the common interest and for
4
The multiplayer case where “all individually share this same notion” is called a tragedy of the
(unmanaged) commons.
Thucydides saw the ruin of interstate relations as dependent upon the intangible value
of the unmanaged “common interest”. 5 The matrix formulations above are the simplest
representation of an evolutionary tragedy of the commons.
This interpretation of tragedy is founded upon the notion that the cost of one’s behavior
is not factored into a benefit at which a choice can be valued. In the case of licence-exempt
wireless spectrum, the user will benefit at the moment of choice and simultaneously incur an
invisible cost. In agreement with Smith, Coase argued that “the value of what is obtained as
well as the value of what is sacrificed to obtain it” are externalities that are internalized by
property rights and bargaining (Coase 1960:2, esp. 1959; Herzel 1951). In the case of spectrum,
Aftab has shown that even if a token economy is introduced, which essentially allocates the
resource to those who value it most, “high-priority” packets have access “at the expense of the
low-value packets” (Aftab, 2002). The core problem in the allocation of spectrum is pricing:
how does the market, and especially users, value spectrum? (Hazlett, 2001) McAfee and Miller
proposed a way of valuing the free renewable resource of spectrum. Through an analogy of
picnic tables at a park, they concluded that unrestrained free access leads to a more efficient
use of the spectrum resource (McAfee and Miller, 2012). However this holds primarily for cases
where transportation costs to the park are low, which implies that the user’s valuation of the
the most part carry on with their own business. For a different interpretation of the voting free-rider problem
as a n-person Prisoner’s Dilemma see Brams (2011) 111-126, Brams, Kilgour (2009). See Axelrod (1984) for
the most famous experimental study of the repeated prisoner’s dilemma, but “Axelrod’s theoretical results are
not robust”. Axelrod’s process is problematic because he does not allow mutation and also any limit point is
a Nash Equilibrium. Nonetheless, the theory of the “evolutionary stable strategy cannot be straightforwardly
applied to infinitely repeated games”, (Osborne, 2004: 439-441). Kim (1994) reviews the literature and the
extensions of the PD as random pairwise matching among a population.5Thuc. 2.60 for citizens and the state; Note that Plato discusses the collective action problem with respect
to citizen voters and the incentive of sanctions to obey the law. This differs from Thucydides because their
is no law code to regulate interstate relations (Rep.2.360b-c). See generally Morrison (1994) on the topos of
comparing cities and individuals in Thucydides, and specifically that all are equal under Athenian law and this
is called a model (paradeigma, 2.37). Also see Aristotle’s Politics 1261b for the point on the assumption that
someone else will act as if they could observe your actions. Modern authors who discuss the problem Smith
(1776) 4.2; Hume (1739-40) 3.2.8 for a very similar description to Thucydides’, who also considers the incentive
of two people and then generalizes for many people. There exists a problem in moving from individual to
group motivation which I do not discuss here, see also Arist.Pol.1.1.; Mill (1848) 5.11.12; Pareto (1935) 3.1496
pp.946-7.
5
spectrum is in most cases low: “providing unlicensed spectrum is advantageous over licensing
when there is a large chance of very low value use.” In other words, a user shows a willingness
to pay for the resource, but would not be greatly damaged if he did not have access. Would
this be the case for users in executive meetings on tablets, in a stampeding crowd at a concert,
in a terrorist attack at an airport, or even watching Usain Bolt win an Olympic Gold on live
broadband television? All these cases are places and times at which the resource has the highest
intrinsic value and access is lowest. These are the instances that require focus.6
Licence-exempt wireless spectrum is an open access resource. It is consumed by users who
are unable to communicate with each other and are unable to devise joint benefits (like car
pooling to reduce congestion) because of a fundamental ignorance regarding the costs incurred
by device density. The culpability for interference in wireless networks is usually assigned
to device manufacturers, i.e. technology. Technology in point of fact has been improving at
phenomenal rates to keep up with the demand for the resource, and devices are built to squeeze
as much out of the available band as possible.7
Manufacturers, however, are interested in their individual revenue maximization, and in
turn flood the market with as many devices as possible (Ting et al. 2004). Since interference
is dependent upon the density of devices, the resource becomes steadily less accessible. This
is of particular interest to wireless providers who rely on technological innovation to remain
competitive. It is then plausible to first model the tragedy as density dependent, then assess
the relationship of technology to density dependent interference, and finally to build a model
using this spring board. We begin with an elementary model that looks at revenue maximiz-
ing firms in competition with each other to show the market mechanism that leads to overuse
(Frank, 1998; Gibbons, 1990). Demand for the resource is increasing, thus firms supply as
many devices as they are able to produce to buyers. The model demonstrates that the tragedy
6Rifkin (2000), in “The Age of Access” he argues for the increasing scarcity of human attention (i.e. time)
in comparison to location as a result of “the shift in the structuring of human relationships from ownership
to access”. The model below is concerned primarily with the spectrum utilization of small-cell infrastructures
that provide access to a myriad of special purpose systems. These general purpose digital devices, such as
commercial cell phones, provide users with greater spectral capacity and also government with public safety.
(CSMAC 2008) Our study does not concern those devices whose spectral band usage is underused.7There exists“the spectrum challenge posed by the rapidly increasing demand for mobile broadband capacity.
The need for additional spectrum to meet the anticipated increase in demand for wireless and mobile data has
been widely recognized internationally”, Ofcom report 29 March 2012“Securing long term benefits from scarce
spectrum resources”; Real Wireless report on techniques for increasing the capacity of wireless broadband
Since it is difficult to capture live interacting technology at specific times, we can best
measure the impact of technological innovation on the benefit to the user v through each firm’s
investment r in research and development, or more generally as investment in competition. 10
10FCC regulation is particularly explicit regarding it’s belief in the ability of licence-exemption to create in-
centives that drive competition and innovation. US Electronic Code of Federal Regulation. Title 47 “Telecom-
11
rir̄
(7)
Devices that are more interference robust are more costly to manufacture, such that “ro-
bustness is a choice variable”. (Ting et al. 2004) Manufacturer i’s investment level is denoted
ri. The average investment level is denoted r̄. This fraction allows us to represent successful
advances in technology as a result of quantifiable investment. If r̄ = ri the expression equals 1,
which mathematically expresses the idea that there is no benefit to the user from investment in
technology. If r̄ < ri, then the manufacturer invests more than average and by assumption has
a breakthrough in technology. (Frank, 2005, 2008) If however r̄ > ri, then the manufacturer
invests less than average and there is no breakthrough in technology. Both the first and last
assumptions characterize a less competitive manufacturer. It is assumed that these manufac-
turers lose market share to manufacturers with better devices (Rankin, 2006: 174),11 making
more of the bandwidth available.
This term requires some refinement. Not all device manufacturers compete with one an-
other. Some manufacturers specialize in ISM bands (voice and control wireless communication)
whereas other manufacturers specialize in Wi-Fi devices and wireless data transfers. In the
case of intraspecific competition rather than interspecific, fairly accurate knowledge of one’s
own market is assumed to be accessible to manufacturers of particular devices (Lotka-Votlerra
model for interspecific versus intraspecific competition). We do not model this interaction in
the r terms above, and therefore the statements herein are directed at a manufacturer who is
part of a market that produces a similar range of devices. The basic algorithm suggests that
each manufacturer must outperform those manufacturers within his product market in order to
survive. Manufacturers of inferior technology devices compete against one another, regardless
of those competing with superior technology. A manufacturer who produces a mixture of tech-
nologies low and high should then do the same and then compare his results against aggregate
average investment in technology.
munication”, Part 8 “Preserving the Open Internet”, Section 8.1 “Purpose”: “The purpose of this part is to
preserve the Internet as an open platform enabling consumer choice, freedom of expression, end-user control,
competition, and the freedom to innovate without permission.” This part addresses broadband internet access
services that exclude “dial-up internet access”, and include fixed wireless services, satellite services and mobile
stations. See Ofcom, Spectrum Sharing Consultation (9 Aug. 2013) “The future role of spectrum sharing for
mobile and wireless data services” p.4, 36ff, and https://www.gov.uk/government/publications/information-
economy-strategy.11“If a mutant individual invests slightly more in competition, they will produce more offspring than other
individuals in the population.”
12
v(A, ri, r̄) =(rir̄
)f(α)
(8)
The number of devices in the market is assumed to be increasing at a rate defined by a
function f(α), where f(α) is always greater than 1. We assign the magnitude of the relative
benefit of a manufacturer’s investment in technology f(α) as dependent upon the density of
devices α. Contra Hardin, this ratio models the growth of a manufacturer’s output with respect
to the density of the other manufacturers’ outputs. Every manufacturer also has a fitness,
or some level of interference resistant technology. This environment represents the density-
dependent intraspecific competition among device manufacturers, and by extension, among the
devices themselves.
f(α) =
(pα
α + γ
)(9)
The parameter γ describes how the benefits from competition v depend on the intensity
of density dependence. It is a spatial parameter that represents the local interference effect,
simulating how many devices are competing for the same spectrum. If(rir̄
)> 1, then v >
1. Thus, v continues to increase over time as a result of γ > 1 which represents that this
manufacturer’s efficient technology is pushing out inferior technologies 12 and simultaneously
decreasing the population of inefficient devices. If instead(rir̄
)< 1, then v < 1. Thus, v
continues to decrease over time because γ = 0 and this manufacturer’s technology is inefficient
and is not competitive, likely flooding the market with more of his own devices. If γ = 0 the
benefit function is density independent. The latter case describes a growing population with
poor competition.
The growth of the population of devices is linked to increasing demand for devices as a result
of falling prices,13 such that p ≥ 0 scales the benefits gained from investing in technology. As
technology tends to improve, the prices of devices tend to fall. Innovation, outmodes devices
and reduces manufacturing costs, allowing manufacturers to offer cheaper and better devices.
This implies that f(α) depends also on falling prices p for the end user. 14 Therefore p is
12Thuc. 1.71.3 “It is necessary, as is the case in any craft (techne) for innovation always to win out”.13For a tangible example of this trend, in the USA the average revenue per minute for wireless mobile telephone
services was 0.44 dollars in 1993 and 0.07 dollars in 2005. Data taken from the FCC, Commercial Mobile Radio
Services (CMRS) Competition Report (11th Annual), Division presentation.14An important side note regarding the parameters p and γ, the former is a magnitude and thus a fixed
13
the change in price trends of devices, which allows us to associate access/user benefit to price
f(α, p). The expression pα allows us to assume that any change below or above 1 increases
benefit gained from technological innovation, such that for p < 0 there is no benefit. A price
increase is modeled as any value p ∈ [0, 1) and a price decrease as p ≥ 1. This is because
the relative benefit from investing in competition f(α) must increase as population density
increases, since more competition leads to fewer devices in operation. Alternatively, as the
number of devices increase, v necessarily decreases.
If α is increasing over time, and v remains constant, it can be assumed that this manu-
facturer’s efficient technology (or increased sharing) is pushing out inferior technologies and
simultaneously decreasing the population of inefficient devices, and so we define a mortality
rate m(α). Mortality represents average device replacement. For example, smart phones are
replaced on average every 18 months and laptops every 3-4 years. So that as α increases mor-
tality rises, and as α decreases mortality falls. In the case mortality falls, the assumption is that
the technology of some of the manufacturers’ is inefficient and not competitive, likely flooding
the market with more of his own devices. This is the case that describes a growing population
with poor competition.
In the same way that technologies die off, they are also born or rather developed. The birth
rate b is a constant which expresses that technologies appear regardless of competition and
represents historical demand. There is also a cost in investing in competition, such that the
more one invests in technology the risk of that technology not yielding enough profit increases.
The function h(r) = rβ is a simple function that represents an accelerating or decelerating
risk, if β ≥ 1 or β < 1, respectively. Putting all these elements together, we have a model
that represents the average per manufacturer benefits and costs of investing in competition
dependent on the density of devices in the licence-exempt spectrum market: his fitness.
v(A, ri, r̄)b−m(α)− h(r) (10)
We can then model the growth rate of α, given one manufacturer’s investment choice.
α̇ = v(A, ri, r̄)bα−m(α)α− h(r)α (11)
By way of an example, in a pair-wise invasibility plot we can model investment in compe-
tition ri on the y-axis and average investment in competition r̄ on the x-axis (Rankin, 2007:
measurable value which is not dependent on the distance from the epicenter of interference. The latter is a
value of intensity in which the responses from the local populace are taken into consideration when calculating
the intensity of the the signal.
14
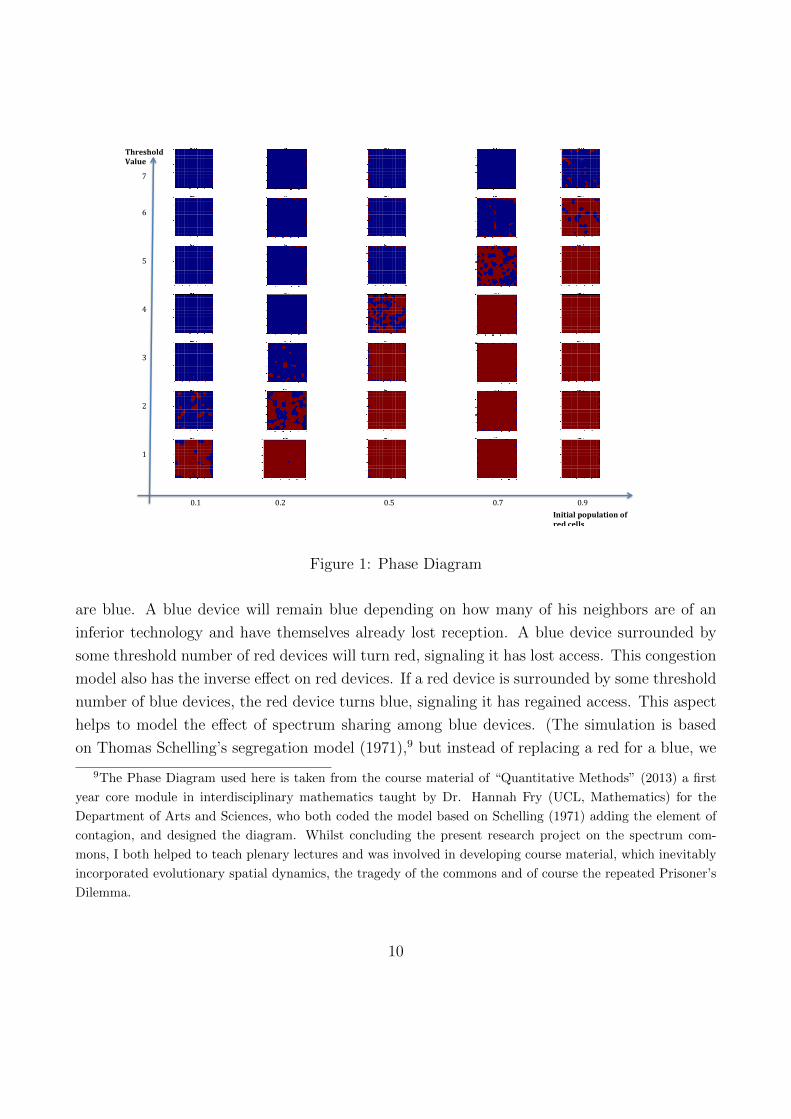
176). This corresponds to the simple agent-based model simulation: the more investment the
higher the threshold value (interference resistance), and the more devices have low interference
resistance the more interference (the less blue devices survive). We can now see clearly that
the relationship is a straight line and that it is up to the other parameters to determine the
regions of growth and decay and ultimately the ESS.
Figure 2: y-axis ri, x-axis r̄, Figures 2a and 2b
White areas represent that manufacturer i increases his production, while black represents
manufacturer i decreases his production. The ESS is the point at which the black and white
areas meet. First assume a manufacturer chooses an above average investment in technology(rir̄
)> 1 in an environment with high population density (and with m(α) = 1).Then assume
there is price stagnation p = 1 and accelerating risk β = 1.5. If there is low intensity of density-
dependence of the benefits from competition γ = 0.01 and the population average strategy
r̄ is high, the ESS is close to the extinction threshold. (Figure 2a) Any higher investment
by manufacturer i above the dashed bar would lead all other devices to extinction, since the
average investment would have to rise in order to compete (i.e. no one would be able to compete
leading to exits and bankruptcy). Rankin posits that as a result the ith individual would also
go extinct. (This need not be the case if we think in cycles.) Conversely, if there should be
a high intensity of density-dependence of the benefits γ = 100, a lower average investment in
competition r̄ pushes the ith manufacturer’s equilibrium investment strategy further away from
the extinction threshold. (Figure 2b)
What we are trying to interpret is not whether technology will improve but how fast must
the market push for technological innovation as a result of the increasing demand for wireless
devices. An idea stated but not modeled by McAfee and Miller “Unlicenced bands are preferable
in the presence of innovation”. An interesting next step would be to see whether their valuation
15
insights could be combined with density dependent intraspecific competition. They themselves
admit that “It is not clear whether innovations in telecommunications hardware occur at a
fast enough rate to affect values in the manner described in the paper.” (McAfee, Miller, 2012:
351-352) In our model innovation is a variable not an assumption.
There are four scenarios in the research on spectrum that need evaluation. Devices under
the licence-exempt regime can either be limited by an institution or can be set by manufacturers
who are maximizing profits. A manufacturer’s investment in competition can likewise be chosen
by himself or required by a regulator. A graphical analysis of these four environments may
lead to interesting conclusions on how parameters and variables interact. An interesting case
study would be to see the evolution of the digital communication standard from 900MHz
CT1 and CT2 to DECT (Digital Enhanced Cordless Communication), where DECT almost
universally replaced the former standard in most countries except for North America on account
of regulation. Then from DECT to Wi-Fi, where DECT was replaced in terms of data while
still maintaining double the coverage of Wi-Fi. The replacement of one technology (DECT) for
the other (Wi-Fi) is costly. Both DECT and Wi-Fi in turn compete with 3G and 4G on voice
and data.
As the literature attests, the market mechanism alone does not have a strong enough invis-
ible hand to ensure the efficient allocation of the open access resource, because manufacturers
will sell as many inefficient devices as they can to users, if the average investment strategy
is too low (or too high). The oft proposed solution is to change demand by either raising
prices or increasing the allocation of licence-exempt spectrum. An alternative, however, would
be for regulators to also inform users that it is in their best interest to actively demand that
device manufacturers demonstrate awareness of the spectrum commons. This would force the
average investment strategy to rise, and push away from the threshold (or close the gap if the
average was already high). Consequently, through market pressure manufacturers would strive
to sell products with greater robustness and better methods of sharing. This not only sees
improvements in device robustness, but also an investment in geographic sharing in the form
of MAS (multi-antenna signal processing). Users, now aware of the cause, can put pressure on
product manufacturers to be user conscious and thereby increasing competition, i.e. help γ and
h(r) remain high. This is equivalent to manufacturers forming what Thomas Schelling called
a “self-restraining coalition” and what Steven Brams called “a public outcry” (Schelling, 1978:
214, 223-4; Brams, 2011: 119ft.7), in order to turn “permission” to innovate into an “obliga-
tion” to innovate (Ostrom, et al., 1994: 38). Marketing campaigns should chide the industry
for their general negligence and demand that industry communicate to users their initiatives
16
(i.e. their investment strategies to find technological solutions) to combat the tragedy of the
spectrum commons. This should be part of every firm’s corporate social responsibility. On the
other hand, alternatively, regulators can require a minimum level of robustness. Institutional
management can set a threshold level ri. The latter regulatory solution, in contrast to the
former public awareness solution, requires a stupendous amount of statistical analysis and a
number of predictive assumptions, whereas the former is a solution that would allow the market
to self-regulate freely.
Acknowledgments: This research paper was supported by British Telecom, Adastral Park.
I would like to thank my supervisors Maziar Nekovee (BT) for his guidance and patience and
Simon Hornblower (Oxford University) for his support. I would also like to thank UCL Ad-
vances for awarding the Enterprise Scholarship for this project. UCL Advances has sponsored
this commercialization chapter, now appended to my thesis. All mistakes are my own.