Train-Induced Vibrations on Embankments and in Buildings – Prediction and Validation of Some Models Christoffer With Doctoral Thesis Division of Soil and Rock Mechanics Department of Civil and Architectural Engineering Royal Institute of Technology Stockholm 2008
Transcript
Train-Induced Vibrations on Embankments and in Buildings – Prediction and Validation
of Some Models
Christoffer With
Doctoral Thesis
Division of Soil and Rock Mechanics Department of Civil and Architectural Engineering
Royal Institute of Technology
Stockholm 2008
TRITA-JOB PHD 1010 ISSN 1650-9501
To my family
Theory without practice is fantasy, practice without theory is chaos.
Unknown
Train-Induced Vibrations on Embankments and in Buildings
PREFACE This thesis is the result of two projects – the final phase of ENVIB (ENvironmental effects of train-induced ground VIBrations) and the entire RSMVib (Rolling Stiffness Measurement Vehicle vibrations). The research was conducted at the Division of Soil and Rock Mechanics at the Royal Institute of Technology (KTH) in Stockholm. The study was sponsored by the Swedish National Rail Administration (Banverket). Part of RSMVib was carried out in cooperation with Delft University of Technology in the Netherlands. The first phase of ENVIB was carried out by Mehdi Bahrekazemi (2001-2004) and was presented in a PhD thesis [1]. The second phase of ENVIB was completed by Christoffer With (2003-2005) and was presented as a Licentiate thesis [2]. This doctoral thesis, written between 2006-2008, completes the RSMVib project. Part of project ENVIB is included in this thesis. Senior Lecturer Anders Bodare managed both projects. A reference board has followed the projects and provided advice. The reference board for ENVIB consisted of Dr. Christian Madshus (NGI), Dr. Lars Olsson (Geostatistik) and Licentiate Eric Berggren (Banverket). The reference board for RSMVib consisted of Dr. Christian Madshus (NGI), Dr. Bo Andréasson (WSP), and Licentiate Eric Berggren (Banverket).
ix
Preface
x
Train-Induced Vibrations on Embankments and in Buildings
AUTHOR’S ACKNOWLEDGMENTS My greatest thanks go to my supervisor, Senior Lecturer Anders Bodare. A significant part of the work for the RSMVib project was carried out at the Delft University of Technology in the Netherlands during autumn 2006. The exchange of ideas with Professor Andrei Metrikine, who invited me to stay on as a Junior Fellow, and his staff was rewarding. I would like to recognise Banverket for substantial financial support. The members of the two reference boards who have contributed valuable help and support throughout the duration of my work are gratefully acknowledged: Dr. Christian Madshus (NGI), Dr. Bo Andréasson (WSP), Dr. Lars Olsson (Geostatistik), and Licentiate Eric Berggren (Banverket) as well as Mr. Alexander Smekal, my contact at Banverket. Furthermore, I would like to thank Professor Håkan Stille and my fellow colleagues at the Division of Soil and Rock Mechanics for fruitful discussions and good company. I would also like to acknowledge the Norwegian Geotechnical Institute (NGI) for the opportunity to present and discuss my work in Oslo in May 2005. The cooperation and assistance of Dr. Kent Lindgren (MWL) and Dr. Sandra Brunsberg, together with Dr. Friedrich Quiel, Ms. Lena Wennerlund and Mr. Per Delin at KTH, and Ms. Cynthia Rullan, as well as Mr. Göran Wallmark, Ms. Anna Gjers, Mr. Hans Filipson and Ms. Karolin Jonsson at Banverket are greatly appreciated. Sincere thanks go to the Lindgren families of Halmstad, who allowed us to mount instruments inside their houses and in their backyards, and to Mr. Lars-Håkan Jansson in Mosås, and the county of Kumla, who allowed us conduct our measurements on their property. The Seismological Department of Uppsala University is appreciated for lending us their seismometers. Christoffer With Stockholm, April 2008
xi
Author’s Acknowledgments
xii
Train-Induced Vibrations on Embankments and in Buildings
LIST OF PUBLICATIONS Parts of this thesis have been published or submitted to journals- and conference papers. Four papers A-D are appended to this thesis. Following is a complete list of material that has been published or submitted for publication during the second phase of project ENVIB and project RSMVib.
INTERNATIONALLY REVIEWED JOURNALS
• With C, Bahrekazemi M, Bodare A. Validation of an empirical model for prediction of train-induced ground vibrations. Soil Dynamics and Earthquake Engineering 2006;26(11):983-990. Paper A.
• With C, Bodare A. Prediction of train-induced vibrations inside buildings using transfer functions. Soil Dynamics and Earthquake Engineering 2007;27(2):93-98. Paper B.
• With C, Bahrekazemi M, Bodare A. Wave barrier of lime-cement columns against train-induced ground-borne vibrations. Submitted to Soil Dynamics and Earthquake Engineering.
• With C, Bodare A. Evaluation of track stiffness with a vibrator for prediction of train-induced displacement on railway embankments. Submitted to Soil Dynamics and Earthquake Engineering. Paper C.
• With C, Metrikine A, Bodare A. Identification of effective properties of the railway substructure in the low-frequency range using a heavy oscillating unit on the track. Submitted to Archive of Applied Mechanics. Paper D.
LICENTIATE THESIS
• With C. Validation of Two Models for Prediction of Train Induced Ground Vibrations. Royal Institute of Technology, 2005.
CONFERENCES
• With C, Bahrekazemi M, Bodare A. Mätningar av tåginducerade markvibrationer i Kåhög före och efter motåtgärd. In 16th Nordic Geotechical Meeting, Ystad, 2004. Swedish.
• Bahrekazemi M, With C, Bodare A. Semi-Empirical Model for Prediction of Train Induced Ground Vibrations. In Nordic Vibration Research, Stockholm, 2004.
xiii
List of Publications
• With C, Bodare A. Field test of a semi-empirical model for prediction of train-induced ground vibration. 2nd International Symposium on Environmental Vibrations, Okayama, 2005.
• With C, Larsson S, Bodare A. Lime-cement columns as wave barrier against train-induced vibrations. XIV European Conference on Soil Mechanics and Geotechnical Engineering, Madrid, 2007.
• With C, Bodare A. Deriving parameters of track and subsoil with a stiffness measurement vehicle. 3rd International Symposium on Environmental Vibrations, Taipei, 2007.
REPORTS TO SWEDISH NATIONAL RAIL ADMINISTRATION EnVib, Phase II
• A study of Models 01 and 02 Developed Within Project EnVib, Report 1, Phase II.
• Validation of two Models for Predictions of Train Induced Ground Vibrations, Report 2, Phase II.
• Field Test of Model EnVib-01, Report 3, Phase II. RSMVib
• Literature Study for Project RSMVib, Report 1. • Models for Prediction of Vibrations, Project RSMVib, Report 2. • A Model for Predicting Vibrations on a Railway Embankment Using
Parameters Derived with RSMV. Report 3. • Field Measurements Performed in Project EnVib Phase II and
RSMVib, Report 4.
xiv
Train-Induced Vibrations on Embankments and in Buildings
CONTRIBUTIONS The four papers appended were prepared in collaboration with co-authors. The author of this thesis was responsible for the major contribution of these papers as described below. The three co-authors are:
Senior Lecturer Anders Bodare, advisor, Papers A-D Dr. Mehdi. Bahrekazemi, former PhD student at KTH, Paper A Professor Andrei Metrikine, local advisor at TUDelft, Paper D
Paper A: Validation of an empirical model for prediction of train-
induced ground vibrations Led the planning of the measurements Led the measurements Analysed the measurements Developed the theory Planned the paper Wrote the paper Paper B Prediction of train-induced vibrations inside buildings using
transfer functions Led the planning of the measurements Led the measurements Analysed the measurements
Developed implementation of the theory Planned the paper Wrote the paper Paper C Evaluation of track stiffness with a vibrator for prediction of
train-induced displacement on railway embankments Led the planning of the measurements Led the measurements Analysed the measurements Developed the theory Planned the paper Wrote the paper
xv
Contributions
Paper D Identification of effective properties of the railway substructure in the low-frequency range using a heavy oscillating unit on the track
Led the planning of the measurements Led the measurements Analysed the measurements Developed part of the theory Planned the paper Wrote the paper
xvi
Train-Induced Vibrations on Embankments and in Buildings
LIST OF CONTENTS
PREFACE .................................................................................................................................... IX AUTHOR’S ACKNOWLEDGMENTS..................................................................................... XI LIST OF PUBLICATIONS ..................................................................................................... XIII CONTRIBUTIONS .................................................................................................................... XV LIST OF CONTENTS....................................................................................................................1 NOMENCLATURE .......................................................................................................................3 1 INTRODUCTION ..................................................................................................................7
1.1 BACKGROUND AND PROBLEMS ..........................................................................................7 1.2 OBJECTIVES AND LIMITATIONS ........................................................................................10 1.3 DISPOSITION OF THESIS ....................................................................................................13
2 SOME ASPECTS OF MODELLING.................................................................................15 2.1 MODEL FOR PREDICTING ENVIRONMENTAL VIBRATIONS..................................................16 2.2 MODEL FOR PREDICTING VIBRATIONS IN BUILDINGS ........................................................24 2.3 MODEL FOR DERIVING SITE PARAMETERS AND PREDICTING DISPLACEMENT OF
EMBANKMENT .................................................................................................................27 2.4 MODEL FOR DERIVING FREQUENCY DEPENDENT SITE PARAMETERS OF EMBANKMENT.....35
3 DISCUSSION AND CONCLUSIONS ................................................................................41 3.1 MODEL FOR PREDICTING ENVIRONMENTAL VIBRATIONS..................................................41 3.2 MODEL FOR PREDICTING VIBRATIONS IN BUILDINGS ........................................................41 3.3 MODEL FOR DERIVING SITE PARAMETERS AND PREDICTING DISPLACEMENT OF
EMBANKMENT .................................................................................................................42 3.4 MODEL FOR DERIVING FREQUENCY DEPENDENT SITE PARAMETERS OF EMBANKMENT.....43 3.5 FINAL DISCUSSION AND CONCLUSIONS.............................................................................44
4 FURTHER RESEARCH......................................................................................................45 5 ABSTRACTS OF THE APPENDED PAPERS .................................................................47 6 REFERENCES .....................................................................................................................49 APPENDED PAPERS A-D MEASUREMENTS
1
List of Contents
2
Train-Induced Vibrations on Embankments and in Buildings
NOMENCLATURE The symbols are written in alphabetic order under four sub-titles, Roman, Greek, Swedish Geotechnical Society, Other and Abbreviations. Under the sub-title Swedish Geotechnical Society is the abbreviations and symbols used in figures that present the geotechnical conditions at the sites explained separately [3].
ROMAN A Area [m2] a Parameter in EnVib-01 [(mm/s)/(km/h)] a1 Parameter in model EnVib-01 [(mm/s)/(kN*km/h)] a2 Parameter in model EnVib-01 [(mm/s)/(kN*km/h)] b Parameter in model EnVib-01 [(mm/s)/(km/h)] Width of beam [m] b1 Parameter in model EnVib-01 [(mm/s)/kN] b2 Parameter in model EnVib-01 [mm/s] c Distributed damping constant [Ns/m2] cc Critical velocity [m/s] cs Shear wave velocity [m/s] D Damping ratio [-] E Young’s modulus [N/m2] EI Bending stiffness [Nm2] F Point load [N] Frms 1s-r.m.s. load [kN] f Frequency [Hz] fc Characteristic frequency [Hz] fr Resonance frequency [Hz] H Soil flexibility [m/N] Hmax Maximum absolute soil flexibility [m/N] h Depth [m] I Moment of inertia [m4] K Soil stiffness [N/m] K0 Static soil stiffness [N/m] k Spring stiffness [N/m] kc Characteristic wave number [1/m] m Mach number V/cc [-] Mass [kg] n Damping factor in EnVib-01 [-]
3
Nomenclature
P Point load [N] p Distributed load [N/m] r Distance from the source [m] r0 Reference distance [m] r1 Distance from the source to observation point 1 [m] r2 Distance from the source to observation point 2 [m] t Time [s] V Speed of the load [km/s] or [m/s] v Particle velocity [m/s] vmax Maximum peak particle velocity [mm/s] vrms 1s-r.m.s. particle velocity [mm/s] vrms1 1s-r.m.s. particle velocity at observation point 1 [mm/s] vrms2 1s-r.m.s. particle velocity at observation point 2 [mm/s] v0,rms 1s-r.m.s. particle velocity at the reference position [mm/s] w Particle displacement [mm] x Coordinate in the fixed frame of reference [m] y Coordinate in the fixed frame of reference [m] z Coordinate in the fixed frame of reference [m] Derivative with respect to time
´ Derivative with respect to space
GREEK
α (1+m2)0.5 [-] β (1-m2)0.5 [-] δ Damping constant [Ns/m2] δ(x) Dirac pulse in x [1/m] κ Distributed spring constant [N/m2] ζ Coordinate in the moving frame of reference [m] η Coordinate in the moving frame of reference [m] ξ Coordinate in the moving frame of reference [m] ρ Density [kg/m3] ρc Distributed density [kg/m] ω Angular frequency [rad/s] ωc Critical angular frequency [rad/s] ωr Resonance angular frequency [rad/s]
4
Train-Induced Vibrations on Embankments and in Buildings
SWEDISH GEOTECHNICAL SOCIETY CPT Cone Penetration Test F Fill GW Groundwater level hv/0.20 m Half turns needed to lower the probe 0.20 m Le Clay Let Dry-crust clay Mn Till qc Point resistance (uncorrected) St Sensitivity s/0.20 Number of seconds required per 0.2 m of penetration Sa Sand Si Silt Skr Helical auger Slb Percussion sounding Vim Weight sounding, machine driven w Water content [-] τf Shear strength (unreduced) [N/m2]
Sounding terminated without reaching refusal
The probe cannot be driven deeper by normal procedure
Examples of results from a borehole investigation. [3]. Rötter/Roots, Swedish/English.
5
Nomenclature
Examples of presentation of soil parameters measured [3].
OTHER
H10 10 m right of a defined centre line km 215+550 System adopted by Banverket to define a position. In this example is the position located 215.550 km along the railway line. Note that the beginning of the line can be given any positive value and does not necessarily have to start at 000+000 Ruk The lowest part of the rail V5 5 m left of a defined centre line +35.7 Elevation, 35.7 m above the reference level
ABBREVIATIONS BEK Bernoulli-Euler Kelvin BEW Bernoulli-Euler Winkler KTH Kungliga Tekniska Högskolan (Royal Institute of
Technology) Lic. Licentiate MWL Marcus Wallenberg Laboratory NGI Norwegian Geotechnical Institute SASW Spectral Analysis of Surface Waves SGF Swedish Geotechnical Society SGI Swedish Geotechnical Institute TUDelft Delft University of Technology
6
Train-Induced Vibrations on Embankments and in Buildings
1 INTRODUCTION
1.1 BACKGROUND AND PROBLEMS Train-induced ground vibrations are of growing concern as a result of the public’s demand for faster and more frequent access to mass transit and industry’s interest in increasing the payload capacity per train. Excessive vibrations in urban areas can lead to public disturbances, malfunction of sensitive equipment, and in extreme cases, even damage to buildings. Furthermore, high magnitudes of ground vibrations increase the maintenance cost of tracks and are therefore a concern even in sparsely populated areas. Train-induced vibrations in the track and the outward propagating waves are complex problems and are not fully understood. The vibrations can be subdivided into quasi-static displacement and wave propagation. A significant part of the problem in understanding the train-induced vibrations, and then predicting vibrations, is the physical size of this three-dimensional problem and the inhomogeneous nature between materials but also within them. Another problem is finding all parameters relevant to a model that is able to accurately describe the situation. In most cases, it can be too costly and time consuming to make a complete site investigation. The problem of train-induced ground vibrations is often spatially divided into railway track (including the rail, pads, sleepers, and railway embankment), soil, and buildings/people/equipment. The parts of this chain are sometimes also referred to as the source, path, and object [1,4], Fig. 1.
ObjectPathSource ObjectPathSource
Fig. 1. Schematised source-path-object
7
Introduction
1.1.1 Source The quasi-static displacement is due to the static load of the train while waves that propagate outwards, and in the direction of the embankment, are due to the interaction of the cars, the track and the subsoil, and caused by spatial changes. A stationary load, i.e. an axle from a train standing still on the track, will cause displacements in the embankment and ground around the train. These displacements are sometimes referred to as the “trough”. The shape of the trough depends on the bending stiffness of the track as well as that of the supporting layers. For a moving load, the trough will follow the load but the shape of the through will change with the speed of the train and it is referred to as a quasi-static displacement [4-6]. As the speed increases, the displacements will increase until the train has approached the critical speed, at which point an increase in train speed will decrease the displacements. The critical speed is associated with the Rayleigh wave velocity in the embankment and sub-soil [1-2,4-5,7-8]. Corrugations of geometry are found on the rail [9]. The wavelength of the unevenness can be measured in millimetres up to kilometres. The discontinuity of sleepers along the track can be seen as a spatial change in the stiffness supporting the rail [4]. For some sleepers, due to wear on the track, the contact with the ballast will decrease over time, resulting in a pattern of different contact forces applied to different sleepers [10]. In the same way the size and properties of the embankment as well as the soil (which is often layered) can be viewed as both a spatial change of geometry as well as stiffness supporting the layer above [11]. The result of the spatial changes is that a time dependent force is applied to each sleeper when the axles of the trains pass by. Another result is that the vertical movement of the train wheels forces the body of the car into motion, causing a dynamic force that is added to the static force applied to the rail via the axle. The sleepers will be forced into motion causing emission of waves. The force applied on the sleepers will be distributed in the ballast and waves may be excited from other locations than the sleepers. The size of the embankment is also important, not only for the internal damping (friction) or the load’s pressure distribution, but also because certain frequencies are amplified or deamplified [4]. In the same manner, the distribution of the load and how the rail and embankment bends under pressure are important [12-14]. Another difficulty when determining the properties of the track is the non-linearity of the shear modulus for different magnitudes of strain in the ballast material [13].
8
Train-Induced Vibrations on Embankments and in Buildings
1.1.2 Path As a wave propagates from the railway track, it is subjected to internal damping (also called material damping or dissipation) and attenuation (commonly referred to as geometric damping) and scattering against inhomogeneities. Upon contact with a medium with different specific impedance, the wave will be reflected and refracted. This conveys a significant problem for most models since both the embankment and soil are quite inhomogeneous in all directions. In certain conditions, the geometry or differences in material properties can focus waves, creating areas of the surface with greater and lower magnitudes, respectively, of vibrations compared what might be expected due to their relative distances to the railway track. Where layering exists, waves of the same frequency might propagate at different velocities due to differences in properties, i.e. shear modulus and Poisson’s ratio [15].
1.1.3 Object The final link in the chain is the object. An object refers to a building and the people and equipment inside of it. Waves encountering a building are reflected and transmitted in the same manner they would if they encountered any other object or soil layer in the ground. A building is especially sensitive to frequencies close to its eigen frequencies, which are related to the building’s dimensions. In addition, humans and the equipment have different degrees of sensitivity to vibrations of different frequencies as well as exposure times [16-18].
1.1.4 Countermeasures Various countermeasures have been developed and implemented in order to mitigate the effect of train-induced ground vibrations. However, countermeasures can intrude upon adjacent property and be quite costly. Examples of such countermeasures are concrete slabs under the railroad embankment, honeycomb-wave impeding barriers, as well as open and in-filled trenches beside the railroad [19-26]. Naturally, the most advantageous remedy would be to identify and avoid problematic areas before constructing the railway line or not locating new buildings close to an existing railway. Although it is not always possible to alter a route, an early acknowledgment of the problem can still prove valuable to engineers. At the beginning of a project, the design is more flexible and the cost of altering plans is comparatively small but increases significantly as the process moves forward. Different models – both empirical and numerical – have been developed to support designers and engineers, both in preliminary planning and in detailed proposals for embankments and countermeasures. A selection of models are presented in [1-2,5-8,12-14,27-40].
9
Introduction
1.2 OBJECTIVES AND LIMITATIONS As can be concluded, the area of research that can be grouped under the title train-induced vibrations is quite wide and spans several academic disciplines. This thesis has taken into consideration several important aspects. For administrative reasons, this thesis has been performed under two projects, ENVIB and RSMVib. ENVIB is the work done during the Licentiate project, and RSMVib, is the work carried out thereafter, as mentioned in the preface. The focus of the first project (ENVIB) was predicting the magnitude of vibrations in the track’s environment. The objective of the ENVIB project was to validate and extend the use of the two models developed in an earlier phase of the project by Dr. Mehdi Bahrekazemi [1], EnVib-01 and EnVib-02. Both models are meant to be easy to use and require no more than limited knowledge of the sites where they predict train-induced vibrations. Being able to quickly make adequate predictions with limited knowledge about site conditions is important at the beginning of a project in order to be alerted early to potential problems. At a later stage of the project, the information is greater but so is the cost of making changes. Paper A presents model EnVib-01 and considers the source and path. Paper B presents the part of model EnVib-02 that considers the object (building). This part could be applicable for engineers and incorporated into other models. The parts of EnVib-02 considering the source and the path, were not investigated further following the validation presented in [2]. The focus of the second project (RSMVib) was primarily to derive parameters representing the embankment and subsoil but also to predict the magnitudes of vibrations on the track. This is because it is both a challenging and time-consuming task to obtain the quality and quantity of input data needed for models. In an effort to address these concerns, a special measuring car, the Rolling Stiffness Measurement Vehicle (RSMV), was made available, depicted in Figs. 2-3. Because the equipment is installed in a modified freight car that can be pulled behind a standard engine car, it can be used to investigate a railway line of significant length over a relatively short period of time. The objective was to see if the point flexibility/stiffness of the track-embankment-subsoil system can be obtained by measuring the force applied to an axle of the car and the responding acceleration. The force originates from two oscillating weights. The point flexibility can then be used to derive properties of different models, which can in turn be used to predict train-induced ground vibrations.
10
Train-Induced Vibrations on Embankments and in Buildings
Fig. 2. Inside the RSMV, the weights in the rack above the rear axle are set in motion with hydraulic pistons [36].
Fig. 3. The measuring car, in the middle, is a modified freight car pulled behind an engine car. The crew and control functions are in the last car (to the left, with the word MÄTVAGN, measuring car, on the side).
11
Introduction
Two ideas how to view the embankment-ground system have been evaluated in Papers C and D. Each paper describes a method for deriving the physical parameters of a track-embankment-subsoil system. Predictions of the maximum peak particle displacement of both freight trains and passenger trains are evaluated in Paper C. Both Papers C and D consider the source. Common for both projects, ENVIB and RSMVib, has been to find methods to evaluate sites with limit amount of prior knowledge and at a fairly short amount of time. Papers A-D are organized in Table 1 depending on the area/areas they consider. Table 1. Schematised presentation of the areas covered by the appended Papers A-D.
Paper Source Path Object A X X B X C X D X
Since the field measurements were carried out on normal railway lines used by ordinary freight and passenger trains, only trains at sub-critical velocity could be studied. In addition to Papers A-D, aspects of modelling and mitigation of train-induced vibrations have been discussed and presented in other contexts. A list of publications is presented in an earlier chapter.
12
Train-Induced Vibrations on Embankments and in Buildings
1.3 DISPOSITION OF THESIS This thesis is presented as a fusion of four papers and an extended introduction. Each paper is independent in the sense that it can be read in any order the reader prefers. The first two have been published and the other two have been submitted for publication. Chapter 2. Some aspects of modelling
A brief introduction to models opens this chapter. Some aspects of deriving site parameters and predicting vibrations on the railway embankment (source), in the vicinity (path), and inside buildings (object) are presented. The aspects considered reappear in the appended papers. Papers A, C, and D address the vibrations on the embankment, and Paper A also discusses the vibrations in the vicinity. Paper B considers modelling of motion inside buildings.
Chapter 3. Discussion and conclusions
Validation and the extension of EnVib-01 and EnVib-02 (the part that considers the object/building) are analysed. Furthermore, the measured point flexibility/stiffness from the RSMV and the derived parameters that represent the embankment and subsoil are discussed and conclusions are drawn. Results from predictions of the maximum peak particle displacement of both freight trains and passenger trains from one model are also analysed.
Chapter 4. Further research
Research is an ongoing process and in this chapter, the author suggests topics for further research based on Chapters 2-3.
Chapter 5. Abstract of the appended papers
For the convenience of the reader, all abstracts of the appended papers are presented together in this chapter.
Appendix Papers A-D and a chapter providing additional information about where and how the measurements have been taken, including a presentation of the instrumentation used on the ground as well as the RSMV.
13
Introduction
14
Train-Induced Vibrations on Embankments and in Buildings
2 SOME ASPECTS OF MODELLING
A model is a representation of reality. Each model describes a specific part of reality in terms and conditions that can be experimentally determined or assumed. The purpose of a model is to understand and predict a reality that is complex. It is important to understand that there will always be limitations with a model, regardless of whether it is rather simple or very advanced, because all models simplify the reality. Assumptions must be made. Assumptions relate to those phenomena that might be relevant to model. Otherwise, designing models would be overwhelming, determining input parameters difficult and the calculation time too great for practical use. This is true especially at the beginning of a process when it is important to get an overall view and recognise potential problems. Considerable returns can be expected by using the right model for a particular problem. This thesis has looked at some aspects of modelling vibrations at the source (on the railway embankment), path (in the vicinity of the track), and at the object (building). Emphasis has been on models that are easy and quick to use without great prior knowledge of the area of interest, in order to reduce cost and save time. Predictions of train-induced vibrations in the ground can be presented as displacement, velocity, or acceleration. The focus has shifted over the course of the two projects. In project ENVIB, the focus was to predict vibrations disturbing people. International as well as Swedish standards [17-18] recognize that analysis of vibration measurements with respect to human comfort shall be carried out using average vibration amplitude rather than the magnitude of individual peaks, as long as the peaks are not significantly much greater. Therefore, running 1s-r.m.s.-particle velocity (one second root-mean-square) is used. Running 1s-r.m.s. is defined by ISO [17] as the square root of the average of the square values over a certain time (one second in this case). One objective of project RSMVib was to predict motion on the embankment. Banverket, has a standard that gives guidelines regarding motion of the railway embankment in maximum displacement [40]. Therefore, in the second project, measurements and prediction are presented as absolute maximum peak displacements.
15
Some Aspects of Modelling
2.1 MODEL FOR PREDICTING ENVIRONMENTAL VIBRATIONS EnVib-01 is an empirical model to predict train-induced ground vibrations in a preliminary design phase. The model is simple to use and gives a quick assessment of the magnitude and the distribution of the ground motion that can be expected on the track and in the vicinity of the track with respect to 1s-r.m.s. It can be useful for planning a new track or before allowing trains to run faster with heavier cargo on an existing railway line. The model has been validated from field measurements in Sweden. EnVib-01’s strength is that it can produce results relatively quickly with a limited amount of information about the area. Although the predictions of EnVib-01 are somewhat crude, the ambition of the model is to reduce the number of areas in a region that need a more thorough and detailed analysis.
2.1.1 Model Using the model is quite straightforward. A stretch of railway line is selected and divided into subsections depending on the dimensions of the embankment, soil strata and material properties (density and shear modulus). Each subsection is matched with previously investigated areas with comparable ground conditions, from which model parameters have been derived. Model parameters are then assigned to each subsection. The assigned stretch can consequently be analysed. The user can elaborate with different values of wheel forces and train speeds and also change the location of the track to find the optimum location for the railway line. Areas that are potentially sensitive to train-induced ground vibrations can be detected. The results may be presented in a graphical map showing the predicted ground motion. A range of colours or contour lines could indicate the particle velocity on the railway embankment and in the surrounding area. An example of this is given in Fig. 4 and [2]. The model works in two steps. The first step is the calculation of the particle velocity at the top of the embankment from a given train velocity and axial loads. In the next step the particle velocity is calculated at an arbitrary point from the track.
16
Train-Induced Vibrations on Embankments and in Buildings
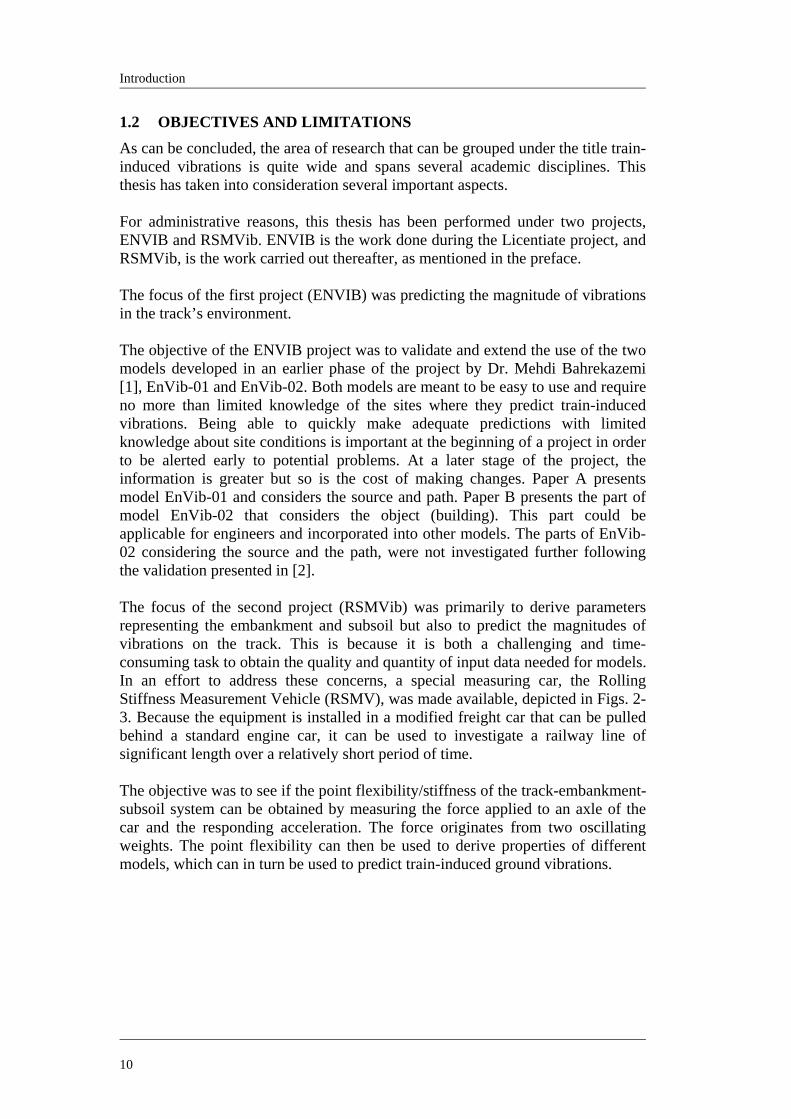
Fig. 4. Two kilometres along the railway line north of Kumla. Contour lines define predicted train-induced ground vibrations at the magnitudes of 0.3, 1.0, and 2.5 mm/s respectively for a freight train at 120 km/h with an r.m.s. wheel load of 25 kN. The area covered is one-times-two kilometres and is just north of the city of Kumla. Vibration of the embankment The relation between the particle velocity on the track, the train speed and load is determined by four constants a1, a2, b1 and b2, which are site specific. The relation is described in Eq. (1):
( ) 2121 bFbVaFav rmsrmsrms +++= (1) where vrms is the r.m.s.-particle velocity at the top of the embankment and V is the speed of the train. The equations describing the gradient 21 aFaa rms += , and the value for the intercept 21 bFbb rms += for any given line can be derived by plotting these in a separate graph vs. the wheel force. Frms is the r.m.s.-wheel force
17
Some Aspects of Modelling
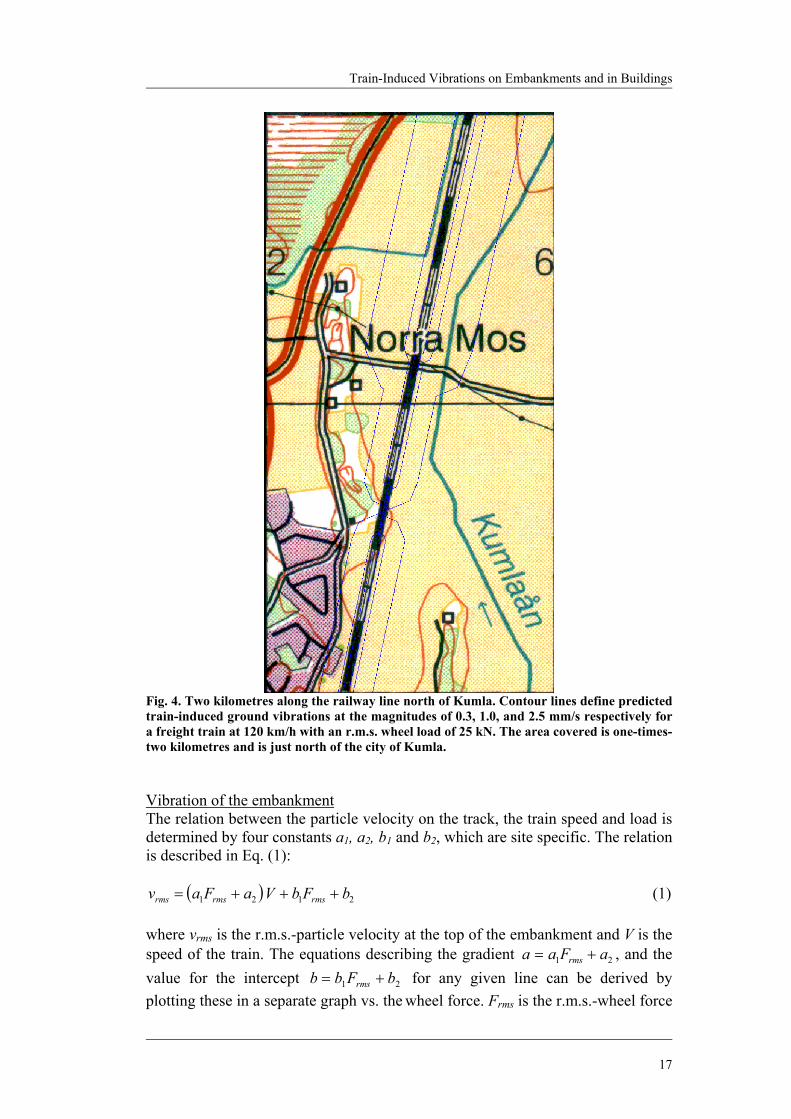
applied to the rail. The term a1 has a physical meaning and was derived during the process of validation. The term a2 is non zero but is very small and can for all practical use be neglected. The term b in the model is the result of assuming a linear relationship between the particle velocity and the speed of the load. This assumption is acceptable within a certain range, Fig. 5. Extrapolation of the assumed linear relationship gives a non-zero value on the abscissa. This is due to the limitations of the model and not a physical phenomenon. Further, this means that the model is not valid for train speeds and loads that significantly deviate from the interval from which the parameters have been derived.
0 20 40 60 80 100 120 140 160 180-5
0
5
10
15
20
25Relation between particle and train velocity
Train speed [km/h]
Par
ticle
vel
ocity
[mm
/s]
Fig. 5. Particle velocity on the railway embankment as a function of the speed of a train is schematically displayed. The solid line represents the magnitude of particle velocity on the railway embankment. The dashed line represents the predicted response depending on the speed of the train.
18
Train-Induced Vibrations on Embankments and in Buildings
Attenuation The magnitude of the particle velocity attenuates with distance from the track, due to material damping, radiation damping and scattering as the waves propagate. The second step of the model addresses this issue. Attenuation relationships for each site have been established by measuring particle velocity at different distances on a straight line perpendicular to the track. The ratio of particle velocity at two locations, 1 and 2, has been approximated to be inversely proportional to the distance between those two points to the power of -n, vrms1 = vrms2 ( r1 / r2 )–n.
2.1.2 Bernoulli-Euler beam on a Winkler foundation The model assumes a linear relationship between the particle velocity and both the speed and the axle load of the train. Furthermore, the speed of the load is assumed to be significantly less than the characteristic speed, V<<cc. A point force, P, which is moving on a Bernoulli-Euler beam founded on a Winkler bed answers to those requirements. The beam represents the railway embankment including the track. The ground is represented by the Winkler bed. Differential equation The differential equation for the displacement, w(x,t), in this case is
)(2
2
4
4
VtxPtwAw
xwEI −+
∂∂
−−=∂∂ δρκ . (2)
EI is the bending stiffness, κ is the distributed spring constant, ρ is the density, A is the cross-section of the beam and P is the point load moving at speed V. If the following characteristic entity is introduced:
44EI
kcκ
= (3)
the solution of the differential equation and the relevant boundary conditions can be written according to [6] in the coordinate of the moving system ξ = x-Vt,
⎭⎬⎫
⎩⎨⎧
+= − )sin(1)cos(12
)( ξαα
ξαβκ
ξ ξβcc
kc kkePk
w c (4)
where V is the speed of the load, α = (1+m2)0.5, β = (1-m2)0.5 and m = V/cc , with cc being the characteristic velocity, often called the critical velocity given by:
( )4 2
4A
EIcc ρκ
= . (5)
19
Some Aspects of Modelling
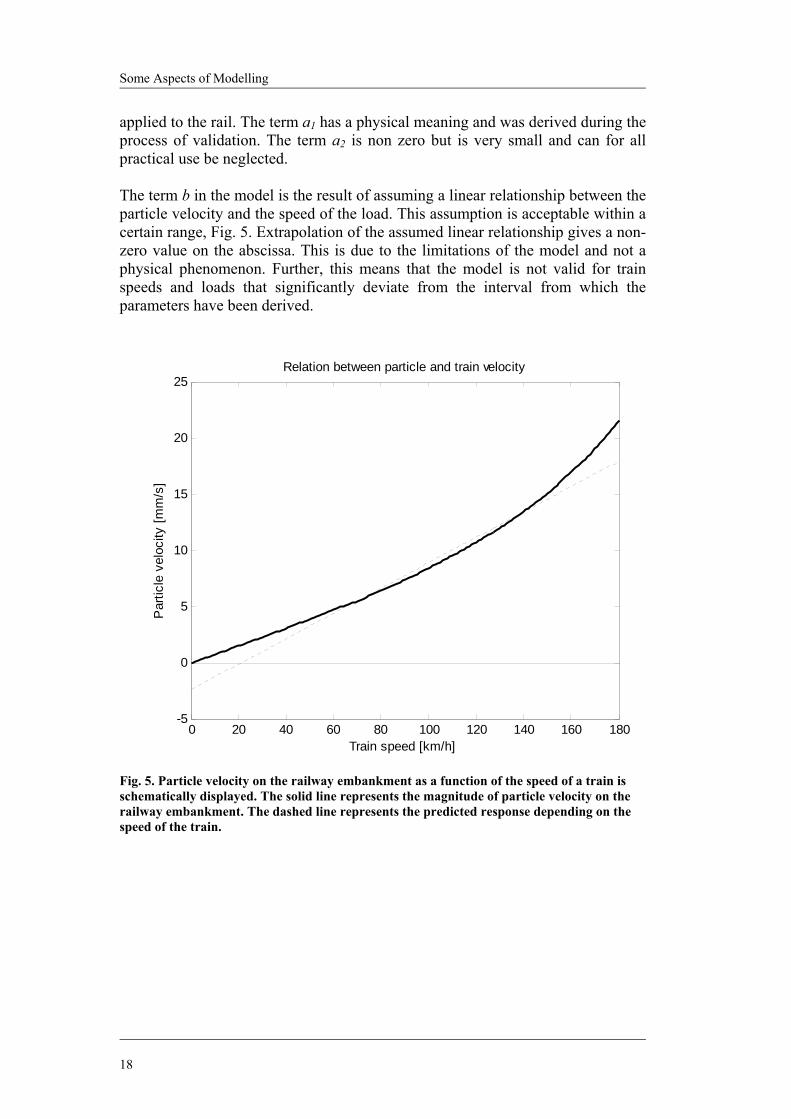
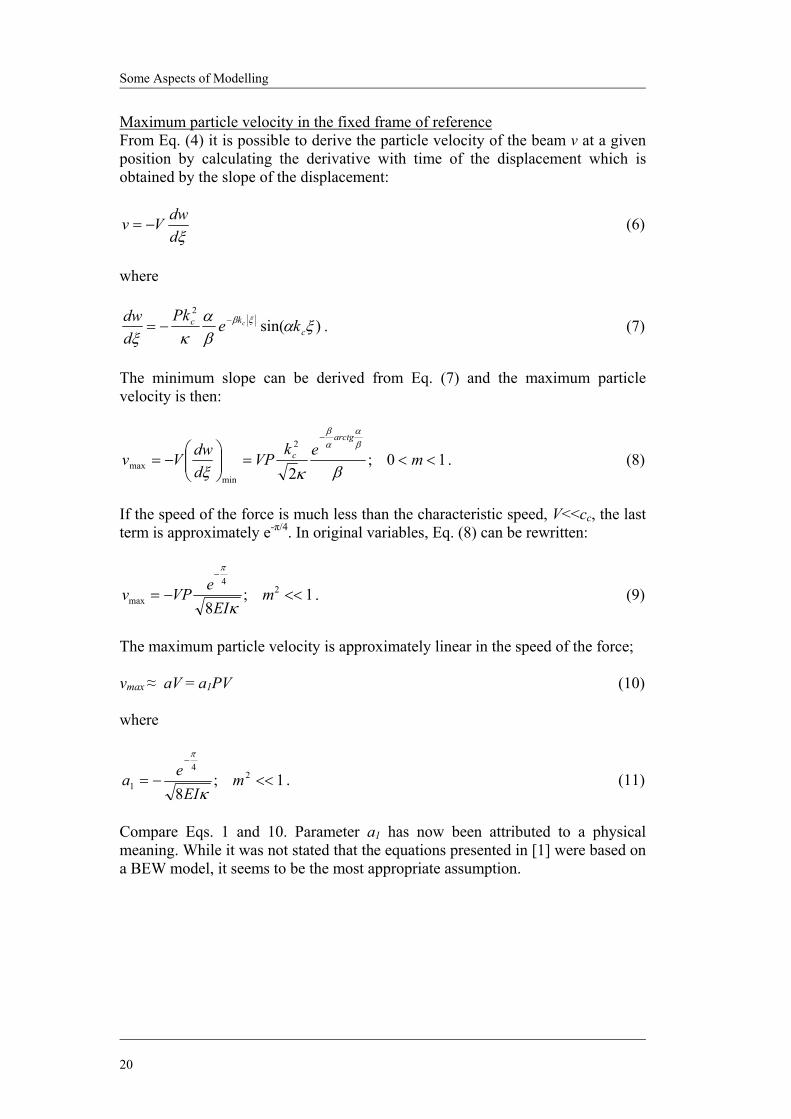
Maximum particle velocity in the fixed frame of reference From Eq. (4) it is possible to derive the particle velocity of the beam v at a given position by calculating the derivative with time of the displacement which is obtained by the slope of the displacement:
ξddwVv −= (6)
where
)sin(2
ξαβα
κξξβ
ckc ke
Pkddw c−−= . (7)
The minimum slope can be derived from Eq. (7) and the maximum particle velocity is then:
10;2
2
minmax <<=⎟⎟
⎠
⎞⎜⎜⎝
⎛−=
−
mekVP
ddwVv
arctg
c
βκξ
βα
αβ
. (8)
If the speed of the force is much less than the characteristic speed, V<<cc, the last term is approximately e-π/4. In original variables, Eq. (8) can be rewritten:
1;8
24
max <<−=−
mEI
eVPvκ
π
. (9)
The maximum particle velocity is approximately linear in the speed of the force; vmax ≈ aV = a1PV (10) where
1;8
24
1 <<−=−
mEI
eaκ
π
. (11)
Compare Eqs. 1 and 10. Parameter a1 has now been attributed to a physical meaning. While it was not stated that the equations presented in [1] were based on a BEW model, it seems to be the most appropriate assumption.
20
Train-Induced Vibrations on Embankments and in Buildings
2.1.3 Field evaluations Two sites have been selected to test the model on the railway line named Godsstråket, which runs between Hallsberg-Örebro in central Sweden. The site at Mosås was selected because its geotechnical site conditions are similar to those sites investigated earlier at Kåhög and Partille. The selection was based on total densities, the shear moduli of the soil and the geometry of the railway embankment. The site at Kumla was chosen since the clay in the ground has a high percentage of sand and was reported as quite stiff compared to the previously investigated sites, which predominantly contained a great depth of either clay and/or peat. Kumla was therefore considered important as a new reference for other sites where the model could be used in future. The site conditions of Mosås and Kumla are presented in Paper A and in [2].
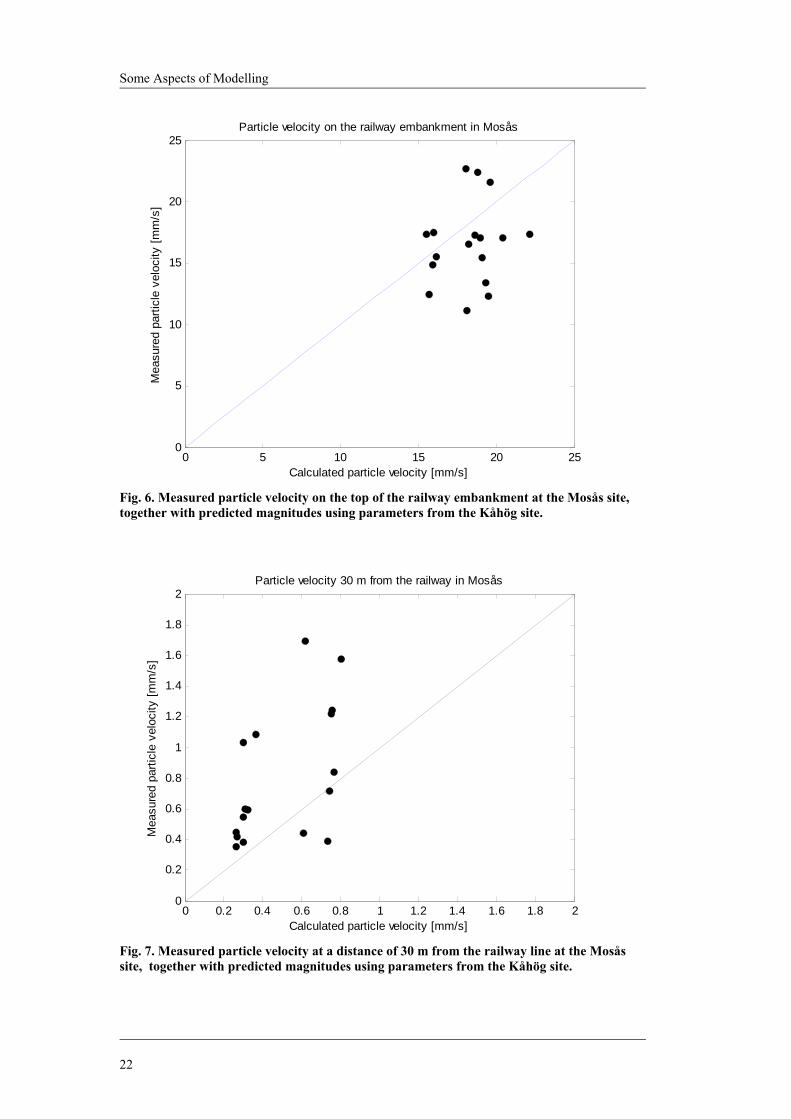
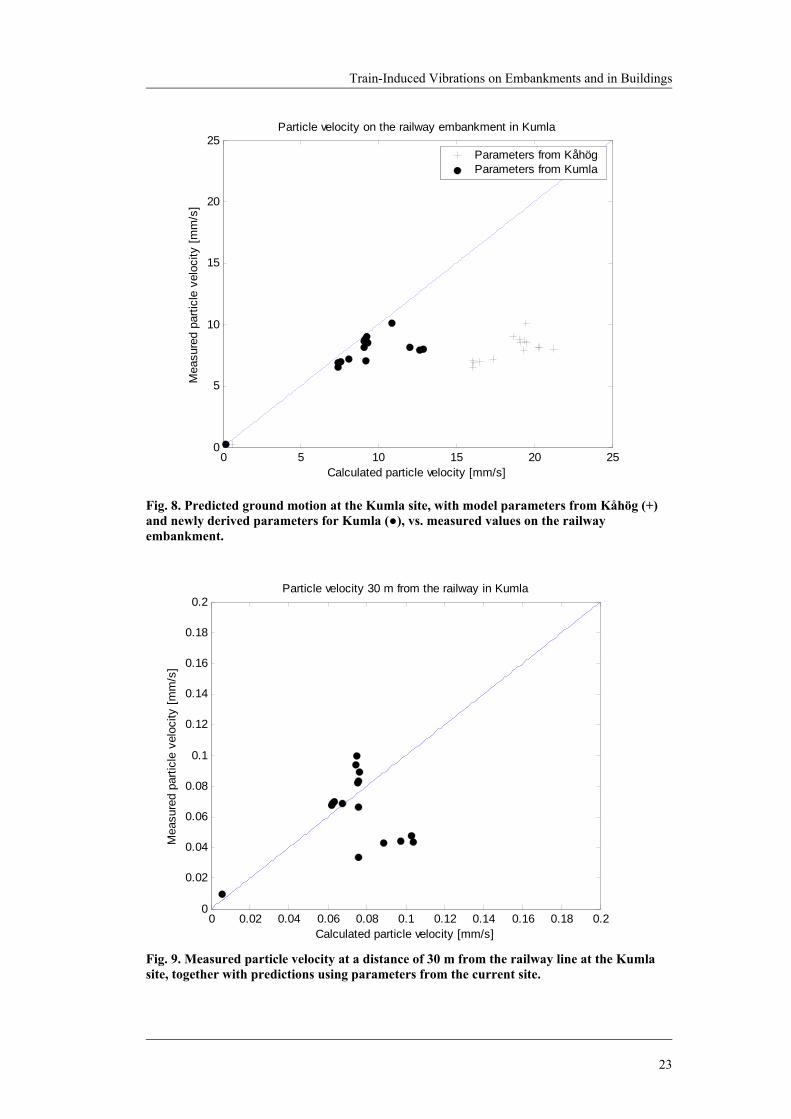
2.1.4 Results Measured and predicted vertical particle velocities for Mosås, on the embankment and at a distance of 30 m from the track, are presented in Figs. 6 and 7. The measured vs. the predicted maximum 1s-r.m.s.particle velocity has been plotted. The predicted values are based on the model parameters derived from the Kåhög site. The average of the absolute values of the error was 21.6%, 3.3 mm/s. The average absolute particle velocity (1s-r.m.s.) at a distance of 30 m from the railway track in Mosås was predicted with an error of 42.7%, 0.4 mm/s. The best comparison for the conditions at this Kumla was once again Kåhög, though the similarities are rather vague. As expected, this resulted in a less accurate prediction; see Fig. 8. A new set of parameters was therefore derived to extend the use of the model. The comparison with the new measurements is presented in Figs. 8 and 9. The calculated 1s-r.m.s. particle velocity on top of the railway embankment in Kumla gave an absolute average error of 30.3% with the model parameters derived from the site, overestimating the vibrations by 1.5 mm/s. The average particle velocity (1s-r.m.s.) at a distance of 30 m from the railway track in Kumla was measured with an absolute error of 47.9%, 0.02 mm/s. Discussion and conclusions are presented in Chapter 3 and in Paper A.
21
Some Aspects of Modelling
0 5 10 15 20 250
5
10
15
20
25
Calculated particle velocity [mm/s]
Mea
sure
d pa
rticl
e ve
loci
ty [m
m/s
]
Particle velocity on the railway embankment in Mosås
Fig. 6. Measured particle velocity on the top of the railway embankment at the Mosås site, together with predicted magnitudes using parameters from the Kåhög site.
0 0.2 0.4 0.6 0.8 1 1.2 1.4 1.6 1.8 20
0.2
0.4
0.6
0.8
1
1.2
1.4
1.6
1.8
2Particle velocity 30 m from the railway in Mosås
Calculated particle velocity [mm/s]
Mea
sure
d pa
rticl
e ve
loci
ty [m
m/s
]
Fig. 7. Measured particle velocity at a distance of 30 m from the railway line at the Mosås site, together with predicted magnitudes using parameters from the Kåhög site.
22
Train-Induced Vibrations on Embankments and in Buildings
0 5 10 15 20 250
5
10
15
20
25
Calculated particle velocity [mm/s]
Mea
sure
d pa
rticl
e ve
loci
ty [m
m/s
]
Particle velocity on the railway embankment in Kumla
Parameters from KåhögParameters from Kumla
Fig. 8. Predicted ground motion at the Kumla site, with model parameters from Kåhög (+) and newly derived parameters for Kumla (), vs. measured values on the railway embankment.
Fig. 9. Measured particle velocity at a distance of 30 m from the railway line at the Kumla site, together with predictions using parameters from the current site.
23
Some Aspects of Modelling
2.2 MODEL FOR PREDICTING VIBRATIONS IN BUILDINGS A fast and straightforward way of using a transfer function to model the vibrations in a building is presented. The transfer function could be used when designing a new railway line to be located in a populated area or when new buildings are planned near a railway line.
2.2.1 Use of transfer function The transfer function is based on the ratio between cross-power spectrum and power spectrum as described in Eq. (11). An estimated linear time-invariant transfer function, Txy can describe the relation between two signals. The transfer function is the ratio of the cross spectrum Pxy of the input signal x and the output signal y, and the power spectrum Pxx of x, f being the frequency.
)()(
)(fPfP
fTxx
xyxy = (11)
A minimum of two geophones are required to collect information in order to generate the transfer function. A transducer is used at the position of interest inside the house and another is set up outside. Each building type has its own transfer function. In fact, different transfer functions may be necessary to develop the response at different locations inside a building. This is particularly the case if the building is relatively large compared with the distance to the track or has multiple floors. The idea is that the instrument outside the building records the motion at the site not influenced by the building, enabling a transfer function to be derived. This function can then be used to predict vibrations inside the building from another source. It is possible that the transfer function could also be used elsewhere, together with a recorded ground signal to predict the vibrations inside a house that may be built in future. The first use of the function could be in a scenario where a new railway line should be constructed, to investigate potential disturbance inside an existing house. The second scenario could be an investigation prior to the construction of a new building close to an existing railway line.
2.2.2 Field test
A building in Halmstad, Rönnvägen 10-12, in South-West Sweden, Fig. 10, was selected for investigation. The building is a two-family semi-detached house. The transfer function was derived from signals recorded inside Rönnvägen 10, Fig. 10, and signals from the ground outside. The motion in the ground and in the building was caused by a special stationary car, the RSMV, acting as a vibrator. Two internal masses, each weighing 4000 kg, were forced to oscillate in the frequency range 3-20 Hz. In a separate field survey, instruments were installed in the other half of the building, Rönnvägen 12, at corresponding positions. The transfer function derived from measurements carried out at Rönnvägen 10, Fig. 11, was used to predict the vibrations inside Rönnvägen 12, using only the recordings from the ground surface in the garden (b1). The predicted magnitudes of the vibrations (maximum
24
Train-Induced Vibrations on Embankments and in Buildings
1s-r.m.s.) were then compared to those measured inside the house at Rönnvägen 12 with transducer b2. The measurements were taken during normal rail traffic. Signals longer than eight seconds were divided into eight-second segments. The transfer function, derived earlier, was applied to each segment. The resulting predictions were then combined into a single signal that predicted the vibrations from the train.
Fig. 10. One-floor semi-detached house with basement where the survey was performed. The transducers on the ground were located at positions a1 and b1. The transducers inside the house were located in the centre of the living-room floors, a2 and b2. Signals recorded with transducers a1-2 were used to derive the transfer function using the RSMV as the source. Transducers b1-2 were later used to record data from train traffic in order to test the validity of the function derived.
0 1 5 m
N Bedroom
Bedroom
Bedroom
Bedroom
Living room Living room
Kitchen Kitchen
Rönnvägen 12 Rönnvägen 10
b1 a1
a2 b2
25
Some Aspects of Modelling
0 2 4 6 8 10 12 14 16 18 200
0.5
1
1.5
2
2.5
3
3.5Transfer function
Frequency [Hz]
Val
ue o
f tra
nsfe
r fun
ctio
n [1
]
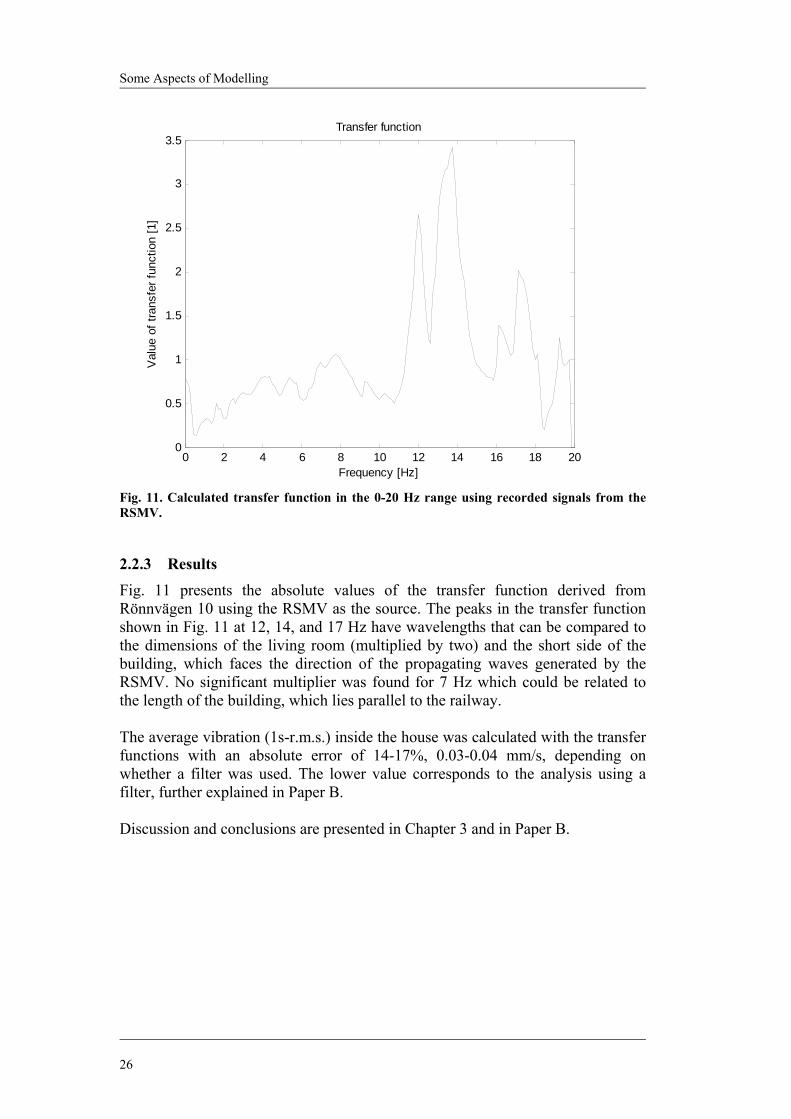
Fig. 11. Calculated transfer function in the 0-20 Hz range using recorded signals from the RSMV.
2.2.3 Results Fig. 11 presents the absolute values of the transfer function derived from Rönnvägen 10 using the RSMV as the source. The peaks in the transfer function shown in Fig. 11 at 12, 14, and 17 Hz have wavelengths that can be compared to the dimensions of the living room (multiplied by two) and the short side of the building, which faces the direction of the propagating waves generated by the RSMV. No significant multiplier was found for 7 Hz which could be related to the length of the building, which lies parallel to the railway. The average vibration (1s-r.m.s.) inside the house was calculated with the transfer functions with an absolute error of 14-17%, 0.03-0.04 mm/s, depending on whether a filter was used. The lower value corresponds to the analysis using a filter, further explained in Paper B. Discussion and conclusions are presented in Chapter 3 and in Paper B.
26
Train-Induced Vibrations on Embankments and in Buildings
2.3 MODEL FOR DERIVING SITE PARAMETERS AND PREDICTING DISPLACEMENT OF EMBANKMENT
A measuring car, Rolling Stiffness Measuring Vehicle (RSMV), has been developed to investigate track conditions.The RSMV is a modified freight car with two axles. Over one of the axles two masses, each 4000 kg, have been installed [2,36,41]. The investigation described here firstly attempts to understand whether the point flexibility of the track, i.e. the track-embankment-subsoil system, can be obtained by simultaneous measurements of the force applied to an axle of the measuring car and the resulting acceleration response. Secondly, it attempts to determine the physical properties of the track by modelling it as a Bernoulli-Euler beam on a Kelvin foundation. The load from the axle on the railway embankment is modeled as a Dirac pulse in space and harmonic vibration in time. The final part investigates the possibility of predicting displacements on a railway embankment during a train passage based on the physical properties obtained. Results from two sites in Sweden, Kumla and Kåhög, have been used.
2.3.1 Motion of a Bernoulli-Euler beam on a Kelvin foundation
The initial assumption is that the differential equation for the displacement w(x,t) due to a time harmonic stationary Dirac pulse δ(x)e-iωt of a Bernoulli-Euler beam on a Kelvin foundation is valid:
( ) ( )xePtwA
tww
xwEI ti δρδκ ω−+
∂∂
−∂∂
−−=∂∂
02
2
4
4
(12)
where EI is the bending stiffness, κ is the distributed spring constant, δ is the distributed damping constant, ρ is the bulk density, A is the cross-section of the beam and Po is the magnitude of the stationary time-dependent load. The line density is defined according to ρc=ρA. The angular frequency is ω. The point flexibility, below the force (x = 0), may be written by solving Eq. (12) with its boundary conditions as:
[ ] 432 21
12
)(Ω−Ω−
=Di
kH c
κω (13)
where Ω is defined as the ratio of frequency over characteristic frequency, and the damping ratio D as:
cc
Dωω
κρδ
=Ω= ,2
. (14)
The characteristic wave number kc and the characteristic angular frequency ωc are defined as:
41
4⎟⎠⎞
⎜⎝⎛=
EIkc
κ . (15)
27
Some Aspects of Modelling
2.3.2 Deriving parameters for the BEK model The measurements from the RSMV are not enough to determine all parameters. Some parameters of the BEK model have to be assumed, its Poisson’s ratio υ, bulk density ρ, and width b of the beam. the shear wave velocity was derived from measurement on the embankment but would otherwise also have to be assumed. The parameters assumed, measured, and calculated are listed in column one in Table 2. By integrating the signal in frequency domain, the response as displacement is obtained. The absolute value of flexibility is then used to analyse the system. The measured absolute value of the flexibility is presented in Figs. 12-13. The damping ratio D is determined first. This is done by determining the maximum absolute value of the flexibility and then the frequencies corresponding to the half-band width or the square-root width, f1 and f2. In order to later obtain the spring constant, the static value of stiffness Ko is determined. The Young’s modulus E is determined from the shear wave velocity cs, Poisson’s ratio υ, and bulk density ρ. It is then easy to determine the area, A=bh, as well as the bending stiffness EI, for a rectangular cross-section and the depth h of the beam The spring constant and the damping constant are obtained from Eq. (16) and Eq. (17) respectively.
bEbK
co ρωκ 2
31
4
163
⎟⎟⎠
⎞⎜⎜⎝
⎛= (16)
AD κρδ 2= (17)
2.3.3 Bernoulli-Euler beam on a Kelvin foundation subjected to a train load From Eq. (12), the deformation under a static load moving along the beam with velocity V can be written as Eqs. (18-19) depending on whether the observation point is in front of or behind the load, ξ >0 respectively ξ <0, [6]. The observation point in front of the load, ξ>0:
( ) ( )⎥⎦
⎤⎢⎣
⎡+= +
+
++
−+ ξα
αγξα
μη
κξ
ξη
cc
kco kkekP
wc
sincos2
)( (18)
The observation point behind the load, ξ<0:
( ) ( )⎥⎦
⎤⎢⎣
⎡+= −
−
−−
+− ξα
αγξα
μη
κξ
ξη
cc
kco kkekP
wc
sincos2
)( (19)
where η, μ, α± and γ± are constants determined by the speed of the train, critical velocity and the damping ratio, see Paper C.
28
Train-Induced Vibrations on Embankments and in Buildings
Once the displacements caused by a point load moving on a beam have been established, the displacements resulting from an arbitrary number of moving point loads can be calculated. This is done by superimposing the individual contributions of each one. The motion of a point on the beam caused by the sum of several point loads can now be derived.
2.3.4 Results
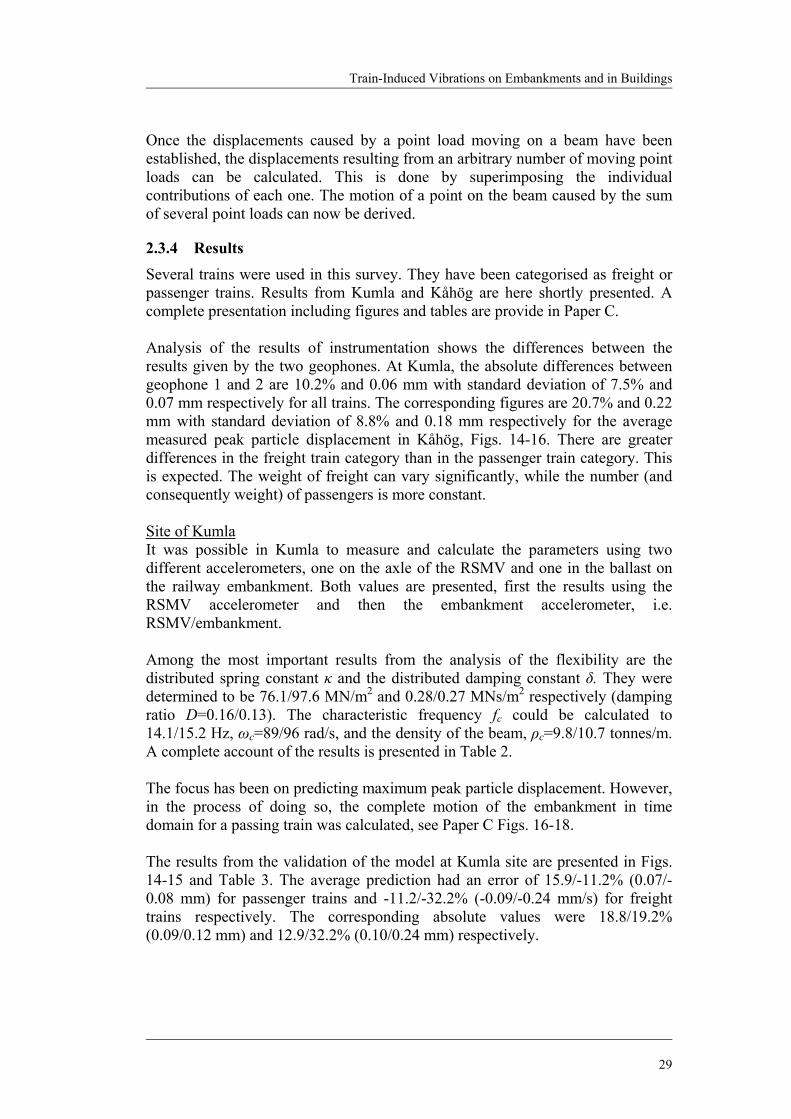
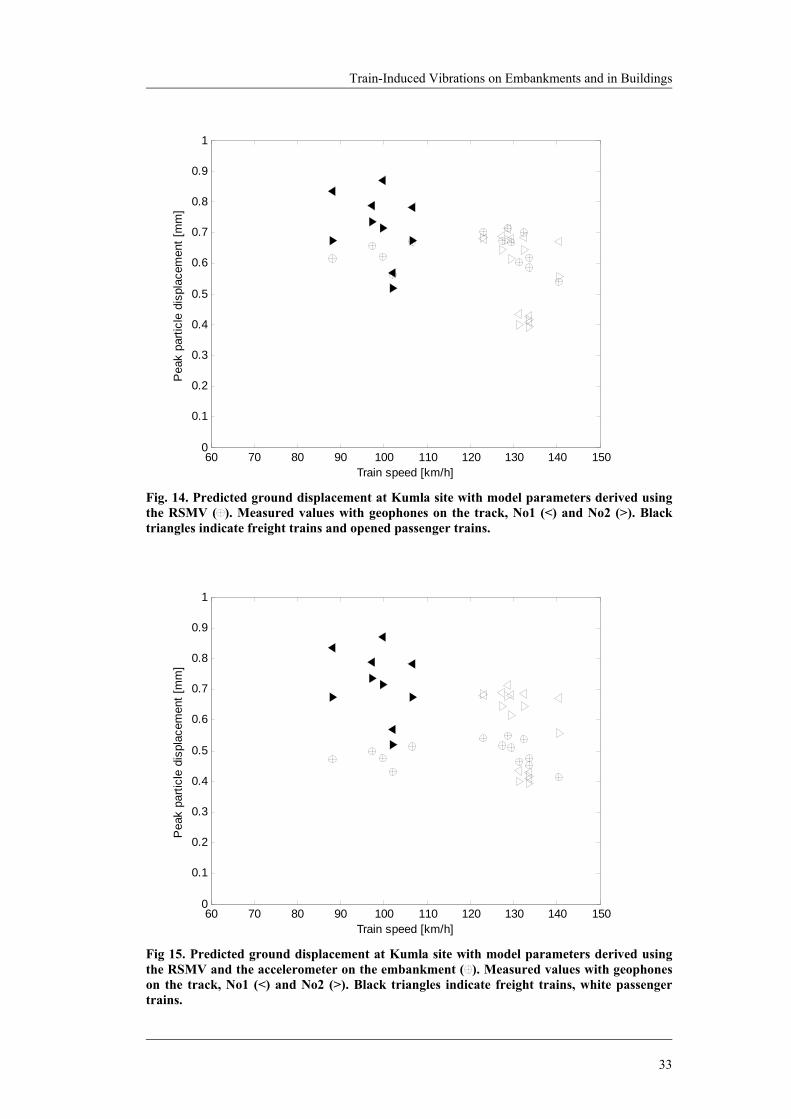
Several trains were used in this survey. They have been categorised as freight or passenger trains. Results from Kumla and Kåhög are here shortly presented. A complete presentation including figures and tables are provide in Paper C. Analysis of the results of instrumentation shows the differences between the results given by the two geophones. At Kumla, the absolute differences between geophone 1 and 2 are 10.2% and 0.06 mm with standard deviation of 7.5% and 0.07 mm respectively for all trains. The corresponding figures are 20.7% and 0.22 mm with standard deviation of 8.8% and 0.18 mm respectively for the average measured peak particle displacement in Kåhög, Figs. 14-16. There are greater differences in the freight train category than in the passenger train category. This is expected. The weight of freight can vary significantly, while the number (and consequently weight) of passengers is more constant. Site of Kumla It was possible in Kumla to measure and calculate the parameters using two different accelerometers, one on the axle of the RSMV and one in the ballast on the railway embankment. Both values are presented, first the results using the RSMV accelerometer and then the embankment accelerometer, i.e. RSMV/embankment. Among the most important results from the analysis of the flexibility are the distributed spring constant κ and the distributed damping constant δ. They were determined to be 76.1/97.6 MN/m2 and 0.28/0.27 MNs/m2 respectively (damping ratio D=0.16/0.13). The characteristic frequency fc could be calculated to 14.1/15.2 Hz, ωc=89/96 rad/s, and the density of the beam, ρc=9.8/10.7 tonnes/m. A complete account of the results is presented in Table 2. The focus has been on predicting maximum peak particle displacement. However, in the process of doing so, the complete motion of the embankment in time domain for a passing train was calculated, see Paper C Figs. 16-18. The results from the validation of the model at Kumla site are presented in Figs. 14-15 and Table 3. The average prediction had an error of 15.9/-11.2% (0.07/-0.08 mm) for passenger trains and -11.2/-32.2% (-0.09/-0.24 mm/s) for freight trains respectively. The corresponding absolute values were 18.8/19.2% (0.09/0.12 mm) and 12.9/32.2% (0.10/0.24 mm) respectively.
29
Some Aspects of Modelling
Site of Kåhög The distributed spring constant κ and the distributed damping constant δ were determined to be 16.5 MN/m2 and 0.34 MNs/m2 respectively (damping ratio D=0.32). The characteristic frequency fc is calculated to 4.9 Hz, ωc=31 rad/s. The density of the beam, ρc=17.6 tonnes/m. From the measurements at Kåhög, three sets of excitations (i.e., the RSMV produced sweep from 3-30 Hz) were recorded. The three sets of recordings show that the determination of parameters may provide some difficulties since they can not be explicitly reproduced. The main differences lay in the lower frequencies. The first set of excitations gives the highest flexibility and the last set of excitations gives the lowest. Thos and the average is presented in Fig. 13. The average results of those three excitations have been used to derive the parameters of this site. The results from the validation of the model at Kåhög site are presented in Fig. 16 and Table 3. The particle displacements were overestimated for passenger trains and underestimated for freight trains. The average prediction of the embankment displacements had an error of -23.4% (-0.28 mm) for passenger trains and -2.4% (-0.07 mm) for freight trains. The corresponding absolute values were 23.4% (0.28 mm) and 28.6% (0.35 mm). Discussion and conclusions are presented in Chapter 3 and in Paper C.
30
Train-Induced Vibrations on Embankments and in Buildings
Table 2. Parameters assumed, measured, and calculated in Kumla and Kåhög. Note that parameters at Kumla have been calculated using both the accelerometer on the axle of the RSMV and the accelerometer on the embankment, denoted ARSMV and Abank respectively. All values have been rounded off before insertion into the table. Kumla Kumla Kåhög ARSMV Abank ARSMV Assumedbank υ 0.2 0.2 0.2 - b 4.0 4.0 4.0 m ρ 2000 2000 2000 kg/m3 Measured cs, soil
* 160 160 80 m/s cs, bank
* 190 190 155 m/s Hmax 10.1 9.0 14.1 nm/N fr 13.7 14.9 4.4 Hz Calculated fc 14.1 15.2 4.9 Hz D 0.16 0.13 0.32 - δ 0.28 0.27 0.34 MNs/m2 κ 76.1 97.6 16.5 MN/m2 Ko 233 302 104 MN/m h 1.2 1.3 2.2 m ρc 9.8 10.7 17.6 ton/m G 72.2 72.2 48.1 MN/m2 E 173 173 115 MN/m2 I 0.6 0.8 3.6 m4 EI 105 140 413 MNm2 kc 0.65 0.65 0.32 1/m ccr 135 147 97 m/s * Measured on the railway embankment or on the ground beside the embankment without the use of gauges on the RSMV.
31
Some Aspects of Modelling
0 5 10 15 20 25 300
0.2
0.4
0.6
0.8
1
x 10-8
Frequency
Abs
olut
e va
lue
of fl
exib
ility
[m/N
]
Fig. 12. Measured absolute value of the flexibility H using accelerometer on the RSMV (black), and gauges on the embankment (red). Derived absolute value of the flexibility H using accelerometer on the RSMV (..), using gauges on the embankment (-). Kumla site.
0 5 10 15 20 25 300
0.2
0.4
0.6
0.8
1
1.2
1.4
1.6
1.8x 10⁻⁸
Frequency [Hz]
Abs
olut
e va
lue
of fl
exib
ility
[m/N
]
Fig. 13. Values for the three sets of excitations measured (black), the average (red), and the derived (..) absolute values of flexibility H. Kåhög site.
32
Train-Induced Vibrations on Embankments and in Buildings
60 70 80 90 100 110 120 130 140 1500
0.1
0.2
0.3
0.4
0.5
0.6
0.7
0.8
0.9
1
Train speed [km/h]
Pea
k pa
rticl
e di
spla
cem
ent [
mm
]
Fig. 14. Predicted ground displacement at Kumla site with model parameters derived using the RSMV ( ). Measured values with geophones on the track, No1 (<) and No2 (>). Black triangles indicate freight trains and opened passenger trains.
60 70 80 90 100 110 120 130 140 1500
0.1
0.2
0.3
0.4
0.5
0.6
0.7
0.8
0.9
1
Train speed [km/h]
Pea
k pa
rticl
e di
spla
cem
ent [
mm
]
Fig 15. Predicted ground displacement at Kumla site with model parameters derived using the RSMV and the accelerometer on the embankment ( ). Measured values with geophones on the track, No1 (<) and No2 (>). Black triangles indicate freight trains, white passenger trains.
33
Some Aspects of Modelling
60 70 80 90 100 110 120 130 140 1500
0.2
0.4
0.6
0.8
1
1.2
1.4
1.6
1.8
2
Train speed [km/h]
Pea
k pa
rticl
e di
spla
cem
ent [
mm
]
Fig. 16. Predicted ground displacement at Kåhög site with model parameters derived using the RSMV ( ). Measured values with geophones on the track, No1 (<) and No2 (>). Black triangles indicate freight trains, white passenger trains. Table 3. Displacement results from field evaluation at Kumla and Kåhög. Note that parameters at Kumla have been calculated using both the accelerometer on the axle of the RSMV and the accelerometer on the embankment, denoted ARSMV and Abank respectively. diff=difference between predicted and measured. std=standard deviation of the difference presented in the line above in the table. Inside the square brackets is the unit of measurement. All values have been rounded off before insertion into the table. Train type
Train-Induced Vibrations on Embankments and in Buildings
2.4 MODEL FOR DERIVING FREQUENCY DEPENDENT SITE PARAMETERS OF EMBANKMENT
Presented here is a new model for deriving the material properties of the foundation under sleepers, based on measurements gathered by an oscillating unit. The model is more complex than the one presented in Chapter 2.3. It consists of a damped system representing the car, and the oscillating masses it contained, as well as the instrumented axle. The model also contains a one-dimensional system for the rail-pad-sleeper combination; an effective foundation under the sleepers that represents the subgrade. This foundation has been assumed to have a frequency-dependent complex dynamic stiffness, which has been identified in this thesis using the measurements taken. This model was developed in an effort to understand how measurements taken with the RSMV can be modified to improve its depiction of conditions along a railway line.
2.4.1 Theory The model accounts only for the vertical motion of the car, the rails and the sleepers. A sketch of the model is shown in Fig. 17.
Rails
Pads
Ground
Axle
Force transducer
Half car
Suspension of the car
Sleepers
FTk
),( txwaxle
),( txwsleepers
)(twFT
),( txwrails
x
z
Rails
Pads
Ground
Axle
Force transducer
Half car
Suspension of the car
Sleepers
FTk
),( txwaxle
),( txwsleepers
)(twFT
),( txwrails
x
z
Fig. 17. Schematic presentation of the model used to describe the system. Force transducer (FT). Axle include the masses of the two wheels. The differential equation that governs vertical vibrations of the rails (the beam) is given as:
( ) ( ) ( ) ( )( ) 0,024
4
>=−+−∂
∂xxwxwxwA
xxw
EI sleepersrailspadsrailsrails χωρ
(20)
35
Some Aspects of Modelling
where EI is the bending stiffness, wrails is the vertical displacement of the rails, and ρ and A are the mass density and the cross-sectional area of the rails (two rails together). The dynamic stiffness of the pads χpads is characterised by the distributed stiffness κpads and the distributed damping constant δpads. wsleepers is the vertical displacement of the sleepers. ω is the angular frequency of oscillation of the mass in the car. Hereinafter it is assumed that the time-frequency relation is characterised by w(x,t)=w(x)e-iωt. The motion of the sleepers is governed for all x by:
in which msleepers is the mass of the sleepers per unit length and χground(ω) is the complex-valued, frequency-dependent stiffness of the ground. The motion of the axle assumed to be in contact with the rail is governed by the following equation:
( ) ( ) ( ) ( ) 000 3
3
3
32 =⎟⎟
⎠
⎞⎜⎜⎝
⎛−=
∂∂
−+=∂
∂−−+− x
xwx
xwEIwwkxwm railsrails
FTaxleFTaxleaxleω
(23) where waxle and wFT are the displacements of the axle and force transducer (FT), respectively, and kFT is the stiffness of the force transducer. The solution of Eqs. (20-21) that is valid for x>0 and satisfies the boundary condition at x →∞ (zero displacement at the infinity) can be written as:
(24) ( ) ( ) ( )
2
1
, 0jk xrails j rails rails
j
w x A e w x w x+ +
=
= =∑ ≥
≥( ) ( ) ( )2
1
, 0jk xsleepers j sleepers sleepers
j
w x B e w x w x+ +
=
= =∑ (25)
assuming that the real parts of k1-2 are negative. Inserting Eqs. (24-25) in Eqs. (20-21), and setting the determinant of the 2x2 coefficient matrix to zero, the following expression for can be found: 4
jk
( ) ( )( ) ( ) ( ) (( ) ( )( )
)ωχ+ωχ+ωmEI
ωχωχ+ωχωmωχ+ωχρAmρAω=k
groundpadssleepers
groundpadspadssleepersgroundpadssleepersj 2
244
−−−
(26) where
( ) ( )21212 kkkEIkrails +−=ωχ (27)
36
Train-Induced Vibrations on Embankments and in Buildings
The ratio χmeasured(ω) of the force measured by the transducer and the measured acceleration of the axle can be computed to give
( ) ( )ωχωωχ railsaxleaxle
FTmeasured m
wF
+−== 2 (28)
where
axleaxle wω=a 2− (29) Thus, to identify the ground stiffness χground(ω), the following function must be minimized at each frequency:
(30) In the evaluation process, which is iterative, the ground stiffness is found. The distributed dynamic stiffness χground(ω) of the ground, as follows from evaluation of measurement performed at Kumla site is presented later, following a description of the measurements and the known system parameters, Figs. 18-19.
2.4.2 Measurements The railway line, known as Godsstråket, between Hallsberg-Örebro in the middle of Sweden runs through the small community of Kumla where the field test was conducted. The bending stiffness of the two rails is 12.8 MNm2 and the mass per unit length of the rails is 120 kg/m (UIC60). The distributed stiffness of the pads is 246 MN/m2 and the distributed damping constant of the pads is 43 kNs/m2. The distributed mass of the concrete sleepers are 385 kg/m. The RSMV has earlier been described in this chapter.
2.4.3 Results
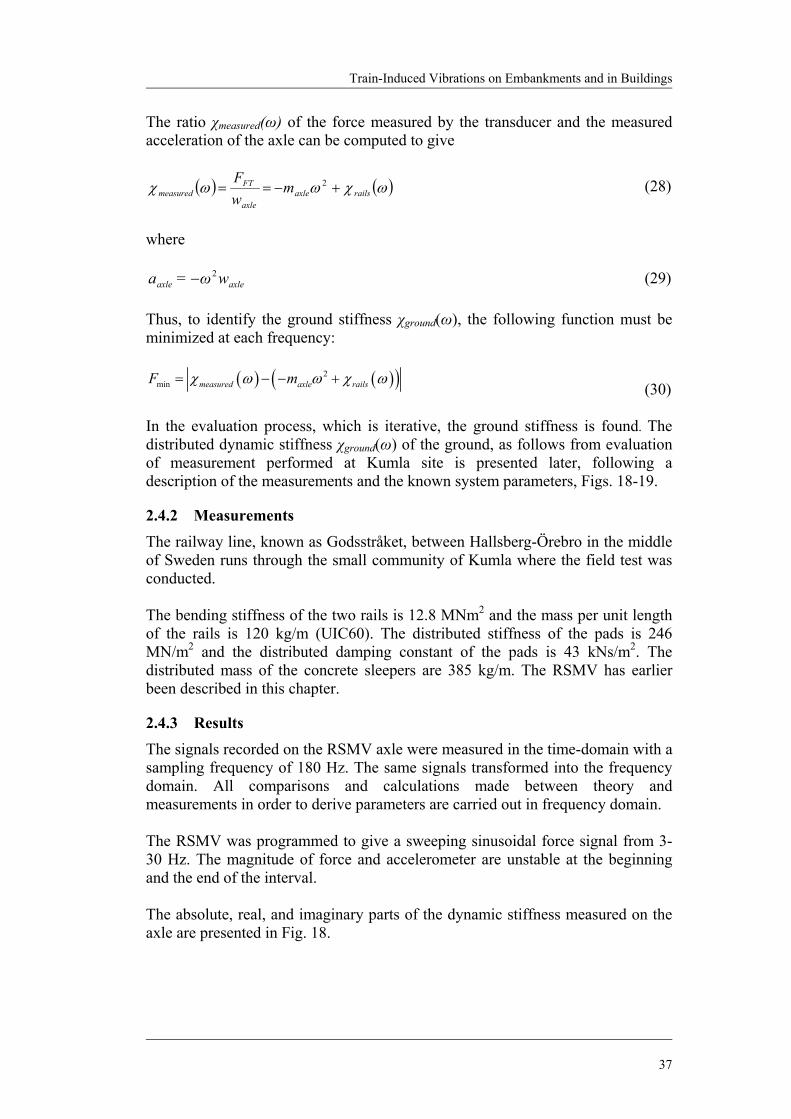
The signals recorded on the RSMV axle were measured in the time-domain with a sampling frequency of 180 Hz. The same signals transformed into the frequency domain. All comparisons and calculations made between theory and measurements in order to derive parameters are carried out in frequency domain. The RSMV was programmed to give a sweeping sinusoidal force signal from 3-30 Hz. The magnitude of force and accelerometer are unstable at the beginning and the end of the interval. The absolute, real, and imaginary parts of the dynamic stiffness measured on the axle are presented in Fig. 18.
37
Some Aspects of Modelling
0 5 10 15 20 25 30-5
-4
-3
-2
-1
0
1
2
3
4
5x 10⁸
Frequency [Hz]
Stif
fnes
s, R
SM
V [N
/m]
Fig. 18. The absolute value of the stiffness measured on the axle (black), the real part of the stiffness (blue), and the imaginary part (red).
0 5 10 15 20 25 30-2
-1.5
-1
-0.5
0
0.5
1
1.5
2x 10⁸
Frequency [Hz]
Dis
tribu
ted
grou
nd s
tiffn
ess
[N/m
2 ]
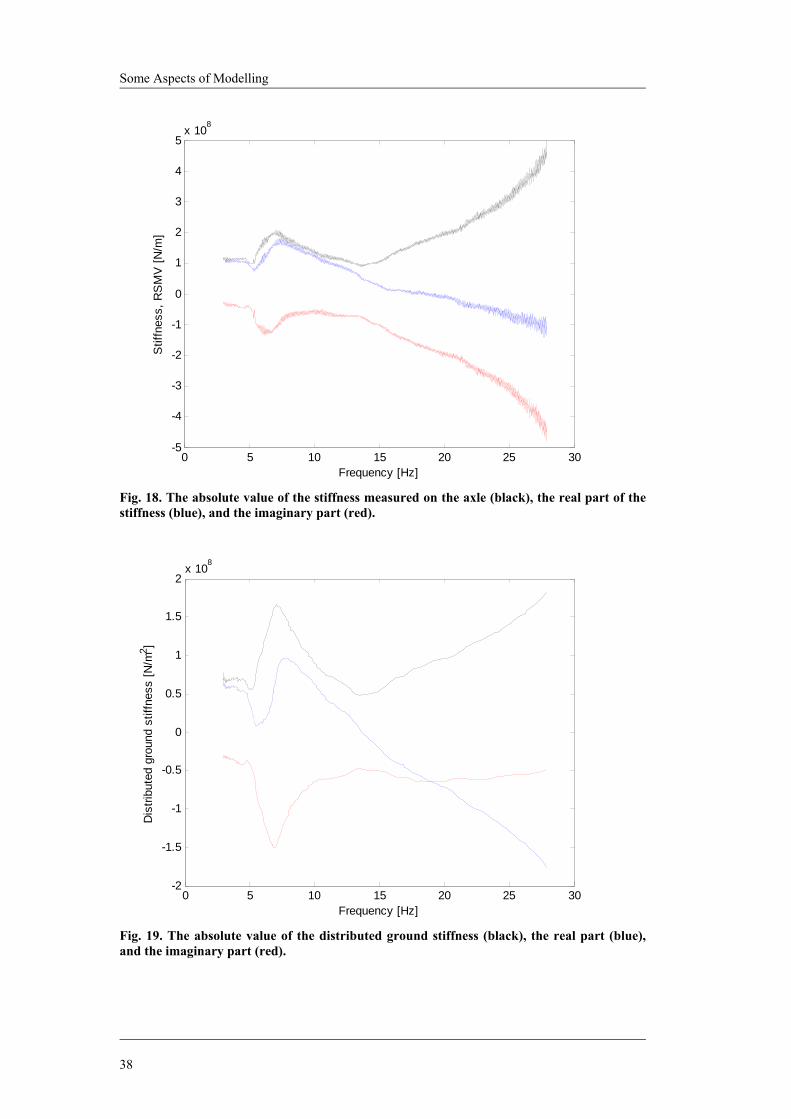
Fig. 19. The absolute value of the distributed ground stiffness (black), the real part (blue), and the imaginary part (red).
38
Train-Induced Vibrations on Embankments and in Buildings
The identified absolute value, the real and imaginary parts of the dynamic stiffness of the ground χground(ω) are presented in Fig. 19. The real part of the dynamic stiffness reflects the elastic and the inertial properties of the railway substructure (everything that is below the sleepers), whereas its imaginary part gives the amount of damping. One should note that the imaginary part of χground reflects both the material and the radiation damping mechanisms. The frequency dependence of the real part of χground(ω) shows that the dynamic reaction of the railway substructure changes from elastic to inertial type at about 15 Hz. The imaginary part of χground(ω) does not show a pronounced variation except in the 5-9 Hz range. In the same frequency range, the real part also shows a resonance-type variation. Discussion and conclusions are presented in Chapter 3 and in Paper D.
39
Some Aspects of Modelling
40
Train-Induced Vibrations on Embankments and in Buildings
3 DISCUSSION AND CONCLUSIONS
Each section presented in Chapter 2 will be discussed and the most important conclusions drawn. Discussion and conclusions can also be found in Papers A-D.
3.1 MODEL FOR PREDICTING ENVIRONMENTAL VIBRATIONS The purpose of EnVib-01 was to reduce the number of sites that need a more detailed investigation, in order to reduce cost. The simplicity of the model is its greatest strength, but before running the model, parameters have to be selected and given as input to EnVib-01. Parameters are selected by comparing the conditions at the site to be investigated, with the sites from which model parameters have been derived. Since no two sites are identical, even with such a general assessment as suggested by this model, the operator has to select the most appropriate match before using its parameters. This part of the procedure for using the model can prove difficult and limit its use. Despite being less consistent at the observation positions beside the track, the model gives fairly accurate results on the embankment. During the investigation into the model’s usability, the absolute error was found on average to be 20-30% on the embankment and 40-50% at a point 30 m perpendicular to the track, 1s-r.m.s. The predictions for the vicinity of the track derive from those made for the embankment. It is therefore not surprising that the model is less accurate beside the track. The accuracy depends on the user’s ability to select the most appropriate match.
3.2 MODEL FOR PREDICTING VIBRATIONS IN BUILDINGS It has been suggested that a transfer function can be used to predict the vibrations inside a building. The main aim was to validate this claim. The survey supported using a transfer function for this purpose. The transfer function for one half of a two-family semi-detached house has been calculated from recordings made from a vibrator – the measuring car RSMV. The transfer function was then used to predict train-induced vibrations inside the other half of the building. The average particle velocity (1s-r.m.s.) inside the house with the transfer function was calculated with an average absolute error of 17%.
41
Discussion and Conclusions
This method could be used before a railway is constructed near existing buildings in order to assess potential problems. Alternatively, the method could be used to predict the vibrations inside a building to be constructed close to an existing railway line. It shall be noted that the conditions were ideal, but not identical, using a two-family semi-detached house. Therefore, even though the tests showed promising results, the differences between predicted and measured values were significant enough to indicate that care must be taken when using this method and that further research should be carried out, as discussed in the next chapter.
3.3 MODEL FOR DERIVING SITE PARAMETERS AND PREDICTING DISPLACEMENT OF EMBANKMENT
The aim of the study was to develop a model to investigate the properties of the track by using a unit with an oscillating mass to predict the motion of the embankment caused by a passing train. Properties of a railway track associated with a Bernoulli-Euler beam on a Kelvin foundation were investigated at two sites using a measuring car, the RSMV. A mass was forced to oscillate over one of the axles of the RSMV, and the force applied to the axle and the acceleration response were measured. At one site, the acceleration was also recorded on the railway embankment. The flexibility H(ω) as a function of frequency was obtained after integration of the acceleration response and division with the force in frequency domain. The following parameters were calculated: damping ratio D, characteristic wave number kc, characteristic frequency ωc, as well as the distributed spring constant κ, the distributed damping constant δ and the bending stiffness EI. The distributed density ρc and the height of the beam h were also determined. Some parameters had to be assumed for the embankment: Poisson’s ratio υ, bulk density ρ, and width b. These parameters were included in a sensitivity analysis for the Kumla site and were found to have little influence on the prediction. Measurement of the peak particle displacement in the ballast on the railway embankment at Kumla and Kåhög was achieved with an accuracy measured as an average absolute error of 15% and 26%, respectively, using the resulting response from the accelerometer on the RSMV. Using an accelerometer in the ballast, the prediction at Kumla was achieved with an average absolute error of 28%. The number of sites investigated was low and there are questions over the interpretation of the results from Kåhög where the resonance frequency was fairly low. However, the results encourage further research on how to use the RSMV and this simple model to determine the displacement of the embankment due to a passing train. The unique tool provided by the RSMV has generated the ability to determine several parameters of the embankment and the subgrade without having to install instruments on the embankment or in the vicinity. This makes it possible to investigate a relatively long railway line in a relatively short amount of time. As
42
Train-Induced Vibrations on Embankments and in Buildings
demonstrated in Chapter 2.3, and discussed in Chapters 3.4 and 4, the usefulness of this tool could be improved even further.
3.4 MODEL FOR DERIVING FREQUENCY DEPENDENT SITE PARAMETERS OF EMBANKMENT
The aims of this study were to investigate the use of an oscillating unit to assess the mechanical properties of the subgrade and to suggest how the use of the RSMV unit might be improved. The RSMV unit in Chapter 2.4 is the same as in Chapter 2.3, but the track and subgrade is modelled differently. The model consists of a damped system representing the car, a one-dimensional model representing the rail-pad-sleeper system and a foundation beneath the sleepers representing the subgrade. A frequency-dependent complex dynamic stiffness for the foundation was identified based on the measurements. The system has a total of three-degrees-of-freedom. The identification procedure carried out has shown that the stiffness of the foundation is a non-monotonic and significantly non-constant function of the frequency. The real part of the ground stiffness – responsible for the elastic and the inertial properties of the subgrade – has a clear absolute minimum (zero) at about 14 Hz, which gives a minimum in the presentation of the absolute ground stiffness. The imaginary part, which reflects the amount of effective damping (including the material and radiation damping mechanisms), has a minimum of about 7 Hz. The results of the performed measurements do not explain the frequency dependence of the identified dynamic stiffness. The reason is that it is unclear whether the resonance-type peaks in the stiffness reflect the dynamic characteristics of the car or those of the subgrade. It is possible that the resonance peaks reflect one of the natural frequencies of the car that has appeared in the measurements due to the vibration transfer between the axles through the subgrade. It could also be the resonance frequency of a layer or combination of layers in the soil. The latter is believed to be the case for the resonance at about 14 Hz in Fig. 18. It was assumed in the paper that the vibrations excited by the second axle of the car do not influence those of the instrumented axle. Furthermore, the dynamic stiffness of the foundation has been assumed to be wave-number independent. In Chapter 4, suggestions are given for how to investigate the significance of those assumptions.
43
Discussion and Conclusions
3.5 FINAL DISCUSSION AND CONCLUSIONS This thesis has considered some aspects of predicting train-induced vibrations. The common objective was to find methods of evaluating sites with a limited amount of prior knowledge and in a fairly short amount of time, with minimal disturbance to the normal operation of the railway line. It is important to balance the need for a simple and quick model with the demand for comprehensive results. While meeting demand for efficiency, it is important to remember that adequate input parameters are required for any model and these can be quite time-consuming to obtain. Many projects lack the time or funding necessary to use some of the available tools without first reducing the number of sites to examine. Deciding if a model is suitable or not is neither easy nor quick; it depends on the situation and the requirements. Predictions that differ from measured motion by as much as a factor of two have been reported as “suitable agreement” or even as “good” by some researchers [27,33-34]. However, other researchers [31,36] have reported results with better agreement with somewhat more modest claims. Not all researchers who develop models validate with field measurements. Those who do, often consider only a few trains. Difficulties in the frequency range of about 0-3 Hz are not uncommon [28,33-34]. This difficulty was also encountered in Paper C. The differences seen at very low frequencies may be attributed to the precision of models or model parameters but may also be attributed to the limitations of the instruments. In the light of how other researchers evaluate their results, the results from the models presented in this thesis seem reasonably accurate for the present purpose. Four models have been presented in this thesis and their capabilities have been demonstrated. It has been found that the properties of a railway embankment can be modelled with a Bernoulli-Euler beam on different types of foundation; as a Winkler or Kelvin foundation (as used in Papers A and C respectively), or as a combination of foundation, springs, and masses (as demonstrated in Paper D). A measuring car like the RSMV can be used to derive the properties of the railway embankment and subsoil. Additionally, the car is found to be useful in determining the transfer function of a building. At this time, only the vertical force applied on one axle and the resulting acceleration response is measured. The RSMV and similar cars have potential for improvement, as discussed in Chapter 4. It is possible that more advanced models, which consider aspects presently difficult to evaluate, could be developed.
44
Train-Induced Vibrations on Embankments and in Buildings
4 FURTHER RESEARCH To assist researchers interested in continuing investigations in this field, the following recommendations have been made: Assigning input parameters to the model EnVib-01 for different sites is highly important; the greater the accuracy, the greater the usefulness of the model. However, if more information is required than is commonly available, this could reduce the benefit of using a system containing a library of site- and model-specific parameters. The sensitivity of the positioning of the gauges used to derive the transfer function in Chapter 2.2 needs to be determined. Another factor is the sensitivity to different geotechnical conditions and the extent of structural modifications allowed. If those sensitivities are found to be relatively important, the use of this method will be limited. Using a stationary oscillating unit on the track to determine parameters has shown promising results. A new set of measurements is proposed, which would include a synchronised acceleration and force measurement on both axles, vertically as well as horizontally. Ideally, these measurements would also include some accelerometers mounted on the rail. Furthermore, an identification of the subgrade’s structure and properties, i.e. shear wave velocity and density, is also advised (SASW or borehole seismic). This would allow conclusions to be drawn about the possible influence of the second axle as well as the layers below the embankment. It could also allow for the development of a three dimensional model. Synchronised measurements on the rail at known intervals would enable investigation of the potential influence of the wave-number dependence of the foundation. At this time, the foundation has been assumed to have only frequency-dependent complex dynamic stiffness. During the investigations presented in this thesis, the RSMV was stationary when the measurements were taken. Taking measurements with the RSMV in motion would minimise disturbance to train traffic. However, if the RSMV were to move too quickly, problems regarding resolution might arise. If possible, the RSMV or similar vehicle should be modified to operate at frequencies lower than 3 Hz. This would make it easier to investigate sites with a low expected stiffness.
45
Further Research
46
Train-Induced Vibrations on Embankments and in Buildings
5 ABSTRACTS OF THE APPENDED PAPERS
Paper A: Validation of an empirical model for prediction of train-induced ground vibrations This paper presents a validation of EnVib-01, an empirical model to predict train-induced ground vibrations in a preliminary design phase. The model is simple to use and gives a quick assessment of the magnitude and the distribution of the ground motion that can be expected in the vicinity of the track. It can be of use during planning of a new track or before allowing trains to run faster with heavier cargo on an existing railway line. The model has been validated from two field measurements in Sweden. The strengths and weaknesses of the model, which has shown promising results, are discussed. Paper B: Prediction of train-induced vibrations inside buildings using transfer functions This article presents a study of the use of transfer functions to predict vibrations inside a building due to train-induced ground vibrations. It is proposed that knowing the transfer function of a building, the vibrations inside a similar building can be predicted given a known ground motion outside. A comparison has been conducted between predicted and measured vibrations inside a building in south-western Sweden due to freight and passenger trains. The transfer function was derived by using a stationary vibrating source. The average particle velocity (1s-r.m.s.) inside the house was calculated with the transfer functions with an average error of -10%, -0.02 mm/s. Prediction was achieved with a standard deviation of 23%, 0.06 mm/s when no filtering of the data was used. Further work is needed to ascertain the accuracy of this method.
47
Abstracts of the Appended Papers
Paper C: Evaluation of track stiffness with a vibrator for prediction of train-induced displacement on railway embankments A measuring car, the Rolling Stiffness Measuring Vehicle (RSMV), has been developed to investigate track conditions. The investigation described in this paper firstly attempts to understand whether the point flexibility of the track, i.e. the track-embankment-subsoil system, can be obtained by simultaneously measuring the force applied to an axle of the measuring car and the resulting acceleration response. Secondly, it attempts to determine the physical properties of the track by modelling it as a Bernoulli-Euler beam on a Kelvin foundation. The final part of the paper investigates the possibility of predicting displacements on a railway embankment based on the physical properties obtained after a train passage. Results from two sites in Sweden, Kumla and Kåhög, have been used. Investigations give encouraging results. However, as seen here, it can be difficult to analyse and obtain parameters if the resonance frequency of the system is low. The peak particle displacement of the ballast on the railway embankment was achieved with fair accuracy for both Kumla and Kåhög using the results from the accelerometer on the RSMV. Paper D: Identification of effective properties of the railway substructure in the low-frequency range using a heavy oscillating unit on the track As the demand for predictions of train-induced vibrations is increasing, it is essential that adequate parameters of the railway structure are given as input in the predictions. Gathering this information can be quite time-consuming and costly, especially when predictions are required for the low-frequency emission. This article presents a procedure for deriving the effective properties of the foundation under the sleepers of a railway track from measurements taken with a heavy oscillating unit on the track. The unit consists of two masses inside a modified freight car that exert a dynamic force in the range 3-30 Hz on one of the two axles. The ratio of force applied on the axle over the resulting response measured with an accelerometer is studied. The foundation of the sleepers is modelled using a frequency-dependent complex-valued dynamic stiffness.
48
Train-Induced Vibrations on Embankments and in Buildings
6 REFERENCES [1] Bahrekazemi M. Train-Induced Ground Vibration and Its Prediction. PhD Thesis. Royal Institute of Technology; 2004. [2] With C. Validation of Two Models for Prediction of Train Induced Ground Vibrations. Lic. Thesis. Royal Institute of Technology; 2005. [3] Swedish Geotechnical Society. System of notation 2001:2. [4] Bodare A. Definition of Problems – Track and Environmental Problems. NORDVIB – Joint Nordic Railway Vibration Research Project, report, 2001. [5] Bodare A, Petek K. Sub and super seismic train induced ground vibrations-theoretical considerations and test results. In: Proceedings of the 2nd International Symposium on Environmental Vibrations – Prediction, Monitoring, Mitigation and Evaluation, Okayama, 2005. [6] Kenney JT, Pasadena JR. Steady-state vibrations of beam on elastic foundation for moving load. Journal of Applied Mechanics 1954;21:359-364. [7] Krylov VV. Generation of ground vibration boom by high-speed trains. In: Krylov VV, editor, Noise and vibration from high-speed trains, Thomas Telford Publishing; 2001. p. 251-283. [8] Kaynia AM, Madshus C, Zackrisson P. Ground vibrations from high-speed trains: Predictions and Countermeasures. Journal of Geotechnical and Geoenvironmental Engineering 2000;126(6):531-537. [9] Karoumi R, Wiberg J, Liljencrantz A. Monitoring traffic loads and dynamic effects using an instrumented railway bridge. Engineering Structures 2005;27:1813-1819. [10] Lundqvist A, Dahlberg T. Load impact on railway track due to unsupported sleepers. Journal of Rail and Rapid Transit 2005;219(2):67-77. [11] Adolfsson K, Andréasson B, Bengtson P-E, Bodare A, Madshus C, Massarch R, Wallmark G, Zackrisson P. High speed lines on soft ground. Evaluation and analysis of measurements from the West Coast Line. report, Banverket, Sweden; 1999.
49
References
[12] Dieterman HA, Metrikine A. The equivalent stiffness of a half-space interacting with a beam. Critical velocities of a moving load on the beam. European Journal of Mechanics 1996;15(1):67-90. [13] Madshus C, Kaynia AM. High-speed railway lines on soft ground: dynamic behaviour at critical train speed. Journal of Sound and Vibration 2000;231(3):689-701. [14] Verichev SN, Metrikine AV. Dynamic rigidity of a beam in a moving contact. Journal of Applied Mechanics and Technical Physics 2000;41(6):1111-1117. [15] Burger HR. Exploration Geophysics on the Shallow Subsurface. Prentice Hall P T R; 1992. [16] Howarth HVC, Griffin NJ. Human response to simulated intermittent railway-induced building vibration. Journal of Sound and Vibration 1988;120(2):413-420. [17] International Organization for Standardization, ISO 2631-1, Vibration and shock - Evaluation of human exposure to whole-body vibration - Part 1: General requirements. 1998. [18] Swedish Standard Institute. SS 460 48 61 Vibration and shock – Measurement and guidelines for the evaluation of comfort in buildings. 2004. [19] Ahmad S, Al-Hussaini TM. Simplified design for vibration screening by open and in-filled trenches. Journal of Geotechnical Engineering 1991;117:67-88. [20] Haupt WA. Surface-waves in non-homogeneous half-space. Proceedings of the Dynamical Methods in Soil and Rock Mechanics, Karlsruhe,1977. [21] Jones CJC. Use of numerical models to determine the effectiveness of anti-vibration systems for railways. Proceedings of the Institute of Civil Engineers, Transportation 1994:43-51. [22] Massarsch KR. Vibration isolation using gas-filled cushions. Geo-Frontiers 2005, Austin, 2005. [23] Takemiya H, Shimabuku J. Honeycomb-WIB for mitigation of traffic-induced ground vibrations. In Proceedings of the 2nd International Symposium on Environmental Vibrations, Okayama, 2005. [24] With C, Bahrekazemi M, Bodare A. Mätningar av tåginducerade markvibrationer i Kåhög före och efter motåtgärd. In 16th Nordic Geotechical Meeting. Ystad, 2004, Vol I. Swedish.
50
Train-Induced Vibrations on Embankments and in Buildings
[25] With C, Larsson S, Bodare A. Lime-cement columns as wave barrier against train-induced vibrations. XIV European Conference on Soil Mechanics and Geotechnical Engineering, Madrid, 2007. [26] Woods RD. Screening of surface waves in soils. Journal of the Soil and Mechanics and Foundations Division 1968;951-979. [27] Hall L. Simulations and analyses of train-induced ground vibrations in finite element models. Soil Dynamics and Earthquake Engineering 2002;23:403-413. [28] Jones CJC, Block JR. Prediction of ground vibration from freight trains. Journal of Sound and Vibration 1996;193(1):205-213. [29] Jones CJC, Sheng X, Petyt M.. Simulation of ground vibration from a moving harmonic load on a railway track. Journal of Sound and Vibration 2000;231(3):739-751. [30] Karlström A, Boström A. An analytical model for train-induced ground vibrations from railways. Journal of Sound and Vibration 2005;292:221-241. [31] Lombaert G, Degrande G, Kogut J, Francois S. The experimental validation of a numerical model for the prediction of railway induced vibrations. Journal of Sound and Vibration 2006;297:512-535. [32] Madshus C, Bessason, B, Hårvik L. Prediction model for low frequency vibration from high speed railways on soft ground. Journal of Sound and Vibration 1996;193(1):195-203. [33] Paolucci R, Maffeis A, Scandella L, Stupazzini, M, Vanini M. Numerical predictin of low-frequency ground vibrations induced by high-speed trains at Ledsgaard, Sweden. Soil Dynamics and Earthquake Engineering 2003;23:425-433. [34] Picoux B, Le Houéedec D. Diagnosis and prediction of vibration from railwy trains. Soil Dynamics and Earthquake Engineering 2005;25:905-921. [35] Sheng X, Jones CJC, Thompson DJ. A comparison of a theoretical model for quasi-statically and dynamically induced environmental vibration from trains with measurements. Journal of Sound and Vibration 2003;267:621-635. [36] Takemiya H. 2003. Simulation of track-ground vibrations due to a high-speed train: the case of X-2000 at Ledsgard. Journal of Sound and Vibration 2003;261:503-526. [37] U.S. Department of Transportation. 1998. High-speed ground transportation noise and vibration impact assessment. Office of Railroad Development, report 293630-1.
51
References
[38] With C, Bahrekazemi M, Bodare A. Validation of an empirical model for prediction of train-induced ground vibrations. Soil Dynamics and Earthquake Engineering 2006;26(11):983-990. [39] With C, Bodare A. Field test of a semi-empirical model for prediction of train-induced ground vibration. In Proceedings of the 2nd International Symposium on Environmental Vibrations, Okayama, 2005. [40] With C, Bodare A. Prediction of train-induced vibrations inside buildings using transfer functions. Soil Dynamics and Earthquake Engineering 2007;27(2):93-98. [41] Smekal A. Jorddynamiska analyser, BVF 585.13, regulation; Banverket, 2001. Swedish. [42] Berggren E. Dynamic Track Stiffness Measurement – A New Tool for Condition Monitoring of Track Substructure. Lic. Thesis. Royal Institute of Technology; 2005. [43] Andréasson B. 2005. Furet, Halmstad - Vibrationsproblemet – Vibrationsfenomenet. WSP, PM, Swedish. [44] Andréasson B. Rapport Geotekniska undersökningar - Halmstad, Furet. WSP, report, 2005. Swedish. [45] The archives at Eastern Region, Sundbyberg, Swedish National Rail Administration. [46] Wallmark G. Möjliga åtgärder mot spridning av vibrationer från tågtrafiken I området Furet, Halmstad, Km 149-150 (G Bld 36), Banverket, Tekniska avdelningen, Geoteknik, PM 1989-05-12, 1989. Swedish. [47] Berggren E, Li MXD, Spännar J. A new approach to the analysis and presentation of track geometry quality and rail roughness with focus on train-track interaction and wavelength content. 7th International Conference on Contact Mechanics and Wear of Rail/Wheel Systems, Brisbane, 2006. [48] Dingqing L, Thompson R, Kalay S. Development of continuous lateral and vertical stiffness measurement techniques. Proceedings from Railway Engineering, London, 2002. [49] Ebersöhn A. Substructure Influence on Track Maintenance. PhD Thesis. University of Massachusetts; 1995. [50] Esvald C. Track stiffness measurements using an adapted tamping machine. Rail International, 1980:103-113.
52
Train-Induced Vibrations on Embankments and in Buildings
[51] Nielsen JCO, Oscarsson J. Simulation of dynamic train-track interaction with state dependent track properties. Journal of Sound and Vibration 2004;275:515-532. [52] Norman C, Farritor S, Arnold R, Elias SEG, Fateh M, El-Sibaie M. Design of a system to measure track modulus from a voving railcar. Proceedings from Railwy Engineering, London, 2004. [53] Thompson R, Marquez P, Dingqing L. Track strength testing using TTCI’s track loading vehicle. Railway Track & Structures 2001;97(12):15-17. [54] Wangqing W, Geming Z, Kaiming Z, Lin L. Development of inspection car for measuring railway track elasticity. 6th International Heavy Haul Conference, Cape Town, 1997. [55] With C, Bodare A. Deriving Parameters of track and subsoil with a stiffness measurement vehicle. 3rd International Symposium on Environmental Vibrations, Taipei, 2007. [56] Andréasson B. Deformation Characteristics of Soft, High-Plastic Clays under Dynamic Loading Conditions. PhD Thesis. Chalmers University of Technology; 1979. [57] Erlingsson S and Bodare A. Vertical S waves in soil stratum over halfspace. Soil Dynamics and Earthquake Engineering 1992;11:427-434.