Transaction Taxes and Traders with Heterogeneous Investment Horizons in an Agent-Based Financial
Market Model Markus Demary
Cologne Institute for Economic Research
Please cite the corresponding journal article: http://www.economics-ejournal.org/economics/journalarticles/2010-8
Abstract
This heterogeneous interacting agents model of a financial market is a generalization of the model proposed by Westerhoff (The Use of Agent-Based Financial Market Models to Test the Effectiveness of Regulatory Policies) by traders who are allowed to have different investment horizons as introduced by Demary (Who Does a Currency Transaction Tax Harm More: Short-term Speculators or Long-term Investors?). Our research goals are, first, to study what consequences the introduction of heterogeneous investment horizons has for agent-based financial market models and second, how effective transaction taxes are in stabilizing financial markets. In detail, we are interested in how the popularity of different trading rules and investment horizons change due to taxation and how emergent properties from the interaction of traders like bubbles and crashes, excess volatility, excess kurtosis and volatility clustering change. Numerical simulations reveal that under taxation traders abstain from short-term trading in favour of longer investment horizons. This change in behavior leads to less excess volatility and diminishing volatility clusters for small tax rates. When the tax rate exceeds a certain threshold, excess volatility and misalignments increase as also found in Westerhoff (Heterogeneous Traders and the Tobin Tax). The reason is, that the longer term fundamentalist trading rule becomes unpopular in favor of the longer term trend-chasing rule.
Paper submitted to the special issue Managing Financial Instability in Capitalist Economies
Correspondence Markus Demary, Cologne Institue for Economic Research, Konrad-Adenauer-Ufer 21, 50668 Köln, Germany; e-mail: [email protected] The author would like to thank Thomas Lux for many helpful comments on earlier drafts of this paper. The views expressed in this paper are those of the author and do not necessarily represent those of the Cologne Institute for Economic Research.
Discussion Paper No. 2009-47 | November 10, 2009 | http://www.economics-ejournal.org/economics/discussionpapers/2009-47
Asset prices are excessively volatile due to speculative bubbles and crashes. The firstreported historical example of an asset price bubble is the Tulipmania in 1636-37([Garber, P. (1990)]). [Thomson, E. (2007)] reports that the price of a tulip on 3rdFebruary 1637 was approximatetly the same as the price of a full furnitured luxuryhouse in the city center of Amsterdam. It should be clear that this price level is notjustifyable by economic fundamentals but is due to speculative exuberance. TheSouth Sea Company and the Mississippi Company Bubble in 1720 were the firstequity price bubbles, while the Florida Land Boom in 1840 was the first reportedreal estate price bubble in history. The roaring twenties were characterized by assetprice crashes that lead to the Great Depression. Japan experienced a similar assetprice decline which led to Japan’s severest and persistent recession. The internetbubble in 1995 and the Asian crisis are newer examples of speculative bubbles, whilethe crash of the US housing market bubble has led to worldwide recessions, whichare comparable to the Great Depression and Japan’s severe recession. Because largeasset price crashes lead to severe recessions, research on asset price bubbles is highlyrelevant for economic scientists, economists in firms and institutions as well as foreconomic policy makers.
[Colander, D. (2009)] refers to four factors, which are responsible for the occu-rance of a speculative bubble. First, there should be price increases in the past.Second, a large fraction of economic agents believes that this past price trend willsustain in the future, and, third, these extrapolating expectations have to coordi-nate through social epidemics and contagion in order to have an impact on prices.[Shiller, R. (2007)] notes that contagion works through word of mouth persuationand the news media1. [Kirman, A. (1991)], [Lux, T. and M. Marchesi (1999)] and[Lux, T. and M. Marchesi (2000)]) introduce agent-based models in which social epi-demics lead to bubbles and crashes. [Brunnermeier, M. (2001)] refers to externali-ties in financial markets, like informational cascades and payoff externalities2, thatmake herding profitable for agents and trading against bubbles risky. Finally, iftransaction costs are high borrowing has to be very cheap, such that leverage willlead to high returns of chasing trends3 ([Colander, D. (2009)]). In financial mar-kets where transaction cost are lower, compared to the housing market for example,speculative bubbles are also possible in the absence of cheap credit. However, oneshould not treat these spectacular bubbles and crashes as anomalies or rare events.
1[Shiller, R. (2001)] argues that news media are observers of and commentators to market eventsand are thereby an integral part of these events. As a reason he mentions that for the occuranceof certain market events a similar thinking among large groups of people are necessary. Followinghim, the news media are essential vehicles for the spread of common ideas, since news on financialmarket events are published every day.
2An informational cascade occurs when an individual neclects his or her private informationafter observing the action of other individuals. A payoff externality is given when the profit of anagent depends on the action of other agents. As long as an agents makes profits by following thecrowd, it is rational for the agents to do so [Brunnermeier, M. (2001)].
3During the recent price bubble in the US housing market riding prices was made profitablethrough leverage although there are high transaction costs in the housing market. The reason forthis leverage effect were cheap housing loan contracts, in which the borrower could pay less orcould choose not to pay interest payments during the first years [Colander, D. (2009)].
www.economics-ejournal.org
2 Economics Discussion Paper
[Shiller, R. (1981)] and [LeRoy, S. and R. Porter (1981)] independently found thatasset prices are more volatile than their fundamental values. These transitory bub-bles and crashes do normally not lead to financial crises but they lead to excessivevolatility of the asset price.
The mainstream economist assumes that trend chasing behavior and herdingis irrational or at least bounded-rational. However, empirical evidence revealsthat a large fraction of professional traders rely on trend-chasing trading rules.[Menkhoff, L. and M. Taylor (2007)] survey the literature on questionaire studiesamong professional foreign exchange dealers. [Taylor, M. and H. Allen (1992)] werethe first who brought questionaire evidence from market participants. They foundthat at short-term horizons traders mostly rely on chartist trading rules, whilethey mostly rely on fundamental based trading rules at longer horizons. Theyfound that 32 percent of the foreign exchange market dealers use chartist rules.[Menkhoff, L. (1997)] is a similar study who found that 45 percent rely on trend-extrapolating trading rules instead of considering information about economic fun-damentals, while in [Lui, Y.-H. and D. Mole (1998)] 51 percent of the questionairedtraders relied on trend-extrapolation4. Inspired by this empirical evidence for be-havioral heterogeneity, agent-based models like the one we are going to present inthis paper explicitly model this heterogeneous trading rules, their evolution and in-teraction, and the emergent macroscopic properties that arise from this interactionof agents. Properties that emerge from agent-based financial market models are typ-ically volatility clustering and the fat-tailness of the distribution of returns, whichcan also be found in empirical daily return time series. [Lux, T. (2009b)] points outthat agent-based models could provide the missing link between the literature on be-havioral biases (behavioral finance) and the econometrics literature, which focusseson stylized facts of financial market data.
However, there are additional approaches in economic theory that explain theoccurance of speculative bubbles and crashes. [Brunnermeier, M. (2001)] explainsthe coordination of trend-chasing trading with externalities in financial markets likeinformational cascades and payoff externalities. The first one occurs when an in-dividual neclects his or her private information after observing the action of otherindividuals. If a large fraction of agents buy assets it is optimal for the singleagent to neclect fundamental information and infer increasing prices from the ob-served action of the others. A payoff externality is given when the profit of anagent depends on the action of other agents. As long as an agents makes prof-its by following the crowd, it is rational for the agents to do so. Moreover, theagent might realize losses by trading against the crowd. Traditional economic the-ory predicts speculative bubbles to be arbitraged away by rational agents whowill trade against mispricings. These rational agents will crowd out irrationaltraders, who rely on trends and market psychology. Within these theories thepower of arbitrage is unlimited. [Brunnermeier, M. (2008)] surveys three factorswhich will limit the power of arbitrage in theory and practice. First, there istfundamental risk. Because the future fundamental value is not known with cer-
4Studies which found similar results are [Cheung, Y.-W. and C. Wong (2000)],[Oberlechner, T (2001)], [Cheung, Y.-W. and M. Chinn (2001)] and[Gehrig, T. and L. Menkhoff (2004)].
www.economics-ejournal.org
Economics Discussion Paper 3
tainty, arbitrage is risky and therefore limited. Second, noise traders make arbi-trage more risky, therefore rational risk-averse traders will decrease their demand,an argument going back to [Bikhchandani, S., D. Hirshleifer and I. Welch (1992)]and [Shleifer, A. and R. Vishny (1997)]. Third, there is coordination risk, becausea single trader will make losses when attacking a bubble alone. For successful arbi-trage a large number of agents has to trade against the mispricing. When individualtraders cannot fully observe the actions from others riding the bubble is less riskycompared to trading against the bubble ([Brunnermeier, M. (2001)]).
[Keynes, J. M. (1936)] and [Tobin, J. (1978)] proposed to introduce taxes on fi-nancial markets in order to reduce speculative trading. Both assume that shortterm traders have a destabilizing impact on prices, while long term traders’ tradingbehavior is stabilizing. Both suggest that the introduction of a transaction tax willharm short-term speculators more compared to longer term investors. The ratio-nale behind this proposal is that a round trip of borrowing money in one country,investing it in another country and consuming the profit in the home country willlead to higher transaction costs the more frequent transactions takes place. Someempirical papers find that the introduction of transaction taxes may be destabi-lizing5. [Westerhoff, F. (2008a)] notes that these empirical studies are not withoutproblems. [Umlauf, S. (1993)], for example, analyzes Swenden’s introduction of a2 percent securities transaction tax, which is following [Westerhoff, F. (2008a)] aquite high tax rate. Because this real world policy experiment did not lead to theexpected success, Sweden abolished the financial market tax. Insights to the failureof this real world policy experiment can be given by referring to the heterogeneousagents model of the foreign exchange market proposed by [Westerhoff, F. (2003)].This model predicts that small transaction taxes are stabilizing, while higher trans-action taxes are destabilizing. The reason is that different tax rates have a differentimpact on the composition of stabilizing and destabilizing trading rules. A smalltax rate makes destabilizing trading rules unprofitable, while a higher tax rate alsomakes stabilizing trading rules unprofitable. Thus, under tax rates above a certainthreshold value a large fraction of stabilizing traders abstain from trading, leadingto a higher fraction of destabilizing traders. As a consequence, transaction taxesdestabilize financial markets when tax rates are high.
Inspired by this result, [Westerhoff, F. (2008a)] suggests to analyze the effective-ness of small transaction taxes on financial market stability. He suggests to use arti-ficial financial markets as computer laboratories for doing these policy experiments.[Lux, T. (2009b)] highlights that agent-based models - which are able to replicateseveral stylized facts of real world financial market data - are preferable tools fordoing policy experiments which are close to reality. Following [Lux, T. (2009b)],[Axelrod, R. and L. Tesfatsion (2006)] and [Westerhoff, F. (2008a)] agent-based mod-els are useful to study systems which are composed of different interacting agentsand in which properties emerge from the interaction of agents, which cannot bededuced by simply aggregating the microscopic properties. Emergent properties inagent-based financial market models that arise from the interaction of heterogeneousgroups of traders are bubbles and crashes, excess volatility, volatility clustering and
5See for example [Umlauf, S. (1993)], [Jones, C. and P. Seguin (1997)],[Aliber R., B. Chowdry and S. Yan (2005)], [Hau, H. (2006)].
www.economics-ejournal.org
4 Economics Discussion Paper
fat-tailness in the distribution of financial asset returns similar to those universalproperties of empirical asset returns ([Lux, T. (2009a)], [Lux, T. (2009b)]). En-couraged from the success of these models in reproducing empirical stylized facts[Demary, M. (2008)], [Westerhoff, F. (2003)], [Westerhoff, F. (2008a)] and[Lux, T. (2009b)] suggest to use these models as laboratories for economic policyexperiments, like regulatory changes. [Westerhoff, F. (2008a)] surveys the followingadvantages of this agent-based modelling: (i) The researcher is able to generate asmuch data as needed for the analysis, in contrast to empirical case studies, whichoften lack of available data. (ii) The researcher is able to measure all variables pre-cisely. Variables like the fundamental value of an asset are unobservable in realityand need to be estimated or derived from an economic model. (iii) The scientistis able to control for exogenous shocks and special events and he or she is ableto simulate special events again and again. By varying a policy parameter underotherwise same conditions, the researcher is able to analyze how a certain policyperforms under this special event. Moreover, scientists are able to vary the policyparameter slightly under otherwise same conditions (see [Westerhoff, F. (2008a)]).In contrast, within event studies using empricial data the researcher only observessome discrete policy changes. (iv) The researcher is able to measure the behav-ior of artificial agents during the simulations. In models like the one proposed by[Demary, M. (2008)] the researcher is able to observe every trader’s actions at eachof the artificial trading days. Thus, the generated datasets from the agent-basedsimulation can be explored by instruments from the statistical toolbox similar likedatasets generated by human subject experiments.
Up to now, there is a growing body of articles which employ agent-based arti-ficial economies for the analysis of the effectiveness of currency transaction taxes6.We already referred to [Westerhoff, F. (2003)] who finds that small currency trans-action taxes lower exchange rate volatility, while higher tax rates lead to an increasein volatility. [Westerhoff, F. and R. Dieci (2006)] propose an agent-based model inwhich traders are allowed to trade in two different financial markets. When apolicy maker levies a transaction tax only onto one market, the volatility in thismarket will decline, while the volatility in the second market will increase. Thereason is that trend-chasing trading rules are more profitable in the untaxed mar-ket. Thus, traders prefer to trade in this market. The second result of this pa-per is, that when the tax is levied on both markets, the volatilty in both marketswill decline. [Demary, M. (2008)] introduces an artificial foreign exchange marketwith chartists and fundamentalists who are allowed to choose between being a daytrader and being a longer term trader. Levying a transaction tax onto this artificialforeign exchange market leads to an increase of the kurtosis of the return distri-bution, which means a higher probability of large positive and negative returns.This increased probability of large returns emerges from the changed composition
6Other policy applications of agent-based models are [Westerhoff, F. (2001)],[Wieland, C. and F. Westerhoff (2005)], [Westerhoff, F. and C. Wieland (2004)][Westerhoff, F. (2008a)] who analyze the effectiveness of central bank interventions.[Westerhoff, F. (2003b)], [Westerhoff, F. (2006)] and [Westerhoff, F. (2008a)] analyze the effective-ness of trading halts for stabilizing financial markets. [Weidlich, A. and D. Veit (2008)] introducean agent-based model for analyzing electricity market regulation, while [Haber, G. (2008)] usesan agent-based model for monetary and fiscal policy analysis.
www.economics-ejournal.org
Economics Discussion Paper 5
of short-term and longer term traders. Under taxation short-term trading becomesunprofitable relative to longer term trading. Short-term traders who normally tradesmall orders every day now decide to trade larger orders every 30 days. This in-crease in larger orders leads to an increase in the kurtosis of the return distribution.[Pelizzari, P. and F. Westerhoff (2007)] show that transaction taxes are only effec-tive under certain market structures, while they will not work under some specificmarket structures. These studies reveal important insights for economic policy mak-ers into the effects of currency transaction taxes on financial markets.
In this paper we enlarge the artifical financial market of [Westerhoff, F. (2008a)]by the trader types with different investment horizons proposed by [Demary, M. (2008)].Note, that under the restriction that all traders have a short-term investment hori-zon, our model collapses to Westerhoff’s model. Our first objective is to study theimplications of longer term investment horizons for exchange rate dynamics in agent-based models, the second one is to use this artificial laboratory for analyzing theeffectiveness of currency transaction taxes. In addition to the models proposed by[Westerhoff, F. (2003)], [Westerhoff, F. and R. Dieci (2006)] and [Westerhoff, F. (2008a)]we are able to analyze how strong the reaction of short-term traders and longer termtraders is to the introduction of transaction taxes. In line with the literature weare interested in how this regulatory policy changes emergent properties that arisefrom the interaction of traders, like bubbles and crashes, excess volatility, volatilityclustering and the fat-tailness of the return distribution due to taxation. Numericalsimulations of our artificial foreign exchange market reveal that emergent proper-ties and stylized facts still remain when longer term traders are introduced. Theeconomic policy analysis leads to the following results. Small transaction taxesmake short-term trading unprofitable. Therefore, the number of short-term funda-mentalists and short-term chartists decreases to zero. One emergent property ofthis change in behavior are the diminishing volatility clusters. Moreover, volatilityand distortions decrease under small transaction taxes. The reason for this resultlies in the fact that under small transaction taxes the market is populated by alarger fraction longer term fundamentalist traders in relation longer term chartisttraders. However, when tax rates are too high, misalignments increase as also foundin [Westerhoff, F. (2003)]. The reason for this u-shaped response of volatility andmisaligments to increasing tax rates is caused by the changed composition of usedtrading rules. In his model tax rates above a certain threshold make fundamentaltrading unprofitable relative to trend-chasing trading. Within our artificial foreignexchange market a similar result emerges. Here, the longer term fundamentalisttrading rule becomes unpopular under tax rates above a certain threshold, whilethe number of traders, who favor the longer term chartist trading rule increases.The reason lies in the fact that short-term traders abstain from trading under trans-action taxes. The diminishing short-term fluctuations lead to longer swings in theexchange rate, which makes longer term chartist trading rules more profitable. Incontrast to [Keynes, J. M. (1936)] and [Tobin, J. (1978)] taxing financial markets isnot per se stabilizing by making short-term trading unprofitable in favor of longerterm trading. Our model shows that this result is not independent of the compo-sition of the used trading rules in the financial market and not independent of thetax rate.
www.economics-ejournal.org
6 Economics Discussion Paper
The remainder of this paper is organized as follows. The next section introducesthe artifical foreign exchange market, while section three will present an analysis ofthe model’s steady state. Section four tackles the validation of this model, whilesection five discusses the simulation results. Section six concludes.
2 The Artificial Financial Market
In this section we introduce the articial financial market which is a generalizationof the model proposed by [Westerhoff, F. (2008a)]. Following [Demary, M. (2008)]we introduce longer term traders into this model. If all traders have a daily invest-ment horizon, then our model collapses to Westerhoff’s. Influential contributionsto agent-based financial market models7 are surveyed in [Westerhoff, F. (2008b)],[Hommes, C. (2006)], [LeBaron, B. (2006)], [Lux, T. (2009a)] and [Lux, T. (2009b)]).All models have in common that agents choose from a finite set of behavioral rules.Commonly, these are a fundamental trading rule, which reacts to deviations of theasset price from its fundamental value, and a chartist trading rule, which reactson trends in the asset price. The former one has a centripetal effect on the as-set price dynamics, while the later one has a centrifugal effect ([Lux, T. (2009b)]).These heterogenous agents are either assumed to consist of a finite population([Kirman, A. (1991)]) or of a continuum of agents ([Brock, W. and C. Hommes (1998)]).Moreover, models may differ in the assumed process for the evolution of used het-erogeneous trading rules. While in [Brock, W. and C. Hommes (1998)] and[DeGrauwe, P. and M. Grimaldi (2006)] the popularity of trading rules is governedby the past success of these rules, in [Kirman, A. (1991)] and [Lux, T. and M. Marchesi (2000)]the evolution of trading rules is governed by social interactions. [LeBaron, B. (1999)]use genetic algorithms as evolutionary processes. Macroscopic properties of the assetprice like bubbles and crashes, excess volatility, excess kurtosis of the return distribu-tion and volatility clustering emerge from the interaction of agents. Note that theseproperties cannot simply be deduced by aggregating agents ([Westerhoff, F. (2008a)])but emerge independent of the microscopic properties ([Lux, T. (2009b)]). An ex-ample for an emergent property is the occurance and burst of a speculative bubble.When the majority of agents rely on chartist rules a speculative bubble can emerge,when this bubble makes fundamental rules more popular and agents switch to thistrading strategy, this change in behavior results in a crash back to the fundamentalvalue. Summing up, these models are quite successful in replicating stylized facts ofdaily financial market data ([Lux, T. (2009b)]).
Similar to [Demary, M. (2008)] we want to analyze in detail the following propo-sition - which is often heard from the proponents of transaction taxes and the publicmedia especially in times of financial instability - within our artificial financial mar-ket: transaction taxes stabilize asset prices by crowding out short-term speculatorsin favor of longer term investors. In order to analyze this proposition we have to
7Important and influencial contributions are [Day, R. and W. Huang (1990)],[Kirman, A. (1991)], [Chiarella, C. (1992)], [Chiarella, C. and X. He (2002)],[DeGrauwe, P. and M. Grimaldi (2006)], [Lux, T. (1995)], [Lux, T. and M. Marchesi (1999)],[Lux, T. and M. Marchesi (2000)], [Brock, W. and C. Hommes (1998)], [LeBaron, B. (1999)] and[Farmer, D. and S. Joshi (2002)].
www.economics-ejournal.org
Economics Discussion Paper 7
consider the following requirements and assumptions:
(i) we need a model in which we are able to distinguish between short-term tradersand longer term investors,
(ii) the number of short-term traders and longer term traders should not be fixedbut traders should be allowed to change groups or leave the market, and
(iii) the model should be able to match empirical properties of financial market datain order perform policy experiments which are close to reality.
For fulfilling requirements (i), (ii) and (iii) the most appealing framework is anagent-based model of a financial market. This artificial foreign exchange marketconsists of the following building blocks
(i) a fundamental exchange rate sft , which is purely determined by exogenous fac-
tors (e.g. monetary aggregates, current accounts, business cycle conditions,...)
(ii) traders who choose from a finite set of possible trading rules: a short-termfundamentalist rule, a short-term chartist rule, a longer term fundamentalistrule, a longer term chartist rule, or being inactive,
(iii) an evolutionary mechanism for determining the popularity of a certain tradingrule according its past performance,
(iv) a market maker who adjusts the exchange rate in response to excess demand,
(v) a policy maker who determines the value of the currency transaction tax rate.
We will elaborate this building blocks in more detail.
2.1 Traders’ Demand for Foreign Currency
[Westerhoff, F. (2008a)] models the agents’ demand in line with the literature on het-erogeneous agents models of financial markets ([Brock, W. and C. Hommes (1998)],[Day, R. and W. Huang (1990)], [Lux, T. (1995)], [Lux, T. and M. Marchesi (2000)],[DeGrauwe, P. and M. Grimaldi (2006)]), but adds random disturbances to the agents’demands in order to account for the empirical variety of trading rules. Thus, short-term chartists’ (SC) demand is given by
dSCt = κC(st − st−1) + βt,where βt ∼ N (0, σ2
β), (1)
while short-term fundamentalists’ (SF) demand is given by
dSFt = κF (sf
t − st) + αt,where αt ∼ N (0, σ2α). (2)
Chartists trade foreign currency because they expect the recent trend (st − st−1) tosustain in the next period. The parameter κC governs the strength of the trend ex-trapolation. Note, that st is the exchange rate in logarithmic notation, thus, st−st−1
www.economics-ejournal.org
8 Economics Discussion Paper
is the percentage change in the exchange rate. Chartists expect to make profits bybuying (selling) the exchange rate at st and selling (buying) it at the expected higher(lower) value st+1. Following [Westerhoff, F. (2008a)], the random disturbance βt
accounts for the variety of possible chartist trading rules. Fundamentalists buy (sell)foreign currency when the current exchange rate st is below (above) the fundamen-tal one sf
t . The reason is that this group expects the exchange rate to return toits fundamental value in the future, where κF is the assumed rate of misalignment-correction. Thus, fundamentalist traders expect profits by buying (selling) foreigncurrency at the exchange rate st and selling (buying) it at the higher (lower) onest+1, which they assume to be close to the fundamental value sf
t . The fundamentalvalue is assumed to be purely exogenous. [Westerhoff, F. (2008a)] adds the ran-dom disturbance αt to this equation, which should represent a percention error or adeviation from the strict deterministic trading rule.
In addition to these two trading rules we assume, following [Demary, M. (2008)],two longer-term trading rules for chartists and fundamentalists. The rationale be-hind this assumption is that traders assume a longer lasting trend in the exchangerate8 or they expect a longer convergence period to the fundamental value. Longer-term chartists (LC) demand is given by
dLCt =
[1− βN
1− ββ](st − st−1). (3)
More precise, it is the chartists’ demand for an investment horizon of N days. ForN = 1 this trading rule collapses to the conventional one period chartist rule. Thistrading rule can be derived as follows. When a longer term chartist trader observesthe current trend segment st − st−1 he or she will expect a trend of β(st − st−1) forthe next period. For calculating the following exchange rate change, the trader usesthis forecast and calculates β2(st−st−1) for the following period. Thus, the expectedexchange rate change st+N − st conditional on the chartists’ rule is nothing else asthe sum over all one period forecasts. By applying the rule for the finite geometricseries equation (3) can be derived. Following [Demary, M. (2008)] the longer-termfundamentalists’ (LF) demand is given by
dLFt =
[1− (1− ψ)N
](sf
t − st). (4)
This trading rule can be derived by the following consideration. When fundamen-talist traders observes the misalignment sf
t − st he or she expects ψ·100% of thismisaligment to be corrected by the next exchange rate change. Thus, he or sheexpects (1 − ψ)·100% of the misalignment to prevail, of which ψ(1 − ψ)·100% willbe corrected by the subsequent exchange rate change an so on. Thus, the expectedexchange rate change st+N − st conditional on the fundamentalist forecasting rule isnothing else as the sum over all one period forecasts. Again, by applying the formulafor the finite geometric series equation (4) can be derived. Note, that for N = 1this rule collapses to the conventional one period fundamentalist rule. Furthermore,
8See [Engel, C. and J. Hamilton (2000)] for an empirical analysis of long swings in exchangerates.
www.economics-ejournal.org
Economics Discussion Paper 9
note that we did not add random disturbances to the longer term trading rules. Thereason is that we assume longer term trading rules to be more robust compared toone period rules.
2.2 Price Adjustment
[Westerhoff, F. (2008a)] assumes following [Farmer, D. and S. Joshi (2002)] a priceimpact function which can be interpreted as a stylized description of a risk-neutralmarket maker. Following [Westerhoff, F. (2008a)], this market maker mediatestransactions out of equilibrium and adjusts prices in response to excess demand.More precisely, the market maker will rise the exchange rate if excess demand forforeign currency is positive, while he will lower the exchange rate in response tonegative market demand Dt
st+1 = st + βDt + εt,where εt ∼ N (0, σ2ε). (5)
Market demand Dt is defined as the sum of orders of fundamentalist traders andchartist traders weighted by their pertinent population weights wSC
t , wSFt , wLC
t andwLF
t
Dt = wSCt dSC
t + wSFt dSF
t + wLCt dLC
t + wLFt dLF
t . (6)
[Westerhoff, F. (2008a)] adds the random disturbance εt to the market maker’s priceadjustment rule, because it only represents a simple representation of real markets.From equations (5) and (6) can be inferred that the orders of the four trader groupsas well as their population fractions determine exchange rate dynamics in a nonlinearway.
2.3 Evolution of Trading Rules
In [Westerhoff, F. (2008a)] traders have three alternatives. They can either be afundamentalist trader or a chartist trader. The third possibility for traders is tostay inactive. In our version of this model traders have two additional alternatives.They can either be a longer term chartist or a longer term fundamentalist. Following[Brock, W. and C. Hommes (1998)], [DeGrauwe, P. and M. Grimaldi (2006)] and[Westerhoff, F. (2008a)] the selection of one of these five alternatives depends onthe strategies’ past performances. The rationale behind this is an evolutionarymechanism in which more agents prefer to follow the trading rule which was mostprofitable in the past. Note, that this mechanism does not model herding be-havior explicitly because there is no social interaction. For herding models see[Lux, T. and M. Marchesi (2000)] and [Lux, T. (2009b)]. Inspired by [Westerhoff, F. (2008a)]we assume the following fitness functions for short-term fundamentalist and short-term chartists
ASCt = (exp{st} − exp{st−1})dSC
t−2 − τ(exp{st}+ exp{st−1})|dSCt−2|+ θASC
t−1(7)
ASFt = (exp{st} − exp{st−1})dSF
t−2 − τ(exp{st}+ exp{st−1})|dSFt−2|+ θASF
t−1.(8)
www.economics-ejournal.org
10 Economics Discussion Paper
The first term of the performance measures ASCt and ASF
t is the return the agentgot by investing in foreign currency by placing his or her order dSC
t−2 or dSFt−2 to the
market maker. Here, [Westerhoff, F. (2008a)] assumes that traders submit ordersin period t − 2, which are executed at period t − 1. If a pertinent trading rule isprofitable or not thus depends on the realized price in period t. The second termis the transaction cost the trader has to pay when executing orders. If the tradersbuys (sells) foreign currency at the price st−1 he or she has to pay a tax amountof τ exp{st−1}|dt−2| on this transaction, where τ is the transaction tax rate. Thetraders only realizes a profit if he or she sells (buys) the currency back at the price st.Again, a tax will be levied on this transaction with the tax amount τ exp{st}|dt−2|.Thus, [Westerhoff, F. (2008a)] assumes a round trip where the investors have to paythe transaction tax twice. The parameter θ is a memory parameter. Thus, the lastterm measures how quickly profits are discounted for strategy selection. If θ is high,then past profits generated by this trading rule will be considered in todays strategyselection, while for θ = 0 past profits do not play any role for todays strategyselection. For d = 1 all past profits will play a role for todays selection. The fitnessmeasures for the longer term trading strategies ALC
Following [Demary, M. (2008)], we divide the profit generated by the multi-periodinvestment through the investment horizon N . Thus, we measure the profit per day.This assumption is necessary in order to have a fair comparison between short-termtrading strategies and longer term strategies. Following [Westerhoff, F. (2008a)] theprofit of being inactive for one period is zero. Following [Brock, W. and C. Hommes (1998)]and [Westerhoff, F. (2008a)] the population fractions of agents are given by the dis-crete choice model proposed by [Manski, C. and D. McFadden (1981)]
wSCt =
exp{γASCt }
1 + exp{γASCt }+ exp{γASF
t }+ exp{γALCt }+ exp{γALF
t }(11)
wSFt =
exp{γASFt }
1 + exp{γASCt }+ exp{γASF
t }+ exp{γALCt }+ exp{γALF
t }(12)
for short term traders,
wLCt =
exp{γALCt }
1 + exp{γASCt }+ exp{γASF
t }+ exp{γALCt }+ exp{γALF
t }(13)
wLFt =
exp{γALFt }
1 + exp{γASCt }+ exp{γASF
t }+ exp{γALCt }+ exp{γALF
t }(14)
for longer term traders, and finally
wIt =
1
1 + exp{γASCt }+ exp{γASF
t }+ exp{γALCt }+ exp{γALF
t }(15)
for inactive traders, whose profits are zero by construction. Note that the higherthe fitness of one particular strategy, the higher will be the percentage fraction of
www.economics-ejournal.org
Economics Discussion Paper 11
agents, who use it. The parameter γ ≥ 0 controls how sensitive traders react to achange in the fitness measure of their trading rule. The higher γ the more agentsswitch to the strategy with the highest fitness. For γ = 0 all trading strategies willbe selected with equal probability, while for γ = ∞ all agents select the strategywith the highest performance.
Note that for N = 1 (all traders have the same investment horizon) our modelcollapses to the model of [Westerhoff, F. (2008a)].
3 Fundamental and Non-Fundamental Steady-States
In order to analyze the steady states of the model we have to set all shocks to zeroand concentrate on the deterministic skeleton of the model. In order to be in steadystate the restriction
(st, sft , d
it, w
it, A
it) = (st−1, s
ft−1, d
it−1, w
it−1, A
it−1) = (s, st, di, wi, Ai) (16)
should hold (i ∈ {SF,LF, SC, LC, I}). Thus, all variables should be equal to their(fundamental) long run values and all dynamics should rest there. Under the re-striction st = st−1 = s = sf all fitness measures collaps to zero
ASC = ASF = ALC = ALF = 0 (17)
leading to a uniform distribution in the popularity of all five trading rules
wSC = wSF = wLC = wLF = wI = 0.2. (18)
Chartists’ demand will be zero when the exchange rate remains constant
dSC = dLC = 0, (19)
while the fundamentalists’ demand will only be zero when the steady state exchangerate s equals the fundamental exchange rate sf
dSF = dLF = 0. (20)
Thus, the fundamental steady state is characterized by zero demands for foreigncurrency, zero profits and equal selection of possible trading rules. Note, thatthis result can often be found in heterogeneous traders models of this type (see[DeGrauwe, P. and M. Grimaldi (2006)]).
What remains is to analyze if it is possible that the exchange rate remains in astate s, where it is different from the fundamental exchange rate s 6= sf . If this isthe case, the fundamentalist traders’ demand is always positive in absolute value.These orders will push the exchange rate back to the fundamental value. It is onlypossible that the exchange rate remains in a non-fundamental equalibrium s 6= sf
if no trader uses the fundamental trading rules, that means wSF = wLF = 0 (see[Grimaldi, M. (2004)]). In line with [Grimaldi, M. (2004)], any constant exchangerate can be an equilibrium if this condition is fulfilled. The reason is that there isno driving force that brings the exchange rate back to the fundamental equilibrium.
www.economics-ejournal.org
12 Economics Discussion Paper
4 Calibration and Model Validation
In order use this artificial foreing exchange market as a computer laboratory for theanalysis of regulatory policies we have to assume numerical values for the model’sparameters first9. This set of used parameter values can be found in Table 1. Mostof the parameter values are taken from [Westerhoff, F. (2008a)]. According to him,parameters are chosen such that the model is able to match numbers and statistics ofreal world financial market data10. [Westerhoff, F. (2008a)] assumes both parame-ters to have the value 0.04. By following his suggestions short-term chartists expectsa return of 0.04 percent for the next day in response to a return of 1 percent todayand a cumulative return of 1.04 percent over the next 30 days. Fundamentalists,however, assume a return of 0.04 in response to a misalignment of 1 percent and acumulative return of 0.71 over the next 30 days.
0.01 fundamental newsκc 0.04 chartists’ reactionσc 0.03 variety of chartist rulesκf 0.04 fundamentalists’ reactionσf 0.005 variety of fundamentalist rulesγ 800 intensity of choiced 0.975 memory parameterN 30 longer term investment horizon
Note: Most prameter values are based on [Westerhoff, F. (2008a)]. We set a higher value for theintensity of choice parameter γ. The longer term investment horizon is assumed to be 30 days.
[Westerhoff, F. (2008a)], [Lux, T. and M. Marchesi (2000)], [Lux, T. (2009b)] and[Franke, R. and F. Westerhoff (2009)] validate agent-based models by analyzing howgood the model is able to reproduce stylized facts of empirical daily financial marketdata like uncorrelated raw returns, volatility clustering, long memory and fat tailsof the return distribution. Thus, we analyze how numbers and statistics like dis-tributional moments, autocorrelations and distributional shape parameters of ourartificially generated computer labaratory data match numbers and statistics of datagenerated in the real world. If our models produces data whose properties are close
9All programming and computations were done using the free open source software R([R Development Core Team (2009)]).
10Studies that estimate rather than calibrate these models are[Gilli, M. and P. Winker (2003)], [Westerhoff, F. and S. Reitz (2003)], [Lux, T. (2006)],[Alfarano, S., T. Lux and F. Wager (2005)], [Boswijk, P., C. Hommes and S. Manzan (2007)],[Winker, P., M. Gilli and V. Jeleskovic (2007)], [Manzan, S. and F. Westerhoff (2007)] and[Ghongadze, J. and T. Lux (2009)]. These studies suggest to that the chartist and fundamentalistreaction parameters κc and κf lie between 0 and 0.1 for daily data.
www.economics-ejournal.org
Economics Discussion Paper 13
to those of real world data, than we are - as proposed by [Lux, T. (2009b)] - able toperform an economic policy analysis which is close to reality. The economic policyanalysis can be done by running the simulations for a given seed of random vari-ables (!) but for different values of the policy parameter. More general results canbe achieved by calculating average statistics over several simulation runs. Theseresults can be interpreted as cross-section averages over several artificial financialmarkets.
Following [Westerhoff, F. (2008a)] and [Lux, T. (2009b)] we use the followingvalidation criteria (Lux-Westerhoff criteria hereafter):
(i) the model should generate bubbles and crashes,
(ii) asset prices should be more volatile than their fundamental values (excessvolatility),
(iii) the return distribution should deviate from the normal distribution (excess kur-tosis),
(iv) absence of autocorrelations in raw returns (non-predictability of daily returns),
(v) hyperbolically decaying autocorrelations of absolute returns (volatility cluster-ing).
Table 2: Summary Statistics: Baseline Simulation versus Empirical Data
Note: Mean, variance, skewness and kurtosis are calculated from the model generated exchangerate return data by using the parameters given in table Table 1. The exchange rate data forthe US-Dollar to Euro, Yen to US-Dollar, Great Brittain Pound to US-Dollar ans US-Dollar toAustralian Dollar are taken from the FRED2 database of the Federal Reserve Bank of St. Louisin daily frequency. The data series range from 1999-01-04 to 2009-10-09 and are available underthe series-ID: DEXUSEU, DEXJPUS, DEXUSUK and DEXAUUS.
Figure 1 contains results of the baseline simulation of our artificial foreign ex-change market. The baseline simulation is characterized by the absence of transac-tion taxes. Moreover, the fundamental exchange rate is assumed to stay constant.Thus, fundamental based trading rules are not affected by the risk that the funda-mental rate will change in the future. Fundamental risks make arbitrage more risky([Brunnermeier, M. (2001)]) and thereby limit arbitrage. As a result, the fundamen-tal trading rules may become less profitable, because fundamental forecasting rulesgenerate larger prediction errors. We will tackle the problem of fundamental risksin section 5.2 and abstain from these kinds of risk during the baseline simulation.
www.economics-ejournal.org
14 Economics Discussion Paper
0 500 1000 1500 2000 2500 3000
−0.
40.
00.
4
Exchange Rate
Trading Days
Exc
hang
e R
ate
0 500 1000 1500 2000 2500 3000
0.0
0.2
0.4
Distortion
Trading Days
Dis
tort
ion
0 500 1000 1500 2000 2500 3000
−0.
050.
05
Return
Trading Days
Ret
urn
0 500 1000 1500 2000 2500 3000
0.0
0.4
0.8
Short Term Chartists
Trading Days
Pop
ulat
ion
0 500 1000 1500 2000 2500 3000
0.0
0.4
0.8
Longer Term Chartists
Trading Days
Pop
ulat
ion
0 500 1000 1500 2000 2500 3000
0.0
0.4
0.8
Short Term Fundamentalists
Trading Days
Pop
ulat
ion
0 500 1000 1500 2000 2500 3000
0.0
0.4
0.8
Longer Term Fundamentalists
Trading Days
Pop
ulat
ion
0 20 40 60 80
0.0
0.4
0.8
Lag
AC
F
Autocorrelation of Raw Returns
0 20 40 60 80
0.0
0.4
0.8
Lag
AC
F
Autocorrelation of Absolute Returns
Figure 1: Simulation without Transaction Taxes
Note: Simulation of 3000 artificial trading days. The underlying parameter values are κf = κc =0.04, N = 30, γ = 800, d = 0.975, σf = 0.005, σc = 0.03 and σs = 0.01. The fundamental value isnormalized to zero. Distortion is measured as the absolute value of the deviation of the exchangerate from its fundamental value.
From Figure 1 we can infer that most of the chartist traders prefer to be short termtraders, while fundamental traders prefer the longer term investment horizon. Thisresults is in line with the argument of [Keynes, J. M. (1936)] and [Tobin, J. (1978)]that short-term traders are destabilizing, while longer term traders are stabilizing.Moreover, this result is also in line with the empirical evidence from questionairestudies like [Taylor, M. and H. Allen (1992)]. There are periods with sharp increasesin the number of short term chartist traders. These periods correspond to periodswith high volatility and large misalignments in the exchange rate. Thus, short termchartists lead to additional risks. These periods of high volatility are followed byperiods with a low volatility and a high popularity of the longer term fundamen-talists trading strategy. Raw returns display two small negative autocorrelations.These mean reverting dynamics may result from the dominance of longer term fun-damental traders who trade large orders against the mispricing. The autocorrelationfunction of absolute returns shows slowly decaying serial correlations in the magni-tude of returns which correponds the the persistent phases of high and low volatilityin the artificial return data. Summing up, the model is able to generate bubbles andcrashes which can be inferred from the time series plot of misalignments (Figure 1).Moreover, it is able to generate non-predictable returns, which can be inferred fromthe small serial correlations in the artificial exchange rate returns. Furthermore,the models is able to generate volatility clustering. This, can be inferred by justeyeballing the time series of returns or more elaborate by the slowly decaying serialcorrelations in absolute returns. Moreover, within the model a return distributionemerges which is characterized by excess kurtosis. As can be inferred from Table 2,the model is able to generate statistics, which are in line with the statistical prop-
www.economics-ejournal.org
Economics Discussion Paper 15
erties of the Yen, Euro, the Great Britain Pound and the Australian Dollar versusUS-Dollar daily exchange rate data. Note, that empirical data as well as data gen-erated by our artificial foreign exchange market are characterized by zero means,standard deviations in the range of 0.006 to 0.015 and a kurtosis measures thatranges from 5.6 to 17.0. Thus, our model for daily exchange rate fluctuations canbe regarded as validated by the Lux-Westerhoff criteria ([Westerhoff, F. (2008a)],[Lux, T. (2009b)]). Moreover, we can conclude that all stylized facts remain underthe introduction of longer term traders.
5 The Effectiveness of Transaction Taxes
[Lux, T. (2009b)] and [Westerhoff, F. (2008a)] suggest to use agent-based models ascomputer laboratories for performing economic policy experiments which are pro-hibitivedly costly to perform in real world markets. The reason is that a policyexperiment in reality has direct consequences for people and moreover the policymaker can only experiment once under the same conditions. More precisely, varyingthe policy instrument under the same conditions is not possible in reality becausethe first trial of the experiment has changed people’s endowments and people changetheir expectations about the future. In an agent-based artificial economy, howewer,we are able to repeat policy experiments under the same conditions but it is possi-ble to vary one or more parameters. [Westerhoff, F. (2008a)] refers to the followingadvantages of agent-based modelling over traditional theorizing, human subject ex-periments and empirical case studies:
(i) We are able to generate as much data points as needed for our policy anal-ysis. When analyzing empirical data, doing case studies or performing hu-man subject experiments the researcher has only access to a limited dataset ([Westerhoff, F. (2008a)]). In our agent-based policy analysis we generatefollowing [Westerhoff, F. (2008a)] a time series of 5000 data points, which cor-reponds to a time horizon of 20 years since the model is calibrated to dailydata. Moreover, we simulate 100 time series of 5000 trading days and takeaverages over all numbers and statistics. The advantage of this procedure isthat our results do not only depend on one certain seed of random variables.One can interpret the generated sample as a panel of 100 foreign exchangemarkets.
(ii) [Westerhoff, F. (2008a)] notes that the second advantage of agent-based mod-elling is that we are able to measure all variables precisely during our policyanalysis. In reality we do not observe a fundamental value. Instead, we have torely on an estimated value or a proxy variable for the fundamental value, whichdepends on a certain economic model. Moreover, in reality it is very costly toget real time data about the used trading strategies of traders or their profitsgenerated by these trading strategies. Within an agent-based experiment weare able to measure all these parameters of our artificial traders.
(iii) We are able to control for exogenous shocks. Within our simulation we in-troduce three types of exogenous events. These are random deviations from
www.economics-ejournal.org
16 Economics Discussion Paper
the market makers price adjustment rule, and random deviations from thechartists’ and fundamentalists’ trading rules. Following [Westerhoff, F. (2008a)]these random disturbances should represent the dozents of real world tradingstrategies which are not explicitly considered in our model. Other exogenousevents like a large drop in the fundamental value (e.g. a big recession) are notintroduced. Thus, we analyze the effectiveness of the currency transaction taxduring ”normal” trading days.
(iv) We perform the simulations under the same conditions (the same seed of ran-dom variables), but with different values of the policy instrument. In thisway we are able to get an inference on how the policy instrument changesproperties - measured by numbers and statistics - of our artificial market.[Westerhoff, F. (2003)] and [Westerhoff, F. (2008a)] suggests the following eval-uation criteria
(a) volatility, defined as the average absolute change in the exchange rate
Vol =1
T
T∑t=1
|st − st−1|, (21)
and
(b) distortion
Dis =1
T
T∑t=1
|sft − st|, (22)
which is defined as the average absolute deviation of the exchange ratest from its fundamental value sf
t .
Moreover, [Demary, M. (2008)] and [Westerhoff, F. (2008a)] suggest to analyzethe change the average percentage fraction of used trading rules as a measureof traders’ behavior, which will change in response to policy changes, while[Demary, M. (2008)] suggests also to analyze the change in the kurtosis of theexchange rate returns
Kurt =1T
∑Tt=1(st − st−1)
4
( 1T
∑Tt=1(st − st−1)2)2
(23)
as a measure of catastrophic risks.
5.1 Simulations without Fundamental Risk
Figure 2 to 5 contains snapshorts of 3000 trading days within our artificial foreignexchange market. Figure 2 is based on a tax rate of 0.1 percent on each currencytransaction, while Figure 3 and Figure 4 are based on the tax rates 0.3 and 0.5 per-cent, while Figure 5 is based on a tax rate of 1 percent. From Figure 2 one can inferby just visual inspection that bubbles and crashes, volatility clusters and distortions
www.economics-ejournal.org
Economics Discussion Paper 17
still prevail under a small transaction tax. Absolute returns are still characterizedby persistent serial correlations. Similar to Figure 1 most of the traders prefer to beshort-term chartist or longer term fundamentalist. Figure 3 shows a simulation runof our artificial foreign exchange market under a transaction tax rate of 0.3 percent.What can be seen is that short-term chartism now has the lowest popularity. Thereason is that taxation makes this trading rule too expensive. The large fluctuationsand amplitudes in short term chartist and longer term fundamentalists populationfractions are now absent. As a result, the occurence of spectacular bubbles andcrashes also diminishes, as can be inferred from the time series plot of distortions.Moreover, taxation reduces the autocorrelation of absolute returns. Thus, volatilityclusters are absent under this tax rate. From Figure 4 and Figure 5 can be inferredthat taxation of financial transactions smoothes the fluctuations in the popularityof trading rules. However, it seems that the highest stabilizing impact is achievedby increasing the tax rate from 0 to 0.1 percent.
0 500 1000 1500 2000 2500 3000
−0.
40.
00.
4
Exchange Rate
Trading Days
Exc
hang
e R
ate
0 500 1000 1500 2000 2500 3000
0.0
0.2
0.4
Distortion
Trading Days
Dis
tort
ion
0 500 1000 1500 2000 2500 3000
−0.
050.
05
Return
Trading Days
Ret
urn
0 500 1000 1500 2000 2500 3000
0.0
0.4
0.8
Short Term Chartists
Trading Days
Pop
ulat
ion
0 500 1000 1500 2000 2500 3000
0.0
0.4
0.8
Longer Term Chartists
Trading Days
Pop
ulat
ion
0 500 1000 1500 2000 2500 3000
0.0
0.4
0.8
Short Term Fundamentalists
Trading Days
Pop
ulat
ion
0 500 1000 1500 2000 2500 3000
0.0
0.4
0.8
Longer Term Fundamentalists
Trading DaysP
opul
atio
n
0 20 40 60 80
0.0
0.4
0.8
Lag
AC
F
Autocorrelation of Raw Returns
0 20 40 60 80
0.0
0.4
0.8
Lag
AC
F
Autocorrelation of Absolute Returns
Figure 2: Simulation with a 0.1 Percent Transaction Tax Rate
Note: Simulation of 3000 artificial trading days. The underlying parameter values are κf = κc =0.04, N = 30, γ = 800, d = 0.975, σf = 0.01, σc = 0.03 and σs = 0.01. The fundamental value isnormalized to zero. The transaction tax rate is 0.1 percent. Distortion is measured as the absolutevalue of the deviation of the exchange rate from its fundamental value.
Figure 6 contains summarized results of our policy experiments for small trans-action taxes between 0 and 1 percent. Each reported number is the average over5000 artificial trading days and 100 artificial markets. The simulations for differenttax rates are based on the same seed of random variables. The tax rate is variedfrom 0 (the baseline case) in 0.1 percent steps and measured by the x-axis of theplot. As one can see, taxation of foreign currency transactions with small tax ratesdoes not change the average returns on holding foreign currency. However, it de-creases the volatility of exchange rate returns and the distortion of the market (theaverage misalignment). Thus, the transaction tax helps to decrease price volatilityand brings the exchange rate on average closer to its fundamental value. However,
www.economics-ejournal.org
18 Economics Discussion Paper
0 500 1000 1500 2000 2500 3000
−0.
40.
00.
4
Exchange Rate
Trading Days
Exc
hang
e R
ate
0 500 1000 1500 2000 2500 3000
0.0
0.2
0.4
Distortion
Trading Days
Dis
tort
ion
0 500 1000 1500 2000 2500 3000
−0.
050.
05
Return
Trading Days
Ret
urn
0 500 1000 1500 2000 2500 3000
0.0
0.4
0.8
Short Term Chartists
Trading Days
Pop
ulat
ion
0 500 1000 1500 2000 2500 3000
0.0
0.4
0.8
Longer Term Chartists
Trading Days
Pop
ulat
ion
0 500 1000 1500 2000 2500 3000
0.0
0.4
0.8
Short Term Fundamentalists
Trading Days
Pop
ulat
ion
0 500 1000 1500 2000 2500 3000
0.0
0.4
0.8
Longer Term Fundamentalists
Trading Days
Pop
ulat
ion
0 20 40 60 80
0.0
0.4
0.8
Lag
AC
F
Autocorrelation of Raw Returns
0 20 40 60 80
0.0
0.4
0.8
Lag
AC
F
Autocorrelation of Absolute Returns
Figure 3: Simulation with a 0.3 Percent Transaction Tax Rate
Note: Simulation of 3000 artificial trading days. The underlying parameter values are κf = κc =0.04, N = 30, γ = 800, d = 0.975, σf = 0.01, σc = 0.03 and σs = 0.01. The fundamental value isnormalized to zero. The transaction tax rate is 0.3 percent. Distortion is measured as the absolutevalue of the deviation of the exchange rate from its fundamental value.
0 500 1000 1500 2000 2500 3000
−0.
40.
00.
4
Exchange Rate
Trading Days
Exc
hang
e R
ate
0 500 1000 1500 2000 2500 3000
0.0
0.2
0.4
Distortion
Trading Days
Dis
tort
ion
0 500 1000 1500 2000 2500 3000
−0.
050.
05
Return
Trading Days
Ret
urn
0 500 1000 1500 2000 2500 3000
0.0
0.4
0.8
Short Term Chartists
Trading Days
Pop
ulat
ion
0 500 1000 1500 2000 2500 3000
0.0
0.4
0.8
Longer Term Chartists
Trading Days
Pop
ulat
ion
0 500 1000 1500 2000 2500 3000
0.0
0.4
0.8
Short Term Fundamentalists
Trading Days
Pop
ulat
ion
0 500 1000 1500 2000 2500 3000
0.0
0.4
0.8
Longer Term Fundamentalists
Trading Days
Pop
ulat
ion
0 20 40 60 80
0.0
0.4
0.8
Lag
AC
F
Autocorrelation of Raw Returns
0 20 40 60 80
0.0
0.4
0.8
Lag
AC
F
Autocorrelation of Absolute Returns
Figure 4: Simulation with a 0.5 Percent Transaction Tax Rate
Note: The numbers and statistics of this figure are based on 3000 artificial trading days. Theunderlying parameter values are κf = κc = 0.04, N = 30, γ = 800, d = 0.975, σf = 0.01, σc = 0.03and σs = 0.01. The fundamental value is normalized to zero. The transaction tax rate is 0.5percent. Distortion is measured as the absolute value of the deviation of the exchange rate fromits fundamental value.
www.economics-ejournal.org
Economics Discussion Paper 19
0 500 1000 1500 2000 2500 3000
−0.
40.
00.
4
Exchange Rate
Trading Days
Exc
hang
e R
ate
0 500 1000 1500 2000 2500 3000
0.0
0.2
0.4
Distortion
Trading Days
Dis
tort
ion
0 500 1000 1500 2000 2500 3000
−0.
050.
05
Return
Trading Days
Ret
urn
0 500 1000 1500 2000 2500 3000
0.0
0.4
0.8
Short Term Chartists
Trading Days
Pop
ulat
ion
0 500 1000 1500 2000 2500 3000
0.0
0.4
0.8
Longer Term Chartists
Trading Days
Pop
ulat
ion
0 500 1000 1500 2000 2500 3000
0.0
0.4
0.8
Short Term Fundamentalists
Trading Days
Pop
ulat
ion
0 500 1000 1500 2000 2500 3000
0.0
0.4
0.8
Longer Term Fundamentalists
Trading Days
Pop
ulat
ion
0 20 40 60 80
0.0
0.4
0.8
Lag
AC
F
Autocorrelation of Raw Returns
0 20 40 60 80
0.0
0.4
0.8
Lag
AC
F
Autocorrelation of Absolute Returns
Figure 5: Simulation with a 1 Percent Transaction Tax
Note: Simulation of 3000 artificial trading days. The underlying parameter values are κf = κc =0.04, N = 30, γ = 800, d = 0.975, σf = 0.01, σc = 0.03 and σs = 0.02. The fundamental value isnormalized to zero. The transaction tax rate is 1 percent. Distortion is measured as the absolutevalue of the deviation of the exchange rate from its fundamental value.
● ● ● ● ● ● ● ● ● ●
0.000 0.002 0.004 0.006 0.008
−0.
015
0.00
00.
015
Mean
Tax Rate
Mea
n
●
●● ● ● ● ● ● ● ●
0.000 0.002 0.004 0.006 0.008
0.01
00.
013
Standard Deviation
Tax Rate
Sta
ndar
d D
evia
tion
●
● ● ● ● ● ● ● ● ●
0.000 0.002 0.004 0.006 0.008
34
56
7
Kurtosis
Tax Rate
Kur
tosi
s
●●
●
●
●●
●●
●●
0.000 0.002 0.004 0.006 0.008
0.00
0.10
0.20
Short−Term Fundamentalists
Tax Rate
Sho
rt−
Term
Fun
dam
enta
lists
●
●
●● ● ● ● ● ● ●
0.000 0.002 0.004 0.006 0.008
0.00
0.10
0.20
Short−Term Chartists
Tax Rate
Sho
rt−
Term
Cha
rtis
ts
●
●●
●● ● ● ● ● ●
0.000 0.002 0.004 0.006 0.008
0.10
0.25
0.40
Inactive Traders
Tax Rate
Inac
tive
Trad
ers
● ●●
● ● ● ● ● ● ●
0.000 0.002 0.004 0.006 0.008
0.15
0.25
0.35
Long−Term Fundamentalists
Tax Rate
Long
−Te
rm F
unda
men
talis
ts
●
●
●●
● ● ● ● ● ●
0.000 0.002 0.004 0.006 0.008
0.15
0.25
0.35
Long−Term Chartists
Tax Rate
Long
−Te
rm C
hart
ists
●
●● ● ● ● ● ● ● ●
0.000 0.002 0.004 0.006 0.008
0.01
00.
020
Distortion
Tax Rate
Dis
tort
ion
Figure 6: The Effectiveness of Small Currency Transaction Taxes
Note: The numbers and statistics of this figure are averages over 5000 artificial trading days over100 artificial markets. They can be interpreted as averages over time and markets. Note that allsimulations for different values of the transaction tax rate are based on the same seed of randomvariables. The underlying parameter values are κf = κc = 0.04, N = 30, γ = 800, d = 0.975,σf = 0.005, σc = 0.03 and σs = 0.01. The fundamental value is normalized to zero. Distortion isdefined as the average absolute deviation of the exchange rate from its fundamental value.
www.economics-ejournal.org
20 Economics Discussion Paper
● ● ● ● ● ● ● ● ● ●
0.010 0.015 0.020 0.025 0.030 0.035
−0.
015
0.00
00.
015
Mean
Tax Rate
Mea
n
● ● ● ● ● ● ● ● ● ●
0.010 0.015 0.020 0.025 0.030 0.035
0.01
000.
0115
0.01
30
Standard Deviation
Tax Rate
Sta
ndar
d D
evia
tion
● ● ● ● ● ● ● ● ● ●
0.010 0.015 0.020 0.025 0.030 0.035
2.5
3.5
4.5
Kurtosis
Tax Rate
Kur
tosi
s
●● ● ● ● ● ● ● ● ●
0.010 0.015 0.020 0.025 0.030 0.035
0.00
0.10
0.20
Short−Term Fundamentalists
Tax Rate
Sho
rt−
Term
Fun
dam
enta
lists
● ● ● ● ● ● ● ● ● ●
0.010 0.015 0.020 0.025 0.030 0.035
0.00
0.10
0.20
Short−Term Chartists
Tax Rate
Sho
rt−
Term
Cha
rtis
ts●
●●
● ● ● ● ● ● ●
0.010 0.015 0.020 0.025 0.030 0.035
0.20
0.30
0.40
Inactive Traders
Tax Rate
Inac
tive
Trad
ers
● ●●
●●
●●
●●
●
0.010 0.015 0.020 0.025 0.030 0.035
0.20
0.30
0.40
Long−Term Fundamentalists
Tax Rate
Long
−Te
rm F
unda
men
talis
ts
●●
● ● ● ● ● ● ● ●
0.010 0.015 0.020 0.025 0.030 0.035
0.20
0.30
0.40
Long−Term Chartists
Tax Rate
Long
−Te
rm C
hart
ists
● ●●
●●
●●
●●
●
0.010 0.015 0.020 0.025 0.030 0.035
0.01
10.
013
0.01
5
Distortion
Tax Rate
Dis
tort
ion
Figure 7: The Effectiveness of Higher Currency Transaction Taxes
Note: The numbers and statistics of this figure are averages 5000 artificial trading days over100 artificial markets. They can be interpreted as averages over time and markets. Note that allsimulations for different values of the transaction tax rate are based on the same seed of randomvariables. The underlying parameter values are κf = κc = 0.04, N = 30, γ = 800, d = 0.975,σf = 0.005, σc = 0.03 and σs = 0.02. The fundamental value is normalized to zero. Distortion isdefined as the average absolute deviation of the exchange rate from its fundamental value.
the tax has no effect on the kurtosis of the exchange rate return distribution. Thereason for this can be inferred from the change in the composition of used tradingrules. The number of short-term chartists and short-term fundamentalists decreasesto zero on average, while the number of longer-term chartists and longer-term fun-damentalists is increasing. Moreover, the number of inactive traders is increasingbecause some short-term traders decide not to trade because the transaction costsare higher than the returns of trading in the foreign exchange market. This is alsothe reason why the kurtosis of the exchange rate return distribution is not increas-ing. Suppose that all short-term traders switch to the longer-term trading strategies.This change in behavior will result in the fact that some traders place larger ordersevery 30 days instead of placing small orders every day. Because returns are pro-portional to market demand in our model, larger orders in a 30 days cycle lead tomore frequent large returns and thus to a larger kurtosis of the return distribution.In the artificial foreign exchange market proposed by [Demary, M. (2008)] a lot oftraders change from short-term trading to longer term trading instead of becominginactive. Therefore, the kurtosis of the exchange rate distribution increases in hissimulations, which means a higher probability of large positive and negative returns.In the model presented here, however, enough short-term traders decide not to tradeinstead of becoming longer-term traders, which leads to the observed negligible ef-fect of transaction taxes on the extreme parts of the return distribution measuredby the kurtosis.
Figure 7 contains summary results for tax rates between 1 and 4 percent. As
www.economics-ejournal.org
Economics Discussion Paper 21
one can see, higher tax rates have no significant impact on the standard deviationand the kurtosis of the exchange rate returns. Within this interval for the taxrate the number of short-term chartists is zero, while the number of short-termfundamentalists declines to zero. For tax rates above 2.5 percent there are no short-term fundamentalists in the market. The number of inactive traders is monotonicallyincreasing under these tax scenarios and lies between 30 and 40 percent. Whenthe tax rate takes the value 4 percent, then 40 percent of the artificial tradersdecide not to trade. Moreover, it can be inferred that the number of longer termfundamentalists is decreasing under rising tax rates. While more than 30 percent ofall traders use the longer term fundamentalist strategy for a tax rate of 1 percent,only 20 percent use this strategy for a tax rate of 4 percent. However, higher taxrates lead to a higher popularity of the longer term chartist trading rule. Undera 1 percent transaction tax approximately 30 percent of all traders use the longerterm chartist rule, while approximately 40 percent use the chartist rule under atax rate of 4 percent. The reason for the increasing popularity of the chartist ruleis the following. Short term trading is prohibitively costly under these high taxrates. When there is no short-term trading, then high frequency fluctuations in theexchange rate are absent and longer lasting trends emerge. When there are longerlasting trends with less noise, then the longer term chartist forecasting techniquebecomes more precise and therefore more agents prefer to choose the chartist tradingrule. Similar, longer term fundamentalist rules become more unprecise when theexchange rate exhibits longer lasting trends. As a result, which emerges from thechanged composition of used trading rules, distortion is rising under higher tax rates.The reason is, that under higher tax rates chartist rules are more frequently usedcompared to fundamentalist trading rules. A similar result can also be found in[Westerhoff, F. (2003)]. Furthermore, it can be inferred from Figure 7, that highertax rates do not have any significant impact on volatility because the number ofshort-term traders is zero. In contrast to [Demary, M. (2008)] higher tax rates donot have any impact on the kurtosis of the return distribution. As explained above,the kurtosis is increasing in his model because a lot of short-term traders decideto become longer term traders. This results in a higher frequency of larger orderswhich leads to a higher kurtosis of the return distribution. In this model, however, 40percent of all traders decide not to trade instead of becoming longer term traders.Thus, higher tax rates have no significant impact on the kurtosis of the returndistribution here.
5.2 Simulations under Fundamental Risk
In Figure 8 the fundamental exchange rate is assumed to follow a random walksf
t+1 = sft + 0.01εt+1, where εt is standard normally distributed fundamental news.
When the fundamental rate follows a random walk, then the fundamental-basedtrading strategies becomes more risky. The reason is that fundamentalists can onlyassume that the exchange rate changes in order to correct to the fundamental ratesf
t , because it is the best forecast of the uncertain future fundamental rate sft+N .
When there is a large fundamental innovation, then fundamentalists make a largeprediction error. As a consequence, fundamentalists lose money which may result in
www.economics-ejournal.org
22 Economics Discussion Paper
a higher popularity of chartist rules for the next period. [Brunnermeier, M. (2001)]notes that this fundamental risk limits arbitrage and in this way leads to persistentspeculative bubbles. From Figure 8 can be inferred, that similar to the simulationswithout fundamental risk most of the chartist traders are short term traders, whilemost of the fundamentalists are long term traders. Again, periods with a cleardominance of chartist traders correspond to periods with large fluctuations in theexchange rate and large misalignments. These periods are followed by longer cor-rection periods with a clear dominance of longer term fundamentalist traders. Theemergent properties are again excess kurtosis of the return distribution and volatilityclustering, which can be inferred from the slowly decaying autocorrelations of abso-lute returns. In contrast to the simulations without fundamental risk, raw returnsseem to exhibit more persistent autocorrelations.
0 500 1000 1500 2000 2500 3000
−2
−1
01
2
Exchange Rate
Trading Days
Exc
hang
e R
ate
0 500 1000 1500 2000 2500 3000
0.0
0.2
0.4
Distortion
Trading Days
Dis
tort
ion
0 500 1000 1500 2000 2500 3000
−0.
050.
05
Return
Trading Days
Ret
urn
0 500 1000 1500 2000 2500 3000
0.0
0.4
0.8
Short Term Chartists
Trading Days
Pop
ulat
ion
0 500 1000 1500 2000 2500 3000
0.0
0.4
0.8
Longer Term Chartists
Trading Days
Pop
ulat
ion
0 500 1000 1500 2000 2500 3000
0.0
0.4
0.8
Short Term Fundamentalists
Trading Days
Pop
ulat
ion
0 500 1000 1500 2000 2500 3000
0.0
0.4
0.8
Longer Term Fundamentalists
Trading Days
Pop
ulat
ion
0 20 40 60 80
0.0
0.4
0.8
Lag
AC
F
Autocorrelation of Raw Returns
0 20 40 60 80
0.0
0.4
0.8
Lag
AC
F
Autocorrelation of Absolute Returns
Figure 8: Simulation with Fundamental Risk and no Transaction Taxes
Note: Simulation of 3000 artificial trading days. The underlying parameter values are κf = κc =0.04, N = 30, γ = 800, d = 0.975, σf = 0.005, σc = 0.03 and σs = 0.02. The fundamental value isnormalized to zero. The transaction tax rate is 0 percent.
Figure 9 contains simulation results of our artificial foreign exchange market withfundamental risk in which a policy maker introduces a currency transaction tax rateof 0.5 percent. Under taxation short term chartism becomes unprofitable, thus, thenumber of traders who use this trading rule becomes zero over the whole simulationhorizon. In reaction to missing chartists misalignment diminish, which is the reasonfor the diminishing periods with a clear dominance of longer term fundamentaltraders. Short term fundamentalism also becomes unprofitable, however, longerterm chartism rises in popularity compared to the case without taxation. Emergentproperties from this changed interaction are diminishing autocorrelations of rawreturns and diminishing autocorrelations of absolute returns. Thus, under taxationvolatility clusters diminish. Moreover, the misaligments decrease in amplitude.
www.economics-ejournal.org
Economics Discussion Paper 23
0 500 1000 1500 2000 2500 3000
−2
−1
01
2
Exchange Rate
Trading Days
Exc
hang
e R
ate
0 500 1000 1500 2000 2500 3000
0.0
0.2
0.4
Distortion
Trading Days
Dis
tort
ion
0 500 1000 1500 2000 2500 3000
−0.
050.
05
Return
Trading Days
Ret
urn
0 500 1000 1500 2000 2500 3000
0.0
0.4
0.8
Short Term Chartists
Trading Days
Pop
ulat
ion
0 500 1000 1500 2000 2500 3000
0.0
0.4
0.8
Longer Term Chartists
Trading Days
Pop
ulat
ion
0 500 1000 1500 2000 2500 3000
0.0
0.4
0.8
Short Term Fundamentalists
Trading Days
Pop
ulat
ion
0 500 1000 1500 2000 2500 3000
0.0
0.4
0.8
Longer Term Fundamentalists
Trading Days
Pop
ulat
ion
0 20 40 60 80
0.0
0.4
0.8
Lag
AC
F
Autocorrelation of Raw Returns
0 20 40 60 80
0.0
0.4
0.8
Lag
AC
F
Autocorrelation of Absolute Returns
Figure 9: Simulation with Fundamental Risk and a 0.5 percent Transaction Tax
Note: Simulation of 3000 artificial trading days. The underlying parameter values are κf = κc =0.04, N = 30, γ = 800, d = 0.975, σf = 0.005, σc = 0.03 and σs = 0.02. The fundamental value isnormalized to zero. The transaction tax rate is 0.5 percent. Distortion is defined as the absolutedeviation of the exchange rate from its fundamental value.
Figure 10 contains figures with summary statistics over 100 simulation runs ofsize 5000. These can be interpreted as statistics over a panel of 100 artificial marketsand 5000 trading days. These summary statistics are plotted for different values ofthe currency transaction tax rate. Similar to other configurations taxation does notchange average daily returns. The standard deviation of returns and the kurtosis ofthe return distribution are decreasing under taxation. The lower kurtosis measureis due to the diminishing volatility clusters under taxation. Taxation of round tripsincreases the costs of speculation. In response the number of inactive traders isincreasing in the transaction tax rate. As already indicated in Figure 8, the numberof short term fundamentalists and short term chartists are decreasing in the tax rate,while the number of longer term chartists and longer term fundamentalists is at leastfor small tax rates increasing. Note, that the response of longer term fundamentalisttraders is hump-shaped again. For tax rates below 0.5 percent the number of longerterm term fundamentalists is increasing, while fundamentalists decrease in numberwhen transaction taxes are higher than 0.5 percent. However, the number of longerterm chartist traders is monotonically increasing in the currency transaction taxrate. The rationale is the following. Under taxation the number of short-termtraders decrease in magnitude, which leads to less short-term fluctuations in theexchange rate. Thus, longer lasting trends in the exchange rate emerge, which makethe longer term chartist trading rule more profitable compared to the longer termfundamentalist rule. As can be inferred from Figure 11 misalignments increase fortax rates above 2 percent. This u-shaped response of misalignment are similar to
www.economics-ejournal.org
24 Economics Discussion Paper
● ● ● ● ● ● ● ● ● ●
0.000 0.005 0.010 0.015 0.020
−0.
015
0.00
00.
015
Mean
Tax Rate
Mea
n
●
● ● ● ● ● ● ● ● ●
0.000 0.005 0.010 0.015 0.020
0.00
60.
012
Standard Deviation
Tax Rate
Sta
ndar
d D
evia
tion
●
● ● ● ● ● ● ● ● ●
0.000 0.005 0.010 0.015 0.020
46
810
Kurtosis
Tax Rate
Kur
tosi
s
●
●
●
●●
●● ● ● ●
0.000 0.005 0.010 0.015 0.020
0.00
0.10
0.20
Short−Term Fundamentalists
Tax Rate
Sho
rt−
Term
Fun
dam
enta
lists
●
● ● ● ● ● ● ● ● ●
0.000 0.005 0.010 0.015 0.020
0.00
0.10
0.20
Short−Term Chartists
Tax Rate
Sho
rt−
Term
Cha
rtis
ts
●
●●
●● ● ● ● ● ●
0.000 0.005 0.010 0.015 0.020
0.15
0.30
0.45
Inactive Traders
Tax Rate
Inac
tive
Trad
ers
●
● ● ● ● ● ●●
●●
0.000 0.005 0.010 0.015 0.020
0.15
0.25
0.35
Long−Term Fundamentalists
Tax Rate
Long
−Te
rm F
unda
men
talis
ts
●
●
●●
●● ● ● ● ●
0.000 0.005 0.010 0.015 0.020
0.15
0.25
0.35
Long−Term Chartists
Tax RateLo
ng−
Term
Cha
rtis
ts
●
● ● ● ● ● ● ● ● ●
0.000 0.005 0.010 0.015 0.020
0.00
00.
015
0.03
0
Distortion
Tax Rate
Dis
tort
ion
Figure 10: The Effectiveness of Small Transaction Taxes under Fundamental Risk
Note: The numbers and statistics of this figure are averages over 5000 artificial trading days over100 artificial markets. They can be interpreted as averages over time and markets. Note that allsimulations for different values of the transaction tax rate are based on the same seed of randomvariables. The underlying parameter values are κf = κc = 0.04, N = 30, γ = 800, d = 0.975,σf = 0.005, σc = 0.03 and σs = 0.02. Distortion is defined as the average absolute deviation of theexchange rate from its fundamental value.
www.economics-ejournal.org
Economics Discussion Paper 25
● ● ● ● ● ● ● ● ● ●
0.020 0.025 0.030 0.035 0.040
−0.
015
0.00
00.
015
Mean
Tax Rate
Mea
n
● ● ● ● ● ● ● ● ● ●
0.020 0.025 0.030 0.035 0.040
0.00
400.
0055
0.00
70
Standard Deviation
Tax Rate
Sta
ndar
d D
evia
tion
● ● ● ● ● ● ● ● ● ●
0.020 0.025 0.030 0.035 0.040
46
810
Kurtosis
Tax Rate
Kur
tosi
s
● ● ● ● ● ● ● ● ● ●
0.020 0.025 0.030 0.035 0.040
0.00
0.10
0.20
Short−Term Fundamentalists
Tax Rate
Sho
rt−
Term
Fun
dam
enta
lists
● ● ● ● ● ● ● ● ● ●
0.020 0.025 0.030 0.035 0.040
0.00
0.10
0.20
Short−Term Chartists
Tax Rate
Sho
rt−
Term
Cha
rtis
ts
● ● ● ● ● ● ● ● ● ●
0.020 0.025 0.030 0.035 0.040
0.15
0.30
0.45
Inactive Traders
Tax Rate
Inac
tive
Trad
ers
● ● ●● ●
● ● ●● ●
0.020 0.025 0.030 0.035 0.040
0.15
0.30
0.45
Long−Term Fundamentalists
Tax Rate
Long
−Te
rm F
unda
men
talis
ts
● ● ● ● ● ● ● ● ● ●
0.020 0.025 0.030 0.035 0.040
0.15
0.30
0.45
Long−Term Chartists
Tax RateLo
ng−
Term
Cha
rtis
ts
● ● ●
●●
●
●●
●●
0.020 0.025 0.030 0.035 0.040
0.00
0.02
0.04
Distortion
Tax Rate
Dis
tort
ion
Figure 11: The Effectiveness of Higher Transaction Taxes under Fundamental Risk
Note: The numbers and statistics of this figure are averages over 5000 artificial trading days over100 artificial markets. They can be interpreted as averages over time and markets. Note that allsimulations for different values of the transaction tax rate are based on the same seed of randomvariables. The underlying parameter values are κf = κc = 0.04, N = 30, γ = 800, d = 0.975,σf = 0.005, σc = 0.03 and σs = 0.01. Distortion is defined as the average absolute deviation of theexchange rate from its fundamental value.
www.economics-ejournal.org
26 Economics Discussion Paper
[Westerhoff, F. (2003)] due to the fact that the number of longer term chartists isincreasing in the transaction tax rate, while the number of fundamentalists rises forsmall tax rates, while the popularity of this trading strategy decreases in numberfor higher tax rates.
6 Conclusion
Agent-based models with heterogeneous interacting agents are powerful tools foreconomic policy analysis. Their success in replicating stylized facts of financial mar-kets data like bubbling and crashing asset prices, non-predictability of returns, ex-cessively high volatilities of returns, excessively high probabilities of extreme largeabsolute returns and volatility clustering makes them preferable tools for analyz-ing regulations in financial markets. The empirical stylized facts emerge withinagent-based models from the interaction of heterogeneous traders. By affecting theindividual agents decisions by market regulations, these regulations have effects onemergent properties like the ones cited before which cannot simply be deduced byaggregating over individual agents.
Within this paper we introduced longer term traders as proposed by [Demary, M. (2008)]into the foreign exchange market model proposed by [Westerhoff, F. (2008a)]. Ourfirst result is that the stylized facts of financial market data also emerge when longerterm traders are introduced into these models. Because our model is able to repro-duce stylized facts of financial market data, we regard is as validated by the Lux-Westerhoff criteria ([Lux, T. (2009b)] and [Westerhoff, F. (2008a)]). The success ofthis artificial foreign exchange market in replicating stylized facts of foreign exchangemarket data makes it a powerful tool for analyzing regulatory policies, like the in-troduction of currency transaction taxes here. In detail, we wanted to analyze thefollowing proposition which is often heard from the proponents of financial markettaxes and the public media in times of financial instability: transaction taxes stabi-lize asset prices by crowding out short-term traders in favor of longer term investors.The economic policy analysis leads to the following results. Small transaction taxesmake short-term trading unprofitable. Therefore, the number of short-term funda-mentalists and short-term chartists decreases to zero. One emergent property of thischange in behavior are the diminishing volatility clusters. Moreover, volatility anddistortions decrease under small transaction taxes. The reason for this result liesin the fact that under small transaction taxes the market is populated by a highernumber of longer term fundamentalist traders compared to longer term chartisttraders. However, when tax rates are too high, misalignments increase as also foundin [Westerhoff, F. (2003)]. The reason for this u-shaped response of misaligmentsto increasing tax rates is caused by the changed composition of used trading rules.In his model tax rates above a certain threshold make fundamental trading un-profitable relative to trend-chasing trading. Within our artificial foreign exchangemarket a similar result emerges. Here, the longer term fundamentalist trading rulebecomes unpopular under tax rates above a certain threshold, while the number oftraders, who favor the longer term chartist trading rule increases. In contrast to[Keynes, J. M. (1936)] and [Tobin, J. (1978)] taxing financial markets is not per sestabilizing by making short-term trading unprofitable in favor of longer term trad-
www.economics-ejournal.org
Economics Discussion Paper 27
ing. Our model shows that this result is not independent of the composition of theused trading rules in the financial market and not independent of the tax rate.
This model shows that taxing financial markets has complex effects caused by be-havioral heterogeneity and interaction of agents and therefore policy makers shouldpay attention on recent research in the area of agent-based financial market mod-els. Within a world in which heterogeneous agents interact the effects of currencytransaction taxes are complex and their effects on markets emerge from the changein the composition of popular trading rules in the market. The stabilizing or desta-bilizing effects of regulatory policies thus emerge by changing the composition ofused trading rules. This study and [Westerhoff, F. (2003)] come to the result thatthere is a threshold tax rate where transaction taxes becomes destabilizing. Be-cause this threshold is not known in reality introducing a tax rate on financialtransactions which is above this threshold may have destabilizing effects. More-over, when a policy maker wants to set a tax rate below this threshold, he or shehas to consider other transaction costs in the financial market. Therefore, the taxthreshold might be lower in reality due to additional transaction costs. Furthermore,[Demary, M. (2008)] finds that the kurtosis of the return distribution may increasedue to taxation because agents trade large orders instead of a sequence of smallerorders. This results may also emerge in similar agent-based financial market models,when it is more profitable for traders to change to longer term trading rules insteadof deciding not to trade. Furthermore [Pelizzari, P. and F. Westerhoff (2007)] findthat the effectiveness of transaction taxes depends on the underlying market mi-crostructure. During phases of financial instability policy makers are often temptedto the introduction of financial market taxes. Recent research, like this study andthe papers cited therein show, that changes in the composition in trading rules hasimportant consequences for the effectiveness of financial market taxes. Thereforepolicy makers should be aware of setting the wrong tax rate. The Swedish expe-rience with transaction taxes was caused by tax rates, which were simply set toohigh. Agent-based models may therefore give important insights into the workingof financial market regulations.
www.economics-ejournal.org
28 Economics Discussion Paper
References
[Alfarano, S., T. Lux and F. Wager (2005)] , ”Estimation of Agent-Based Models:The Case of an Asymmetric Herding Model”, Computational Economics, Vol.26, 19-49.
[Aliber R., B. Chowdry and S. Yan (2005)] , ”Some Evidence that a Tobin Tax onForeign Exchange Transactions May Increase Volatility”, European Finance Re-view, Vol. 7, 481-510.
[Axelrod, R. and L. Tesfatsion (2006)] , ”A Guide for Newcomers to Agent-BasedModelling in the Social Sciences”, in: L. Tesfatsion and K. Judd (eds.), ”Hand-book of Computational Economics, Vol. 2: Agent-Based Computational Eco-nomics”, North Holland, Amsterdam.
[Bikhchandani, S., D. Hirshleifer and I. Welch (1992)] , ”A Theory of Fads, Fash-ion, Custom and Cultural Change as Informational Cascades”, Journal of Polit-ical Economy, Vol 100(5), 992-1026.
[Boswijk, P., C. Hommes and S. Manzan (2007)] , ”Behavioral Heterogeneity inStock Prices”, Journal of Economi Dynamics and Control, Vol. 31, 1938-1970.
[Brock, W. and C. Hommes (1998)] , ”Heterogeneous Beliefs and Routes to Chaosin a Simple Asset Pricing Model”, Journal of Economic Dynamics and Control,Vol. 22, 1235-1274.
[Brunnermeier, M. (2008)] , ”Bubbles”, in: Durlauf, Steven and Lawrence Blume(eds.), ”The New Palgrave Dictionary of Economics”, 2nd Edition, PalgraveMacmillan, 2008.
[Brunnermeier, M. (2001)] , ”Asset Pricing under Asymmetric Information: Bub-bles, Crashes, Technical Analysis and Herding”, Oxford University Press, Ox-ford.
[Chiarella, C. (1992)] , ”The Dynamics of Speculative Behavior”, Annals of Opera-tions Research, Vol. 37, 101-123.
[Chiarella, C. and X. He (2002)] , ”An Adaptive Model of Asset Pricing and WealthDynamics with Heterogeneous Trading Strategies”, Computing in Economicsand Finance, Vol. 135, Society for Computational Economics.
[Day, R. and W. Huang (1990)] , ”Bulls, Bear and Market Sheep”, Journal of Eco-nomic Behavior and Organization, Vol. 14, 299-329.
[DeGrauwe, P. and M. Grimaldi (2006)] , ”Exchange Rate Puzzles: A Tale ofSwitching Attractors”, European Economic Review, Vol. 50, 1-33.
[Cheung, Y.-W. and C. Wong (2000)] ”A Survey of Market Practitioners’ Views onExchange Rate Dynamics”, Journal of International Economics, Vol. 51(2), 401-419.
[Cheung, Y.-W. and M. Chinn (2001)] ”Currency Traders and Exchange Rate Dy-namics”, Journal of International Money and Finance, Vol. 20(4), 459-471.
[Colander, D. (2009)] , ”The Macroeconomy in 2009: Financial Crises, Panicsand Macroeconomic Policy”, Manuscript, Middlebury College, available under:https://segue.middlebury.edu/sites/colander, 7th October 2009.
[DeLong, B., A. Shleifer, L. Summers and R. Waldman (1990)] , ”Noise TraderRisks in Financial Markets”, Journal of Political Economy, Vol. 98(4), 703-738.
[Demary, M. (2008)] , ”Who Does a Currency Transaction Tax Harm More: Short-term Speculators or Long-term Investors?”, Jahrbucher fur Nationalokonomieund Statistik, Vol. 228, 228-250.
[Engel, C. and J. Hamilton (2000)] , ”Long Swings in the Dollar. Are They in theData and Do the Markets Know It?”, American Economic Review, Vol. 80, 689-713.
[Fama, E. (1970)] Fama, Eugene (1970), ”Efficient Capital Markets: A Review ofTheory and Empirical Work”, Journal of Finance, Vol. 45, 383-417.
[Farmer, D. and S. Joshi (2002)] , ”The Price Dynamics of Common TradingStrategies”, Journal of Economic Behavior and Organization, Vol. 49, 149-171.
[Franke, R. and F. Westerhoff (2009)] , ”Validation of a Structural StochasticVolatility Model of Asset Pricing”, Working Paper.
[Garber, P. (1990)] , ”Famous First Bubbles”, Journal of Economic Perspectives,Vol. 4(2), 35-54.
[Gehrig, T. and L. Menkhoff (2004)] ”The Use of Flow Analysis in Foreign Ex-change: Exploratory Evidence”, Journal of International Money and Finance,Vol. 23(4), 573-594.
[Gilli, M. and P. Winker (2003)] , ”A Global Optimization Heuristic for EstimatingAgent-Based Models”, Computational Statistics and Data Analysis, Vol. 42, 299-312.
[Ghongadze, J. and T. Lux (2009)] , ”Modelling the Dynamics of EU EconomicSentiment Indicators: An Interaction-Based Approach”, Kiel Working PapersNo. 1482, Kiel Institute for the World Economy.
[Grimaldi, M. (2004)] , ”The Exchange Rate, Heterogeneity of Agents and BoundedRationality”, Dissertation, Katholieke Universiteit Leuven.
[Haber, G. (2008)] , ”Monetary and Fiscal Policy Analysis With an Agent-BasedMacroeconomic Model”, Jahrbucher fur Nationalokonomie und Statistik, Vol.228(2+3), 276-295.
[Hau, H. (2006)] , ”The Role of Transaction Costs for Financial Volatility: Evidencefrom the Paris Bourse”, Journal of the European Economic Association, Vol. 4,862-890.
[Hommes, C. (2006)] , ”Heterogeneous Agents Models in Economics and Finance”,in: L. Tesfatsion and K. Judd (eds.), ”Handbook of Computational Economics,Vol. 2: Agent-Based Computational Economics”, North-Holland, Amsterdam,1107-1186.
[Jones, C. and P. Seguin (1997)] , ”Transaction Costs and Price Volatility: Evi-dence from Commission Deregulation”, American Economic Review, Vol. 87,728-737.
[Keynes, J. M. (1936)] , ”The General Theory of Employment, Interest andMoney”, New York.
[Kirman, A. (1991)] , ”Epidemics of Opinion and Speculative Bubbles in FinancialMarkets”, in: Taylor, M. (ed.), ”Money and Financial Markets”, Oxford, 354-386.
[LeBaron, B. (1999)] , ”Technical Trading Rule Profitability and Foreign ExchangeIntervention”, Journal of International Economics, Vol. 49, 125-143.
[LeBaron, B. (2006)] , ”Agent-Based Computational Finance”, in: in: L. Tesfatsionand K. Judd (eds.), ”Handbook of Computational Economics, Vol. 2: Agent-Based Computational Economics”, North-Holland, Amsterdam, 1187-1233.
[LeRoy, S. and R. Porter (1981)] , ”The Present Value Relation: Tests Based onImplied Variance Bounds”, Econometrica, Vol. 64, 555-574.
[Lui, Y.-H. and D. Mole (1998)] , ”The Use of Fundamental and Technical Analysisfor Foreign Exchange Dealers: Hong Kong Evidence”, Journal of InternationalMoney and Finance, Vol. 17, 535-545.
[Lux, T. (1995)] , ”Herd Behavior, Bubbles and Crashes”, Economic Journal, Vol.105, 881-896.
[Lux, T. and M. Marchesi (1999)] , ”Scaling and Criticality in a Stochastic Multi-Agent of a Financial Market”, Nature, Vol. 397, 498-500.
[Lux, T. and M. Marchesi (2000)] , ”Volatility Clustering in Financial Markets: AMicrosimulation of Interacting Agents”, International Journal of Finance andEconomics, Vol. 3, 675-702.
[Lux, T. (2006)] , ”Rational Forecasts or Social Opinion Dynamics? Identificationof Interaction Effects in a Business Climate Survey”, Manuscript, University ofKiel.
[Lux, T. (2009a)] , ”Applications of Statistical Physics in Finance and Economics”,in: Rosser, J.B., Jr. (ed.)
[Lux, T. (2009b)] , ”Stochastic Behavioral Asset Pricing Models and the StylizedFacts”, in: Hens, Thorsten and Klaus Schenk-Hoppe (eds.) ”Handbook of Finan-cial Markets: Dynamics and Evolution”, North Holland: Amsterdam, 161-211.
[Manski, C. and D. McFadden (1981)] , ”Structural Analysis of Discrete Data withEconometric Applications”, Cambridge.
[Manzan, S. and F. Westerhoff (2007)] , ”Heterogeneous Expectations, ExchangeRate Dynamics and Predictability”, Journal of Economic Behavior and Organi-zation, Vol. 64, 111-128.
[Menkhoff, L. (1997)] , ”Examining the Use of Technical Analysis”, InternationalJournal of Finance and Economics, Vol. 2, 307-318.
[Menkhoff, L. and M. Taylor (2007)] ”The Obstinate Passion of Foreign ExchangeProfessionals: Technical Analysis”, Journal of Economic Literature, Vol. XLV(December), 936-972.
[Oberlechner, T (2001)] ”Importance of Technical and Fundamental Analysis in theEuropean Foreign Exchange Market”, International Journal of Finance and Eco-nomics, Vol. 6(1), 81-93.
[Pelizzari, P. and F. Westerhoff (2007)] , ”Some Effects of Transaction Taxes un-der Different Market Microstructures”, Quantitative Finance Research Center,Research Paper 212.
[R Development Core Team (2009)] , ”R: A Language and Environment for Sta-tistical Computing”, R Foundation for Statistical Computing, Vienna, Austria,http://www.R-project.org.
[Shiller, R. (1981)] , ”Do Stock Prices Move to Much to be Justified by subsequentChanges in Dividents”, American Economic Review, Vol. 71(3), 421-436.
[Shiller, R. (2001)] , ”Exuberant Reporting: Media and Misinformation in the Mar-kets”, Harward International Review, Vol. 23(1), Spring.
[Shiller, R. (2007)] , ”Understanding Recent Trends in House Prices and HomeOwnership”, Paper presented at the Symposium ”Housing, Housing Financeand Monetary Policy” of the Federal Reserve Bank of Kansas City in JacksonHole, Wyoming, 31th August 2007.
[Shleifer, A. and R. Vishny (1997)] , ”The Limits to Arbitrage”, Journal of Fi-nance, Vol. 52(1), 35-55.
[Taylor, M. and H. Allen (1992)] , ”The Use of Technical Analysis in the ForeignExchange Market”, Journal of International Money and Finance, vol. 11, 304-314.
[Thomson, E. (2007)] , ”The Tulipmania: Fact or Artefact”, Public Choice, Vol.130(1-2), 99-114.
[Tobin, J. (1978)] , ”A Proposal for International Monetary Reform”, Eastern Eco-nomic Journal, Vol. 4, 153-159.
[Umlauf, S. (1993)] , ”Transaction Taxes and the Behavior of the Swedish StockMarket”, Journal of Financial Economics, Vol. 33, 227-240.
[Weidlich, A. and D. Veit (2008)] , ”Agent-Based Simulations for Electricity Mar-ket Regulation Advice: Procedures and An Example”, Jahrbucher fur Na-tionalokonomie und Statistik, Vol. 228 (2+3), 149-172.
[Westerhoff, F. (2003)] , ”Heterogeneous Traders and the Tobin Tax”, Journal ofEvolutionary Economics, Vol. 13, 53-70.
[Westerhoff, F. (2003b)] , ”Speculative Markets and the Effectiveness of Price Lim-its”, Journal of Economic Dynamics and Control, Vol. 28, 493-508.
[Westerhoff, F. (2001)] , ”Speculative Behavior, Exchange Rate Volatility and Cen-tral Bank Interventions”, Central Europan Journal of Operations Research, Vol.9, 31-50.
[Westerhoff, F. (2006)] , ”Technical Analysis based on Price-Volume Signal and thePower of Trading Breaks”, International Journal of Theoretical and Applied Fi-nance, Vol. 9, 227-244.
[Westerhoff, F. and C. Wieland (2004)] , ”Spillover Dynamics of Central Bank In-terventions”, German Economic Review, Vol. 5, 435-450.
[Westerhoff, F. and S. Reitz (2003)] , ”Nonlinearities and Cyclical Behavior: TheRole of Chartists and Fundamentalists”, Studies in Nonlinear Dynamics andEconometrics, Vol. 7 (Issue 4, Article 3).
[Westerhoff, F. and R. Dieci (2006)] , ”The Effectiveness of Keynes-Tobin Trans-action Taxes when Heterogeneous Agents Can Trade in Different Markets: ABehavioral Finance Approach”, Journal of Economic Dynamics and Control,Vol. 30, 293-322.
[Westerhoff, F. (2008a)] , ”The Use of Agent-Based Financial Market Models toTest the Effectiveness of Regulatory Policies”, Jahrbucher fur Nationalokonomieund Statistik, Vol. 228, 195-227.
[Westerhoff, F. (2008b)] , ”Exchange Rate Dynamics: A Nonlinear Survey”, in:Rosser, B. (ed.) Handbook of Complexity Research, Cheltenham.
[Wieland, C. and F. Westerhoff (2005)] , ”Exchange Rate Dynamics, Central BankInterventions and Chaos Control Methods”, Journal of Economic Behavior andOrganization, Vol. 58, 117-132.
[Winker, P., M. Gilli and V. Jeleskovic (2007)] , ”An Objective Function for Simu-lation Based Inference on Exchange Rate Data”, Journal of Economic Interac-tion and Coordination, Vol. 2, 125-145.
You are most sincerely encouraged to participate in the open assessment of this discussion paper. You can do so by either recommending the paper or by posting your comments.


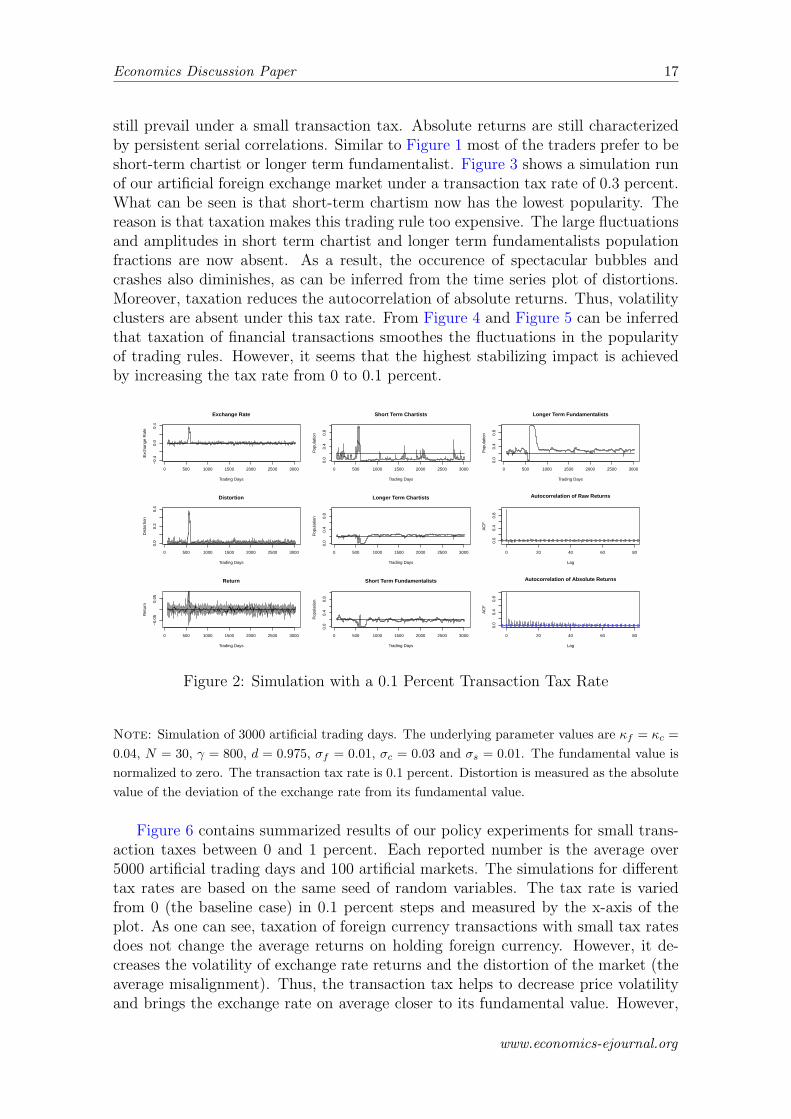


![arXiv:1305.6323v4 [q-fin.TR] 8 Aug 2015the liquidity provided by HFT (High Frequency Traders [Menkveld, 2010]) raised concerns. So did the dispersion of liquidity on such an heterogeneous](https://static.documents.pub/doc/80x56/5ff4e2d391e859745c526904/arxiv13056323v4-q-fintr-8-aug-2015-the-liquidity-provided-by-hft-high-frequency.jpg)


