IL J %-!H«-MXl ' f fcl§ - Vw-t" y v2££ The Nuclear Societies of Israel The Israeli Nuclear Society The Israel Healfh Physics Society Radiation Research Society of Israel The Israel Society of Medical Physics The Israel Society of Nuclear Medicine TRANSACTIONS JOINT ANNUAL MEETING 1978 BEN GURION UNIVERSITY OF THE NEGEV December 28, 1978
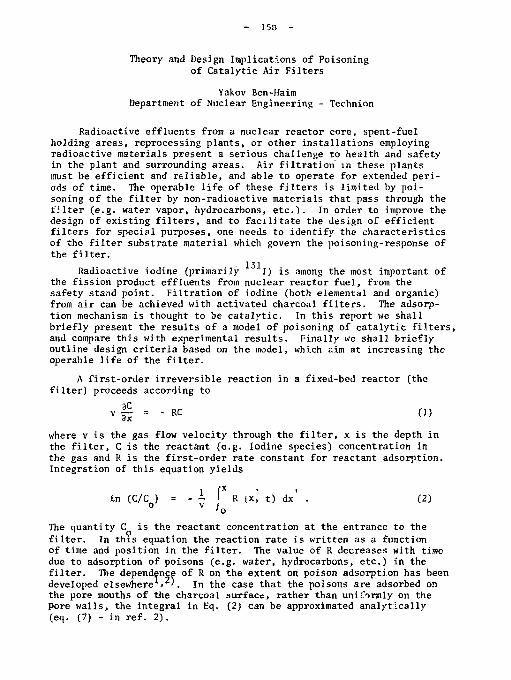
Transcript
IL J %-!H«-MXl ' f fcl§ - Vw-t" yv2££
The Nuclear Societies of Israel
The Israeli Nuclear Society The Israel Healfh Physics Society Radiation Research Society of Israel The Israel Society of Medical Physics The Israel Society of Nuclear Medicine
TRANSACTIONS JOINT ANNUAL MEETING 1978
BEN GURION UNIVERSITY OF THE NEGEV December 28, 1978
Volume 6
The N u c l e a r Soc i e t i e s of I s r ae l
The Israel Nuclear Society The Israel Health Physics Society Radiation Research Society ot Israel The Israel Society of Medical Physics The Israel Society of Nuclear Medicine
TRANSACTIONS JOINT ANNUAL MEETING 1978
BEN GURION UNIVERSITY OF THE NEGEV December 28, 1978
P R O G R A M
0900 Exhibition of Scientific & Technological Equipment 0900-1000 R e g i s t r a t i o n and l i g h t r e f r e s h m e n t
1000-1030 Opening Address: Y. Ronen - Chairman, Org n:'z?'ng Committee M. Rosen - Rector. Ben-C'urJoi: University U. Eilam - Director Gener , Israel Atomic Energy Commission
K.H. Beckurts - President, European Nuclear Society
1030-1215 MEMORIAL LECTURE SERIES IN MEMORY OF Professor Saadia Amiel
Chairman: A. Seroussi - Director General, Nuclear Research Center-Negev In -Memor ia words by E. R i k l i s - Cha i rman , R a d i a t i o n R e s e a r c h S o c i e t y
o f I s r a e l
INVITED REVIEW LECTURES:
C u r r e n t T rends i n R a d i o b i o l o g i c a l A s p e c t s o f Cance r R e s e a r c h E. R i k l i s - N u c l e a r R e s e a r c h C e n t e r - N e g e v &
Ben-Gur ion U n i v e r s i t y
N u c l e a r R e a c t o r s i n t h e Middle E a s t S . Y i f t a h - So req N u c l e a r R e s e a r c h C e n t e r & Techn ion
Thorium as F u e l i n N u c l e a r R e a c t o r s A. Radkowsky - Ben-Gur ion U n i v e r s i t y & T e l - A v i v U n i v e r s i t y
Development i n N u c l e a r Fus ion D. S h v a r t s - N u c l e a r R e s e a r c h C e n t e r - N e g e v
1215-1^400
l!»00-1700
Lunch
PARALLEL CONTRIBUTED SCIENTIFIC SESSIONS
N u c l e a r R e a c t o r Theory and Techno logy Cha i rman : I . R o t h e n s t e i n
R a d i a t i o n A p p l i c a t i o n & R a d i o i s o t o p e s Chai rman: Z. A l f a s s i
R a d i a t i o n R e s e a r c h & R a d i o b i o l o g y Chai rman: N. Degani
R a d i a t i o n i n Medic ine Chai rman: M. Ronen
Health Physics & Protection Cha i rman : A. K u s h e l e v s k y
1700-1720 L i g h t i n g Hanuka Cand le s
1730-1900
PANEL DISCUSSION
Is there an Alternative ti> Nuclear Energy in the State of Israel Rector, Ben-Gurion University of the Negev Israel Atomic Energy Commission Director General, Electricity Board Nuclear Research Center - Negev Ben-Gurion University of the Negev Chairman, Knesset Parliamentary Committee on Ecology
S. Yiftah - President, The Israel Nuclear Society
Moderator: M. Rosen Pane 1: I. Adar
A. Amiad M. Ron Y. Ronen I. Tam i r
This Jo in t Annual Meeting was made poss ib le by the ass i s t ance and generosi ty of the Nuclear Research Center-Negev, and the Ben-Gurion University of the Negev.
ORGANIZING COMMITTEE
Y.Ronen, (Chairman), Ben-Gurion University of the Megev, Department of Nuclear Engineering
Z. A l fass i , A. Kushelevsky, " " " I . Levin, Nuclear Research Center-Negev E. R i k l i s , Nuclear Research Center-Negev M. Ron, Nuclear Research Center-Nepev M. Ronen, Nuclear Research Center-liegev
Editors
Y. Ronen 2. Alfassi A. Kusheleveky E. Riklis
Saadjii Amiel 19J9 - 197X h^ny n'ljo
Professor Saadia Amiel died of bra in cancer on August 8, 1978 in Tel-Aviv, a f t e r almost two years of a heroic f ight against the d isease . Saadia Amiel was since 1959 Head of the Nuclear Chemistry Department at the Soreq Nuclear Pesearch Center , and since 3971 an Adviser to the Minister of Defence and Head of the Long Term Planning Unit in the Ministry. He was also Professor of Nuclear Chemistry and High Energy Chemistry at the Hebrew University in Jerusalem.
The s c i e n t i f i c a c t i v i t i e s of Professor Amiel centered around research in nuclear f i ss ion y i e l d s , and systematics of f i s s ion phenomena from t h e o r e t i c a l to experimental aspec t s . He l e f t h is imprint in I s r a e l by s t a r t i n g the production of r ad io isotopes and labe l led compounds, h i s major contr ibut ion of world-wide use being, however, the development of the a n a l y t i cal method of uranium determination by delayed neutron a c t i vation ana lys i s . For his i.utjtar.ding contr ibut ion in the f ie ld jf ana ly t i ca l radiuchemistry Amiel wen the George Hevesy Medal for 1977. In p a r a l l e l to his research work, Amiel was very ac t ive ly involved in publ ic l i f e . He believed so much in the " S c i e n t i -f i ca t ion of the S t a t e " that he wrote the s c i e n t i f i c platform of one party for the ,-erieral e l ec t i ons to the Knesset. He was President of the I s r ae l Chemical Society from 1970 to 1973, organized many symposia and served in severa l Daneis and expert missions of the In te rna t iona l Atomic Energy Agency to various coun t r i es .
He was on the e d i t o r i a l board of * he I s r a e l Journal of Chemistry, the Journal of Pad)oanalyt ical Chemistry and the Journal of Chemical Instrumentat ion. He was a lso Chairman of the A .soc ia t ion of Alumni of the Hebrew Univers i ty . After undergoing brain surgey in January ?-977, and aware of h i s condi t ion , he fought back, and from semi-para lys is succeeded by s t rength of w i l l to walk and work. He came to Haifa in December 1977 for the opening of the Annual Meeting of the Nuclear Soc ie t ies and even t r a v e l l e d to Europe to cha i r an in t e rna t iona l symposium. He wrote a book on his experience and the b a t t l e against cancer, and became very i n t e r e s t e d in the croblems of radiobiology as r e l a t e d to radiotherapy. Ajiiiel was proposed for the " I s r a e l P r i ze" . He did no t , however, 1 i ve »o win it,.
Emy P i k l i s
COKTEtJTS
SECTION A - Nuclear Reactor Theory and Nuclear Technology
SECTION B - Radiation Gauges and Radioisotopes
SECTION C - Radiation in Medicine
SECTION D - Health Physics
SECTION E - Padiation Research and Radiobiology
Section A
HULCEAR REACTOR THEORY AND NUCLEAR TECHNOLOGY
Table of Contents Page H r .
1) Scope : Max imiza t i on o f N u c l e a r F u e l Energy O u t p u t i n a PWR f o r F i x e d 1A U-233 I n i t i a l I n v e n t o r y , M. K e r e n , w. R o t h e n s t e i n
2) S h i e l d i n g and Burn -up of B u r n a b l e P o i s o n Rods i n t h e PSU-LEOPARD Code 5A J . S z a b o , W. R o t h e n s t e i n
3) Burn-up C a l c u l a t i o n s T r e a t e d a s a Time Dependent P rob lem 8A Y. B a r t a l , s . Y i f t a h
4) Resonance O v e r l a o i n t h e Low U n r e s o l v e d Region o f P u - 2 4 1 12A Y. Gur and S. Y i f t a h
5) Resonance Area A n a l y s i s from ' J n d e r d e t e r m i n e d D a t a , M. Ganor 14A
6) Pn Approx imat ion t o t h e N e u t r o n T r a n s p o r t e q u a t i o n i n 2D G e o m e t r i e s 19A H. Lemanska and M. S h a t z
7) On t h e S i m p l i f i e d P Method i n t h e EXTERMINATOR Code, "1. Lemanska, L . G i t t e r 22A
8) S t a r t u p O c c i d e n t S i m u l a t i o n i n t h e IRR-1 Us ing t h e DSNP S i m u l a t i o n Language , D. S a p h i e r
11) T h e r m a l - H y d r a u l i c A n a l y s i s o f a New C o n c e p t u a l Core D e s i g n , S . K a i s e r m a n , z . Edelman, E . Wacho lde r , E . E l i a s
13) slowdown Da ta as an I n p u t t o C o n t a i n m e n t A n a l y s i s Dur ing a Loss o f Coolant A c c i d e n t i n PWR, A. K e n i g s b e r g
15) S u p r a t h o r n a l M i c t i o n s d u r i n g T h e r m o n u c l e a r B u n o f DT P e l l e t s , i). S h v a r t s
25A
0) Generalized Perturbation Theory for Durn-up, Xenon Poisoning and Reactor 32A Safety Problems, E. Greenspan
10) Hydrogen Economy and Nuclear Energy, Yigal Ronen 40A
42A
12) Containment Outflow Parametric Study and Safety Considerations Following 48A" a Loss of Coolan*- Accident, A. Kenigsberg, A. Einav
53A
14) Paramttric Analysis of Passive Heat Sinks Effect on Containment Pressure Transients, A. Kenigsberg, E. Elias 59A
64A 16) Discrete Ordinates Solution of the Fokker Planck Equation for Charged
Particles Transport in Plasma, D. Shvarts 67ft 17) Direct Versus Adjoint Recursive Monte Carlo Methods
it. Goldstein, E. Greenspan, A. Kinrot, D. Shvarts 70A 18) A Recursive Honte Carlo Method for Multigroup Problems
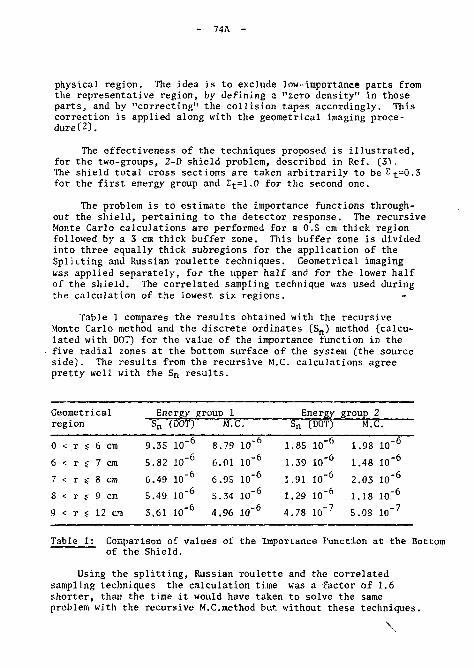
M. Goldstein, K. Greenspan 73A 19) Dry Recovery of Ceramic Sintered Uranium Dioxide 76A
I. Schwartz, M.1I. Mintz, Z. Hadari
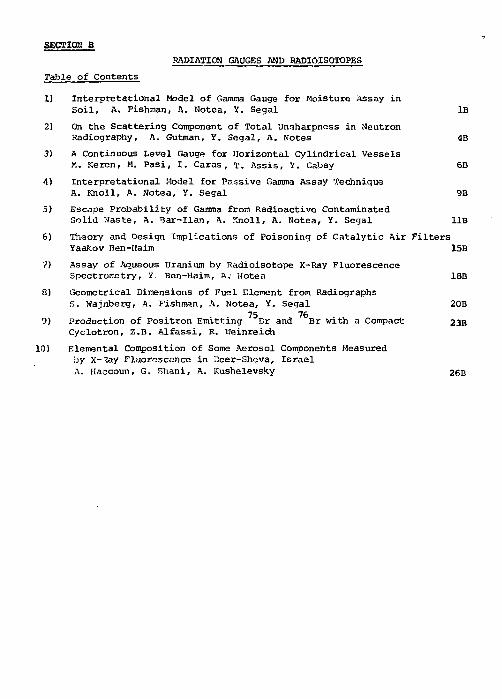
SECTION B RADIATION GAUGES AND RADIOISOTOPES
Table of Contents
1) Interpretational Model of Gamma Gauge for Moisture Assay in Soil, A. Fishman, A. Notea, Y. Segal IB
2) On the Scattering Component of Total Unsharpness in Neutron Radiography, A. Gutman, Y. Segal, A. Notes 4B
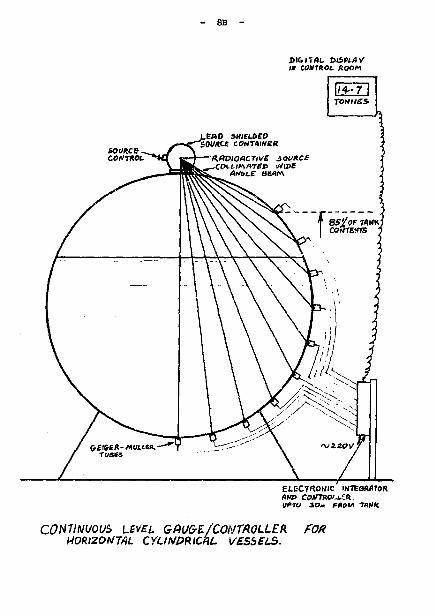
3) A Continuous Level Gauge for Horizontal Cylindrical Vessels M. Keren, M. Pasi, I. Caras, T. Assis, Y. Gabay 6B
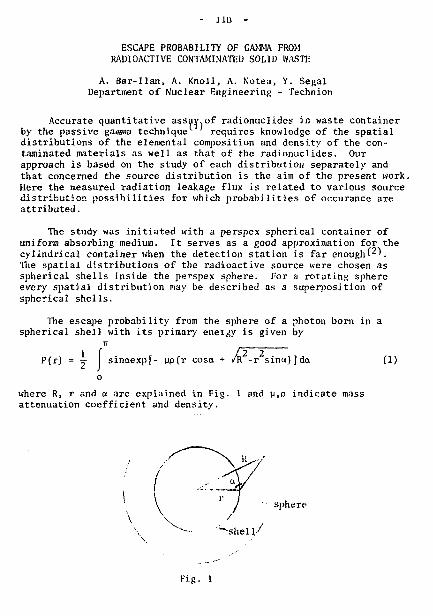
4) Interpretational Model for Passive Gamma Assay Technique A. Knoll, A. Notea, Y. Segal 9B
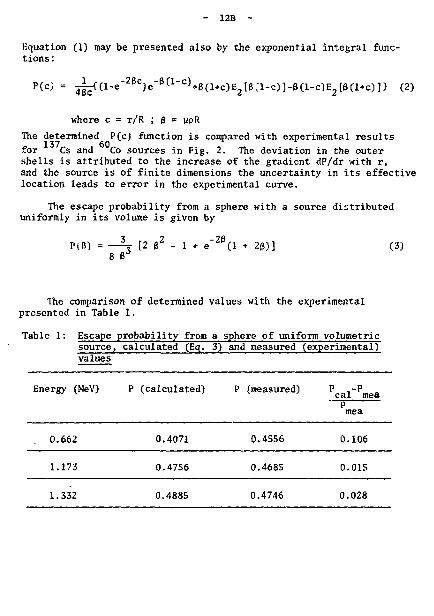
5) Escape Probability of Gamma from Radioactive Contaminated Solid Waste, A. Bar-Ilan, A. Knoll, A. Notea, Y. Segal IIB
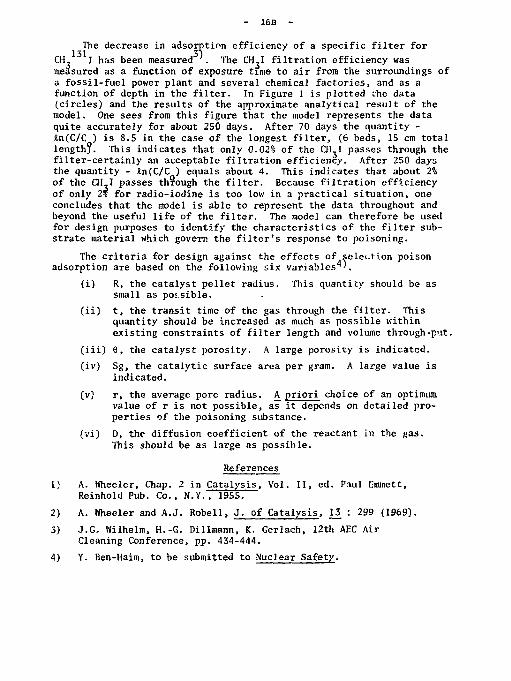
6) Theory and Design Implications of Poisoning of Catalytic Air Filters Yaakov Ben-Ilaim 15B
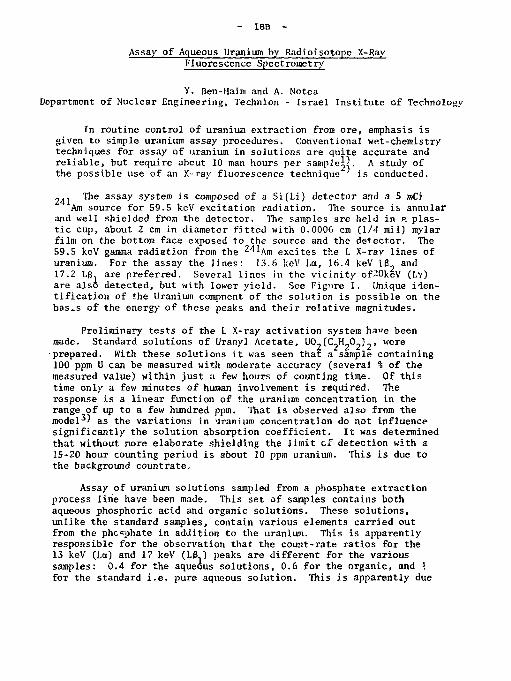
7) Assay of Aqueous Uranium by Radioisotope X-Ray Fluorescence Spectrometry, Y. Ben-Haim, A.- Uotea 18B
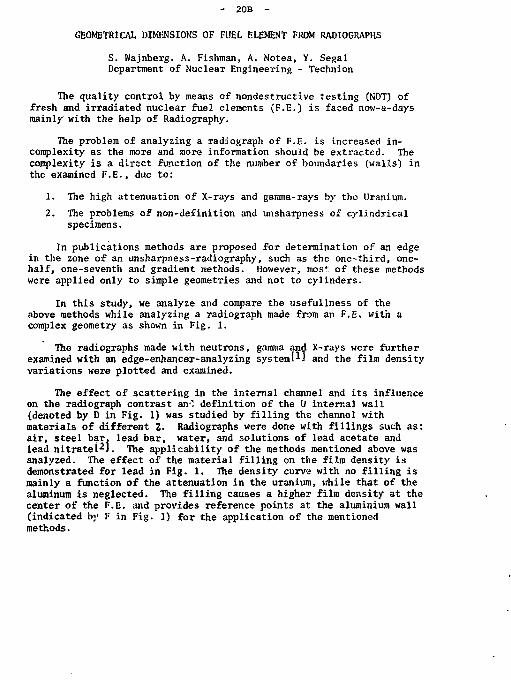
8) Geometrical Dimensions of Fuel Element from Radiographs s. Wajnberg, A. Fishman, A. Notea, Y. Segal 20B
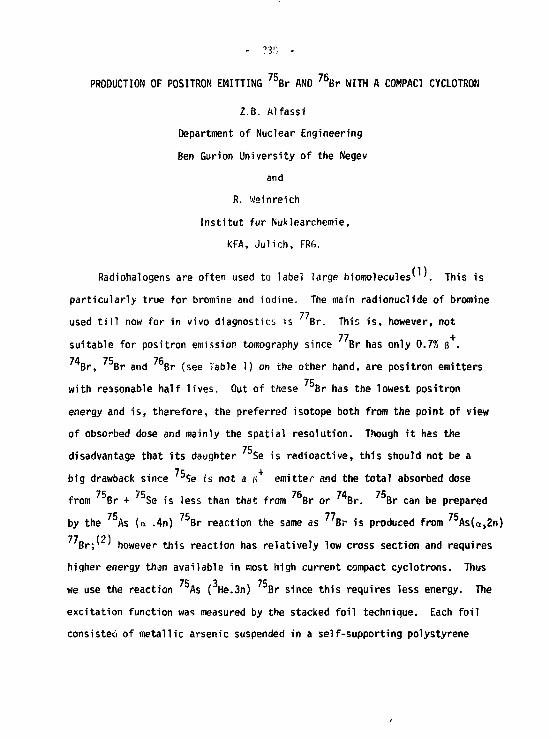
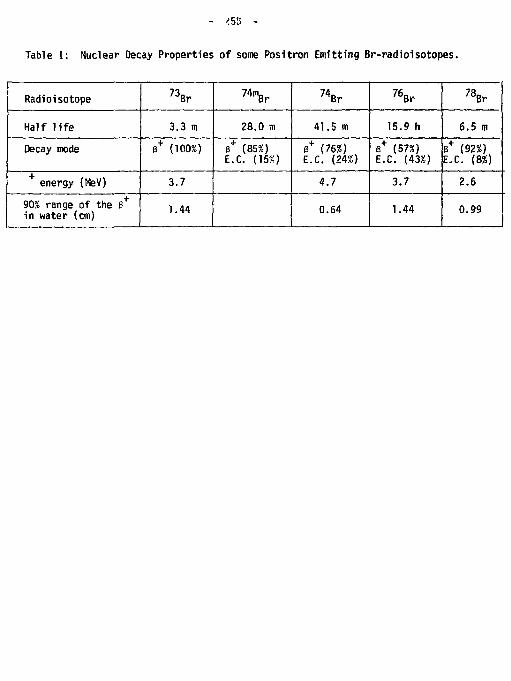
9) Production of Positron Emitting Br and Br with a Compact 23B Cyclotron, Z.B. Alfassi, R. neinreich
10) Elemental Composition of Some Aerosol Components Measured by X-^ay Fluorescence in ;3eer-Sheva, Israel A. Haccoun, G. Shani, A. Kushelevsky 26B
SECTIO« C
RADIATION IN MEaiCIHE
T a b l e of C o n t e n t s Page Hr .
1) D e t e r m i n a t i o n o f S e l e n i u m i n U r i n e by N e u t r o n A c t i v a t i o n A n a l y s i s , R. W a i n g a r t e n , Y. Shamai , T . S c h l e s i n g e r IC
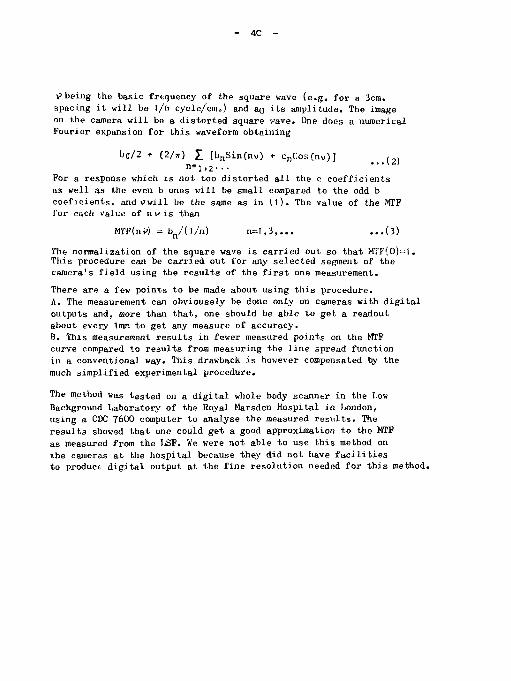
2) A Note on Rapid E s t i m a t i o n o f Gamma C a m e r a ' s M.T .F . G. Adam 3C
3) I n v e s t i g a t i o n o f a P o s s i b l e C o r r e l a t i o n Between t h e L e v e l of Se l en ium i n t h e Blood and Skin D i s e a s e s - by H e u t r o n A c t i v a t i o n A n a l y s i s , S. Abboud, T . S c h l e s i n g e r , R. W e i n g a r t e n , M. D a v i d , E . J . Feuerman 5C 18
4) F - 5 - F l u o r o u r a c i l a s a Model f o r P r e d i c t i n g Chemotherapy Response t o 5 - F l u o r o u r a c i l , Jashovam S h a n i , W a l t e r Wolf 7C
5) L i g h t S e n s i t i v i t y T e s t s - P r e l i m i n a r y S t u d i e s i n P s o r i a s i s P a t i e n t s Undergo ing A c t i n o t h e r a p y a t t h e Dead Sea , A . F . K u s h e l e v s k y , E . A z i z i , *-J.W. Avrach IOC
6) Combined L o c a l H y p e r t h e r m i a and X - I r r a d i a t i o n i n t h e T r e a t ment of M e t a s t a t i c Tumors : Case P .epor t , A. Y ° r u s h a l m i , .'1. T a l p a s 12C
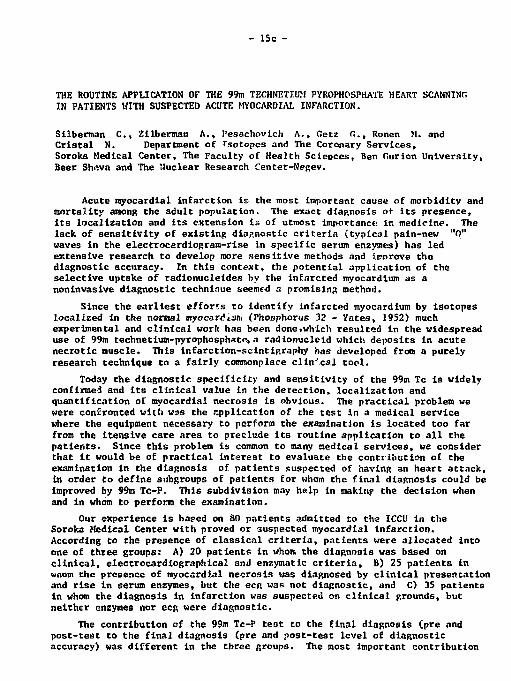
7) T!ie Routine Application of the 99n Technetium Pyrophosphate Heat Scanning in Patients with Suspected Acute Myocardial Infarction, C. Silberman, A. Zilberman, A. Pesachovieh, G. Getz, M. Ronen, N. Cristal 15C
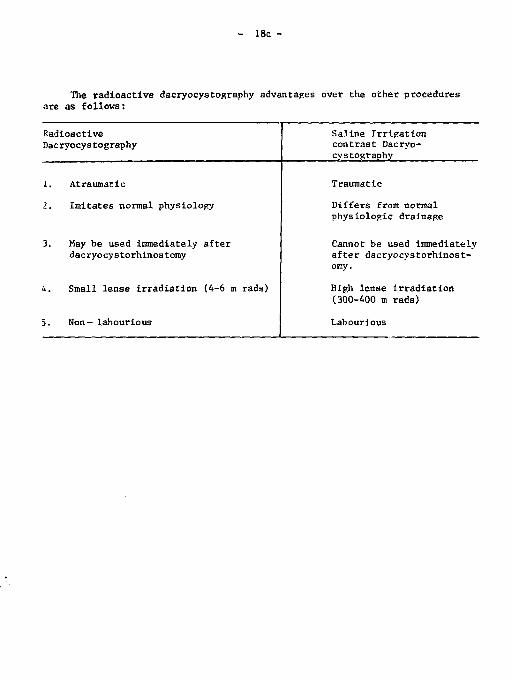
8) Radioactive Dacryocystography, Z. Tesler, L. FriedmanAPeisajovich II. Ronen, C. Silberman 17C
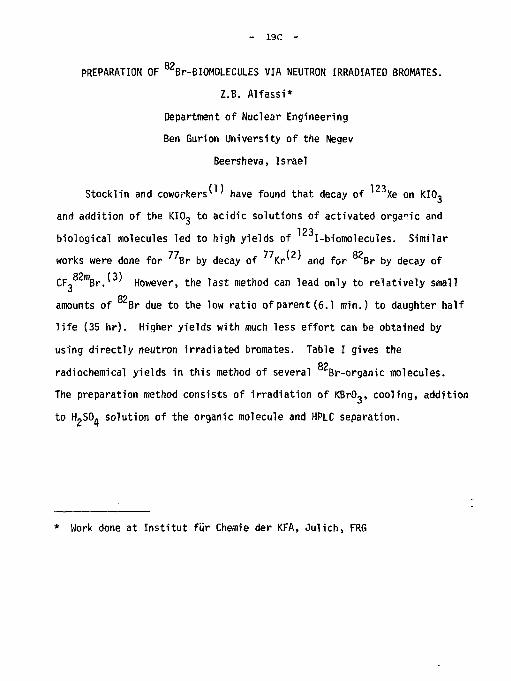
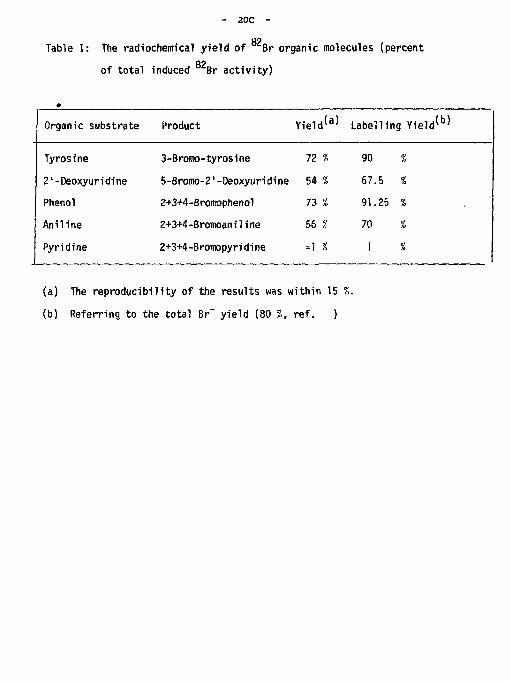
82 0) Preparation of Br-Biomolecules via Neutron Irradiated Bromates Z.B. Alfassi 19C
10) Evaluation of Liver and Bone Scanning after Surgery for Breast Cancer, S. Zaltzman, M. Barski 22C
SECTION D
HEALTH PHYSICS
Table of Contents Page Hr.
1) Radiation Hazards from Consumer Products in Israel T. Schlesinger, M. Surkes ID
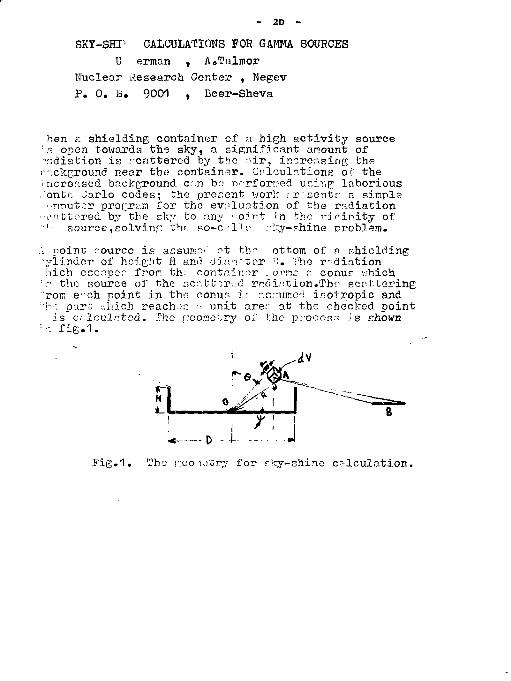
2) S k y - S h i n e C a l c u l a t i o n s from Gamma S o u r c e s , u . German, A. Talmor 2D
3) The A p p l i c a t i o n o f t h e ICRP-26 Recommendations i n t h e I s r a e l P e r s o n a l Dos ime t ry S e r v i c e , Y. E i s e n , T. S c h l e s i n g e r 5D
4) Au toma t i c TLD Dos ime t ry l y s t e n i n t h e I r j r a e l Tiadge " e r v i c e Y. E i s e n , n . M a l h i , ?,, S e g a l 6D
5) LET Dependence of t h e R e l a t i v e T h e r m o l u m i n e s c e n t H f f i c i e n c y o f LiF-TLD, J . K a l e f - E z r a , I . F r a i e r , Y . S . Horowi tz 9D
6) T h e r m o l u m i n e s c e n t E f f i c i e n c y o f LiF-TLD t o Cf -252 F i s s i o n F r a g m e n t s , J . K a l o f - E z r a , I . F r a i e r , Y . S . Horowi t z 11D
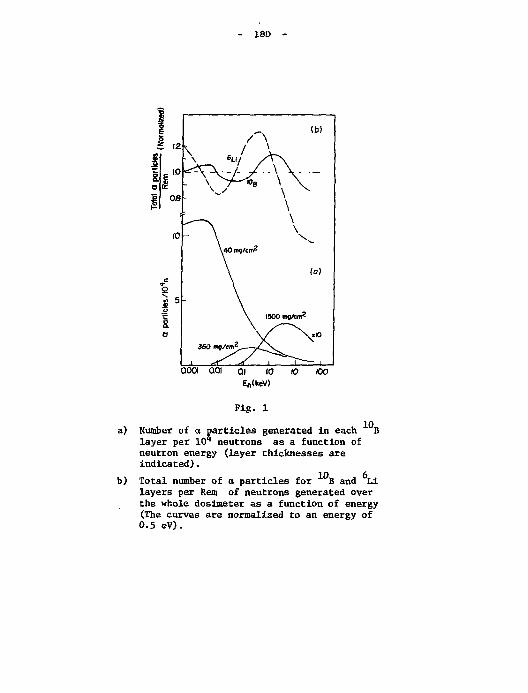
7) P o l y c a r b o n a t e s a s F a s t Neu t ron D o s i m e t e r s Y. E i s e n , Z , K a r p i n o w i t z , A, Gavron 13D
3) A F l a t Energv Resoonse D o s i m e t e r i n t h e E n i t h e r m a l Region Y. E i s e n , Y. Shamai 17D
9) I n f l u e n c e o f Beam H e i g h t on t h e Beam w i d t h P r o f i l e s o f C o b a l t The rapy M a c h i n e s , 11. T a t c h e r , Y. H a n d e l z w i e g , H. Yudelev 20D
SECTION E • Page Mr.
Radiation Research and Radiobiology
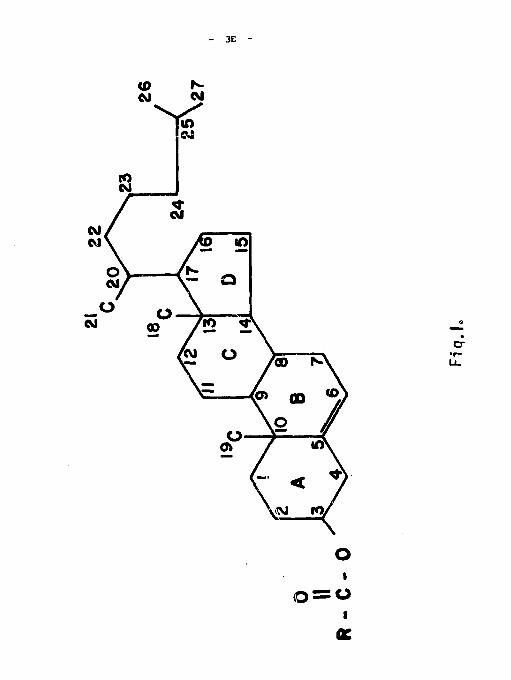
1. Radiolysis of Cholesteric Esters in CC1 , L. Feldman, Z.B. Alfassi and A. Kushelevsky IE
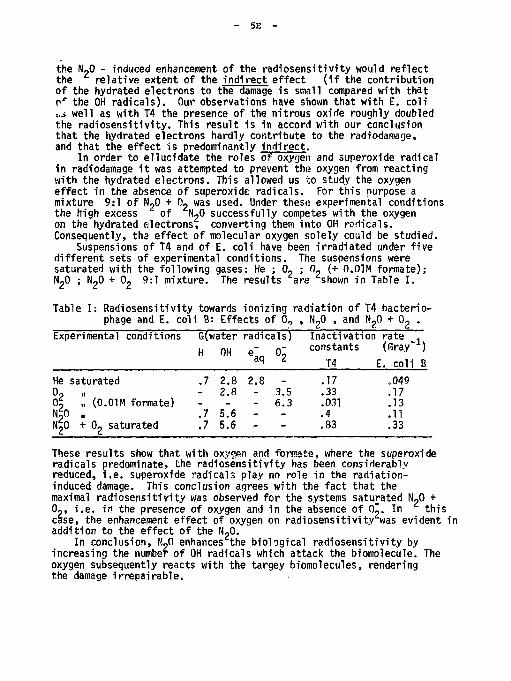
2. The Distinction between the Roles of 0 and of 0 in Biological Radiodamage, A. Samuni, M. Chevion, Y.S. Ilalpern, Y.A. Ilan, G, Czapski 4E
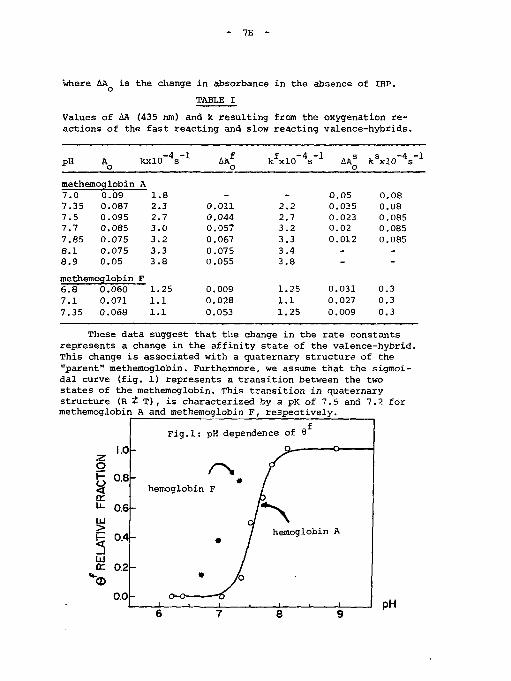
3. 2uaternary Structure of Methemoglobin III. Pulse Radiolysis of Human Adult and Fetal Hemoglobins, Y.A. Ilan, M. rhevion, A. Samuni, T. Navok and G. Czapski 5E
4. The Effect of selected model compounds on the Oxic Radiation response of Bacillus Pumilus spores, G.P. Jacobs 8E
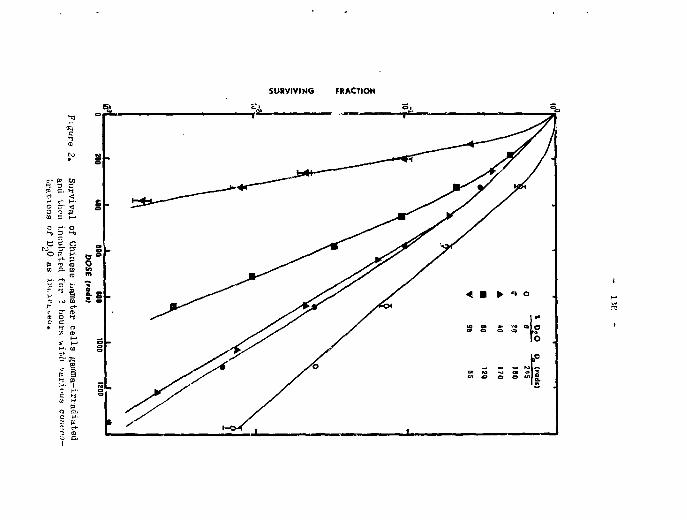
5. The Effect of Deuterium Oxide on the Radiation Response of Chinese Hamster Cells, E. Ben-Hur and E. Riklis 10E
6. The Gamma Irradiation of Cephalosporins, G.P. Jacobs 14E
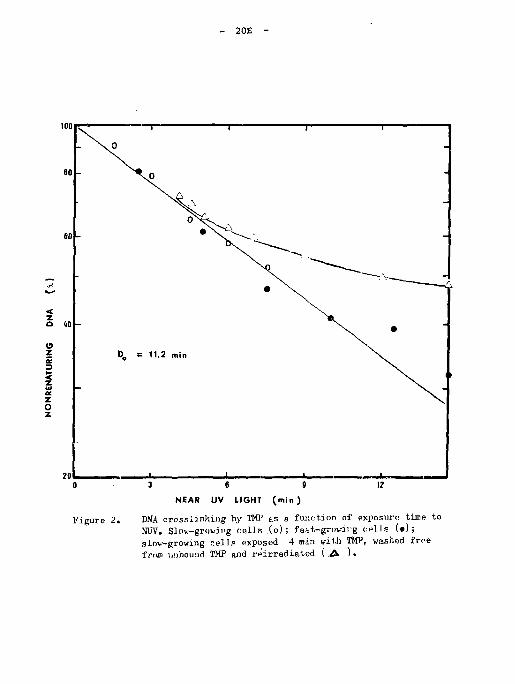
7. Tile effect oZ Grovrth Rate on the Sensitivity of Escherichia Coli. K12 to D:JA Crosslinks Induced by Tsoralen plus near Ultraviolet Light 17E A. Zaritsky, E. Ben-Hur, M.T. Hansen.
8. Radiosensitivity of Tissues from Carrot Root in Culture. A Correlation with Endogenous Growth Substancer N. Degani and D. Pickholtz 21E
SECTIO» A
NUCLEAR REACTOR THEORY AHD S7CLEAR TECHNOLOGY
- IA -
SCOPE: MAXIMIZATION OF NUCLEAR FUEL ENERGY OUTPUT IN A PIVR FOR FIXED U - 2 3 5 INITIAL INVENTORY
M. KEREN Israel Electric Co. Ltd.
P.O. Box. 10, Haifa, Israel W. Rothenstein
Nuclsar Engineering Department Technion, Haifa, Israel
The basic objective of fuel management for nuclear power reactors is the optiir.ization of fuel cycle and reactor operation to achieve a minimum overall energy cost, within the constraints given by design limits and technical specification for the operation of the reactor.
There are many decision variables which are associated with the general optimization problem with complex interrelationships. Many of tho parameters, such as the quantity of fresh fuel loaded and the feed enrichment are determined long before the batch is actually loaded into the reactor.
In reality, the fuel manager is facing the problem of maximization of energy output for 3 given set of fuel assemblies by a good selection of the fuel loading pattern. It is in this area that the present project aims to give good guidelines.
A computer program SCOPE was developed to provide an answer to the above problem. SCOPE has four main sections:
a. Calculation of cross sections (and ultimately the HOC iso-topics), using polynomials generated by PSU-LEOPARD [1].
b. Calculation of normal power distribution and burnup for each assembly.
c. Calculation of the nuclear fuel cycle cost. d. Optimization procedure which directs the process of the
calculations. The relations between the various parts of SCOPE are presented
in Fig. 1. SCOPE calculates normal power distribution by solving the coarse
mesh 2-D 1.5 group diffusion equations. The theory for setting up this model was taken from S. Borresen [2]. Since the mean free path length of the fast group is comparatively long, widely spaced nodes (one point per assembly) can be used in the fast group. After solving iteratively for the fast flux the thermal flux is obtained analytically assuming zero buckling in the thermal group which is reasonable for light water reactors. In order to take boundary effects into account the fluxes in each node are adjusted with reference to the fluxes in each of the four neighbouring assemblies.
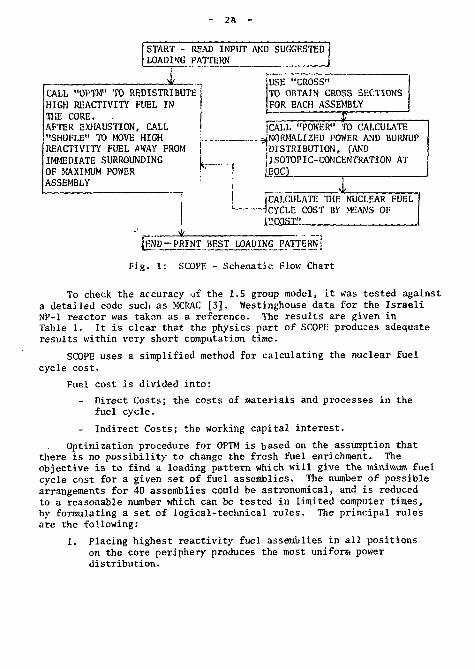
START - READ INPUT AND SUGGESTED LOADING PATTERN J,
CALL "OPTM" TO REDISTRIBUTE j HIGH REACTIVITY FUEL IN | TOE CORE. AFTER EXHAUSTION, CALL j "SHUFLE" TO MOVE HIGH I REACTIVITY FUEL AWAY FROM | IMMEDIATE SURROUNDING L OF MAXIMUM POWER ^ I ASSEMBLY :
USE "CROSS" TO OBTAIN CROSS SECTIONS FOR EACH ASSEMBLY
ICALL "POWER" TO CALCULATE ..^NORMALIZED POWER AND BURNUP
'DISTRIBUTION, (AND ilSOTOPIC-CONCENTRATION AT |EOCJ
CALCULATE THE NUCLEAR FUEL ~1CYCLE COST BY MEANS OF Lucosr: i
{END- PRINT BEST LOADING PATTERN j
F i g . 1 : SCOPE - S c h e m a t i c Flow C h a r t
To check the accuracy of the l.S group model, it was tested against a detailed code such as MCRAC [3]. Westinghouse data for the Israeli NP-1 reactor was takon as a reference. The results are given in Table 1. It is clear that the physics part of SCOPE produces adequate results within very short computation time.
SCOPE uses a simplified method for calculating the nuclear fuel cycle cost.
Fuel cost is divided into: Direct Costs; the costs of materials and processes in the fuel cycle.
- Indirect Costs; the working capital interest. Optimization procedure for OPTM is based on the assumption that
there is no possibility to change the fresh fuel enrichment. The objective is to find a loading pattern which will give the minimum fuel cycle cost for a given set of fuel assemblies. The number of possible arrangements for 40 assemblies could be astronomical, and is reduced to a reasonable number which can be tested in limited computer times, by formulating a set of logical-technical rules. The principal rules are the following:
1. Placing highest reactivity fuel assemblies in all positions on the core periphery produces the most uniform power distribution.
Westinghouse SCOPE QX1)* MCBAC QX1) MCRAC C4X4)
1. Max. normalized power 2. Average burnup-batch 1 (MWD/MTU) 3. " " " 2 4. " " " 3 5. Pu concentrat ion-batch 1
Cgr Pu/Kg U) 6. Discharge enrichment-batch 1 (percent) 7. U Losses-batch 1(percent) 8. CPU timefsecond?), IBM 370/168
Table 1 : Comparison of SCOPE and MCRAC. (Numbers i n parentheses are deviat ions from the Westinghouse va lues ) .
* Number of mesh po in t s per fuel assembly.
- 4A
2. Fuel assemblies with high reactivity should not be placed in close proximity anywhere except on the periphery or just inside it.
J. Lower radial power peaks result if the lowest reactivity fuel is placed on all four faces of high reactivity fuel.
4. In order to avoid drastic changes in the k profiles during the iterations high reactivity fuel assemblies are moved only one position at a time.
5. The lower leakage factor near the center of the core makes proper fuel placement more critical in this area. Consequently different logic is used in the shuffling procedure depending on the part of the core under consideration.
To investigate the adequacy of the performance of SCOPE, the loading pattern suggested by Westinghouse for NP-1 was checked. The reference case achieves burnup of 15,900 MWD/TON for a fuel cost of 9.22 mills/KWH. After 30 shuffling iterations, SCOPE converged (in about 30 seconds on the IBM 370/168} to a loading pattern producing 16,200 MWD/TON at a fuel cost of 9.08 mills/KWH. The improvement in fuel cost (0.14 mills/KWH) is equivalent to about 800,000 $/yr. The difference in bumup (300 MWD/TON) might save, through reduction in fissile fuel consumption in the entire grid, up to 3,000,000 $/yr.
References [1] M.J. Cenko, "The Pennsylvania State University Pressurized
Water Reactor Fuel Management Package User's Guide", June 1975. [2] S. Borresen, "A Simplified, Coarse Mesh, Three Dimensional
Diffusion Scheme for Calculating the Gross Power Distribution in a Boiling Water Reactor", Nucl. Sei. Eng. j44, pp. 37-43 (1971).
[3] H. Huang, "MCRAC User's Guide (draft)", Pennsylvania State University.
- 5A -
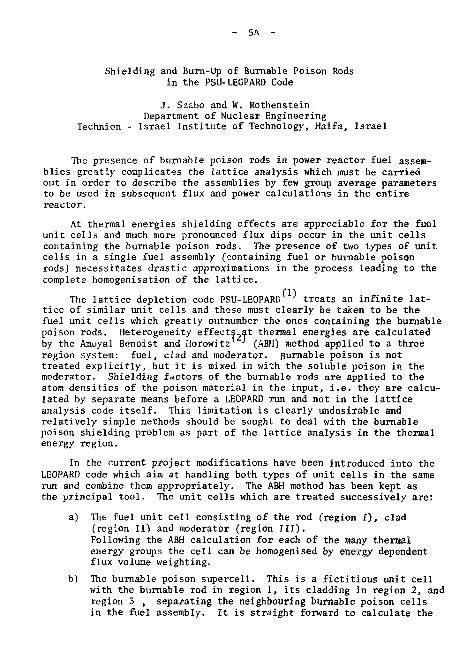
Shielding and Burn-Up of Burnable Poison Rods in the PSU-LEOPARD Code
J. Szabo and W. Rothenstein Department of Nuclear Engineering
Technion - Israel Institute of Technology, Haifa, Israel
The presence of burnable poison rods in power reactor fuel assemblies greatly complicates the lattice analysis which must be carried out in order to describe the assemblies by few group average parameters to be used in subsequent flux and power calculations in the entire reactor.
At thermal energies shielding effects are appreciable for the fuel unit cells and much more pronounced flux dips occur in the unit cells containing the burnable poison rods. The presence of two types of unit cells in a single fuel assemhly (containing fuel or burnable poison rodsj necessitates drastic approximations in the process leading to the complete homogenisation of the lattice.
The lattice depletion code PSU-LEOPARD treats an infinite lattice of similar unit cells and these must clearly be taken to be the fuel unit cells which greatly outnumber the ones containing the burnable poison rods. Heterogeneity effects^at thermal energies are calculated by the Amuyal Benoist and Horowitz (ABH) method applied to a three region system: fuel, clad and moderator. Burnable poison is not treated explicitly, but it is mixed in with the soluble poison in the moderator. Shielding factors of the burnable rods are applied to the atom densities of the poison material in the input, i.e. they are calculated by separate means before a LEOPARD run and not in the lattice analysis code itself. This limitation is clearly undesirable and relatively simple methods should be sought to deal with the burnable poison shielding problem as part of the lattice analysis in the thermal energy region.
In the current project modifications have been introduced into the LEOPARD code which aim at handling both types of unit cells in the same run and combine them appropriately. The ABH method has been kept as the principal tool. The unit cells which are treated successively are:
a) The fuel unit cell consisting of the rod (region I), clad (region III and moderator (region III). Following the ABH calculation for each of the many thermal energy groups the cell can be homogenised by energy dependent flux volume weighting.
b) The burnable poison supercell. This is a fictitious unit cell with the burnable rod in region 1, its cladding in region 2, and region 3 , separating the neighbouring burnable poison cells in the fuel assembly. It is straight forward to calculate the
6A -
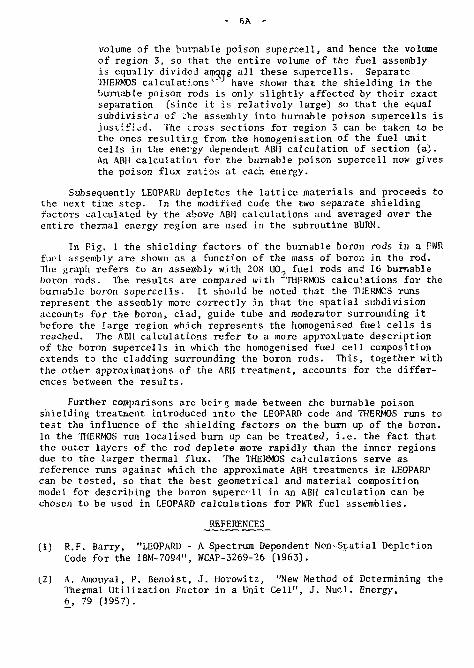
volume of the burnable poison supercell, and hence the volume of region 3, so that the entire volume of the fuel assembly is equally divided among all these supercells. Separate THERMOS calculations have shown that the shielding in the burnable poison rods is only slightly affected by their exact separation (since it is relatively large) so that the equal subdivisifii of ;he assembly into burnable poison supercells is justified. The cross sections for region 3 can be taken to be the ones resulting from the homogenisation of the fuel unit cells in the energy dependent ABH calculation of section (a). An ABH calculation for the burnable poison supercell now gives the poison flux ratios at each energy.
Subsequently LEOPARD depletes the lattice materials and proceeds to the next time step. In the modified code the two separate shielding factors calculated by the above ABH calculations and averaged over the entire thermal energy region are used in the subroutine BURN.
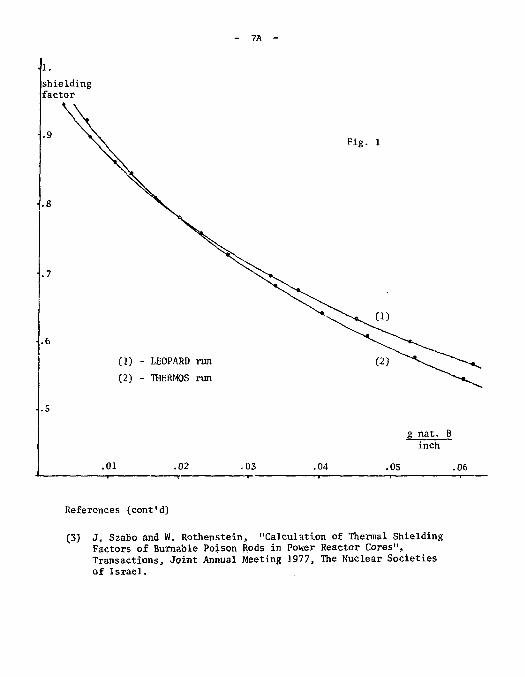
In Fig. 1 the shielding factors of the burnable boron rods in a PWR fuel assembly are shown as a function of the mass of boron in the rod. The graph refers to an assembly with 20S UO, fuel rods and 16 burnable boron rods. The results are compared with ""THERMOS calculations for the burnable boron supercells. It should be noted that the THERMOS runs represent the assembly more correctly in that the spatial subdivision accounts for the boron, clad, guide tube and moderator surrounding it before the large region which represents the homogenised fuel cells is reached. The ABH calculations refer to a more approximate description of the boron supercells in which the homogenised fuel cell composition extends to the cladding surrounding the boron rods. This, together with the other approximations of the ABH treatment, accounts for the differences between the results.
Further comparisons are beii-g made between the burnable poison shielding treatment introduced into the LEOPARD code and THERMOS runs to test the influence of the shielding factors on the burn up of the boron. In the THERMOS run localised burn up can be treated, i.e. the fact that the outer layers of the rod deplete more rapidly than the inner regions due to the larger thermal flux. The THERMOS calculations serve as reference runs against which the approximate ABH treatments in LEOPARP can be tested, so that the best geometrical and material composition model for describing the boron superc^ll in an ABH calculation can be chosen to be used in LEOPARD calculations for PWR fuel assemblies.
REFERENCES
(1) R.F. Barry, "LEOPARD - A Spectrum Dependent Non-Spatial Depletion Code for the IBM-7094", WCAP-3269-26 [1963).
(2) A. Amouyal, P. Benoist, J. Horowitz, "New Method of Determining the Thermal Utilization Factor in a Unit Cell", J. Nucl. Energy, 6, 79 (1957).
7A -
shielding factor
Fig. l
(1) - LEOPARD run (2) - THERMOS run
g nat. B inch
.01 .02 .03 .04 .05 .06
References (cont'd)
(3) J. Szabo and W. Rothenstein, "Calculation of Thermal Shielding Factors of Burnable Poison Rods in Power Reactor Cores", Transactions, Joint Annual Meeting 1977, The Nuclear Societies of Israel.
- 3A -
i^/^cr' BURNUP CALCULATIONS TREATED AS h TIME
i'liU-l «'7 AS DEPENDENT PROBLEM
Y. Bartal and 3. Yiftah Soreq Nuclear Research Center
Yavne
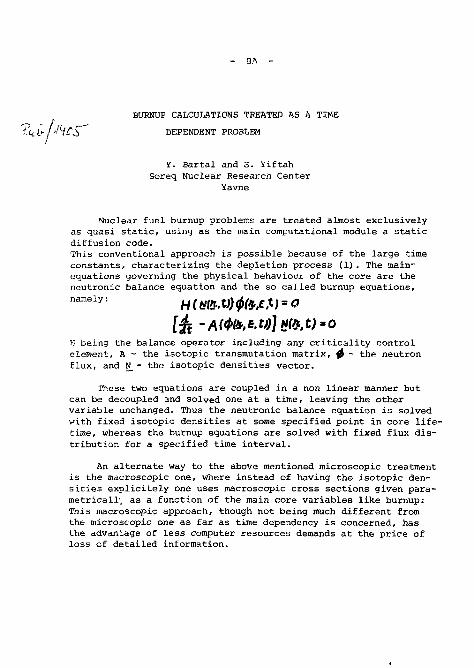
Nuclear fuel burnup problems are treated almost exclusively as quasi static, using as the main computational module a static diffusion code. This conventional approach is possible because of the large time constants, characterizing the depletion process (1). The main-equations governing the physical behaviour of the core are the neutronic balance equation and the so called burnup equations,
namely: HlHtoMfaAU'O
lii -Arøfcfc«Jj!»f*.«-o H being the balance operator including any criticality control element, A - the isotopic transmutation matrix, f( - the neutron flux, and N_ - the isotopic densities vector.
These two equations are coupled in a non linear manner but can be decoupled and solved one at a time, leaving the other variable unchanged. Thus the neutronic balance equation is solved with fixed isotopic densities at some specified point in core lifetime, whereas the burnup equations are solved with fixed flux distribution for a specified time interval.
An alternate way to the above mentioned microscopic treatment is the macroscopic one, where instead of having the isotopic densities explicitely one uses macroscopic cross sections given para-metricall'j as a function of the main core variables like burnup: This macroscopic approach, though not being much different from the microscopic one as far as time dependency is concerned, has the advantage of less computer resources demands at the price of loss cf detailed information.
- 9A -
The main drawback of both the macroscopic and the microscopic quasi static treatments is the high computational costs needed for a core lifetime followup. This is especially important where fuel management calculations are being done where one must resort to very approximate methods in order to overcome this drawback.
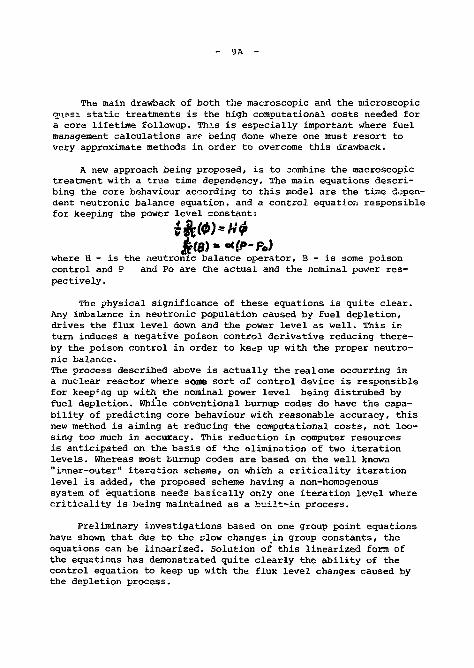
A new approach being proposed, is to combine the macroscopic treatment with a true time dependency. The main equations describing the core behaviour according to this model are the time dependent neutronic balance equation, and a control equation responsible for keeping the power level constant:
where H - is the neutronic balance operator, B - is some poison control and P and Po are the actual and the nominal power respectively.
The physical significance of these equations is quite clear. Any imbalance in neutronic population caused by fuel depletion, drives the flux level down and the power level as well. This in turn induces a negative poison control derivative reducing thereby the poison control in order to keep up with the proper neutronic balance. The process described above is actually the real one occurring in a nuclear reactor where some sort of control device is responsible for keeping up with the nominal power level being distrubed by fuel depletion. While conventional burnup codes do have the capability of predicting core behaviour with reasonable accuracy, this new method is aiming at reducing the computational costs, not loosing too much in accuracy. This reduction in computer resources is anticipated on the basis of the elimination of two iteration levels. Whereas most turnup codes are based on the well known "inner-outer" iteration scheme, on which a criticality iteration level is added, the proposed scheme having a non-homogenous system of equations needs basically only one iteration level where criticality is being maintained as a built-in process.
Preliminary investigations based on one group point equations have shown that due to the slow changes in group constants, the equations can be linearized. Solution of this linearized form of the equations has demonstrated quite clearly the ability of the control equation to keep up with the flux level changes caused by the depletion process.
- irm -
Work is still in progress, where the aim is to provide with a 2-D two group code based on the proposed model.
As a main framework and checking burnup code the SCAR (2) code has been chosen which is a part of the Penn-State University Fuel Management Pachage (PFMP). This code utilizes macroscopic cross sections given as a function of fuel burnup and soluble boron content. While using this code, quite a few corrections and additions have been implemented:
1. The burnup distribution calculation which was based on the assumption of fixed composition loading in heavy elements, has been corrected to take into account different loadings.
2. The materials volumes calculation which was mesh spacing dependent has been corrected.
3. A wrong assignment of logical units has been corrected. 4. Inconsistencies between the code and the manual and within
the code have been removed, concerning variable definitions and options.
5. Some points within the code, where out of dimension condition could occur without notice, have been located, so that this condition is being checked now.
6. Needlessly long conputational algorithms have been shortened and redundant variables removed.
7. Materials' map which was distorted has been "corrected. 8. A full report of memory demands and excess memory has been
implemented. 9. A change in the order of multi-dimensional variables has
been implemented reducing thereby the total storage needed. 10. The High Speed Mortale which uses a sort of synthesis between
two 1-D calculation has been removed, being too much dependent on the power reactor core on which it has been tested (TMI-1)..
11. As a consequence of 10, soluble boron criticality calculation has been implemented, using the standard x-y module.
- IIA -
12. A new option of having power and flux maps either by mesh node or by mesh point have been implemented. Power maps include power fractions and power sharing.
13. Fluxes are normalized according to total power and core height given in input.
REFERENCES 1. Y. Bartal, "Methods of nuclear fuel burnup calculations
in thermal reactors". Research Proposal. 2. M.J. Cenko, "The Pennsylvania State University Pressurized
Water Reactor Fuel Management Package User's Guide", PSBR-315-497483.
- 12A -
•' ' ' " • RESONANCE OVERLAP IN THE LOW UNRESOLVED 7U/W REGION OF PU-241
Y. Gur and S. Yiftah Soreq Nuclear Research Center
Yavne
In evaluated nuclear data files, the resonance region is divided into two subregions (resolved and unresolved resonances). In the resolved region parameters are given for each resonance while in the unresolved region only statistical parameters are given.
These parameters are used to compute group effective cross sections, which are represented by two factors (1): The infinitely diluted cross section and the resonance self shielding factor. The second factor contains temperature and mixture effects upon the effective cross section. Shielding factors are computed, in the unresolved region, using simplified models that assumeno overlapping between resonances of different (£,j) series and overlapping of two resonances of the same (•£, j) series. Two questions naturally arise: a) How many overlapping resonances are to be considered for the computation of a reliable shielding factor and b) how reliable are results of the simplified computation.
Preliminary computations were already presented (2) and were continued as follows: Two ladders of virtual resolved resonance parameters were sampled, in the lower unresolved resonance region, by the Monte Carlo method,from the KEDAK-3 statistical parameters of Pu-241. These ladders were used to compute shielding factors for group 17 of ABN group structure (100-215 eV), using the resolved resonances method.
The fission and capture shielding factors, Ff and F c were computed vith 3,5,11,15,21 and 25 interfering resonances for 300°K, and 1500°K, and compared with simplified model calculations performed by MIGROS (3), in Kernforschungszentrum, Karlsruhe(4). The difference,Ax, A = F
x i!500)-Fx (300), x is f or c, and the relative difference, Aj-X , i _ ^x are also computed and compared. r x fx(300)
It was found that a small number of interfering resonances usually yields a lower shielding factor that 25 interfering resonances while the simplified model yields higher shielding factors. On the other hand the relative difference, A r, which is a measure of the contribution of the cross section to the Doppler effect is
- 13A -
much smaller when computed by the simplified model. The relative increase in Of and tfy , per 1 C for Pu-241
in Group 17 of ABN(l), (100-215eV), xlO 1 3 , is given in the follwing table.
Table I
Relative Increase, xlO , in <7f and " per 1°C, for Pu-241 in Group 17 (100-215eV)
a 0
25 interfering resonances Simplified model (MIGROS)
a 0 ladder I ladder II
Simplified model (MIGROS)
°f
0 10 100
.131
.107
.050
.119
.095
.046
.007
.020
.34
a Y 0 10 100
.274
.236
.134
.323
.283
.171
.101
.112
.100
REFERENCES 1. I.I. Bondarenko et al: "Group constants for nuclear reactors
calculations consultant bureau",(1964). 2. Y. Gur and S. Yiftah:"Effective cross section computation in
the unresolved resonance region".The I.N.S. Transactions Vol 5, (1977). 3. I. Broeders et al: MIGROS-3, KFK-2388 (1977). 4. H. Küsters et al: Private communication.
- 14A -
RESONANCE AREA ANALYSIS FROM UNDERDETERMINED DATA
M. Caner Soreq Nuclear Research Center
Vavne
The resonance parameters calculated by area analysis of capture and fission cross sections are underdetermined: a transmission experiment is needed in order to get Fj and a complete parameter set- In the absence of transmission datar
the assumption Ty - <Ty> d>2) ^ s ^ n g e n eral sufficiently accurate. For the cases where the latter assumption is inaccurate (as for some resonances in Ref. 1) or even inconsistent with the data, the present approach was developed: it is based on the statistical properties of the partial widths. This work was done in the context of a nuclear data evaluation of Cm-244' 3'.
As a first step, the average capture width, <^y> , and the corresponding number of degrees of freedom,u , are calculated from the available complete data subset (in the case of Cm-244, the resonances below 521 eV); or, at worst, from data from a similar isotope. This calculation is done using the weighted maximum likelihood method described later on.
Furthermore, the average reduced neutron width, <T%> , is calculated from the above mentioned subset, and it is assumed that the reduced neutron widths, T n , follow a chi-square distribution with u = 1 . n
The likelihood function, L, is defined as follows:
L = P(x ; u ) • P(x ;1) Y Y (1) x = r / <r > Y Y Y
x = rn / <rn > n
The parameters of a given resonance are obtained by calculating the maximum of L, subject to the relations given by the measured capture and fission areas. The following expression is obtained:
- 15A -
where D =
B + Y
B f
r . j ,0
n >
E = B
Y
B l •iTr
^ /exp
i = Y,f
(3)
The most likely capture width for a given resonance is obtained by solving numerically Eq. (2). Then, the calculation of the corresponding neutron and fission widths is straightforward. It was assumed throughout that we are dealing wit i s-wave resonances and zero spin targets.
In Table I the Cm-244 resonance parameters calculated with the present method (using capture and fission areas of Moore et al.'*') are compared with those obtained by Moore et al. (their data and by Simpson et al. (4)
r =37meV, Uy = ») Ænd those obtained (transmission + data of Moore et al.),
for a few representative resonances. For the full set of resonances, see Ref. 3. If the Simpson et al. data are taken to be the preferred set, the calculated values are found to be better or not worse than those of Moore in most cases. And for the range 522 eV < E < 973 eV, where only the Moore et al. data are available, the values calculated here are preferred? this is particularly so for those resonances to which Moore et al. assign extremely large neutron widths.
In order to analyze the capture width distribution, a weighted maximum likelihood method is developed rtlw'need for this generalization arises because the experimental errors are of the same order of magnitude aa^the width of the distribution itself. The weighted livelihood function, W, is defined:
N
W = TT i=l
p<r <r >, u ) Y Y
By analogy to the least-squares formula w. are defined such that
(5)
<r > 2 M r . ) 2
y_ +\ YI/ u„
N = E
i=l
(4)
the weights
(5)
16 A
a, = N w. l — l w Following the standard maximum likelihood analysis ' we obtain
w (6) r > = i
u -
N I a. T . i= l x Y 1
N , f o r u >>1 y I'."a.'
1 1 In ^ry> r .
Y l
Y (7)
Results using Eqs. (6)-(7) are shown in Table II for Cm-244 and U-238. It is seen that the present method gives, as expected, results intermediate between the extreme cases of neglecting experimental errors and of neglecting the finite width of the distribution.
REFERENCES
Moore, M.S., and Keyworth, G.A., Phys. Rev. C3_, 1656 (1971). Silbert, M.G., and Berreth, J.R., Nucl. Sei. Eng. 5_2, 187 (1973). Caner, M., and Yiftah, S., "Curium-244 Neutron Data Evaluation", Rep. IA-(to be published). Simpson, O.D., Simpson, F.B., and Young, T.E., ANCR-1088, 39(1972)• Brandt, S., "Statistical and Computational Methods in Data Analysis", North-Holland, Amsterdam (1970).
- 17A -
Table I
Cm-244 resonance parameters
r E (eV) T (meV) r (meV) T (meV) |Reference n
4 22.85 ?2.85
22.8210.01
* 37 3319 3512
3.710.3 3.3+0.9 3.510.2
0.18+0.02 Moore 0.1810.01 Calculated 0.1810.01 Simpson<4>
5 34.99 34.99
35.00±0.02
* 37
3319 2313
2.51+0.07 2.2 ±0.6 1.57+0.20
0.5910.05 Moore 0.5910.02 Calculated 0.6410.04 Simpson
9 96.12 96.12
96.3010.05
* 37 3319 5117
1.54+0.05 1.410.4 2.310.3
0.74+0.06 Moore 0.76+0.05 Calculated 0.6910.07 Simpson
Error-we ighted average, w. =<ar .) 33.4+1.5 47+11 22.9+0.4 214±36
P B APPROXIMATION IO THE NEUTRON TRANSPORT EQUATION
IN 2D GEOMETRIES
-7> 1/ Å//lr/)l/ M " I , e n , a n s I c a a n d M - Shatz
-+
Soreq Nuclear Research Center Yavne
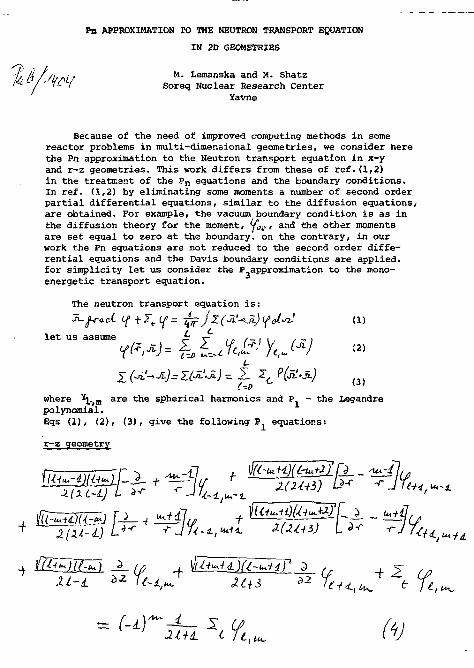
Because of the need of improved computing methods in some reactor problems in multi-dimensional geometries, we consider here the Pn approximation to the Neutron transport equation in x-y and r-z geometries. This work differs from these of ref.(1,2) in the treatment of the P n equations and the boundary conditions. In ref. (1,2) by eliminating some moments a number of second order partial differential equations, similar to the diffusion equations, are obtained. For example, the vacuum boundary condition is as in the diffusion theory for the moment, y^,, and the other moments are set equal to zero at the boundary, on the contrary, in our work the Pn equations are not reduced to the second order differential equations and the Davis boundary conditions are applied, for simplicity let us consider the P.approximation to the mono-energetic transport equation.
The neutron transport equation is:
5-frcd Lf +TtLf= -fejZ(JH->JL)l{J-^ (1) l e t us assume £. i - \ \ , , -> >
L
Z(jL^jL)=ZtX.'Ji)^Z ZcP(jZ.jQ ( 3 )
where \ . i m are the spherical harmonics and P - the Legandre polynomial. Eqs <1), (2), (3), give the following P equations:
r-z geometry
t-H^i.
1 JLUL til,*. (V
- 20A -
where
anä ,2
eqs. (4) gives: -/
- j - r v
t;x
(5)
(5)
where
Eqs. (5) called the SP equations, are introduced to the EXTERMINATOR code. The numerical results obtained for BMU assemblies are good and given in the table bolow.
Table I
Comparison between k „ calculated by Exterminator and Exterminator with SP codes for BMU - assemblies.
geometry Exterminator Exterminator with SP3
x-y 0.9756 1.0014
r-z 0.9798 1.0064
- 21A -
REFERENCES 1. E.M. Gelbard - "Application of spherical harmonics method to
reactor problems". WAPD-BT-20 p. 73, 1960.
2. E.M. Gelbard and G. Pearson - "Iteractive solution to the P and double P ecjuations". Nucl. Sei. ana Eng. vol. 5, p. 36, 1959.
- 22A
ON THE SIMPLIFIED P METHOD IN THE EXTERMINATOR CODE
M. Lemanska and L. Gitter Soreq Nuclear Research Center
Yavne
Few-group diffusion theory is a basic tool for the analysis of power reactors. But in some problems, as for example, those with light weter - breeder reactors (LWBR), en improved computing method is needed to take into account the anistotropic scattering in the fast energy group (or groups). The Sn transport method is the most vidsly used, but its application to multi-dimensional geometries is difficult. The other approximation to the transport equation, the spherical harmonics methods, gives for slab geometry simple equations, but in other geometries more complicated equations. The complexity of the spherical harmonics methods is dependent on geometry. Because of this difficulty the SPi (simplified P.) method has been proposed by Gelbard. For simplicity we consider here the SP approximation.
Let the neutron trasnport equation for the highest group in slab geometry be:
A T £ * t = *. \"}\ %Tl~ & a) where the notation has the usual meaning. Assuming expension in the Legandre polynamials
A.M* %(*}+ {\ % w t PA w t p % w m
and using the relation
h ?t = f^I !\^+ ITU pc-± fr one obtains from eq. (1)
23A -
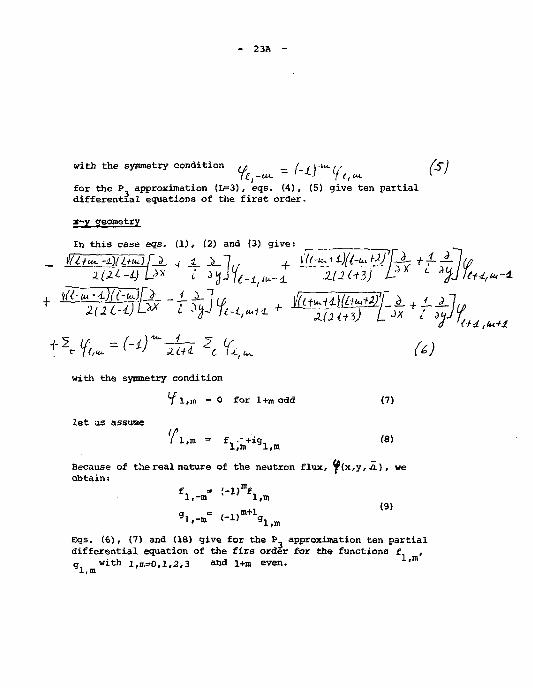
with the symmetry condition ./> _ / , \ u<_,, A " I
for the P approximation (L=3), eqs. (4), (5) give ten partial differentxal equations of the first order.
*~y geometry
In this case eqs. (1), (2) and (3) give:
o Ird ,<«•*£
with the symmetry condition
Tl,m = 0 for 1+m odd (7)
let us assume ll,n = f, -+ig, (8)
l,m l,m Because of the real nature of the neutron flux, y(x,y, Ji.), we obtain:
1,-m l,m a — / i\m+1 9l,-m <-D 9
(9) l,m
Eqs. (6), (7) and (16) give for the P approximation ten partial differential equation of the firs order for the functions f , g with i,n=o,i,2.3 and i + m even. , m
l(m
- 24A
Boundary Condition
The Davis vacuum boundary conditions are applied: Jj^^lK^-r^Dy^J^) =i ( 1 0 ) ,.;i. c
where n is the normal to the surface at the point r and 1 = 0,2,..L-1, when L is odd.
r-z geometry We obtain from eq. (10) the boundary condition for the upper
and lower boundaries in the form of three algebraic, linear, homogereous equations for the unknown moments,- Y„v • VlO' ^20 and V30- F o r t l l e cylindrical surface, four algebraic, linear, homogereous equations for the unknown moments: V'OO' "Ul' V'22' C ,31' v 3 3 -
x-y geometry Similar to the case of r-z geometry the boundary condition
are here reduced to algebraic linear, homogeneous equations as follows: surfaces x=0, x=X: four equations for the functions t ,t ,1 ,
f31' f33 " surfaces y=0, y=Y: three equations for the functions fnr.»g, ,g,,,
REFERENCES J.K. Fletcher - "The solution of the multigroup neutron transport equation using spherical harmonics". TRG Report 2547(R). J.K. Fletcher - "The solution of the time-independent multi-group neutron transport equation using spheri-al harmonics" Annuals of Nucl. Energy, vol. 4, p. 401, 1977. James A. Davis - "Variational vacuum boundary conditions for a Pn approximation" . Mucl. Sei. and Eng. vol. 25, p. 189, 1966.
- 25A -
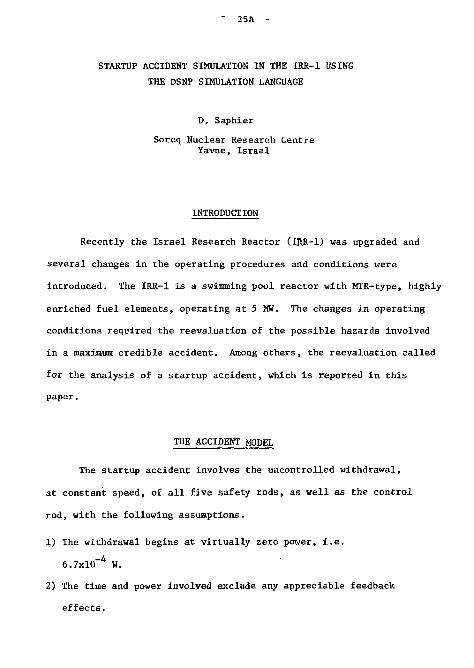
STARTUP ACCIDENT SIMULATION IN THE IRR-1 USING THE DSNP SIMULATION LANGUAGE
D. Saphier
Soreq Nuclear Research Centre Yavne, Israel
INTRODUCTION
Recently the Israel Research Reactor (IRR-1) was upgraded and
several changes in the operating procedures and conditions were
introduced. The IRR-1 is a swimming pool reactor with MTR-type, highly
enriched fuel elements, operating at 5 MW. The changes in operating
conditions required the reevaluation of the possible hazards involved
in a maximum credible accident. Among others, the reevaluation called
for the analysis of a startup accident, which is reported in this
paper.
THE ACCIDENT MODEL
The startup accident involves the uncontrolled withdrawal,
at constant speed, of all five safety rods, as well as the control
rod, with the following assumptions.
1) The withdrawal begins at virtually zero power, i.e.
6.7xl0~4 W.
2) The time and power involyed exclude any appreciable feedback
effects.
- 26A -
3) The operator and all the safety cricuits, with the exception
of the power level trip, fail to operate.
4) The only SCKAM mechanism in the reactor is the reactor overpower
which is activated at 12 MW, and results in the safety rods
being accelerated into the core.
5} There is a 60 millisecond delay between the SCRAM signal and
the beginning of safety rod insertion.
System safety requirements demand that the total power liberated
in a startup accident, assuming worst conditions, does not exceed
80 MWs (design base accident). In the previous safety evaluation
the to t^ l l i be ra t ed power was estimated to be 4 .1 MWs. No damage to the
fuel rod w i l l occur below 8 MWs.
To calculate the integral power generated during the startup
accident, the kinetic equations (1) and (2) have to be solved
fi.fidLn + J X ^ + S (1)
dC ß,
dr = r - ¥ i w
where n is the total number of neutrons in the reactor at any time;
C. is the delayed neutron precursor of the ith group (i=l,...6);
p is the reactivity (k f^-D/k f ; 8. is the neutron lifetime;
B. is the ith group delayed neutron fraction; and S is the neutron
source. The initial neutron level n , assuming a source of
S neutrons/s, is obtained from equation CD» and is given by
n «• (3) o p
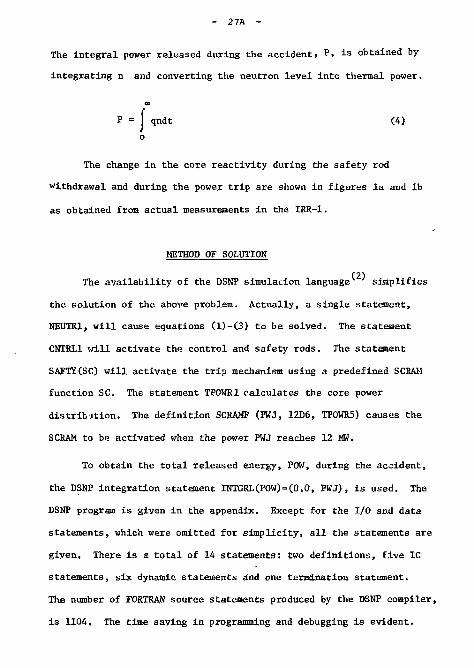
- 27A -
The integral power released during the accident, P> is obtained by
integrating n and converting the neutron level into thermal power.
P = j qndt (4) o
The change in the core reactivity during the safety rod
withdrawal and during the power trip are shown in figures la and lb
as obtained from actual measurements in the IER-1.
METHOD OF SOLUTION
(2) The availability of the DSNP simulacion languagev simplifies
the solution of the above problem. Actually, a single statement,
NEUTR1, will cause equations (1)-C3) to be solved. The statement
CNTRL1 will activate the control and safety rods. The statement
SAFTYCSC) will activate the trip mechanism using a predefined SCRAM
function SC. The statement TP0WE1 calculates the core power
distribution. The definition SCRAMF (PWJ, 12D6, TP0WR5) causes the
SCEAM to be activated when the power PWJ reaches 12 MW.
To obtain the total released energy, POW, during the accident,
the DSNP integration statement INTGRL(POW)=(0.0, PWJ), is used. The
DSNP program is given in the appendix. Except for the I/O and data
statements, which were omitted for simplicity, all the statements are
giyen. There is a total of 14 statements: two definitions, five IC
statements, six dynamic statements and one termination statement.
The number of FORTRAN source statements produced by the DSNP compiler,
is 1104. The time saving in programming and debugging is evident.
3 4 5 6 t (min)
7 8 9 10 0 Ql 0.2 0.3 t(s) Q4 0.5
Fig, la: Change in reactivity as a function of time resulting from safety and control rod withdrawal at constant speed from the IRR-1.
Fig, lb: Change in reactivity as a function of time resulting from reactor SCRAM.
29A
Time (sec) 357 359 361 363 365
120 180 240 300 360 Time (sec)
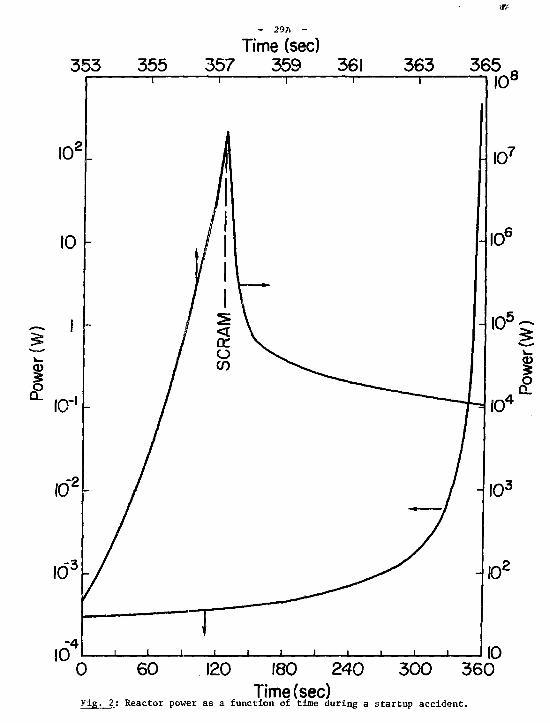
Tip. 2: Reactor power as a function of time during a startup accident.
- 30A -
RESULTS
The transient power during the startup accident is shown
in fig. 2. Note the two different time and power scales in the figure
necessary to cover the 11 decades of power change. Although the
SCRAM signal is generated when the power reaches 12 MW, the cpntrol
and safety rods start falling only 60 milliseconds later. .M.S a
result the peak power reached is 20 MW. The total integral power
released during tha startup accident is 5 MWs. This value is far
below any danger to the reactor, and compares well with the previous
estimate of 4.1 MWs.
REFERENCES
(1) J. TADMOR, "Israel Research Reactor-1, Hazards Evaluation Report",
Israel Atomic Energy Commission, IA-689 (1961).
(.2) D. SAPHIER, "The Simulation Language of DSNP: Dynamic Simulator
for Nuclear Plants", Argonne National Laboratory, ANL-CT-77-20
(1978).
31A -
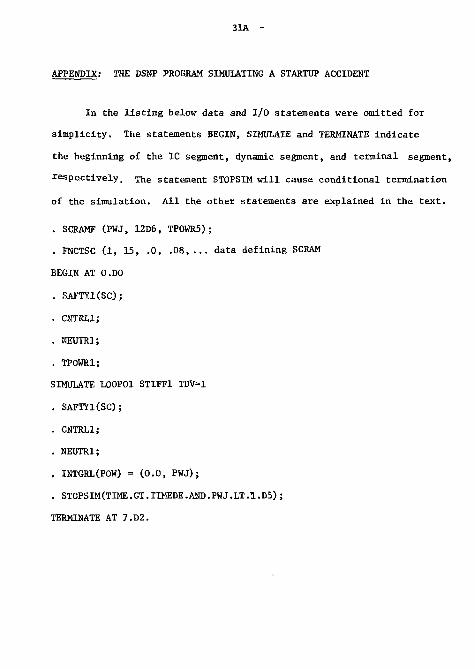
APPENDIX: THE DSNP PROGRAM SIMULATING A STARTUP ACCIDENT
In the listing below data and I/O statements were omitted for
simplicity. The statements BEGIN, SIMULATE and TERMINATE indicate
the beginning of the IC segment, dynamic segment, and terminal segment,
respectively. The statement STOPSIM will cause conditional termination
of the simulation. All the other statements are explained in the text.
. SCRAMF (PWJ, 12D6, TP0WR5);
. FNCTSC (1, 15, .0, .08,... data defining SCRAM
BEGIN AT 0.D0
. SAFTYl(SC);
. CNTRL1;
. NEOTRI;
. TP0WR1;
SIMULATE L00P01 STIFF1 TDV=1
. SAFTYl(SC);
. CNTRL1;
. NEOTRI;
, INTGRL(POW) = ( 0 . 0 , PWJ);
. STOPSIM(TIME.GT.TIMEDE.AND.PWJ.LT.1.D5) ;
TERMINATE AT 7 .D2 .
32A -
GENERALIZED PERTURBATION THEORY FOR BURNUP, XENON POISONING AND REACTOR SAFETY PROBLEMS
E. Greenspan Nuclear Research Center-Negev, and Department of Nuclear Engineering Ben-Gurion University of the Negev
Time-dependent perturbation theory formulation for the neutron and nuclide fields have recently been deve-
(1 2) loped by Gandini ' t o enable sensitivity and uncertainty analysis of nuclide transmutation and fuel burnup problems. The burnup problem is, in general, non linear due to the coupling between the neutron and the nuclide fields. Gandini's formulation accounts for the coupling between these fields only partially and indirectly; it consists of uncoupled time-dependent generalized perturbation theories (GPT) for the neutron field and for the nuclides field which are applied iteratively - using the nuclide density distribution in the unperturbed reactor one applies GPT to calculate the effect of the perturbation on the neutron distribution. This perturbation in the neutron field is then used to define the perturbation in the nuclides transmutation operator which provides the input for the application of GPT to the nuclide field. The change in the nuclide field does not feed back to the change in the neutron field.
In this work we report on a more general time-dependent perturbation theory for the coupled neutron-nuclide fields which fully accounts for the corpling between variations in the neutron and nuclide fields and in a direct,
- 33A -
rather than iterative, manner. Moreover, we expand the perturbation theory formulation to include temperature feedback effects, Such effects are necessary for the analysis of a variety of safety problems.
Consider performance parameters of two forms * * R : S /dt<S (x;t),«(x;t)>//dt<Sd(x;t),*(ic;t)
and (1)
R, 5 /dt/drM (r;t)N (r ; t)//dt/drM,(r;t)N.(r; t) I - n - n - — d - a - (2)
where x=(r,E,$!) and <,> stands for /dr/dE/dfl. S represents a detector response function (a cross sec-* tion like quantity) while M is usually set to be 6(reV )6(t-t ) where V and t are the region and - m m m m time the inventory of the nuclide of interest is looked for. Examples for R. are the breeding ratio and peak-to-average power density. An example for R_ is the isotopic composition at end-of-life (EOL).
(3) In the perturbed reactor we get , up to second order accuracy in 6S ,ätf>,äN etc., 6R, / d t < 6 S , * > / d t < ( S S * «>
n* d* / d t < S * , « > / d t < S* $>
J"dt<6<J>,S*> / d t < 6 < J , S * >
/ d t < * , S > n / d t < * , S d > (3)
and
34A -
äR, /dt/clrM ON I - n n
K, Vdt/drM N 2 - n n
Idt/drH,6N. - d d
/dtJ"drM*N. - d a
(4)
The f 1 u x, $ , and neutron density,N . , distri
butions required for evaluating the perturbation
theory expressions are the solution of the follo
wing set of coupled non-linear equations:
1 3 TT + £ i-V + Z - (1-R)< '/Ef't
P I V d C d (5)
tt-+ X6 Cd " £ u V (6)
3r i ai N. -Jf i
N . I a . J J- .1*i
(7)
|fe*«J T + hi, * = W (8)
The above equations are written using simpli
fied, somewhat symbolic, notations for the sake of
abreviation; all the independent variables and
integral signs, for example, have been omitted.
Only one group of delayed neutrons is considered.
The temperature equation is taken after Becker.
Temperature variations are assumed to affect the
neutron flux distribution via the temperature
(4)
- 35A -
dependence of the cross sections
3T or y _ 1
a 3T x
(9)
The perturbations in the flux, 6$, and
nuclide density, 5N., distributions can be obtai
ned from the solution of the following set of
coupled linear equations [obtained from Eqs.
(5) - (9)] :
7 Ü T + 8 - v + h ( l - ß ) X p u £ £ j 5 «
- A . X . O C J + Z la . - a . - < ! - £ . ) v . « . a . . 4>6N. il d ° i [ t i s i i A p i i f i j i
+ a S 4 - a £ * - (1-B)X u a j , » 5T = 0 I t t s s *p f r ^
(It + A d) 6 c d - <ß"V«> - l ( B i V f i W i
- (ßua f E f <t>)5T = 0
| ~ + X. + a . * | 6 N . - I | a _ . * + X, , | 6 N . l » t i a i J i j ) t i ( j + i j-ij J
l 1 ai j r i J J-iJ
1'ai ai i J ; / 1'aj->-i J-"i j J i
(10)
(11)
(12)
~ + a + b£ N.Y-.or.«|6T + bE,<54> + bL o,.*oN 3t i'fi fi f i 0 (13)
Thi> perturbation theory formulation outlined above is inefficient when one wishes to calculate the of foct of a large variety of perturbations .in ,i smil] number of performance parameters (such ,i« Ln sensitivity analysis). For sucli applications it. is ck'sirenblo to transform the formulation into la>\ adjoint space, To do so we define the t o 1 1 ow i-i v, set of coupled linear equations which
( 1 3 ) : a d j o L t i t t o t h e s e t o f e q u a t i o n s ( 1 0 )
1 v 3 t - 1.2. V 5: - 21 ( l - t K ' E j X . ] < - R " z f c d
; i . [ o .a. i a i i
;>t
i o- . s. ] + b r , r = j * i X * J -> f
» d x d *
• S - + X . + 0 . 0 N . -S t a. a i j i " i - * * j f i J |
l 0 t r ° S i - ( 1 - £ i > u i 0 f i X p i ) * *
. . . , . l f i * ) C * + (hi o f i *JT* = HJ
- )
( 1 4 )
( 1 5 )
( 1 6 )
a n d
+ <P
[. |_ + a + b, M l Y f i a £ i * j T *
Z N 1Y .a ,s! - S Y o.^JN, - 0 i ' ( " » l i j M a 1 + j i-j jj
subjected to the boundary condition of zero outgoing *
importance and to the final condition of * (t f) ™
C (t f) = N (t.) =T (t,)=0. In terms of these adjoint
functions the perturbation expressions of Eqs. (3)
and (-'») can be expressed as follows:
(17)
OR, /dt<6s' ,<!>> /dt<öS,,<ä» n' d'
/dt<S ,*> /dt<S ,,$> n* d*
+ 1 ,'dr /dtiv'*^ + J*(r;t 1)6N 1(r;t 1)J
* with N obtained from the solution of Eqs. (14) -
1 * (17) with the source terms H =0 and
* a 1
S S ,
/dt<*,S*> /dt<4>,S >
(18)
(19)
Similarly
OR
" 2
ÖK, I * * I —^ = £ /dr /dtN I6M i + N 1(r;t 1)6N i(r;t 1)j
(20)
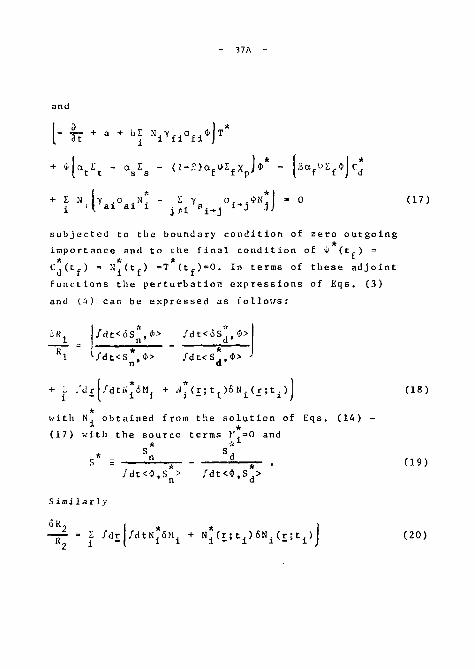
- 387V -
vhere the N 's are now the solution of Eqs. (14) 1 * (17) subjected to the source terms S and II,
i /dt/drM N - n n ln » i /dt/drM.N. - d d
6' , :M.=0, i*-d,n id x (21)
Expressions (18) and (20) provide efficient formulations for calculating the effects of many different alterations in th? initial composition, ON., and/or in the composition of the reactor during its operation, Sil. (Such as the movement of control rods) on the performance parameters of interest at any future time. The coupling between the neutron, nuclides and temperature fields is taken into account by the definition of the adjoint functions. The computational effort required for the solution of the adjoint equations is equivalent to that required for the solution of the corresponding set of forward equations.
REFERENCES
(1) A. Csndini, "A Method of Correlation of Burnup Measurements for Physics Prediction of Fast Power - Reactor life", Nucl. Sei. Eng. 3J3» 1 (1969).
(2) A. Gandini, M. Salvatores and L. Tondinelli, "New Developments in Generalized Perturbation Methods in the Nuclide Field", Nucl. Sei. Eng. 62, 339 (1977).
- 39A -
(3) E. Greenspan, "Developments in Perturbation Theory", in Advances in Nuclear Science and Technology, Vol.9, 181 (1976).
(A) M. Becker, The Principles and Applications of Variational Methods. The M.I.T. Press, 1964.
(5) E. Greenapan, "On the Adjoint Space in Reactor Theory", Annals of Nucl. Energy, 3_, 323 (1976).
- 40A -
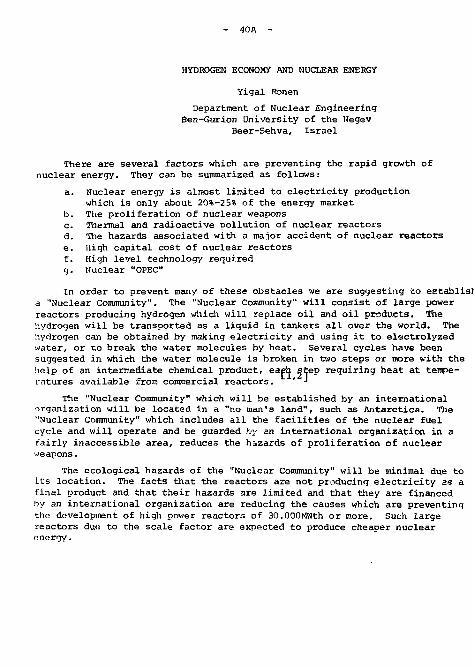
HYDROGEN ECONOMY AND NUCLEAR ENERGY
Yigal Ronen Department of Nuclear Engineering
Ben-Gurion Universi ty of the Negev Beer-Sehva, I s r a e l
There are several fac tors which are prevent ing the rapid growth of nuclear energy. They can be summarized as follows:
a. Nuclear energy i s almost l imi ted t o e l e c t r i c i t y production which i s only about 20%-25% of the energy market
b . The p r o l i f e r a t i o n of nuclear weapons c. Thermal and rad ioac t ive po l lu t ion of nuclear reac to rs d. The hazards associa ted with a maior accident of nuclear r eac to r s e . High c a p i t a l cost of nuclear r eac to r s f. High l eve l technology required g. Nuclear "OPEC"
In order to prevent many of these obstacles we are suggesting to establish a "Nuclear Community". The "Nuclear Community" will consist of large power reactors producing hydrogen which will replace oil and oil products. The hydrogen will be transported as a liquid in tankers all over the world. The hydrogen can be obtained by making electricity and using it to electrolyzed water, or to break the water molecules by heat. Several cycles have been suggested in which the water molecule is broken in two steps or more with the help of an intermediate chemical product, eaeh Step requiring heat at temperatures available from commercial reactors. ' *
The "Nuclear Community" which will be established by an international organization will be located In a "no man's land", such as Antarctica. The "Nuclear Community" which includes all the facilities of the nuclear fuel cycle and will operate and be guarded by an international organization in a fairly inaccessible area, reduces the hazards of proliferation of nuclear weapons.
The ecological hazards of the "Nuclear Community" will be minimal due to its location. The facts that the reactors are not producing electricity as a final product and that their hazards are limited and that they are financed by an international organization are reducing the causes which are preventing the development of high power reactors of 30.000MWth or more. Such large reactors due to the scale factor are expected to produce cheaper nuclear energy.
- 41A -
The peaceful prosperity of humanity depends to a great extent on cheap and secure energy sources. We have witnessed in the past, the effect on the world of the cartelization of energy sources by a small number of nations.
Thus, the obvious solution is that the world energy sources should be aoverned by an international body whose aim is to secure cheap energy, free fron uolitical consideration, for the benefit of Mankind.
Inferences
1. 0. do tsor.i and C, Karchetti, Ilydroqen, Key to the Cnerqv Market -Kurospectra, Vol. IX, No. 2, 46 (1970).
2. C. llarchetti. Hydrogen and Energy,Chemical Economy and Engineering Review, January 1973.
- 42A -
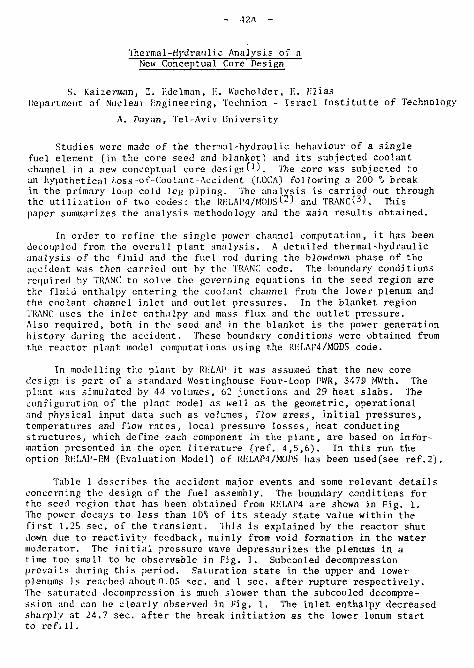
Thermal-Hydraulic Analysis of a New Conceptual Core Design
S. Kaizerman, Z. Kdelman, H. Wacholder, V.. Rlias Department of Nuclear engineering, Technion - Israel Institutte of Technology
A. Payan, Tel-Aviv University
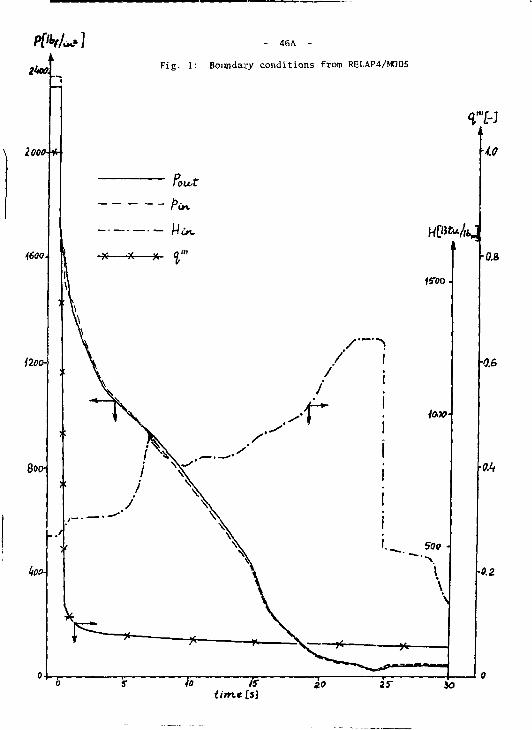
Studies were made of the thermal-hydraulic behaviour of a single fuel element (in the core seed and blanket) and its subjected coolant channel in a new conceptual core designO. The core was subjected to an hypothetical l-oss-of-Coolant-Accldent (1.0CA) following a 200 % break in the primary loup cold leg piping. The analysis is carried out through the utilization of two codes: the RELAP4/M0ns(2) and TRANC( 3). This paper summarizes the analysis methodology and the main results obtained.
In order to refine the single power channel computation, it has been decoupled from the overall plant analysis. A detailed thermal-hydraulic analysis of the fluid and the fuel rod during the blowdown phase of the accident was then carried out by the TRANC code. The boundary conditions required by TRANC to solve the governing equations in the seed region are the fluid enthalpy entering the coolant channel from the lower plenum and the coolant channel inlet and outlet pressures. In the blanket region TRANC uses the inlet enthalpy and mass flux and the outlet pressure. Also required, both in the seed and in the blanket is the power generation history during the accident. These boundary conditions were obtained from the reactor plant model computations using the RF.LAP4/MOD5 code.
In modelling the plant by RFLAP it was assumed that the new core design is part of a standard Wostlnghouse Four-Loop PWR, 3479 MWth. The plant was simulated by 44 volumes, 62 junctions and 29 heat slabs. The configuration of the plant model as well as the geometric, operational and physical input data such as volumes, flow areas, initial pressures, temperatures and flow rates, local pressure losses, heat conducting structures, which define each component in the plant, are based on information presented in the open literature (ref. 4,5,6). In this run the option RFLAP-F.M evaluation Model) of Ri-:LAP4/M0D5 has been used(see ref.2).
Table 1 describes the accident major events and some relevant details concerning the design of the fuel assembly. The boundary conditions for The seed region that has been obtained from RF.I.AP4 are shown in Fig. 1. The power decays to less than 10-6 of its steady state value within the first 1.25 sec. of the transient. This is explained by the reactor shut down due to reactivity feedback, mainly from void formation in the water moderator. The initial pressure wave depressurizes the plenums in a time too small to be observable in Fig. 1. Subcooled decompression prevails during this period. Saturation state in the upper and lower plenums is reached about 0.05 sec. and 1 sec. after rupture respectively. The saturated decompression is much slower than the subcooled decompression and can be clearly observed in Fig. 1. The inlet enthalpy decreased sharply at 24.7 sec. after the break initiation as the lower lenum start to refill.
- .1 iA -
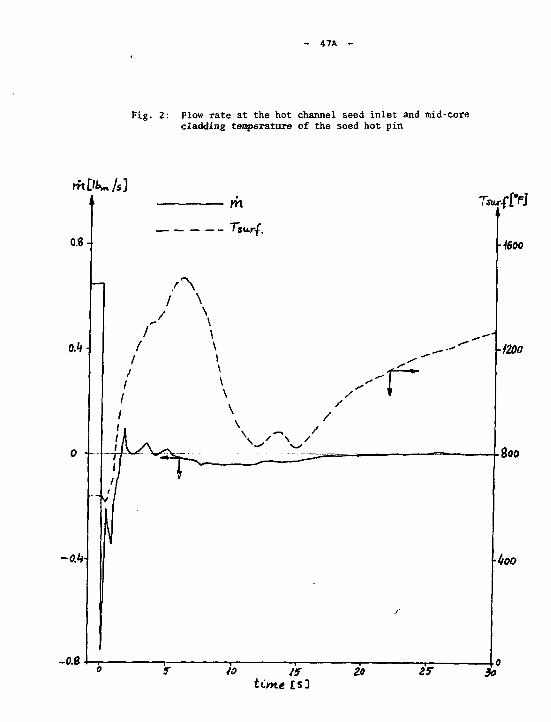
In Figure 2 the coolant inlet flow rate and the mid-core surface temperature in the hot-channel of the seed as obtained from TRANC are presented. The relative decompression rates hetween the plenum determine both the magnitude and the direction of the core flow. At times 1.6 sec. and S.S sec. after break such oscilations of the coolant flow rate in the channel inlet are observed. The increase in the clad surface temperature after 0.5 sec. is due to DNB. The cladding temperature reaches a maximum of )470°]-' about 6 sec. after the rupture and then starts to decrease due to higher negative flow in the channel. At 15 sec. after break, the surface temperature increases again due to the reduction in the channel flow rate. The fine structure of the temperature curve is determined hy the various heat transfer models and two-phase flow patterns in the core during the accident.
The present method which uses the III:]AI' code for the overall loop calculations in conjunction with the TRANd code is shown to he useful for obtaining more detailed results for a single power channel in the core. Two of the most important acceptance criteria of NRC have been veri f i cd :
The calculated maximum cladding temperature should not exceed 22IM"V.
The calculated total oxidation of the cladding should no where exceed il.lT times tin. total cladding thickness before oxidation.
The present results indicate a maximum cladding temperature of about I5flO°I; and total oxidation of about 0,1°, which proves that the fuel elements in this new conceptual core design arc acceptable.
• MA
Table 1 ; Major livcnts of the Accident and l-'uel Assemblies Data
Time (sec) 0. .010002
(!. ,02
0.
4.
15
•15
Major 1: vents
llvent 2
Instantaneous 200°» break (4.125x2 ft a r e a ) .
Pump power shutoff. No scram.
The pressure begins to reduce in the core .
The accumulator on the broken loop i s turned on. Satura t ion has occurred in the i n l e t piping from the intact loops to the pressure vesse l .
3.0 - The flow through the secondary s ide of steam
generator is stopped by valves .
12.5 - i'ho accimiulator on the i n t a c t loops i s turned on.
14.7 - The flow from the i n t a c t loops to the reac tor vessel i s reduced to zero.
lfa.5 - The accumulator coolant begins to f i l l the upper down comer, bypass the lower downcomer and flows through the break to the containment.
21.0 - The lower I'lumun i s f i l l e d with steam.
22.71 - hnd of bypass.
24.7 - S t a r t of r e f i l l .
fuel Assemblies data
Seed II - Blanket l-'uel Composition - 0.12 PuO./O. bt> HO /0.22 Zr0? - same (Atomic l a s s fraction) Maximum volumetric - 835 w/cc - 387 w/cc power generation i n hot cliunnrU Lat t i ce Configuration Triangular array- - same Pi tch - 0.03865 ft - 0.03484 ft Average coolant - 30.5 f t / s ec - 26.S f t / s e c veloci ty
- A'jh -
References
A. Radkowsky, Tel Aviv Univers i ty , Personal communication, (1978) .
Aerojet Nuclear Company, "R):.l.AP4/MOD5 - A computer program for t r a n s i e n t thermal-hydraulic analys is of nuclear r eac to r s and r e l a t ed systems u s e r ' s manual", ANCR-NUREG-1335, C1976].
Kaizcrman, S . , "'Hie Thermal-Hydraulic Response of a PWR Puel Rod a t Accident Condit ions", M.Sc. Thes is , Technion-1.1 .T . , (1978).
So lbr ig , C.N., Barniun, I)..J., "The RK1.AP4 computer Code: Part 1. Application tu Nuclear Power-Plant Analys is" , Nuclear Safety, Vol. 17, No. 2, pp. 194, (197b).
Barnum, I)..J,. So lb r ig , CIV., "The RÜ1.AP4 Computer Code: Part 2. Hngineering Design of the (Input Model", Nuclear Safety, Vol. 17, No. 3, pp 299, (1976).
Barnum, Ü.J . , Solbi'ig, C.W., "The Ri:.I,AP4 Computer Code: Part 3. I.OCA Analysis Results of a Typical PWR Plan t" , Nuclear Safety, Vol. 17, No. 4 , pp 422, (1976)
PfV^J Ikoo.
- 46A -
Fig. 1: Boundary conditions from RELAP4/M0D5
\ lOQO- Mr
4600-
Koo
doo-
koa
la is time[i]
- 47A
Fig. 2: Flow rate at the hot channel seed inlet and mid-core cladding temperature of the seed hot pin
rfiDWs] 1
10 /f tCnte £s3
29 ZT 40 So
- 4SA
CONTAINMENT OUTFLOW PARAMETRIC STUDY AND SAFETY CONSIDERATIONS FOLLOWING A LOSS OF COOLANT ACCIDENT
By A. Kenigsberg -id A. Einav Israel Atomic Energy Commission, Pov." Reactor Division
EXTENDED SYNC'S I!
The present work deals with an exterial containment penetration followed by a Loss Of Coolant Accident (LOCA), and reveals the necessity of researching the following donains: a. Fission fragment behaviour which is dependent upon the thermo
dynamic release mechanism of corium ar.J core construction materials.
b. Thermodynamic properties controlling relevant mechanisms like adsorption, diffusion, transport and chemical reaction while fission fragments are under containment accident conditions as analyzed in the work.
c. Development and adjustment of a probabilistic methdology for calculating the potential risks and their corresponding probabilities (including containment system analyses, fault tree analyses, etc,),
The containment safety studies, analyzing Loss Of Coolant Accident events, include two essential elements (histories):
1. Containment pressure and temperature transients of the air-steam mixture (the carrier medium history).
Fission fragment release behaviour (the radioactive material history).
The integral effect of the two elements yields the radioactive release characteristics outside the containment (dependent upon containment integrity), and is the base data for successive risk assessment 'steps .
- 49A -
An atmospheric radioactive release is a sequence of mainly two events:
1. Containment integrity failure due to internal overpressure.
2. A penetration hole in the containment wall created at the beginning of the accident (initiating it) - as in a missile shot event.
This work analyzes the main parameters involved, emphasizing the second case (missile penetration) which has been rarely studied.
As shown in fig. 1, there is an essential difference between those two events, resulting from the time sequences of the carrier medium and the radioactive material histories:
1. The first event (containment overpressure) consists of a simultaneous development of the two histories: the core cooling water flashes into the containment causing a pressure build-up of air-steam mixture, while as a result of that Loss Of Coolant Accident (LOCA), the fuel temperature rises to melting and causes fission-fragment release.
2. The second event (missile penetration) might be basically different: the carrier medium starts flowing out at the beginning of the accident, completing most of the release within 2-5 minutes depending on the penetration size. Core meltdown (if occures) happens usually considerably later (20-60 min.), when the driving force is zero of very small. The result is a very slow and long release that might Involve considerably lower radioactivity due to physical, chemical and radioactive attenuation.
The outflow rate calculations were based on Thermal-Hydraulic equations using mass-energy balance, steam-water data, heat conduction and fluid flow equations. The main computation tool was the CONTEMPT-LT computer code (1).
A more elementary calculation level using a desk-calculator program was developed in order to check against the CONTEMPT-LT results. An example of such a comparison yielding good correlation, is included. A parametr-ic study of outflow effects was performed providing important information "about outflow behaviour and properties following the accident. Parameters investigated were: a. Hole size In containment shell ranging 1-100 square foot and resulting parameters such as:
- 50A -
b, Pressure transient behaviour (up to a peak of kS Psia), c. Outflow rate transient (up to a peak of 2.8x10⁶lbm/hr), i. Time to end of containment outflow (ranging 50-500 seconds), '•"ig. 2 is an example of the mentioned parametric study. A sensitivity representation sumerizes the whole range of the involved paramerers.
The time to end of outflow has a special importance since the outflow driving force degrades to zero, resulting an essential change from forced flow through the containment hole to different transport mechmisms, e.g. diffusion etc. The time to end of outflow coinciding with postulated core meltdown timing, shapes the radioactivity release profile as examplified in fig. 1.
The results stress the importance of research in the field of material thermodynamic properties and fission product release mechanisms as mentioned in the preamble.
Since these issues were not yet researched in the mentioned applications, they are important for a more realistic conainment safetly analysis involving external initiated containment breach.
REFERENCES
1. L.L. Wheat, R.J. Wagner, G.F. Niederauer, C.F. Obenchaln, "CONTEMPT-LT- a Computer Program for Predicting Containment Pressure - Temperature Response to a Loss of Coolant Accident", Aerojet Nuclear Company, TID-4500 (supplied by ACC).
2. Consolidated Edison Company of New-York, Inc., Indian Point Nuclear Generating Unit No. 3, "Final Facility Description and Safety Analysis Report", U.S. Atomic Energy Commission, Docket N0.5C-286, Exhibit B-12,
3- J. Kenneth Salisbury, "Kents' Mechanical Engineering's Handbook: Power", John Willey 6 Sons, Inc., Twelve Edition, p. 1.11.
51A -
Fig. 1: Comparison of potential LOCA scenario: internal Initiating event (pipe break) Vs. external initiating event (containment penetration).
10' 10' time (sec)
c o r e iiu'ltduwiL
16' 16 * ioJ/
time (sec)
t ime (sec)
LEAKRATES FOR 1 -20 SQ. FT. HOLES
ID
<
(D Ol
, i t D — <I> O
TIME ( SECONDS )
- 53A -
SLOWDOWN DATA AS AN INPUT TO CONTAINMENT ANALYSIS DURING A LOSS OF COOLANT ACCIDENT IN PWR
By A. Kenigsberg, Israel Atomic Energy Conmisslon Power Reactor Division.
A nuclear reactor pressurized system at a loss of coolant accident undergoes a massive water discharge out of Its primary system. This blowdown phenomenon i«ight uncover the core and is usually followed by a ref i I I-ref lood |j|>.v;e ;n which emergency cooling water is Injected.
Being at high temperature, and pressurized, the primary system water flashes into the containment atmosphere being separated into sump water and steam which is the main reason to temperature and pressure build-up in the containment.
Starting with blowriown data (primary system mass discharge rate) one can calculate the steam accumulation rate in the containment and proceed to evaluate the resulting pressure transients. Steam accumulation rate can be obtained by mass and heat balance:
(1 ) M T - M w + M s
(2 ) M T H T = M W H W + M S H S
Where:-
M T : Primary system mass discharge rate.
M : Steam accumulation rate.
M : Sump water accumution rate.
H : Enthalpy per mass unit of primary system water.
H : Enthalpy per mass unit of accumulating steam.
H : Enthalpy per mass unit of sump water.
- 54* -
Yielding: (3)
Neglecting additional heat and mass transfer, equation 3 enables to estimate pressure and energy accumulation in the containment.
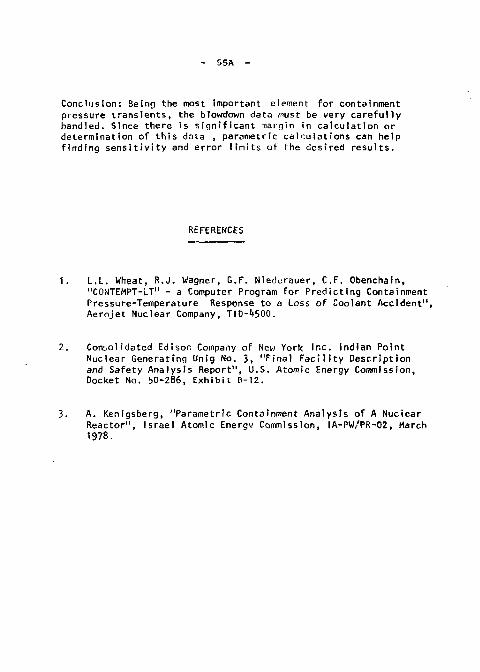
In order to calculate extensively and more accurately the influence of primary system blowdown on containment pressure transients, the computer code "CONTEMPT" (1) was run using numerical models as evaporatlon-c.ondesation, heat sink by structural materials and steam-water properties. The blowdown basic data is a tabular data of water discharge rate through time taken from the final safty analysis report of a PWR (2).
Fig. 1 shows the resulting pressure transients In the containment for the reference case of blowdown da:? (intensity factor=l), with four additional pressure transients corresponding to four intensity factors relatively to the reference case. For example -an Intensity factor of 1.5 represents a blowdown data where all discharge rates are 1.5 times the discharge rates of the reference data. The pressure transients are consistent with the blowdown Intensity parameter showing high pressures for high discharge rates.
• A second effect that was studied was the time table of the blowdown. Fig. 2 shows the reference case plus two additional cases: one of a "streched" time table (time factor=l.Z5) putting all discharge rates at times longer 1.25 times than those of the reference case, and the other case having a "shortened" time table (time factor=0.70). The resulting pressure transients are represented in fig. 2. Note that the integral mass of discharged water Is not constant.
Figures 1 and 2 correspond to the mentioned blowdown input followed by a ref i 11-reflood phase of emergency cooling «ater flash out. Fig. 3 shows a calculation having the reflood phase eliminated, compared with the reference case. The result Is a lower pressure transient by 25^-30? pointing out that the core rewetting mechanism causes an additional containment pressure build-up for a relatively long time.
- 55A -
Conclusion: 3eing the most Important element for containment pressure transients, the blowdown data must be very carefully handled. Since there is significant margin in calculation or determination of this data , parametric calculations can help finding sensitivity and error limits of the desired results.
REFERENCES
1. L.L. Wheat, R.J. Wagner, G.F. Nieiiorauer, C.F. Obenchain, "CONTEMPT-LT" - a Computer Program for Predicting Containment Pressure-Temperature Response to a Loss of Coolant Accident", Aerojet Nuclear Company, TID-^SOO.
Consolidated Edison Company of Nev; York Inc. Indian Point Nuclear Generating Unlg No. 3, "Final Facility Description and Safety Analysis Report", U.S. Atomic Energy Commission, Docket No. 50-286, Exhibit B-12.
3. A. Kenigsberg, "Parametric Containment Analysis of A Nuclear Reactor", Israel Atomic Energv Commission, IA-PW/PR-02, March 1978.
- 56A -
Flg. 1: Containment pressure transients for parametric blowdown intensities
•»i
fe
li
5
IØMH
w
tø
c visd ) aanssaad
57R -
Flg. 2: Containment pressure transients for parametric btowdown time factors
( VISd ) 3&äS&Je
- 58A -
Fig. 3: Containment pressure transient without reflood VS. the reference case (with reflood)
( VISd ) 3mSS38d
- 59A -
Parametric Analysis of Passive Heat Sinks Effect on Containment Pressure Transients
A. Kenigsberg - I s r ae l Atomic Energy Commission and
E. Elias - Department of Nuclear Engineering, Technion
The bui ld-up of containment pressure following a loss of coolant (10CA) i s a r e s u l t of large mass and energy accumulation. During and ai ' ter t ha t accumulation process considerable amount of energy i s t r a n s ferred to the containment i n t e r n a l s t r u c t u r a l ma te r i a l s which act as passive heat s inks . A PWR containment with a t o t a l volume of 3x l0 6 f t ( 8 . 5 x l 0 4 m3) t yp i ca l ly includes 9x105 ft 3 ( 2 . 5 X 1 0 4 in3) of s t r u c t u r a l mater ia l s with large surface area including f loor walls and cons t r u c t i o n s . Energy absorption in passive heat s inks plays an important r o l l in reducing the containment pressure and keeping i t below i t s design maximum allowable value. In a recent paper Hasan and Olsha s tudied the effect of heat removal by passive heat s inks in the f i r s t 25 sec . of the LOCA. The present work deals with the heat t r a n s f e r t o i n t e r n a l s t r u c t u r a l elements during a l l the phases of the accident . Parametric study is presented on the effect of the area and th ickness of the heat sinks on the containment p ressure . Typical 950 NKte PWR containment [2] was chosen as a reference case for the ca lcu la t ions and for the required input blowdown data .
In order to simplify the heat sink problem the containment i n t e r na ls are divided into small s t r u c t u r a l elements. A heat balance equat ion can then be wr i t ten for each element
g(x) 1^ [T(x , t ) ] = V [k«VT(x, t ;>J + S(x , t ) (1)
where k coefficient of thermal conductivity t time T temperature g specific heat (at constant pressure) S heat source per unit volume x space coordinate Equation (1) was solved using the finite differences method in two
separate regions; the containment boundaries and the internal walls. The computations were carried out using the computer code CONTEMPT [3] in cylindrical geometry.
As a model for parametric study of the effect of the passive heat sinks on the containment pressure, the internal walls were simulated by a cylindrical concrete wall surrounding the reactor pressure vessel [4]. Figure 1 coi pares the pressure transient for a typical case which
- 60A -
includes such heat sinks with a hypothet ical case with "no passive heat s inks" . The curves demonstrate the s igni f icance of the containment i n t e rna l s and walls on the pressure t r a n s i e n t s . In the ad iaba t ic case (no passive heat s i n k s ) , the pressure r i s e s continuously because of the continuous mass and energy accumulation in the containment with pressure-drop mechanisms.
Fig. 2 represen ts a parametr ic study considering the wall surface area as the s tudied parameter. As expected, the pressure t r a n s i e n t s are s i g n i f i c a n t l y lower for higher surface areas at the f i r s t 10-15 minutes, and so are the pressure peaks (which have specia l importance when containment i n t e g r i t y and leakage are concerned). The sharp increase of the containment pressure at the f i r s t 10 seconds of the accident i s cont ro l led mainly by the r a t e of coolant discharge from the primary system during the blowdown phase. The effect of the heat s inks in t h i s ear ly period i s obviously neg l igab le . The r e s u l t s in t h i s ear ly phase are in general agreement with the p red ic t ions of Hasan and Olsha [1 ] . After about 1000 $ec the predominant e f fec t on the containment pressure i s the coolan'; discharge during the r e f i l l and reflood phases.
Fig. 3 shows the pressure t r a n s i e n t s for d i f fe ren t wall th ickness . Lower pressures are obtained for higher th icknesses . This i s mainly because a th ick wall absorbs more heat having more t o t a l heat capac i ty .
As a conclusion i t can be seen tha t the influence of the pass ive heat s inks on the containment pressure t r a n s i e n t s i s very meaningful and must be considered thoroughly in containment safety analyses . The s t ronges t effect of the heat sinks i s observed a t the time period from 10 to 1000 sec a f t e r the i n i t i a t i o n of accident .
REFERENCES [I] Dov Hasan and Zvi Olsha "On the Effect of Passive Heat Sinks on
Containment Heat Removal Following a LOCA, Using the CONTEMPT Code", I s r ae l Nuclear Soc ie t i e s Transact ions , Jo in t Annual Meeting, p . 97-102, Dec. 4 -5 , 1977.
[2] Consolidated Edison Company of New Yorfc Inc. "Indian Point Nuclear Generating Unit No. 3, Final F a c i l i t y Description and Safety Anal y s i s Report" USAEC Docket No. 50-286, Exhibit B-12.
[3] L.L. Weat, R.J. Wagner, G.F. Niederauer, C.F. Obenchain, "C0NTEMPT-LT - A Computer Program for Predic t ing Pressure-Temperatu re Response t o Loss of Coolant Accident", Aerojet Nuclear Company, T10-4500. (supplied by ACC).
[4] A. Kenigsberg, "Rarametric Containment Analysis of a Nuclear Reactor", I s r ae l Atomic Energy Commission, IA - PW/PR-02, March 1978.
/
in Q.
VO ij
&&*> 1VJH*-
M >
SS*^" - !
_ _
ii'l
.
SS*^" - !
_ _
ii'l 1 HEAT STRUCTURE^- -^
'• , ' • i ! :
SS*^" - !
_ _
ii'l 1 HEAT STRUCTURE^- -^
'• , ' • i ! :
SS*^" - !
i ! 1
: i i
Ü MM i i ! '
i
Ü lø be izs bee TirC ( SECONDS )
•.zee
- 62R
Fig. 2: A parametric study of containment pressure transients for different wall areas
g t c t c -S-B-aaa
..._ U- -T I
I
1
i -* _ .. -
w
C VISd ) 3fcT6S3Ud
63A -
Fig 3: A parametric study of containment pressure transients for different wall thicknesses
! - - •
in
UJI
2
( visd ) aanssaad
- 6-1 !\ -
Sl'PRATHERMAL REACTIONS DURINC
THERMONUCLEAR BURN OF DT PELLETS
U, S h v a r t s
Nuclear Research Center-Negev PO Box 9001, Beer-Sbeva, ISRAEL
Stationary calculations have shown that under suitable conditions fusion burn can proceed via fusion ciiain reactions. Nuclear Scattering of the fusion burn particles (mainly the neutrons) produce a shower of fast ions, some of which undergo further fusion reactions during their slowinp down. However, practically the fusion burn proceeds via thermal and suprathermal reactions.
Tiiis work reports on a study of the dynamics of fusion burn. The study is done with a time dependent code developed to take into account both burn channels. Since fusion chain reaction proceeds via suprathermal ions, it is desirable to represent the energy dependence accurately, whereas the space dependence may be represented in an approximate manne r.
The code consists of a multi-group, multi-species description of the suprathermal ions population, accounting for Coulomb friction processes, as well as for large energy transfer reactions (due to nuclear scatterings) and supra-thermal fusion reactions. The bulk plasma is represented by a two fluid description for electrons and ions. The energy balance equations account for: (a) energy transfer from fast ions to the bulk plasma ions and electrons (taking into account high density degeneracy effects); (b) radiation
65A
losses; (c) energy exchange between electrons and ions, Hydrodynamic expansion and finite dimension effects (leakage) ara taken into account using a self-similar solution for the expansion and an approximate diffusion coefficients for radiation and particles leakage.
The code has been checked against results of full hydrodynamic and thermal burning calculations of homo-
(2) geneous DT spheres . The time dependent energy yield for various initial conditions (mass, density and temperature) was found to be in a good agreement with the detailed calculations.
The dynamics of the fusion chain reaction has been studied and found to follow an exponential law growth after a very short transient period. The above result leads to simple kinetic equations, from which one can conclude the relative importance of the usual thermal burn and the chain reaction. The characteristic reaction time for the thermal burn is Xl =C*l<aV'>) where n and <(?V> are the particle density and the fusion reaction rate respectively. In the temperature range 4 5 T j f( kt^f T% can be approximated by: T\ *« 0 • >t • ~fytv) s e c . The characteristic reaction time for the suprathermal burn may be defined as XI ~ */o( where *( is the asymptotic exponential growth rate. From the dynamic calculations
it., the smallest value for "C. was about J.J'IO-h sec.
Comparing ~C% with TL we see that for temperatures below 4KeV the chain reaction growth rate is comparable
- 66A -
to that of the thermal burn rate. For VI .jf 10 £**, , as expected in laser fusion the effect of suprathermal reactions «as found to be about 5-10X of the total futt sion reactions. However, for higher densities, vt 5./# end low temperatures, T~ 1 KeV, the high electron cegeneracy was found to give rise to a much more pronounced effect of the chain reaction in the start up of the burti process .
References
1. Peres A. and Shvarts D.; Nucl. Fusion 1_5, 687 (1975).
;:. Fraley G. et al., Phys. Fluids, r7, 474 (1974).
- G7A -
DISCRETE 0RD1NATES SOLUTION OF THE FOKKER PLANCK EQUATION FOR CHARGED PARTICLES TRANSPORT IN PLASMA
* D. Shvarts
Nuclear Research Center-Negev P.O. Box 9001, Beer-Sheva, ISRAEL
The Boltzmann equation for charged particle transport in plasma is commonly reduced to the Fokker-Planck
where the energy (E) and angular (*•) derivative terms are the Fokker-Planck collision operator for problems in which the Coulomb small angle collisions are dominant.
(2) We have already shown how one can cast the energy derivative into a multi-group formulation. When the angular dispersion term can be neglected, the charged particles are moving in straight lines, and one can adopt a neutron
(3) S code to calculate their transport . However, in many n ' practicle cases the angular dispersion term can not be ignored. Calculations which take angular dispersion into account used the Monte-Carlo methods. Recently, the
ft,) Pj method has been also adapted for such calculations. However, the Monte-Carlo calculations are very expensive and in the E method resonable accuracy requires high orders (£). In this work we describe a way to take the angular dispersion into account using the S roeLhod.
For every energy group, in slab geometry, the Fokker-Planck equation takes the form:
- 68A -
where (Jfc and 4L are the slowing down and scattering cross sect ions respectively.
An attempt to solve the above equation by adding the dispersion term, explicitly, to the source, requires very small time steps. In order to allow larger time steps, we have used the Alternative Directions
(5) Implicit (ADI) method . This method provides a second order semi-implicit accurate solution. At each time step the solution is splited into two stages: (a) at the first half time step the angular diffusion term is solved implicitly, and the space transport term explicitly, and (b) at the second half time step, the diffusion is solved explicitly and the transport implicitly. The absorbtion and source terms are splited equally between these two stages. The transport term is solved using the S procedure and the diffusion term is solved using the usual tridiagonal matrix solution.
In order to test our method we have looked ?t the steady state solution for the transmission of a beam through a slab of variable thickness (0.5 to 10 m.f.p) while the scattering fraction C*<L/*£•»•£), was varied between 0 and 1. Analytic solutions to the steady state problem can be obtained in *:wo limits: (a) For C»0 the
-x/A usual exponential solution, T=e is derived, and (b) for O l Bethe^ ' has shown that the solution is, T-0.862/ (x/X + 0.719). Very good agreement has been obtained between these analytical and our numerical results.
- 69A -
This method has been incorporated in a multigroup code for charged particles transport. The effect of the angular dispertion on the Glowing down process of ions and electrons in plasmas was studied using this code.
Work done while on a leave of absence in Orsay University, France.
References
1. Corman E.Ci. et al. Nucl. Fusion 1J>_, 377 (1975) 2. Greenspan E. and Shvarts D., Nucl. Fusion 16.
295 (1976). 3. Shvarts D. , Trans. INS 5., 2A1 (1977). 4. Haldy P. and Ligou J., Nucl. Fusion 17,, 1225 (1977). 5. Roache P.J., "Computational Fluid Dynamics"
Hermosa Publishers (1972). 6. Bethe H.A. et al., proe. of APS vol. 7j}, 573 (1938).
- 70A -
DIRECT VERSUS ADJOINT RECURSIVE MONTE CARLO METHODS
M. Goldstein , E. Greenspan , A. Kinrot and D. Shvarts Nuclear Research Center-Negev
P.O. Box 9001, Beer-Sheva, Israel and*
Department of Nuclear Engineering Ben-Gurion University of the Negev
The recursive Monte Carlo method(l>2) for the estimation of importance functions (aimed for importance sampling applications) is applied by generating "forward" histories pertaining to a source of neutrons applied to a small phase space region and weighting the probability for these neutrons to cross the close-to-detector surface by the value of the importance function at the surface crossing point. The region average importance is then obtained by averaging the importance of all the neutrons in the region considered. This procedure is repeated recursively starting with the closest to detector region and continuing toward the source. I7e shall refer to this procedure us the direct recursive II.C. method.
One can conceive of another recursive procedure in which the adjoint equation is solved straightforwardly in small steps. In this, so called adjoint recursive II.C, method one starts from the detector region and propagates adjunctons (adjoint "particles") histories from surface to surface (or from volume to volume) the system is divided into, until reaching the source region. The purpose of this work is to compare the accuracy and applicability of the two recursive M.C. methods.
In this note we report on results from a simple monoenergetic 2-D deep penetration problem. The system consists of a right circular cylindrical shield of a uniform homogeneous composition having two concentric annular ducts of 7 cm height each. The inner and outer radii of the ducts are respectively, 2 cm and 3 cm for the upper duct and 7 cm and 8 cm for the lower one. The outer radius of the shield is 12 cm and its height is 14 cm. A point ietector is located 10 cm above the shield, on the cylinder axis. An isotropic source is homogeneously distributed on a ring located at the base of the shield in the range 7< r j S cm. The shield cross sections are taken arbitrarily to be %t - 1.0, 1$ = 0.9 (isotropic scattering is assumed) and £a = 0.1. The problem is to estimate the importance function throughout the shield and the detector response.
The particular system geometry described above was chosen to have relatively low values of the importance function near the
- 71A -
source and in regions in which the flux anrolitude is relatively high. Such a problem promise to emphasize tiie significance of accurate enough estimation of the importance function distribution in low importance regions.
For the purpose of the recursive calculations the shield is divided by plane surfaces perpendicular to the cylinder axis. Both the direct and adjoint recursive calculations are performed for !j mfp regions each, followed by a 1 mfr> buffer zone. For the direct recursive calculations we used surtce sources(2) and geometrical imaging techniques^) j separately for the upper half and the lower half of the shield. The surface source is taken to be uniform at each subregion of the phase space"). For the adjoint recursive calculations the source i.s taken to be the distribution of the importance function on the close-to-detector surface (which is known fron the previous step)- The calculation of the importance function on the next surface is oerforraed using a cross-surface estimator.
The importance function values obtained from direct recursive calculations agree very well with the results of Sfj (HOT) calculations, while the results of the adjoint recursive calculations are less accurate, especially for the backward, and forward angular directions. For example, the results from the adjoint recursive calculations, for the first two forward and the last two backward directions in the region 1 < r j 2 cm, H = 10.:"> en arc, respectively, 1.41-10"4± 101, 1.96.10- 4±m, 2.1S-10-5ilO.K and 1.81 • 10-5±12%. The corresponding results from the direct recursive calculations are 2.11-10-4±4.3%, 1.84.10-4±4.7?ä, 2.96-10-5±5.21 and 2 .71 .10-5±4.3%.
Using the importance function from, respectively, the adjoint and the direct recursive calculations for importance sampling, the detector response was found to be 3.02-10~6±4.3% and 4.li-10"6±1.9%. For comparison, the detector response calculated with DOT is 3.85-10""6, Not only the direct recursive flonte Carlo approach gives the more accurate result, but its running time (overall, including both importance function and forward calculations) was only 75% of that of the adjoint recursive approach.
It is concluded that, for the problem considered, the direct recursive Monte Carlo method is more efficient and more accurate than that of the'adjoint recursive Monte Carlo one. This is attributed to the Improved capability of the direct recursive approach for accurately estimating the imDortance function at phase space regions in which the importance function value is relatively small.
- 72A -
Other advantages of the direct over the adjoint recursive Honte Carlo method are its adaptability to geometrical imag-ingf2] and to correlated sanpling(l). With geometrical imaging, the. direct recursive technique is found, for the problem considered to be 7.4 tines faster than the adjoint recursive one. 5y applying correlated sanpling techniques one can reprocess the collision tapes, generated with-the direct recursive method for a "reference" detector, to calculate the importance functions of many different detectors. The adjoint recursive Monte Carlo method, on the other hartd, requires a complete adjoint calculation for each detector.
References
1. II. Goldstein and D. Shvarts - "A Recursive Monte Carlo Technique for Generating Importance Functions", Trans, to. liucl. Soc, 2£ (pp. 261-262) 1978.
2. 11. Coldstcin and E. Greenspan - "Geometrical Inaging and Surface Sources in the Recursive Ilonte Carlo Method" (To be presented at the 1978 Winter Meeting of the AIJS) .
- 73A -
THE RECURSIVE MONTE CARLO METHOD FOR MULTIGROUP PROBLEMS
M. Goldstein and E. Greenspan Nuclear Research Center-Negev
P.O. Box 9001, Beer-Sheva, Israel and
Department of Nuclear Engineering Ben-Gurion University of the Negev
The recursive Monte Carlo method^ 15»( 2), developed so far for monoenergetic problems, consists of "forward" calculations performed for geometrical regions comprising [approximately] of h rofp thick region, followed by a (approximately) 1 mfp thick buffer zone. A difficulty arises in ar lying this recursive procedure to multigroup problems, because the mfp is energy dependent.
One possible way to apply the recursive Monte Carlo method for the solution of multigroup problems is to divide the system into geometrical regions, the thickness of which are one-half of the smallest mfp, h mfp m ^ n (usually corresponding to the lowest energy group), followed by a buffer zone which is one mfp thick in terms of the most penetrating neutrons, 1 mfpmax (usually corresponding to the highest energy group). Such a procedure might be very inefficient especially for problems in which there is a large spread in the mfp as a function of energy.
In this work, we report on two developments which improve the efficiency of the recursive Monte Carlo method, for the solution of multigroup problems.
The use of splitting and Russian roulette techniques, and the use of a correlated sampling technique for "geometrical adjustment", associated with the application of geometrical imagingC2). Consider a system divided into h mfp min thick geometrical regions, followed by a 1 mfpmax buffer zones. To apply the splitting and Russian roulette techniques, the buffer zone is divided into 1 mfpmin thick subregions. Splitting and Russian roulette weights are calculated for each subregion, by assuming a exponential attenuation of the importance function. The main effect of using the splitting and the Russian roulette techniques is the concentration of most of the neutrons getting into the buffer zone close to the region of interest.
The correlated sampling technique is used for adjusting the geometry of a region to be "smaller" than the representative
- 74A -
physical region. The idea is to exclude low-importance parts from the representative region, by defining a "zero density" in those parts, and by "correcting" the collision tapes accordingly. This correction is applied along with the geometrical imaging procedure^).
The effectiveness of the techniques proposed is illustrated, for the two-groups, 2-D shield problem, described in Ref. (31. The shield total cross sections are taken arbitrarily to be £-[-0.3 for the first energy group and l-^-l .0 for the second one.
The problem is to estimate the importance functions throughout the shield, pertaining to the detector response. The recursive Monte Carlo calculations are performed for a 0.5 cm thick region followed by a 3 cm thick buffer zone. This buffer zone is divided into three equally thick subregions for the application of the Splitting and Russian roulette techniques. Geometrical imaging was applied separately, for the upper half and for the lower half of the shield. The correlated sampling technique was used during the calculation of the lowest six regions.
Table 1 compares the results obtained with the recursive Monte Carlo method and the discrete ordinates (S n) method (calculated with DOT) for the value of the importance function in the five radial zones at the bottom surface of the system (the source side). The results from the recursive M.C. calculations agree pretty well with the S n results.
Geometrical Energy group 1 Energy group 2 region S n (DOT) M.C. S n (DOT) M.C.
0 < r s 6 cm 9.3S 10" 6 8.79 10" 6 1.85 10" 6 1.98 10" 6
6 < r 5 7 cm 5.82 10" 6 6.01 10" 6 1.39 10" 6 1.48 10" 6
7 < r s 8 cm 6.49 10" 6 6.95 10" 6 1.91 10" 6 2.03 10" 6
8 < r j 9 cm 5.49 10" 6 5.34 10~ 6 1.29 10~ 6 1.18 10" 6
9 < r s 12 cm 3.61 10" 6 4.96 10" 6 4.78 10" 7 5.08 10" 7
Table 1: Comparison of values of the Importance Function at the Bottom of the Shield.
Using the splitting, Russian roulette and the correlated sampling techniques the calculation time was a factor of 1.6 shorter, than the time it would have taken to solve the same problem with the recursive M.C.method but without these techniques.
\
*/
It is concluded that the splitting, Russian roulette and the correlated sampling techniques can significantly improve the efficiency of the recursive Monte Carlo for multigroup problems.
References
1. M. Goldstein and D. Shvarts - "A Recursive Monte Carlo Technique for Generating Importance functions", Trans. Am. Nucl. S o c , 28_ (pp. 261-262) 1978.
2. M. Goldstein and E. Greenspan - "Geometrical Imaging and Surface Sources in the Recursive Monte Carlo Method" (To be presented at the 1978 Winter Meeting of the A.N.S.)
3. M. Goldstein et al. - "Direct Versus Adjoint Recursive Monte Carlo Methods", These Transartions.
- 76A -
DRY RECOVERY OP CERWIC SINTERED URANIUM DIOXIDE
I . Schwar t z A.n. Mintz Z. H a d a r i
J e o a r t m e n t o f ' I n c l e a r E n a i n e e r i n q
and n u c l e a r Resea rch C e n t e r - Noaev
Uranium d i o x i d e s i n t e r e d p e l l e t s a r e commonly used a s f u e l e l e m e n t s i n l i g h t w a t e r r e a c t o r s . V a r i o u s amounts of w a s t e m a t e r i a l a r e a c c u m u l a t e d d u r i n g t h e p r o d u c t i o n p r o c e s s of t h e f u e l e l e m e n t s . In g e n e r a l , t h e w a s t e m a t e r i a l accumul a t e d amounts t o a p o r o x i m a t e l y 10% of t h e o r i o i n a l feed m a t e r i a l .
Wet r e c o v e r y p r o c e s s of t h a t (JO s c r a p m a t e r i a l i n v o l v e d i s s o l u t i o n i n b o i l i n g HI]0 l i q u i d - l i q u i d e x t r a c t i o n , p r e c i p i t a t i o n of ADU and c o n v e r s i o n t o UO . T h i s m u l t i - s t a g e p r o c e s s i s v e r y c o s t l v .
Dry s c r a p r e c o v e r y p r o c e s s e s ° " t h e o t h e r hand a r e more c o n v e n i e n t , e n a b l i n g d i r e c t r e c y c l i n q of t h e w a s t e m a t e r i a l . I t -nay be u t i l i z e d a l s c t o p r o d u c e f u e l e l e m e n t s w i t h c o n t r o l l e d p o r o s i t v .
Th ree d r y r e c o v e r y r o u t e s a r e commonly u t i l i z e d :
1. Air ca lc ina t ion of waste mater ia l t o U 0 and blending with the o r i g i n a l UO powder.
2. Air ca lc ina t ion to U 0 , then reduction to 'JO., and blending with the o r i g i n a l UO powder.
3. Grinding the waste mater ia l to fine powder and Mending with the o r i g i nal UO powder.
The present study i nves t i ga t e s sys temat ica l ly the s i n t e r i n g qua l i t y of UO powders mixed with various amounts of waste mater ia l processed by the three dry recovery r o u t e s . A r e l i a b l e comparison i s thus poss ible between these three r o u t e s . In add i t ion , the e f fec t of s ieving the added mater ia l has been examined.
Experimental Uranium dioxide was produced by continuous p r e c i p i t a t i o n of ADU, ca lc ina t ion
to V O a t 700°C and reduction of the U 0 in hydroqen flow a t about 700°C. Par t of the o r i g i n a l U07 batch was cold pressed (1 ton/cm 2) to green p e l l e t s and s i n te red in hydrogen flow at about 1600 C for 4 hours . The s in t e r ed p e l l e t s reached %.4±0.3% of t h e i r t i i eore t ica l densi ty [10.97 g r / c c ] ,
Ttie manufactured s in t e r ed p e l l e t s were divided in to three po r t i ons . Each portion was nrocessod to represent the scrap mater ia l according to the respect ive dry scrap recovery.
For each route the recovered waste powder was sieved and divided in to four s ize f r a c t i o n s : >100 |)m; 100-63 \m-, 63-36 um; <36 um.
Eacn of these s ize f rac t ions was blended with the o r i g i n a l powder a t various concentrat ions in the range 0-20% wt %. After homogenization, the various mix-
77A -
tures were cold pressed and sintered under the same conditions as the original 'JO . The densities of the sintered elements were taken as an average of three pellets for each mixture.
Effect of Sieving
The sintering behavior was found to be independent of sieve size fraction both in the case of route 1 and 2. The results wore dependent only on the composition of the mixture.
II 0 Recovery Route
Figure 1 presents the sintering behavior of various mixtures of the original 'JO powder blended with " n r e c o v e r e d by t h e f i r s t r o u t e . The s o l i d l i n e i n t h e f i g u r e s t a n d s f o r s i n t e r e d d e n s i t i e s w h i l e t h e d a s h e d and d o t t e d - d a s b e d l i n e s r e p r e s e n t open and c l o s e d n o r o s i t i e s r e s p e c t i v e l v . The i n c r e a s e i n open p o r o s i t y which i s c a u s e d by U 0 a d d i t i o n i s prob-nbly t h e r e s u l t of t h e l a r g e volume d e c r e a s e which accompan ies t h e c o n v e r s i o n of 'JO., d u r i n g t h e s i n t e r i n g p r o c e s s . The d e c r e a s e i n c l o s e d p o r o s i t y may be due t o t h " c a t a l y t i c e f f e c t of t h e e x c e s s oxygen su .opl ied bv t h e U 0 on t h e s i n t e r i n g h i n e t i c s o f u ran ium d i o x i d e .
U 0 •+ UO Recovery Route J o
Figure 2 (labelling is the same as for Fig. 1) presents the sinterabilities of original powders blended with various amounts (0-15 wt i) of recovered UO produced by the reduction of the U O obtained by the previous route.
There is almost no effect of the recovered DO addition (in the range 0-15 wt %) on the sinterability of the oriqinal UO powder. A slight increase in open porosity, however, is observed i/ithout any change in closed porosity.
Grinding Sintered UP Scrap The third recovery route consists of grinding sintered UO scrap and mixing
the grinded novder with the original UO powder. Fig. 3 presents the sintering quality of sucli mixtures containing up to 20 wt % grounded bO powder. The general trend is towards decreased sintered densities with increasing content of the grounded UO scrap in the mixture.
78A
O I -Ä?
>-I -
cö Z UJ
o Q UJ
tr UJ H Z rø
99 • -
97 - __„ » — —
95 - / \ . / ^ 4
9 3 „/ • — . •
91 m
— i i i
FIG. 1 . % U 3 0 S
10 15
- 5
rø 3 O
a o
2
- /
2 97
> I -
1
É " ~ r - — * — _ _ *
I 1
i i
i i
i
rø 95 2 tu a a ui 93 CC UJ
z rø 91
s /
*
i i
i i
i
rø 95 2 tu a a ui 93 CC UJ
z rø 91
s /
*
_-—--* .„«s.-r^lTjrill
i i
i i
i
5 10 % RECOVERED U 0 2
15
- 4
- 3 W O cc
0
• 1
79A -
Fir.
10 15 ^ G R O U N D E D U 0 2
20
SECTION B
RADIATION GAUGES AND RADIOISOTOPES
in -
Interpretational Model of Gamma Gauge for Moisture Assay in Soil
A. Fishman, A. Notea, Y. Segal Department of Nuclear Engineering, Technion, Israel
Gauging of moisture content in soil is of major importance in controlled agriculture. In the present work [1] a gamma transmission gauge for the measurement of the total moisture content in the soil layer which holds most of the plant roots was studied. The gamma source is lowered inside a pipe that has been driven up to the required depth in the soil. The gauge detection head is located on the surface. The gauge response was examined with Nal (3"x2", 2"x2") and Geiger detectors as function of source depth in soil, moisture content, moisture distribution profile, soil elemental composition md source activities. The model developed is based on exponential behaviour for the primary flux and on a buildup function which describes the secondary flux. Preliminary approaches [2,3] to the buildup function were compared with experimental results. It turned out that the function given by Taylor [4] suits best.
For design the gauge response may be des Tibed by:
2
A a Y exp [ - ($.+l)(y p +u 8)x] (1} o . _. * K s s w J K
source emission rate (photons/sec) mass attenuation coefficient (cm2/g), s - denotes soil, w - water density of soi" (g/cm ) water content per cubic centimeter of soil source-detector representative chord factors obtained from •:'•"? fit
The ß, depends mainly on the deter'or efi-i.-iency, while a is a function of both detector efficiency and as .ay £>"•• nctry.
137 The response of a gauge based o . GM i. »tector for 2.3 mCi Cs at
a depth of 53 cm is shown in Fig. 1. ' < r'irst exponential term in the model influences at 9 values up to %, while for high 6 values the second exponent dominants.
The dependence of the response on the water profile in the soil was studied by following the response as a function of time after short irrigation and by measurement of various arrangements of perspex and concrete slabs. It was found that if the gauge is designed to be
R(0] =
where:
A o
s,w
X
»A
- 2B -
independent of the first exponent, there is no sensitivity to the water profile in the soil. For such gauge the response of Eq. (1) simplifies to
R(9) = A Q a exp[ - (ß+l)CusPs + v^x] (2)
The relative resolving power function [5] of the gauge is used to optimize the gauge operation for specific working condition and a given 8 range. The relative resolving power P(0) for 68.3 confidence level is given by:
P(e) = [ÆceJT (s+ijp^e]"1 (3)
where T is measurement time constant.
This function is demonstrated in Fig. 1 for the gauge specified above and T = SOO sec. It is seen that with this gauge 8 in the range of 1.'. to 20% was measured with a relative resolving power of 2%.
References
1. A. Fishman, "Evaluation of Gamma Transmission Gauge for Assay of Water Content in Soil", MSc Thesis, Department of Nuclear Engineering, Technion (1978).
2. A. Fishman, A. Notea, Y. Segal, "Gamma Gauge for Monitoring Moisture in Soil", Transactions of the Nuclear Societies of Israel, 5_ (1977) 195.
•3. A. Fishman, A. Notea, Y. Segal, "Integral Measurement of Moisture in Soil by Gamma Radiation", Meeting of the Soil Science Society in Israel, Rehovot, Apr. 1978.
4. J.J.Fitzgerald, G.L. Brownell, F.J. Mahoney, "Mathematical Theory of Radiation Dosimetry", Gordon 5 Breach, Science Pub. New York (1967) p. 359.
5. A. Notea and Y. Segal, "A General Approach to the Design of Radiation Gauges", Nuclear Technology, 2_4 (1974) 73-80.
3B
RXIO
v
\
GM detector ^*-. 137 2.3 mCi Cs
depth: 53 cm time constant: S00 sec
/""<">
1P m
- w.o 8.0
6.0
4.0
d 2.0
0.0 e (%) 12 16 20
Fig. 1: Response R and relative resolving power P of a gamma transmission soil moisture gauge
- 4B -
On the Scattering Component of Total Unsharpness In Neutron Radiography
A. Gutman, Y. Segal, A. Notea Department of Nuclear Engineering, Technion - Israel Institute of Technology
A basic limitation on image accuracy in neutron radiography is scattering of neutrons in the irradiated object. The most we can do with this component of total image unsharpness is to estimate it and try to restore the undisturbed image.
yPoint Spread Function,/
In the present work accurate computations of(PSF/for slab objects were performed with the MORSE-CG programfl] based on Monte Carlo simulation of scattering processes. Results are presented as compared with those of Single Flight Integration (SFI) model, so two fitting coefficients P,,P2 are sufficient to provide the precise PSF for different slab thicknesses (D), slab detector distances (B), I and I . a s
£ ,1 are macroscopic cross sections of slab material for absorption and scattering correspondingly. In our case the PSF is defined as the neutron flux detected on a given detection plane (z=D+B) due to a neutron beam of intensity I = 5(x)ä(y) incident at right angle to the object (z=0). i.e.
PSF = n e [ö(x)ä(y) + s(x,y)] (1)
where n is the efficiency of the flux detection, Z A = Z + E ,s(x.y) describes the scattered flux, t a s
s(x,y) can be used for restoration of a given image g(x,y) to an ideal image f(x,y). tie assume a convolution relation[2]:
CO
g(x,y) = / hCx-x'.y-y^fCx'.yMdx'dy' + v (x,y) (2) -00
where v describes noise which is signal-independent. The signal is the neutron beam I = 6(x)6(y). For the ideal situation of input signal I and of no noise we get:
If the functions involved are well behaved Eq. (6) can be solved by the Furier transform method, i.e.
F = 1+S+MO) W
where M(uo) is an arbitrary high frequency filter function.
The s(x,y) function was computed with Monte Carlo computing code for every possible combination of the parameters in Table 1.
Table 1: Combinations of Parameters Used in the Calculations
D (cm) 0.1 O.S 1 2
Z -D a
0.2 1 3 5
Z -D s
0.2 1 2 3 4 5
B (cm) 0.1 0.5 i i -J
The Monte Carlo results were compared with values obtained by direct integration of a single scattering model (SF1). As a rule the relationship between the two functions could be fitted by Eq. 8:
P-T PSF(r) = P -SFI(r) e (8)
where r = Æ^ty 2 " , SFI ( r ) i s PSF(r) in SFI model. P represents uniform cont r ibu t ion of secondary neutron s c a t t e r i n g in PSF while P . represen ts the bui ld up of secondary sca t t e red neutrons to l a rge r r ad iuses .
REFERENCES
[11 M.B. Emmett, "The TORSE Monte Carlo Radiation Transport Code System", ORNL-4972, February 1975.
[2] Azriel Rosenfeld, A.C. Kak., Dig i ta l P ic tu re Processing (1976).
- 6B -
A Continuous Level Gauge for Horizontal Cylindrical Vessels. By M.Keren, tl.Pasi, I.Caras, T. Assis, Y. Gabay. NRCN, P.O.B. 9001, Beer Sneva. Radiochemistry Dept., Electronic Dept.
The measurement of the contents of a vessel containing corrosive material is difficult. One of tlio methods is to use gamma-irradiation with externally mounted equipment. The commercial types offered for the continuous measurement of a vessels contents require mechanical movement to follow the liquid level or static mounted equipment suitable only for vertical cylindrical vessels. I7e have developed a static mounted instrument to continuously measure the contents of horizontal cylindrical vessels. A prototype has been working for over C months on a large pressure vessel containing liquified chlorine. The equipment was mounted externally on the vessel, without interupting its operation. The system consists of a radioactive source - Cs-137 (200 - 500 mCi depending on the vessel diameter) mounted on the top of the vessel, with ten detectors (G-M tubes) around half the circumference (see . figure) and an electronic controller to sum the detectors' signals and linearise the readout. To give a constant geometric configuration between the source and the detectors, the source holder was built to give a fan shaped beam of gamma-irradiation. The linearisation of the outputs is obtained by placing the detectors in predetermined positions on the vessels circumference and amplification of each output signal. The detectors output signal is given by:
AK w 1 t ; i Vu = "(-;)em:j « P C - V ^ J ]
r{i) where e^j . e f f i c 1 e n c y o f t h e detector (i)
"(1) = smplifif.ation of the detector's output signal, for its normalisation
- Tu -
A = source activity (mCi) K = specific gamma-ray constant r/ji = distance between source and detector (i) (cm) u, = linear absorption coefficient of vessel's wall (cm ) u 2 = linear absorption coefficient of liquid (cm"') x l f i ) = total wall thickness traversed by gamma-ray to-detector (i) >,/..= liquid thickness traversed bv oaimia-ray to detector(i)
The volume of the linuid is given by: V% = [10 - 1° „ ] x 10
i=lR(i) The accuracy and linearity are better than IK. The instrument incorporates an upper and lower limit switch which can be used for control or alarm purposes. Because the gamma souce used has a long half life (Cs-137 Ti. = 30 years) the instrument does not require recalibration more than once per year. The system has a hiqh reliability and expected long life, as there are no movinq parts and ther is no contact with the liquid. The static continuous level gauge described here Is ideally suitable for retrofitting on various shaped vessels, containing high temperature or corrosive liquids, viscous fluids and solids, where conventional methods of level measurement cannot be used.
The electronic instument is designed in the form of plug-in unit, with digital and linear integrated ciruits. It includes 3 regulated power-supplies (2 low-and 1 high-voltage, fly-back type). The detector includes a preamplifier (allowing long distance between detector and instrument). The output pulses of each detector are converted to a DC-voltage signal, wich is a function of its position. The total output-signal is the sum of all detectors (DC-converted) signals. It is displayed on a digital panel-meter and transmitted to 2 comparators wich serve as high and low limit-detectors. Each comparator drives one relay for control purposes.
SB -
DIGITAL D(SP1/»V «r COMXttOi. ROOM
GUD
ELC-CTROWiC INTEGRATOR *M> COtHHOI-lS.il. UPTO W » Fftou TANK
CONTINUOUS L&EL GW&B/CONTROLLER FOR U0Rl20N7flL CYUNPRlCkL VESSELS.
INTERPRETATION!. MODEL for PASSIVE GAMMA ASSAY TECHNIQUE A. Knoll, A. Notea, Y. Segal
Department of Nuclear Engineering, Technics n •> 31 Passive gamma assay of Nuclear fuel content in bulks '"' is based
on spectrum analysis of the radiation leaked out from it. A model for the response of the assay system was developed in the present work. This model takes into consideration contributions' from all the gamma lines and thus can serve for accuracies estimation and minimum detectable quantity. The spectrometer detects primary and secondary photon fluxes and produces a pulse height distribution spectrum. The pulses entering a pulse height range ("window") around line j result from:
a) photons born in the container with energy E., leaked out with primary energy, and detected by photoelectric effect.
b) photons born in the container with energy E. > E., scattered in the containers matrix, reached the spectrometer with E. and detected by photoelectric effect -1
c) photons born with E. > E. leaked cut with E. detected via Compton effect and the pulses produced enter the "window".
d) photons with E. which leak after scattering, detected via Compton effect1and the pulses enter the window
e) photons emitted by sources outside the container medium.
Hence, the assay system response defined as the countrate at the window range is given by:
n R. = B . + 1 { f . E . p . i . . + y [ f . f c . p . . i . . + J J k=l J 3 3 3 i J J J J
where: B. - background from external sources
P. - average escape probability of photon born .with E. and reached the detector with no energy loss1- ' . -1
f. - fraction of countrate at the peak j which appear within -1 the window range
1., - emission rate of photons E. per gram of radionuclide k
\ content of radionuclide k
- lOB -
n - number of gamma emitters
P.. - average escape of photon bom with E. > E. and leaked -11 at energy E. 1 -1
r. - spectrometer resolution (f w h m)
e. - intr insic photopeak efficiency of the spectrometer -1 for pliotons with E.
J D.. - intrinsic Compton efficiency for photon with E. which • is detected by Compton scattering and the pulse
appears in the window of line j W. - window width expressed in r. units
For the various j lines (j=l,2, N) a set of linear relations is obtained. The set of order Nxn is presented in matrix notation by
II = J3 + A m (2) where A is a matrix of order Nxn 'l.-ie response function Eq. (2) is useful in optimizing the design parameters of the assay system. At the data interpretation stage the set of equations (2) should be solved simultaneously for the determination of the m, values
k m = A" 1 (J* - B) (3)
where AA" = I; I is a unit matrix of NxN order. When n=N the values of m, are determined. When m<N the best values of m, are obtained by least square fitting.
References 1. R.H. Augustson and T.D. Reilly, "Fundamentals o r passive nonde
structive assay of fissionable materia]",LA-5651-11 (1974). 2. J.E. Cline, "A relatively simple and precise technique for Nc assay
of plutonium waste", ANCR-1055 (USA, 1972). 3. G. Birkhoff and A. Notea, "Monitoring of plutonium contaminated
4. A. Bar-Ilan, A. Knoll, A. Notea, Y. Segal Escape probability of gamma from radioactive contaminated solid waste. Present Meeting (Dec. 1978)
- H B -
ESCAPE PROBABILITY OF GAMMA FROM RADIOACTIVE CONTAMINATED SOLID WASTE
A. Bar-IIan, A. Knoll, A. Notea, Y. Segal Department of Nuclear Engineering - Technion
Accurate quantitative assay., of radionuclides in waste container by the passive gamma technique requires knowledge of the spatial distributions of the elemental composition and density of the contaminated materials as well as that of the radionuclides. Our approach is based on the study of each distribution separately and that concerned the source distribution is the aim of the present work. Here the measured radiation leakage flux is related to various source distribution possibilities for which probabilities of occurance are attributed.
The study was initiated with a perspex spherical container of uniform absorbing medium. It serves as a good approximation for the cylindrical container when the detection station is far enough (21. The spatial distributions of the radioactive source were chosen as spherical shells inside the perspex sphere. For a rotating sphere every spatial distribution may be described as a superposition of spherical shells.
The escape probability from the sphere of a photon born in a spherical shell with its primary eneigy is given by
2 o
i r n 2 P(r) = •=• s inaexp[- up(r cosa + /R - r s i n a ) ] do (1)
where R, r and a are explained in Fig. I and v,p indicate mass attenuation coefficient and density.
Fig. 1
- 12B -
Equation (1) may be presented also by the exponential integral functions :
P ( C J = 4^Cl-e" 2 e c)e" ß C 1" c )+3(l +c)E 2[ß(l-c)]-6(l-c)E 2[eCl*c)]} (2)
where c = r/R ; ß = upR The determined P(c) function is compared with experimental results for Cs and Co sources in Fig. 2. The deviation in the outer shells is attributed to the increase of the gradient dP/dr with r, and the source is of finite dimensions the uncertainty in its effective location leads to error in the experimental curve.
The escape probability from a sphere with a source distributed uniformly in its volume is given by
PIß) = —K [2 ß 2 - 1 + e" 2 6(l + 2$)] (3) 8 ß-*
The comparison of determined values with the experimental presented in Table 1.
Table 1: Escape probability from a sphere of uniform volumetric source, calculated (Eq. 3) and measured (experimental) values
Energy (MeV) P (calculated) P (measured) P ,-P cal mea P mea
0.662 0.4071 0.4556 0.106
1.173 0.4756 0.4685 0.015
1.332 0.4885 0.4746 0.028
- 13T1 -
P(c) Fig 2 - Comparison of Calculated to measured r e s u l t s of p robab i l i ty escape from concentric source s h e l l s .
0.125 0.25 0.375 0.5 0.625 0.75 0.875 1.0
C
- 14B -
References
(1) A. Knoll, A. Notea, Y. Segal, "Interpretational r.iodel for passive gamma assay technique". Present Meeting (Dec. 197«}.
(2) G. Birkhoff, A. Notea, "Monitoring of Plutoi.ium contaminated solid waste streams", chapter III, J.R.C. Ispra Establishment, EUR 5637 e (1976).
(3) Case et al, "Introduction to the theory of neutron diffusion", Los Alamos Scientific Laboratory (1953).
(4) t.R. Powsner, D.E. Raeside, "Diagnostic Nuclear Medicine", Grune S. Stratton, Inc. (1971).
- 1 SS -
Theory and Design Implications of Poisoning of Catalytic Air Filters
Yakov Ben-Haim Department of Nuclear Engineering - Technion
Radioactive effluents from a nuclear reactor core, spent-fuel holding areas, reprocessing plants, or other installations employing radioactive materials present a serious challenge to health and safety in the plant and surrounding areas. Air filtration in these plants must be efficient and reliable, and able to operate for extended periods of time. The operable life of these filters is limited by poisoning of the filter by non-radioactive materials that pass through the filter (e.g. water vapor, hydrocarbons, etc.). In order to improve the design of existing filters, and to facilitate the design of efficient filters for special purposes, one needs to identify the characteristics of the filter substrate material which govern the poisoning-response of the filter.
Radioactive iodine (primarily I) is among the most important of the fission product effluents from nuclear reactor fuel, from the safety stand point. Filtration of iodine (both elemental and organic) from air can be achieved with activated charcoal filters. The adsorption mechanism is thought to be catalytic. In this report we shall briefly present the results of a model of poisoning of catalytic filters, and compare this with experimental results. Finally we shall briefly outline design criteria based on the model, which aim at increasing the operable life of the filter.
A first-order irreversible reaction in a fixed-bed reactor (the filter) proceeds according to
v § - - RC (1) where v is the gas flow velocity through the filter, x is the depth in the filter, C is the reactant (e.g. Iodine species) concentration in the gas and R is the first-order rate constant for reactant adsorption. Integration of this equation yields
1 f x
JUi (C/CQ) = - i R (x, t) dx . (2) •"o
The quantity C is the reactant concentration at the entrance to the filter. In this equation the reaction rate is written as a function of time and position in the filter. The value of R decreases with time due to adsorption of poisons (e.g. water, hydrocarbons, etc.) in the filter. The dependence of R on the extent on poison adsorption has been developed elsewhere , ' . In the case that the poisons are adsorbed on the pore mouths of the charcoal surface, rather than uniformly on the pore walls, the integral in Eq. (2) can be approximated analytically (eq. (7) - in ref. 2).
- 16B -
The decrease in adsorption efficiency of a specific filter for CH I has been measured . The CH,I filtration efficiency was measured as a function of exposure time to air from the surroundings of a fossil-fuel power plant and several chemical factories, and as a function of depth in the filter. In Figure 1 is plotted the data (circles) and the results of the approximate analytical result of the model. One sees from this figure that the model represents the data quite accurately for about 250 days. After 70 days the quantity -J.n(C/C ) is 8.5 in the case of the longest filter, (6 beds, 15 cm total length?. This indicates that only 0.02% of the CH.l passes through the filter-certainly an acceptable filtration efficiency. After 250 days the quantity - Jtn(C/C ) equals about 4. This indicates that about 2% of the CH,I passes through the filter. Because filtration efficiency of only 2% for radio-iodine is too low in a practical situation, one concludes that the model is able to represent the data throughout and beyond the useful life of the filter. The model can therefore be used for design purposes to identify the characteristics of the filter substrate material which govern the filter's response to poisoning.
The criteria for design against the effects of selection poison adsorption are based on the following six variables ' .
(i) R, the catalyst pellet radius. This quantity should be as small as possible.
(ii) t, the transit time of the gas through the filter. This quantity should be increased as much as possible within existing constraints of filter length and volume through-put.
(iii) 9, the catalyst porosity. A large porosity is indicated. (iv) Sg, the catalytic surface area per gram. A large value is
indicated. (v) r, the average pore radius. A priori choice of an optimum
value of r is not possible, as it depends on detailed properties of the poisoning substance.
(vi) D, the diffusion coefficient of the reactant in the gas. This should be as large as possible.
References 1) A. Wheeler, Chap. 2 in Catalysis, Vol. II, ed. Paul Emmett,
Reinhold Pub. Co., N.V., 1955. 2) A. Wheeler and A.J. Robell, J. of Catalysis, j[3 : 299 (1969). 3) J.G. Wilhelm, H.-G. Dillmann, K. Gerlach, 12th AEC Air
Cleaning Conference, pp. 434-444. 4) Y. Ben-Haim, to be submitted to Nuclear Safety.
- 17B
n 0 200 400
Time (Days)
600
Fig. 1
- IBB -
Assay of Aqueous Uranium by Radioisotope X-Ray Fluorescence Spectrometry
Y. Ben-Haim and A. Notea Department of Nuclear Engineering, Technion - Israel Institute of Technology
In routine control of uranium extraction from ore, emphasis is given to simple uranium assay procedures. Conventional wet-chemistry techniques for assay of uranium in solutions are quite accurate and reliable, but require about 10 man hours per sampled. A study of the possible use of an X-ray fluorescence technique is conducted.
... The assay system is composed of a Si(Li) detector and a 5 mCi Am source for 59.5 keV excitation radiation. The source is annular
and well shielded from the detector. The samples are held in p. plastic cup, about 2 cm in diameter fitted with 0.0006 cm (1/4 mil) mylar film on the bottom face exposed to the source and the detector. The 59.5 keV gamma radiation from the 2<*l/\m excites the I X-ray lines of uranium. For the assay the lines: 13.6 keV l,a, 16.4 keV 1,(5- and 17.2 Lg, are preferred. Several lines in the vicinity of20keV (Ly) are also detected, but with lower yield. See Figure 1. Unique identification of The Uranium compnent of the solution is possible on the bas^s of the energy of these peaks and their relative magnitudes.
Preliminary tests of the L X-ray activation system have been made. Standard solutions of Uranyl Acetate, UO, (C.H 0,) ~, were •prepared. With these solutions it was seen that a sample containing 100 ppm U can be measured with moderate accuracy (several % of the measured value) within just a few hours of counting time. Of this time only a few minutes of human involvement is required. The response is a linear function of the uranium concentration in the range of up to a few hundred ppm. That is observed also from the model 3' as the variations in 'iranium concentration do not influence significantly the solution absorption coefficient. It was determined that without more elaborate shielding the limit of detection with a 15-20 hour counting period is about 10 ppm uranium. This is due to the background countrate.
Assay of uranium solutions sampled from a phosphate extraction process line have been made. This set of samples contains both aqueous phosphoric acid and organic solutions. These solutions, unlike the standard samples, contain various elements carried out from the phosphate in addition to the uranium. This is apparently responsible for the observation that the count-rate ratios for the 13 keV (La) and 17 keV (Lf5.) peaks are different for the various samples: 0.4 for the aqueous solutions, 0.6 for the organic, and '. for the standard i.e. pure aqueous solution. This is apparently due
- 19B -• ••v<m&--
to variations in the solution adsorption coefficient as a function of composition. Absolute calibration of samples from industrial line depends en preparing a multi-component standard uranium solution for which the parameter \ s / \ 7 is the same as for the industrial sample.- Furthermore, tne quantity R._/R _ index for diagnosing concentration changes in tne components of the solution.
is a useful he non-uranium
I La 328 ppm Uranyl Acetate Solution 241
Am Activation
V LB_ LY
Energy Fig. 1
REFERENCES 1) E.J. Boiwer, O'.W. McKlveen and W.J. McDowell,
Health Physics, 34: 345 (1978).
2) IAEA: "Radioisotope X-Ray Fluorescence Spectroscopy", Proc. Panel, Vienna, 1968, Technical Reports series No. 115, IAEA Vienna (1970).
3) R.P. Gardner and R.L. Ely, "Radioisotope Measurement Applications in Engineering", Reinhold Pub. Co., N.Y., 1967.
• Eq. (12-84).
- 20B -
GEOMETRICAL DIMENSIONS OF FUEL ELEMENT FROM RADIOGRAPHS
S. Wajnberg. A. Fishman, A. Notea, Y. Segal Department of Nuclear Engineering - Technion
The quality control by means of nondestructive testing (NDT) of fresh and irradiated nuclear fuel elements (F.E.) is faced now-a-days mainly with the help of Radiography.
The problem of analyzing a radiograph of F.E. is increased in-complexity as the more and more information should be extracted. The complexity is a direct function of the number of boundaries (walls) in the examined F.E., due to:
1. The high attenuation of X-rays and gamma-rays by the Uranium. 2. The problems of non-definition and unsharpness of cylindrical
specimens.
In publications methods are proposed for determination of an edge in the zone of an unsharpness-radiography, such as the one-third, one-half, one-seventh and gradient methods. However, most of these methods were applied only to simple geometries and not to cylinders.
In this study, we analyze and compare the usefullness of the above methods while analyzing a radiograph made from an F.E. with a complex geometry as shown in Fig. 1.
The radiographs made with neutrons, gamma and X-rays were further examined with an edge-enhancer-analyzing system!*] and the film density variations were plotted and examined.
The effect of scattering in the internal channel and its influence on the Tadiograph contrast an-', definition of the U internal wall (denoted by D in Fig. 1) was studied by filling the channel with materials of different Z- Radiographs were done with fillings such as: air, steel bar. lead bar, water, and solutions of lead acetate and lead nitrate^]. The applicability of the methods mentioned above was analyzed. The effect of the material filling on the film density is demonstrated for lead in Fig. 1. The density curve with no filling is mainly a function of the attenuation in the uranium, while that of the aluminum is neglected. The filling causes a higher film density at the center of the F.E. and provides reference points at the aluminium wall (indicated by F in Fig. 1) for the application of the mentioned methods.
2 IB
density graphs
^ If \ Ref. Vv ^ Line
LEAD BLOCK
Fig. 1: Schematic description of Savannah River fuel element. The upper curves represent film density measured at the radiographs.
radiograph of F.E. without filling and side blocks. radiograph of F.E. with Pb filling and blocks.
a',b',c' = 1/2, 1/3, 1/7 of a.b.c respectively.
- 22B -
A similar technique was applied for improving the definition of the outer diameter. Blocks of lead, one at aach side of the F.E. were located touching the aluminum cladding. The sharp rise of the density curve at the outer diameter produces clear reference points in comparison with the curve obtained from a radiograph without side blocks.
The F.E. dimensions resulted from the radiographs analysis were compared with the actual values, and it was found that definite agreement is achieved' only for some dimensions. In light of the results, it is impossible to recommend any cf these methods^]. Thus it is clear that improvements are required. The dimension interpretation are functions of the geometry studied and further work is directed toward» the development of the interpretational model,
REFERENCES
[1] M.S. Schlosser, "Radiographic Enhancement and Analysis System", Materials Evaluation, 3_S (Nov. 1977), pp. 16-18.
[2] "Fundamentals of Radiography", Materials Evaluation, 36, (July 1978), p. 22.
[3] A. Vary and K.J. Bowles, "Application of an Electronic Image Analyzer to Dimensional Measurements from Neutron Radiographs", Materials Evaluation, 32 (January 1974), p. 7.
PRODUCTION OF POSITRON EMITTING 7 5 B r AND 7 6 B r WITH A COMPACT CYCLOTRON
Z.B. Alfassi Department of Nuclear Engineering
Ben Gurion University of the Negev and
R. Weinreich Institut für Nuklearchemie,
KFA, Jülich, FRG.
Radiohalogens are often used to label large blomolecules^ '. This is particularly true for bromine and iodine. The main radionuclide of bromine used till now for in vivo diagnostics is Br. This is, however, not
77 + suitable for positron emission tomography since Br has only 0.7% ß .
Br, Br and Br (see Table 1) on the other hand, are positron emitters 75 with reasonable half lives. Out of these Br has the lowest positron
energy and is, therefore, the preferred isotope both from the point of view of obsorbed dose and mainly the spatial resolution. Though it has the
75 disadvantage that its daughter Se is radioactive, this should not be a 7r +
big drawback since 3Se is not a t> emitter and the total absorbed dose 75 75 76 74 75
from Br + Se is less than that from Br or Br. Br can be prepared by the As (a .4n) JBr reaction the same as Br is produced from As(et,2n) 77 (21 Br-, ' however this reaction has relatively low cross section and requires higher energy than available in most high current compact cyclotrons. Thus we use the reaction As ( He.3n) Br since this requires less energy. The excitation function was measured by the stacked foil technique. Each foil consisted of metallic arsenic suspended in a self-supporting polystyrene
- 24B -
3 f i l m . Preliminary results show that in the range of 33-25 fteV He, the
thick target y ie ld is above 4 mCi/uA-hr with less than 2% contamination
of 7 6 B r .
References 1) G. Stöcklin, Int. J. Appl. Rad. Isot. 23, 131 (1977); S. H. Qaim,
S. Stöcklin and R. Weinreich, Int. J. ApDl. Rad. Isot. 28, 947 (1977). 2) A. 0. Munn and S.L. Waters, Int. J. Appl. Rad. Isot. 26, 731 (1975)
Table I : Nuclear Decay Properties of some Positron Emitting Br-radioisotopes.
Radioisotope 7 3 B r 7 4 V 7 4 B r 7 6 B r 7 8 B r
Half l i f e 3.3 m 28.0 m 41.5 m 15.9 h 6.5 m
Decay mode B+ (100%) ß + (85%) E.C. (15%)
ß + (76%) E.C. (24%)
ß + (57%) E.C. (43%)
8 + (92%) E.C. (8%)
energy (MeV) 3.7 4.7 3.7 2.6
90% range of the e* in water (cm) 1.44 0.64 1.44 0.99
- 26B -
ELEMENTAL COMPOSITION OF SOME AEROSOL COMPONENTS MEASURED
BY X-RAY FLUORESCENCE IN BEER SHEVA, ISRAEL
A. Haccoun, G. Sham' and A. Kushelevsky Nuclear Engineering Department
Ben Gurion University of the Negev Beer Sheva, Israel
Abstract
Particles having diameters between =20 ym and 0.2 ym are present in
a^r as aerosols. Their chemical composition, shape and concentration are
a function of the environment both nearby and distant . X-ray fluorescence
method was used to measure the elemental concentration ( in ng/m ) of some
elements in the composition of Beer Sheva aerosols.
The a i r sampling was done between June 1977 and May 1978 by pumping
a i r through a cel lulose f i l t e r Whatman 41 . The f i l t e r which retains aerosols
were crushed and pressed into a pe l le t and presented for the XRF analysis.
The XRF instrument used was a Phil ips PW 1410 x-ray spectrometer. The
fol lowing elements were measured: Ca, S i , S, Fe and C I , which are some of
the major elements and Pb, V, Mn, N i , Ti which are not easy to measure
by Instrumental Neutron Activat ion Analysis (1) .
Table 1 gives some elemental concentrations measured d.r ing the las t
year. The Total Suspended Particles (TSP) - the global concentration of
aerosols in a i r - is also given in Table 1 . The TSP was measured by the
difference in weight between the f i l t e r before and a f ter a i r sampling. Mean
TSP value is rather high (130 yg/m ) and is specif ic to the desert conditions
- 27B
of the Beer Sheva area (2). It appears that weight percentage of the major elements vary with
the origin of the aerosols. During normal meterological conditions when the mean TSP is 130 yg/m , Ca, Si and Fe have respectively 10%, 11% and 2.4% of the TSP. During sharav and sandstorm conditions the proportion of the same elements, Ca, Si and Fe are 16%, 16% and 2.3% which indicates a different origin of these aerosols which may be correlated with wind direction (Libya, Arabic Desert, etc.) See Table 2.
- 28B -
TABLE 1
Elemental Concentrations (ng/m } of some Aerosol Components Measured by X-Ray Fluorescence in Beer Sheva
Meteorological Mean TSP Conditions i.g/m3 Ca Si Fe Ca+Si+Fe
Normal 130 10 11 2.4 23
Sandstorm and 550 16 16 2.3 34 sharav
30B
References
1. Haccoun, A. , Shani, G., Nuclear Method used to Compare Ai r Pol lut ion in
a City and a Pol lut ion-free-area, IAEA-SM-206/7, Vienna» 1976.
2. Haccoun, A. , Shani, G., Kushelevsky, A. , Total Oi f fent ia l Suspended Part ic le
Measurements in Normal and Sandstorm Condition in Beer Sheva, I s rae l ,
Proc. of the 2nd Intern. Congress of Ecology, Jerusalem, 1978.
Acknowledgement
The authors want to thank Mr. I . Klein and also Mr. P. Bar On of the
X-Ray Laboratory of the R.D. Authority (B.G.U.) for the i r col laborat ion.
SECTION C
RADIATION IN MSDICINE
- IC -
DETERMINATION OF SELENIUM IN URINE BY NEUTRON ACTIVATION ANALYSIS
R. Uaingarten, Y. Shamai and T. Schlesinger Soreq Nuclear Research Centre
Yavne, Israel
The interest In the detection of selenium traces in biological material has been stimulated over the past few years by the discovery that this element plays an essential part in human biochemistry (1). The selenium excretion rate of persons not occupationally exposed to it has been found to be between 10 and 150 pg/Jl (2). There are indications that excretion rates in excess of about 250 ug Se per liter urine indicate a body burden which exhibits toxic effects (2).
Presently available techniques (3-5) are not suitable for the detection of Se with the required sensitivity. He tried to measure 75ge produced by neutron activation. However, even the use of an irradiation time of 1 hour, a long cooling time (20 days) and a long counting period (15 hours) did not enable us to detect the activity of 7 5Se in irradiated samples due to interfering isotopes. We therefore developed a technique to get rid of the Interfering radioisotopes and thereby reduce both the cooling time and the detection limit. The method described here enabled us to lower the detection limit to 0.6 ng/ml after 1 hour of irradiation and a cooling time of 5 days.
Urine samples were concentrated by evaporation and irradiated for 1 hour in the IRR-1 core, together with a Se standard solution. After five days cooling, a chemical separation in the presence of Se carrier was performed, the main step being the precipitation of selenium ascorbate. The samples were counted in a 4"x4" well type Nal(Tl) detector coupled to a pulse height analyzer for about an hour. A typical spectrum is shown in fig. 1. The main peak in the spectrum is the one at 0.4 MeV which is mainly due to the coincident detection of the 0.265 and 0.135 MeV photons. The recovery of the selenium by this method was measured and was found to be 81+SZ. Reproducibility was checked by measuring 12 aliquots of a urine sample. The fluctuations in the calculated Se content were found to reflect the fluctuations of the chemical recovery. On the other hand, much larger fluctuations were found in the Se content of urine of randomly chosen persons not exposed to Se (up to a factor of 2)
- 2C -
Ey(MeV) 02 04
Fig. 1 spectrum of an activated urine sample after cheaical traat-The peaks appear at 0.265 MeV (572), 0.137 MeV (562)
Gaooa nent. The peaks appear .... „.«.„., ™ , ,..»#»,,, U . U / ne« vso«># and 0.40 MeV (112 plus coincident detection of the former peaks)
Che average being about 25 jig/liter. The detection li»it (defined as two standard deviations of the background) was found to be about 0.6 ug/l for an irradiation time of one hour in a flux of about 5x10*- nsec - 1 cm - 2, 5 days cooling end a counting period of about one hour. This limit Is about 52 of the minisMQ eispected selenium concentration in hiraan urine (10 pg/O and therefore is adequate for most applications.
A NOTE ON RAPID ESTIMATION OF GAMMA CAMERA'S M . T . F .
C . Adam
Nuclear Research Center- Negev, P.O.B. 9001, Beer - Sheva, Israel.
The usual way of measuring an MTF of a gamma camera is to record the camera's response to a collimated line source and from this information to determine the MTF by a Fourier transform. This method however determines the response of only one narrow segment of the camera's field. To gather information about the behaviour of the whole field one has to repeat the measurement segment by segment a procedure which is both tedious and time consuming. The purpose of this note is to suggest a way of determining the response of the whole field, doing essentially one measurement. The idea is to record the response of the camera when it is"looking" at a flood source through a bar phantom. Both source ana phantom should cover the whole field of view. The bars of the pliantom should be thick enough to block essentially all the radiation from the flood source. The spacing between the bars which should be equal to their widths can be chosen freely and this choice is govrned by two facts: A) the lowr.'st frequency for which the MTF will be measured is 1/jk where )• Is twice the bar's width. Judging by this fact alone, one would tend to choose as wide a bar as possible. B) The width of the segment of the camera's field for which the MTF is determined is obviously 2>, so that if one wants to asses the camera's response in fine detail, one has to choose small bar widths. In practice one compromises between the two opposing demands, and a spacing of 3cm. seems reasonable. After recording the camera's response digitally the data are analysed as given below. One chooses one line orthogonal to the bars of the phantom at a time, and calculates the MTF for that segment as follows: The input to that part of the camera is a square wave, the Fourier transform of which has the form:
a 0/2 • (2/,) l l(!/ii)Sin(nv)] ...<1) n=l,3...
- 4C -
»? being the basic frequency of the square wave (e.g. for a 3cm. spacing it will be l/i> cycle/cm,) and a<) its amplitude. The image on the camera will be a distorted square vave. One does a numerical Fourier expansion for this waveform obtaining
bo/2 + (2/TT) £ [bnSin{nv) + cnCos(nv)J ( 2 )
n=i, 2... For a response which is not too distorted all the c coefficients as well as the even b ones will be small compared to the odd b eoeficients, and i>will be the same as in (1). The value of the MTF for each value of n v> is than
MTF(nf) = bn/(l/n) n=1,3,... ...(3)
The normalization of the square wave is carried out so that MTF(0)=1. This procedure can be carried out for any selected segment of the camera's field using the results of the first one measurement. There are a few points to be made about using this procedure. A. The measurement can obviousely be done only on cameras with digital outputs and, more than that, one should be able to get a readout about every 1mrc to get any measure of accuracy. B. This measurement results in fewer measured points on the MTF curve compared to results from measuring the line spread function in a conventional way. This drawback is however compensated by the much simplified experimental procedure.
The method was tested on a digital whole body scanner in the I'OW Background Laboratory of the Royal Marsden Hospital in London, using a CDC 7600 computer to analyse the measured results. The results showed that one could get a good approximation to the MTF as measured from the I.SF. We were not able to use this method on the cameras at the hospital because they did not have facilities to product digital output at the fine resolution needed for this method.
- 5C -
INVESTIGATION OF A POSSIBLE CORRELATION BETWEEN THE LEVEL OF SELENIUM IN THE BLOOD AND SKIN DISEASES -
BY NEUTRON ACTIVATION ANALYSIS
S. Abboud, T. Schlesinger and R. Weingarten Soreq Nuclear Research Centre, Yavne
and M. David and E.J. Feuerman
Beilinson Medical Center, Petah-Tikva.
It has been demonstrated that more than 10 trace elements play a major role in human disease mechanisms (1). One of these, selenium, is intimately related to two important constituents, vitamin E and sulfur amino acid (2). An abnormal blood level of selenium has been shown to be related to disease in many species (3). The purpose of this work was to correlate the blood level of selenium, determined by neutron activation analysis, with the skin diseases pemphigus vulgaris and psoriasis.
Blood samples were taken from patients, who were hospitalized for pemphigus, before treatment with cortisone and from patients during the course of the treatment. Blood samples were also taken from psoriasis patients and from those not suffering from skin disease.
Three methods were used to determine selenium in the blood samples: 1. Dried blood samples, sealed in quarts ampoules, were irradiated in the core.of the reactor for 10-15 hours at a thermal flux of 5x10" n/cm sec and an epicadnium flux of "\- 2x10 n/cm2sec. The 7 sSe activity (half-life 121 days) was measured after a long cooling time, and compared with the activity induced in a standard sample (dried animal blood) containing 0.59±0.09 yg/g Se. The standard and blood samples were irradiated together under the same conditions. 2. Liquid blood, in polyethylene vials, was irradiated for 5 sec in the pneumatic tube (rabbit) ot the reactor, at a thermal flux of t 5xl0 1 2 n/cm _ 2sec - 1. The activity of 7 / ! nSe (haif-life 17.5 sec) was counted for one minute, begining 15 sec after the end of irradiation. 3. Liquid blood (1 cuH), sealed in quarts ampoules, was irradiated in the core of the reactor for one hour. The activity of 7 5Se was measured after a chemical separation which removed the activity of 2 4 K a , S^Er, 59p e > 652n and other radioactive isotopes from fche sample.
- 6C -
The result obtained by the first method indicated an average level of 0.186+0.022 ug/ml (2 S.D.) selenium in blood samples of pemphigus patients before treatment. After treatment of one week as well as of two months the concentration of selenium decreased to an average of 0.15510.02ug/ml. A lower level of selenium concentration, an average ofl.132+0.038 Ug/ml, was found in psoriasis patients. In blood samples taken from patients not suffering from skin disease the average level of selenium was found to be 0.143±0.030 ug/al.
By the second method an average concentration of 0.183±0-004 ug/tnl selenium was found in blood samples of patients before treatment. After treatment and a recovery period the level decreased to an average of 0.152+0.028 yg/ml. For psoriasis patients an average level of 0.115+0.026 ug/ml was measured, and for patients not suffering from skin disease 0.128*0.032 ug/ml selenium was found in the blood.
No quantitative results could be obtained by the third method. The results indicate a higher (30%-40%) concentration of selenium in the blood of patients (before treatment) suffering from pemphigus, relative to normal patients, and the level is still high (10%-20%) after treatment. Treatment with cortisone seems to lower the selenium concentration to near normal levels. No significant differences were measured in psoriasis patients.
References: 1. Schwarz, K., in: Nuclear Activation Techniques in the Life
Sciences. Proceedings of a Symposium, Bled. Yugoslavia, 10-14 April 1972, IAEA, Vienna 1972.
3. Schwarz, K. et al., Fedn. Proe, Fedn. Amer. Socs. Exp. Biol. 20, 655 (1961).
- 7C
'°F_5-KLÜ0R0URACIL AS A MODEL FOP. PRLT1CT1KG CHEMOTiibBAJPY RESPONSE TO 5-FLUOHOUPAC1L
* Jashovam Shani and Walter kolf Radiophurmucy Program, School of Pharmacy, University of Southern California and Cancer Research Center, Zonal Ave
Los-Angeles, California, U.a.A 5»fluorouracil (5-FU) is known to be a useful, often
highly effective agent in the pullijtive treatment of patients with a variety of solid tumors, particularly breast and colon, However, the response is unpredictable, it is known that approximately 30?» of the patients with metastatic breast carcinoma and 20^ of patients with colo= rectal cancer receive objective response to 5-FU systemic chemotherapy (Seifert, P. et al, Cancer 36,123,1V75; Carter S.K., Cancer Treatment Keviews 3,141,1976). At the present time, there is no way of predicting whether a given tumor in a given patient will or will not re*,jond to therapy with 5-FU. Any method to predict which patients will respond would be of great importance, since it would allow more definitive assessment of the short-time prognosis and would spare the majority of patients a useless trial of therapy with 5-FU.
Recent studies of the distribution of injected 5-FU labelled with F-18 in mice bearing LI 210 lymphocytic leukemia showed marked differences between 5-FU responsive and nonresponsive tumors (Shani, J. & Wolf, W., Cancer Hesearch 37,2306,1977). This L1210 tumor is usually sensitive to 5-FU, and shows evidence of prolonged retention of 5-FU and its metabolites, particularly the therapeutical active F-dUNP (Chadwick, >i. & Uogers, V.l., Cancer Research 32, 1045 1972). In one group of animals the tumor was made 5-FU resistant by 34 generation transplant passage under exposure to low dose 5-FU treatment. In this model, tumor-to-blood retio of radioactivity 12 hours after intravenous injection of a test-dose of Fl8-5-FU was five times higher in the sensitive tumors (20:1) than in the resistent line (4:1).
LabeJling of 5-FU with F-18 has been perfected to the point where up to 30 mCi of the material can be synthesized with 98^ purity. An IND (12,591) was obtained for our own laboratory, and pilot studies have been done, so far, on six p tients. In two of these, the studies wore repeated during the early part of 5-FU infusion therapy, in order
- 8C -
to see whether louding with very high doses of stable 5-FU would affect the radiophiirmjcokinetics of F18-5-FU. Those patients included four with colorectul cancer, one vith hepatoma and one with metastatic cancer of the breast. Except for one patient with excellent previous response to 5-FU therapy, none of their: hud received 3-FU in the past. All but one of the patients hau measurable evidence of a tumor at the time of 1he study.
1 R Five to 15 mCi of F-5-FU were injected intravenously und images of the trunk in interior and posterior projections were obtained immediately at approximate two hour intervals up to 12 hours.The detector was u duul-headed (hio Nuclear rectilinear scanner with 12.7 cm ">"al crystals «nd high-energy collimators. r iotos-cans uere obtained and compared visually; data vas transfered by an interface to a digital mini-computer and processed by quantitat ing radioactivity over selected ureas of interest (tumor area, liver, kidney etc.) and plotting the activity course ugainst time. The cumulative urinary excretion of radioactivity vas measured during the period of such s-tudy.
Only in one patient, who hud a recurrent colorectal carcinoma and had a recent laparotomy of bowel obstruction w»s there F-18 uptake in the tumor area demonstrable on the scintigraphic images. This patient was subsequently treated with 5-FU and did well. The organ transit of radioactivity showed r.jpid concentration in the liver, followed in some patients by accumulation in the gallbladder (but not in the bowel) and excretion in the kidney. The cumulative urine excretion varied from a high of 83:,'» to a low of 35$, the latter in the patient with extensive recurrent colorectal Crtrcinoma in the left lower abdominal quadrant, and apparent uptake of F-18 in the tumor area. The time transit pattern of radioactivity through liver, gallbladder and kidneys was quite variable in the indivii ual patients. The significance of this observation in terms of the various metabolites represented by the r..<;ioacti vi ty and of any possible effect of 5-FU on. the tun.jr remains to be determined.
Lieberman L. (from Madison, Wis., personal communication) u*ing a somewhat different method of synthesis of F18-5-FU, have attempted to use it as a tumor localizing agent for scintigraphy. Five out of 11 patients so studied showed enough concentration in the known tumor site to be demonstrable by scintigraphy. These five patients included three that had
- 9C -
gastrointestinal carcinoma, one with carcinoma of the base of the tounge and one with a chondrosarcoma. None of these patients have received prior 5-FÜ therapy»
It is hoped that the inconsistancy in the results of F18-5-FU uptake in the various tumors will be clarified by measuring the ratio of F-dUMP to dUMP in specimens of human colorectal carcinoma. It is hoped to separate those tumors in which a high ratio may support the therapeutic effect from those in which a low ratio may inhibit activity of F-dUMP. Whenever logistically possible, the non-invasive studies with F18-5-FU proposed here will be carried out in close synchronization with those biopsy studies, thus using a two-pronged approach to the prediction of 5-FU response and trying to validate one methodology by the other.
As part of our continuing aim in developing methods to study the differential kinetics of distribution of this drug, a series of carotid-jugular loops were performed, as described previously (\ifolf, W. & Manaka, R.C., J. Clin. Hem. Oncol. 7,80,1977), and either F18-5-FU or "cold" 5-FU was injected intravenously, at doses of 1-15 mg/kg. Activity was recorded at 4 sec intervals on a 1024 pulse height analyzer in a multiscaling mode, and the data analyzed by non-linear and auto-an computer programs. Blood samples were collected serially between 1 and 70 minutes after a bolus injection, aud analyzed by high-pressure liquid-chromatography.
Two compartmental kinetics were obtained in female Fisher rats. The values of the pharmacokinetic constants a r e :
1 f i _ a S t 1/2 a t 1/2 B F-5-FU 4.06 0.011 0.17 mic 62.0 min 5-FU 2.78 0.035 0.25 " 19.8 "
The lower value of the t 1/2 of the rapid distribution phase of the F-18 labelled drug is probably due to more accurate sampling, while the higher value of the slow phase is caused by the presence in blood, not only of 5-FU, but also of its metabolites. The significance of these studies lies in that they may allow individualized, non-invasive pharmacokinetic assessment of drug distribution, both in blood and in other organs.
* IAEA fellow and visiting associate professor of Radio=
pharmacy at USC, Los-Angeles. Present address::Radiopharmacy Unit, School of Pharmacy, The Hebrew University, Jerusalem.
- IOC -
LIGHT SENSITIVITY TESTS - PRELIMINARY STUDIES IN PSORIASIS PATIENTS UNDERGOING ACTINOTirERAPY AT THE DEAD SEA
by
A.P. Kushelavsky, Ph.D. Department of Nuclear Engineering Ben Gurion Univers i ty of the Negev
3 . Azizi , M.D. Department of Dermatology
Tel-Hashomer Hospi ta l , I s r a e l
W.W. Avrach, M.D. Department of Dermatology
Hadassah Hospi ta l , Je rusa len
Abstract The success of act inotherapy t reatment of 94 o a t i e n t s with p s o r i a s i s
was co r re l a t ed with t h e i r pre- t rea t rasnt UV l i g h t s e n s i t i v i t y . The p a t i e n t s were divided i n t o three groups according to t h e i r s e n s i t i v i t y t o UV l i g h t . I t was found t h a t the most s e n s i t i v e group benef i t t ed l e a s t from a c t i n o therapy ind ica t ing the importance in pretreatment determination or the p a t i e n t ' s sun s e n s i t i v i t y .
Experimental 94 p s o r i a t i c p a t i e n t s , mostly with "geographic" t runka l and limbs,
skin l e s ions were examined. Each p a t i e n t was i r r a d i a t e d with increas ing doses of UV l i g h t on a previously unexposed skin area of h i s lower b a c k . ' * The i r r ad iance a t 297 nm a t the skin was found to be 0.689 mW/cm2 and 1.27 mW/cm2 a t 254 nm.
The p a t i e n t s were exposed for 30 seconds, 60 seconds, 90 seconds and 150 seconds. Twenty-four hours a f t e r the exposure, t h e i r UV s e n s i t i v i t y index (UVSI), defined as the lowest exposure which produced erythema, was determined.
Thereafter the p a t i e n t s s t a r t e d da i ly t rea tment . The t reatment consis ted of ba th ing in the Deas Sea and sunbathing, i n i t i a l l y for ha l f an hour twice da i ly increas ing cowards the end of the treatment t o 6 hours da i ly exposure. Usually the p a t i e n t ' s normal l o c a l t reatment was continued. At the end of the t reatment f ina l t he rapeu t i c r e s u l t s were determined using a 5-grade scale going from completely healed to unchanged and d e t e r i o r a t e d .
HC -
Results 26 out of the 32 p a t i e n t s with the lowest UVSI ( i . e . the most s ens i t i ve
t o UV), could not stay freely in the sun and t h e i r exposure times had to be cut to 1/4-1/2 of the normal treatment t ime. 12 out of these 32 p a t i e n t s had c l e a r evidence of p h o t o - s e n s i t i v i t y manifested by various degrees of e r y t h e matous r eac t i ons . In 5 pa t i en t s of t h i s group the exposure l im i t a t i ons p e r s i s t e d throughout the whole month and no adaptat ion was noted.
42 p a t i e n t s f e l l i n t o the second IIVSI. This UVSI was found to be about averaqe for a randomized population (unpublished d a t a ) . Only 7 p a t i e n t s of t h i s group developed p e r s i s t e n t erythematous r eac t ions . One of the p a t i e n t s , a woman taking the contracept ive p i l l , developed severe photosens i t ive r e a c t i o n s .
The p a t i e n t s with UVGI of 90 seconds and grea te r shewed exce l l en t adaptat ion to sunl ight without any c l i n i c a l evidence of p h o t o s e n s i t i v i t y .
The following prel iminary conclusions can be made: 1) As a group p a t i e n t s with low UVSI benef i t t ed l e a s t from ac t inotherapy. 6% of t h i s group showed no c l i n i c a l improvement. This may be due t o the fact t ha t s t r i c t l i m i t a t i o n s had to be placed on the neriod they were allowed to s tay out in the sun. Hence they could not enjoy the complete schedule of ac t inotherapy. I t would appear tha t t h i s group requires a longer program of act inotherapy with a very slow increase in t h e i r da i ly exposure t o sun l igh t . 2) The p a t i e n t s with normal and above UVUI show exce l l en t c l i n i c a l r e s u l t s . Pa t i en t s with higher UVSI would appear t o benef i t most from actinotheraDy.
Discussion The preliminary r e s u l t s confirm the importance of determining the l i g h t
s e n s i t i v i t y of the p a t i e n t s before t reatment . Optimal r e s u l t s can be obtained only i f the p a t i e n t ' s l i gh t s e n s i t i v i t y i s taken in to considerat ion and a spec ia l l i g h t therapy program i s t a i l o r e d for each p a t i e n t i nd iv idua l ly . Furthe r work with much l a rge r grouos of p a t i e n t s i s necessary in order t o c o r r e l a t e the rapeu t ic r e s u l t s with exposure for p a t i e n t s with d i f fe ren t skin complexions and sever i ty and type of p s o r i a s i s .
References 1) A.P. Kushelevsky, "Fiber Optic Light Guides for Photo tes t ing in Dermato-
log ica l Photobiology", Phys. Med. Biology 2_3, 503-510 (1078). 2) J.W. Avrach and A.M. Hiordson, "Psor ia s i s Behandling Ved Det Dtfde Hav",
Uqeskrift for Laegen, 136, 2687-2690 (1974).
- 12C -
COMBINED LOCAL HYPERTHERMIA AND X - IRRADIATION IN THE TREATMENT OF METASTATIC TUMORS: CASE REPORT. * & )
# + A. Yerushalmi and M. Talpaz # Radiation Unit, The Weizmann Institute of Science, Rehovot, Israel, and + Internal Department C, Oncologec Unit 0 s), Kaplan Hospital, Rehovot, Israel.
Introdviiction : It is well established that hyperthermia has a
selective inhibitory effect on cancer cells. Experimental and clinical evidence prove that hyperthermia and combined local hyperthermia and ionizing radiation are inactivators of tumors. (1-4). Two cases are reported here. The simultaneous application of hyperthermia and ionizing radiation therapy induced regression of tumors, in cases where conventional methods had failed. Case 1 : B.R. Female, age 80 In 1963 the patient underwent right nephrotomy . She did well up to 1969, when metastases appeared around the surgical incision lines. She then underwent surgical procedures to remove these metastases, and post operation x-ray therapy. A progesterone course followed these treatments. On January 1976 the patient noticed palpable nodes in the axillary and inguinal region. She was checked in the oncological unit at the Kaplan Hospital. At this stage nodes were detected in the right and left axilla and a hard stationary lymph node measuring 5.0x3.5 cm diameter was found in the right inguinal region. The patient suffered also from massive oedema of the right thigh and limb due to obstructuion. Thereafter she underwent one course with Vinblastine. Chemotherapy was stopped, since treatment did not affect the palpable nodes, and the patient's refusal to continue treatment. At this stage it was decided to try the combined simultaneous local heat and x-ray treatment. The aim was to achieve regression of the mass in the inguinal region.
(a) Supported by Gulton Foundation, Englewood,N.J. USA. (b) Dr. A. Shani, Head.
- 1 '. • -
Each session consisted of local heating, 70 min. by hot air, and 180 rad (280 kv, 14 mA IB rad/min H.V.L 4.0 mm Cu. ) X- rays administered during the last 10 min. of local heating. Skin temperature in the heated region was 46-47°C, rectal temperature was 36.8-36.9°C before, during and after heating. The patient underwent 6 sessions during 13-20.6.78 . After these treatments, the lesion was obviously regressing and became flat and soft. On 5.8.78 it measured 1.5x2 cm diameter. Skin reaction at the treatment region was moderate with blister formation. During this period the patient developed an acute renal failure due to obstruction of the left kidney. The patient underwent nephrotomy and it became impossible to continue any treatment. Case 2 : L.L. Male, age 67. The patient was hospitalized on 1.2.77, because of pains in the shoulder, and fulness of the upper abdomen. Medical ex?mination confirmed fulness of the upper abdomen and a supraclavicular enlarged node. Biopsy of the node indicated a metastatic adeno -carcinoma. In spite of the lack of clear cut diagnosis, it seemed to be a pancreatic adenocarcinoma. Liver scan revealed suspicions for metastasis. Also bonny metastasis was suspected. From visual impairment development, it was not possible to rull out brain metastasis. The patient underwent a 5FU course without any effect. He was also treated with the same drug according tc the Ans field protocol, without any effect. The patient's condition deteriorated during May 1977, with the appearance of pain and loss of weight. Also an upper abdomental mass was palpated below the xyphoid, measuring 4 cm diameter. With this deterioration in his condition, the patient was treated according to a protocol consisting of Mitomycin, Oncovin, thio TEPA and Methotrexate . During this treatment partial clinical remission was observed, which lasted from July to November. At this stage, the patient's condition deteriorated with the appearance of ascites and the reappearance of the upper abdomenal mass, measuring 9 cm in diameter, which »as hard and non-movable. At this stage it was decided to try the combined simultaneous local heat and x-ray treatment. The patient underwent 4 sessions during 16.12.77 -10.1.78, following the same protocol of patient 1. After these treatments, on 25.1.78, an obvious regression of the tumor was measured. However,
14C -the patient's general condition continued to deteriorate. He developed cerebral symotoms. He was confused and lethargic, and later became comatus most probabley because of brain metastasis. He died on the 10.2.78 . 1) Proceeding of the International symposium on cancer
Therapy by Hyperthermia and Radiation. Washington D,C. April 28-30, 1975. Chicago ; The American College of Radiology.
2) Brenner H.J. and Yerushalmi A. Combined local Hyperthermia and x-irradiation in the Treatment of Metastatic Tumours. Brit. J. Cancer, 33. 91-95 (1975).
3) Yerushalmi A. Cure of a Solid Tumor by simultaneous Administration of Microwaves and x-ray Irradiation. Radiat. Res. 64 602-610 ( 1975) .
4) Yerushalmi A. Treatment of a solid tumor by local simultaneous Hyperthermia and Ionizing Radiation: Dependence on Temperature and Dose. Europ. J. Cancer .12 807-813, (1976) .
- 15c -
THE ROUTINE APPLICATION OF THE 99m TECHNETIUM PYROPHOSPHATE HEART SCANNING IN PATIENTS WITH SUSPECTED ACUTE MYOCARDIAL INFARCTION.
Silberman C , Zllberman A., Pesachovlch A., Getz r.., Ronen M. and Crlstal N. Department of Tsotopes and The Coronary Services, Soroka Medical Center, The Faculty of Health Sciences, Ben Gurion University, Beer Sh«wa and The Nuclear Research Center-Negev.
Acute myocardial infarction is the most important cause of morbidity and mortality among the adult population. The exact diagnosis ot its presence, its localization and its extension is of utmost Importance in medicine. The lack of sensitivity of existing diagnostic criteria (typical pain-new "0" waves in the electrocardiogram-rise in specific serum enzymes) has led extensive research to develop more sensitive methods and im rove the diagnostic accuracy. In this context, the potential application of the selective uptake of radionuclides by the infarcted myocardium as a noninvasive diagnostic technique seemed a promising method.
Since the earliest efforts to identify infarcted myocardium by isotopes localized in the normal myocarrfiaiii (Phosphorus 32 - Yates, 1952) much experimental and clinical work has been done»which resulted in the widespread use of 99m technetium-pyrophosphate, a radionucleid which deposits in acute necrotic muscle. This infarction-sclntigraphy has developed from a purely research technique to a fairly commonplace clin'cal tool.
Today the diagnostic specificity and sensitivity of the 99m Tc Is widely confirmed and its clinical value in the detection, localization and quantification of myocardial necrosis is obvious. The practical problem we were confronted with was the application of the test In a medical service where the equipment necessary to perform the examination is located too far from the itensive care area to preclude its routine application to all the patients. Since this problem is common to many medical services, we consider that it would be of practical interest to evaluate the contribution of the examination in the diagnosis of patients suspected of having an heart attack, in order to define subgroups of patients for whom the final diagnosis could be Improved by 99m Tc-P. This subdivision may help in makinp the decision when and In whom to perform the examination.
Our experience is based on 80 patients admitted to the ICCU in the Soroka Medical Center with proved or suspected myocardial infarction. According to the presence of classical criteria, patients were allocated into one of three groups: A) 20 patients in whom the diagnosis was based on clinical, electrocardiographleal and enzymatic criteria, B) 25 patients in wnom the presence of myocardial necrosis was diagnosed by clinical presentation and rise in serum enzymes, but the ecg was not diagnostic, and C) 35 patients in whom the diagnosis in infarction was suspected on clinical grounds, but neither enzymes nor ecg were diagnostic.
The contribution of the 99m Tc-P test to the final diagnosis (pre and post-test to the final diagnosis (pre and post-test level of diagnostic accuracy) was different in the three groups. The most important contribution
- 16c -
ras ln group C. In group B the test Improved mainly the diagnosis of the localization of the necrosis. Among patients that fulfill the three diagnostic criteria (group A ) , no further help Is to be expected from the test.
We conclude that it is essential to perform the 99m Tc-P heart scanning for patients of group C. The test is not necessary for patients of group A. For patients belonging to group B, it is recommended to perform the test, in vlev of the prognostic implications related to the site of the necrosis vlthln the heart.
Z. Tesler, M. D., h. Friedman, M. D., A. Pelsalovlch, M. D., M. Ronen, C D . and C. Sllbertnan, M.D. Department of Isotopes and Department of Ophthalmology, Soroka Medical Center, Beer Sheva.
On* of ehe most frequent causes of tearing (epiphora) Is ;i disturbance In the lacrimal drainage apparatus, the etiology of which could be: 1. Developmental malformations, 2. Congentlal imperforation of the naso-lacrimal duct, 3. Inflammation, 4. Tumor, 5. Trauma, 6. Foreign body, 7. Physiological block.
When a pacitnt complains of epiphora, verification of the patency of the naso-lacrlmal drainage system is of utmost Importance. There are several ways to accomplish this: 1. Irrigation trial with saline and checking for the fluid under the
inferior nasal concha, 2. Contrast dacryocystography, 3. Radioactive dacryocystography. Compared with the other two, the last procedure has many advantages.
Recently, 20 patients who complained of epiphora were examined in our department by radioactive dacryocystography and the results were compared with the clinical findings by slit lamp, conlunctival culture, and irrigation test, carried out by the ophthalmologist.
99 One drop of Tc sodium pertechnetate was instilled into the conlunctival
snc of each eye by an oxford sampler micropipet. The drop was in a dose of approximately 200pc. The patient was then seated facing the gamma camera screen, with his forehead and nose touching It, and scintiscans were done at 0, 15, and 30 minutes, collecting 85K counts.
The resulns of the radioactive dacryocystography and the examinations by the ophthalmologist were In complete correlance except for 1 case which can be explained as a physiological block. Case report: 1. A male patient was complaining for years of epiphora in both eyes. Tine ophthalmologic examination and an irrigation test were normal. On the radioactive dacryocystography we found a physiologic block on both sides. 2. A male patient was complaining of epiphora of the right eye. Irrigation teat was normal. Radioactive dacryocystography showed less exposure of the polaroid picture above the right lacrimal apparatus, which can be explained as a stenosis of the lacrimal duct on this side.
- 18c -
The radioactive dacryocystography advantages over the other procedures are as follows:
Radioactive Dacryocystography
Saline Irrigation contrast Dacryocystography
1. Atraumatic Traumatic
Z. Imitates normal physiology Differs from normal physiologic drainage
3. May be used immediately after dacryocystorhinostomy
Cannot be used immediately after dacryocystorhinostomy.
4. Small lense irradiation (4-6 m rads) High lense irradiation (300-400 m rads)
5. Non— labourious Labourious
- 19C -
PREPARATION OF 82Br-BI0M0LECULES VIA NEUTRON IRRADIATED BROMATES.
Z.B. A l fass i *
Department of Nuclear Engineering
Ben Gurion University of the Negev
Beersheva, Israel
(11 123 Stocklin and coworkers1 ' have found that decay of Xe on KIO,
and addition of the KIO, to acidic solutions of activated organic and 123 biological molecules led to high y ie lds of I-biomolecules. Similar
77 77 (21 ft2 works were done for Br by decay of Kr 1 ; and for Br by decay of CF, mBr. ' However, the last method can lead only to relatively small
82 amounts of Br due to the low ratio of parent (6.1 min.) to daughter half life (35 hr). Higher yields with much less effort can be obtained by
using directly neutron irradiated bromates. Table I gives the 82 radiochemical y ields in th is method of several Br-organic molecules.
The preparation method consists of i r rad ia t ion of KBrO,, cool ing, addit ion
to H2S0, solution of the organic molecule and HPLC separation.
* Work done at I ns t i t u t für Chemie der KFA, Jü l i ch , FRG
- 20C -op
Table I: The radiochemical yield of Br organic molecules (percent 82 of total induced Br activity)
Organic substrate Product Yie1d ( a ) Labelling Yield ( b )
(a) The reproducibility of the results was within 15 %.
(b) Referring to the total Br" yield (80 %, ref. )
- 21C -
References:
1. H.J. Machulla, A. Shanshal and G. Stockl in , Radiochim. Acta 24_, 42
(1977); M. El-Garhy and G. Stockl in , Radiochem. Radioanal. Let t .
18, 228 (1974).
2. 0. de Jong, H. Kooiman, G.A. Brinknian, L. Lindner and F.M. Kaspersen,
2nd Int . Symp. on Radiopharmaceutical Chemistry, Oxford, July 1978.
3. S.H. Wong and H.J. Ache, In t . J. Appl. Rad. Isot. 22, 19 (1976);
S.H. Wong, J.F. Mastaklem and H.J. Ache, In t . J. Appl. Rad. Isot .
27, 379 (1976).
22C -
EVALUATION OF LIVER AND BONE SCANNING AFTER SURGERY FOR BREAST CANCER So Zaltzmon and M. Barski
Department of Nuclear Medicine, Tel Hashomer Govrnroent Hospital
We should consider the screening pre-operative liver and bone scanning in patients expecting surgical treatment for cancer of Mammae a very important step in special cases. To assess our theory we took two samples consisting in two groups of patients sent to our examinations up to 3 months after surgery. All of them had hystological confirmation of the disease and the scanning were required only when clinical or laboratory findings brought the suspitino of metastases. The first group consisted of 17 patients operated between March and October 1976, and the second group, of 9 patients, from October 1977 to April 1978. Half of them had positive lymph nodes in the axilla. The results for these 26 cases were as follows: - No pathological findings - 13 - Metastases to Liver - 1 - Metastases to Bones - 3 - Other pathological findings - In Liver - 6
Iu Bones - 3 Summarizing, 4 out of 26 Patients (15,3%) and had confirmed spread of the disease a short time after surgery. The remaining 9 cases showed inespecific or degenerative changes without further confirmation of metastases during the follow-up. Discussion : The problem of a screening scanning of Liver and Bones sistematically before mastectomy for cancer of mamae has two aspects to be considered. On one side, we could think that a positive finding would prevent innecesary operations that would only add to the suffering of the patients and to the work of the hospital staff, and spend innecesary internation-days. On the other side, adopting such examination as a preoperative routine would create logistic and economical problems to the Nuclear Medicine Departments, which, would have to be expanded in machinnery and personnel to be able to cope with the supplementary work. A complete statistical study of breast operations is available for the year 1974. Figures of the last years have not yet been fully published 4
During the above mentioned year, 770 mastectomies were done in Israel, ranging from the simple to the extended radical mastectomy.
- 23C -
From them, about 70 were done in the Sheba Medical Center in Tel -Hashomer. If we consider 20 minutes for eech complete Liver-Spleen examination and 60 minutes for each complete Bone scanning, The total time consumed by our 70 patients vould be 93.3 hours in one year. That means almost three weeks of worker-machine occupation. We confirmed a high proportion of metastases - 15.35 as seen above-in our 26 cases. We considered 3 months after surgery a reasonable limit of time to suspect they had metastases before the operation. The medical literature available is not so categoric as we are C. J. Davies and others ( Brit. Med. J., 2-603-604, 1977)studied 192 patients 4 to 6 weeks after operation . They found a significant relationship between the presence of metastatic lymph nodes to axilla and the incidence of bone metastases. In consequence, they advocate the lymph node biopsy for assessing the prognosis of the patient, in place of the radioisotopic scannings. Other authors ( Butzeiard, Vandongen and Vanderchaft, European J. of Cancer, J3:l9-22, 1977) found only 8.4?» cases with bone mete's lases in patients studied before operation and staged T) - T2 , No and N-]a „ For this reason they concluded that the radio Iso-topic examination is unnecessary in the early stages. Our samples were pre-selected because they were sent to us only after the surgeon or the oncologist suspected the spreading of the cancer» Our own experience and of the above mentioned authors inclines us to reccomend the screening Liver and bone scans before operation in the following special cases:
a) The presence of palpable Lymph nodes. b) Confirmed Lymph nodes metastases by byopsy. c) When there are clinical and laboratory basis for
a rensonble suspition.
*-.
SECTION D
HEALTH PHYSICS
- ID -
RADIATION HAZARDS FROM CONSUMER PRODUCTS IN ISRAEL
T. Schlesinger and M. Surkes Soreq Nuclear Research Centre, Yavne, Israel
There are a number of instruments and consumer products which during regular use or operation emit ionizing radiation. In many cases this radiation is extraneous in light of the purpose for which the instrument or the product is designed and used. The public is therefore not awara of the potential radiation hazards of these items. Among such instruments and products being used by the public in Israel (exempt from radiation protection legislation) are television receivers, airport inspection systems, high voltage rectifiers, electron microscopes, cold cathode gas discharge tubes, smoke detectors, static charge eliminators, natural radioactive materials etc.
The technical details of these products, the type of radiation emitted and the expected exposure rates are discussed. A quantitative assessment of the exposure to individuals and the public is given-
Of special interest are the radiation hazards from color television receivers. Until 1975 the number of such receivers in Israel was very small. Recently, however, there is a trend in the public to acquire color television sets even though the Israel Broadcasting Service does not broadcast in color (color broadcasts are received from neighboring countries, mainly Jordan). According to U.S.A. standards (1) the radiation exposure from T.V. receivers should not be higher than 0.5 mR/h (averaged over 10 cm2) at any accessable point 5 cm from the surface of the receiver under normal operating conditions. Receivers that do not comply with this requirement are recalled and modified (90,000 receivers were for example recalled for this reason in 1967 (2)), In Israel there are no such regulations at present and there is a potential hazard that receivers rejected in other countries because they emit excess radiation will be imported and distributed in Israel, if no legal measures are taken.
References 1. Recommendations of the National Committee on Radiation
Protection and Measurements,Radiology T5_, 122 (1960) 2. NCRP Report No. 56 (1967) p. 2.
- 2D -
SKY-SHT CALCULATIONS FOR GAMMA SOURCES U erman , A»Talmor
Nuclear Research Center , Negev P. 0. B. 9001 , Beer-Sheva
hen r. shielding container cf a high activity source ; r, open towards the sky, a significant amount of radiation is scattered by the nir, increasing the r.-ickground near the container. Calculations of the increased background can bo p-rforred using laborious , ontc. Jarlo codes; the present vjorlr rr-sents a simple •••nputcr program for the evaluation of the radiation •cnttored by the sky to any ron'nt in tho ->-: rinity of -'• source,solving th<, so-c'1"U> rky-shine problem. A point rource is assunw" at tb- ottom of n shielding •ylinder of height H and dir:-!-ter 0. The r-diation hich escapes fror, th: container . orris a conus v:hich
:" the source of the scattered radiation .Tho scattering "rom e.-'ch point in the conus i r assume! isotropic and '"}'•'. part ..'hich reach.is •. unit arer at the checked point is calculated. The geometry of Lhc p:-oc
:-: fig.1.
_.D.|. /..'..J Fig.1. The neo ictry for sky-shine calculation.
i s shown
3D -
For a radioactive source cmittinn S photons/sec at energy E, the intensity reaching the volume element dV is:
I1=B*J^_«S*e~2l''R (photonr/sec)
'"here: •CL- the solid snßle of clement flV as scon fron 0. B - buildup factor I T- total attenuation factor
The number of photons scattered 5n tv- oln-r-n.t dV is
dI=I.(1-e- j T , d R)_4i-i s- the; scattering cross soo.t-op
Assuming isotropic scattering, t'--.: "oso r. te at "
v:hero IT is tho tot-i cross section o- photons of enerry
E'-1 + |e7r°- C 0 £ p )"
in air am' K-j. is tho intc-nsifcy—vo.-;e f•ctor r.t energy E'(Pis the allglo OAB am! s is t!v distance AB).
The contributions of th': dV elements to the 'lose at B is \-dded performing iterations ov, r 0 ,^ , R. The elements d6 ,dY ,dR .ere chosen .so '••'v.t increasing their dimensions twice will change the final result by less than Vo. R is increased until the contribution of any element at this distance is lcr.r than 1'.' from the total dose.
The- pv-orr-.im was employed \ o calculate the dose rate fron a Cs-1"7 an-1! Co-60. source in a cylindrical lead shi'-lö of dimensions 5;/>:?0 CM.The source was at '1-0 cm. fron the shiojn bottom and the shield thickness was '>!> en.The dose v.".luos at various dlst.-.-.nces from the source at 180 rn. height are civen in table 1.
4D -distance from shielvi wall (m)
-'" - — 1 2 3 10 r 0 70 100
Cs-157 ''000 Ci 98.' 47.8 50.5 6.9 1.3 0.2 0.09 O0-6O 500 Ci 104.? 52.0 55.4 7.9 1.6 0.5 0.12
Table 1-l'ha radiition fiel'" r-onr nhielded nonrces due to sky-shine. (i n nB/hr).
In order to check the r. Iculation. • n axnr-rdr-.'-nt v;as performed employing a 3.9 'ji Ir-19' .'ourr-e 'n ? load shield open to tho sky.The ••'one rater, nenr-urod v.'ii.h a Babyline(1) and c To tal (r:) or-i^tor tofsthe-r \ifch tho calculated v luer rm '-±vnn in fc-Mc ''.
Table 2-Calculated -.nd exp< rin nl; 1 doso rates near a shielded 8.9 'i Ir-1" rourco fin pR/hr).
SD -
THE APPLICATION OF THE ICRP-26 RE00MME8DATI0NS IN THE ISRAEL PERSONAL DOSIMETRY SERVICE
Y. Eisen and T. Schlesinger Soreq Nuclear Research Centre, Yavne, Israel
Since the new version of the ICRP recommendations has been published (ICRP-26) the Israel personal dosimetry service has been guiding its customers to ensure that the average annual effective dose equivalent to all exposed workers falls well below the limit of 5 Rem.
Warnings are sent to workers who are exposed to more than about one third of the above recommended limit, i.e. above ISO mRem, within one month. This new adapted limit satisfies the condition that during a three month period the effective dose equivalent will not exceed one tenth of the annual limit of 5 Rem. Before ICRP-26 had been published! warnings were sent fox monthly exposures above 400 mRem. Warnings are also sent to working places in which the annual dose equivalent averaged over all their workers is greater than 500 mRem. A survey which was carried out by us shows that only in a fev; working places the annual dose equivalent average exceeds 500 mRem. Due to the reduction in the monthly warning limit from 400 mRem to 150 mRem, the number of warnings increased from 0.1% to 0.4%.
The Israel personal dosimetry service adopted the weighting factors for different organs recommended by the ICRP-26. Previous to this publication doses were measured and recorded separately for the whole body, hand, feet, head and skin. Beginning 1979 we intend to register, in addition to the individual doses to the above organs, the effective dose equivalent 5 calculated as follows
5 - J U lD t
where u. is the weighting factor for the i-th organ as adopted by the ICRP and D. is the dose equivalent for that organ as recorded by the individual dosimeter. The whole body skin dose is incorporated in the quantity 15 and its weighting factor is taken to be 0.05. A detailed description of the dose handling computer code and the way in which the effective dose equivalent is computed, registered and reported will be presented.
tø1!
AUTOMATIC TLD DOSIMETRY SYSTEM IK THE ISRAEL ItADGE SERVICE
Y. Eisen, S. Malhi and Z. Segal
Soreq Nuclear Research Centre, Yavne, Israel.
The Israel Badge Service is transferring from conventional film dosimeters to thermoluminescent (TLD) dosimeters. The changeover is expected to be fully effected by March 1979. A Harsha» (2271) automated TLD system together with two kinds of dosimeters have been purchased.
The dosimeters for determination of exposure Co B, V and X-rays are comprised of three TLD-100 (LiF) chips, two of which are 0.89 mm thick and the other 0.38 mm thick. The thicker chips are positioned in the badge holder behind a 1.2 mm Al filter while the thin chip (especially suitable for low energy X-rays and ß rays) is positioned behind an open window. Workers in mixed gamma (beta) and thermal neutron fields will use special dosimeters comprised of two TLD-100 chips and one TLD-700 chip. Thermal neutron doses are obtained from the difference between the. luminescences of the TLD-100 and TLD-700 chips. Each dosimeter has an identification number which is read prior to the chip readings. The dosimeter and its holder are shown in Fig. 1.
Each dosimeter contains two identical chips, one to be read each period and the other read only in case of a failure of one of the chips or after four periods to check the accumulated dose. Since the response characteristics of nil the dosimeters are not equal (a spread of + 15% exists), each TLD chip was individually calibrated. The calibration was performed by exposing the dosimeters to 600 mR of i radiation from a °"Co source. TLD chips that showed deviations from +15% were rejected and sent back for replacement. The calibration of each chip decreases the uncertainty in the extracted dose and improves the accuracy of the dosimeter reading.
After reading the chips exposed to 600 mR, the average residual jjse was found to be (3±l)mR. The background of unexposed dosimeters a week after annealing was found to be (7±2)mR. The reproducibility of values obtained for chips exposed several times to a dose of 600 mR was found to be +5%. Due to these factors we estimate that the minimum dose that can be recorded is 15 mR.
- 7D -
Fig. 1 TLD dasiüster and dosisieter holder
The energy response of the TLD chips was found by exposing them to X-rays of effective energies from 30 keV to 200 keV. The energy response was recorded separately for the thick chip behind the Al filter and the thin chip behind the open window. The response curve of the former is nearly flat above 40 keV and decreases below this energy. The response of the latter chip is peaked around 40 keV. At this energy the response is higher than at high energies by about 40%. A relatively large uncertainty might
- 8D -
occur when the dosimeters are exposed to a mixed low energy penetrating dose (for instance at 30 keV) and skin dose. Since the skin dose is absorbed by the Al filter, all luminescence in the thick chip will be due to the penetrating dose. The skin and penetrating doses are mixed in the thin chip and there is no way of extracting the energy of the penetrating dose. At low energies (20 keV - 40 keV), the uncertainty in the case of mixed skin and penetrating dose might be as large as 302.
For 6 radiation, the lowest energy that can be recorded is about 300 keV. Doses due to ß particles below. 800 keV are not recorded in the thick chip and are extracted from the thin chip only.
The uncertainties in the doses extracted by reading the thin and thick chips may be summarized as follows: a) +10% for Y or X-ray energ ies above 80 fceV b) ±20% for Y or X-ray energies between 40 and 80 keV c) +30% for Y °* X-ray energies between 20 and 40 keV d) +20% for $ energies above 300 keV
The automatic TLD reader provides the output on a punched paper. A system is now under design to store the output directly in a computer. The output includes the identity of the TLD card and the readings from the TLD chips. The TLD system is adjusted so that 1 nC in the current integrator is equivalent to 1 mR.
- 9D -
LET Dependence of the Relative Thermoluminescent Efficiency of LiF-TLD
J. Kalef-Ezra* I. Fraier*and Y.S. Horowitz Department of Physics, Ben Gurion University of the Negev
LiF-TLD'-S are today the most commonly used TL dosimeter material mainly because of their high sensitivity and tissue equivalence in gamma and electron radiation fields. Much effort is currently being invested in the investigation of the use of LiF-TLD in more exotic radiation fields such as mixed neutron-gamma and high Linear Energy Transfer (LET) particulate radiation fields. For this reason it is important to investigate the thernoluminescent (TL) sensitivity of LiF-TLD as a function of LET and other factors.
We have investigated the dependence of the relative TL efficiency of LiF-TLD, n, on the unrestricted dose-averaged Linear Energy Transfer, LET„ , of the ionizing radiation field (TL-LET dependence) using LiF:Mg,Ti hot-pressed chips; TLD-100,600,700 encapsulated in glass bulbs and two batches for each type. The possibility of type and batch dependence of n was also investigated. The concentration of the main impurity dopants was found to be constant over the dosimeter population (Mg, Ti) however large variations were discovered in the concentrations of other impurities.
Standard heat treatments were employed i.e., one hour pre-irradiation annealing at 4itO°C followed by a slow cooling rate to room temperature and a 15 minute post-irradiation anneal at 100°C. The TL reading system is based on single photon counting; glow curves were recorded using an Elscint MCA in multiscale node and the integral under the glow curve after electronic background subtraction was used as the IL signal. The dosimeters were irradiated at room temperature..with: Co-60 gamma rays, beta particles from Ni-63, Pr-147 and Kr-85 sources, •+ MeV alphas from Am-241, neutrons and S pm mylar degraded fission fragments from a Cf-252 spontaneous fission source.The imparted energy rate delivered to the LiF-TLD's by the particulate ionizing radiations was measured using Si surface barrier detectors. The low energy Ni-63 source was calibrated by cooling the Si detector to -20°C. Calibrations were carried out under geometrical configurations identical to those used for the dosimeter irradiations.
Electron backscattering was taken into account using a modification ) of Everhart's backscattering model2) as well as Monte Carlo calculations3) for the u
greater electron energies. Corrections for TL light self-absorption were also applied.) Our results combined with collected data from the literature clearly indicate
the the relative TL efficiency is not only LET» dependent, but also depends strongly on the particle species. The possibility that changes in the TL emission spectrum5) for various species of radiation influences the value of n has been excluded by our TL emission spectra studies using optical filters. We have also observed that the relative TL efficiency is both batch and type dependent in certain regions of LET. We speculate that this dependence arises from variations in impurity concentrations from batch to batch that we have measured via chemical atomic spectroscopy.
+ Partially supported by the International Atomic Energy Agency, Research Contract 1614/RB and the United States - Israel BiNational Science Foundation
* In partial fulfill nent of the requirements for the M.Sc. Degree
lOD We have theoretically investigated the TL-LET dependence using the
theory of the track structure of charged particles. In order to quantitatively predict the influence of saturation on the TL-LET dependence we measured the TL growth curve for H-3 beta particles combining it with published experimental data on the radial dose distribution surronding the central column of the heavy charged particle track in tissue equivalent gases. This calculation of the saturation mechanism was not capable of predicing our measured TL-LET dependence. Other iiBchanisms potentially contributing to the TL-LET dependence will be discussed.
1. J. Kalef-Ezra and Y.S. Horowitz, Calculation of Electron Backscattering for low Z materials of Dosimetric Importance, to be published
2. T.E. Everhart, Jour. Appl. Phys. 31, 1483 (1960) 3. J. Kalef-Ezra and Y.S. Horowitz, Proceedings of the Specialists Seminar on
TL Dosimetry Applied to Archaeology, Oxford, 1968. PACT Journal on Chemical, Mathematical and Physical Techniques Applied to .Archaeology, in press.
4. Y.S. Horowitz, I. Fraier and J. Kalef-Ezra, Measurement of TL light self--absorption in irradiated LiF using monoenergetic thermal neutrons, to be published.
5. I . Fraier, J . Kalef-Ezra and Y.S. Horowitz, Emission spectra of LiF-TLD after irradiation by charged par t ic les , to be published
- HD -
Thermoluminescent Effici;ncy of LiF-TLD to Cf-252 Fission Fragments
li ss
J. Kalef-Ezra , I. Freier and Y.S. Horowitz Department of Physics, Ben Gurion University of the Negev
In the various studies of TL-LET in LiF-TLD previously reported in the literature the high LET points have been usually obtained via low energy alpha particles or heavy ions (e.g., 0-16, Ca-':0 etc..,) and the LET value has therefore not exceeded approximately 1000 keV/ian. The possible observation of fission fragment induced TL is therefore of especial relevance in TL-LET studies because it allows the extension of the TL-LET curve to very high LET values approximately one order of magnitude greater than in previous studies. Theoretical predictions of the relative efficiency of fission fragment induced TL result in very low efficiency ( 5% ) relative to Co-60 gamma rays.
We have therefore studied the TL induæd by fission fragments by irradiating in vacuum LiF-TLD's with a 5 pm mylar degraded flux from a Cf-252 source. The energy imparted to the LiF-TLD's by the particulate low penetrating radiations has been monitored using a Heavy Ion Silicon Surface Barrier Detector and the energy spectrum calibration has been corrected for pulse height defect using an empirical function introduced by Wilkins et. al.,1). Approximately one-third of the imparted energy arises from fission fragments that in LiF have a mean specific LETS* of approximately 3.7 x 101* MeV gm cm - 2. Most of the remainder of the imparted energy arises from alpha particles emitted from Cf-252. The alpha TL efficiency of the LiF-TLD's was simultaneously determined using an Am-2'tl source. The small contribution of other radiations to the TL production (e.g., beta particles, gamm rays and X rays, neutrons and light charged particles emitted during ternary fission events ) has also been taken into account.
Various batches of Harshaw TLD-100,600,700 encapsulated in glass bulbs have been employed. The TL reading system is based on single photon counting using a cooled GaAs photooathode RCA photomultiplier of constant photocathode efficiency from 200 - 900 nm. Glow curves were recorded in an Elscint MCA used in multiscale mode where background subtraction was carried out electronically. The integ:oal under the glow curve was used as 1:he TL signal. No significant differenoas between the glow curves arising from the Cf-252 and Am-241 sources were observed.
The TL efficiency of the fission fragments relative to 5.5 MeV alpha particles has been found to be 1.3 ± 0.4 ( the statistical error comprises only a small part of the indicated total error. If saturation were the only cause of the reduced TL efficiency of LiF-TLD for high LET radiations relative to low LET radiations, the fission fragment relative TL efficiency to 5.5 MeV alphas would be approximately 0.3. The obvious and rather surprising conclusion is that saturation is not the only effect responsible to the TL-LET behaviour in direct contradiction to TL-LET dogma of the past decade. As previously mentioned no previous data have been reported in the literature for very high LET radiation however model dependent extrapolation of published alpha and heavy ion data yield values of fission fragment TL efficiency up to one order of magnitude lower than alpha TL efficiency.
+ Partially supported by the International Atomic Energy Agency Research Contract 1614/FB and the United States-Israel BiNational Science Foundation
* In partial fulfillment of the requirements for the M.Sc. degree
- 12D -
Previous theories of TL-LET behaviour have almost exclusively assunrosd that the TL production efficiency is insensitive to the species of the ionizing particle and we speculate that this is one of the main deficiencies of the previous models. Current studies in oi>r laboratory are aimed at determining to what extent the TL-LET behaviour is material dependent, i.e., to what extent is the TL-LET dependence a function of impurity concentration, type of material etc., The relatively high TL efficiency of LiF-TLD's to fission fragments points to the potential application of TL dosimetry to heavy ion dosimetry, fast neutron flux monitor ing?) etc,
1. B.D. WiUdns, M.J. Fluss, J.B. Kaufman, C E . Gross, E.P. Steinberg, Nucl. Instr. iMeths. 92, 381-389 (1971)
Y. Eisen, Z. Karpinowitz, A. Gavron, A. Tal, Y. Itzkin and T. Schlesinger
Screq Nuclear Research rentre, Yavne, Israel,
During the last few years many attempts have been made to replace the conventional nuclear track emulsion dosime'.er with a more reliable dosimeter. Such attempts include the albedo dosimeters (1), polycarbonates with fissile radiators (2) and polycarbonates with no radiators (3). Here we report on our study on polycarbonates with no ej'.ernal radiators. We have investigated the energy response in the range 1 to 14 MeV, the dose threshold and the electrochemical etching method for recording the damage sites ir the polycarbonate due to the interaction with fast neutrons.
Nuclear track emulsion dosimeters (NTA films) have several drawbacks. The main one is the fading of the latent image (i.e. silver atoms recombine with electrons to form a silver ion). This effect is believed to be due to water vapour on the emulsion. Vie have found that although the films are stored properly in desiccators and well sealed in special packages, fading over a period of a month between exposure and development does not allow a reliable dose evaluation. For instance, a dose of 100 mRem of neutrons from a 239p u_R e source faded to 15 mRem f.fter a period of a month. Fading is more severe for lower energy neutrons. Other shortcomings of this type of film are its sensitivity to 6 and Y radiations and the fact that scanning of the small size nuclear tracks is quite tedious.
The polycarbonate dosimeters are based on the interaction of fast neutrons with the carbon and oxygen nuclei which compose the polycarbonate molecule. Wher. these nuclei recoil they cause a large amount of ionization around their tracks, thus causing the scission of long polymer chains intc shorter fragments. The damage is an increasing function of the rate of the energy loss of the particle. Tracks in the polycarbonate can be enlarged to be easily visible under a 10X magnifier by electrochemical etching, a technique which was introduced by Tommasino (4) and later use.? successfully by Sohrabi (5). This technique is based on the fact that the shorter fragments of the polymer produced by a large ionization are more easily dissolved by chemical etchants. The damaged sites are also characterized by higher electrical conductivity.
- 14D -
Polycarbonate dosimeters have several advantages over the nuclear track emulsion dosimeters: a) no fading, b) insensitivity to S and Y radiation which makes it possible to work in mixed n+ß and n+Y fields, c) large magnification for counting of pits is not required.
The energy response characteristics of the polycarbonates were investigated by exposing them to different sources of fast neutrons: a) Monoenergetic neutrons in the energy range 1 to 4.5 MeV using the 'H(p >n)'Be reaction. (These experiments were performed in the Tandem Van-de-Graaff laboratory of the Weizmann Institute) b) Monoenergetic neutrons of 14.7 MeV using the d(t,n)^He reaction. This experiment was performed in the Cockcroft-Walton accelerator at Ben-Gurion university) c) Neutrons from Cf and ™Pu-Be sources with intensities of 2xl06n/ sec and 1.3xl07n/ sec respectively. The experimental energy response curve is shown in Fig. 1. It can be seen that below 3 MeV the response of the polycarbonate decreases quite dramatically up to the threshold energy around 1 MeV. Above 3 MeV the response curve levels-off to a value of (9-10) pits/Ccm^-lOO mRem). At an energy of 2 MeV the response is about one third of that above 3 MeV. The response of the polycarbonate to neutrons from 252of and 2 3 9Pu~Be is (4.8+0.4) pits/(cm2-100 mRem) and (9.0+0.5) pits/(cm2-100 mRem) respectively.
The background was also investigated and found to have a mean value of (2.5+0.5) pits/cm^. This is equivalent to a dose of about 50 mRem for neutron spectra similar to that of " 2 c f a a ^ a
dose of 25 mRem for neutron energies above 3 MeV. All values quoted above were obtained under the following
etching conditions: solution temperature: 25°C, etchant: 28% K0K, etching time: 3*s to 4 hours, voltage: 900-1000V, frequency: 1600Hz. Under these conditions the maximum diameter of pits obtained for neutrons from a Pu-Be source is around 0.12mm.
Lower limits for doses which can be recorded on the polycarbonate dosimeters depend on the neutron energy. For spectra such as 252cf the lower limit is 45 mRem, whereas for neutron energies above 3 M&V the lower limit is 25 mRem. Table 1 gives the statistical uncertainties for different doses.
15D -
12 T
| II
10 -1 L
T
9
-
4 ? 8 8. O -7 O ' Cd
IO
S 5 T I
4 "
Jw » 2 5 2 C f
D 2 3 9 P u - B e 3 - /l V 14.7 MeV
2
1
• 7 L i (p,n) 7Be
C 2 4 « 8 10 12 E n(MeV)
14
Fig. 1 Energy response of the polycarbonate dosimeter
Since the conventional HTA films have many drawbacks it is suggested that their use be discontinued by the Israel Badge Service and that they be replaced in the near future by polycarbonate dosimeters. The polycarbonate dosimeter does not have a flat energy response in the overall region *rom 1 to 14 MeV. Therefore doses for workers in each radiation area will be extracted from the neutron spectrum measured in the area and the energy response characteristics found in the present study.
- 16D -
TABLE 1 Statistical uncertainties for
different doses and different energies
Dose (mRem)
uncertainties (%) Dose (mRem) E ^ C f E sMeV n 50 48 30 100 28 19 200 18 13 300 14 10 500 11 8 1000 7 5
References 1) E. Piesch and B
2)
3)
4) 5)
Burgkhardt, IAEA symposium on Neutron Monitoring, Vienna, 1972. K. Becker, Topics in Radiation Dosimetry, Supplement 1, Academic Press, N.Y., 1972, p. 79, and references therein. R.A. Oswald and R.V. Wheeler, Twenty Second Annual Meeting of the Health Physics Society, July 1977. L. Tommas, in CNEN Report, RT/PROT (71) (1970) 1. M. Sohrabi, Health Physics 2T_ (1974) 598.
170 -
A FLAI ENERGY RESPONSE DOSIMETER IN THE EPITHERMAL REGION
Y. Eisen and Y. Shamai Soreq Nuclear Research Centre, Yavne, Israel
The neutron dosimeters which presently exist for the epithermal region do not exhibit a flat energy response. The common dosimeters are of two kinds: a) albedo dosimeters (1), based on the detection of thermal neutrons backscattered from the body. They usually consist of a pair of LlF (TLP-600 and TLD-700) ribbons. Only one of these ribbons (TLD-600) is sensitive to thermal neutrons. b) a dosimeter (2) which consists of very thin layers of B and °Li and a cellulose nitrate film. When intermediate energy neutrons impinge on the 1"B or ^hi, a particles are emitted via the (n.ct) reaction and damage the cellulose nitrate film. Both dosimeters are strongly energy dependent and can only be used either in narrow energy spectra or in areas where the spectrum is well known; for instance where the flux varies inversely with the neutron velocity.
In this study we developed and are presently building a flat energy response dosimeter in the region 0.4 eV to 50 keV. The dosimeter consists of several layers of different thicknesses and areas of l^B and °Li. The layers are mounted on cellulose nitrate film. We have proved theoretically that the sum of a particles originating from the (n,o) reaction across the dosimeter is proportional to the neutron dose regardless of the energy. The energy flatness was achieved by means of a simulation code which operates as follows. A flux of neutrons <J> (n/cm^) impinges on the different layers. This flux is normalized to the flux/dose curve (3). We denote the normalized flux by ij(Rem). The total cross sections for n+^B or n+ 6Li are almost entirely composed of the (n,a) reaction cross section. The a particles emitted have rather low energies in all directions (a maximum of 2.1 MeV and 1.8 MeV for ^ i and
10 B
respectively. Moreover ICatz and Kobetich (4) have theoretically found that the minimum energy of an a particle needed to cause ionization damage is approximately 0.12 MeV. (The cut-off energy is 3n important parameter in our calculations and is currently being investigated.) Therefore, if the layers are thicker than the maximum range of the emitted o particles, not all generated a particles reach the cellulose nitrate film.
- 18D
!„ 1.0
OS-
(b) /" \
^ . ' \ - \ 6 L i / - \ 6 L i /
- \ T - " " B \_/ \ V
\ '' \
A \ — \ \ » \A0 rjiq/cm^
\ (a)
\ 1500 mgAm 2
\ v / ^ ^ » 1 0 K N 360 mg/cm^ — ^
i r ~ j _ Qoa ooi oi io Efl(keV)
(00
Fig. 1
a) Number of a particles generated in each B layer per 10 neutrons as a function of neutron energy (layer thicknesses are indicated}.
b) Total number of a particles for B and Li layers per Rem of neutrons generated over the whole dosimeter as a function of energy (The curves are normalized to an energy of 0.5 eV).
19D -
Thus, the maximum effective thickness of the layer, t m a x , from which a particles can still emerge with sufficient energy depends on the energy of the a particle moving in the forward direction and on the energy loss of the a particle in B or in Li. For each effective thickness t„ there exists a maximum scattering angle, ^aax> beyond which a particles do not have sufficient energy to cause Ionization in the cellulose nitrate. The ranges and energy loss rates were taken from Ref. 5. If the total thickness of the layer is t(mg/cm 2), then the total number of a particles recorded on the cellulose nitrate film will be:
*** tio e-o where S is the area of the layer, M E = O E P (erg is the total cross section at energy E and p is the Avogadro number divided by the mass number of the layer) and doE/dß is the differential (n,o) cross section for an energy E. It is assumed that the differential cross section is isotropic.
We have found that the sum of the a particles can be independent of energy in the range 0.4 eV to SO keV when only three layers of thicknesses 40 mg/cm , 360 mg/cm* and 1500 mg/cm' are used. The first two layers might be either "Li or QB, while the third should be B. We could not achieve a flat energy response with Li alone. The areas of these layers, Sj were found by using an automatic fit program which minimized the sum of a particles emerging from the three layers to a constant value independent of energy.
The effect of the three layers on the number of a particles generated and the response of this dosimeter are given in Fig. 1. One observes that each layer has a different effect on the incoming neutrons, and consequently on the number of outgoing a particles. While at low energies the a particles emerge mainly from the thin layer, at high energies they emerge mainly from the thick layer.
References 1) E. Fiesch and E. Burgkhardt, IAEA Symposium on Neutron
147 (1977) 153. 3) NCRP Report No. 38, January 1972, Table 2, p. 16. 4) R. Katz and E.J. Kobetich, Phys. Rev. 170 (1968) 401. 5) L.C. Northcliffe and R.f. Schilling, Nucl. Data
Tables 7 (1970) 233.
- 20D -
INFLUENCE OF BEAM HEIGHT ON THE BEAM WIDTH PROFILES OF COBALT THERAPY MACHINES*
M. Tatcher, Y. Mandelzwieg and M. Yudelev Northern Israel Oncology Center, Rambam Medical Center
Technion - Faculty of Medicine, Haifa
The size of a radiotherapy beam is usually defined as the distance between the 50% levels of the beam profile at the surface. In a discussion of the accuracy of radiation field data, Weinkam, Kolde and Sterling (1) reported inconsistencies in the relationship between the nominal beam size and the measured size for cobalt sets of several manufacturers. For a constant collimator setting corresponding to beam width W they found that, as the beam height H was changed, the measured widths of the beam profiles varied in a non-systematic way. In the example given (W = 5 cm) differences of up to 2 mm were seen. In the present work the influence of beam height on the beam width profiles of two cobalt machines was investigated. The experimental results are described and compared with calculations.
MEASUREMENTS The machines studied are the Picker C8M/80 and the Siemens Gammatron 3 cobalt therapy units. Beam profiles were measured in air and in a water phantom with a 0.6 cc ionization chamber, and at the build-up depth in a perspex phantom with photographic films (Kodak Type XM-5)•
For both machines, with W set at 5 cm and 10 cm, when H was varied from 5 cm to 2k cm, the measured beam width (determined from the profiles in air and at the build-up depth) remained constant to within the experimental error of 0.5 mm. Fig. 1 shows the profiles for the Picker unit in air and at depth 12 cm for W = 10 cm, H = 5 and 20 cm (source - surface distance = 80 cm). While elongation doesn't alter the beam width at the surface, it produces a small deviation at the outer edge of the profiles which becomes
* Supported in part by the United States-Israel Binational Science Foundation.
more pronounced with increasing depth. Since it occurs outside the mc-in part of the treatment field, this effect can usually be neglected for clinical purposes.
CALCULATIONS The deviations may be explained in terms of the different amounts of radiation scattered from the collimator and phantom as H is varied. The effects of collimator scatter appear in the air profiles and are seen to be slight. The radiation model of Cunningham (2) allows the computation of dose in beams of arbitrary shape, including phantom scatter contributions, and it is ot interest to test it against the measured data for elongated beams. Profiles were generated using an adaptation of Cunningham's computer program CBEAM (3), and the calculated distributions plotted in Fig.1 show that the model represents the experimental dependence on beam height to a good approximation. For depth 12 era, in the worst case (5x2^ cm ) , a maximum error of about \% occurs at the location of the 10' isodose.
CONCLUSIONS For the cobalt units investigated, no changes in beam width were observed as beam height was varied. The small beam height dependent effects found in the penumbra are reproduced by Cunningham's model of rad i a t i on.
REFERENCES 1. J.J. Weinkam, R.A. Kolde and T.O. Sterling.
Brit. J. Radiol., h(>, 983 (1973). 2. H.E. Johns and J.R. Cunningham.
The Physics of Radiology (Thomas, Springfield II., 1969). 3. M. Tatcher, S. Palti and J. Hohl lever.
Trans. Israel Nuc. Soc. 129, (1977).
- 22D -
10(K '
30 -
60 U l v> o o
^ 40 . x 1*1 u CC U l o.
20
-
BEAM PROFILES g IN AIR
^ \ »»-irr. L
i «„ 2JMeiiurt«l O
iCilculitai —
_i i
\
AT DEPTH 12CM
1 0 x 5 c m i c . l c u l . t . A —
1 0 * M e m l c . i . » i . t . i —
c •> = o OISTANCE FROM CENTRA! AXIS \tW)
10
FIG1. REAM PROFILES FOR ELONGATED FIELOS FOR THE PICKER COM/If) MIAl l UNIT
SECTION E
RADIATION RESEARCH AND PADIOBIOLOGY
- IE -
RADIOLYSIS OF CHOLESTETtIC ESTERS IN CC1„ 4
L. Feldman, Z.B. Alfass i and A. Kushelevsky
Department of Nuclear Engineering Ben-Gurion Univers i ty of the Negev Beer-Sheva I s r a e l
Previous s tud ies show t h a t encapsulated cho l e s t e r i c l i qu id c r y s t a l s (CLC) can be used as y-rav dosimeters in the range of 1-80 Mrad. In order t o lower the dose range t o .k r ad , t he e f f ec t of y i r r a d i a t i o n on organic so l u t i o n s of CLC was s tud ied . '
In CC1 so lu t ions the CCI and CI r ad i ca l s formed by the r a d i o l y s i s of the solven abs t r ac t H atoms from the e s t e r forming <3!C1 and HCl.
The following expßrimantal r e s u l t s lead t o tho conclusion t h a t the a t tack occurs mainly on the cho les te ro l skeleton a t the C-7 pos i t ion ( F i g . l ) :
a) The TLC of i r r a d i a t e d c h o l e s t e r i c e s t e r s from cho les t e ry l formate (C ) t o cho les t e ry l decanoate (C. ) shows t h a t the Rf of the main r a d i o l y t i c p ro duct inc reases with the decrease in the number of carbon atoms of the ac id i c r e s idue . These products although not i d e n t i f i e d y e t , were proved not t o be the alkanoyl ch lo r ides , the a lkyi ch lor ides or the chloro de r iva t i ve s of CLC, where the CI i s on the ac id i c r e s idue . Thus i t can be concluded t h a t the product i s a CLC with the CI atom a t the r i n g .
b) G(HC1) and R(aiCl.) were found to be the sane for cho les t e ry l formate as for a l l the others
c) G<CHC1 ) for O.KI so lu t ion of cholestanyl nonanoate in CC1 (choles-tanol i s a sa tu ra t ed c h o l e s t e r a l and lacks the 5-6 double bond) i s 2.6 times smaller than t h a t of cho les t e ry l nonanoate in the same concent ra t ion . The fact t h a t varying the a c i d i c s ide-chain of the e a t e r s does not change G{CHC1 ) while the s a tu ra t i on of the cholestero.'. causes such a d r a s t i c decrease in G(CHCl-) leads t o the conclusion t h a t most of CHC1 i s produced by abs t r ac t ing an !I atom from the r ing a t the C-7 p o s i t i o n . The double band in pos i t ion 5-6 ir. the cho le s t e ro l skeleton causes the H atom on carbon 7 t o be a l l y l i c hydroqens which are more weakly b o u n d 4 ' .
We s tudied the competition r e a c t i o n s : CC13 + CLC ~±* CO. 11 + products
cci., + cc i ,—• c,ci^ J 3 2 6
2 7 and found t h a t k = 1.26 x 10 1/mols x sec using k = 5 ± 2.5 x 10
(reference 6 ) . The activation energy war found to be 4 Kcal.
- 2E -
Re f e r e n c e s
1 . A.P. Kushe levsky , h. Feldman and Z .B . A l f a s s i , M o l . C r y s t . L i q u i d C r y s t . , 35 , 353 ( 1 9 7 6 ) .
2 . Z .B. A l f a s s i , L. Feldman and A. Kushe levsky , Radiat ion E f f e c t s 3 2 , 67 ( 1 9 7 7 ) .
3 . Z.B. A l f a s s i , A.P. Kushelevsky and h. Feldman, Mol .Crys t . 3^ , 33 ( 1 9 7 7 ) .
4 . Z .B. A l f a s s i , D.M. Golden and S.W. Benson, I n t . J . Chem. K i n e t i c s , 5_, 157 ( 1 9 7 3 ) .
5 . D.G. Hendry, T. M i l l , L. P i s a k i e w i e z , J . A . Howard and U.K. Eigenman, J . Phys . Chem., 9 3 7 , 2 > 1 9 7 4 ,
3E -
o =
o I
o I
4E -
THE DISTINCTION BETWEEN THE ROLES OF 0 2 AND OF Q"z IN BIOLOGICAL RADIODAMAGE
* ra * Amram Samuni, Mordechai Chevion , Yeheskel S. Hal pern , Yael A.
# # lian and Gidon C2apskiI , From the Departments of Molecular
* a a Biology , Cellular Biochemistry and Physical Chemistry , Hebrew University, Jerusalem.
The enhancement of the biological radiodamage under oxic conditions was attributed also,_in part, to the action of superoxide radicals generated from e~ and H radicals by oxygen. The confirmation (or exclusion) of q such an hypothesis, was made difficult by the inevitable formation of OZ radicals in the presence of oxygen. Moreover, the mode of oxygen action was further obscured as the relative contributions of the various radiation effects were not known. Pirect and indirect as well as endogenous and exogenous effects are generally contributing, to various extents, to the resulting biological radiodamage. Therefore it seemed necessary to quantitate first the relative contributions of these effects for each test-organism studied. Then, it was important to plan an experimental system in which the different roles of oxygen and of superoxide radicals would be distinguishable.
In the present study the effect of y-radiation on the survival of T4 bacteriophage and of E. coli B has been investigated. The irradiations of the test-organisms were carried out in phosphate buffer suspensions. The spectrum of the water-radicals was controlled by a careful choice of the appropriate saturating gas and the addition of suitable radical scavengers. All the survival curves exhibited a pronounced shoulder and the inactivation rate constants were evaluated from the linear portions of the dose-response curves.
In the first stage we have examined the effect of high molecular weight radical scavengers on the radiosensitivities of the organisms studied. In the presence of an excess of polyethylene glycol, most of the radicals formed outside the organism are scavenged. Thus the indirect exogenous radiodamage is blocked. In the case of the T4 bacteriopTiäge, the radiosensitivity has been reduced roughly by tenfold. This indicated that the majority of the dttectable damage in T4 is due to radicals formed outside the virus On the other hand, with E. coli B the introduction of the radical scavenger has hardly affected the radiosensitivity. This clearly showed that in the E. coli most of the damage originates endqgenously.
In order to estimate the direct and indirect radiation effects we have compared the radiosensrtTVities in suspensions saturated with either helium or nitrous oxide. In case where the N«0 scavenges most of the hydrated electrons converting them into OH radicals,
- 5E -
the N-O - induced enhancement of the radiosensitivity would reflect the relative extent of the indirect effect (if the contribution of the hydrated electrons to the damage is small compared with that p* the OH radicals). Our observations have shown that with E. coli „J well as with T4 the presence of the nitrous oxide roughly doubled the radiosensitivity. This result is in accord with our conclusion that the hydrated electrons hardly contribute to the radiodamage, and that the effect is predominantly indirect.
In order to ellucidate the roles of oxygen and superoxide radical in radiodamage it was attempted to prevent the oxygen from reacting with the hydrated electrons. This allowed us to study the oxygen effect in the absence of superoxide radicals. For this purpose a mixture 9:1 of N,,0 + Op was used. Under these experimental conditions the high excess '" of N-0 successfully competes with the oxygen on the hydrated electrons, converting them into OH radicals. Consequently, the effect of molecular oxygen solely could be studied.
Suspensions of T4 and of E. coll have been irradiated under five different sets of experimental conditions. The suspensions were saturated with the following gases: He ; 0- ; 0„ (+ 0.01M formate); N ?0 ; NpO + Op 9:1 mixture. The results are shown in Table I.
Table I: Radiosensitivity towards ionizing radiation of T4 bacteriO' phage and E. coli B: Effects of 0 o , N 70 , and N ?0 + 0 ? .
Experimental conditions G(water radicals) Inact ivat i on rate .. (Gray - 1 ) H OH e" o ; constants
on rate .. (Gray - 1 )
aq 2 T4 E. col i B He saturated .7 2.8 2.8 - .17 .049 Op .. 0 , „ (0.01M formate) N£O „ NgO + 0 2 saturated
These results show that with oxygen and formats, where the superoxide radicals predominate, the radiosensitivity has been considerably reduced, i.e. superoxide radicals play no role in the radiation-induced damage. This conclusion agrees with the fact that the maximal radiosensitivity was observed for the systems saturated NpO + Op, i.e. in the presence of oxygen and in the absence of 00. In this case, the enhancement effect of oxygen on radiosensitivity was evident in addition to the effect of the N,0.
In conclusion, NpO enhances the biological radiosensitivity by increasing the number of OH radicals which attack the biomolecule. The oxygen subsequently reacts with the targey biomolecules, rendering the damage irrepairable.
- 6E -
QUATERNARY STRUCTURE OF METHEMOGLOBIN III. PULSE RADIOLYSIS STUDY OF HUMAN ADULT AND FETAL HEMOGLOBINS.
Yael A. Ilan*, Mordechai Chevion**, Amram Samuni***, Tikva Navok** and Gidon Czapski*, Departments of Physical Chemistry*, Cellular Biochemistry** and Molecular Biology***, The Hebrew University of Jerusalem, Jerusalem, Israel
Using the pulse radiolysis technique on solutions of methemoglobin, the heme-iron within a single subunit in the tetramer, (MHb)., was reduced to iron (II)
eqn. 1 (MHb) + e~ •*• (MHb),Hb 4 aq J
The valence hybrid, (MHb),Hb, thus formed was reacted with oxygen
eqn. 2 (MHbKHb + 0 •* (MHb) Hb0 2
The effect of organic phosphate and [H ] on the kinetics of the oxygenation process were used to determine the changes in the quaternary structure of the protein.
The quaternary structure is associated with either a high affinity (denoted P state) or a low affinity (T state). Organic phosphate like IUP (inositol hexaphosphate) that act as allosteric modifier, lower the affinity of the tetramer towards oxygen.
Methemoglobin does not bind gaseous ligands, thus it is impossible to obtain a direct evidence for its "affinity state". By pulse irradiating the methemoglobin solutions we produced singly reduced tetramer (eqn. 1) that bind oxygen (eqn. 2).
Solutions of raethemoglobin A and F were pulse irradiated in the presence of oxygen. Two distinguishable processes were observed: The first represents the reduction of the methemoglobin by eaq (e3n* 1)r while the second shows the binding of oxygen to the valence-hybrid (eqn. 2).
The second process, the oxygenation reaction was recorded at various pH values, in the presence and the absence of IHP.
In the pH range 7-8.9, in the absence of IHP, only one phase, of first order kinetics, is observed for hemoglobin A. The evalu-a< öd rate constants (k) gradually increase with pH (table I. In the presence of IHP, at the pH range 7-8, the kinetic curves of the oxygenation reaction exhibited two first order decay processes. Computer best-fit yielded the parameters k , k s, AAg and £A^ for each reaction. At each pH the calculated k* was identical to the respecti-v-e rate constant (k) determined in the absence of IHP (table I).
The relative contribution of the fast reacting species, 9 was evaluated using the foMowing expression:
AA f
eqn. 3 f _ o_
- 7E -
where AA is the change in absorbance in the absence of IHP. TABLE I
Values of M (435 nm) and k resulting from the oxygenation reactions of the fast reacting and slow reacting valence-hybrids.
These data suggest that the change in the rate constants represents a change in the affinity state of the valence-hybrid. This change is associated with a quaternary structure of the "parent" methemoglobin. Furthermore, we assume that the sigmoi-dal curve (fig. 1) represents a transition between the two states of the methemoglobin. This transition in quaternary structure (R t T ) , is characterized by a pK of 7.5 and 7.2 for methemoglobin A and methemoglobin F, respectively.
1.0 o H 0.8 < tr ^ 0.6 UJ > b 0.4 < _J UJ a: 0.2
o.oh
Fig.l: pK dependence of 8
hemoglobin F
pH
- 8E -
THE EFFECT OF SELECTED MODEL COMPOUNDS ON THE OXIC RADIATION RESPONSE OF Bacillus pumilus SPORES
G.P.Jacobs
Department of Pharmacy, School of Pharmacy, Hebrew University of Jerusalem, P.O.B. 12065, Jerusalem, Israel.
The effect of certain model compounds comprising alcohols and paraffins on the radiation sensitivity of Bacillus pumilus spores has been carried out with the aim of understanding the radiation-induced inactivation of microorganisms when suspended in non-aqueous milieux. The compounds have been selected because of their different physical and chemical properties and their resemblance to non-aqueous components of ointment and cream bases. This study is a prerequisite to the undertaking of radiation sterilization of such pharmaceutical preparations. Changes brought about in radiation response will be useful in determining suitable radiation doses for sterilization of oleaginous and emulsion-type ointments and creams.
The test organism used is now recognized as one of the principal biological standards for the certification of radiation sterilization facilities and is recommended as the microorganism of choice to be used in routine monitoring of the efficacy of production radiation sterilization processes. Its hardy nature makes it particularly useful for this study. The compounds selected for study were n-heptane, n-dodecane, n-hexadecane, iso-octane, cyclo-hexane, n-hexanol, octan-2-ol, n-decanol, iso-amyl alcohol and 2-phenylethanol.
Spores of Bacillus pumilus E601 (ATCC 27142)mounted on kaolin powder (1) were suspended in the appropriate organic agent and gamma-irradiated under oxic conditions. Slopes of dose - In survival curves (inactivation constants), obtained following a suitable dilution and plating technique (l),were used as the criteria for quantitatively estimating radiation response.
Spores suspended in paraffins (100%) displayed in all cases increased radiation response over that for aerated aqueous buffered suspensions. Values of k_, the inactivation constant, ranged between 5x and 2x that aqueous buffer. Less pronounced modification of radiation response was obtained for the alcohols. With n-hexanol there was a 70% increase in the value of k_ over that seen for buffer, with 2-phenylethanol a 25% increase was obtained, whilst with iso-amyl alcohol no modification of the aerated buffer response
- 9E -
w&s obtained.
Inspection of the above results reveals a marked tendency for response to increase with decreasing polarity of the suspending fluid.
The partial miscibility of the alcohols in water afforded the opportunity of examining the transition from the response characteristic of aerated aqueous buffered suspensions to those of the spores in pure organic liquids. Spores were suspended in aqueous buffered solutions of the alcohols over the concentration range 10"^ M to approximately 10M, corresponding to 100% pure alcohol. In the case of 2-phenylethanol, increasing concentrations up to 10 _ 1M produced little change in response which was a little below that characteristic of aerated buffer. Further increases in concentration resulted in a rise in the value of It, with a maximum being attained at 8,1M (equivalent to 100% 2-phenylethanol). With n-hexanol the radiation response was constant, and similar to that for buffer, up to a 1M concentration. Beyond this concentration and up to 9.8M (pure n-hexanol), there was a gradual rise in the value of k. Iso-amyl alcohol displayed little deviation from buffer particularly at the extreme concentrations (that is 10"^M and 11.3M), however there was a trend for a decrease in response around the IM concentration.
The phenylethanel and hexanol results may be indicative of dehydration of the spore at high agent concentration.
This work has been supported by a grant from the Joint Research Fund of the Hebrew University and Hadassah.
REFERENCE CI) TALLENTIRE.A and JACOBS,G.P., (1972) Int.J.Radiat.Biol.,
21, 205.
- lOE -
THE EFFECT OF DEUTERIUM OXIDE ON THE RADIATION RESPONSE OF CHINESE HAMSTER CELLS.
E. BEN - HUR and E. Rlhl.IS
Dept0 of Radiobiology, Nuclear Research Center - Negev, Beer - Sheva
Since the discovery of deuterium in 1932 a large number of papers have appeared on the biological effects of deuterium compounds• (for a review see 1 ). In spite ot this, only a limited number of studies concerning theeffect of heavy water (D2O) on radiation sensitivity were reported (2). The evidence available is inconclusive and,.furthermore, pertains only to bacteria and whole animals. Since we were studying factors affecting the radiation response of cultured mammalian cells for some time (3,4) we decided to s*udy the effect of D2O on radiosensitivity in this system.
Figure 1 shows the survival curves of Chinese hamster cells exposed to D2O for various tiroes following gamma-irradiation. Apparently there is a time dependent increase in radiation response as a function of post-irradiation incubation in medium containing 90$ D2O. Pre - irradiation exposure to I12" f ° r UP t o 2 hr had only a slight effect. The dependence of D2O effect on its concentration in the medium is shown in Fig. 2. The effect is clearly increased as the D2O percentage in the medium is raised. However between 20$ and 40$ there is almost no change in sensitivity. Above 40$ the effect increases sharply.
The radiation damage that interacts synergistically with D2" l s
repaired by the cells in about 3 hr at 37° C in complete growth medium. The rate of repair is slower at 20°C in buffer and there is no repair at 4°C . This suggestsan enzymatically mediated process. We propose that incubation of mammalian cells in D2O following ionizing radiation interferes with their capacity to repair radiation damage. The repair-deficient cells from patients afficted with hereditary diseases like xeroderma pigmentosum and ataxia telangiectasia should be useful in testing this hypothesis.
fergamon Press , New York , 1963 3. Ben - Hur, E. , Elkind, M„M. and Bronk, B.V. , Thermally
enhanced radio-response of cultured Chinese hamster cells : inhibition of repair of sublethal damage and enhancement of lethal damage . Radi at. Res. , j>8 (1974) 38-51.
4. Ben - Hur, E. , Kol R. and Riklis, E. , Modification of radiation response by hyperthermia and its relation to DNA damage and repair . Radiobiological Research and Radiotherapy , Vol. 1, pp. 299-311 , IAEA , Vienna. , 1977.
- 12E -
0 200 400 (00 100 1000 1200 DOSE frodi)
F . y u r e 1* S u r v i v a l n f C h i n e s e h u m s t e r cclis gnir.wn~ivr/.(lii,i c-»d and then i icubated with 9ü f" DjO for various times, as indicated.
SURVIVING FRACTION
- 14E -
THE GAMMA IRRADIATION OF CEPHALOSPORINS G.P.Jacobs
Department of Pharmacy, School of Pharmacy, Hebrew University of Jerusalem, P.O.B. 12065, Jerusalem, Israel.
Increasing application of ionizing radiation to the sterilization of pharmaceuticals has prompted this study into the effect of gamma irradiation on a number of the cephalosporins. The rationale for the choice of this particular group of pharmaceuticals is based on their known susceptibility to hydrolysis , thus eliminating sterilization of injectables by conventional methods such as autoclaving. The necessary practice of sterilizing powders for injections by techniques involving costly and highly demandinf aseptic processes, makes sterilization by gamma irradiation most desirable. Because of the destructive nature of ionizing radiation and the difficulty in predicting its radiolytic effect, it is necessary to analyse each compound individually for molecular damage in order to detemnine the feasibility of its radiation sterilization. The present investigation is aimed at studying the effect of different doses of gamma radiation on four of the cephalosporins selected for their differing chemical structures and microbiological activities.
The cephalosporins tested were cephalexin, cephaloridine, cephalothin sodium and cephapirin. 5g samples of these drugs were irradiated CI) in open vessels with 1, 2.5 and 5 Mrad doses from a 13'Cs gamma-ray source. Following irradiation the samples were subjected to pertinent chemical and microbiological tests.
Results of melting point determinations, microbiological (2) and chemical (3) assays, UV absorbance af aqueous solutions and specific opt:cal rotation measurements (SOR) are presented in Table 1. NMR spec ral determinations (4) show no differences between irradiated ( Mrads) and unirradiated cephalexin. In the case of the other three antibiotics examined, there does appear to be sone change in intensity of the peaks assigned to the two p-lactam protons. No products of radiolysis have been detected by TLC examination (5).
Cephalexin seems to display reduced potency with increasing radiation dose as indicated by the microbiological assay results. None of the other tests however seem to support this observation, possibly suggesting that the reduced potency ( about 7% following a 5 Mrad dose ) is simply as a result of biological variation.
Cephaloridine is apparently unaffected by radiation doses of up to 5 Mrads.
- 15F. -
Table 1
Cephalosporin Dose MPt Microbi Chemical * UV SOR (°) (Mrads) C°C) ological assay SOR (°)
The tests employed in this study ( other than TLC ) indicate that gamma-irradiation reduces the potency of cephalothin sodium. However, any products of radiolysis are in too small a concentration to be.detected by TLC examination.
Like cephalexin, cephapirin is also affected to some extent by radiation. Its potency is reduced by a 5 Mrad dose, as indicated by the chemical assay results, by about 4%. Radiolysis products were not detected by TLC examination.
It is noteworthy that both cephalothin sodium and cephapirin possess the same substituent in the C-3 position of the dihydroth-iazine ring, namely, an acetoxymethyl group, which may be radiation labile.
- 16E -
In conclusion, the results of our tests indicate that cephal-oridine and cephalexin may be irradiated at the commonly employed sterilization dose of 2.S Mrads and that doses of up to 5 Mrads do not adversely affect these two anti biotics. The other two cephalosporins examined, cephalothin sodium and cephapirin, display reduced potency even following a 2.5 Mrad dose. However, a 1 Mrad dose may possibly be employed for cephalosporin samples with very low initial contamination, a situation not uncommon for other antibiotics (2,6).
The author acknowledges the technical assistance of Mrs. Paula Fisher. The cephalosporins were kindly donated by Glaxo Laboratories, England and Bristol Laboratories, U.S.A.
REFERENCES (1) JACOBS,G.P. and MELUMAD.D., (1976) Pharm.Acta Helv.,51,313. (2) JACOBS,G.P., (1977) Pharm. Acta Helv.,52,302. (3) BRITISH PHARMACOPOEIA 1973, p.88. H.M.S.O..London. (4) WILSON,W.L.,AVDOVICH,H.W. and HUGHES,D.W., (1974) J.Associat
ion Official Analytical Chemists,57,1300. (5) JACOBS,G.P., submitted for publication.
- 17E
THE EFFECT OF GROWTH KATE ON THE SENSITIVITI OF Escherichia coli K12 TO DNA CROSSLIMSS INDUCED EI PSORALEN P1.US NEAR IT.TBAV10I.ET LIGHT
A. Zaritsky, Department of Biology, Ben - Gurion University of the Negev, P.O. Box 653, Beer-Sheva, Israel
E. Ben-Hur, Israel Atomic Energy Conroissitn, Nuclear Research Center-Negev, Beer-Sheva, Israel
M. T. Hansen, Accelerator Department, Risf* National Laboratory, Dh-4000 Roskilde, Denmark
The currently accepted model (l) ."or repair of DNA interstrand crosslinks in bacteria involves genetic recombination in the cells damaged. Some implications of the hypothesis wert tested for crosslinks produced by 4,5, '8-trimethylpKorftlFn (TM-) and near ultraviol.-t light (NUV) in Escherichia coli i\12-Materials and Methods
Escherichia cell M 2 (CP.34), thy, drm , thr , leu (2)was cultivated in A+B buffered salts solution(3) supplemented by either alanine and proline (0.04$ each) or glucose (0„4?°) and casein hydrolysate (l^),and with threonine (50 ug/ml), leucine (50 ug/ml), thymine (20 ug/ml) and deoxyguanosine (GdR, 100 ug/ml), The cultures were vigonusly aerated and diluted periodically to maintain balanced growth at 37°C. The relative mass increase was measured by light scattering at 450nm and viable bacteria werf titered by plating on minimal agar plates.
Cells (10ml) were incubated with TMP (lO~5f) for 5 min, tb*n cooled quickly in the presence of 20 mM scdium-azide, washed twice by centri-fugation and suspended in 5 ml buffer containing lO'-'M TMP. Cell suspensions were irradiated in 50 mm diameter plastic Petri dishes using two black-lite lamps with an incident flux of 20 J/n>2 (No. 50058, UV Products; (4) ).
Crosslinks between ci i.iijximentary strand of DNA were assayed using Si nuclease(4). Total covalent binding of TMP to DNA was measured using 3H-labeled TMP (5). Results and Discussion
E. coli cells growing slowly (doubling time "X— 120 min) art 1.8 fold more sensiiive tc tt TMP and NUV than fast growing cells ( t = 32 min; Fig. 1). The latter contain more DNA with more replication forks (3), while the photoreaction rates are unaffected b;- grnvtl. rtte (FJg.2). The sensitivities observed are therefore qualitatively consistent with the idea that a cell can survive crosslinks in DNA-stretuhes thet are found in nultiple copies ,
18E -
The experimental difference in sensitivity between cells growing in the two conditions is staaller than expected on the basis of the simple hypothesis that cells can only survive crosslinks produced i: repeated stretches of DNA. The data suggest that crosslinks can be repaired by a mechanism that does not require recombination. The efficiency of this repair system seems very limited, though , since the munber of crosslinks per lethal hit is small.
Comparison between survival levels and number of crosslinks supports the view that monoadducts are verv efficiently rf-paired and do not significantly rnduce colony-forming ability at the range of energies employed; reirradiation by NUV after removing unbound TMP affects survival and crosslinks production similary (Pigs.- 1 and 2).
References 1. Cole, R.S, , Proc. Nat. Acad. Sei. 70, 1064 (1973). 2. Lane, H.E.D. and D.T. Denherdt, J. Bacteriol. 20 , 805(1974). 3. Ilelmstetter, C.E. and S. Cooper, J. Mol. Biol. _31_ , 507 (1968). 4. Ben-Hur, E., A. Prager and E. Riklis , PhotJchem. Photobiol. ,
submitted. 5. Ben-Hur, E. and E. Riklis, Photochem. Photobiol. _27 , J. " ( 1978).
- 19E -
Figure 1. Survival of E.coli Ki2 after growth in minimal medium {•) or i;i enriched medium (o) , ^ , , slow growi-jg ce i l s i r radia ted for four rain with Trø', washed frun frcn unbound TMP and re i r rmünted .
- 20E -
NEAR LIGHT
F i g u r e 2 . DNA c r o s s l i n k i n g by TMl' as a func t ion nf exposure t ime t o NUV. S lny-grov i i 'g n e l l s . ( o ) ; f a s t - g r o w i n g c e l l s ( • ) ; s low-growing c e l l s exposed 4 min w i th TMP, washed f r e e from unbound TMP and r e i r r a d i a t e d (A ) •
- 2 IE -
RADIOSENSITIVITY OF TISSUES FROM CARROT ROOT IN CULTURE. A CORRELATION WITH ENDOGENOUS GROWTH SUBSTANCES.
N. Deganl and D. Pickholtz
Laboratory of Radiobiology, Nuclear Research Center, Negev,
Beer Slieva, P.O.B. 9001.
A comparative study was done on the radiosensitivity of phloem and cambium paiencliyma extracted from a carrot root. The explants were gamma irradiated from a 6^Co S Ource at different doses, either when freshly excised from the carrot root, or after 9 days of growth in culture. Direct cytophotometric measurements on the amount of DNA per nucleus showed that the freshly excised cells were in the Gl phase of the cell cycle whereas those after 9 days of growth in culture were mixed population with about 50S in the G2 phase. Growth on the Murashige and Skoog medium was terminated after 45 day.'; .md was expressed as fresh weight per explant.
The results show that the cambium is more radioresistant than the phloem and that both tissues when irradiated at the "G2 phase" of the cell cycle on the 9th day in culture, are more radioresistant than on the first day in culture at the Gl phase. It has been shown (1) that a gradient of growth substances exists from the cambium to the phloem in a carrot root. In addition to radiation effects on DNA, radiation inactivates growth substances. At a given radiation dose higher endogenous concentration of growth substances will he left to support growth in the cambium as compared to the phloem. Furthermore, if the concentrations of the growth substances in a tissue is superoptimal for growth, radiation may lower the concentration of the growth substances to optimal range and thus enhance growth, (Fig. 1. 0.5 Krad, cam. A ) . Partial inacti-vation of growth substances, especially auxin which increases nucleic acids content in plant cells and controls apical dominance, may well he the basis for growth stimulation by radiation (2). The greater radiosensitivity of the Gl phase of the cell cycle (Fig. 1 c.f. A to B) means that radiation affects the transition from Gl to S to greater extent than the transition from G2 to M. This is consistent witii the work of Evans and Van't Hof (3) who showed that the G1-»S transition is more radiosensitive than the G2-*M transition, in tissues of plants which have about 80% of their cells in the Gl phase upon arrest.
References: 1. Lancaster, D.M., and Rowan, K.S., In mechanisms of regulation
of plant growth. Eds., R.L. Bieleskl, A.R. Ferguson and M.M. i Cresswell. Bulletin 12, The Royal Society of New Zealand,
- 22E -
Wellington, pp. 559-564 (1974). 2. Kahan, R.S., Bad. Bot. 14, 257-262 (1974). 3. Evans, L.S., and Van't Hof, J. Rad. Res. 64, 331-343 (1975).
I -
< _ ] CL X LU CC ÜJ CL
tbIOO _ J o or -z. o ° 50 o I -
The effect of radiation dose and time, on the growth of carrot root camb.'.um (CAM) and phloem (phi explants in culture. R _ i r r a d i a t i o n o n the first day in culture
B - Irradiation on the 9th day in culture
LU O
ÜJ 0
O.krad 0.5 krad 2.5 krad 5.0 krad
CAM PHL CAM PHL CAM PHL CAM PHL
A
B B A B
A B
A B
A
B
A
AUTHOR INDEX
Abboud, 5 . 5C Adam, G. 3C A l f a s s i , Z . B . 23B, 19C, IE A v r a c h , W.W. IOC A z i z i , E . IOC A s s i s , T. flu
B a r - I l a n , A. I I B B a r t a l , Y. 8A B a r s k i , M. 22C Ben-Haim, Y. 15B, 18B Ben-Hur , E . 10E, 17E
C a n e r , M. 14 \ C a r a s , I . 6B C h e v i o n , 11. 4F., 6E C r i s t a l , i l . 15C C z a p s k i , G. 4E, 6E
Dav id , : i . 5C Dayan, A. 42A D e g a n i , H. 21E
Edelman, Z . 42A E i n a v , A. 48A E i s e n , Y. 5D, GD, 13D,17D E l i a s , E . 42A, 59A
Fe ldman, L. IE Feuerman , E . J . 5C F i shman , A. IB , 20B F r a i e r , I . 9D, 11D
Gabay, Y. 6B Gavron , A. 13D German, ' J . 2D G e t z , G. 15C G i t t e r , L. 22A G o l d s t e i n , .'!. 70 A, , 73A G r e e n s p a n , E. 32A, , 70A, 73A Gur , Y. 12A Gutman, A. 4B
Haccoun, A. 26B H a d a r i , Z. 76A I l a l p e r n , Y . S . 4E Hansen, M.T. 17E H o r o w i t z , Y . S . 9D, 11D
l i a n , Y.A. 4E, 6E
J a c o b s , G.P . 3E, 14E
K a i z e m a n , R. 42A K a r p i n o w i t z , Z. 13D K a l e f - E z r a , J . 9D, 11D *'.eren, M. IA, 6B K ö n i g s b e r g , A. 48A, 53A, 59A K i n r o t , A. 70 A K n o l l , A. 9B , I I B i'.ushe l e v s k y , A. 26B, IOC, IE
Lemanska, 11. 19A, 22A
• l a l h i , S. 6D l i r .nde lzwieg , Y. 20D M i n t z , K.H. 76A
Navok, T. I l o t e a , A.
P a s i , M. P e s a c h o v i c h , A . P i c k h o l t z , D.
R i k l i s , E . Ronen, M. Ronen, Y. R o t h e n s t e i n , W.
S a p i e r , n . S c h l e s i n g e r , T . S h a t z , M. S h v a r t z , D. Shamai , Y. S h a n i , G. S z a b o , J . Samuni , \ . S i l b e r m a n , C. S e g a l , Y. S e g a l 2 . S h a n i , J . S u r k e s , H.
6E I B , 4B, 9B , I I B , 1 8 3 , 20B
6B 13C, 17C 2 IE
10E 15C, 17C 40 A 1A, 5A
25A 1C, 5C, I D , 5D
19 A 64A, 67*1, 70A, 76A
I C , 17D 26B 5A 4E, 6E 15C, 17C
1 3 , 4B, 9B, I I B , 20B 6D 7C ID
Talmor, A. 2D Talpaz, M. 12C Tatcher, M. 20D
'.lacholåox, E. 42E Waingarten, R. IC, 5C
Wajnberg, S. 20B '.\ainreich, R. 2 3D Wolf, VI. 7C
Yiftah, S. 8A, 12A
Yerushalmi, A. 12C Yudelev, H. 200
Zaltzman, S. 22C Zaritsky, A. 17E Zilberman, A. 15C