Figure 3.15 Thermal decomposition of amylose and amylopectin from potato in N2 atmosphere.
Reprinted with permission from ref. 20. Copyright 2008 Elsevier. .............................................. 74
Figure 3.16 TGA of the soft flour S (green line) and its derivative (blue line). A: Starting point of
the predominantly starch decomposition; B: ending point of the “starch effect”. Moisture content
is defined as the mass loss before 200˚C. Ash content is the mass of the residue at the end of the
full run. .......................................................................................................................................... 77
To obtain a valid reference point, the flours were analyzed for moisture and protein. Due to
the fact that lipid and dietary fiber amounts are relatively small in wheat flours, the starch content
can be estimated from known protein content for a flour at 14% moisture base. This approximation
reduces the composition analysis to only two parameters, protein and moisture contents.
Table 3.1 Experimentally determined moisture (actual) and protein (corrected for 14% moisture
base) contents for the studied flours.
Moisture, % SD Protein, % SD
H1 13.08 0.07 13.25 0.02
H2 13.43 0.07 12.61 0.01
H3 13.61 0.01 11.06 0.01
H4 11.21 0.02 10.56 0.01
S 11.99 0.04 8.71 0.02
S_ind 10.91 0.22 7.63 0.01
H_ind 10.71 0.17 12.56 0.02
Wheat A 14.38 0.14 11.12 0.07
Wheat B 12.06 0.11 12.11 0.04
Wheat C 11.84 0.11 7.77 0.05
Corn 12.72 0.34 4.98 0.02
Quinoa 9.56 0.09 11.97 0.10
Brown Rice 10.61 0.08 7.90 0.16
White Rice 11.07 0.14 6.93 0.05
Arrowroot 11.73 0.23 0.22 0.04
The experimental data are presented in Table 3.1. The analyses were done with three
replicates, or with two replicates in some cases for protein analysis (for full data see Table 5.6).
The flours moisture was in the range of 9.56 – 14.38%. Moisture content strongly depends
45
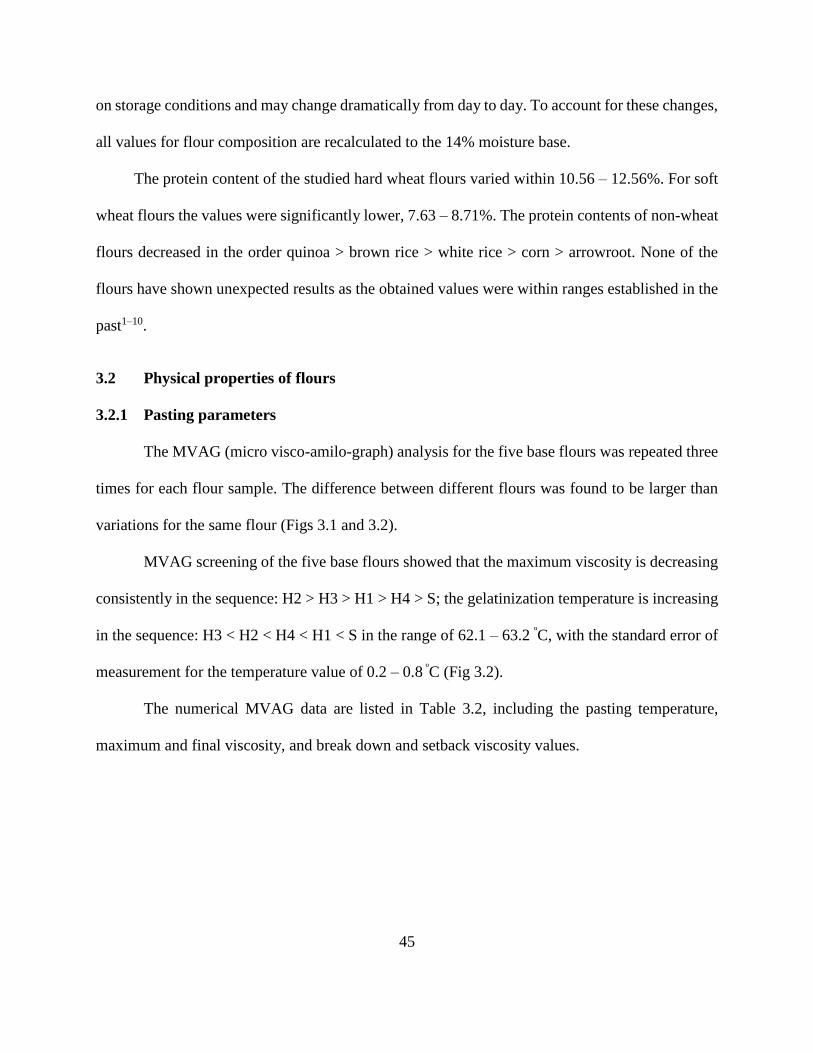
on storage conditions and may change dramatically from day to day. To account for these changes,
all values for flour composition are recalculated to the 14% moisture base.
The protein content of the studied hard wheat flours varied within 10.56 – 12.56%. For soft
wheat flours the values were significantly lower, 7.63 – 8.71%. The protein contents of non-wheat
flours decreased in the order quinoa > brown rice > white rice > corn > arrowroot. None of the
flours have shown unexpected results as the obtained values were within ranges established in the
past1–10.
3.2 Physical properties of flours
3.2.1 Pasting parameters
The MVAG (micro visco-amilo-graph) analysis for the five base flours was repeated three
times for each flour sample. The difference between different flours was found to be larger than
variations for the same flour (Figs 3.1 and 3.2).
MVAG screening of the five base flours showed that the maximum viscosity is decreasing
consistently in the sequence: H2 > H3 > H1 > H4 > S; the gelatinization temperature is increasing
in the sequence: H3 < H2 < H4 < H1 < S in the range of 62.1 – 63.2 ºC, with the standard error of
measurement for the temperature value of 0.2 – 0.8 ºC (Fig 3.2).
The numerical MVAG data are listed in Table 3.2, including the pasting temperature,
maximum and final viscosity, and break down and setback viscosity values.
46
Figure 3.1 Graphical representation of MVAG results for Soft (S) flour with three replicates. A: Beginning of gelatinization; B
gelatinization maximum; C: viscosity at the end of the heating phase; D: viscosity at the beginning of the cooling phase; E: viscosity
at the end of the cooling phase. The solid circles are “anchor points” measured for the most critical viscosity values that define the
pasting properties of a flour. The curves represent viscosity change and are based on the data obtained for the “anchor points”.
Soft 1
A
B
C
ESoft 2
D
Soft 3
Temperature Profile
0
20
40
60
80
100
120
0
50
100
150
200
250
300
350
400
0 5 10 15 20 25 30
Tem
per
ature
, o C
Vis
cosi
ty, B
U
Time, min
Soft 1
Soft 2
Soft 3
Temp 1
Temp 2
Temp 3
47
Figure 3.2 Graphical representation of MVAG results for the five base flours. An average curve of three replicated runs is shown for
each flour. The curves represent viscosity change and are based on the data obtained for the “anchor points” shown on the graph as
solid circles (see Fig 3.1).
H1
H3
H4
H2
Soft
0
100
200
300
400
500
600
700
800
0 5 10 15 20 25 30
Vis
cosi
ty, B
U
Time, min
CWRS_H1 HWR_H3 MHRW_H4_National USHRS_H2_NS SRW_S
48
Table 3.2 Selected data from the MVAG analysis for the five base flours.
Pasting
temperature
(SEM)i
Maximum
viscosity Breakdown
Final
viscosity Setback
H1 Time, min 5.23 10.18 26.33
Visc., BUj 11 354 132 555 333
μk 0 14 13 39 35
Temp., ºC 63.1 (0.2) 91.0 46.5
H2 Time, min 5.23 10.03 26.33
Visc., BU 12 447 136 740 430
μ 1 15 6 14 3
Temp., ºC 62.7 (0.5) 91.5 46.2
H3
Time, min 5.30 10.17 26.33
Visc., BU 11 425 131 727 433
μ 1 32 18 33 16
Temp., ºC 62.1 (0.8) 91.6 46.0
H4 Time, min 5.24 10.24 26.33
Visc., BU 11 303 100 532 329
μ 1 30 31 36 21
Temp., ºC 62.9 (0.7) 91.7 46.4
S Time, min 5.57 9.80 26.33
Visc., BU 11 257 123 36 231
μ 0 5 2 8 4
Temp., ºC 63.2 (0.1) 88.1
i SEM is the standard error of the mean. j BU is the Brabender unit. k μ is the confidence interval at 95% probability level.
49
3.2.2 Gelatinization parameters
The Differential Scanning Calorimetry (DSC) studies showed that among hard base flours,
spring flours gelatinize in a shorter range with a slightly higher onset temperature than winter
flours (Fig 3.3). Soft base flour also gelatinizes in a short temperature range with a high onset
temperature. This result could be related to a smaller starch granule size of the spring flours and
soft flour. From scanning electron microscopy datal, it is also known that H1 and H2 spring flours
have more damaged starch granules and a tighter protein matrix, and no protein on the starch
granule surface. This can explain a slightly higher onset temperature of gelatinization. The
numerical data from the DSC analysis of the five base flours are listed in Table 3.3.
Figure 3.3 Gelatinization transition temperatures for the five base flours. Bars illustrate
temperature ranges of gelatinization.
DSC runs of the standard industrial flours showed the following results (see Fig 3.4 and
Table 3.4). Gelatinization of the soft standard industrial flour occurs in a narrower range than for
the hard standard industrial flour. This may result from more small size particles present in the soft
flour. The enthalpy of gelatinization for soft standard industrial flour (2.92 J/g) was significantly
l The data were obtained by J. Kang (Food Science Department, University of Guelph) within a collaboration project.
50
higher than for the hard standard industrial flour (2.18 J/g).
Table 3.3 Gelatinization parameters from DSC runs for the five base flours.
Flour Tonset, ºC Tmax, ºC Tend, ºC ∆H, J/g
H1_CWRS 56.37 64.23 71.27 2.14
H2_HRS 56.72 64.30 71.97 2.48
H3_HWR 52.99 62.63 70.10 2.48
H4_MHRW 54.14 62.51 68.99 2.29
S_SRW 56.75 63.71 70.34 2.56
μm 0.26 0.29 0.28 0.29
Table 3.4 Gelatinization parameters from DSC runs for the standard industrial flours.
Flour Tonset, ºC Tmax, ºC Tend, ºC ∆H, J/g
H_ind 55.36 62.48 69.69 2.18
S_ind 55.52 61.47 67.32 2.92
μm 0.35 0.40 0.37 0.40
Figure 3.4 Gelatinization transition temperatures for the two standard industrial flours. Bars
illustrate temperature ranges of gelatinization.
m μ is the confidence interval at 95% probability level.
5055
6065
70Temperature, oC
Tonset
H_ind
S_ind
Tmax Tend
51
The results for the standard industrial flours were in line with gelatinization parameters of
the base flours. As the hard standard industrial flour is a spring flour, it gelatinized in a shorter
range like the base spring flours.
The experimental error shows that there is no significant difference between the measured
parameters for some of the flours. Due to this fact, the DSC analysis does not appear to be a reliable
tool to distinguish flours from the same natural source (within wheat flours in this case).
3.2.3 Powder X-ray diffraction studies
In this study powder X-ray diffraction was used to perform quantitative analysis (to
determine flour crystallinity) and to complete retrogradation study. Additionally, the prospects of
powder X-ray diffraction to study changes in flour and starch rich samples were evaluated.
3.2.3.1 Preliminary experiments
Starch was confirmed to be the only source of crystallinity in the studied wheat flours as
their PXRD patterns corresponded to a simulated pattern for the crystalline A-amylose11 (see
section 2.2.3.1).
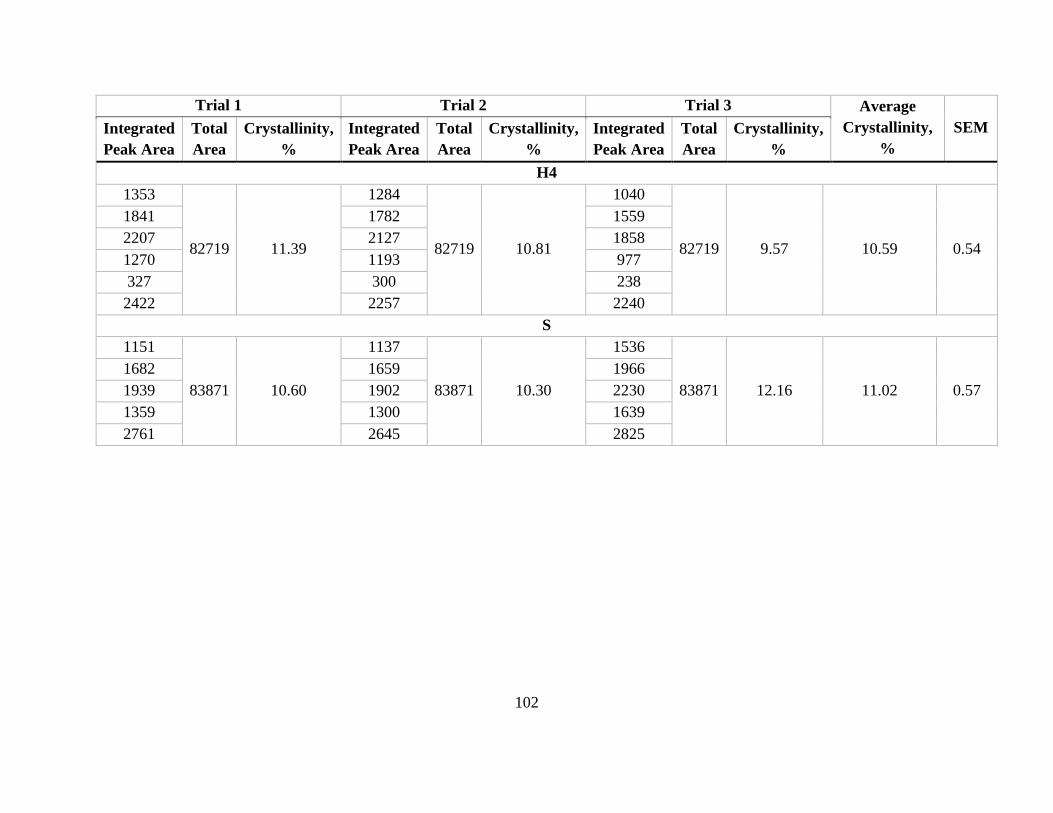
Crystallinity values for the five base flours were calculated on 4-70º 2θ range and are
reported in Table 3.5.
There was no significant difference in the crystallinity values for the five base flours. The
values vary in the 11-12% range. As the starch content within the analyzed wheat flours did not
vary significantly, the result is not surprising. A good correlation between the starch content and
crystallinity value is expected when different types of flours are compared, like rice vs corn. In
that case, the difference in the flour crystallinity could be used as a proof of a difference in their
composition.
52
Table 3.5 Crystallinity from PXRD for the five base flours.
Flour Starch contentn, % Crystallinity, % (SEMo)
H1 72.1 10.9 (0.4)
H2 72.9 11.8 (0.2)
H3 74.4 10.6 (0.3)
H4 74.8 10.6 (0.5)
S 76.8 11.0 (0.6)
The evaluation of fresh and gelatinized flour dough was performed in different
experimental settings (Fig 3.5). The PXRD experiments showed that crystallinity is lost due to the
gelatinization of starch granules during baking. Because of the small sample size, the dough
completely dried by the end of the baking time for the both experimental setups. Consequently,
baked samples were not able to retrograde. In the absence of water, neither A- nor B-type
crystallites can form as both contain molecules of water in their crystal structure11,12.
n The starch content was approximated from the protein and ash content of the flours (Table 3.9). o SEM (standard error off the mean) was calculated for three repeated calculations of the starch crystallinity (see Table
5.7).
53
Figure 3.5 PXRD of H3 dough baked in oven a) in a polyimide capillary; b) on a flat stage
holder. Baking time was 18 min for the sample in the capillary and 20 min for the sample in the
flat stage holder.
after baking
before baking
(a)
after baking
before baking
(b)
54
3.2.3.2 In-situ PXRD measurements
The variable temperature PXRD measurements were conducted on a capillary stage in a
closed polyimide capillary with a flour dough as a sample. Due to the fact that the loss of
crystallinity is associated with the gelatinization of the starch, this PXRD method makes it possible
to monitor the degree of gelatinization as the time and temperature change during the experiment
(Fig 3.6).
Figure 3.6 Evolution of PXRD patterns of an in-situ baked dough sample in a polyimide
capillary on spinning stage. Heating/measuring procedure included scan at 20ºC – curve (1), 1st
heating 20-100ºC (15 min), then scan at 100ºC (6 min) – curve (2); 2nd heating 100-200ºC (15
min), then scan at 200ºC (6 min) – curve (3); cooling 200-20ºC (30 min), then scan. The overall
heating time was 72 min. The scans were also repeated in 16 hours and on day 3 and day 8 of
storage in the sealed capillary.
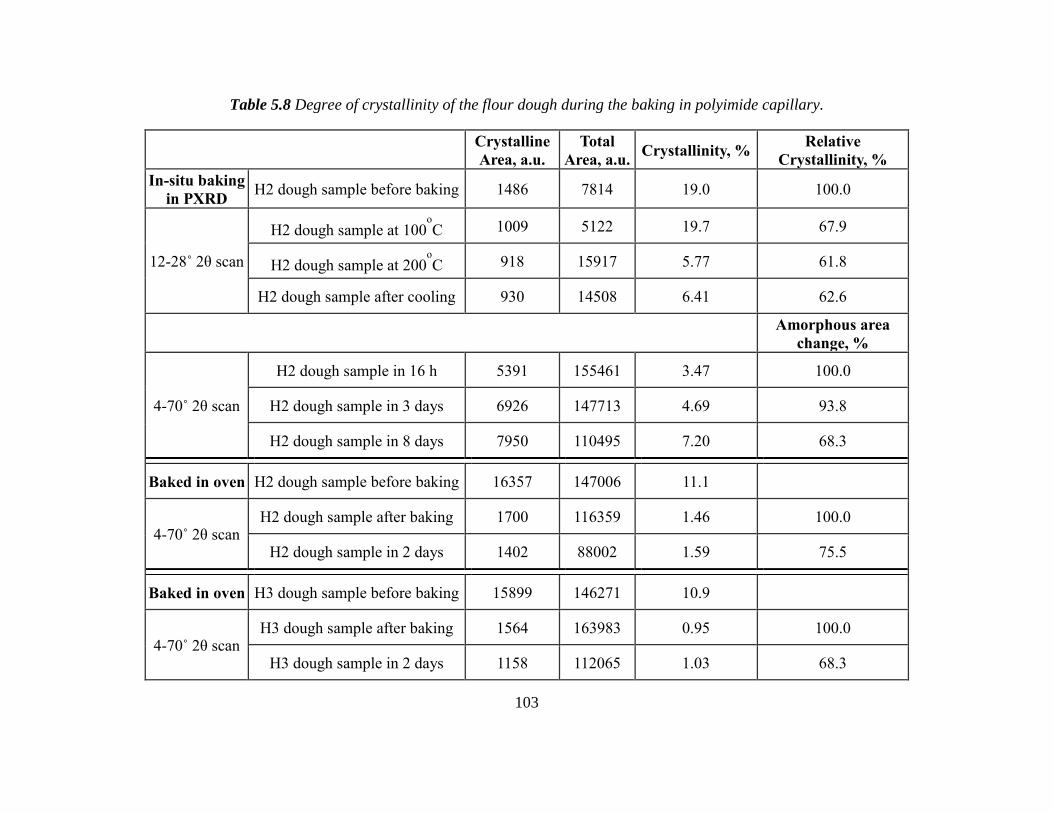
Preliminary baking experiments showed that gelatinization of a flour sample is associated
not only with the loss of crystalline peaks13 but also with the growth of the amorphous halo peak
centered around 17-20˚ 2θ angle (see Figs 3.5 and 3.6 and Table 5.8). It was also noted that the
amorphous halo region on the PXRD patterns changes in time during the storage of the gelatinized
(2) at 100ºC
(1) at 20ºC
(3) at 200ºC
55
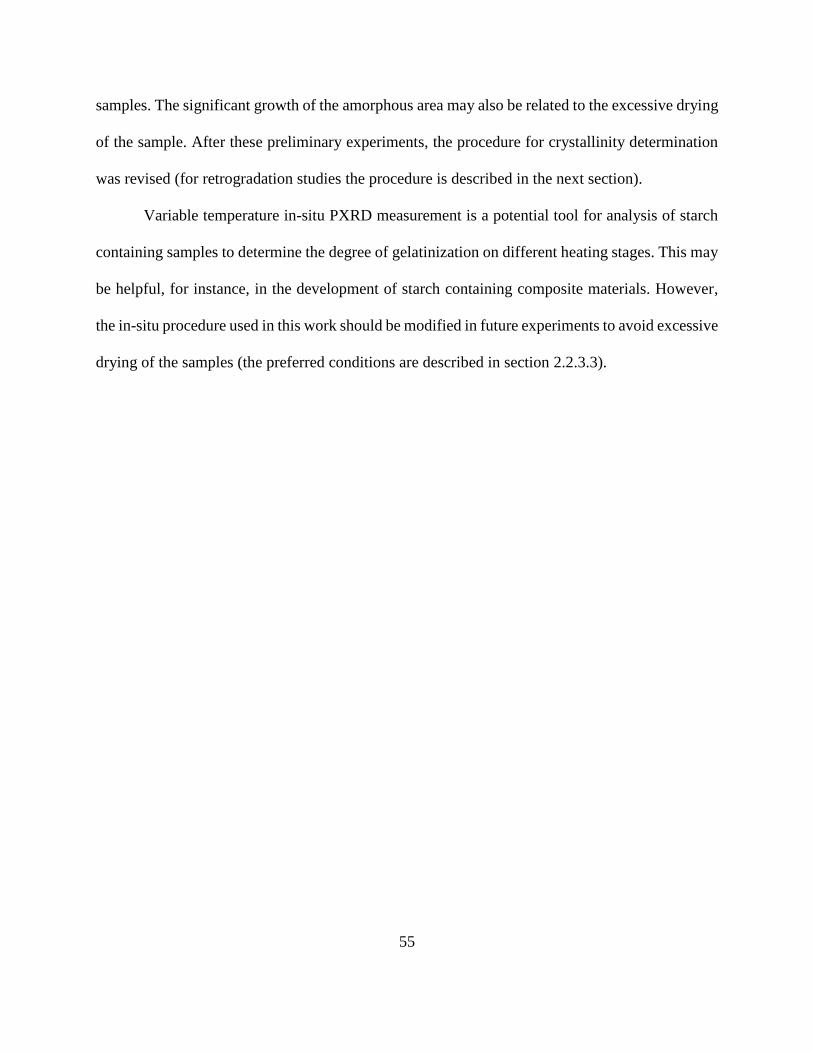
samples. The significant growth of the amorphous area may also be related to the excessive drying
of the sample. After these preliminary experiments, the procedure for crystallinity determination
was revised (for retrogradation studies the procedure is described in the next section).
Variable temperature in-situ PXRD measurement is a potential tool for analysis of starch
containing samples to determine the degree of gelatinization on different heating stages. This may
be helpful, for instance, in the development of starch containing composite materials. However,
the in-situ procedure used in this work should be modified in future experiments to avoid excessive
drying of the samples (the preferred conditions are described in section 2.2.3.3).
56
3.2.3.3 Retrogradation study
Retrogradation tests were conducted to monitor the staling of bread samples during the
storage.
First stage
Initially, bread samples baked from the five base flours stored at room temperature for half
a year were monitored for crystallinity changes for a 30 days period (Tables 5.9 and 5.10). No
further analysis was possible due to excessive formation of mold after 15-20th day of storage at the
room temperature.
From the five base flours only H2 reached its retrogradation maximum (a plateau on the
curve, Figs 3.7 and 3.8). Although the H4 flour had the smallest crystallinity value, the H4 flour
bread retrograded to the highest level. Other flours as of the 30th day have retrograded to nearly
the same level (9.1- 9.9%).
The standard industrial flours stored in a freezer for two years and taken for the comparison
reached their retrogradation maximum in a much shorter time frame (Fig 3.9, Table 5.11). So, the
history of the flour (age, storage conditions) may be more important for the retrogradation rate
than the type of the flour. This makes retrogradation tests an excellent tool to monitor and study
the effect of production and storage conditions of the flour on the quality of bread.
At this stage the retrogradation studies were decided to be repeated for the five base flours
after an additional year of storage at room temperature and in a freezer to test the above hypothesis.
57
Figure 3.7 Retrogradation data for the samples baked from the five base flours stored at room temperature for half a year
(calculated on 4-70˚ 2θ range). The data points are connected with a straight line to guide the eye.
H1
H2
H3
H4
S
1
3
5
7
9
11
0 5 10 15 20 25 30
Cry
sta
llin
ity
on
4-7
0˚
2θ
ran
ge,
%
Time, days
Legend: flour and its crystallinity value
H1_10.93% H2_11.81% H3_10.64%
H4_10.59% S_11.02%
58
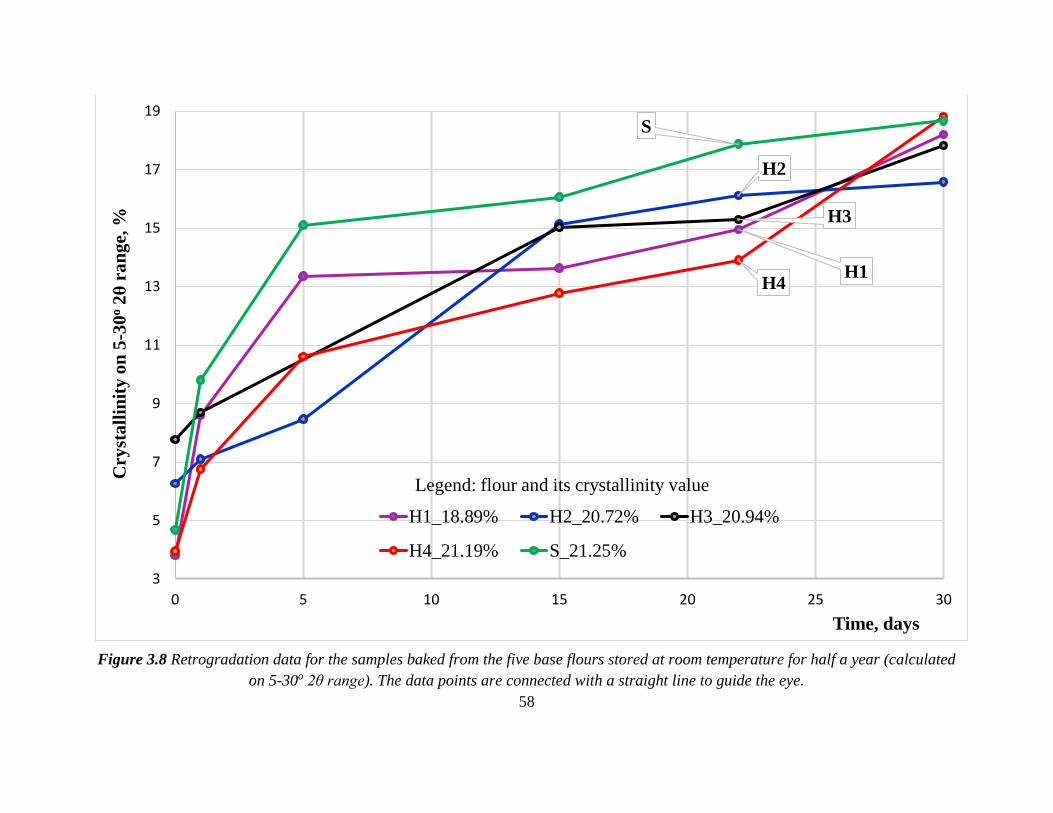
Figure 3.8 Retrogradation data for the samples baked from the five base flours stored at room temperature for half a year (calculated
on 5-30o 2θ range). The data points are connected with a straight line to guide the eye.
H1
H2
H3
H4
S
3
5
7
9
11
13
15
17
19
0 5 10 15 20 25 30
Cry
sta
llin
ity
on
5-3
0o
2θ
ran
ge,
%
Time, days
Legend: flour and its crystallinity value
H1_18.89% H2_20.72% H3_20.94%
H4_21.19% S_21.25%
59
Figure 3.9 Retrogradation data for the samples baked from the two standard industrial flours stored in a freezer at -30˚C for two
years (calculated on 5-30o 2θ range). The data points are connected with a straight line to guide the eye.
S_i
S_ind dried
H_i
H_ind dried
2
4
6
8
10
12
14
16
18
0 5 10 15 20 25 30
Cry
sta
llin
ity
on
5-3
0˚
2θ
ran
ge,
%
Time, days
Legend: flour and its crystallinity value
S_ind 23.22% S_ind dried
H_ind 20.85% H_ind dried
60
Variation in crystallinity measurements
The determination of crystallinity on the different 2θ ranges showed different values but
similar trends (Figs 3.8 and 3.9). The difference in the staling rates is more evident for the smaller
range. Therefore, the determination of crystallinity on the 5-30˚ 2θ range which includes all
significant crystalline peaks of starch appears to be preferable for starch rich products.
Different sample preparation techniques led to similar results in crystallinity determination.
The observed difference in the patterns (Fig 3.10) was only due to the difference in backgrounds
that are subtracted during calculations. The drying of the sample helps to keep the sample mass at
the same level. However, with normalization of the sample by mass, drying is not necessary.
Figure 3.10 The difference in PXRD patterns of dried and non-dried samples prepared from
bread crumb baked from industrial standard flour.
Dried
sample
Non-dried
sample
Inte
nsi
ty, co
un
ts
2θ angle, deg
61
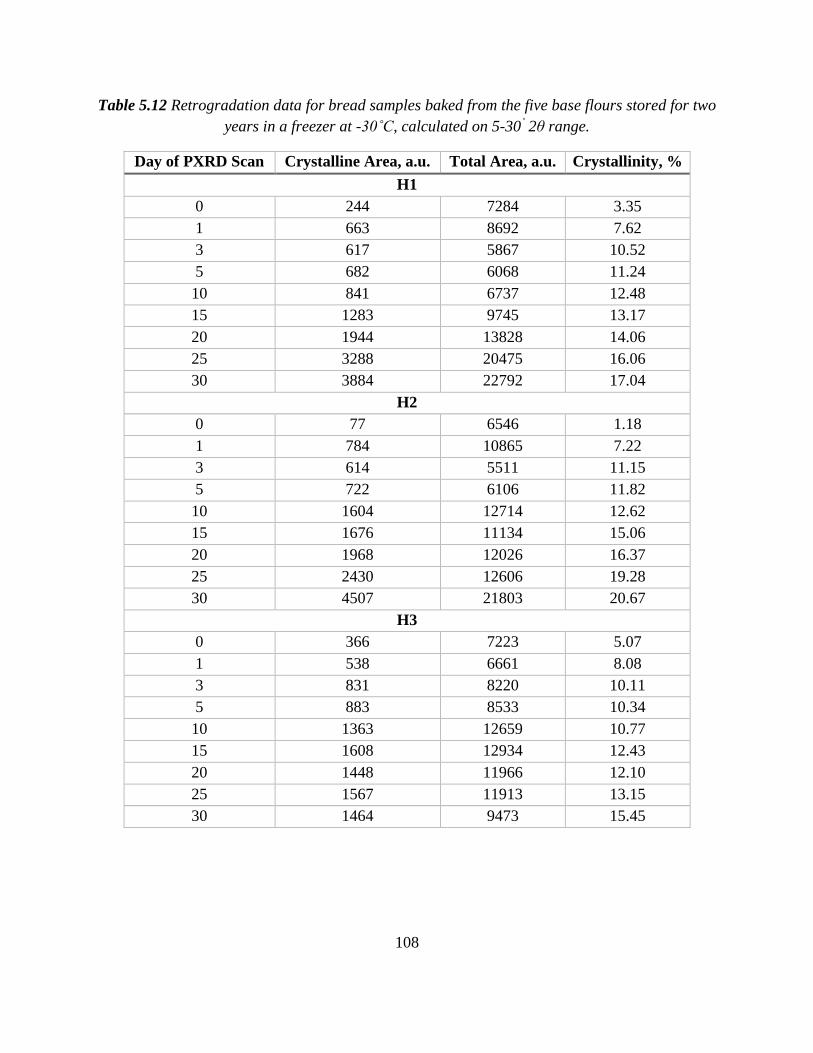
Second stage
After an additional year of storage under different conditions (one set of flours was stored
at room temperature and second set of flours was stored in a freezer) the retrogradation study was
repeated for the five base and two standard industrial flours. All calculations were performed only
on the 5-30º 2θ range for non-dried samples.
Two bread sets were compared for difference in the retrogradation rate. The first set was
baked from the flours stored at room temperature for two years (Fig 3.11, Table 5.12). The second
was baked from the flours stored in a freezer at -30˚C for two years (Fig 3.12, Table 5.13). Breads
were baked following the same procedure. To confirm the difference in the retrogradation rate, the
statistical analysis was performed.
62
Figure 3.11 Retrogradation data for the samples of bread baked from the base flours stored at room temperature for 2 years. The
data points are connected with a straight line to guide the eye.
H1
H2
H3
H4
S
2
4
6
8
10
12
14
16
18
20
0 5 10 15 20 25 30
Cry
sta
llin
ity, %
Time, days
Legend: flour and
its crystallinity value
H1_rt_18.9%
H2_rt_20.7%
H3_rt_21.9%
H4_rt_21.2%
S_rt_21.2%
63
Figure 3.12 Retrogradation data for the samples of bread baked from the base flours stored for two years in a freezer at -30˚C. The
data points are connected with a straight line to guide the eye.
H1
H2
H3
H4
S
1
3
5
7
9
11
13
15
17
19
21
0 5 10 15 20 25 30
Cry
sta
lin
ity,
%
Time, days
Legend: flour and
its crystallinity value
H1_f_18.89%
H2_f_20.72%
H3_f_21.19%
H4_f_21.19%
S_f_21.25%
64
Figure 3.13 Retrogradation of the bread baked from the two standard industrial flours stored for
three years in a freezer at -30˚C. The data points are connected with a straight line to guide the
eye.
The retrogradation for the two standard industrial flours stored in a freezer at -30˚C for
three years (Fig 3.13, Table 5.14) showed a similar behavior as on the second year of storage. In
both cases the samples retrograded almost to their retrogradation maximum during the first 5 days
(Figs 3.9 and 3.13).
Statistical analysis for the difference in retrogradation rates
Initially, retrogradation data were fitted to model curves to compare retrogradation rates
for the base flours stored at room temperature and in a freezer at -30˚C. Fifth degree polynomial
fit of the data points showed a good fit with R2 values higher than 93%. One-tailed t-test was
H_ind
S_ind
0
5
10
15
20
25
0 5 10 15 20 25 30
Cry
sta
llin
ity,
%
Time, days
Legend: flour and its crystallinity value
H_ind_f_20.85%
S_ind_f_23.22%
65
performed for linear component of the polynomial curves at 90% significance level. Statistical
analyses showed a significant difference between the base flours stored at room temperature and
in a freezer at -30˚C for the H2, H3 and S flours (the probability that the difference was due to
random factor only is 6.2, 1.2 and 1.0% respectively).
In order to further interpret the data and extract useful information, the following
assumptions were made, and limitations were taken into account.
Assumptions:
1) The increase in crystallinity over time is due to partial crystallization of
starch only, and the process is essentially the same for all the bread samples.
2) The retrogradation rate is maximal at the beginning and must go to a plateau
at infinite time.
3) The final crystallinity (plateau) should be the same for the same bread and
should be equal to the crystallinity of the corresponding unbaked flour.
4) The derivative of the crystallinity vs time function is never negative, that is
the crystallinity value of a sample can only either increase or remain constant over time. This
assumption does not exclude the presence of more than a single retrogradation process in the
sample. Due to a limited number of points, it was decided to represent the whole process as only
two distinct sub-processes. From Figures 3.11 and 3.12 the retrogradation rate was much faster
during the first three days, followed by a slower rate in the rest of the measurements period.
Therefore, it was assumed there are two distinct sub-processes, one being predominant in the first
three days, and another after this period.
Limitations:
1) Due to the limited number of data points and relatively large experimental
66
error, a polynomial fit may not adequately reflect the nature and parameters of the process.
Therefore, linear approximations were used on selected regions of the curves instead.
2) Bread baked from some flours may not reach retrogradation maximum in
the 30 days period. The analysis of the sample after 20 days of storage is complicated due to the
formation of mold in a high amount and cannot be extended over 30 days.
With the above considerations, each curve was separated into two regions: fast
retrogradation (days 0-3) and slow retrogradation (days 5-30). The curves were fitted with linear
equations separately for the two regions. One-tailed t-test was performed for the slope at 95%
significance level (Table 3.6).
Table 3.6 Retrogradation rates of bread samples baked from the five base flours stored for 2
years. Retrogradation rates are obtained as slopes from a linear fit for the fast and slow
retrogradation regions.
Storage
conditions
Flour type
Room temperature Freezer at -30˚C
Retrogradation rate, %/day
(Standard error of the slope)
Fast region of 0-3 days range (based on 3 data points)
H1 2.17 (0.20) 2.25 (0.70)
H2 1.90 (1.23) 3.13 (1.01)
H3 2.31 (0.67) 1.59 (0.49)
H4 2.25 (0.68) 1.72 (1.26)
S 3.26 (0.43) 2.30 (0.53)
Slow region of 3-30 days range (based on 7 data points)
H1 0.30 (0.04) 0.23 (0.01)
H2 0.27 (0.06) 0.36 (0.02)
H3 0.19 (0.02) 0.18 (0.03)
H4 0.26 (0.05) 0.33 (0.06)
S 0.19 (0.02) 0.21 (0.03)
The statistical analyses of retrogradation rates for the base flours stored at room
67
temperature and in a freezer at -30˚C showed a difference in some cases. For the slow
retrogradation region, H1, H2 and H4 flours showed a significant difference for retrogradation
rates between the sets of flours stored at room temperature and in the freezer (the probability that
the difference was due to random factors only is 0.8, 1.1 and 4.6%, respectively). For the fast
retrogradation region, only S flour showed a significant difference (the probability that the
difference was due to random factors only is 4.7%). To improve the fitting model, it would be
beneficial to provide more than three data points for the 0-3 days period.
Overall, retrogradation rate for the fast region was 9.7 times higher than the retrogradation
rate for the slow region within the bread samples baked from the flours stored at room temperature;
and retrogradation rate for the fast region was 8.3 times higher than the retrogradation rate for the
slow region within the bread samples baked from the flours stored in a freezer at -30˚C.
Therefore the history of the flour, such as its age and storage conditions, appears to affect
the retrogradation rate more than other factors.
Retrogradation tests appear to be an excellent tool to monitor and study the effect of
production and/or storage conditions on the quality of bread and staling behavior. Potentially, the
evaluation of the effect of additives that inhibit staling could be conducted using the PXRD
analysis. The studies could be extended to retrogradation behavior of non-wheat flours. Finally,
the dependence on humidity and the formation of a particular starch allomorph type could be
studied for retrograding starch samples.
68
3.3 Developing a new analytical method for flour analysis
Preliminary screening of the flour samples with thermogravimetric analysis (TGA) revealed
a potential application of TGA as a convenient and fast analytical technique that could yield
multiple parameters useful for the flour analysis. The parameters may include not only the
decomposition temperatures, but also the moisture and ash content, approximate amounts of starch
and protein, and the amylose to amylopectin ratio.
The main focus of further studies was to determine the ash content and to extract
information from the main effect of flour decomposition during heating. The main effect occurs in
each sample at around 250-330ºC (Figs 3.14 and 3.16). The ash content was determined as the
mass of the residue after isothermal heating at 600ºC in an air atmosphere at the end of the TGA
experiment.
3.3.1 Ash content determination
Three methods of ash content determination were compared: AACCI standard method14,
TGA analysis in the platinum 100 μl pan, and TGA analysis in the 250 μl high volume ceramic
pan. The comparison of results of the TGA method with the platinum 100 μL pan and the standard
method showed a good agreement although the precision of the TGA method was lower and
insufficient to clearly see differences between the flours (Table 3.7). Therefore, attempts to
improve the TGA procedure were made. Various modifications were tried, including those in the
sample preparation, experimental procedure, and treatment of the experimental data. Eventually,
a new method was developed with the 250 μL high volume ceramic pans, as described in the
section 2.2.4.2.
The comparison of the TGA method with the 250 μL high volume ceramic pan and standard
69
method (Table 3.7) shows a high correlation (95%) between the methods. Thus, the TGA and
AACCI methods can be used interchangeably. In the standard AACCI method, the sample is held
at least for 5 hours in the oven to reach a stable mass of the residue. The duration of the TGA
experiment was ~4 hours for the TGA run in the platinum 100 μl pan and ~5 hours for the TGA
run in the 250 μl high volume ceramic pan. The main advantages of TGA are its simplicity and
automaticity. The standard method involves repeated movement of the sample between balances,
desiccator and furnace that could be a source of systematic error. In TGA this type of error is
eliminated but there are other sources of error due to a small sample size.
Table 3.7 Comparison of ash content values obtained by the TGA and the standard AACCI
methods (all values are normalized to 14% moisture base).
Ash content (%)
Flour TGA (100 μL Pt pan)
(SD for 2 replicates)
AACCI method
(SD for 3 replicates)
TGA (250 μL ceramic pan)
(SD for 2 replicates)
H1 0.79 (0.07) 0.62 (0.006) 0.69 (0.01)
H2 0.73 (0.10) 0.54 (0.014) 0.59 (0.05)
H3 0.36 (0.03) 0.55 (0.013) 0.59 (0.04)
H4 0.94 (0.02) 0.69 (0.013) 0.89 (0.03)
S 0.72 (0.01) 0.56 (0.011) 0.68 (0.00)
Correlation: 95%
The standard deviations of the TGA mass measurement were determined from two
independent runs for each flour. To account for the change in density of gas with increasing
temperature, a buoyancy correction should be applied15. A blank experiment was performed (Fig
5.2), and the mass increase was subtracted from the data for the 250 μl high volume ceramic pan
experiments. In case of the platinum 100 μl pan (Fig 5.3), the effect was less than 0.02% of the
sample mass and the change was neglected. Finally, the data were normalized to 14% moisture
70
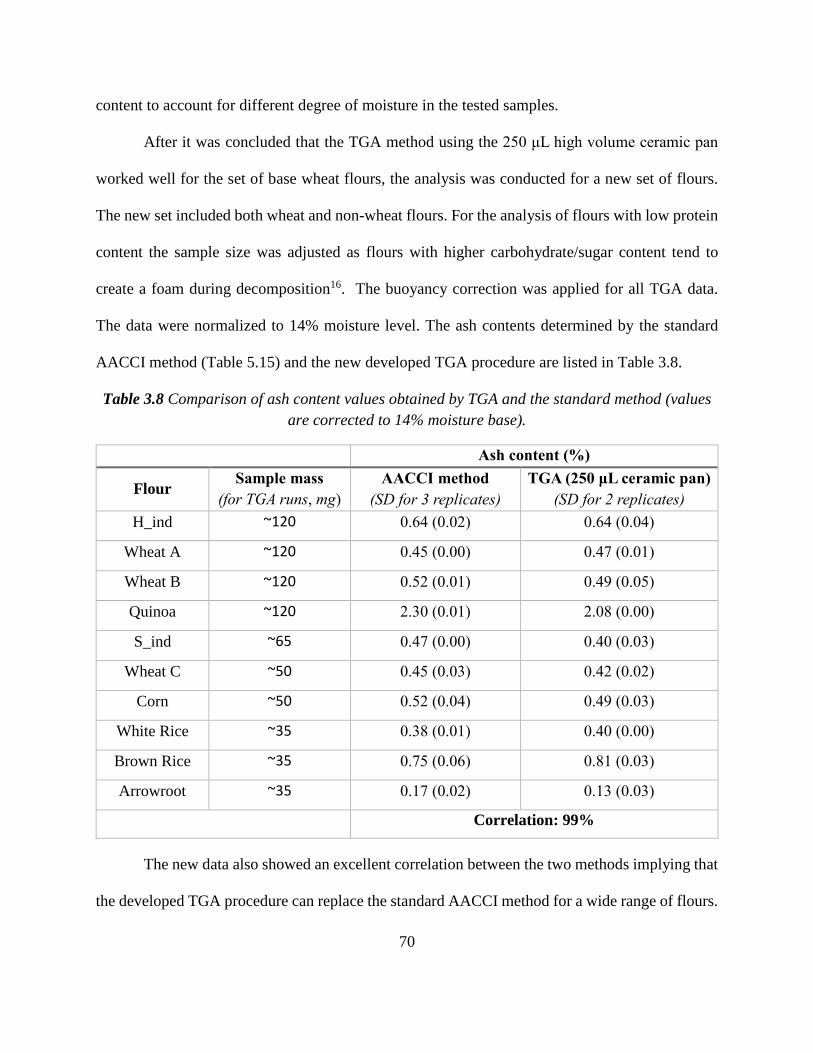
content to account for different degree of moisture in the tested samples.
After it was concluded that the TGA method using the 250 μL high volume ceramic pan
worked well for the set of base wheat flours, the analysis was conducted for a new set of flours.
The new set included both wheat and non-wheat flours. For the analysis of flours with low protein
content the sample size was adjusted as flours with higher carbohydrate/sugar content tend to
create a foam during decomposition16. The buoyancy correction was applied for all TGA data.
The data were normalized to 14% moisture level. The ash contents determined by the standard
AACCI method (Table 5.15) and the new developed TGA procedure are listed in Table 3.8.
Table 3.8 Comparison of ash content values obtained by TGA and the standard method (values
are corrected to 14% moisture base).
Ash content (%)
Flour Sample mass
(for TGA runs, mg)
AACCI method
(SD for 3 replicates)
TGA (250 μL ceramic pan)
(SD for 2 replicates)
H_ind ~120 0.64 (0.02) 0.64 (0.04)
Wheat A ~120 0.45 (0.00) 0.47 (0.01)
Wheat B ~120 0.52 (0.01) 0.49 (0.05)
Quinoa ~120 2.30 (0.01) 2.08 (0.00)
S_ind ~65 0.47 (0.00) 0.40 (0.03)
Wheat C ~50 0.45 (0.03) 0.42 (0.02)
Corn ~50 0.52 (0.04) 0.49 (0.03)
White Rice ~35 0.38 (0.01) 0.40 (0.00)
Brown Rice ~35 0.75 (0.06) 0.81 (0.03)
Arrowroot ~35 0.17 (0.02) 0.13 (0.03)
Correlation: 99%
The new data also showed an excellent correlation between the two methods implying that
the developed TGA procedure can replace the standard AACCI method for a wide range of flours.
71
The new TGA method for ash content determination works as well for the wheat flours as for non-
wheat flour variety. Even after the sample size was dramatically reduced for flours with low protein
content, the method yielded reliable data correlating well with the standard AACCI method. In
conclusion, our studies suggest that the newly developed TGA procedure is an excellent alternative
to the standard AACCI method of ash determination for a wide range of flours.
3.3.2 The main effect of flour decomposition
3.3.2.1 Preliminary experimental screening
Flour is a complex, multicomponent system. It is possible that multiple processes occur
simultaneously on thermal decomposition of a flour sample. This overlap tremendously
complicates interpretation of the TGA data.
By the chemical composition, starch is a very uniform material consisting of two polymers
made up of the same monomeric species. In contrast, protein is a complex mixture of polymers of
different composition, degree of polymerization, and four levels of biomolecular structure. Flour
proteins have different amino acids composition17 and differ in their properties such as solubility18.
The presence of compositionally and structurally different components will cause a great number
of TGA-sensitive events occurring in a wide range of temperatures. In other words, protein is
expected to show much more complicated decomposition behavior.
To investigate which flour component is responsible for the main effect (250-330˚C), TGA
measurement of a flour was compared with those for starch and protein isolated from the same
flour dough. The analyses of ~30 mg samples were carried out in the range of 35-800ºC at the
5ºC/min heating rate under the N2 purge gas flow of 25 ml/min (the thermograms are shown in Fig
3.14).
72
Figure 3.14 The TGA curves of separated starch, dough protein and initial flour under N2 purge
gas.
The thermograms clearly indicate that the main effect (250-330˚C) of decomposition is
mostly due to thermal decomposition of starch. At the same time, in the range of 330-400˚C both
protein and starch decompositions contribute to the mass loss effect. Wheat gluten decomposition
was reported to happen around 162ºC19. In our experiment conducted in the N2 atmosphere, we did
not observed any decomposition near this temperature. As the mass loss of starch and protein occur
in approximately the same range of temperatures, the deconvolution of these decomposition events
is complicated.
Nevertheless, the following conclusions can be made based on the above experiments:
1) The main effect of decomposition in the region of 250-330˚C is mostly due to
Starch
Protein
Flour
Wei
ght,
%
Temperature, ˚C
73
thermal decomposition of starch.
2) The mass loss in the 250-330˚C temperature range may correlate with the amount
of starch in the sample.
3.3.2.2 Amylose and amylopectin decomposition
Studies reported in the literature show that thermal degradation of amylose and
amylopectin happen independently (Fig 3.15)20. In particular, the onset temperature of the thermal
decomposition is slightly higher for amylopectin in comparison to amylose.
The decomposition of amylopectin is deeper in terms of the mass loss above 300˚C. With
the assumption that flours with higher amylopectin content decompose with a larger mass loss, it
is possible to distinguish the contributions of the starch polymers to the decomposition pattern.
The TGA data collected for flour samples were examined for the residue amount at 600˚C
before the isothermal step (see Fig 3.16). From the evaluated data we can conclude that the amylose
content of the flours is increasing in the following sequence: H_ind < Wheat A ~ Wheat B < H1 <
Quinoa ~ White Rice ~ S ~Wheat C ~ H2 < H3 ~ H4 < S_ind < Corn < Arrowroot. Additional
analysis of flour samples for amylose/amylopectin content is required to verify the reliability of
the amylose/amylopectin ratio determination based on the assumption that flours with higher
amylopectin content decompose with a larger mass loss. The values for amylose content reported
in the literature do not help as they vary significantly not only between the flours of different
natural source but also within the same flour type. For example, amylose content in wheat flours
was reported as 20.4, 26.3, and 37.5% for the high-amylose wheat flour21–23. For the rice flours the
amylose content was reported as 25.6 and 27.2%24,25.
The possibility to identify flours with higher amylose content among a set of different
74
flours from their TGA thermograms would give a valuable add-in to the TGA method.
Figure 3.15 Thermal decomposition of amylose and amylopectin from potato in N2 atmosphere.
Reprinted with permission from ref. 20. Copyright 2008 Elsevier.
Wei
gh
t, %
Temperature, ºC
amylose
amylopectin
75
3.3.2.3 The main effect of flour decomposition: calculations
As shown in section 3.3.2.1, the main effect of flour decomposition observed in TGA
experiments in the 250-330˚C range is caused by two processes occurring in parallel. As it can be
seen from Fig 3.14, the processes are the decomposition of starch and protein. Although the two
events overlap, the mass loss from starch is a greater and much more “square” effect which occurs
in a very narrow range due to the compositional and structural uniformity of starch. In contrast,
the mass loss of protein is smaller and very gradual, resulting from a continuum of decomposition
reactions in a wider temperature range.
The described differences of the two effects are better seen on the derivative curve of the
TGA thermogram (Fig 3.16). The derivative shows a strong sharp peak on top of a weaker, flatter
peak.
In an attempt to extract the starch content from the TGA thermograms, two assumptions
were made:
1. The decomposition of starch and protein are two parallel processes independent of
each other.
2. The sharp effect is caused predominantly by the decomposition of starch.
Based on these assumptions and the known starch content for the five base flours (Table
3.9), a number of calculation procedures have been tried, of which the best is described below.
The onset and offset points were determined for the sharp peak on the derivative of the
mass change function. In the case of the soft flour (Fig 3.16), the onset temperature was 253.35ºC
and the offset temperature was 331.92ºC. These define the starting point (point A) and the ending
point (point B) for the starch decomposition event. The corresponding weight of the sample in
point A was 86.51%, and the weight in point B was 37.01%. The difference (A-B) corresponds to
76
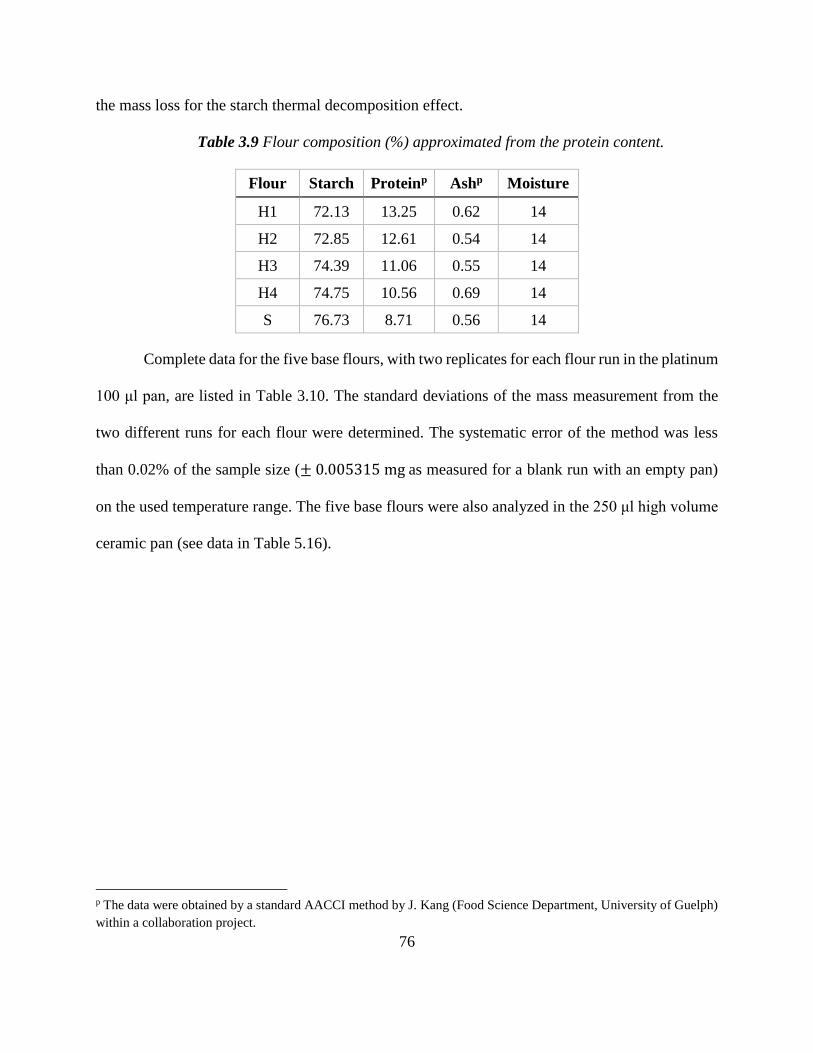
the mass loss for the starch thermal decomposition effect.
Table 3.9 Flour composition (%) approximated from the protein content.
Flour Starch Proteinp Ashp Moisture
H1 72.13 13.25 0.62 14
H2 72.85 12.61 0.54 14
H3 74.39 11.06 0.55 14
H4 74.75 10.56 0.69 14
S 76.73 8.71 0.56 14
Complete data for the five base flours, with two replicates for each flour run in the platinum
100 μl pan, are listed in Table 3.10. The standard deviations of the mass measurement from the
two different runs for each flour were determined. The systematic error of the method was less
than 0.02% of the sample size (± 0.005315 mg as measured for a blank run with an empty pan)
on the used temperature range. The five base flours were also analyzed in the 250 μl high volume
ceramic pan (see data in Table 5.16).
p The data were obtained by a standard AACCI method by J. Kang (Food Science Department, University of Guelph)
within a collaboration project.
77
Figure 3.16 TGA of the soft flour S (green line) and its derivative (blue line).
A: Starting point of the predominantly starch decomposition; B: ending point of the “starch effect”. Moisture content is defined as the
mass loss before 200˚C. Ash content is the mass of the residue at the end of the full run.
78
Table 3.10 TGA data for the five base flours run in the platinum 100 μl pan describing the mass
loss due to predominantly starch decomposition.
Flour A, % B, % (A-B), % Average (A-B), % SD
H1 86.31 36.96 49.35
48.44 1.29 86.50 38.97 47.53
H2 85.51 38.00 47.51
48.33 1.16 85.98 36.83 49.15
H3 86.12 34.99 51.13
51.52 0.54 86.63 34.73 51.90
H4 85.65 35.68 49.97
49.50 0.66 86.26 37.23 49.03
S 86.58 37.39 49.19
49.35 0.22 86.51 37.01 49.50
The extracted mass loss values are close among the five base flours as the differences are
within or barely beyond the experimental error. To correlate the mass loss for the starch thermal
decomposition to the content of starch in the flour, the corresponding coefficient was determined
from independent composition analysis data (Table 3.9).
As a result, the starch content in the flour could be approximated from the TGA data using
the following equations:
Starch content (%) = 1.56 × NMC14 × Average(A-B)
or
Starch content (%) = 2.06 × NMC14 × Average(A-B)
where
NMC14 is a normalization coefficient for 14 % moisture content base;
NMC14 = 86/(100-MCactual), where MCactual is the moisture content determined from the same
TGA experiment, defined as the mass loss occurring before 200˚C.
1.48 is the coefficient (Kst) used to determine the amount of starch in the flour from TGA
measurements in the platinum 100 μl pan.
2.06 – is the coefficient (Kst) used to determine the amount of starch in the flour from TGA
79
measurements in the 250 μl high volume ceramic pan.
For more detailed explanation of the coefficient calculation for TGA runs in the both types
of pans see Tables 5.17 and 5.18.
To verify the reliability of the proposed procedure of flour composition analysis from TGA,
further experiments were conducted with a new set of wheat and non-wheat flours. The collected
data showed that the procedure is satisfactory for the wheat flours. Unfortunately, the procedure
did not yield acceptable results for starch/protein contents in a non-wheat flours (see the data in
Table 5.19). Since the lipids and dietary fiber contents are significantly differ for a non-wheat flour
in comparison to the wheat flours, the coefficient should be calculated for each specific flour type.
80
References
1. Corke H, De Leyn I, Nip WK, Cross NA. Bakery Products: Science and Technology. 1st ed.
(Hui YH, ed.). Blackwell Publishing; 2008. 574 p.
2. Akpapunam MA, Darbe JW. Chemical composition and functional properties of blends of
maize and bambara groundnut flours for cookie production. Plant Foods Hum Nutr. 1994;
46(2): p. 147-155. doi:10.1007/BF01088767
3. Sacchetti G, Pinnavaia GG, Guidolin E, Rosa MD. Effects of extrusion temperature and
feed composition on the functional, physical and sensory properties of chestnut and rice
flour-based snack-like products. Food Res Int. 2004; 37(5): p. 527-534.
doi:10.1016/j.foodres.2003.11.009
4. Shankar TJ, Bandyopadhyay S. Process variables during single-screw extrusion of fish and
rice-flour blends. J Food Process Preserv. 2005; 29: p. 151-164.
5. Zhou Z, Robards K, Helliwell S, Blanchard C. Composition and functional properties of
rice. Food Sci Technol Int. 2002; 37(8): p. 849-868.
6. Ranhotra GS, Gelroth JA, Glaser BK, Lorenz KJ, Johnson DL. Composition and Protein
Nutritional Quality of Quinoa. Cereal Chem. 1993; 70(3): p. 303-305.
7. Peroni FHG, Rocha TS, Franco CML. Some structural and physicochemical characteristics
of tuber and root starches. Food Sci Technol Int. 2006; 12(6): p. 505-513.
doi:10.1177/1082013206073045
8. Kumalasari ID, Harmayani E, Lestari LA, Raharjo S, Asmara W, Nishi K, Sugahana T.
Evaluation of immunostimulatory effect of the arrowroot (Maranta arundinacea. L) in vitro
and in vivo. Cytotechnology. 2012; 64(2): p. 131-137. doi:10.1007/s10616-011-9403-4
9. Aprianita A, Vasiljevic T, Bannikova A, Kasapis S. Physicochemical properties of flours
and starches derived from traditional Indonesian tubers and roots. J Food Sci Technol. 2014;
51(12): p. 3669-3679. doi:10.1007/s13197-012-0915-5
10. Arab L, Wittler M, Schettler G. European Food Composition Tables in Translation. 3rd ed,
Springer; 1987: 157 p.
11. Imberty A, Chanzy H, Perez S. The Double-helical Nature of the Crystalline Part of A-
starch. J Mol Biol. 1988; 201: p. 365-378.
12. Bertoft E. Fine Structure of Amylopectin. In: Nakamura Y, ed. Starch Metabolism and
Structure. Springer; 2015: p. 3-40.
13. Ottenhof MA, Farhat IA. The effect of gluten on the retrogradation of wheat starch. J Cereal
Sci. 2004; 40(3): p. 269-274. doi:10.1016/j.jcs.2004.07.002