106
Transforming Lives and Landscapes with Trees

Transforming Lives and Landscapes with Trees

World Agroforestry Centre
World Agroforestry CentreUnited Nations Avenue, GigiriP. O. Box 30677-00100Nairobi, Kenya.Phone + (254) 20 722 4000
Fax + (254) 20 722 4001Via USA phone (1-650) 833-6645Via USA fax (1-650) 833-6646Email: [email protected]: www.worldagroforestry.org
Content: Francis Kinyanjui and Ernest GatoruEditing and proofreading: Betty Rabar and Anne Munene Design and layout: Sherry Odeyo and Martha MwendaPrinted by: Digital Process Works Ltd.
The geographic designation employed and the presentation of material in this publication do not imply the expression of any opinion whatsoever on the part of the World Agroforestry Centre concerning the legal status of any country, territory, city or area or its authorities, or concerning the delimitation of its frontiers or boundaries.
© 2013 World Agroforesty CentreISSN 2078-5550

The Centre
ABOUT US 1-3FIVE-YEAR PERFORMANCE REVIEW 4-5CORPORATE INFORMATION 6BOARD OF TRUSTEES 8-11SENIOR LEADERSHIP TEAM 12-13CORPORATE GOVERNANCE REPORT 15 -18CORPORATE SOCIAL RESPONSIBILITY 19-29
Financial Statements
BOARD CHAIR’S STATEMENT 31-32BOARD STATEMENT ON RISK MANAGEMENT 33STATEMENT OF THE MANAGEMENT’S RESPONSIBILITIES 34REPORT OF THE INDEPENDENT AUDITOR 35STATEMENT OF FINANCIAL POSITION 36STATEMENT OF ACTIVITIES 37STATEMENT OF CHANGES IN NET ASSETS 38STATEMENT OF CASH FLOWS 39NOTES TO THE FINANCIAL STATEMENTS 40-61
Exhibits EXHIBIT 1: SCHEDULE OF UNRESTRICTED GRANTS REVENUE 63EXHIBIT 1A: SCHEDULE OF RESTRICTED GRANT REVENUE 64-74 EXHIBIT 1B:ANALYSIS OF SOURCES AND APPLICATIONS OF RESTRICTED PROJECT GRANTS 76-91EXHIBIT 2: PROPERTY AND EQUIPMENT DETAILED SCHEDULE 92EXHIBIT 3: STATEMENT OF OVERHEAD EXPENSES 93 EXHIBIT 4: CGIAR - GENDER & DIVERSITY/AWARD PROGRAM 94 EXHIBIT 5: CGIAR RESEARCH PROGRAM 95-99
CONTENTS
Financial Statements and Auditor’s Report
World Agroforestry Centre
LIST OF ABBREVIATIONS & ACRONYMSACTS African Centre for Technology StudiesAPI Agroforestry Policy InitiativeAWARD African Women in Agricultural Research and DevelopmentBAYSUP International Bilingual Academy of YaoundéBoT Board of TrusteesCAMES African and Malagasy Council for Higher EducationCCAFS CGIAR Research Program on Climate Change, Agriculture and Food Security CGIAR Consultative Group on International Agricultural ResearchCIFOR Center for International Forestry ResearchCIMMYT International Maize and Wheat Improvement CenterCIRAD Le Centre de coopération internationale en recherche agronomique pour le développementCORAF Conseil ouest et centre africain pour la recherche et le développement agricolesDG Director GeneralETFRN European Tropical Forest Research NetworkFARA Forum for Agricultural Research in AfricaFLD Forest & Landscape DenmarkG&D Gender and DiversityHIV Human Immunodefi ciency VirusHQ HeadquartersIARAS Impact Assessment and Rural Advisory ServicesICRAF World Agroforestry CentreICT Information and communication TechnologyIER L’Institut d’Economie RuraleIFRS International Financial Reporting StandardsIFS International Foundation for ScienceIRRI International Rice Research InstituteIRS Internationally Recruited Staff IWD International Women’s DayKM Knowledge ManagementLED Light-Emitting DiodesMCDC Maseno Child Development CentreNRS Nationally Recruited Staff POWB Programme of Work and BudgetPROTA Plant Resources of Tropical AfricaREDD Reducing Emissions from Deforestation and Forest DegradationSBE Self-Breast ExaminationSD Science DomainSLT Senior Leadership TeamUK United KingdomUNDP United Nations Development Programme UNICEF United Nations Children’s Fund

The Centre 1
ABOUT US The World Agroforestry Centre (ICRAF) is a CGIAR Consortium Research Centre. The organization was founded in 1978 with its global headquarters based in Nairobi, Kenya. It currently operates in 31 countries. In 2002, it was rebranded as the World Agroforestry Centre although retaining ICRAF as its legal name and acronym.
Our Vision Our vision is a rural transformation in the developing world as smallholder households increase their use of trees in agricultural landscapes to improve food security, nutrition, income, health, shelter, social cohesion, energy resources and environmental sustainability.
Our Mission The Centre’s mission is to generate science-based knowledge about the diverse roles that trees play in agricultural landscapes, and to use its research to advance policies and practices, and their implementation that benefi t the poor and the environment.
Our Core ValuesWe strongly adhere to four shared core values that guide our work and relationships with colleagues, investors and partners:
• Professionalism • Mutual respect• Creativity• Inclusiveness
Our Strategic Goals (Strategy 2013-2022)Considering the trends and challenges in the global environment, the emerging research needs and opportunities, as well as ICRAF’s comparative advantages and roles, the Centre has developed three integrating strategic goals upon which its programme of research for development impact is based:
• Building livelihoods by generating knowledge, choice and opportunities• Improving landscapes and their sustainability by better managing their complexity; and• Transforming agroforestry impacts to large-scale through policy, innovation and partnerships.
2 World Agroforestry Centre
About Us (contd.)
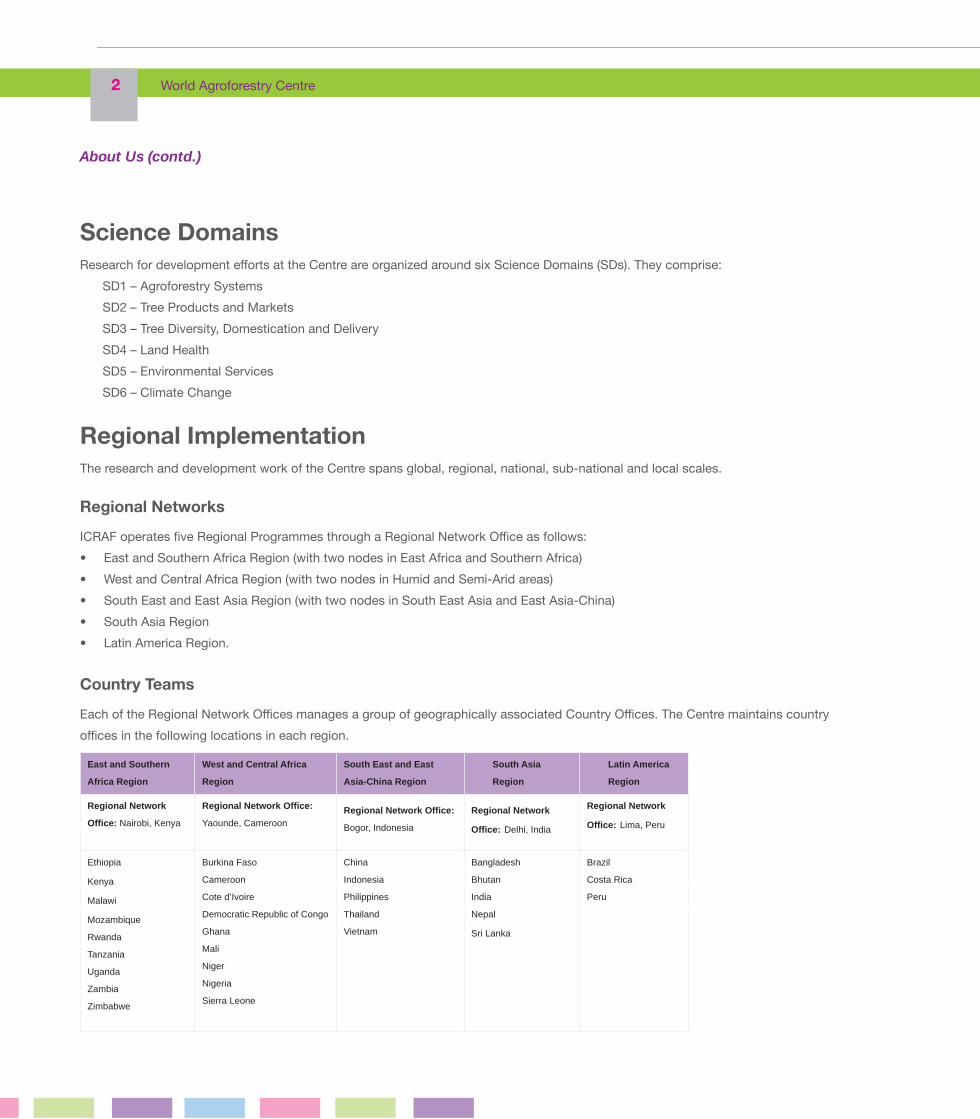
Science DomainsResearch for development eff orts at the Centre are organized around six Science Domains (SDs). They comprise:
SD1 – Agroforestry SystemsSD2 – Tree Products and MarketsSD3 – Tree Diversity, Domestication and DeliverySD4 – Land HealthSD5 – Environmental ServicesSD6 – Climate Change
Regional ImplementationThe research and development work of the Centre spans global, regional, national, sub-national and local scales.
Regional Networks
ICRAF operates fi ve Regional Programmes through a Regional Network Offi ce as follows:• East and Southern Africa Region (with two nodes in East Africa and Southern Africa)• West and Central Africa Region (with two nodes in Humid and Semi-Arid areas)• South East and East Asia Region (with two nodes in South East Asia and East Asia-China)• South Asia Region• Latin America Region.
Country Teams
Each of the Regional Network Offi ces manages a group of geographically associated Country Offi ces. The Centre maintains country offi ces in the following locations in each region.
East and Southern
Africa Region
West and Central Africa
Region
South East and East
Asia-China Region
South Asia
Region
Latin America
Region
Regional Network
Office: Nairobi, Kenya
Regional Network Office:
Yaounde, CameroonRegional Network Office: Bogor, Indonesia
Regional Network
Office: Delhi, India
Regional Network
Office: Lima, Peru
Ethiopia
Kenya
Malawi
Mozambique
Rwanda
Tanzania
Uganda
Zambia
Zimbabwe
Burkina Faso
Cameroon
Cote d’Ivoire
Democratic Republic of Congo
Ghana
Mali
Niger
Nigeria
Sierra Leone
China
Indonesia
Philippines
Thailand
Vietnam
Bangladesh
Bhutan
India
Nepal
Sri Lanka
Brazil
Costa Rica
Peru

The Centre 3
Research Support and Advice UnitsThere are a number of units which exist to support the Science Domains and Regional Programmes. They include:
• Research Methods Group • Impact Assessment and Rural Advisory Services Unit (IARAS) • GeoScience Lab• Knowledge Management Unit • Communications Uni • Capacity Development Unit• Agroforestry Policy Initiative.
Our PeopleThe organization comprises 452 staff from a wide array of disciplines including forestry, agriculture, economics, soil science, social science, administration, monitoring and evaluation, communications and ICT. Their high-level skills and expertise ensure that the Centre has the capacity to conduct quality research, and to use this research to advance policies and practices that benefi t the poor and the environment.
Our PartnersThe World Agroforestry Centre has always implemented much of its work in partnership with a range of public, private and international bodies. Our partnerships are based on a clear recognition of the value that is added through working jointly with partners and sharing strengths to achieve specifi c outcomes. We partner with universities, advanced research institutions, national agricultural research organizations, private sector organizations, and government and non-government agencies in the fi elds of agriculture, forestry, environment, conservation and climate change.
About Us (contd.)
4 World Agroforestry Centre
FIVE-YEAR PERFORMANCE REVIEW
60.00
50.00
40.00
30.00
20.00
10.00
- 2008 2009 2010 2011 2012
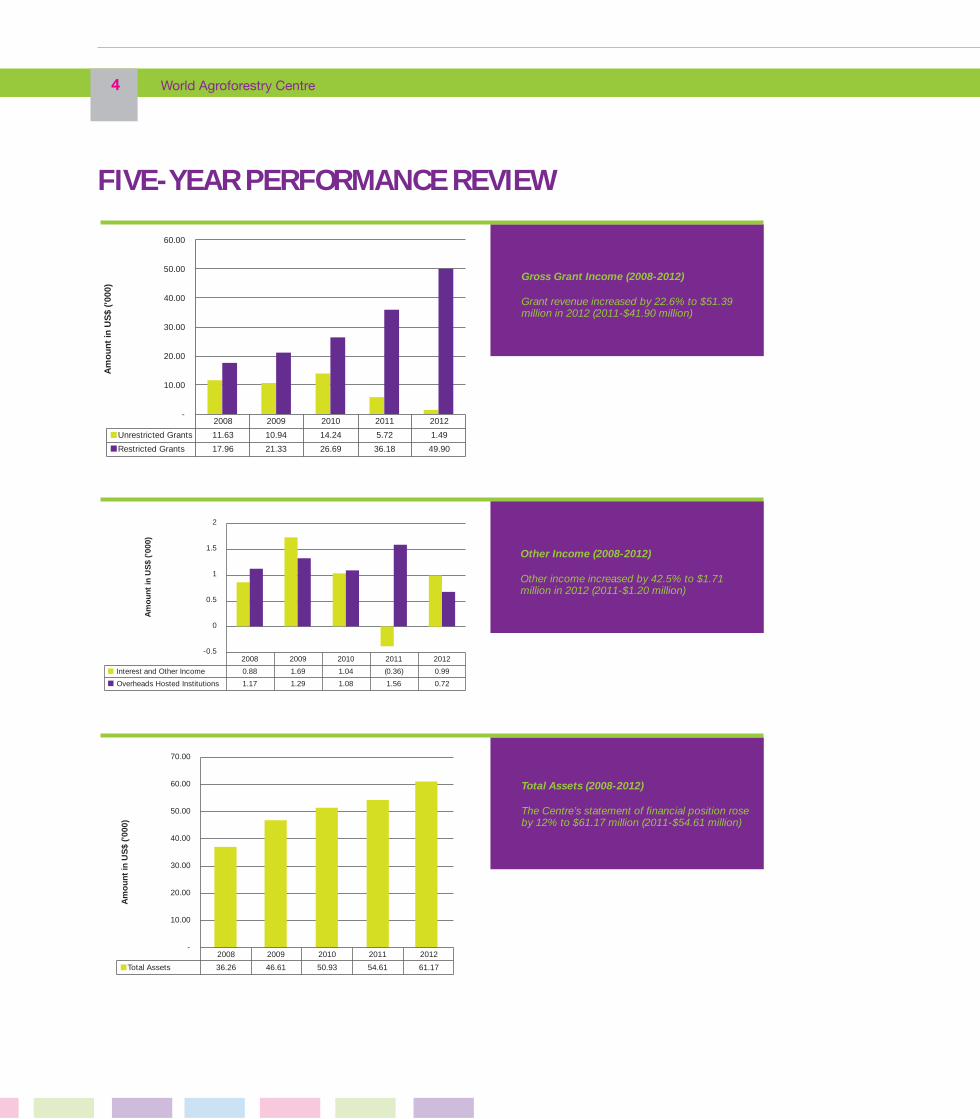
Unrestricted Grants 11.63 10.94 14.24 5.72 1.49
Restricted Grants 17.96 21.33 26.69 36.18 49.90
Am
oun
t in
US
$ (’0
00)
Gross Grant Income (2008-2012)
Grant revenue increased by 22.6% to $51.39 million in 2012 (2011-$41.90 million)
2
1.5
1
0.5
0
-0.5 2008 2009 2010 2011 2012
Interest and Other Income 0.88 1.69 1.04 (0.36) 0.99
Overheads Hosted Institutions 1.17 1.29 1.08 1.56 0.72
Am
oun
t in
US
$ (’0
00)
Other Income (2008-2012)
Other income increased by 42.5% to $1.71 million in 2012 (2011-$1.20 million)
70.00
60.00
50.00
40.00
30.00
20.00
10.00
- 2008 2009 2010 2011 2012
Total Assets 36.26 46.61 50.93 54.61 61.17
Am
oun
t in
US
$ (’0
00)
Total Assets (2008-2012)
The Centre’s statement of fi nancial position rose by 12% to $61.17 million (2011-$54.61 million)
The Centre 5
Five-year performance review (contd.)
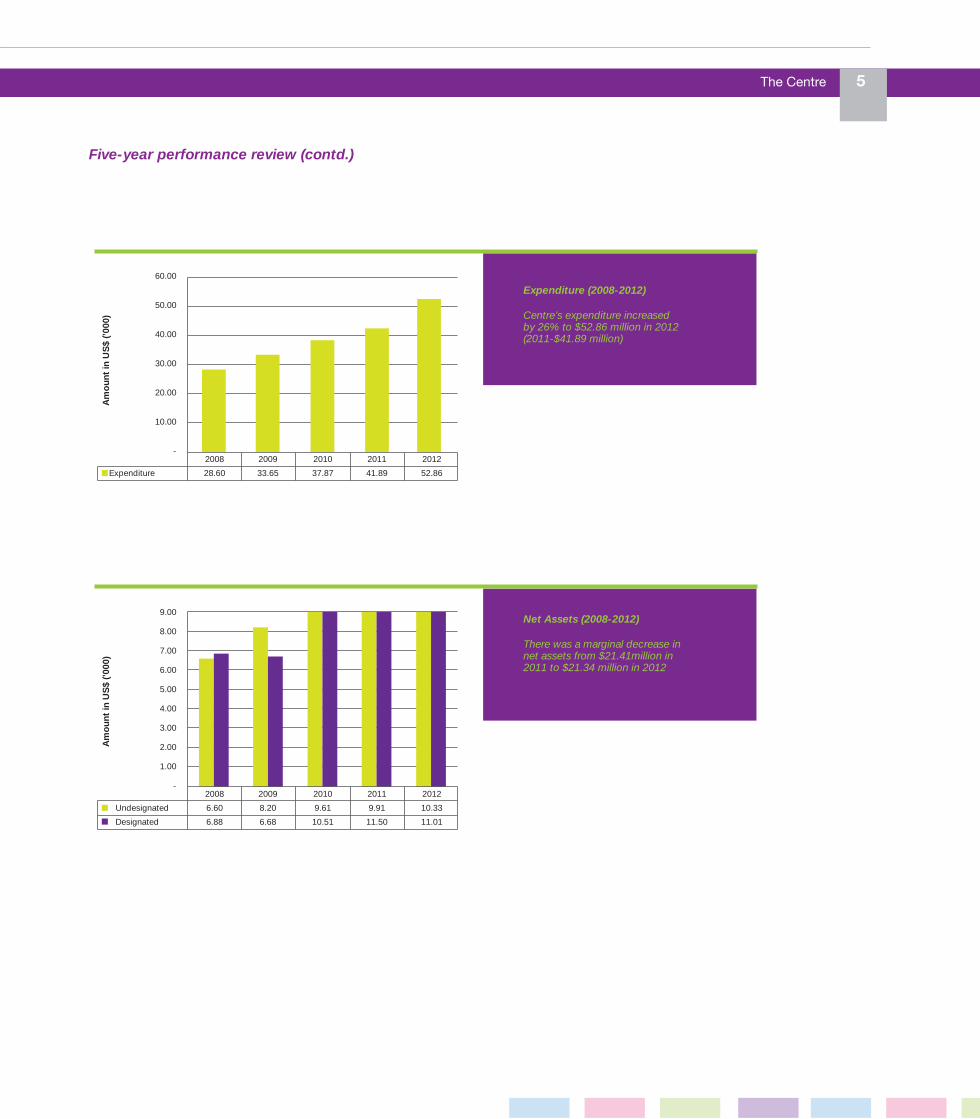
Expenditure (2008-2012)
Centre’s expenditure increased by 26% to $52.86 million in 2012 (2011-$41.89 million)
60.00
50.00
40.00
30.00
20.00
10.00
- 2008 2009 2010 2011 2012
Expenditure 28.60 33.65 37.87 41.89 52.86
Am
oun
t in
US
$ (’0
00)
Net Assets (2008-2012)
There was a marginal decrease in net assets from $21.41million in 2011 to $21.34 million in 2012
9.00
8.00
7.00
6.00
5.00
4.00
3.00
2.00
1.00
- 2008 2009 2010 2011 2012
Undesignated 6.60 8.20 9.61 9.91 10.33
Designated 6.88 6.68 10.51 11.50 11.01
Am
oun
t in
US
$ (’0
00)

6 World Agroforestry Centre
CORPORATE INFORMATION
AuditorsPricewaterhouseCoopersCertifi ed Public AccountantsPwC TowerWaiyaki Way/Chiromo Road, WestlandsP. O. Box 4396300100 - Nairobi
HEADQUARTERS
World Agroforestry CentreICRAF HouseUnited Nations AvenueP. O. Box 3067700100 - Nairobi
Board of Trustees Prof. Eric Tollens, Chair BelgiumDr. Romano Kiome, Ex-offi cio Kenya Dr. Rita Sharma India
Prof. Olavi Luukkanen Finland
Dr. Paco Sereme Burkina Faso
Ms. Hilary Wild United Kingdom
Mr. John Hudson, Ex-offi cio United Kingdom (Joined November 2012)
Dr. John Lynam USA
Dr. Hosny El-Lakany, Ex-offi cio Egypt
Dr. Hector Cisneros Peru
Prof. Tony Simons, Ex-offi cio United Kingdom
LawyersOraro & Company AdvocatesACK Garden House3rd Floor, Wing C, First Ngong AvenueP.O. Box 5123600200 - Nairobi
Board SecretaryProf. August Temu


8 World Agroforestry Centre
BOARD OF TRUSTEES
Prof. Eric Tollens obtained his PhD in Agricultural Economics from
Michigan State University in 1975. He is currently a professor of
agricultural economics at the Faculty of Agricultural and Applied
Biological Sciences of the Catholic University of Leuven, Belgium.
He has held teaching jobs at various universities and is registered
with professional bodies, including the American Agricultural
Economics Association, European Association of Agricultural
Economics, Belgium Association for Agricultural Economics and
the Royal Academy of Overseas Sciences.
Prof. Eric TollensChair, Board of Trustees
Prof. Tony Simons is the Director General of the World
Agroforestry Centre, a position he has held since October
2011. Prior to that, he was the Deputy Director General of
the Centre. He is a Board member of Plant Resources of
Tropical Africa (PROTA) and the African Centre for Technology
Studies (ACTS), and a member of the Panel of Experts of
Forest Genetic Resources. He is also an Honorary Professor
of Tropical Forestry at Forest & Landscape Denmark (FLD),
Faculty of Life Science, University of Copenhagen. Prof.
Simons has a PhD in Botany from Cambridge University,
United Kingdom.
Prof. Tony Simons Ex-offi cio member
Dr. Romano Kiome is currently the Permanent Secretary, Ministry
of Agriculture in Kenya. He has a PhD from the University of East
Anglia in the United Kingdom. He is a member and/or Chair of 12
technical advisory committees at national and international level.
He has led several national and regional projects before becoming
involved in research management. He is a Board member of two
other research institutes in Kenya, including the World Vegetable
Centre and the International Maize and Wheat Improvement Centre
(CIMMYT). He has published over 48 articles, book chapters,
conference papers and reports.
Dr. Romano KiomeEx-offi cio member
The Centre 9
Dr. Héctor Cisneros holds a PhD in Forestry from the University
of British Columbia and an MSc in Forestry from University of
Toronto. He has worked in both North America and Peru, and his
main areas of expertise include rural development, forestry and
environmental issues. He is currently the Executive Coordinator of
the National Forest Conservation Programme to Mitigate Climate
Change in the Ministry of Environment in Peru. He has authored
and co-authored over 20 technical papers.
Dr. Hector Cisneros
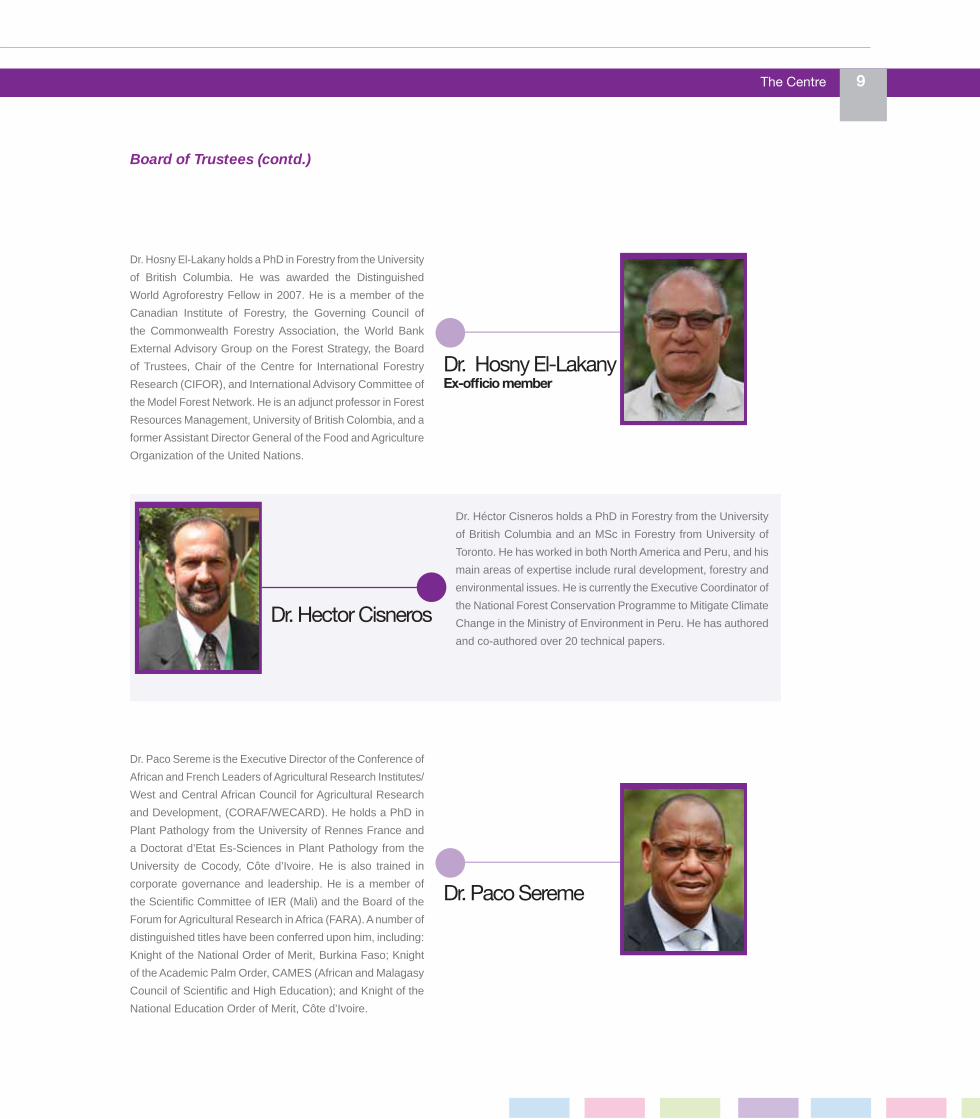
Dr. Hosny El-Lakany holds a PhD in Forestry from the University
of British Columbia. He was awarded the Distinguished
World Agroforestry Fellow in 2007. He is a member of the
Canadian Institute of Forestry, the Governing Council of
the Commonwealth Forestry Association, the World Bank
External Advisory Group on the Forest Strategy, the Board
of Trustees, Chair of the Centre for International Forestry
Research (CIFOR), and International Advisory Committee of
the Model Forest Network. He is an adjunct professor in Forest
Resources Management, University of British Colombia, and a
former Assistant Director General of the Food and Agriculture
Organization of the United Nations.
Dr. Paco Sereme is the Executive Director of the Conference of
African and French Leaders of Agricultural Research Institutes/
West and Central African Council for Agricultural Research
and Development, (CORAF/WECARD). He holds a PhD in
Plant Pathology from the University of Rennes France and
a Doctorat d’Etat Es-Sciences in Plant Pathology from the
University de Cocody, Côte d’Ivoire. He is also trained in
corporate governance and leadership. He is a member of
the Scientifi c Committee of IER (Mali) and the Board of the
Forum for Agricultural Research in Africa (FARA). A number of
distinguished titles have been conferred upon him, including:
Knight of the National Order of Merit, Burkina Faso; Knight
of the Academic Palm Order, CAMES (African and Malagasy
Council of Scientifi c and High Education); and Knight of the
National Education Order of Merit, Côte d’Ivoire.
Dr. Hosny El-LakanyEx-offi cio member
Dr. Paco Sereme
Board of Trustees (contd.)
10 World Agroforestry Centre
Board of Trustees (contd.)
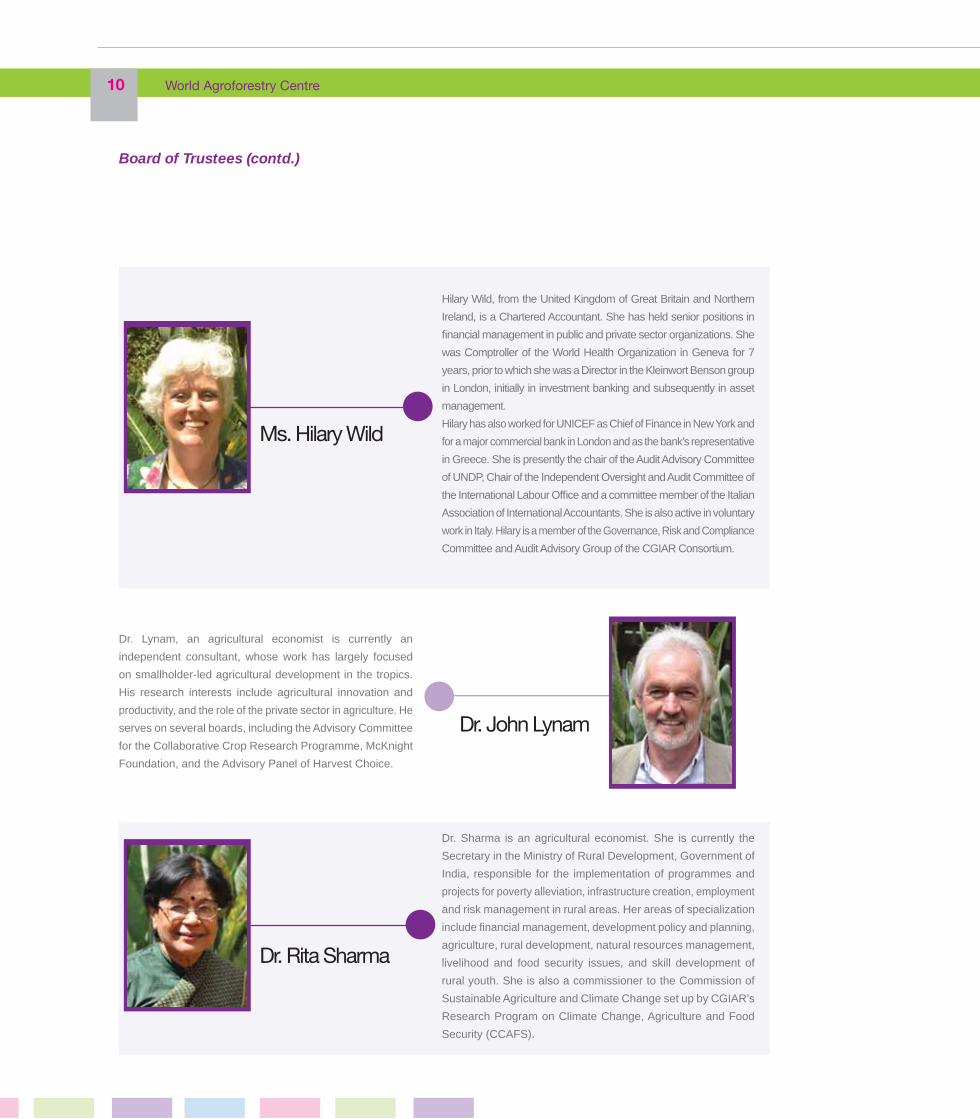
Hilary Wild, from the United Kingdom of Great Britain and Northern
Ireland, is a Chartered Accountant. She has held senior positions in
fi nancial management in public and private sector organizations. She
was Comptroller of the World Health Organization in Geneva for 7
years, prior to which she was a Director in the Kleinwort Benson group
in London, initially in investment banking and subsequently in asset
management.
Hilary has also worked for UNICEF as Chief of Finance in New York and
for a major commercial bank in London and as the bank’s representative
in Greece. She is presently the chair of the Audit Advisory Committee
of UNDP, Chair of the Independent Oversight and Audit Committee of
the International Labour Offi ce and a committee member of the Italian
Association of International Accountants. She is also active in voluntary
work in Italy. Hilary is a member of the Governance, Risk and Compliance
Committee and Audit Advisory Group of the CGIAR Consortium.
Ms. Hilary Wild
Dr. Lynam, an agricultural economist is currently an
independent consultant, whose work has largely focused
on smallholder-led agricultural development in the tropics.
His research interests include agricultural innovation and
productivity, and the role of the private sector in agriculture. He
serves on several boards, including the Advisory Committee
for the Collaborative Crop Research Programme, McKnight
Foundation, and the Advisory Panel of Harvest Choice.
Dr. John Lynam
Dr. Sharma is an agricultural economist. She is currently the
Secretary in the Ministry of Rural Development, Government of
India, responsible for the implementation of programmes and
projects for poverty alleviation, infrastructure creation, employment
and risk management in rural areas. Her areas of specialization
include fi nancial management, development policy and planning,
agriculture, rural development, natural resources management,
livelihood and food security issues, and skill development of
rural youth. She is also a commissioner to the Commission of
Sustainable Agriculture and Climate Change set up by CGIAR’s
Research Program on Climate Change, Agriculture and Food
Security (CCAFS).
Dr. Rita Sharma

The Centre 11
John Hudson is a forester with many years of experience in
international development from around the world. He was
Senior Forestry Adviser at the UK’s Department for International
Development until 2010. He is Chair of the Board of Directors of
the Rights and Resources Initiative, Vice Chair of CIFOR’s Board
of Trustees, Trustee of the Commonwealth Forestry Association
and a member of the Programme Committee of WWF-UK.Mr. John HudsonEx-offi cio member
Prof. Olavi Luukkanen holds a DSc (Agriculture & Forestry)
degree in silviculture and separate MSc degrees in Forestry
and Genetics from the University of Helsinki, as well as an
MSc in Forestry/Tree Physiology from the University of
Wisconsin, USA. Since 1984, he has worked as professor
of tropical silviculture at the University of Helsinki, where
he is the director of the Viikki Tropical Resources Institute
(VITRI). With more than 30 years of forest-related experience,
he is a senior advisor on forestry and agroforestry for the
International Foundation for Science (IFS), and has also
served as the president of the Finnish Society for Forest
Science, and the chairman of the European Tropical Forest
Research Network (ETFRN).
Prof. Olavi Luukkanen
Board of Trustees (contd.)

12 World Agroforestry Centre
SENIOR LEADERSHIP TEAM
Prof. Tony Simons holds a PhD in
Botany from Cambridge University,
United Kingdom. He has worked with
the World Agroforestry Centre since
1995 in different roles. He was appointed
Director General in 2011. He is a Board
member of Plant Resources of Tropical
Africa (PROTA) and the African Centre
for Technology Studies (ACTS), and
a member of the Panel of Experts of
Forest Genetic Resources.
Mr. Abeysekera joined the World
Agroforestry Centre in August 1998. He is
a fellow member of the Chartered Institute
of Management Accountants. He is
responsible for treasury and accounting,
budgeting functions and systems, and
formulation and implementation of
fi nancial strategies and policies. He
assists the Director General in macro
fi nancial planning, fi nancial analysis,
investments, and budgetary control, and
provides fi nancial advice to the Senior
Leadership Team, the Director General
and the Board of Trustees.
Prof. Temu joined the World Agroforestry Centre in 1992. He has a PhD in
Forest Resource Assessment and Management from the University of Dar es
Salaam in Tanzania and University of California, Berkeley. He is responsible
for the overall vision, strategy and management of partnerships at the Centre.
He has written extensively on forestry, agricultural and natural resources
education and research. In 2000, he was admitted as an International Fellow
of the Swedish Academy of Agriculture and Forestry. He also serves as the
Secretary to the Board of Trustees.
Prof. Tony SimonsLaksiri Abeysekera
Prof. August Temu
Director GeneralDeputy Director General- Finance and Corporate
Services
Deputy Director General- Partnerships, Regions and Impact
The Centre 13
Senior Leadership Team (contd.)
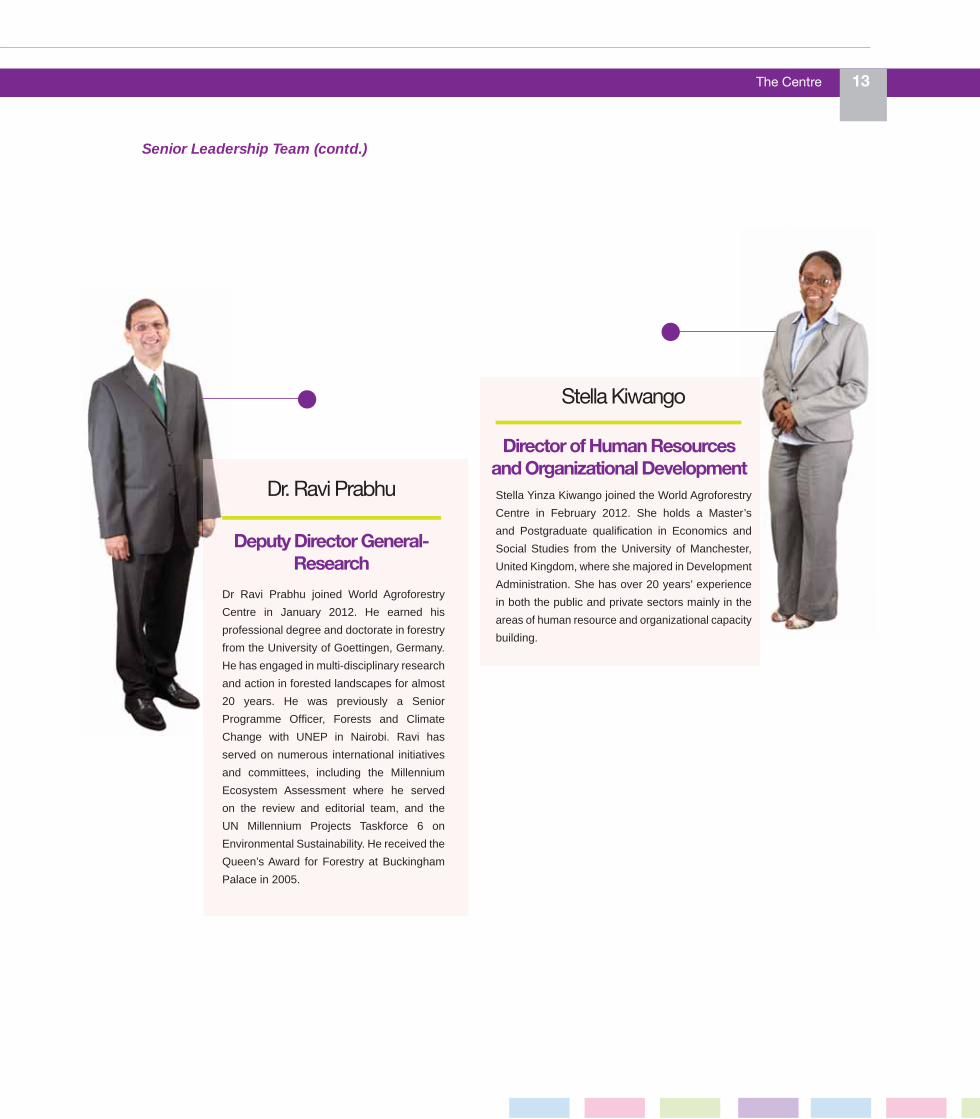
Dr Ravi Prabhu joined World Agroforestry
Centre in January 2012. He earned his
professional degree and doctorate in forestry
from the University of Goettingen, Germany.
He has engaged in multi-disciplinary research
and action in forested landscapes for almost
20 years. He was previously a Senior
Programme Offi cer, Forests and Climate
Change with UNEP in Nairobi. Ravi has
served on numerous international initiatives
and committees, including the Millennium
Ecosystem Assessment where he served
on the review and editorial team, and the
UN Millennium Projects Taskforce 6 on
Environmental Sustainability. He received the
Queen’s Award for Forestry at Buckingham
Palace in 2005.
Stella Yinza Kiwango joined the World Agroforestry
Centre in February 2012. She holds a Master’s
and Postgraduate qualifi cation in Economics and
Social Studies from the University of Manchester,
United Kingdom, where she majored in Development
Administration. She has over 20 years’ experience
in both the public and private sectors mainly in the
areas of human resource and organizational capacity
building.
Dr. Ravi Prabhu
Stella Kiwango
Deputy Director General- Research
Director of Human Resources and Organizational Development
The Centre 15
At the World Agroforestry Centre (ICRAF), the Board of Trustees and Senior Leadership Team are committed to the highest level of corporate governance, which is considered critical to the achievement of the work done by the Centre. ICRAF is part of the Consortium of the Consultative Group on International Agricultural Research (CGIAR), which operates globally with the aim of reducing rural poverty, increasing food security, improving health and nutrition and ensuring more sustainable management of natural resources.
Board Organization and Structure
The World Agroforestry Centre’s Charter provides for the Board of Trustees (BoT) as the governing body. The
BoT’s fundamental responsibility is to ensure the Centre has the required resources to achieve its mission and vision with the highest level of honesty, integrity and ethical standards. The current BoT constitutes a diverse pool of skills in the areas of agroforestry science, environmental management, business management and economics, amongst other areas.
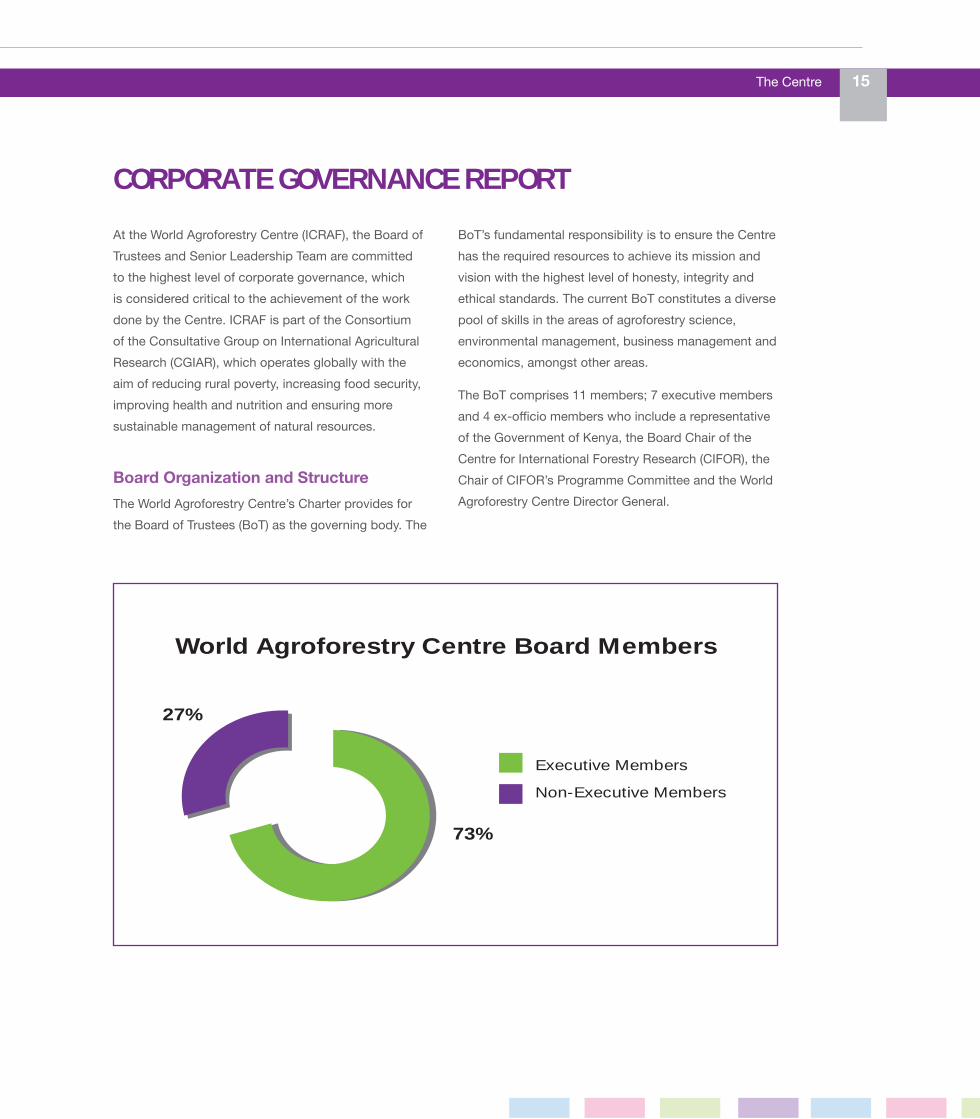
The BoT comprises 11 members; 7 executive members and 4 ex-offi cio members who include a representative of the Government of Kenya, the Board Chair of the Centre for International Forestry Research (CIFOR), the Chair of CIFOR’s Programme Committee and the World Agroforestry Centre Director General.
CORPORATE GOVERNANCE REPORT
73%
Executive Members
Non-Executive Members
27%
World Agroforestry Centre Board Members
16 World Agroforestry Centre
The Role of the Board
The Board of Trustees’ primary mandate is to lay down policies and monitor management action. In order to do this eff ectively, the Board has delegated the day-to-day management of the Centre to the Director General who is assisted by the Senior Leadership Team (SLT).
The Board of Trustees is responsible for approving the Centre’s Strategy and the Annual Programme of Work and Budget (POWB). The Board also monitors the Centre’s progress towards achieving its objectives; ensures fi nancial integrity and accountability; provides oversight of investments and disposal of major assets; approves personnel policies; and monitors the legal implications of the Centre’s activities, and the performance of the Board as a whole and that of its individual members.
The Board’s duties and responsibilities as listed in the Centre’s Charter are to:
1. Select and appoint (or dismiss) the Director General and set his or her terms of employment.
2. Endorse the appointment of director-level staff upon the recommendation of the Director General.
3. Approve personnel policies, salary scales and benefi ts of the Centre’s employees.
4. Actively participate in the development of the Centre’s strategy and medium-term plans.
5. Review and approve the annual programme of work and budget.
6. Monitor the Centre’s progress towards the achievement of its objectives through systematic internal reviews and interact directly with external programme and management review panels.
7. Ensure that the Centre’s fi nancial integrity and accountability is upheld, appoint external auditors, and approve the audited annual fi nancial statements.
8. Exercise oversight of investments, acquisition of facilities and equipment and disposal of major assets.
9. Identify and elect new Board members and orient them on the operations of the Centre.
10. Monitor and evaluate the performance of its members to ensure that the Board is accountable for prudence and diligence in the performance of its functions.
Corporate Governance Report (contd.)
The Centre 17
Activities of the Board
The Board meets twice a year, in April and November. It is the responsibility of the Board Secretary to organize the meetings, ensure proper documentation of the Board business and support the Board Chair and other members. The Board of Trustees also works closely with specially formulated Board Committees which ensure effi cient and eff ective implementation of Board business.
Each Committee has formal written terms of reference that are approved and periodi cally reviewed by the Board. All Committee members are Trustees, and the Centre’s Direc tor General is an ex-offi cio member of some of the Committees. Director-level staff serve as resource persons for the Committee to which their responsibility most closely relates.
The Functions and Composition of the Board
Committees
1. The Executive Committee
It comprises the Chair and the Vice-Chair of the Board, and the Chairs of all the Board standing Committees. The Director General is an ex-offi cio member.
The main functions of this committee are to set up general management policies for the Centre; to carry out an overview of the management and fi nancial practices of the Centre; and to submit its report and recommendations to the Board of Trustees for endorsement. This committee meets twice annually.
2. Finance and Audit Committee
This Committee has at least three members of the Board. Its major function is to assist the Centre’s Board of Trustees in fulfi lling its oversight responsibilities for the fi nancial reporting process, the system of risk management and internal
control, the audit process, as well as the Centre’s process for monitoring compliance with laws and regulations and the code of conduct. This Committee meets annually.
3. The Programme Committee
Its mandate is to review the current and future programme of work for the Centre, in consultation with the Director General, director-level staff and other staff members nominated by the Director General, and to report its fi ndings to the Board. This team meets at least annually.
4. The Operations Committee
It assists the Board of Trustees in reviewing the effi ciency and eff ectiveness of the Centre’s operational functions. This includes matters related to human resources, transport, information and communications technology, building expansion, safety and security. This team meets at least annually.
5. Nominations Committee
The major responsibility of this Committee is to monitor tenure of membership of serving Trustees and to develop and maintain a roster of potential Board members.
6. Resource Mobilization Committee
As the name suggests, the responsibility of this Committee is to mobilize resources (both human and fi nancial) for implementing the Centre’s science agenda.
7. Ad Hoc Committee on Agroforestry Policy Initiative (API)
This committee works to contribute to the strategic development of the API, provide guidance on external opportunities for enhancing impact and provide guidance on how to internally position the API so as to enhance synergies with other units.
Corporate Governance Report (contd.)

18 World Agroforestry Centre
The following table indicates Committee membership of the Board members and meeting attendance in 2012. Where directors are not able to attend particular meetings, comments and issues arising from specifi c topics of discussion are usually relayed in advance to the Chairman of the Committee, with relevant papers or information for consideration.
Name Professional Expertise
Board Position
Committee Designation Executive Nominations Finance
and Audit Operations Resource Mobilization Programme
Agroforestry policy initiate
Eric TollensAgronomy and Agricultural Economist
Executive Member
Executive Committee 2/2 2/2 1/1 2/2 1/1
Olavi Luukkanen Forestry and Agriculture
Executive Member
Programme Committee Chair 2/2 1/2 2/2 1/1 2/2
John Hudson ForestryNon-Executive Member
1/2 1/2 1/2 1/2
John Lynam Agricultural Economics
Executive Member
Agroforestry Policy Initiative Committee Chair and Resource Mobilization Committee Chair
2/2 2/2 2/2 1/1 2/2 1/1
Paco Sereme Plant Pathology and Agronomy
Executive Member
Operations Committee Chair 2/2 2/2 2/2
Rita Sharma Agricultural Economics
Executive Member
Nominations Committee Chair 1/2 1/2 2/2 1/1 1/2 1/1
Hilary Wild Finance Executive Member
Finance & Audit Committee Chair 2/2 2/2 2/2 1/1 2/2
Hector Cisneros Forestry Executive Member 2/2 2/2 2/2 1/1
Hosny El-Lakany Forestry and Agriculture
Non-Executive Member
2/2 1/2 2/2 1/2 2/2
Romano Kiome Agronomy and Soil Science
Non-Executive Member
2/2 0/2 0/2
Tony Simons BotanyNon-Executive Member
2/2 2/2 1/1 2/2 1/1
Corporate Governance Report (contd.)
The Centre 19
CORPORATE SOCIAL RESPONSIBILITY
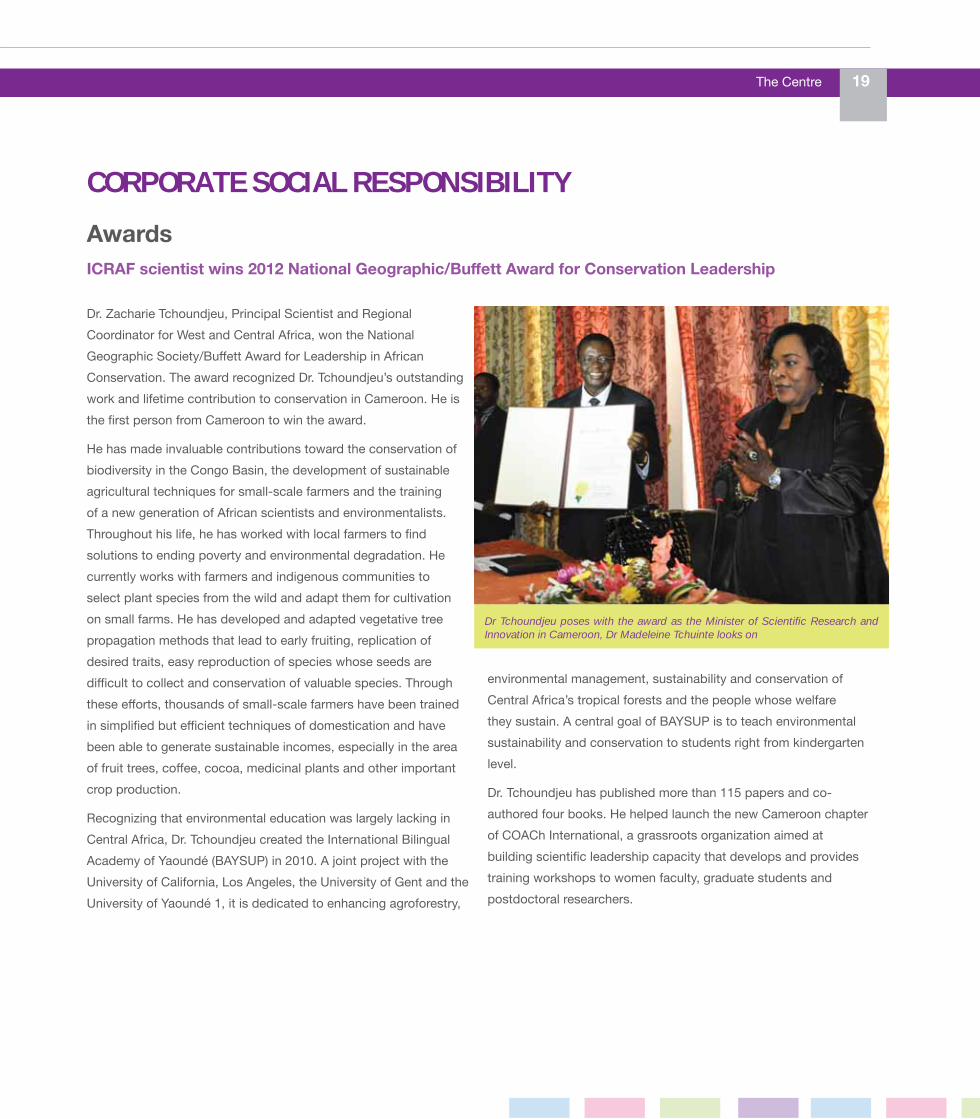
Dr. Zacharie Tchoundjeu, Principal Scientist and Regional Coordinator for West and Central Africa, won the National Geographic Society/Buff ett Award for Leadership in African Conservation. The award recognized Dr. Tchoundjeu’s outstanding work and lifetime contribution to conservation in Cameroon. He is the fi rst person from Cameroon to win the award.
He has made invaluable contributions toward the conservation of biodiversity in the Congo Basin, the development of sustainable agricultural techniques for small-scale farmers and the training of a new generation of African scientists and environmentalists. Throughout his life, he has worked with local farmers to fi nd solutions to ending poverty and environmental degradation. He currently works with farmers and indigenous communities to select plant species from the wild and adapt them for cultivation on small farms. He has developed and adapted vegetative tree propagation methods that lead to early fruiting, replication of desired traits, easy reproduction of species whose seeds are diffi cult to collect and conservation of valuable species. Through these eff orts, thousands of small-scale farmers have been trained in simplifi ed but effi cient techniques of domestication and have been able to generate sustainable incomes, especially in the area of fruit trees, coff ee, cocoa, medicinal plants and other important crop production.
Recognizing that environmental education was largely lacking in Central Africa, Dr. Tchoundjeu created the International Bilingual Academy of Yaoundé (BAYSUP) in 2010. A joint project with the University of California, Los Angeles, the University of Gent and the University of Yaoundé 1, it is dedicated to enhancing agroforestry,
environmental management, sustainability and conservation of Central Africa’s tropical forests and the people whose welfare they sustain. A central goal of BAYSUP is to teach environmental sustainability and conservation to students right from kindergarten level.
Dr. Tchoundjeu has published more than 115 papers and co-authored four books. He helped launch the new Cameroon chapter of COACh International, a grassroots organization aimed at building scientifi c leadership capacity that develops and provides training workshops to women faculty, graduate students and postdoctoral researchers.
Dr Tchoundjeu poses with the award as the Minister of Scientifi c Research and Innovation in Cameroon, Dr Madeleine Tchuinte looks on
AwardsICRAF scientist wins 2012 National Geographic/Buff ett Award for Conservation Leadership
20 World Agroforestry Centre
Reaching out to the communityKenya
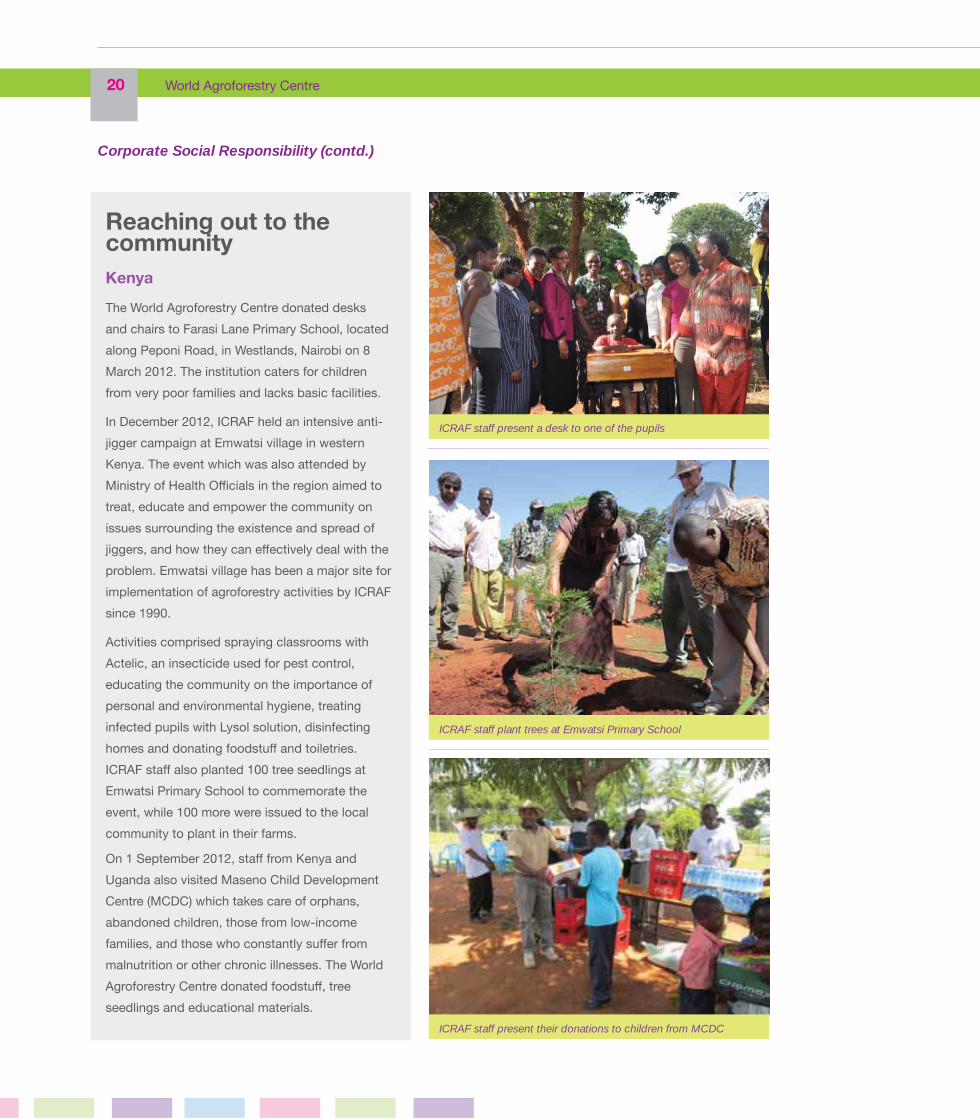
The World Agroforestry Centre donated desks and chairs to Farasi Lane Primary School, located along Peponi Road, in Westlands, Nairobi on 8 March 2012. The institution caters for children from very poor families and lacks basic facilities.
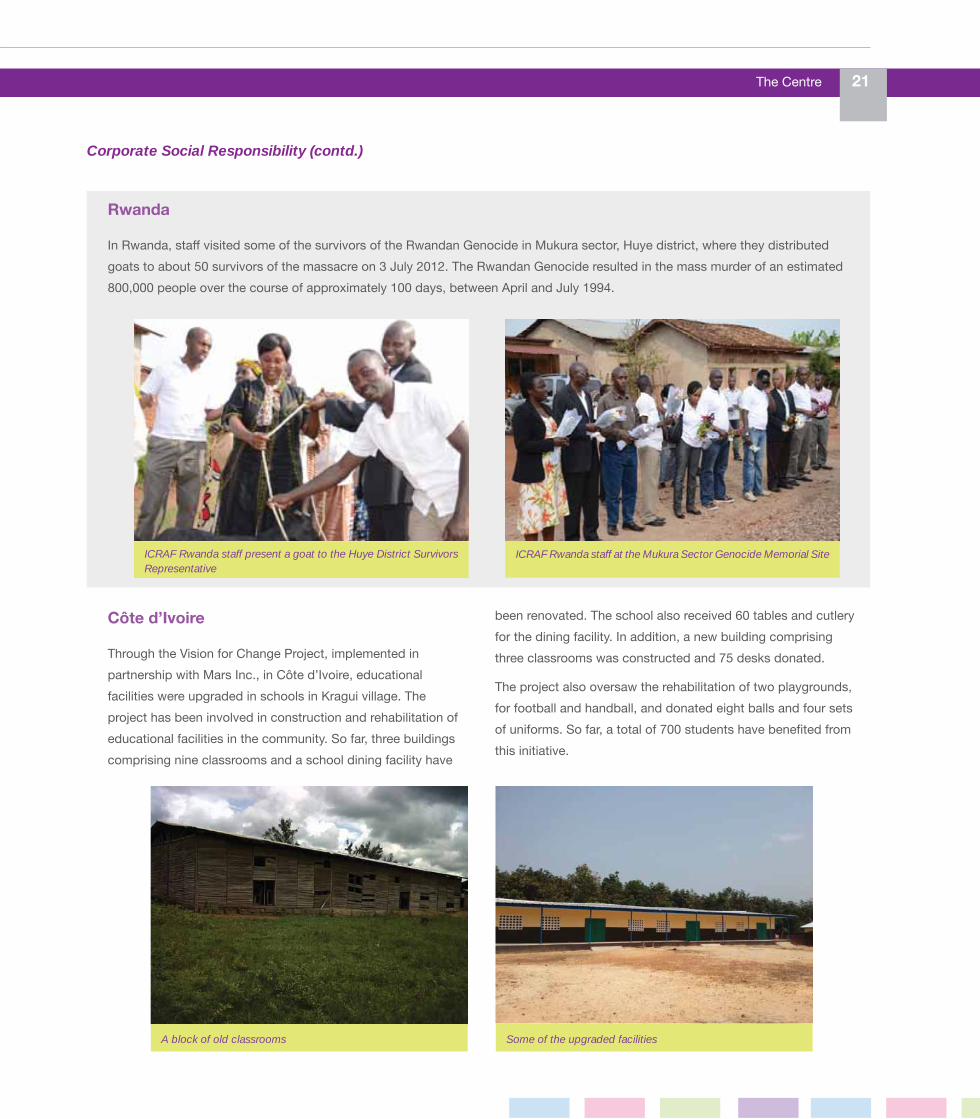
In December 2012, ICRAF held an intensive anti-jigger campaign at Emwatsi village in western Kenya. The event which was also attended by Ministry of Health Offi cials in the region aimed to treat, educate and empower the community on issues surrounding the existence and spread of jiggers, and how they can eff ectively deal with the problem. Emwatsi village has been a major site for implementation of agroforestry activities by ICRAF since 1990.
Activities comprised spraying classrooms with Actelic, an insecticide used for pest control, educating the community on the importance of personal and environmental hygiene, treating infected pupils with Lysol solution, disinfecting homes and donating foodstuff and toiletries. ICRAF staff also planted 100 tree seedlings at Emwatsi Primary School to commemorate the event, while 100 more were issued to the local community to plant in their farms.
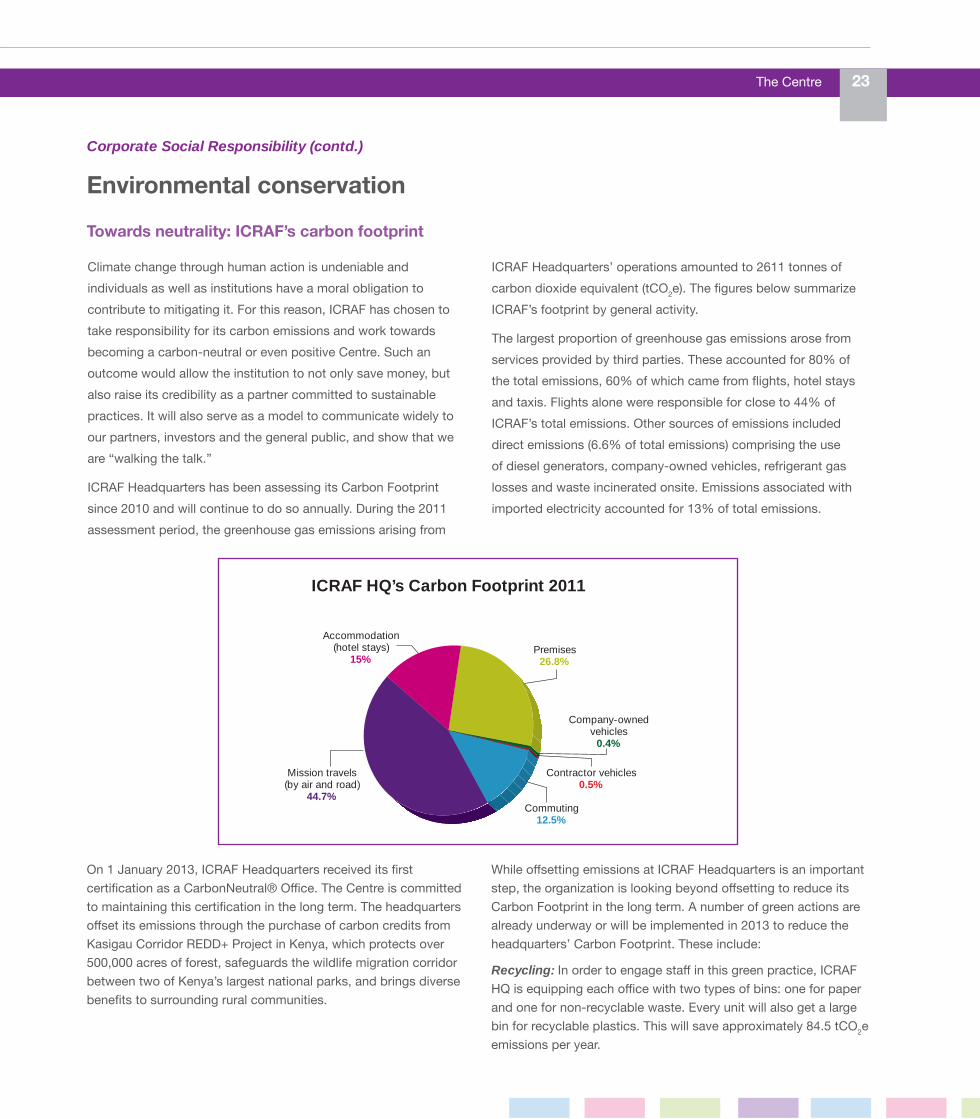
On 1 September 2012, staff from Kenya and Uganda also visited Maseno Child Development Centre (MCDC) which takes care of orphans, abandoned children, those from low-income families, and those who constantly suff er from malnutrition or other chronic illnesses. The World Agroforestry Centre donated foodstuff , tree seedlings and educational materials.
ICRAF staff plant trees at Emwatsi Primary School
ICRAF staff present a desk to one of the pupils
ICRAF staff present their donations to children from MCDC
Corporate Social Responsibility (contd.)
The Centre 21
Rwanda
In Rwanda, staff visited some of the survivors of the Rwandan Genocide in Mukura sector, Huye district, where they distributed goats to about 50 survivors of the massacre on 3 July 2012. The Rwandan Genocide resulted in the mass murder of an estimated 800,000 people over the course of approximately 100 days, between April and July 1994.
Côte d’Ivoire
Through the Vision for Change Project, implemented in partnership with Mars Inc., in Côte d’Ivoire, educational facilities were upgraded in schools in Kragui village. The project has been involved in construction and rehabilitation of educational facilities in the community. So far, three buildings comprising nine classrooms and a school dining facility have
been renovated. The school also received 60 tables and cutlery for the dining facility. In addition, a new building comprising three classrooms was constructed and 75 desks donated.
The project also oversaw the rehabilitation of two playgrounds, for football and handball, and donated eight balls and four sets of uniforms. So far, a total of 700 students have benefi ted from this initiative.
ICRAF Rwanda staff at the Mukura Sector Genocide Memorial Site
A block of old classrooms Some of the upgraded facilities
ICRAF Rwanda staff present a goat to the Huye District Survivors Representative
Corporate Social Responsibility (contd.)

22 World Agroforestry Centre
In 2012, torrential rains brought by the southwest monsoon caused fl ooding in various parts of the Philippines. Flood victims were forced to stay in “Tent City”—the temporary home for evacuees in the village of Tadlac, Los Banos, Laguna. The houses of village residents near Laguna Lake were submerged in waist-deep fl oodwaters and some of them were severely damaged, forcing hundreds of families to remain in evacuation. Living in donated tents and makeshift housing, these families were dependent on relief assistance from the local government and volunteer organizations.
On 7 September 2012, ICRAF staff held a feeding programme for more than 1,000 evacuees in Tadlac Tent City. Hot porridge and bread was served early in the morning, mostly to women and children, including students on their way to school. Donations in kind such as canned food, clothes and blankets were also collected in partnership with the International Rice Research Institute (IRRI) Host Country and Community Relations Offi ce. The donations were turned over to the Municipal Disaster and Risk Reduction and Management Council for distribution to fl ood victims.
Philippines
Some of the children pose with development workers One of the temporary shelters
Corporate Social Responsibility (contd.)
The Centre 23
Climate change through human action is undeniable and individuals as well as institutions have a moral obligation to contribute to mitigating it. For this reason, ICRAF has chosen to take responsibility for its carbon emissions and work towards becoming a carbon-neutral or even positive Centre. Such an outcome would allow the institution to not only save money, but also raise its credibility as a partner committed to sustainable practices. It will also serve as a model to communicate widely to our partners, investors and the general public, and show that we are “walking the talk.”
ICRAF Headquarters has been assessing its Carbon Footprint since 2010 and will continue to do so annually. During the 2011 assessment period, the greenhouse gas emissions arising from
ICRAF Headquarters’ operations amounted to 2611 tonnes of carbon dioxide equivalent (tCO2e). The fi gures below summarize ICRAF’s footprint by general activity.
The largest proportion of greenhouse gas emissions arose from services provided by third parties. These accounted for 80% of the total emissions, 60% of which came from fl ights, hotel stays and taxis. Flights alone were responsible for close to 44% of ICRAF’s total emissions. Other sources of emissions included direct emissions (6.6% of total emissions) comprising the use of diesel generators, company-owned vehicles, refrigerant gas losses and waste incinerated onsite. Emissions associated with imported electricity accounted for 13% of total emissions.
Environmental conservation
Accommodation(hotel stays)
15%
Mission travels(by air and road)
44.7%Commuting
12.5%
Contractor vehicles0.5%
Company-ownedvehicles
0.4%
Premises26.8%
ICRAF HQ’s Carbon Footprint 2011
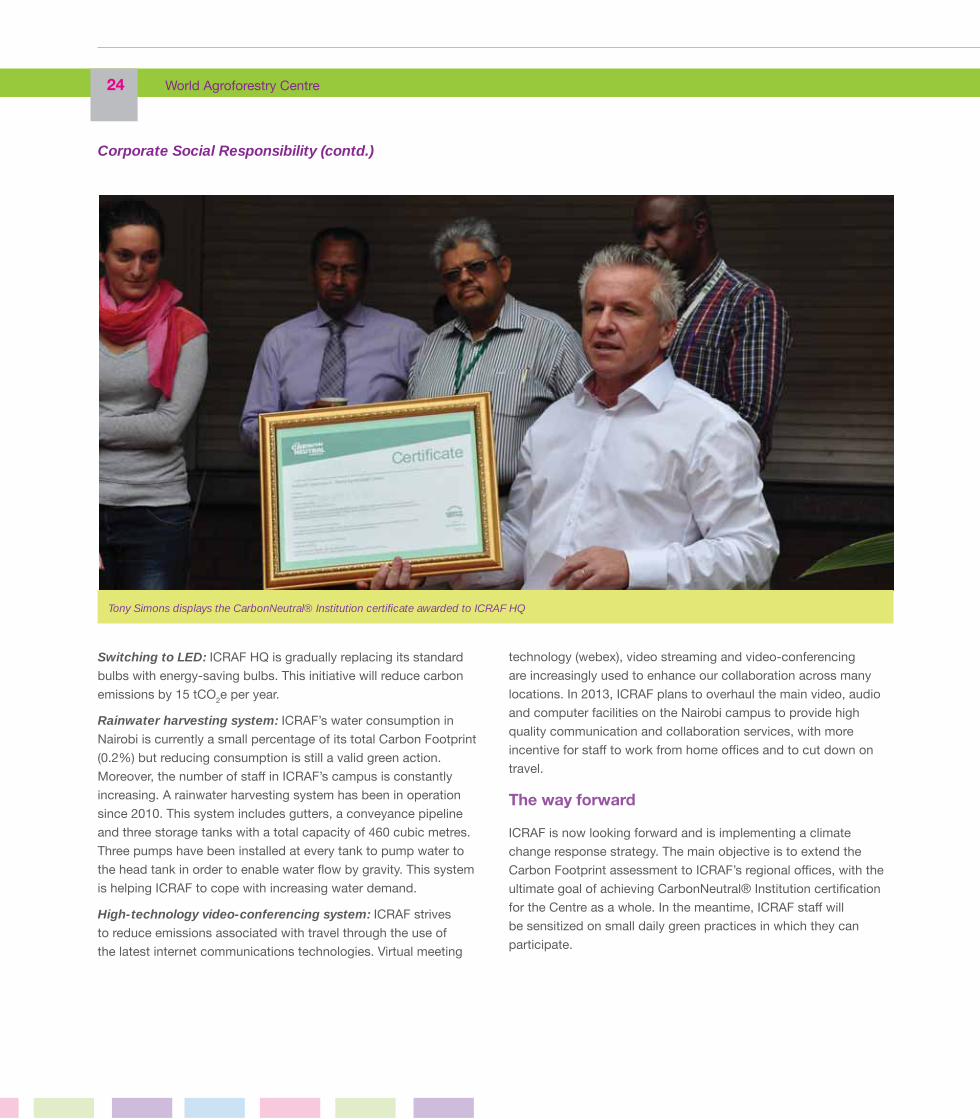
On 1 January 2013, ICRAF Headquarters received its fi rst certifi cation as a CarbonNeutral® Offi ce. The Centre is committed to maintaining this certifi cation in the long term. The headquarters off set its emissions through the purchase of carbon credits from Kasigau Corridor REDD+ Project in Kenya, which protects over 500,000 acres of forest, safeguards the wildlife migration corridor between two of Kenya’s largest national parks, and brings diverse benefi ts to surrounding rural communities.
While off setting emissions at ICRAF Headquarters is an important step, the organization is looking beyond off setting to reduce its Carbon Footprint in the long term. A number of green actions are already underway or will be implemented in 2013 to reduce the headquarters’ Carbon Footprint. These include:
Recycling: In order to engage staff in this green practice, ICRAF HQ is equipping each offi ce with two types of bins: one for paper and one for non-recyclable waste. Every unit will also get a large bin for recyclable plastics. This will save approximately 84.5 tCO2e emissions per year.
Towards neutrality: ICRAF’s carbon footprint
Corporate Social Responsibility (contd.)
24 World Agroforestry Centre
Switching to LED: ICRAF HQ is gradually replacing its standard bulbs with energy-saving bulbs. This initiative will reduce carbon emissions by 15 tCO2e per year.
Rainwater harvesting system: ICRAF’s water consumption in Nairobi is currently a small percentage of its total Carbon Footprint (0.2%) but reducing consumption is still a valid green action. Moreover, the number of staff in ICRAF’s campus is constantly increasing. A rainwater harvesting system has been in operation since 2010. This system includes gutters, a conveyance pipeline and three storage tanks with a total capacity of 460 cubic metres. Three pumps have been installed at every tank to pump water to the head tank in order to enable water fl ow by gravity. This system is helping ICRAF to cope with increasing water demand.
High-technology video-conferencing system: ICRAF strives to reduce emissions associated with travel through the use of the latest internet communications technologies. Virtual meeting
technology (webex), video streaming and video-conferencing are increasingly used to enhance our collaboration across many locations. In 2013, ICRAF plans to overhaul the main video, audio and computer facilities on the Nairobi campus to provide high quality communication and collaboration services, with more incentive for staff to work from home offi ces and to cut down on travel.
The way forward
ICRAF is now looking forward and is implementing a climate change response strategy. The main objective is to extend the Carbon Footprint assessment to ICRAF’s regional offi ces, with the ultimate goal of achieving CarbonNeutral® Institution certifi cation for the Centre as a whole. In the meantime, ICRAF staff will be sensitized on small daily green practices in which they can participate.
Tony Simons displays the CarbonNeutral® Institution certifi cate awarded to ICRAF HQ
Corporate Social Responsibility (contd.)
The Centre 25
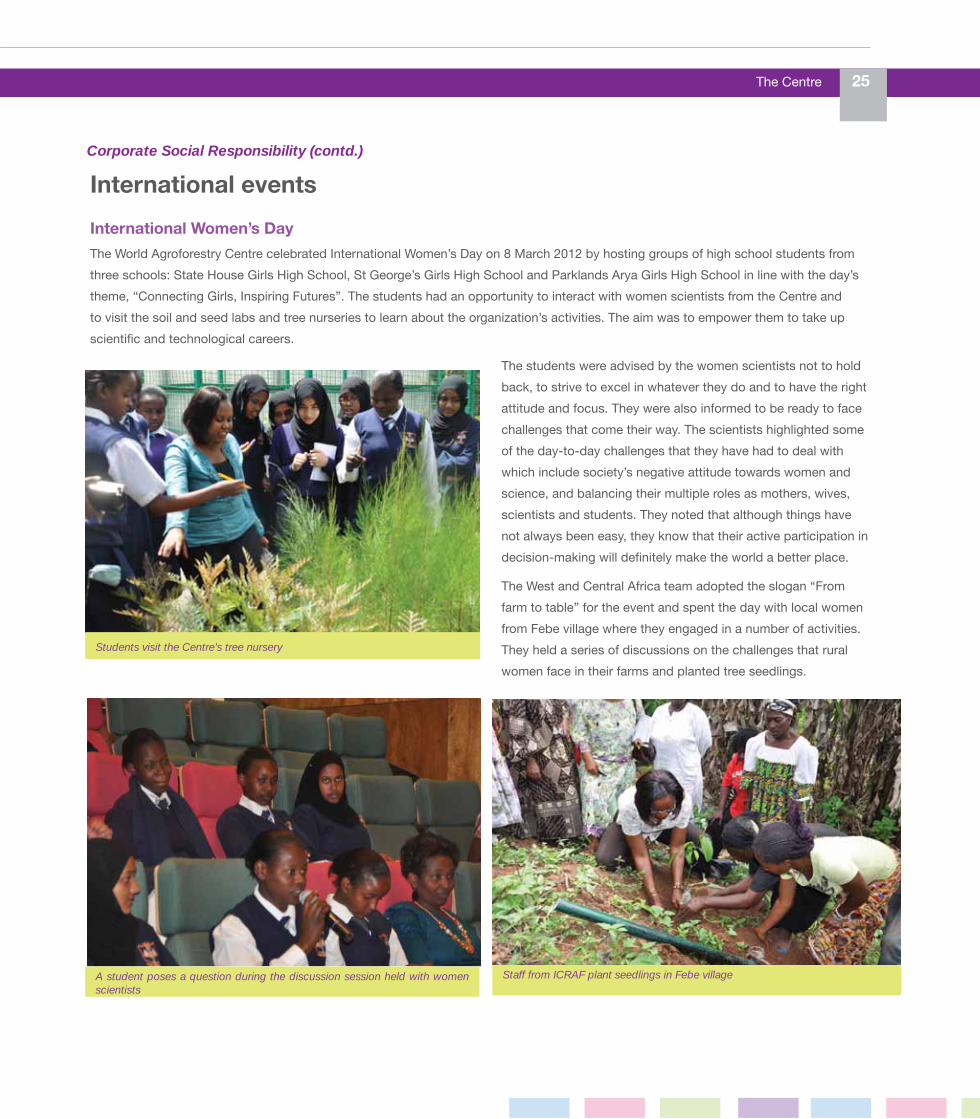
The World Agroforestry Centre celebrated International Women’s Day on 8 March 2012 by hosting groups of high school students from three schools: State House Girls High School, St George’s Girls High School and Parklands Arya Girls High School in line with the day’s theme, “Connecting Girls, Inspiring Futures”. The students had an opportunity to interact with women scientists from the Centre and to visit the soil and seed labs and tree nurseries to learn about the organization’s activities. The aim was to empower them to take up scientifi c and technological careers.
International events
International Women’s Day
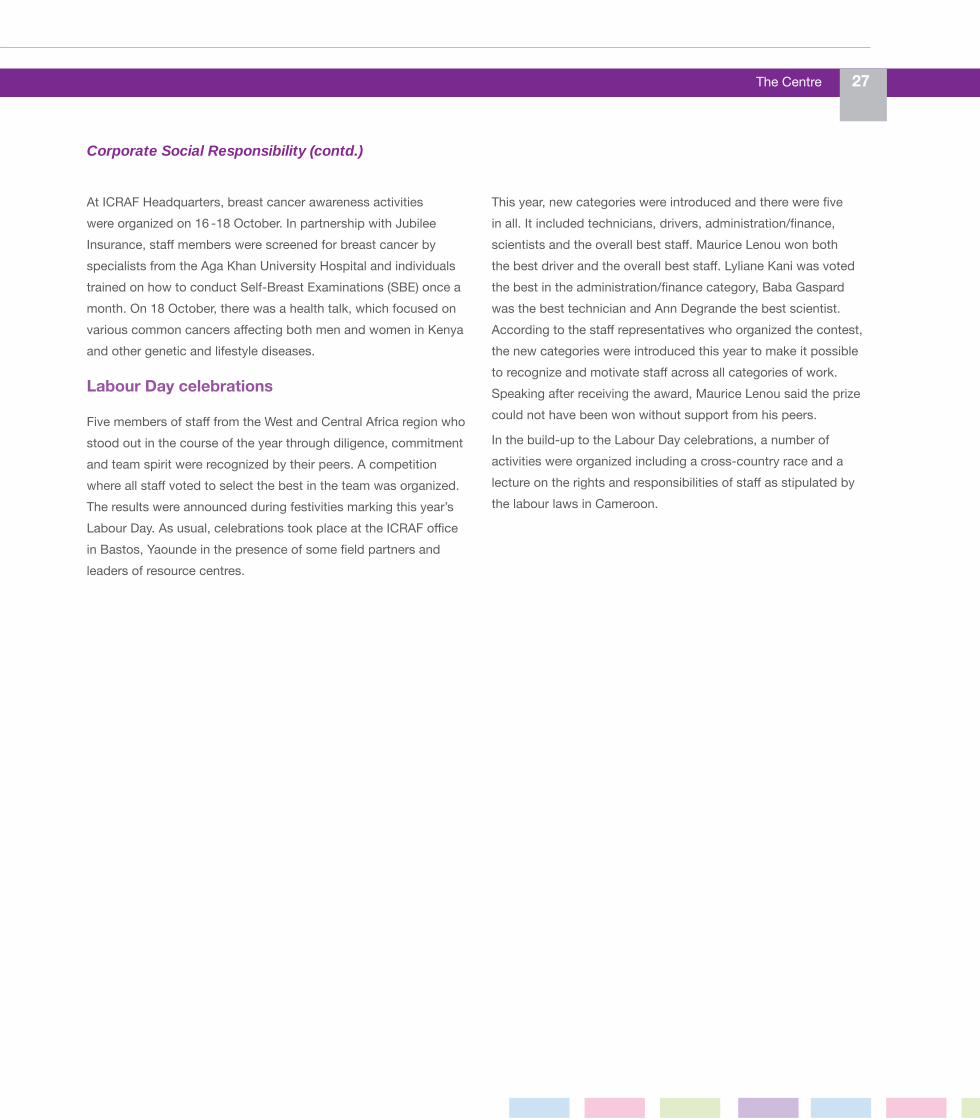
The students were advised by the women scientists not to hold back, to strive to excel in whatever they do and to have the right attitude and focus. They were also informed to be ready to face challenges that come their way. The scientists highlighted some of the day-to-day challenges that they have had to deal with which include society’s negative attitude towards women and science, and balancing their multiple roles as mothers, wives, scientists and students. They noted that although things have not always been easy, they know that their active participation in decision-making will defi nitely make the world a better place.
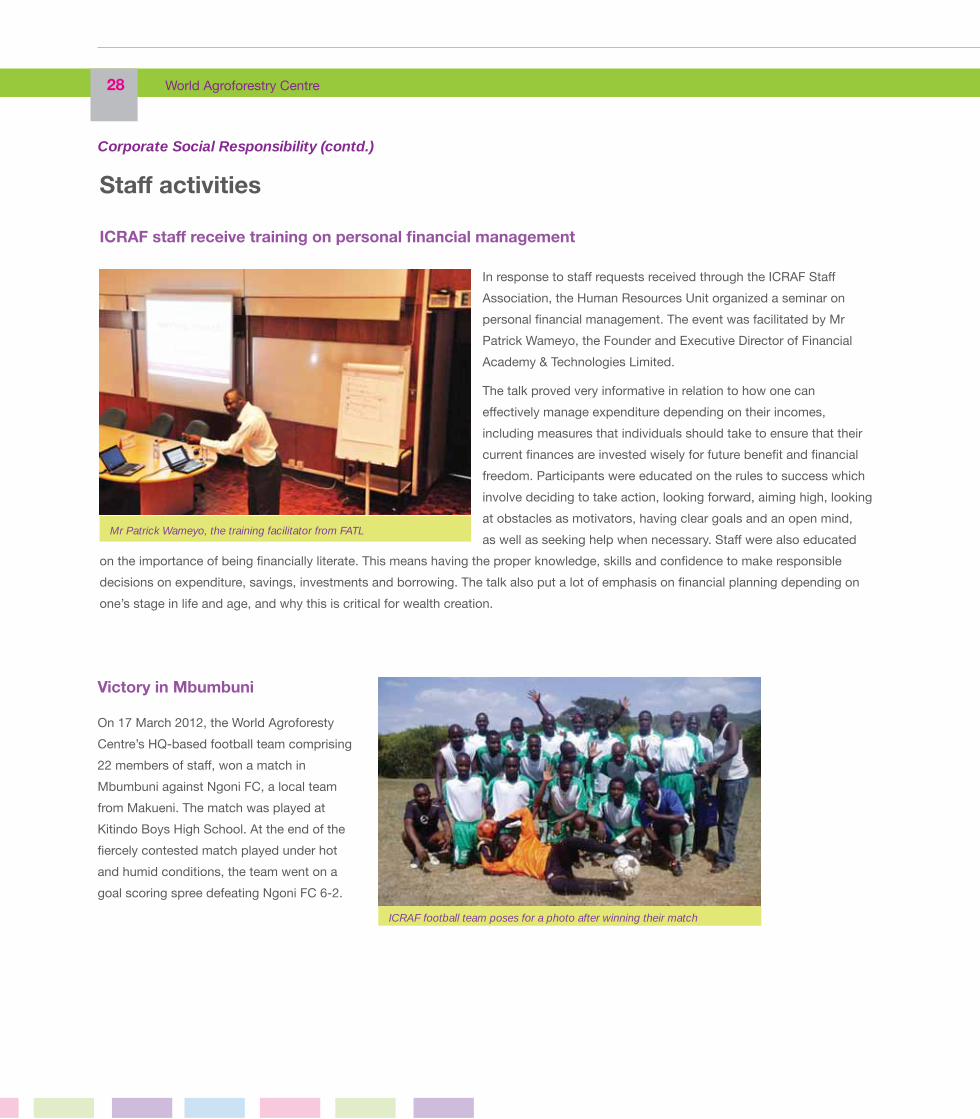
The West and Central Africa team adopted the slogan “From farm to table” for the event and spent the day with local women from Febe village where they engaged in a number of activities. They held a series of discussions on the challenges that rural women face in their farms and planted tree seedlings.
Students visit the Centre’s tree nursery
A student poses a question during the discussion session held with women scientists
Staff from ICRAF plant seedlings in Febe village
Corporate Social Responsibility (contd.)

26 World Agroforestry Centre
Stella Kiwango receives pre-test counselling
Stanley Ngara, an HIV/AIDS counsellor, addressing ICRAF staff
World AIDS Day
World AIDS Day, commemorated on 1 December, brings together people from around the world to raise awareness about HIV/AIDS and demonstrate international solidarity in the face of the pandemic. The theme for the 2012 World AIDS Day was “Getting to Zero: Zero new HIV infections. Zero discrimination. Zero AIDS-related deaths”. To mark the day, ICRAF Headquarters organized a Voluntary Counselling and Testing (VCT) camp on campus from 28-30 November 2012.
In Cameroon, a one-day seminar for all staff was organized. The day began with a welcome speech from the Regional Coordinator for ICRAF West and Central Dr. Zac Tchoundjeu. This was followed by a presentation by Mme Ymele Berthe Yemefack, a social aff airs specialist in charge of guidance and counselling both the infected and aff ected persons. The staff then had an opportunity to listen to a testimony from an HIV-positive patient who has been infected since 2000 and has given birth to two children who are HIV free with an HIV negative husband. After this they held discussions and covered topics such as how the virus spreads, symptoms, prevention and management.
The month of October has globally been recognized as the Breast Cancer Awareness Month. It was fi rst celebrated in 1985 in America through partnerships among various social awareness groups and pharmaceutical companies working on cancer treatment. The main reason for having an entire month dedicated to breast cancer is to increase awareness among people about the disease because of its prevalence, as well as raise funds for research into its cause, prevention, diagnosis, treatment and cure. Information and medical support is also off ered to those aff ected.
Breast Cancer Awareness Month
Idah Ogoso introduces the presenters during the session on Breast Cancer Awareness
Corporate Social Responsibility (contd.)
The Centre 27
At ICRAF Headquarters, breast cancer awareness activities were organized on 16 -18 October. In partnership with Jubilee Insurance, staff members were screened for breast cancer by specialists from the Aga Khan University Hospital and individuals trained on how to conduct Self-Breast Examinations (SBE) once a month. On 18 October, there was a health talk, which focused on various common cancers aff ecting both men and women in Kenya and other genetic and lifestyle diseases.
Labour Day celebrations
Five members of staff from the West and Central Africa region who stood out in the course of the year through diligence, commitment and team spirit were recognized by their peers. A competition where all staff voted to select the best in the team was organized. The results were announced during festivities marking this year’s Labour Day. As usual, celebrations took place at the ICRAF offi ce in Bastos, Yaounde in the presence of some fi eld partners and leaders of resource centres.
This year, new categories were introduced and there were fi ve in all. It included technicians, drivers, administration/fi nance, scientists and the overall best staff . Maurice Lenou won both the best driver and the overall best staff . Lyliane Kani was voted the best in the administration/fi nance category, Baba Gaspard was the best technician and Ann Degrande the best scientist. According to the staff representatives who organized the contest, the new categories were introduced this year to make it possible to recognize and motivate staff across all categories of work. Speaking after receiving the award, Maurice Lenou said the prize could not have been won without support from his peers.
In the build-up to the Labour Day celebrations, a number of activities were organized including a cross-country race and a lecture on the rights and responsibilities of staff as stipulated by the labour laws in Cameroon.
Corporate Social Responsibility (contd.)
28 World Agroforestry Centre
ICRAF staff receive training on personal fi nancial management
Staff activities
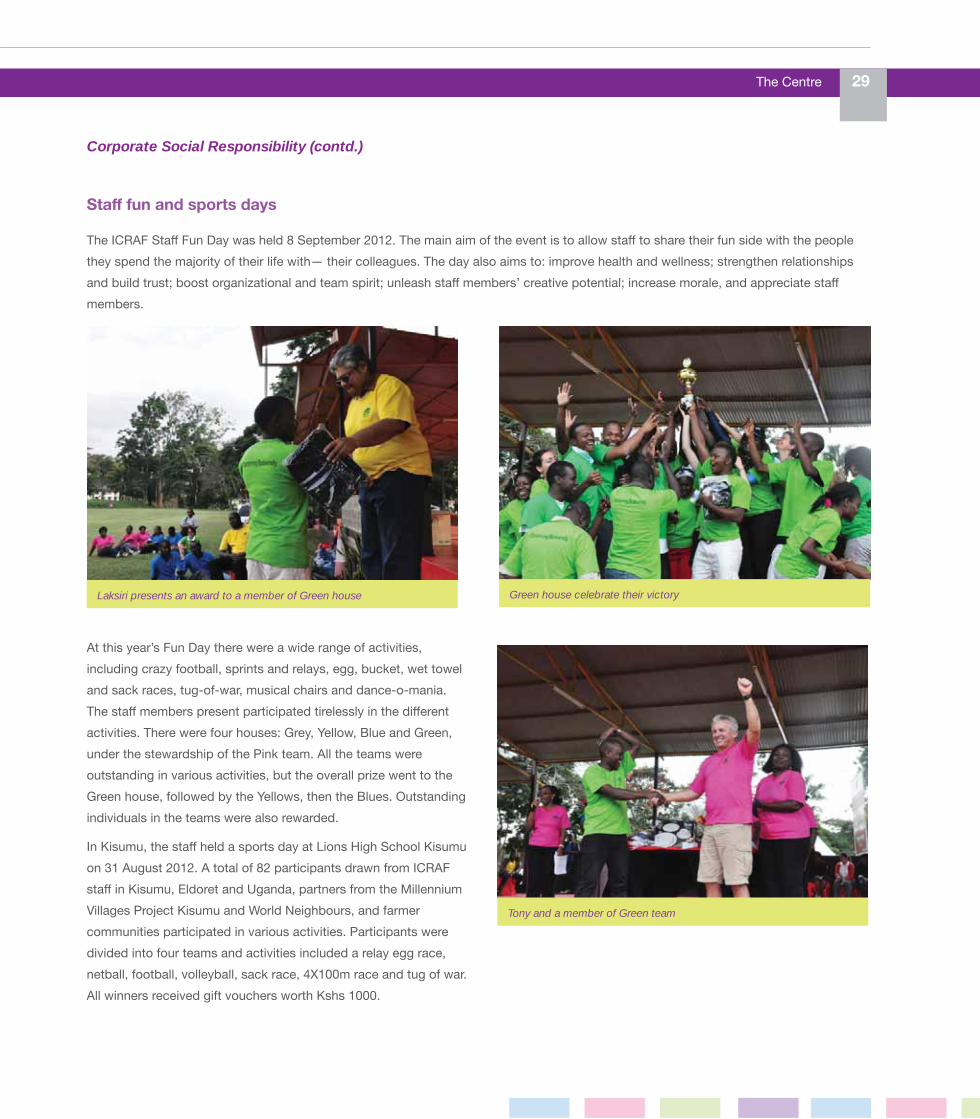
In response to staff requests received through the ICRAF Staff Association, the Human Resources Unit organized a seminar on personal fi nancial management. The event was facilitated by Mr Patrick Wameyo, the Founder and Executive Director of Financial Academy & Technologies Limited.
The talk proved very informative in relation to how one can eff ectively manage expenditure depending on their incomes, including measures that individuals should take to ensure that their current fi nances are invested wisely for future benefi t and fi nancial freedom. Participants were educated on the rules to success which involve deciding to take action, looking forward, aiming high, looking at obstacles as motivators, having clear goals and an open mind, as well as seeking help when necessary. Staff were also educated
on the importance of being fi nancially literate. This means having the proper knowledge, skills and confi dence to make responsible decisions on expenditure, savings, investments and borrowing. The talk also put a lot of emphasis on fi nancial planning depending on one’s stage in life and age, and why this is critical for wealth creation.
Mr Patrick Wameyo, the training facilitator from FATL
Victory in Mbumbuni
On 17 March 2012, the World Agroforesty Centre’s HQ-based football team comprising 22 members of staff , won a match in Mbumbuni against Ngoni FC, a local team from Makueni. The match was played at Kitindo Boys High School. At the end of the fi ercely contested match played under hot and humid conditions, the team went on a goal scoring spree defeating Ngoni FC 6-2.
ICRAF football team poses for a photo after winning their match
Corporate Social Responsibility (contd.)
The Centre 29
Staff fun and sports days
The ICRAF Staff Fun Day was held 8 September 2012. The main aim of the event is to allow staff to share their fun side with the people they spend the majority of their life with— their colleagues. The day also aims to: improve health and wellness; strengthen relationships and build trust; boost organizational and team spirit; unleash staff members’ creative potential; increase morale, and appreciate staff members.
At this year’s Fun Day there were a wide range of activities, including crazy football, sprints and relays, egg, bucket, wet towel and sack races, tug-of-war, musical chairs and dance-o-mania. The staff members present participated tirelessly in the diff erent activities. There were four houses: Grey, Yellow, Blue and Green, under the stewardship of the Pink team. All the teams were outstanding in various activities, but the overall prize went to the Green house, followed by the Yellows, then the Blues. Outstanding individuals in the teams were also rewarded.
In Kisumu, the staff held a sports day at Lions High School Kisumu on 31 August 2012. A total of 82 participants drawn from ICRAF staff in Kisumu, Eldoret and Uganda, partners from the Millennium Villages Project Kisumu and World Neighbours, and farmer communities participated in various activities. Participants were divided into four teams and activities included a relay egg race, netball, football, volleyball, sack race, 4X100m race and tug of war. All winners received gift vouchers worth Kshs 1000.
Laksiri presents an award to a member of Green house Green house celebrate their victory
Tony and a member of Green team
Corporate Social Responsibility (contd.)
30 World Agroforestry Centre
Financial Statements 31
The Board of Trustees of the World Agroforestry Centre is responsible for providing programmatic, governance and fi nancial oversight to ensure that the Centre is managed eff ectively and effi ciently. The Board is privileged to serve an institution whose mission and objectives are centred on improving people’s lives through sound science and the highest level of professionalism, transparency and accountability in all its operations. The Centre has seen steady progress in its programmatic delivery, fi nancial performance and risk management, and the Board is encouraged by this trend.
The year 2012 saw continuing global economic crises, especially in Europe, but notwithstanding this, many countries are continuing their commitment to overseas development. Ireland is a good example. The country has been in severe economic diffi culties yet the amount budgeted for development assistance is stable and Ireland remains a loyal and generous donor to the World Agroforestry Centre.
In the development area, fi gures from the Food and Agriculture Organization of the United Nations showed that despite recent rises, global food commodity prices dropped in 2012. On average, global food prices were 7% lower in 2012 compared to 2011. However, the outlook for 2013 is uncertain as drought remains a threat in many developing countries.
Centre highlights
Agroforestry, especially as an element in climate-smart agriculture and in landscapes, is being recognized by global research, development and donor communities as an established discipline that can make signifi cant contributions to food security, income, natural resource management and climate change adaptation and mitigation.
Agroforestry was better profi led internationally in 2012 than it has been at most points in its 34-year history. We are now at the heart of the movement to promote climate-smart agriculture, putting us in a very strong position to pursue our scientifi c work in concert with widespread policy innovation in an increasing number of countries. At the same time, the Centre is being recognized by major donors and policymakers for its expertise and it is being included in high-level
negotiations and large initiatives. For example, the Final Report of the High-level Panel on Global Sustainability ‘Resilient People, Resilient Planet: A Future Worth Choosing’, proposed an Evergreen revolution that “increases productivity while reducing resources intensity and protects biodiversity.” The Panel insisted that “an immediate push on sustainable agriculture would yield enormous social, economic and environmental dividends.”
In terms of its scientifi c output, the Centre continues to perform well. In 2012, Centre scientists published over 120 peer-reviewed papers. The annual Science Week held in Nairobi in September used innovative web-based software to develop novel ideas for research at the Centre.
The Beating Famine conference, a joint initiative by World Vision and the World Agroforestry Centre was held in Nairobi and brought together leading thinkers in agriculture, climate change and the environment to review innovative ways of tackling Africa’s apparently unending cycle of drought and food insecurity.
In June, a number of Centre staff attended the Rio+20 meeting in Brazil, taking part in a series of high-level events, with the message that sustainable intensifi cation of agricultural production can be achieved through climate- and development-smart agriculture with trees.
Continuing our engagement with the United Nations, World Agroforestry Centre staff and partners hosted two events at the 11th Conference of the Parties to the Convention on Biological Diversity in Hyderabad, India. ‘Tree Diversity Day’ highlighted the importance of tree diversity to human well-being and environmental health, through their delivery of numerous life-supporting services and products. The Day attracted over 200 participants to listen to a series of panel discussions that featured strong audience participation. The offi cial side event entitled ‘What’s cooking on farms?’ saw 120 guests listen to talks on the use of trees for health, fuel and nutrition.
The profi le of the World Agroforestry Centre was also raised at the 18th Session of the United Nations Framework Convention on Climate Change Conference of the Parties in Doha, Qatar, in December 2012. Participating in 12 offi cial side events, Centre staff highlighted the contribution that trees and agroforestry can make
BOARD CHAIR’S STATEMENT

32 World Agroforestry Centre
to ameliorating the eff ects of climate change. At Forest Day 6, Centre staff organized a heavily attended Discussion Forum on ‘Drivers of Deforestation: Exploring Regional Diff erences and New Patterns’. The event addressed the question of how drivers of deforestation vary across scales and continents. It also explored what generic designs of landscape approaches could best address complex interactions between multiple drivers as they manifest across continents, countries and landscapes.
Financial performance
From a fi nancial point of view, the Centre remains in excellent health. Our reserves, when expressed in terms of operating days, are among the highest in CGIAR. The expenditure for 2012 increased by 26% to US$53 million, up from $42 million in 2011. Because of the vagaries of Consortium funding, a defi cit was anticipated in 2012 of $5 million, but through increased bilateral funding, and the cooperation of the staff with the eff orts of the Financial Services Unit, this was reversed to a $236,000 surplus. Signifi cant progress has been made towards achieving full-costing of our services in 2012 and it is anticipated that this process will be completed in 2013. Full overhead recovery was achieved in 2012.
The Centre did not operate an overdraft with any of its bankers during the year. The short-term solvency (liquidity) as at 31 December 2012 was 195 days against a benchmark of 90-120 days set by the CGIAR. The long-term fi nancial stability (adequacy of reserves) as at 31 December 2012 was 155 days against the CGIAR recommended minimum benchmark of 90 days.
CGIAR change management
By 2012, the Consortium offi ce had settled down into a more fully functioning entity, with a new Chief Executive Offi cer, a clear Strategy and Results Framework placing strong emphasis on outcomes and impact, and robust management structures. The Centre remains involved in seven of the 15 CGIAR Research Programmes (CRPs), with major collaboration in two of them: CRP6, Forests, Trees and Agroforestry, and CRP7, Climate Change, Agriculture and Food Security.
The reorganization seems to be fi nding favour with donors, as the budget for 2012 topped $650 million, $860 million for 2013, with predictions that we will reach the $1 billion mark in the near future.
The year ahead
2013 will be a time of new opportunities. Tony Simons is settling well into his new position of Director General and exerting a considerable infl uence on the direction of the Centre, of which the Board approves. He has led the very inclusive exercise of refreshing the Centre strategy, which has been operational since 1 March 2013. The Strategy, entitled ‘Transforming Lives and Landscapes with Trees’ will position the Centre to move rapidly into its role within the impact-based CRP system, while retaining its competitive advantage as a cutting-edge research organization. Three new strategic goals have been defi ned and six Science Domains developed with innovative programmes of research. The challenge now will be to engage our partners in that strategic work.
2013 will also see the major part of the preparations for the World Congress on Agroforestry, scheduled to take place in February 2014 in Delhi, India. The Indian Council of Agricultural Research and the World Agroforestry Centre, together with the Indian Society of Agroforestry and Global Initiatives, have already launched preparations for a ground-breaking event that will demand tremendous participation from all ICRAF staff .
Appreciation
I would like to congratulate Dr Zac Tchoundjeu and staff of the West and Central Africa Regional Offi ce for winning the 2012 National Geographic/Warren Buff et Award for Leadership in African Conservation. Dr Pal Singh and ICRAF were recognized by the Sri Lankan government with a National Science Award for our role in saving smallholder coconut farmers from Waligama leaf wilt disease.
Finally, on behalf of the Board, I would like to compliment the Centre’s staff for the continued quality of their work and congratulate them on another successful year. We also thank all the donors, partners, Centres and the Consortium staff and offi ces for their continued support to the World Agroforestry Centre.
Eric TollensChairBoard of TrusteesWorld Agroforestry Centre 3 May 2013
Board Chair’s Statement (contd.)

Financial Statements 33
The Board of Trustees and Management of the World Agroforestry Centre have reviewed the implementation of the risk management framework during 2012 and the Board is satisfi ed with the progress made.
The Board of Trustees has the responsibility of ensuring that an appropriate risk management process is in place to identify and manage current and emerging signifi cant risks to the achievement of the Centre’s business objectives, and to ensure alignment with CGIAR principles and guidelines as adopted by all CGIAR Centres. These risks include operational, fi nancial and reputation risks that are inherent in the nature, modus operandi and locations of the Centre’s activities. They are dynamic owing to the environment in which the Centre operates. There is potential for loss resulting from inadequate or failed internal processes or systems, human factors or external events. Risks include:
1. Misallocation of scientifi c eff orts away from agreed priorities; 2. Loss of reputation due to lack of scientifi c excellence and
integrity; 3. Business disruption and information system failure;4. Liquidity problems;5. Transaction processing failures; 6. Loss of assets, including information assets; 7. Failure to recruit, retain and eff ectively utilize qualifi ed and
experienced staff ; 8. Failure in staff health and safety systems; 9. Failure by the Consortium to execute legal and fi duciary
responsibilities; 10. Withdrawal or reduction of funding by donors due to the
fi nancial crisis;11. Subsidization of the cost of projects funded from restricted
grants and/or partial non-delivery of promised outputs due to inadequate costing of restricted projects;
12. The Lead Centre not complying with the terms of the agreement with the Consortium and/or not delivering on the agreed outputs can have a negative impact on ICRAF as a participating Centre; and
13. Non-prioritization of agroforestry in the CRPs due to lack of funding etc.
The Board has adopted a risk management policy that includes a framework by which the Centre’s management identifi es, evaluates and prioritizes risks and opportunities across the
organization; develops risk mitigation strategies which balance benefi ts with costs; monitors the implementation of these strategies; and periodically reports to the Board on results. This process draws upon risk assessments and analysis prepared by staff of the Centre’s business unit, internal auditors, Centre-commissioned external reviewers and the external auditors. The risk assessments also incorporate the results of collaborative risk assessments with other CGIAR Centres, offi ce system components, and other entities in relation to shared risks arising from jointly managed activities. The risk management framework seeks to draw upon best practices, as promoted in codes and standards promulgated in a number of CGIAR member countries. It is subject to ongoing review as part of the Centre’s continuous improvement eff orts.
Risk mitigation strategies include the implementation of systems of internal controls, which, by their nature, are designed to manage rather than eliminate risk. The Centre endeavours to manage risk by ensuring that the appropriate infrastructure, controls, systems and people are in place throughout the organization. Key practices employed in managing risks and opportunities include business environmental scans, clear policies and accountabilities, transaction approval frameworks, fi nancial and management reporting, and the monitoring of metrics designed to highlight positive or negative performance of individuals and business processes across a broad range of key performance areas. The design and eff ectiveness of the risk management system and internal controls is subject to ongoing review by the Centre’s internal audit service, which is independent of the business units, and which reports the results of its audits directly to the Director General and to the Board through its Finance and Audit Committee.
The Board also remains very alive to the impact of external events over which the Centre has no control other than to monitor and, as the occasion arises, to provide mitigation.
Eric TollensChair
Board of Trustees
World Agroforestry Centre 3 May 2013
BOARD STATEMENT ON RISK MANAGEMENT
34 World Agroforestry Centre
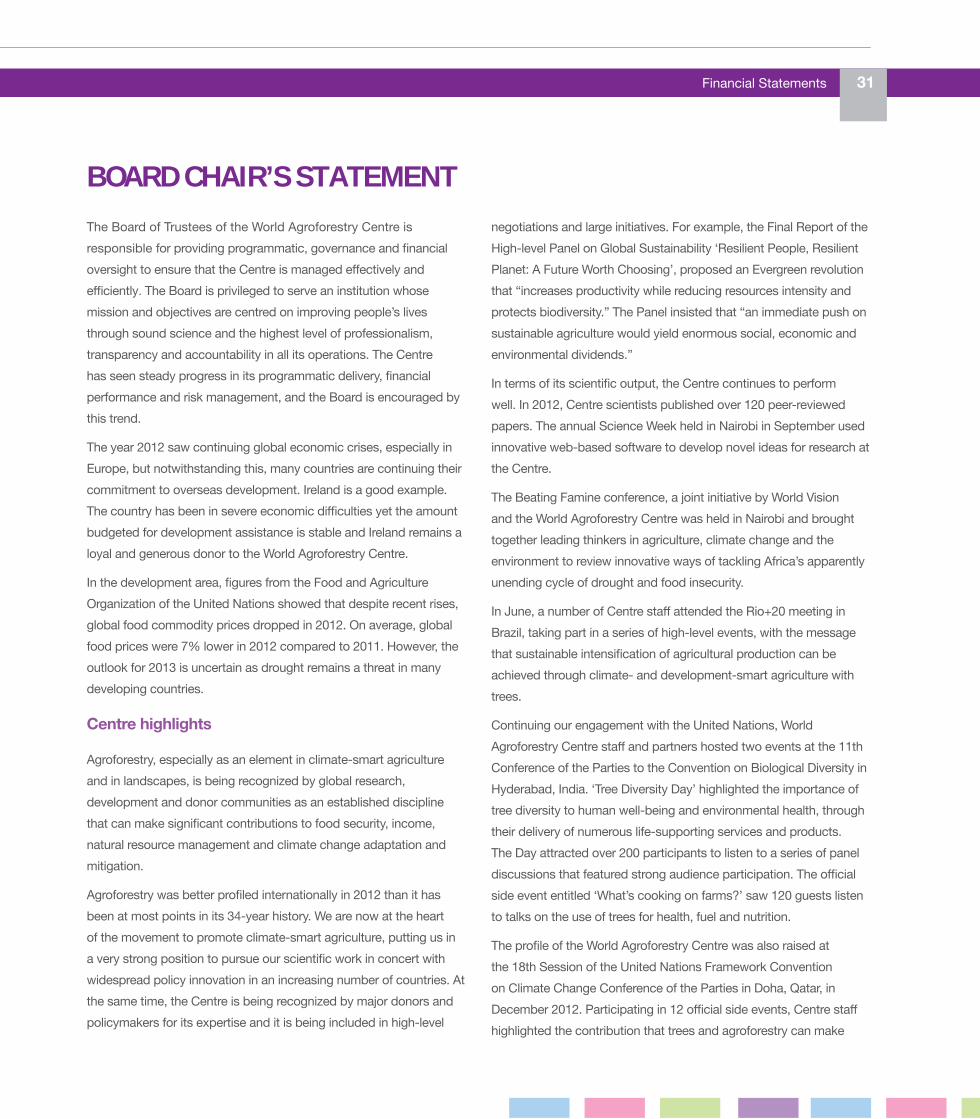
World Agroforestry Centre’s management is pleased to present the fi nancial statements for the year ended 31st December 2012 set out on pages 36 to 61. The fi nancial statements comprise the statement of fi nancial position at 31st December 2012, the statement of activities, the statement of changes in net assets and the statement of cash fl ows for the year then ended, and the notes to the fi nancial statements which include a summary of signifi cant accounting policies and other explanatory notes, in accordance with CGIAR Accounting Policies and Procedures Manual – Financial
Guidelines Series No. 2 (Revised February 2006 and supplemented
by 2011 Advisory Note).
Management is responsible for the preparation and presentation of these fi nancial statements on the basis of accounting described in Note 2 in accordance with the guidelines contained in the CGIAR Accounting Policies and Procedures Manual – Financial
Guidelines Series No. 2 (Revised February 2006 and supplemented
by 2011 Advisory Note). This responsibility includes: determining that the basis of accounting described in Note 2 is an acceptable basis for preparing and presenting the fi nancial statements in the circumstances; designing, implementing and maintaining internal control relevant to the preparation and presentation of fi nancial statements that are free from material misstatement, whether due
to fraud or error; selecting and applying appropriate accounting policies; and making accounting estimates that are reasonable in the circumstances.
Management accepts responsibility for the preparation of the above mentioned fi nancial statements, which have been prepared using appropriate accounting policies supported by reasonable and prudent judgments and estimates, in conformity with the CGIAR
Accounting Policies and Procedures Manual – Financial Guidelines
Series No. 2 (Revised February 2006 and supplemented by 2011
Advisory Note). Management is of the opinion that the fi nancial statements give a true and fair view of the state of the fi nancial aff airs of the Centre and of its operating results.
Management further accepts responsibility for the maintenance of accounting records which may be relied upon in the preparation of fi nancial statements, as well as adequate systems of internal fi nancial control.
Management’s assessment of funding, as per the indicative Programme of Work and Budget for 2013, indicates that the Centre will remain a going concern for at least the next 12 months from the date of this statement.
Tony SimonsDirector General
Laksiri AbeysekeraDeputy Director General-Finance and
Corporate Services
STATEMENT OF THE MANAGEMENT’S RESPONSIBILITIES
Financial Statements 35
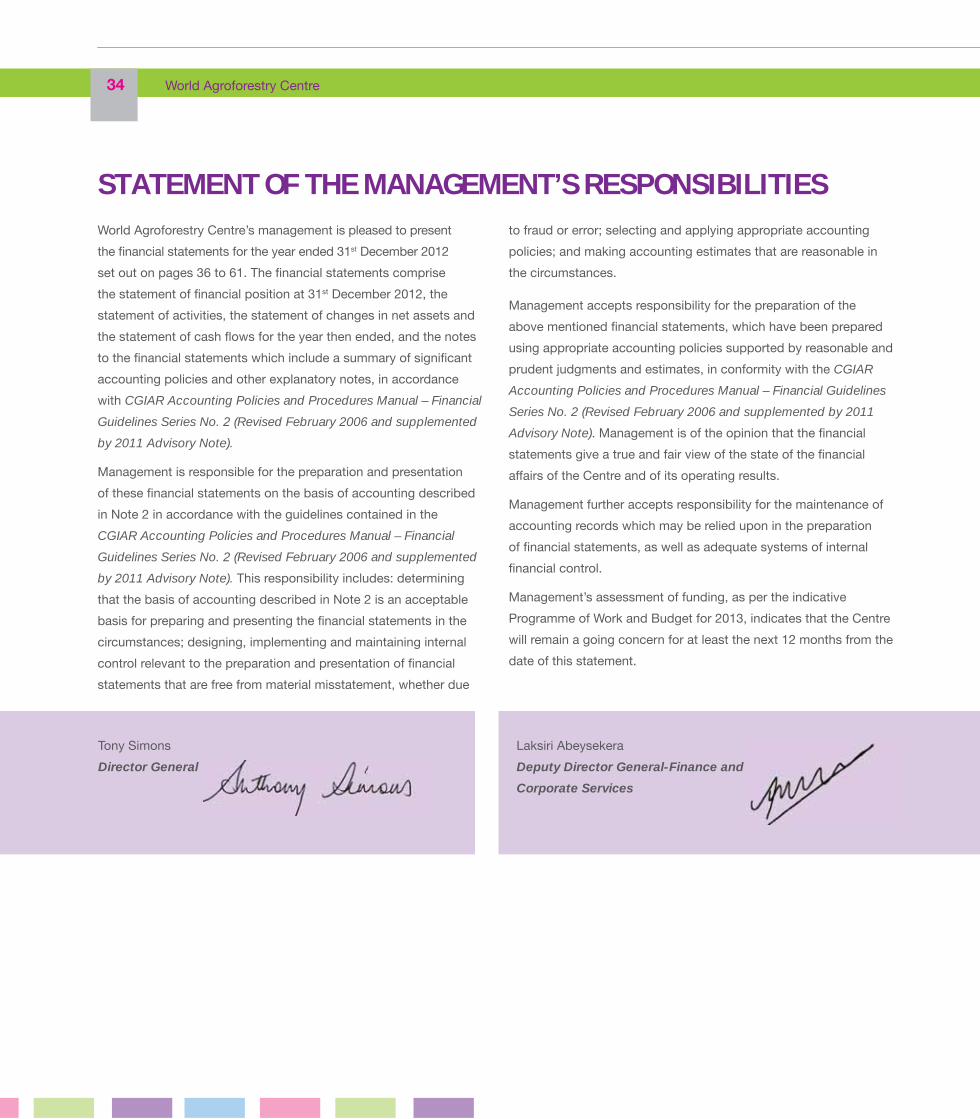
Report on the fi nancial statements
We have audited the accompanying fi nancial statements of the World Agroforestry Centre (the “Centre”) set out on pages 36 to 61. These fi nancial statements comprise the statement of fi nancial position at 31 December 2012, the statement of activities, statement of changes in net assets, a statement of cash fl ows for the year then ended, and a summary of signifi cant accounting policies and other explanatory notes.
Trustees’ responsibility for the fi nancial statements
The trustees are responsible for the preparation and fair presentation of these fi nancial statements in accordance with the Consultative Group on International Agricultural Research (CGIAR)
Accounting Policies and Procedures Manual – Financial Guidelines
Series No. 2 (Revised February 2006 and supplemented by 2011
Advisory Note) and for such internal control, as the trustees determine necessary to enable the preparation of fi nancial statements that are free from material misstatements, whether due to fraud or error.
Auditor’s responsibility
Our responsibility is to express an opinion on the fi nancial statements based on our audit. We conducted our audit in accordance with International Standards on Auditing. Those standards require that we comply with ethical requirements and plan and perform our audit to obtain reasonable assurance that the fi nancial statements are free from material misstatement.
An audit involves performing procedures to obtain audit evidence about the amounts and disclosures in the fi nancial statements. The procedures selected depend on the auditor’s judgement, including the assessment of the risks of material misstatement of the fi nancial statements, whether due to fraud or error. In making those risk assessments, the auditor considers internal control
relevant to the entity’s preparation of fi nancial statements that give a true and a fair view in order to design audit procedures that are appropriate in the circumstances, but not for the purpose of expressing an opinion on the eff ectiveness of the entity’s internal control. An audit also includes evaluating the appropriateness of accounting policies used and the reasonableness of accounting estimates made by the trustees, as well as evaluating the overall presentation of the fi nancial statements.
We believe that the audit evidence we have obtained is suffi cient and appropriate to provide a basis for our opinion.
Opinion
In our opinion the fi nancial statements give a true and a fair view of the fi nancial position of the World Agroforestry Centre as at 31 December 2012 and of its fi nancial performance and its cashfl ows for the year then ended, in accordance with the Consultative
Group on International Agricultural Research (CGIAR) Accounting
Policies and Procedures Manual – Financial Guidelines Series No.
2 (Revised February 2006 and supplemented by 2011 Advisory
Note).
Basis of accounting and restriction
on use
Without modifying our opinion, we draw attention to Note 2 to the fi nancial statements, which describe the basis of preparation and measurement. The fi nancial statements are prepared to assist trustees of the Centre to report to the Consortium Board and donors on the Centre’s fi nancial performance and status. As a result, the fi nancial statements may not be suitable for another purpose. Our report is intended solely for the Centre, the Consortium Board and its donors and should not be used by parties other than these.
REPORT OF THE INDEPENDENT AUDITOR TO THE BOARD OF TRUSTEES OF THE WORLD AGROFORESTRY CENTRE (ICRAF)
Certifi ed Public Accountants of KenyaCeeeeeeeeeeeeeeeertrrrrrtrtrrtrrrrrrrrrrrtifiifiififiifiifififiififiififiifififififififififififififififififi ed Publbbbbbbbbbbbbbbbbb ic Accountants of Kenya
36 World Agroforestry Centre
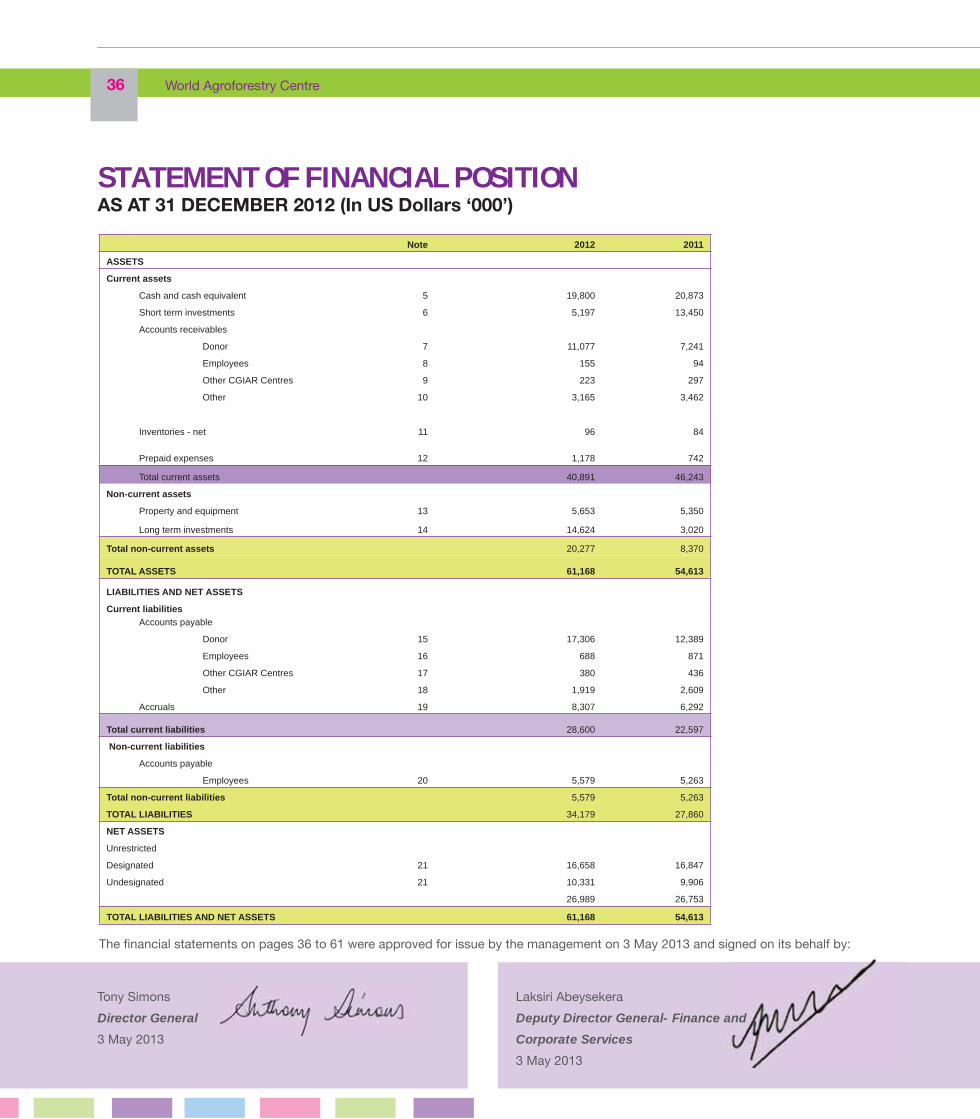
Note 2012 2011 ASSETS
Current assets
Cash and cash equivalent 5 19,800 20,873
Short term investments 6 5,197 13,450
Accounts receivables
Donor 7 11,077 7,241
Employees 8 155 94
Other CGIAR Centres 9 223 297
Other 10 3,165 3,462
Inventories - net 11
96
84
Prepaid expenses 12 1,178 742
Total current assets 40,891 46,243
Non-current assets
Property and equipment 13 5,653 5,350 Long term investments 14 14,624 3,020
Total non-current assets 20,277 8,370
TOTAL ASSETS 61,168 54,613
LIABILITIES AND NET ASSETS
Current liabilitiesAccounts payable
Donor 15 17,306 12,389
Employees 16 688 871
Other CGIAR Centres 17 380 436
Other 18 1,919 2,609
Accruals 19 8,307 6,292
Total current liabilities 28,600 22,597
Non-current liabilities
Accounts payable
Employees 20 5,579 5,263
Total non-current liabilities 5,579 5,263
TOTAL LIABILITIES 34,179 27,860
NET ASSETS
Unrestricted
Designated 21 16,658 16,847
Undesignated 21 10,331 9,906
26,989 26,753
TOTAL LIABILITIES AND NET ASSETS 61,168 54,613
STATEMENT OF FINANCIAL POSITIONAS AT 31 DECEMBER 2012 (In US Dollars ‘000’)
Tony SimonsDirector General
3 May 2013
Laksiri AbeysekeraDeputy Director General- Finance and
Corporate Services 3 May 2013
The fi nancial statements on pages 36 to 61 were approved for issue by the management on 3 May 2013 and signed on its behalf by:
and
Financial Statements 37
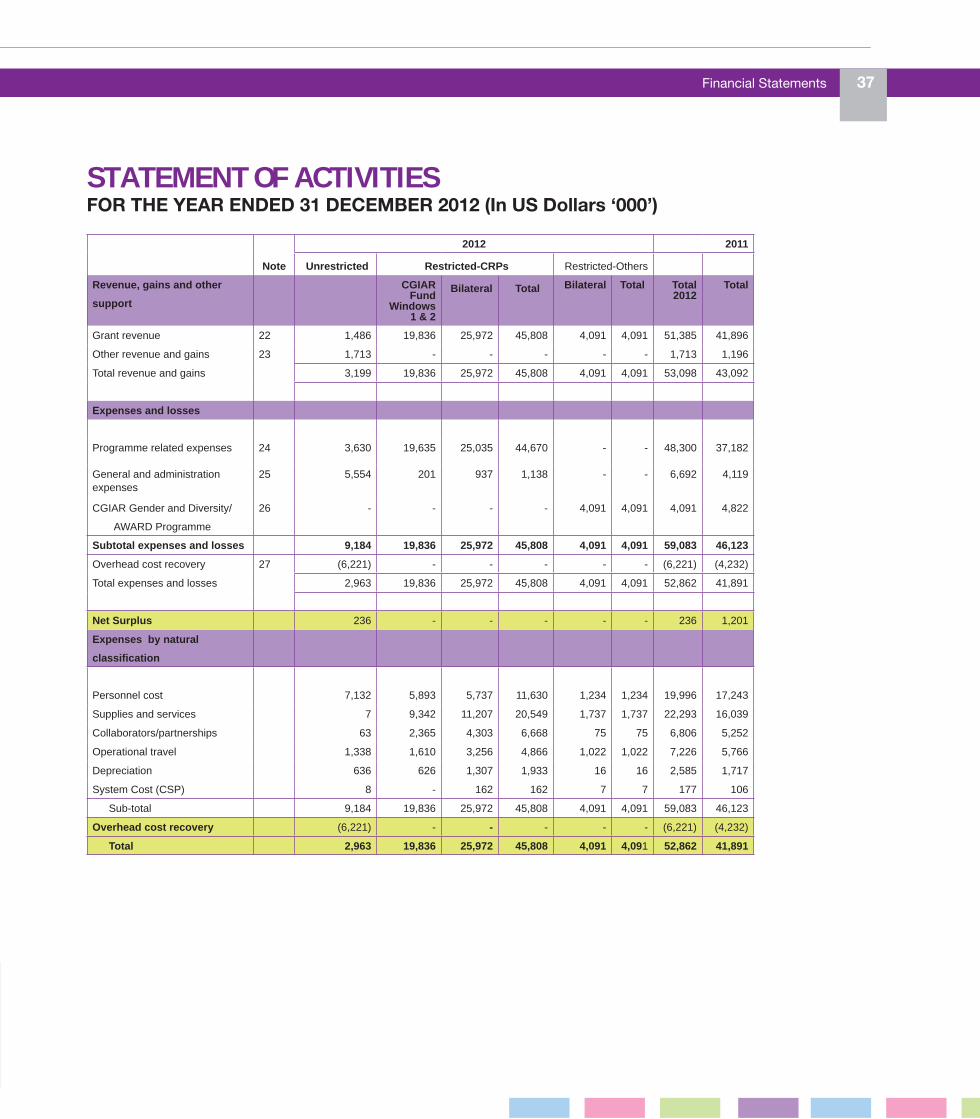
STATEMENT OF ACTIVITIESFOR THE YEAR ENDED 31 DECEMBER 2012 (In US Dollars ‘000’)
Note
2012 2011
Unrestricted Restricted-CRPs Restricted-Others
Revenue, gains and other
support
CGIARFund
Windows1 & 2
Bilateral Total Bilateral Total Total2012
Total
Grant revenue 22 1,486 19,836 25,972 45,808 4,091 4,091 51,385 41,896
Other revenue and gains 23 1,713 - - - - - 1,713 1,196
Total revenue and gains 3,199 19,836 25,972 45,808 4,091 4,091 53,098 43,092
Expenses and losses
Programme related expenses 24 3,630 19,635 25,035 44,670 - - 48,300 37,182
General and administrationexpenses
25 5,554 201 937 1,138 - - 6,692 4,119
CGIAR Gender and Diversity/
AWARD Programme
26 - - - - 4,091 4,091 4,091 4,822
Subtotal expenses and losses 9,184 19,836 25,972 45,808 4,091 4,091 59,083 46,123
Overhead cost recovery 27 (6,221) - - - - - (6,221) (4,232)
Total expenses and losses 2,963 19,836 25,972 45,808 4,091 4,091 52,862 41,891
Net Surplus 236 - - - - - 236 1,201
Expenses by natural
classification
Personnel cost 7,132 5,893 5,737 11,630 1,234 1,234 19,996 17,243
Supplies and services 7 9,342 11,207 20,549 1,737 1,737 22,293 16,039
Collaborators/partnerships 63 2,365 4,303 6,668 75 75 6,806 5,252
Operational travel 1,338 1,610 3,256 4,866 1,022 1,022 7,226 5,766
Depreciation 636 626 1,307 1,933 16 16 2,585 1,717
System Cost (CSP) 8 - 162 162 7 7 177 106
Sub-total 9,184 19,836 25,972 45,808 4,091 4,091 59,083 46,123
Overhead cost recovery (6,221) - - - - - (6,221) (4,232)
Total 2,963 19,836 25,972 45,808 4,091 4,091 52,862 41,891
38 World Agroforestry Centre
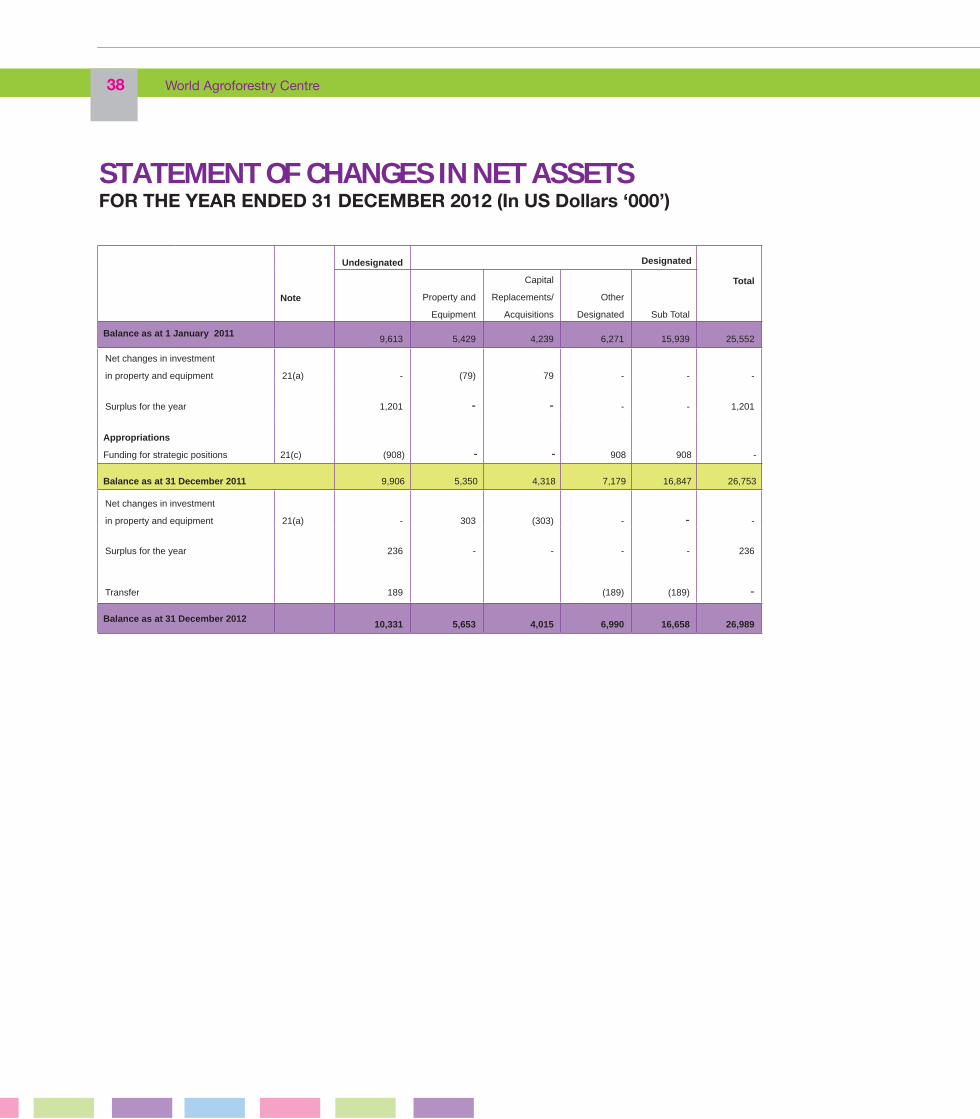
Note
Undesignated Designated
Total
Property and
Equipment
Capital
Replacements/
Acquisitions
Other
Designated Sub Total
Balance as at 1 January 2011 9,613 5,429 4,239 6,271 15,939 25,552
Net changes in investment
in property and equipment 21(a)
-
(79)
79
-
-
-
Surplus for the year
1,201
-
-
-
-
1,201
Appropriations
Funding for strategic positions 21(c)
(908)
-
-
908
908
-
Balance as at 31 December 2011 9,906 5,350 4,318 7,179 16,847 26,753
Net changes in investment
in property and equipment 21(a)
-
303
(303)
-
-
-
Surplus for the year 236 - - - - 236
Transfer
189
(189)
(189)
-
Balance as at 31 December 2012 10,331 5,653 4,015 6,990 16,658 26,989
STATEMENT OF CHANGES IN NET ASSETSFOR THE YEAR ENDED 31 DECEMBER 2012 (In US Dollars ‘000’)
Financial Statements 39
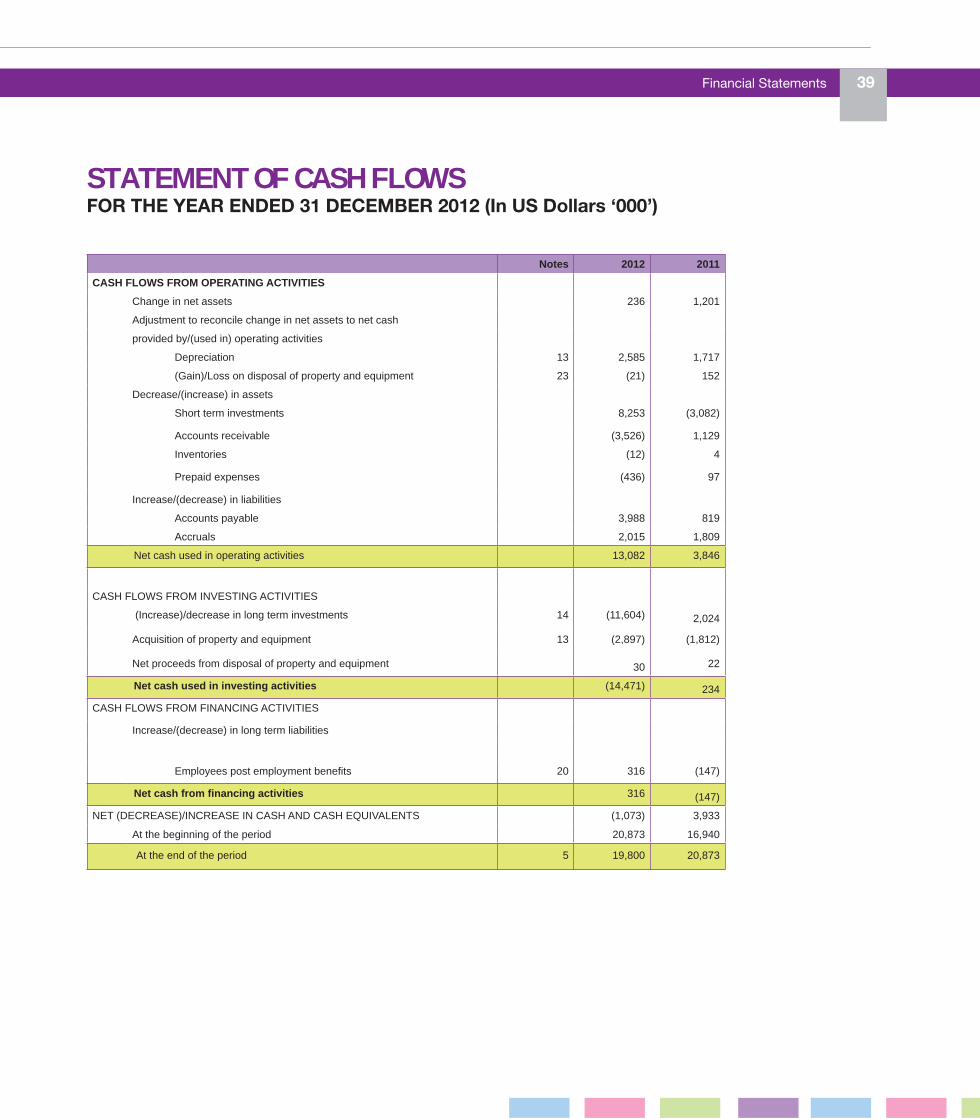
STATEMENT OF CASH FLOWSFOR THE YEAR ENDED 31 DECEMBER 2012 (In US Dollars ‘000’)
Notes 2012 2011
CASH FLOWS FROM OPERATING ACTIVITIES
Change in net assets 236 1,201
Adjustment to reconcile change in net assets to net cash
provided by/(used in) operating activities
Depreciation 13 2,585 1,717
(Gain)/Loss on disposal of property and equipment 23 (21) 152
Decrease/(increase) in assets
Short term investments 8,253 (3,082)
Accounts receivable (3,526) 1,129
Inventories (12) 4
Prepaid expenses (436) 97
Increase/(decrease) in liabilities
Accounts payable 3,988 819
Accruals 2,015 1,809
Net cash used in operating activities 13,082 3,846
CASH FLOWS FROM INVESTING ACTIVITIES
(Increase)/decrease in long term investments 14 (11,604) 2,024
Acquisition of property and equipment 13 (2,897) (1,812)
Net proceeds from disposal of property and equipment 30 22
Net cash used in investing activities (14,471) 234
CASH FLOWS FROM FINANCING ACTIVITIES
Increase/(decrease) in long term liabilities
Employees post employment benefits 20 316 (147)
Net cash from financing activities 316 (147)
NET (DECREASE)/INCREASE IN CASH AND CASH EQUIVALENTS (1,073) 3,933
At the beginning of the period 20,873 16,940
At the end of the period 5 19,800 20,873

40 World Agroforestry Centre
1. REPORTING ENTITY
The World Agroforestry Centre is an autonomous, not-for-profi t research and development institution supported by over 50 diff erent governments, private foundations, regional development banks, and the World Bank. The Centre is part of the alliance of the Consultative Group on International Agricultural Research (CGIAR) Centres.
The Centre was founded in 1978 as the International Council for Research in Agroforestry (ICRAF) to promote the exchange of information about agroforestry research in the tropics. With its headquarters in Nairobi, Kenya, the organization has 18 offi ces in Africa, ten in Asia and three in South America. In 1992, the Centre joined the CGIAR group, and since then has transformed itself into a world-class international agricultural research institution. In 2002, the organization acquired the brand name, the World Agroforestry Centre. However, the International Centre for Research in Agroforestry (ICRAF) remains the legal name.
In recent years, the World Agroforestry Centre has incorporated an explicit development agenda to its work to ensure broader adoption of agroforestry systems and practices and to be proactive in creating innovative development partnerships that leverage and extend the impact of our research.
2. BASIS OF PREPARATION AND MEASUREMENT
a. Basis of preparation
The fi nancial statements have been prepared in accordance with the CGIAR fi nancial guidelines contained in the Accounting Policies and Procedures Manual (Revised February 2006 and supplemented by 2011 Advisory Note). The CGIAR recognizes that in certain respects, the existing International Financial Reporting Standards (IFRSs) do not cover issues unique to not-for-profi t organizations. Therefore, the CGIAR has developed the Accounting Policies and Procedures Manual (CGIAR Financial Guidelines 2, February 2006) which draws on other widely applied standards to provide guidance on these matters.
The preparation of fi nancial statements in accordance with the CGIAR Financial Guidelines No. 2 (Revised February 2006 and supplemented by 2011 Advisory Note) requires the use of certain critical accounting estimates. It also requires management to exercise its judgement in the process of applying the Centre’s accounting policies. The areas involving a higher degree of judgement or complexity, or whose assumptions and estimates are signifi cant to the fi nancial statements, are disclosed in Note 4.
b. Basis of measurement
The measurement basis applied is the historical cost basis except where otherwise stated in the accounting policies below.
3. SIGNIFICANT ACCOUNTING POLICIES
The accounting policies set out below have been applied consistently to all periods presented in these fi nancial statements.
a. Revenue recognition
Revenue is the gross infl ow of economic benefi ts during the year arising in the course of the ordinary activities of the Centre where those infl ows result in increases in net assets. The Centre recognizes revenue when:
• the infl ows can be reliably measured; • It is probable that future economic benefi ts will fl ow to the Centre; and• when specifi c criteria have been met of the Centre’s activities as described below.
Revenue is measured at fair value of the consideration received or receivable.
The major portion of the Centre’s revenue is normally derived through the receipt of donor grants – either “Unrestricted” or “Restricted”.
Other revenue and gains are increases in net assets resulting from the Centre’s peripheral or incidental transactions and other events and circumstances aff ecting the Centre, other than those that result from grants. These are categorized as unrestricted.
NOTES TO THE FINANCIAL STATEMENTSFOR THE YEAR ENDED 31 DECEMBER 2012
Financial Statements 41
Revenue is recognized as follows:
i) Grant revenue
Grants are recognized as revenues only when the conditions have been substantially met or the donor has explicitly waived the conditions.
Unrestricted grant revenue
Unrestricted grants are recognized as revenue upon unconditional transfer of cash or other assets by donors. Such revenue is recognized in full in the fi nancial period specifi ed in commitments made by donors.
Restricted grant revenue
Restricted grants are recognized as revenue when there is reasonable assurance that the conditions attached to them have been complied with, and that the grants will be received.
ii) Donations in kind
Donations in kind are recognized at the fair value of the goods or services received or in the absence of this, at the amount attributed to them by the donor.
iii) Other revenue and gains
Other revenue and gains are recognized in the period in which they are earned.
b) Foreign currency translations
i) Functional and presentation currency
Items included in the fi nancial statements are measured using the currency of the primary economic environment in which the Centre operates (‘the functional currency’). These fi nancial statements are presented in US dollars (US$), which is the Centre’s functional currency. All fi nancial information presented in US dollars has been rounded to the nearest thousand.
ii) Transactions and balances
All foreign currency transactions are recorded, on initial recognition, in the Centre’s functional currency by applying to the foreign currency amount the exchange rate between the US dollar and the foreign currency at the date of the transaction.
At each period end date:
• Foreign currency monetary items are reported using the closing rate,
• Non-monetary items denominated in foreign currency which are carried at historical cost are reported using the exchange rate at the date of the transaction, and
• Non-monetary items denominated in foreign currency which are carried at fair value are reported using the exchange rates that existed when the values were determined.
Exchange diff erences are recognized as revenue or expense in the statement of activities in the period in which they arise.
c. Cash and cash equivalents
Cash comprises cash on hand, project imprest and bank balances which can be added to or withdrawn without limitation and are immediately available for use in the current operations.
Cash equivalents are short-term, highly liquid investments that are both: i) readily convertible to known amounts of cash; and ii) so near their maturity date that they present insignifi cant risk of changes in value because of changes in interest rates. These include only investments with original maturities of three months or less.
Cash is valued at face value.
Cash and cash equivalents in currencies other than the US dollar are recorded at market rates, in eff ect at the time of transaction and restated to the equivalent US dollar amount at prevailing market rates as of the date of the Statement of Financial Position.
Notes to the Financial Statements (contd.)
42 World Agroforestry Centre
d. Short term investments
These comprise investments that are (a) acquired with original maturity of more than three months but not exceeding one year, and (b) investments that are originally long term in nature but are currently due to mature within one year from the date of the Statement of Financial Position.
Investments are initially recorded at their acquisition cost. Interest relating to short-term investments is reported in the Statement of Activities as expense or revenue.
e. Accounts receivable
Receivables are generally defi ned as claims held against others for the future receipt of money, goods or services. Receivables include claims from donors, loans and advances to employees, advances to other Consortium of CGIAR Centres and claims against third parties for services rendered.
Accounts receivable from donors consist of claims from donors for grants pledged in accordance with the terms specifi ed by the donor. It also pertains to claims from donors for expenses paid on behalf of projects in excess of cash received.
Recognition
• Unrestricted grants: receivables from unrestricted grants should be recognized in full in the period specifi ed by the donor. Before an unrestricted grant can be recognized as revenue, suffi cient verifi able evidence should exist documenting that a commitment was made by the donor and received by the Centre.
• Restricted grants: receivables from restricted grants will be recognized in accordance with the terms of the underlying contract.
• Receivables from employees are recognized as they arise and cancelled when payment is received.
• Advances to other Consortium of CGIAR Centres are recognized when the cash or other assets borrowed are delivered or when payment is made for a liability of another Centre.
• Other receivables are recognized upon the occurrence of event or transaction which gives the Centre a legal claim against others.
Valuation
• All receivable balances are valued at their net realizable value, calculated as the gross amount of receivable minus any allowances provided for doubtful accounts.
• Allowance for doubtful accounts are provided in an amount equal to the total receivables shown or reasonably estimated to be doubtful of collection. The amount of the allowance is based on past experiences, and on a continuing review of receivable aging reports and other relevant factors.
• Any receivable or portion of receivable adjudged to be uncollectible is written off . Write-off s of receivables are done via the allowance for doubtful accounts after all eff orts to collect have been exhausted.
f. Inventories
Inventories are assets held in the form of materials or supplies to be consumed in the Centre’s operations or in the rendering of services. They comprise materials and supplies not directly expended at the time of their purchase, such as scientifi c supplies, automotive parts, building materials, petroleum products, offi ce and other general supplies.
Inventories are initially valued at cost. The cost of inventories applied to operations is based on the fi rst-in fi rst-out principle, and includes expenditure incurred in acquiring the inventories, production or conversion costs and other costs incurred in bringing them to their existing location and condition.
Inventories are written down to net realizable value on an item-by-item basis. The allowance for inventory obsolescence is deducted from the related asset. The amount of write-down of inventories to net realizable value and all losses of inventories is recognized as an expense in the period the write down or loss occurs.
Inventories held at the end of the fi nancial period are stated at the lower of cost and net realizable value.
Notes to the Financial Statements (contd.)
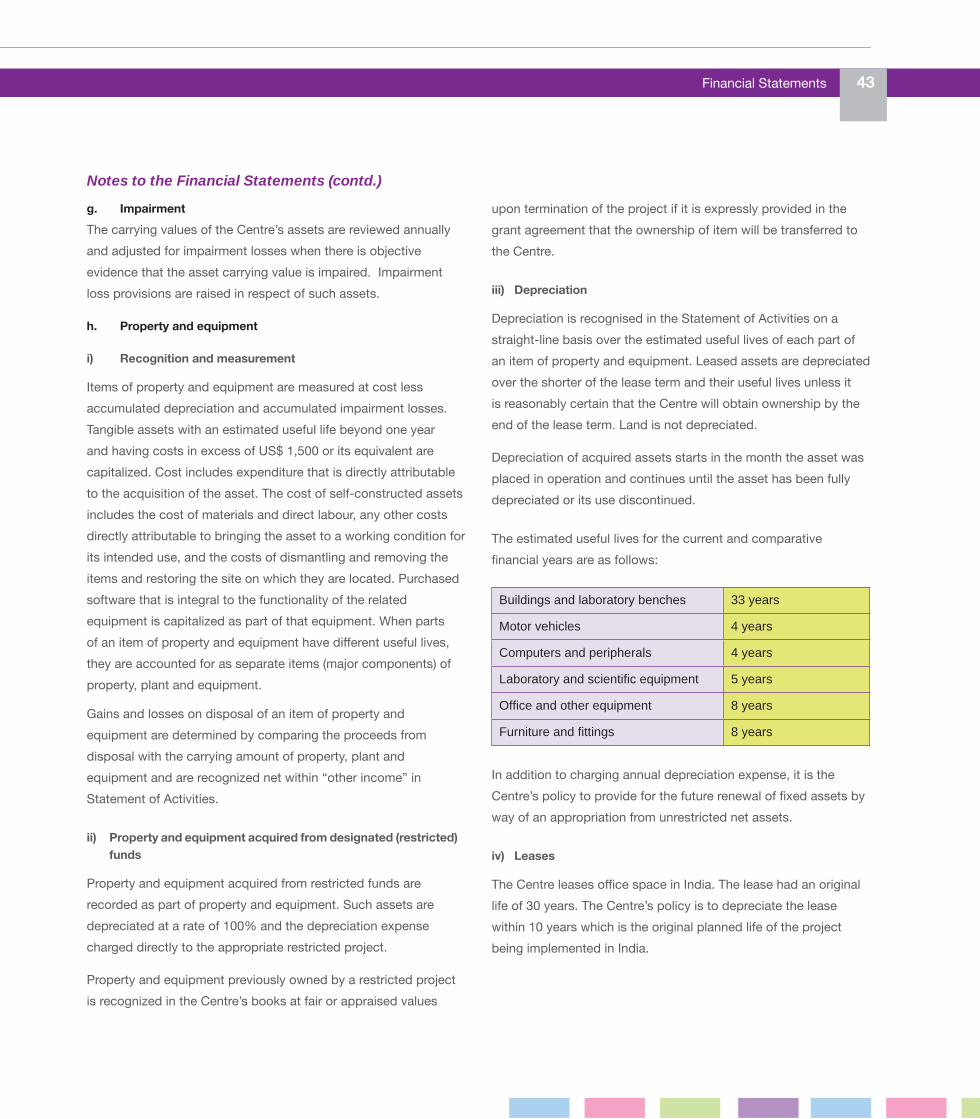
Financial Statements 43
g. Impairment
The carrying values of the Centre’s assets are reviewed annually and adjusted for impairment losses when there is objective evidence that the asset carrying value is impaired. Impairment loss provisions are raised in respect of such assets.
h. Property and equipment
i) Recognition and measurement
Items of property and equipment are measured at cost less accumulated depreciation and accumulated impairment losses. Tangible assets with an estimated useful life beyond one year and having costs in excess of US$ 1,500 or its equivalent are capitalized. Cost includes expenditure that is directly attributable to the acquisition of the asset. The cost of self-constructed assets includes the cost of materials and direct labour, any other costs directly attributable to bringing the asset to a working condition for its intended use, and the costs of dismantling and removing the items and restoring the site on which they are located. Purchased software that is integral to the functionality of the related equipment is capitalized as part of that equipment. When parts of an item of property and equipment have diff erent useful lives, they are accounted for as separate items (major components) of property, plant and equipment.
Gains and losses on disposal of an item of property and equipment are determined by comparing the proceeds from disposal with the carrying amount of property, plant and equipment and are recognized net within “other income” in Statement of Activities.
ii) Property and equipment acquired from designated (restricted) funds
Property and equipment acquired from restricted funds are recorded as part of property and equipment. Such assets are depreciated at a rate of 100% and the depreciation expense charged directly to the appropriate restricted project.
Property and equipment previously owned by a restricted project is recognized in the Centre’s books at fair or appraised values
upon termination of the project if it is expressly provided in the grant agreement that the ownership of item will be transferred to the Centre.
iii) Depreciation
Depreciation is recognised in the Statement of Activities on a straight-line basis over the estimated useful lives of each part of an item of property and equipment. Leased assets are depreciated over the shorter of the lease term and their useful lives unless it is reasonably certain that the Centre will obtain ownership by the end of the lease term. Land is not depreciated.
Depreciation of acquired assets starts in the month the asset was placed in operation and continues until the asset has been fully depreciated or its use discontinued.
The estimated useful lives for the current and comparative fi nancial years are as follows:
Buildings and laboratory benches 33 years
Motor vehicles 4 years
Computers and peripherals 4 years
Laboratory and scientific equipment 5 years
Office and other equipment 8 years
Furniture and fittings 8 years
In addition to charging annual depreciation expense, it is the Centre’s policy to provide for the future renewal of fi xed assets by way of an appropriation from unrestricted net assets.
iv) Leases
The Centre leases offi ce space in India. The lease had an original life of 30 years. The Centre’s policy is to depreciate the lease within 10 years which is the original planned life of the project being implemented in India.
Notes to the Financial Statements (contd.)
44 World Agroforestry Centre
i) Long term investments
These comprise investments with a maturity of more than one year as of the date of the Statement of Financial Position.
Investments are initially recorded at their acquisition cost (including brokerage and other transaction costs) if they were purchased.
Investments in securities with readily determinable fair values and all investments in debt securities are measured at fair value as of the date of the Statement of Financial Position.
Interest, dividends, losses and gains relating to investments are reported in the Statement of Activities as gains or losses.
j) Accounts payable
These represent amounts due to donors, employees and others for support, services and or materials received prior to year-end but not paid for as of the date of the Statement of Financial Position.
Accounts payable to donors include grants received from donors for which conditions are not yet met and amounts payable to donors in respect of any unexpended funds received in advance for signed contracts.
Accounts payable are classifi ed as current liabilities if payment is due within one year or less. If not, they are presented as non-current liabilities.
Measurement
• Current liabilities are carried at the amount to be paid.
• Long-term liabilities are shown at the present or discounted value of the future net cash outfl ows expected to be made to settle the liabilities in the normal course of operations
k) Accruals
Accruals represent liabilities to pay for goods and services that have been received, supplied or formally agreed with suppliers.
Accruals are recorded in the accounting records and reported in the fi nancial statements of the periods to which they relate as the transactions or events occur.
l) Employee benefi ts
Employee benefi ts are all forms of consideration given by the Centre in exchange for the services rendered by all employees – whether internationally recruited staff (IRS) or nationally recruited staff (NRS). Employee benefi ts include:
• Short-term employee benefi ts (such as wages, salaries and paid leave) and non-monetary benefi ts (such as medical care, housing and cars) for current employees;
• Post employment benefi ts such as pensions, other retirement benefi ts, post employment medical care and insurance; and
• Termination benefi ts.
i) Short-term employee benefi ts
Short-term employee benefi t obligations are measured on an undiscounted basis and are expensed as the related service is provided. A liability is recognised for the amount expected to be paid under short-term cash bonus if the Centre has a present legal or constructive obligation to pay this amount as a result of past service provided by the employee and the obligation can be estimated reliably.
ii) Defi ned contribution pension scheme
The Centre operates a defi ned contribution pension scheme for all its regular employees. The scheme is administered by an insurance company and is funded by contributions from the World Agroforestry Centre and its employees. Contributions of the Centre to the pension scheme are charged to operating expenses in the year to which they relate.
Prepaid contributions are recognised as an asset to the extent that a cash refund or a reduction in future payments is available.
iii) Other post employment benefi ts
Full provision is made for gratuity payable to employees at the end of their contracts. This provision is based on basic salary times the number of years worked up to a maximum of six years of service. Provisions are also made in respect of outstanding leave days accruing to staff and staff repatriation costs.
Notes to the Financial Statements (contd.)
Financial Statements 45
iv) Termination benefi ts
Termination benefi ts are recognised as an expense when the Centre is demonstrably committed, without realistic possibility of withdrawal, to a formal detailed plan to either terminate employment before the normal retirement date, or to provide termination benefi ts as a result of an off er made to encourage voluntary redundancy. Termination benefi ts for voluntary redundancies are recognised as an expense if the Centre has made an off er encouraging voluntary redundancy, it is probable that the off er will be accepted, and the number of acceptances can be estimated reliably.
m) Provisions liabilities
A provision is recognised if, as a result of a past event, the Centre has a present legal or constructive obligation that can be estimated reliably, and it is probable that an outfl ow of economic benefi ts will be required to settle the obligation. Provisions are determined by discounting the expected future cash fl ows at a rate that refl ects current market assessments of the time value of money and the risks specifi c to the liability.
n) Income tax
The Government of Kenya has exempted the Centre from all local taxes including customs duty on goods and services received by the Centre. Consequently, the Centre does not account for tax in its fi nancial statements.
o) Overheads cost recovery
Overhead costs recovery represents the overhead costs recovered from restricted projects based on the rates agreed and as stated in each project agreement with donors. Cost ratios are computed on the basis of provisions of CGIAR Financial Guidelines 5.
p) Net assets
Net assets are the residual interest in the Centre’s assets after liabilities are deducted. The overall change in net assets represents the total gains and losses generated by the Centre’s activities during the period as determined by the particular
measurement principles adopted and disclosed in the fi nancial statements.
Net assets are classifi ed as either undesignated or designated.
i. Undesignated: that part of net assets that are not designated by the Centre’s management for specifi c purposes.
ii. Designated: a. Use of assets has been designated by the Centre
management for specifi c purposes such as reserve for replacement of property and equipment and net investment in property and equipment. Designation is made on an annual basis based on Board of Trustees’ resolution.
b. The Board of Trustees may also designate net assets to mitigate or counter unforeseen eventualities, funding reductions and currency risks that pose serious risks for business continuity.
q) Comparative information
Where necessary, comparative fi gures have been restated to conform to changes in presentation in the current year.
4. CRITICAL ACCOUNTING ESTIMATES AND JUDGEMENTS
The preparation of fi nancial statements requires management to make judgements, estimates and assumptions that aff ect the application of accounting policies and the reported amounts of assets, liabilities, income and expenses. Although management believes the estimates and assumptions used in preparation of these fi nancial statements were appropriate in the circumstances, actual results could diff er from those estimates and assumptions. Estimates and underlying assumptions are reviewed on an ongoing basis. Revisions to accounting estimates are recognized in the period in which the estimates are revised and in any future periods aff ected. The critical areas of accounting estimates
Notes to the Financial Statements (contd.)
46 World Agroforestry Centre
4. CRITICAL ACCOUNTING ESTIMATES AND JUDGEMENTS (contd.)and judgements in relation to the preparation of these fi nancial statements are as set out below:
i. Critical judgements in applying accounting policies
In the process of applying a CGIAR fi nancial guidelines, management has made judgement in determining:
• the classifi cation of fi nancial assets and liabilities
• whether fi nancial and non-fi nancial assets are impaired.
ii. Key sources of estimation uncertainty
Impairment of assets
At each reporting date, the organization reviews the carrying amount of its assets to determine whether there is any indication
that these assets have suff ered an impairment loss. If any such indication exists, the recoverable amount of the asset is estimated in order to determine the extent of impairment.
Property and equipment
Critical estimates are made in determining the useful lives and residual values to property, plant and equipment based on the intended use of the assets and the economic lives of those assets. Subsequent changes in circumstances or prospective utilization of the assets concerned could result in the actual useful lives or residual values diff ering from initial estimates.
Staff separation costs
At each reporting date, the Centre provides for the estimated staff separation costs which comprise gratuity and repatriation. Gratuity is based on the number of years worked for the Centre and related basic salary. Repatriation is based on the prevailing air ticket rates.
Notes to the Financial Statements (contd.)

Financial Statements 47
2012
USD’000
2011
USD’000
5. CASH AND CASH EQUIVALENTS
Cash at hand 3,763 49
Bank balances 12,976 15,765
Short term deposits (Acquired with original maturities of 3 months or less) 3,061 5,059
19,800 20,873
6. SHORT TERM INVESTMENTS
This account comprises:
Investment with original maturity of more than 3 months but less than one year
Long term investments due to mature within one year 5,197 13,450
7. ACCOUNTS RECEIVABLE - DONORS
Unrestricted 41 414
Restricted 11,319 7,193
11,360 7,607
Less allowance for doubtful accounts (283) (366)
11,077 7,241
8. ACCOUNTS RECEIVABLE - EMPLOYEES
Advances to staff 155 94
9. ACCOUNTS RECEIVABLE - OTHER CGIAR CENTRES
IPGRI / Bioversity International 45 27
ICRISAT- International Crop Research Institute for The Semi-Arid Tropics 56 49
ILRI- International Livestock Research Institute 103 48
TSBF-Tropical Soil Biology and Fertility Centre 4
CIMMYT-International Maize and Wheat Improvement Center 11 169
CIFOR-Center for International Forestry Research 4 4
223 297
10. ACCOUNTS RECEIVABLE - OTHERS
Associated organizations (partners and collaborators) 3,064 3,342
Deposits 68 88
Others 55 54
3,187 3,484
Less allowance for doubtful accounts (22) (22)
3,165 3,462
11. INVENTORIES- NET
Stationery and office supplies 80 75
Spare parts 8 5
Others 9 5
97 85
Less allowance for obsolescence (1) (1)
96 84
12. PREPAID EXPENSES
Advances to suppliers 1,102 669
Staff rent 76 73
1,178 742
Notes to the Financial Statements (contd.)

48 World Agroforestry Centre
Notes to the Financial Statements (contd.)
13. PROPERTY AND EQUIPMENT - NET2012 - USD ‘000
Balance
January 1
Work in
Progress Additions Disposal
Balance
December 31 Cost
Physical facilities 7,485 287 - (1) 7,771
Infrastructure & leasehold 463 - - - 463
Furnishing & equipment 11,943 385 2,225 (2,523) 12,030
Total cost 19,891 672 2,225 (2,524) 20,264 Accumulated Depreciation
Physical facilities (3,814) - (224) 1 (4,037)
Infrastructure & leasehold (263) - (27) - (290)
Furnishing & equipment (10,464) - (2,334) 2,514 (10,284)
Total depreciation (14,541) - (2,585) 2,515 (14,611)Net Book Value
Physical facilities 3,671 287 (224) - 3,734
Infrastructure & leasehold 200 - (27) - 173
Furnishing & equipment 1,479 385 (109) (9) 1,746
Total net book value 5,350 672 (360) (9) 5,653
2011 - USD’000Balance
January 1
Work in
Progress
Additions Disposal Balance
December 31 Cost
Physical facilities 8,125 78 65 (783) 7,485
Infrastructure & leasehold 474 - - (11) 463
Furnishing & equipment 15,367 - 1,669 (5,093) 11,943
Total cost 23,966 78 1,734 (5,887) 19,891Accumulated Depreciation
Physical facilities (4,377) - (220) 783 (3,814)
Infrastructure & leasehold (247) - (27) 11 (263)
Furnishing & equipment (13,912) (1,470) 4,918 (10,464)
Total depreciation (18,536) - (1,717) 5,712 (14,541)Net Book Value
Physical facilities 3,748 78 (155) - 3,671
Infrastructure & leasehold 227 - (27) - 200
Furnishing & equipment 1,455 - 199 (175) 1,479
Total net book value 5,430 78 17 (175) 5,350

Financial Statements 49
Notes to the Financial Statements (contd.)
14. LONG TERM INVESTMENTS
This account consist of: 2012
USD ‘000
2011
USD ‘000
Bonds 14,624 3,020
The investment portfolio is managed by HSBC Private Bank Suisse and Vestra Wealth LLP UK. Interest earned on investments during the year is recognised as other revenue and gains in the Statement of Activities.
15. ACCOUNTS PAYABLE - DONORS
2012
USD ‘000
2011
USD ‘000
Unrestricted (Funds received in advance from unrestricted grants) 4 571
Restricted (Funds received in advance from restricted grants) 17,302 11,818
17,306 12,389
16. ACCOUNTS PAYABLE - EMPLOYEES
Accrued leave provision 381 403
Others 307 468
688 871
17. ACCOUNTS PAYABLE - OTHER CGIAR CENTRES
ILRI- International Livestock Research Institute 186 164
TSBF- Tropical Soil Biology and Fertility - 57
IRD- Institute for Research in Development - 85
Consortium of International Agricultural Research Centers 194 130
380 436
18. ACCOUNTS PAYABLE - OTHER
Associated organizations (partners and collaborators) 785 1,152
Trade creditors 718 685
Others 416 772
1,919 2,609
19. ACCRUALS
Project expenses 3,829 2,318
Supplies and services 4,478 3,974
8,307 6,292
20. ACCOUNTS PAYABLE - EMPLOYEES (POST EMPLOYMENT BENEFITS)
Balance at beginning of the year 5,263 5,410
Provisions during the year 1,047 559
Disbursements during the year (731) (706)
5,579 5,263
Balance at end of the year made up of:
Gratuity 4,085 3,978
Repatriation 1,494 1,285
5,579 5,263
50 World Agroforestry Centre
Notes to the Financial Statements (contd.)
21. NET ASSETS
The level of net assets recommended by the CGIAR is 75-90 days of operating expenses excluding depreciation. As at 31st December 2012, the Centre’s net assets represented 155 days (2011 – 194 days) of the operating expenses excluding depreciation.
Net assets include both the designated and undesignated portions.
Undesignated
The balance in the undesignated portion as at 31 December 2012 is US$ 10.331 million (2011 - US$ 9.906 million), which is presented as unrestricted (undesignated) net assets. The surplus for the year of US$ 0.236 million (2011 - US$ 1.201 million), represents the total gains generated by the Centre during the year.
Designated
a) Net investment in property and equipment
A portion of unrestricted net assets has been appropriated by the Board of Trustees to refl ect net investment in property and equipment.
The balance of US$ 5.653 million (2011: USD 5.350 million) as at 31 December 2012 comprises the balance brought forward from 2011
and the current year’s net increase in fi xed assets of US$ 303,000 (2011: Decrease of US$ 79,000).
b) Reserve for acquisition and replacement of property and equipment
Each fi nancial year, the Centre appropriates from the unrestricted net assets an amount equal to the movement in the net book value of the property and equipment and any other specifi c allocation into a reserve designated to meet the acquisition and replacement costs for property and equipment items.
The balance of US$ 4.015 million (2011 - US$ 4.318 million) as at 31 December 2012 represents unspent funding available for use by the Centre in future years for acquisition and replacement of property and equipment.
c) Other designations
In 2008, the Centre appropriated US$ 2.5 million from undesignated net assets to cater for any future funding shortfalls and adverse foreign currency eff ects, which could pose a risk to the Centre’s continuity. An additional appropriation of US$ 0.908 million was made from the 2011 operating surplus to cater for funding for strategic positions. In 2012, an adjustment of US$0.198 million was made to refl ect the current value of contingencies.
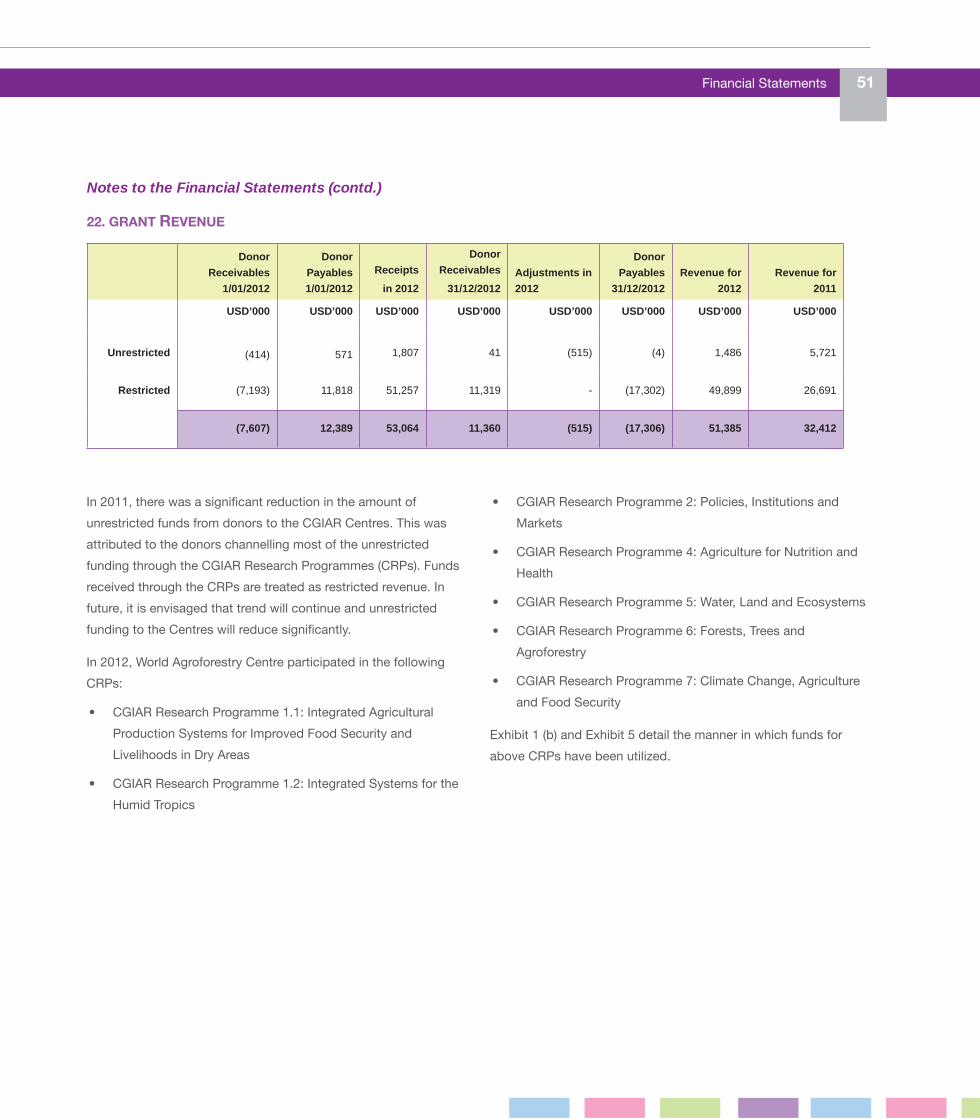
Financial Statements 51
Notes to the Financial Statements (contd.)
In 2011, there was a signifi cant reduction in the amount of unrestricted funds from donors to the CGIAR Centres. This was attributed to the donors channelling most of the unrestricted funding through the CGIAR Research Programmes (CRPs). Funds received through the CRPs are treated as restricted revenue. In future, it is envisaged that trend will continue and unrestricted funding to the Centres will reduce signifi cantly.
In 2012, World Agroforestry Centre participated in the following CRPs:
• CGIAR Research Programme 1.1: Integrated Agricultural Production Systems for Improved Food Security and Livelihoods in Dry Areas
• CGIAR Research Programme 1.2: Integrated Systems for the Humid Tropics
• CGIAR Research Programme 2: Policies, Institutions and Markets
• CGIAR Research Programme 4: Agriculture for Nutrition and Health
• CGIAR Research Programme 5: Water, Land and Ecosystems
• CGIAR Research Programme 6: Forests, Trees and Agroforestry
• CGIAR Research Programme 7: Climate Change, Agriculture and Food Security
Exhibit 1 (b) and Exhibit 5 detail the manner in which funds for above CRPs have been utilized.
22. GRANT REVENUE
Donor
Receivables
1/01/2012
Donor
Payables
1/01/2012
Receipts
in 2012
Donor
Receivables
31/12/2012 Adjustments in
2012
Donor
Payables
31/12/2012
Revenue for
2012
Revenue for
2011
USD’000 USD’000 USD’000 USD’000 USD’000 USD’000 USD’000 USD’000
Unrestricted (414) 571 1,807 41 (515) (4) 1,486 5,721
Restricted (7,193) 11,818 51,257 11,319 - (17,302) 49,899 26,691
(7,607) 12,389 53,064 11,360 (515) (17,306) 51,385 32,412

52 World Agroforestry Centre
Notes to the Financial Statements (contd.)
23. OTHER REVENUE AND GAINS
2012 2011
USD’000 USD’000
Sale of farm produce 3 9
Investment income 468 (78)
Exchange gain/(loss) 88 (655)
Consultancy fees (13) 25
Administration fees* 720 1,560
Offi ce space charges* 168 269
Equipment rental - 2
Gain/(loss) on sale of equipment 21 (152)
Miscellaneous income 258 216
1,713 1,196
* Income from hosting other CGIAR centres and like-minded organizations in Nairobi campus
24. PROGRAMME-RELATED EXPENSES
Programme-related expenses
Programme-related expenses are expenses incurred by main research, research support, training, and information services as described below.
Research Programmes
Cover expenses on research for development in Africa, Asia and Latin America.
Research Support Programmes
Include genetic resource and biometrics units, farm and aircraft operations, plant growth facilities, postharvest engineering, analytical laboratory, and research management.
Training
Costs include training offi ces, fellowships, workshops, seminars, allowances to trainees and training-related travel.
Information Services
Cover the costs of publication of annual reports and technical publications, translation and printing of various public information activities, and library service.

Financial Statements 53
Notes to the Financial Statements (contd.)
Program-related expenses incurred as of 31 December were as follows: 2012 2011
USD’000 USD’000
Programme-related expenses 48,300 37,182
25. MANAGEMENT AND GENERAL EXPENSES Management and general expenses consist of:
Corporate Governance
Covers the costs of board of trustees, director general’s offi ce, administration, internal audit, fi nance, human resources, personnel, and purchasing departments.
General Operations
Include expenses on physical plant services, utilities, communications, security and general services.
Management and general expenses incurred as of 31 December were as follows:
2012
USD’000
2011
USD’000
Management and general expenses 6,692 4,119
26. CGIAR GENDER AND DIVERSITY/AWARD PROGRAMME
The purpose of the Gender and Diversity Programme is to help the CGIAR Centres leverage their rich staff diversity to increase research and management excellence. The programme promotes such activities as diversity-positive recruitment, international teamwork, cross-cultural communications and advancement for women. It also provides services and resources to those Centres focused on supporting an organizational culture of inclusion, dignity, well-being and opportunity, in both policy and practice. The G&D programme came to an end in 2012.
2012
USD’000
2011
USD’000
Personnel costs 1,234 1,304
Professional services and supplies 1,737 1,822
Operational travel 1,022 1,142
Partnerships/small grants 75 444
Depreciation 16 110
System Cost (CSP) 7 -
4,091 4,822

54 World Agroforestry Centre
Notes to the Financial Statements (contd.)
27. OVERHEAD COST RECOVERY Overhead cost recovery represents the portion of project restricted income allocated by donors through grant agreements to support general institutional overhead costs.
2012 2011
USD’000 USD’000
From restricted grants 6,221 4,232
28. OTHER SUPPORT: Scientists-in-KindFrance (CTFT and CIRAD) and Belgium (VVOB) International seconded scientifi c personnel to the Centre during the year. Their cost was borne by the donors, as shown below, whilst World Agroforestry Centre provided the necessary support services. This support is not reported in the Statement of Activities.
2012 2011
USD’000 USD’000
Belgium - 19
France 97 83
29. PERSONNEL COST The following items are included within staff costs:
2012
USD’000
2011
USD’000
Salaries 12,453 11,011
Social security costs 180 216
Pension costs - defi ned contribution plans 1,542 1,350
Other personnel costs 5,821 4,666
19,996 17,243
The number of persons employed by World Agroforestry Centre at the end of 2012 was 452 (2011: 392).

Financial Statements 55
Notes to the Financial Statements (contd.)
30. RELATED PARTY TRANSACTIONS
Key management personnel remuneration
Key management personnel are those persons having authority and responsibility for planning, directing and controlling the activities of the entity, directly or indirectly, including any director (whether executive or otherwise) of that entity.
2012 2011
USD’000 USD’000
Salaries and other short term benefi ts 1,200 941
Post employment benefi ts 103 94
1,303 1,035
31. CONTINGENT LIABILITIES
There are no contingent liabilities at 31 December 2012 and 31 December 2011.
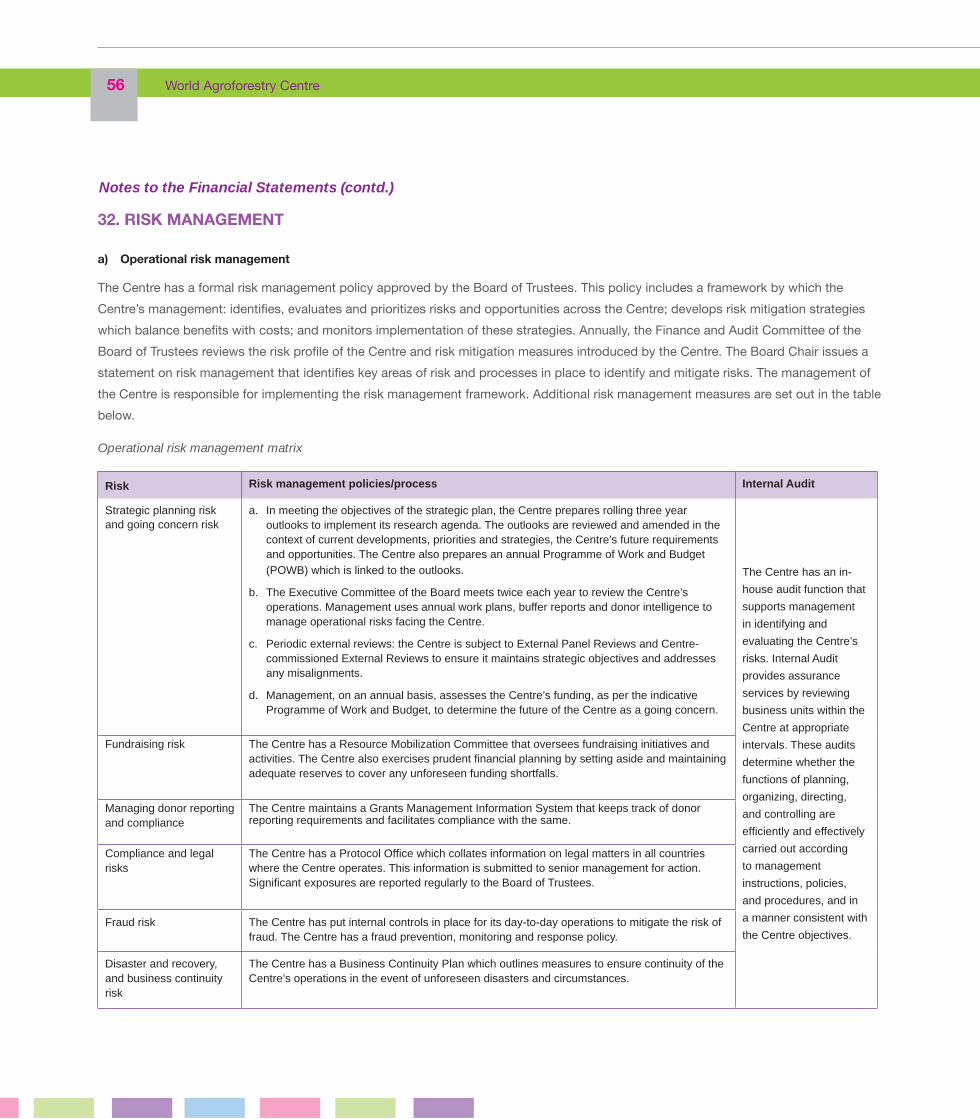
56 World Agroforestry Centre
Notes to the Financial Statements (contd.)
Risk Risk management policies/process Internal Audit
Strategic planning riskand going concern risk
a. In meeting the objectives of the strategic plan, the Centre prepares rolling three year outlooks to implement its research agenda. The outlooks are reviewed and amended in the context of current developments, priorities and strategies, the Centre’s future requirements and opportunities. The Centre also prepares an annual Programme of Work and Budget (POWB) which is linked to the outlooks.
b. The Executive Committee of the Board meets twice each year to review the Centre’s operations. Management uses annual work plans, buffer reports and donor intelligence to manage operational risks facing the Centre.
c. Periodic external reviews: the Centre is subject to External Panel Reviews and Centre-commissioned External Reviews to ensure it maintains strategic objectives and addresses any misalignments.
d. Management, on an annual basis, assesses the Centre’s funding, as per the indicative Programme of Work and Budget, to determine the future of the Centre as a going concern.
The Centre has an in-
house audit function that
supports management
in identifying and
evaluating the Centre’s
risks. Internal Audit
provides assurance
services by reviewing
business units within the
Centre at appropriate
intervals. These audits
determine whether the
functions of planning,
organizing, directing,
and controlling are
effi ciently and effectively
carried out according
to management
instructions, policies,
and procedures, and in
a manner consistent with
the Centre objectives.
Fundraising risk The Centre has a Resource Mobilization Committee that oversees fundraising initiatives and activities. The Centre also exercises prudent fi nancial planning by setting aside and maintaining adequate reserves to cover any unforeseen funding shortfalls.
Managing donor reporting and compliance
The Centre maintains a Grants Management Information System that keeps track of donor reporting requirements and facilitates compliance with the same.
Compliance and legal risks
The Centre has a Protocol Offi ce which collates information on legal matters in all countries where the Centre operates. This information is submitted to senior management for action. Signifi cant exposures are reported regularly to the Board of Trustees.
Fraud risk The Centre has put internal controls in place for its day-to-day operations to mitigate the risk of fraud. The Centre has a fraud prevention, monitoring and response policy.
Disaster and recovery, and business continuity risk
The Centre has a Business Continuity Plan which outlines measures to ensure continuity of the Centre’s operations in the event of unforeseen disasters and circumstances.
32. RISK MANAGEMENT
a) Operational risk management
The Centre has a formal risk management policy approved by the Board of Trustees. This policy includes a framework by which the Centre’s management: identifi es, evaluates and prioritizes risks and opportunities across the Centre; develops risk mitigation strategies which balance benefi ts with costs; and monitors implementation of these strategies. Annually, the Finance and Audit Committee of the Board of Trustees reviews the risk profi le of the Centre and risk mitigation measures introduced by the Centre. The Board Chair issues a statement on risk management that identifi es key areas of risk and processes in place to identify and mitigate risks. The management of the Centre is responsible for implementing the risk management framework. Additional risk management measures are set out in the table below.
Operational risk management matrix

Financial Statements 57
Notes to the Financial Statements (contd.)
32. RISK MANAGEMENT (Continued)
b) Financial risk management
The Centre is exposed to the following fi nancial risks from its use of fi nancial instruments:
• Credit risk• Liquidity risk• Market risk.
The Centre’s risk management objectives, policies and processes for measuring and managing its key fi nancial risks are detailed below.
i) Credit risk
Credit risk is the risk of fi nancial loss to the Centre if a counterparty to a fi nancial instrument fails to meet its contractual obligations, and arises from cash and cash equivalents and accounts receivables. The Centre’s maximum exposure to credit risk as at 31st December 2012 is presented in the Statement of Financial Position.
Cash and cash equivalents
Cash and cash equivalents are held with reputable fi nancial institutions. The Centre’s formal investment policy stipulates that protection of capital in real terms over the investment horizon is paramount while allowing for very moderate short term volatility to achieve the return objective.
Accounts receivables
• Review of aging reports are carried out monthly and provisions for doubtful amounts made for any potentially irrecoverable amounts.
• The Centre does not incur expenditure on restricted donor grants before funding contracts are signed.
• Advances to partner and hosted organizations are subject to the Centre’s internal requirements to limit losses arising from funds advanced by the Centre.
The table below analyses the credit risk position of the Centre’s receivables, cash and cash equivalent and short-term deposits.
Fully performingUS$’000
Past dueUS$’000
ImpairedUS$’000
31 December 2012
Accounts receivable - Donor 11,077 - 283
Accounts receivable - Employees 155 - -
Accounts receivable - Other CGIAR Centres 223 - -
Accounts receivable - Others 3,165 - 22
Cash and cash equivalents 19,800 - -
Short term investments 5,197 - -
39,617 - 305
31 December 2011
Accounts receivable - Donor 7,241 - 366
Accounts receivable - Employees 94 - -
Accounts receivable - Other CGIAR Centres 297 - -
Accounts receivable - Others 3,462 - 22
Cash and cash equivalents 20,873 - -
Short term investments 13,450 - -
45,417 - 388
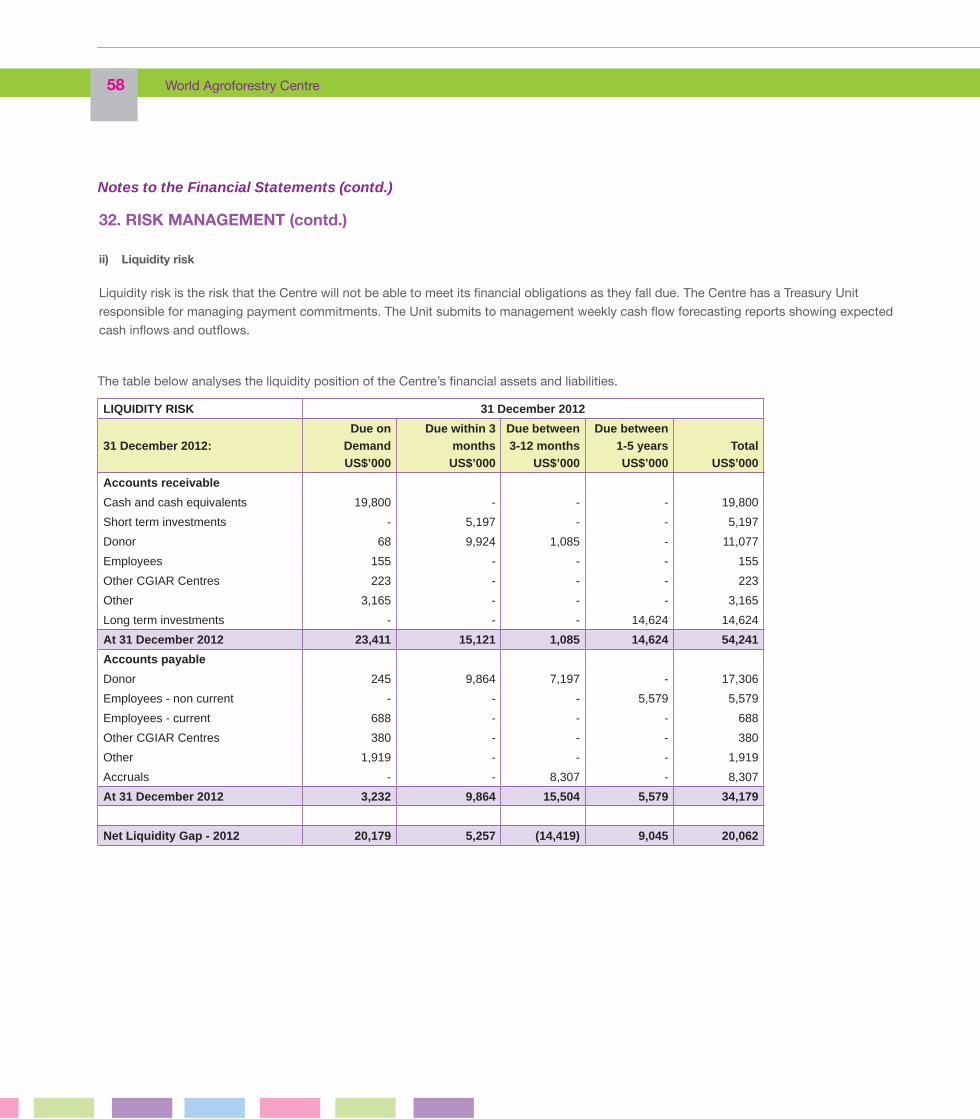
58 World Agroforestry Centre
Notes to the Financial Statements (contd.)
32. RISK MANAGEMENT (contd.)
ii) Liquidity risk
Liquidity risk is the risk that the Centre will not be able to meet its fi nancial obligations as they fall due. The Centre has a Treasury Unit responsible for managing payment commitments. The Unit submits to management weekly cash fl ow forecasting reports showing expected cash infl ows and outfl ows.
The table below analyses the liquidity position of the Centre’s fi nancial assets and liabilities.
LIQUIDITY RISK 31 December 2012
31 December 2012:Due on
DemandUS$’000
Due within 3months
US$’000
Due between3-12 months
US$’000
Due between 1-5 years
US$’000 Total
US$’000
Accounts receivable
Cash and cash equivalents 19,800 - - - 19,800
Short term investments - 5,197 - - 5,197
Donor 68 9,924 1,085 - 11,077
Employees 155 - - - 155
Other CGIAR Centres 223 - - - 223
Other 3,165 - - - 3,165
Long term investments - - - 14,624 14,624
At 31 December 2012 23,411 15,121 1,085 14,624 54,241
Accounts payable
Donor 245 9,864 7,197 - 17,306
Employees - non current - - - 5,579 5,579
Employees - current 688 - - - 688
Other CGIAR Centres 380 - - - 380
Other 1,919 - - - 1,919
Accruals - - 8,307 - 8,307
At 31 December 2012 3,232 9,864 15,504 5,579 34,179
Net Liquidity Gap - 2012 20,179 5,257 (14,419) 9,045 20,062

Financial Statements 59
Notes to the Financial Statements (contd.)
LIQUIDITY RISK 31 December 2011
31 December 2011:Due on
DemandUS$’000
Due within 3months
US$’000
Due between3-12 months
US$’000
Due between 1-5 years
US$’000 Total
US$’000
Accounts receivable
Cash and cash equivalents 20,873 - - - 20,873
Short term investments - 13,450 - - 13,450
Donor 391 6,477 373 - 7,241
Employees 94 - - - 94
Other CGIAR Centres 297 - - - 297
Other 3,462 - - - 3,462
Long term investments 3,020 3,020
At 31 December 2011 25,117 19,927 373 3,020 48,437
Accounts payable
Donor 249 6,862 5,278 - 12,389
Employees - non current - - - 5,263 5,263
Employees - current 871 - - - 871
Other CGIAR Centres 436 - - - 436
Other 2,609 - - - 2,609
Accruals - - 6,292 - 6,292
At 31 December 2011 4,165 6,862 11,570 5,263 27,860
Net Liquidity Gap - 2011 20,952 13,065 (11,197) (2,243) 20,577
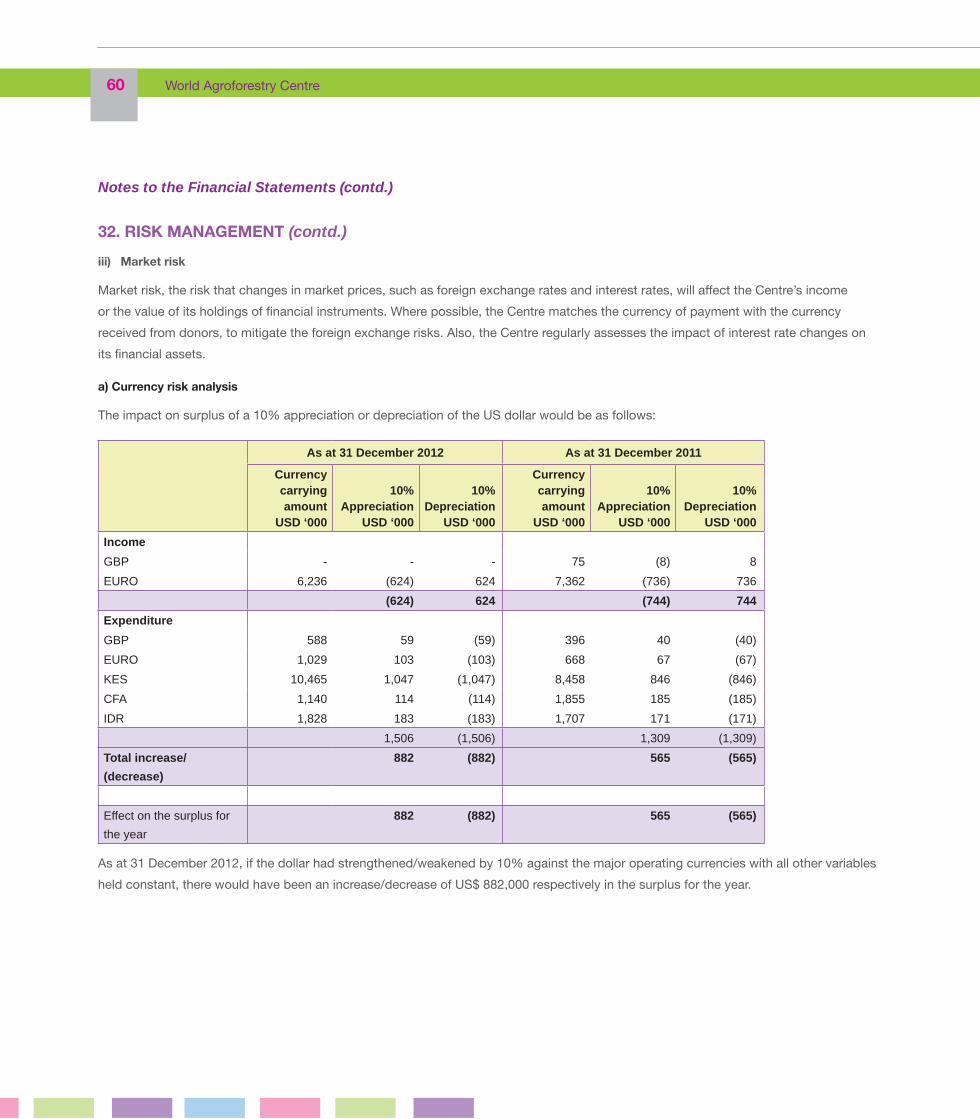
60 World Agroforestry Centre
Notes to the Financial Statements (contd.)
32. RISK MANAGEMENT (contd.)
iii) Market risk
Market risk, the risk that changes in market prices, such as foreign exchange rates and interest rates, will aff ect the Centre’s income or the value of its holdings of fi nancial instruments. Where possible, the Centre matches the currency of payment with the currency received from donors, to mitigate the foreign exchange risks. Also, the Centre regularly assesses the impact of interest rate changes on its fi nancial assets.
a) Currency risk analysis
The impact on surplus of a 10% appreciation or depreciation of the US dollar would be as follows:
As at 31 December 2012 As at 31 December 2011
Currencycarrying amount
USD ‘000
10%Appreciation
USD ‘000
10%Depreciation
USD ‘000
Currencycarrying amount
USD ‘000
10%Appreciation
USD ‘000
10%Depreciation
USD ‘000
Income
GBP - - - 75 (8) 8
EURO 6,236 (624) 624 7,362 (736) 736
(624) 624 (744) 744
Expenditure
GBP 588 59 (59) 396 40 (40)
EURO 1,029 103 (103) 668 67 (67)
KES 10,465 1,047 (1,047) 8,458 846 (846)
CFA 1,140 114 (114) 1,855 185 (185)
IDR 1,828 183 (183) 1,707 171 (171)
1,506 (1,506) 1,309 (1,309)
Total increase/
(decrease)
882 (882) 565 (565)
Effect on the surplus for
the year
882 (882) 565 (565)
As at 31 December 2012, if the dollar had strengthened/weakened by 10% against the major operating currencies with all other variables held constant, there would have been an increase/decrease of US$ 882,000 respectively in the surplus for the year.
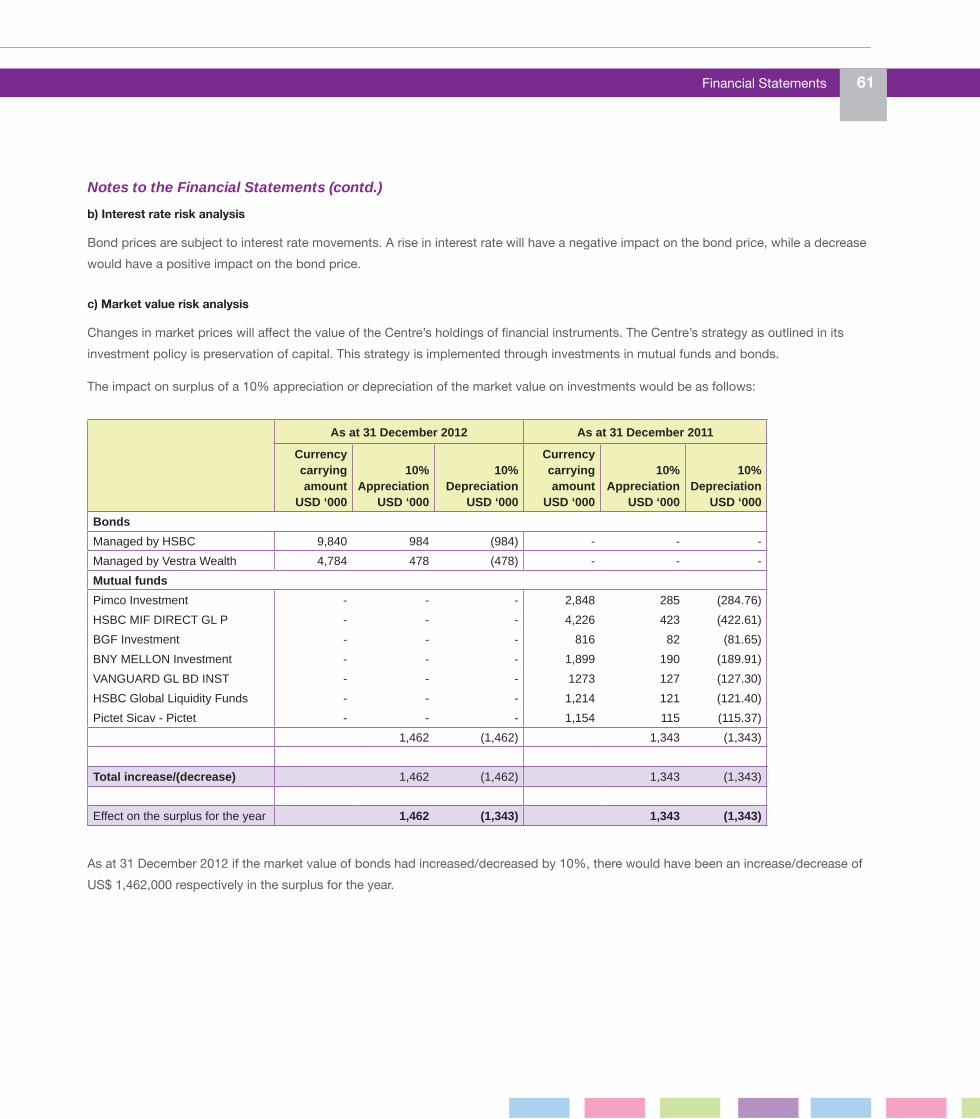
Financial Statements 61
Notes to the Financial Statements (contd.)
b) Interest rate risk analysis
Bond prices are subject to interest rate movements. A rise in interest rate will have a negative impact on the bond price, while a decrease would have a positive impact on the bond price.
c) Market value risk analysis
Changes in market prices will aff ect the value of the Centre’s holdings of fi nancial instruments. The Centre’s strategy as outlined in its investment policy is preservation of capital. This strategy is implemented through investments in mutual funds and bonds.
The impact on surplus of a 10% appreciation or depreciation of the market value on investments would be as follows:
As at 31 December 2012 As at 31 December 2011
Currencycarrying amount
USD ‘000
10%Appreciation
USD ‘000
10%Depreciation
USD ‘000
Currencycarrying amount
USD ‘000
10%Appreciation
USD ‘000
10%Depreciation
USD ‘000
Bonds
Managed by HSBC 9,840 984 (984) - - -
Managed by Vestra Wealth 4,784 478 (478) - - -
Mutual funds
Pimco Investment - - - 2,848 285 (284.76)
HSBC MIF DIRECT GL P - - - 4,226 423 (422.61)
BGF Investment - - - 816 82 (81.65)
BNY MELLON Investment - - - 1,899 190 (189.91)
VANGUARD GL BD INST - - - 1273 127 (127.30)
HSBC Global Liquidity Funds - - - 1,214 121 (121.40)
Pictet Sicav - Pictet - - - 1,154 115 (115.37)
1,462 (1,462) 1,343 (1,343)
Total increase/(decrease) 1,462 (1,462) 1,343 (1,343)
Effect on the surplus for the year 1,462 (1,343) 1,343 (1,343)
As at 31 December 2012 if the market value of bonds had increased/decreased by 10%, there would have been an increase/decrease of US$ 1,462,000 respectively in the surplus for the year.

Exhibits 63
SCHEDULE OF UNRESTRICTED GRANTS REVENUEFOR THE YEAR ENDED 31 DECEMBER 2012 (In US Dollars ‘000’) Exhibit 1
2012 2011
Donor Funds B/F Received Accounts
Receivable
Refund/
Adjustment
Advance
Payment
Grant
Revenue
Australia - - - - - - - 519
Aid to Africa - - - - - - - 1
Belgium - - - - - - - 760
China (20) - 29 11 - - 20 20
Finland (320) - 632 6 - - 318 320
Germany - - 379 - - - 379 348
Ireland - - 606 - - - 606 830
Netherlands (52) - - - 52 - - -
Philippines (2) - 7 4 - - 9 12
South Africa (20) - - 20 - - - -
The Consortium of
International Agricultural
Research Centers
- 571 154 - (567) (4) 154 2,912
(414) 571 1,807 41 (515) (4) 1,486 5,721
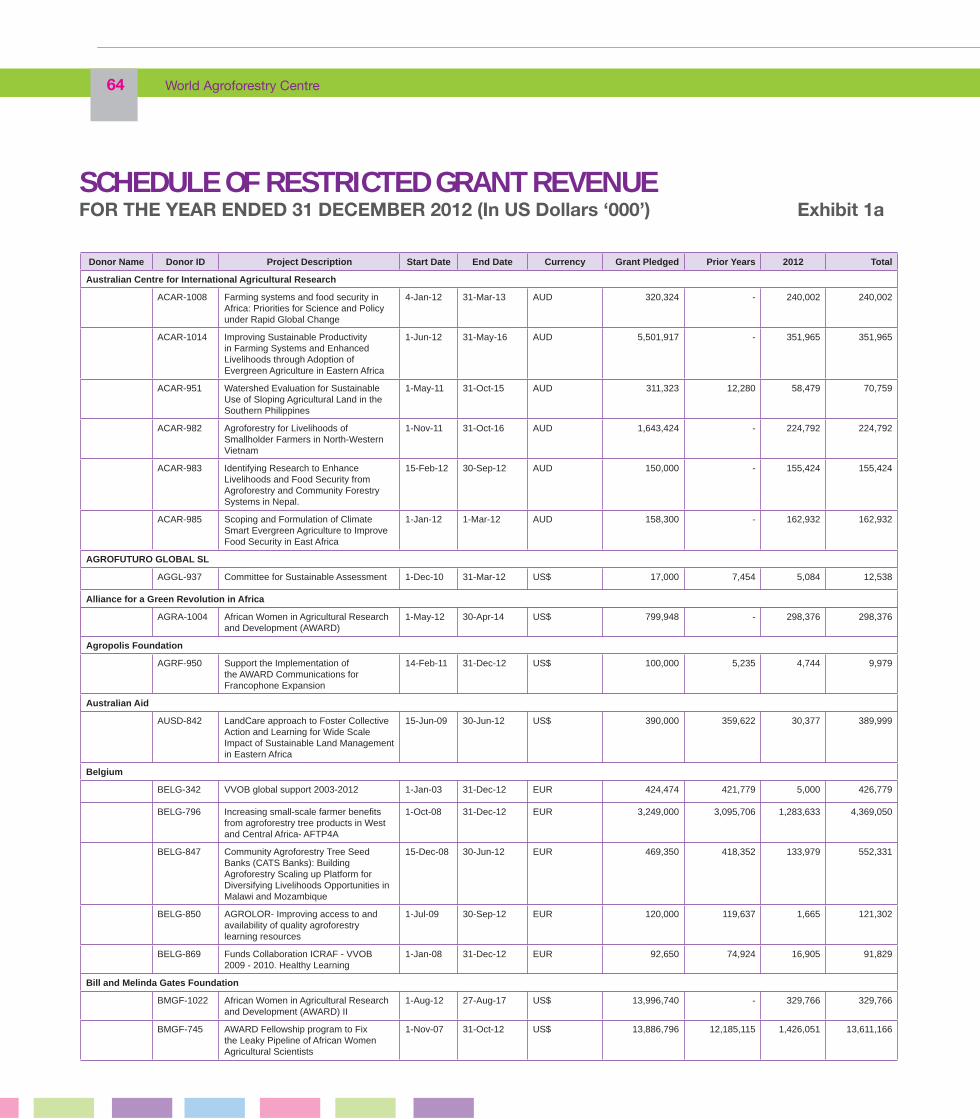
64 World Agroforestry Centre
SCHEDULE OF RESTRICTED GRANT REVENUEFOR THE YEAR ENDED 31 DECEMBER 2012 (In US Dollars ‘000’) Exhibit 1a
Donor Name Donor ID Project Description Start Date End Date Currency Grant Pledged Prior Years 2012 Total
Australian Centre for International Agricultural Research
ACAR-1008 Farming systems and food security in Africa: Priorities for Science and Policy under Rapid Global Change
4-Jan-12 31-Mar-13 AUD 320,324 - 240,002 240,002
ACAR-1014 Improving Sustainable Productivity in Farming Systems and Enhanced Livelihoods through Adoption of Evergreen Agriculture in Eastern Africa
1-Jun-12 31-May-16 AUD 5,501,917 - 351,965 351,965
ACAR-951 Watershed Evaluation for Sustainable Use of Sloping Agricultural Land in the Southern Philippines
1-May-11 31-Oct-15 AUD 311,323 12,280 58,479 70,759
ACAR-982 Agroforestry for Livelihoods of Smallholder Farmers in North-Western Vietnam
1-Nov-11 31-Oct-16 AUD 1,643,424 - 224,792 224,792
ACAR-983 Identifying Research to Enhance Livelihoods and Food Security from Agroforestry and Community Forestry Systems in Nepal.
15-Feb-12 30-Sep-12 AUD 150,000 - 155,424 155,424
ACAR-985 Scoping and Formulation of Climate Smart Evergreen Agriculture to Improve Food Security in East Africa
1-Jan-12 1-Mar-12 AUD 158,300 - 162,932 162,932
AGROFUTURO GLOBAL SL
AGGL-937 Committee for Sustainable Assessment 1-Dec-10 31-Mar-12 US$ 17,000 7,454 5,084 12,538
Alliance for a Green Revolution in Africa
AGRA-1004 African Women in Agricultural Research and Development (AWARD)
1-May-12 30-Apr-14 US$ 799,948 - 298,376 298,376
Agropolis Foundation
AGRF-950 Support the Implementation of the AWARD Communications for Francophone Expansion
14-Feb-11 31-Dec-12 US$ 100,000 5,235 4,744 9,979
Australian Aid
AUSD-842 LandCare approach to Foster Collective Action and Learning for Wide Scale Impact of Sustainable Land Management in Eastern Africa
15-Jun-09 30-Jun-12 US$ 390,000 359,622 30,377 389,999
Belgium
BELG-342 VVOB global support 2003-2012 1-Jan-03 31-Dec-12 EUR 424,474 421,779 5,000 426,779
BELG-796 Increasing small-scale farmer benefits from agroforestry tree products in West and Central Africa- AFTP4A
1-Oct-08 31-Dec-12 EUR 3,249,000 3,095,706 1,283,633 4,369,050
BELG-847 Community Agroforestry Tree Seed Banks (CATS Banks): Building Agroforestry Scaling up Platform for Diversifying Livelihoods Opportunities in Malawi and Mozambique
15-Dec-08 30-Jun-12 EUR 469,350 418,352 133,979 552,331
BELG-850 AGROLOR- Improving access to and availability of quality agroforestry learning resources
1-Jul-09 30-Sep-12 EUR 120,000 119,637 1,665 121,302
BELG-869 Funds Collaboration ICRAF - VVOB 2009 - 2010. Healthy Learning
1-Jan-08 31-Dec-12 EUR 92,650 74,924 16,905 91,829
Bill and Melinda Gates Foundation
BMGF-1022 African Women in Agricultural Research and Development (AWARD) II
1-Aug-12 27-Aug-17 US$ 13,996,740 - 329,766 329,766
BMGF-745 AWARD Fellowship program to Fix the Leaky Pipeline of African Women Agricultural Scientists
1-Nov-07 31-Oct-12 US$ 13,886,796 12,185,115 1,426,051 13,611,166
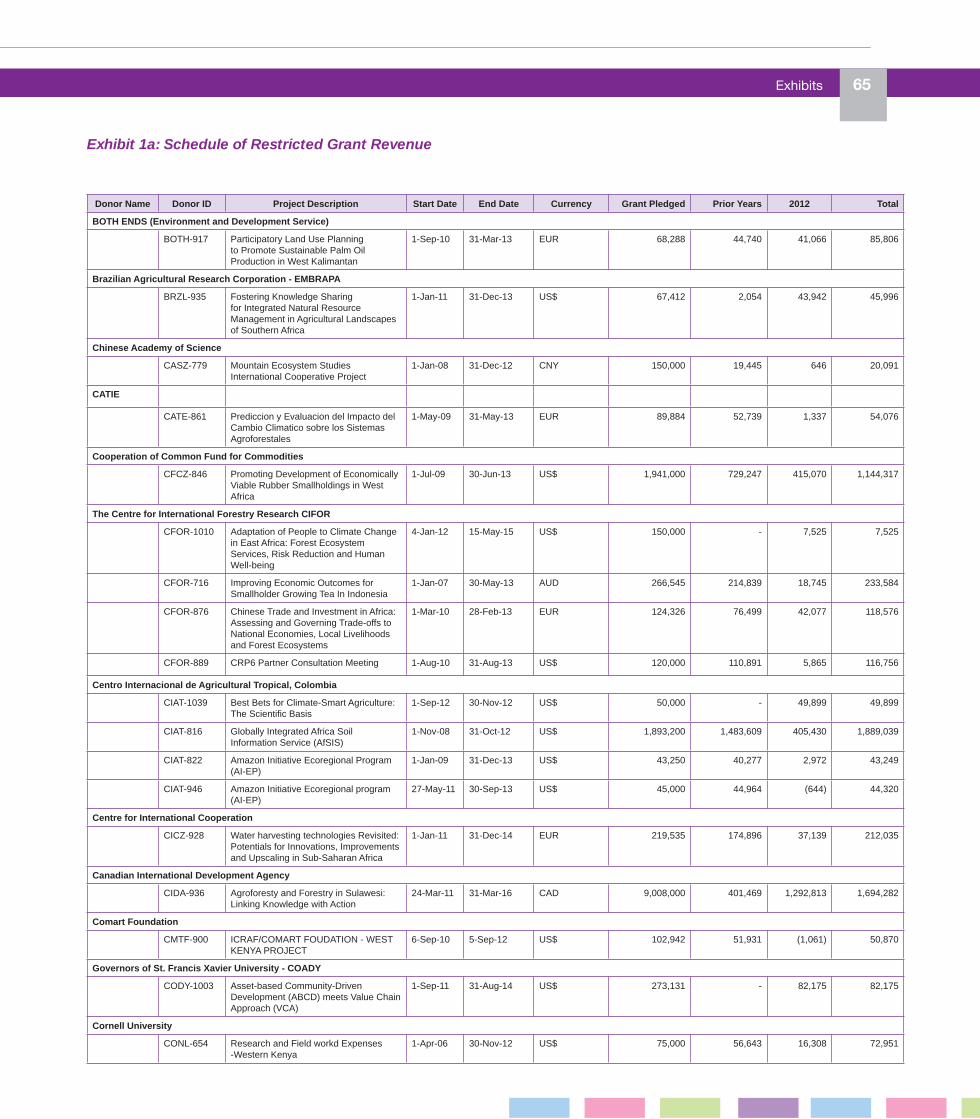
Exhibits 65
Donor Name Donor ID Project Description Start Date End Date Currency Grant Pledged Prior Years 2012 Total
BOTH ENDS (Environment and Development Service)
BOTH-917 Participatory Land Use Planning to Promote Sustainable Palm Oil Production in West Kalimantan
1-Sep-10 31-Mar-13 EUR 68,288 44,740 41,066 85,806
Brazilian Agricultural Research Corporation - EMBRAPA
BRZL-935 Fostering Knowledge Sharing for Integrated Natural Resource Management in Agricultural Landscapes of Southern Africa
1-Jan-11 31-Dec-13 US$ 67,412 2,054 43,942 45,996
Chinese Academy of Science
CASZ-779 Mountain Ecosystem Studies International Cooperative Project
1-Jan-08 31-Dec-12 CNY 150,000 19,445 646 20,091
CATIE
CATE-861 Prediccion y Evaluacion del Impacto del Cambio Climatico sobre los Sistemas Agroforestales
1-May-09 31-May-13 EUR 89,884 52,739 1,337 54,076
Cooperation of Common Fund for Commodities
CFCZ-846 Promoting Development of Economically Viable Rubber Smallholdings in West Africa
1-Jul-09 30-Jun-13 US$ 1,941,000 729,247 415,070 1,144,317
The Centre for International Forestry Research CIFOR
CFOR-1010 Adaptation of People to Climate Change in East Africa: Forest Ecosystem Services, Risk Reduction and Human Well-being
4-Jan-12 15-May-15 US$ 150,000 - 7,525 7,525
CFOR-716 Improving Economic Outcomes for Smallholder Growing Tea In Indonesia
1-Jan-07 30-May-13 AUD 266,545 214,839 18,745 233,584
CFOR-876 Chinese Trade and Investment in Africa: Assessing and Governing Trade-offs to National Economies, Local Livelihoods and Forest Ecosystems
1-Mar-10 28-Feb-13 EUR 124,326 76,499 42,077 118,576
CFOR-889 CRP6 Partner Consultation Meeting 1-Aug-10 31-Aug-13 US$ 120,000 110,891 5,865 116,756
Centro Internacional de Agricultural Tropical, Colombia
CIAT-1039 Best Bets for Climate-Smart Agriculture: The Scientific Basis
1-Sep-12 30-Nov-12 US$ 50,000 - 49,899 49,899
CIAT-816 Globally Integrated Africa Soil Information Service (AfSIS)
1-Nov-08 31-Oct-12 US$ 1,893,200 1,483,609 405,430 1,889,039
CIAT-822 Amazon Initiative Ecoregional Program (AI-EP)
1-Jan-09 31-Dec-13 US$ 43,250 40,277 2,972 43,249
CIAT-946 Amazon Initiative Ecoregional program (AI-EP)
27-May-11 30-Sep-13 US$ 45,000 44,964 (644) 44,320
Centre for International Cooperation
CICZ-928 Water harvesting technologies Revisited: Potentials for Innovations, Improvements and Upscaling in Sub-Saharan Africa
1-Jan-11 31-Dec-14 EUR 219,535 174,896 37,139 212,035
Canadian International Development Agency
CIDA-936 Agroforesty and Forestry in Sulawesi: Linking Knowledge with Action
24-Mar-11 31-Mar-16 CAD 9,008,000 401,469 1,292,813 1,694,282
Comart Foundation
CMTF-900 ICRAF/COMART FOUDATION - WEST KENYA PROJECT
6-Sep-10 5-Sep-12 US$ 102,942 51,931 (1,061) 50,870
Governors of St. Francis Xavier University - COADY
CODY-1003 Asset-based Community-Driven Development (ABCD) meets Value Chain Approach (VCA)
1-Sep-11 31-Aug-14 US$ 273,131 - 82,175 82,175
Cornell University
CONL-654 Research and Field workd Expenses -Western Kenya
1-Apr-06 30-Nov-12 US$ 75,000 56,643 16,308 72,951
Exhibit 1a: Schedule of Restricted Grant Revenue
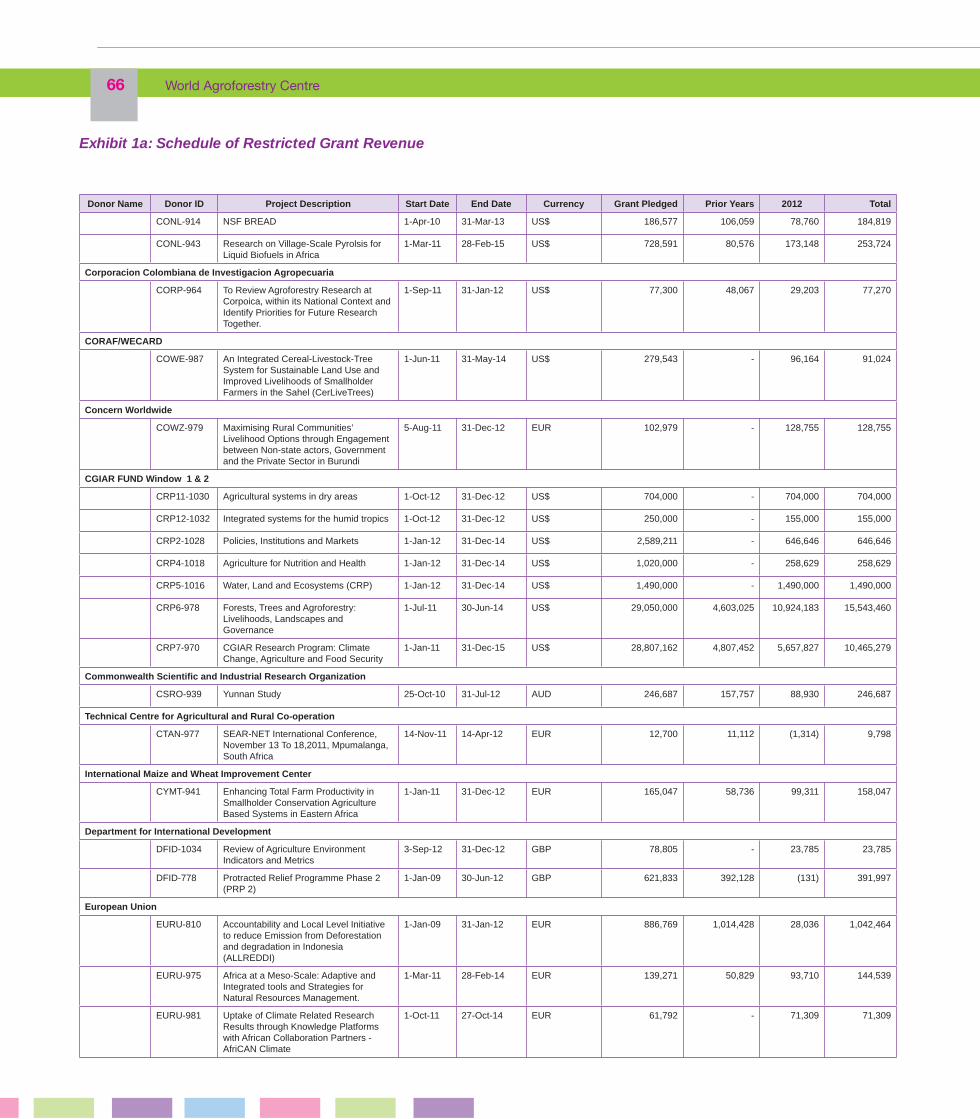
66 World Agroforestry Centre
Donor Name Donor ID Project Description Start Date End Date Currency Grant Pledged Prior Years 2012 Total
CONL-914 NSF BREAD 1-Apr-10 31-Mar-13 US$ 186,577 106,059 78,760 184,819
CONL-943 Research on Village-Scale Pyrolsis for Liquid Biofuels in Africa
1-Mar-11 28-Feb-15 US$ 728,591 80,576 173,148 253,724
Corporacion Colombiana de Investigacion Agropecuaria
CORP-964 To Review Agroforestry Research at Corpoica, within its National Context and Identify Priorities for Future Research Together.
1-Sep-11 31-Jan-12 US$ 77,300 48,067 29,203 77,270
CORAF/WECARD
COWE-987 An Integrated Cereal-Livestock-Tree System for Sustainable Land Use and Improved Livelihoods of Smallholder Farmers in the Sahel (CerLiveTrees)
1-Jun-11 31-May-14 US$ 279,543 - 96,164 91,024
Concern Worldwide
COWZ-979 Maximising Rural Communities’ Livelihood Options through Engagement between Non-state actors, Government and the Private Sector in Burundi
5-Aug-11 31-Dec-12 EUR 102,979 - 128,755 128,755
CGIAR FUND Window 1 & 2
CRP11-1030 Agricultural systems in dry areas 1-Oct-12 31-Dec-12 US$ 704,000 - 704,000 704,000
CRP12-1032 Integrated systems for the humid tropics 1-Oct-12 31-Dec-12 US$ 250,000 - 155,000 155,000
CRP2-1028 Policies, Institutions and Markets 1-Jan-12 31-Dec-14 US$ 2,589,211 - 646,646 646,646
CRP4-1018 Agriculture for Nutrition and Health 1-Jan-12 31-Dec-14 US$ 1,020,000 - 258,629 258,629
CRP5-1016 Water, Land and Ecosystems (CRP) 1-Jan-12 31-Dec-14 US$ 1,490,000 - 1,490,000 1,490,000
CRP6-978 Forests, Trees and Agroforestry: Livelihoods, Landscapes and Governance
1-Jul-11 30-Jun-14 US$ 29,050,000 4,603,025 10,924,183 15,543,460
CRP7-970 CGIAR Research Program: Climate Change, Agriculture and Food Security
1-Jan-11 31-Dec-15 US$ 28,807,162 4,807,452 5,657,827 10,465,279
Commonwealth Scientific and Industrial Research Organization
CSRO-939 Yunnan Study 25-Oct-10 31-Jul-12 AUD 246,687 157,757 88,930 246,687
Technical Centre for Agricultural and Rural Co-operation
CTAN-977 SEAR-NET International Conference, November 13 To 18,2011, Mpumalanga, South Africa
14-Nov-11 14-Apr-12 EUR 12,700 11,112 (1,314) 9,798
International Maize and Wheat Improvement Center
CYMT-941 Enhancing Total Farm Productivity in Smallholder Conservation Agriculture Based Systems in Eastern Africa
1-Jan-11 31-Dec-12 EUR 165,047 58,736 99,311 158,047
Department for International Development
DFID-1034 Review of Agriculture Environment Indicators and Metrics
3-Sep-12 31-Dec-12 GBP 78,805 - 23,785 23,785
DFID-778 Protracted Relief Programme Phase 2 (PRP 2)
1-Jan-09 30-Jun-12 GBP 621,833 392,128 (131) 391,997
European Union
EURU-810 Accountability and Local Level Initiative to reduce Emission from Deforestation and degradation in Indonesia (ALLREDDI)
1-Jan-09 31-Jan-12 EUR 886,769 1,014,428 28,036 1,042,464
EURU-975 Africa at a Meso-Scale: Adaptive and Integrated tools and Strategies for Natural Resources Management.
1-Mar-11 28-Feb-14 EUR 139,271 50,829 93,710 144,539
EURU-981 Uptake of Climate Related Research Results through Knowledge Platforms with African Collaboration Partners - AfriCAN Climate
1-Oct-11 27-Oct-14 EUR 61,792 - 71,309 71,309
Exhibit 1a: Schedule of Restricted Grant Revenue
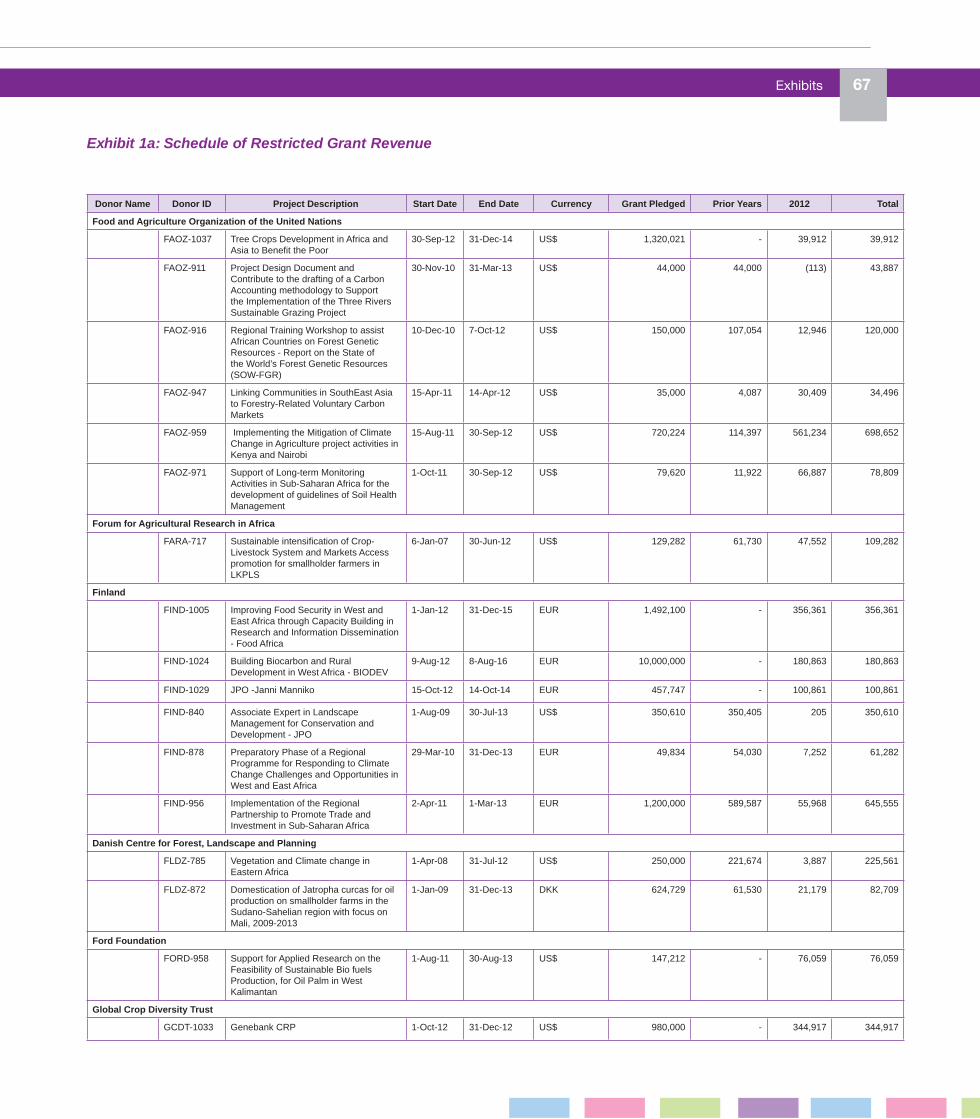
Exhibits 67
Exhibit 1a: Schedule of Restricted Grant Revenue
Donor Name Donor ID Project Description Start Date End Date Currency Grant Pledged Prior Years 2012 Total
Food and Agriculture Organization of the United Nations
FAOZ-1037 Tree Crops Development in Africa and Asia to Benefit the Poor
30-Sep-12 31-Dec-14 US$ 1,320,021 - 39,912 39,912
FAOZ-911 Project Design Document and Contribute to the drafting of a Carbon Accounting methodology to Support the Implementation of the Three Rivers Sustainable Grazing Project
30-Nov-10 31-Mar-13 US$ 44,000 44,000 (113) 43,887
FAOZ-916 Regional Training Workshop to assist African Countries on Forest Genetic Resources - Report on the State of the World’s Forest Genetic Resources (SOW-FGR)
10-Dec-10 7-Oct-12 US$ 150,000 107,054 12,946 120,000
FAOZ-947 Linking Communities in SouthEast Asia to Forestry-Related Voluntary Carbon Markets
15-Apr-11 14-Apr-12 US$ 35,000 4,087 30,409 34,496
FAOZ-959 Implementing the Mitigation of Climate Change in Agriculture project activities in Kenya and Nairobi
15-Aug-11 30-Sep-12 US$ 720,224 114,397 561,234 698,652
FAOZ-971 Support of Long-term Monitoring Activities in Sub-Saharan Africa for the development of guidelines of Soil Health Management
1-Oct-11 30-Sep-12 US$ 79,620 11,922 66,887 78,809
Forum for Agricultural Research in Africa
FARA-717 Sustainable intensification of Crop-Livestock System and Markets Access promotion for smallholder farmers in LKPLS
6-Jan-07 30-Jun-12 US$ 129,282 61,730 47,552 109,282
Finland
FIND-1005 Improving Food Security in West and East Africa through Capacity Building in Research and Information Dissemination - Food Africa
1-Jan-12 31-Dec-15 EUR 1,492,100 - 356,361 356,361
FIND-1024 Building Biocarbon and Rural Development in West Africa - BIODEV
9-Aug-12 8-Aug-16 EUR 10,000,000 - 180,863 180,863
FIND-1029 JPO -Janni Manniko 15-Oct-12 14-Oct-14 EUR 457,747 - 100,861 100,861
FIND-840 Associate Expert in Landscape Management for Conservation and Development - JPO
1-Aug-09 30-Jul-13 US$ 350,610 350,405 205 350,610
FIND-878 Preparatory Phase of a Regional Programme for Responding to Climate Change Challenges and Opportunities in West and East Africa
29-Mar-10 31-Dec-13 EUR 49,834 54,030 7,252 61,282
FIND-956 Implementation of the Regional Partnership to Promote Trade and Investment in Sub-Saharan Africa
2-Apr-11 1-Mar-13 EUR 1,200,000 589,587 55,968 645,555
Danish Centre for Forest, Landscape and Planning
FLDZ-785 Vegetation and Climate change in Eastern Africa
1-Apr-08 31-Jul-12 US$ 250,000 221,674 3,887 225,561
FLDZ-872 Domestication of Jatropha curcas for oil production on smallholder farms in the Sudano-Sahelian region with focus on Mali, 2009-2013
1-Jan-09 31-Dec-13 DKK 624,729 61,530 21,179 82,709
Ford Foundation
FORD-958 Support for Applied Research on the Feasibility of Sustainable Bio fuels Production, for Oil Palm in West Kalimantan
1-Aug-11 30-Aug-13 US$ 147,212 - 76,059 76,059
Global Crop Diversity Trust
GCDT-1033 Genebank CRP 1-Oct-12 31-Dec-12 US$ 980,000 - 344,917 344,917

68 World Agroforestry Centre
Donor Name Donor ID Project Description Start Date End Date Currency Grant Pledged Prior Years 2012 Total
Global Food and Farming Futures
GFFF-875 Foresight Global Food and Farming Futures
1-Apr-10 30-Apr-13 US$ 90,200 74,019 15,997 90,016
Global Forum for Rural Advisory Services
GFRS-955 Logistic Support to GFRAS for the GFRAS Annual meeting, the International Conference (Innovations in Extension and Advisory Services) and the GFRAS Steering Committee Meeting, in Nairobi, November 2011
2-Apr-11 1-Mar-13 US$ 253,000 242,240 2,054 244,294
Deutsche Gessellschaft fur Technische Zusammenarbeit - GTZ
GTZG-817 Making the Mekong Connected (MMC): Development of carbon market and conservation financing mechanisms for multifunctional landscape bio-corridors in the Upper Mekong
1-Mar-09 28-Feb-12 EUR 1,198,000 837,246 712,801 1,550,047
GTZG-965 Provide ACCI with Scenario of Climate Change & Variability & its Potential Effects on the Main Farming Activities
22-Aug-11 31-Oct-13 US$ 50,131 14,540 35,576 50,116
Heifer International
HFER-749 East Africa Dairy Development (EADD) 15-Dec-07 30-Jun-13 US$ 2,472,275 2,117,128 348,199 2,465,327
Harvard University
HVUN-780 Allocation of incentive contracts for environmental service provision in agricultural landscapes
1-Jun-08 31-Dec-13 US$ 42,274 27,500 14,774 42,274
World Bank
IBRD-774 Study on Hydrological Services in Sasumua Watershed
1-Aug-08 31-Dec-13 US$ 102,000 85,851 16,149 102,000
IBRD-834 Capacity Building Program on the Opportunity Costs of Reducing Emissions from Deforestation and Land Use Change
1-Jun-09 31-Mar-13 US$ 420,538 346,972 73,566 420,538
IBRD-856 Financing Implementation of 2009 Work Program
1-Sep-09 30-Aug-13 US$ 561,392 352,230 130 352,360
IBRD-929 Tree-based Technologies for Landscape Restoration in Africa
18-Feb-11 30-Jun-13 US$ 30,000 25,145 4,855 30,000
International Center for Agricultural Research in the Dry Areas
ICAD-907 MP1.1 Dry Areas Planning Meeting 1-Jul-10 31-Dec-13 US$ 195,577 194,112 1,465 195,577
India Council for Agricultural Research
ICAR-851 Enabling Small Holders to Improve their Livelihoods and Benefit from Carbon Finance under the National Agricultural Innovation Project (NAIP)
1-Jun-09 30-Apr-13 INR 26,536,000 29,502 13,972 43,474
ICAR-984 Enabling Small Holder Vulnerable Communities to Secure Sustainable Livelihoods under Changing Climate in India
27-Aug-11 26-Aug-14 INR 9,800,000 - 48,435 48,435
International Cooperation Center for Agricultural Education - Nagoya University
ICCA-891 Japan Capacity Building Program for African Agricultural Researchers
26-Sep-10 16-Oct-13 US$ 9,600 8,573 1,027 9,600
ICLARM
ICLM-953 From Ridge to Reef: An Ecosystem Based Approach to Biodiversity Conservation and Development in the Philippines
2-Apr-11 1-Mar-13 US$ 243,239 83,576 146,579 230,155
International Crop Reseach Institute for the Semi Arid Tropics
ICRI-1026 Africa Rising: Sustainable Intensification of Cereal-Based Farming Systems in the Sudano-Sahelian Zone
6-Jan-12 30-Sep-13 US$ 101,705 - 101,696 101,696
Exhibit 1a: Schedule of Restricted Grant Revenue
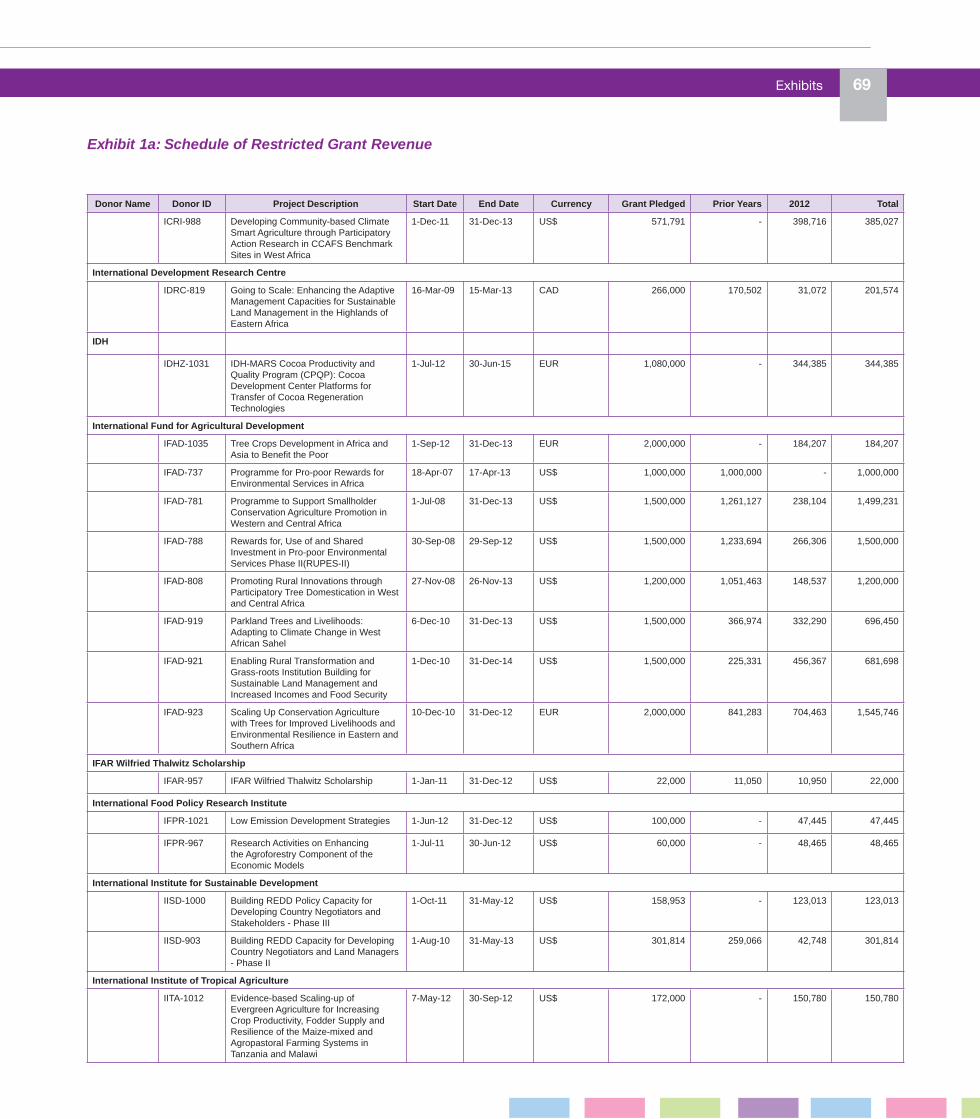
Exhibits 69
Exhibit 1a: Schedule of Restricted Grant Revenue
Donor Name Donor ID Project Description Start Date End Date Currency Grant Pledged Prior Years 2012 Total
ICRI-988 Developing Community-based Climate Smart Agriculture through Participatory Action Research in CCAFS Benchmark Sites in West Africa
1-Dec-11 31-Dec-13 US$ 571,791 - 398,716 385,027
International Development Research Centre
IDRC-819 Going to Scale: Enhancing the Adaptive Management Capacities for Sustainable Land Management in the Highlands of Eastern Africa
16-Mar-09 15-Mar-13 CAD 266,000 170,502 31,072 201,574
IDH
IDHZ-1031 IDH-MARS Cocoa Productivity and Quality Program (CPQP): Cocoa Development Center Platforms for Transfer of Cocoa Regeneration Technologies
1-Jul-12 30-Jun-15 EUR 1,080,000 - 344,385 344,385
International Fund for Agricultural Development
IFAD-1035 Tree Crops Development in Africa and Asia to Benefit the Poor
1-Sep-12 31-Dec-13 EUR 2,000,000 - 184,207 184,207
IFAD-737 Programme for Pro-poor Rewards for Environmental Services in Africa
18-Apr-07 17-Apr-13 US$ 1,000,000 1,000,000 - 1,000,000
IFAD-781 Programme to Support Smallholder Conservation Agriculture Promotion in Western and Central Africa
1-Jul-08 31-Dec-13 US$ 1,500,000 1,261,127 238,104 1,499,231
IFAD-788 Rewards for, Use of and Shared Investment in Pro-poor Environmental Services Phase II(RUPES-II)
30-Sep-08 29-Sep-12 US$ 1,500,000 1,233,694 266,306 1,500,000
IFAD-808 Promoting Rural Innovations through Participatory Tree Domestication in West and Central Africa
27-Nov-08 26-Nov-13 US$ 1,200,000 1,051,463 148,537 1,200,000
IFAD-919 Parkland Trees and Livelihoods: Adapting to Climate Change in West African Sahel
6-Dec-10 31-Dec-13 US$ 1,500,000 366,974 332,290 696,450
IFAD-921 Enabling Rural Transformation and Grass-roots Institution Building for Sustainable Land Management and Increased Incomes and Food Security
1-Dec-10 31-Dec-14 US$ 1,500,000 225,331 456,367 681,698
IFAD-923 Scaling Up Conservation Agriculture with Trees for Improved Livelihoods and Environmental Resilience in Eastern and Southern Africa
10-Dec-10 31-Dec-12 EUR 2,000,000 841,283 704,463 1,545,746
IFAR Wilfried Thalwitz Scholarship
IFAR-957 IFAR Wilfried Thalwitz Scholarship 1-Jan-11 31-Dec-12 US$ 22,000 11,050 10,950 22,000
International Food Policy Research Institute
IFPR-1021 Low Emission Development Strategies 1-Jun-12 31-Dec-12 US$ 100,000 - 47,445 47,445
IFPR-967 Research Activities on Enhancing the Agroforestry Component of the Economic Models
1-Jul-11 30-Jun-12 US$ 60,000 - 48,465 48,465
International Institute for Sustainable Development
IISD-1000 Building REDD Policy Capacity for Developing Country Negotiators and Stakeholders - Phase III
1-Oct-11 31-May-12 US$ 158,953 - 123,013 123,013
IISD-903 Building REDD Capacity for Developing Country Negotiators and Land Managers - Phase II
1-Aug-10 31-May-13 US$ 301,814 259,066 42,748 301,814
International Institute of Tropical Agriculture
IITA-1012 Evidence-based Scaling-up of Evergreen Agriculture for Increasing Crop Productivity, Fodder Supply and Resilience of the Maize-mixed and Agropastoral Farming Systems in Tanzania and Malawi
7-May-12 30-Sep-12 US$ 172,000 - 150,780 150,780

70 World Agroforestry Centre
Donor Name Donor ID Project Description Start Date End Date Currency Grant Pledged Prior Years 2012 Total
International Livestock Research Institute
ILRI-1025 Sustainable Tree-Crop-Livestock Intensification as a Pillar for the Ethiopian Climate Resilient Green Economy Initiative
5-Jan-12 31-Oct-12 US$ 135,000 - 65,971 65,971
ILRI-973 Livelihood Diversifying Potential of Livestock Based Carbon Sequestration Options in Pastoral and Agropastoral Systems in Africa
1-Apr-11 31-Mar-14 EUR 160,171 - 99,029 99,029
Government of India
INDA-980 Research grant 1-Jan-12 31-Dec-13 US$ 150,000 - 28,476 28,476
Indonesian Palm Oil Commission
IPOC-841 Research on the Study Accounting for Greenhouse gas Emissions
1-May-09 30-Apr-13 US$ 398,232 398,232 (17,036) 381,196
Ireland
IRLD-1007 Agroforestry Food Security Programme (AFSP) Phase II
4-Jan-12 31-Mar-15 EUR 2,000,000 - 462,172 458,432
IRLD-720 Malawi Agroforestry Food Security Programme
1-Jan-07 31-Dec-13 EUR 5,417,475 5,412,810 4,664 5,417,474
IRLD-795 Cooperation with Irish Universities and Research Institutes
1-Apr-08 31-Mar-13 EUR 150,000 85,823 15,169 100,992
International Water Management Institute
IWMI-913 CPWF Nile 2 Project in Ethiopia 1-Nov-10 31-Mar-14 US$ 199,801 152,705 32,584 185,289
Japan
JPAN-753 Bioenergy Provision within Agroforestry Systems in East Africa
1-Apr-07 31-Mar-13 US$ 584,294 368,862 172,432 541,294
Japan International Research Center For Agricultural Sciences
JRAS-742 Japan-CGIAR Fellowship Programme- 2007-2011
30-Sep-06 31-Aug-13 US$ 20,225 19,450 775 20,225
Kenya
KENY-904 Agri-business Development with Irrigation Solutions for Sustainable Food Security, Economic Empowerment and Economic Growth
30-Sep-10 29-Sep-13 US$ 590,000 230,711 74,665 305,376
Universite LAVAL
LAUN-989 Accroitre la Securite alimentaire en associant etroitement elevage, arbres et cultures par la pratique de l´agroforesterie au Mali
2-Feb-12 1-Dec-14 CAD 281,257 - 107,024 90,301
LEUSER NOEL
LIFZ-818 Leuser Nurseries of Excellence(NOEL) Program: Community Nurseries for land rehabilitation, livelihood enhancement and biodiversity conservation
13-Mar-09 31-Mar-13 US$ 169,831 157,197 (6,445) 150,752
Margaret A. Cargill Foundation
MACF-1036 Protecting Biovdiversity through Improved Community Forest Management and Agforestry
1-Sep-12 31-Aug-15 US$ 1,206,975 - - -
Mars Inc
MARS-619 Trees and Markets 1-Jan-06 31-Dec-13 US$ 182,583 134,566 48,017 182,583
MARS-867 To Support the Development of Sustainable Cocoa Production in West Africa through Setting Baseline and Systems for Soil and Carbon Assessment
1-Nov-09 31-Dec-13 US$ 295,000 167,355 69,063 236,418
MARS-894 MARS GLOBAL CHOCOLATE 6-Jan-10 31-Dec-13 US$ 366,500 366,359 141 366,500
Exhibit 1a: Schedule of Restricted Grant Revenue
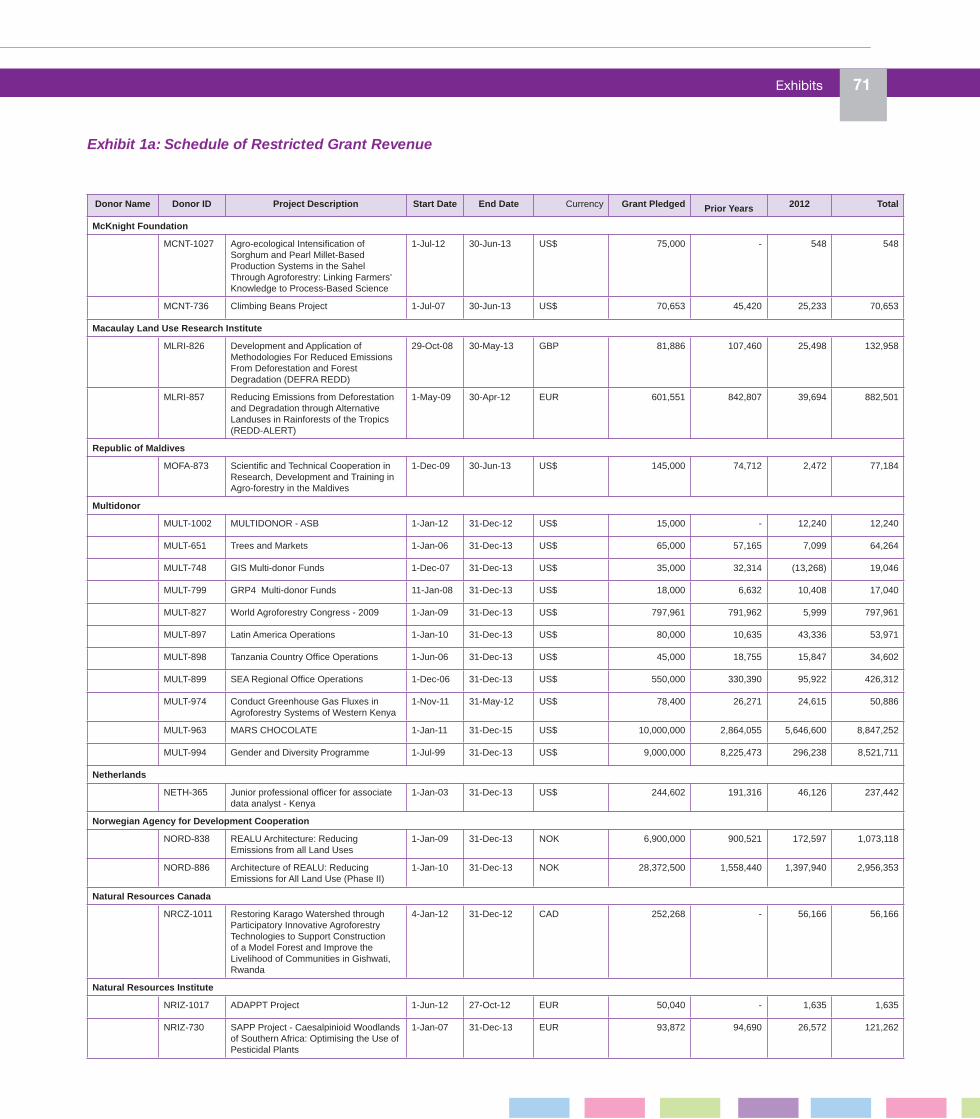
Exhibits 71
Exhibit 1a: Schedule of Restricted Grant Revenue
Donor Name Donor ID Project Description Start Date End Date Currency Grant Pledged Prior Years 2012 Total
McKnight Foundation
MCNT-1027 Agro-ecological Intensification of Sorghum and Pearl Millet-Based Production Systems in the Sahel Through Agroforestry: Linking Farmers’ Knowledge to Process-Based Science
1-Jul-12 30-Jun-13 US$ 75,000 - 548 548
MCNT-736 Climbing Beans Project 1-Jul-07 30-Jun-13 US$ 70,653 45,420 25,233 70,653
Macaulay Land Use Research Institute
MLRI-826 Development and Application of Methodologies For Reduced Emissions From Deforestation and Forest Degradation (DEFRA REDD)
29-Oct-08 30-May-13 GBP 81,886 107,460 25,498 132,958
MLRI-857 Reducing Emissions from Deforestation and Degradation through Alternative Landuses in Rainforests of the Tropics (REDD-ALERT)
1-May-09 30-Apr-12 EUR 601,551 842,807 39,694 882,501
Republic of Maldives
MOFA-873 Scientific and Technical Cooperation in Research, Development and Training in Agro-forestry in the Maldives
1-Dec-09 30-Jun-13 US$ 145,000 74,712 2,472 77,184
Multidonor
MULT-1002 MULTIDONOR - ASB 1-Jan-12 31-Dec-12 US$ 15,000 - 12,240 12,240
MULT-651 Trees and Markets 1-Jan-06 31-Dec-13 US$ 65,000 57,165 7,099 64,264
MULT-748 GIS Multi-donor Funds 1-Dec-07 31-Dec-13 US$ 35,000 32,314 (13,268) 19,046
MULT-799 GRP4 Multi-donor Funds 11-Jan-08 31-Dec-13 US$ 18,000 6,632 10,408 17,040
MULT-827 World Agroforestry Congress - 2009 1-Jan-09 31-Dec-13 US$ 797,961 791,962 5,999 797,961
MULT-897 Latin America Operations 1-Jan-10 31-Dec-13 US$ 80,000 10,635 43,336 53,971
MULT-898 Tanzania Country Office Operations 1-Jun-06 31-Dec-13 US$ 45,000 18,755 15,847 34,602
MULT-899 SEA Regional Office Operations 1-Dec-06 31-Dec-13 US$ 550,000 330,390 95,922 426,312
MULT-974 Conduct Greenhouse Gas Fluxes in Agroforestry Systems of Western Kenya
1-Nov-11 31-May-12 US$ 78,400 26,271 24,615 50,886
MULT-963 MARS CHOCOLATE 1-Jan-11 31-Dec-15 US$ 10,000,000 2,864,055 5,646,600 8,847,252
MULT-994 Gender and Diversity Programme 1-Jul-99 31-Dec-13 US$ 9,000,000 8,225,473 296,238 8,521,711
Netherlands
NETH-365 Junior professional officer for associate data analyst - Kenya
1-Jan-03 31-Dec-13 US$ 244,602 191,316 46,126 237,442
Norwegian Agency for Development Cooperation
NORD-838 REALU Architecture: Reducing Emissions from all Land Uses
1-Jan-09 31-Dec-13 NOK 6,900,000 900,521 172,597 1,073,118
NORD-886 Architecture of REALU: Reducing Emissions for All Land Use (Phase II)
1-Jan-10 31-Dec-13 NOK 28,372,500 1,558,440 1,397,940 2,956,353
Natural Resources Canada
NRCZ-1011 Restoring Karago Watershed through Participatory Innovative Agroforestry Technologies to Support Construction of a Model Forest and Improve the Livelihood of Communities in Gishwati, Rwanda
4-Jan-12 31-Dec-12 CAD 252,268 - 56,166 56,166
Natural Resources Institute
NRIZ-1017 ADAPPT Project 1-Jun-12 27-Oct-12 EUR 50,040 - 1,635 1,635
NRIZ-730 SAPP Project - Caesalpinioid Woodlands of Southern Africa: Optimising the Use of Pesticidal Plants
1-Jan-07 31-Dec-13 EUR 93,872 94,690 26,572 121,262

72 World Agroforestry Centre
Donor Name Donor ID Project Description Start Date End Date Currency Grant Pledged Prior Years 2012 Total
National Smallholder Farmers’ Association of Malawi
NSFM-906 Increasing Benefits to Smallholder Farmers From Improved Soil Fertility through Integration of Pigeon Peas, Groundnuts and Conservation Agriculture in Maize Production Systems of Malawi
1-Jan-10 31-Dec-12 US$ 105,734 49,979 55,755 105,734
Overseas Development Institute
ODIT-924 Bioenergy in Africa - Jatropha 21-Dec-10 15-Mar-13 US$ 15,106 13,892 1,214 15,106
Peru
PERU-930 Investigación agroforestal amazónica para usos de la tierra con alta provisión de servicios ambientales, bajas emisiones de gases y rentabilidad económica- (2011-2013)
1-Jan-11 31-Dec-13 US$ 90,000 51,177 35,346 86,523
Rwanda Agricultural Development Authority
RADA-865 Sustainable Land Management Project (Rwanda)
5-Nov-09 30-Apr-13 US$ 265,671 265,671 (57,143) 208,528
Rainwater Harvesting Implementation Network Foundation
RAIN-1009 Institutional Strengthening of Southern and Eastern Africa Rainwater Network - SEARNET Conference.
21-Feb-12 31-Dec-12 EUR 37,485 - 37,800 37,800
RAIN-952 Mapping Interventions and Assessing Financing Mechanisms and Institutional Frameworks for Sustainable Promotion of Rainwater Harvesting
1-Jul-11 31-Dec-12 EUR 62,481 71,857 (40,961) 30,896
Rights and Resources Group
RRGZ-858 Analysis of Forest Program Impacts on Environment and Ecology
1-May-09 30-Apr-12 US$ 30,000 29,215 572 29,787
Republic of South Africa Gov’t
RSAZ-1015 Department of Agriculture, Forestry and Fisheries
1-Jan-12 31-Dec-13 US$ 107,800 - 104,002 104,002
Roundtable on Sustainable Palm Oil
RSPO-938 Scientific Panel of RSPO Greenhouse Gas Working Group
1-Feb-11 31-Jul-13 US$ 26,232 26,232 (125) 26,107
Swiss Development Corporation
SDCZ-1038 Consultancy to the SDC-MoLEP Project on Sloping Land Management in DPRK
1-May-12 31-Dec-12 EUR 90,460 - 107,460 107,460
SDCZ-870 DPRK -Sustainable Sloping Land Management
1-Jan-10 31-Dec-13 EUR 100,556 136,853 351 137,204
SDCZ-931 DPRK - Sustainability and Institutionalization of Sloping Land Management
21-Feb-11 31-Dec-13 EUR 137,267 181,163 (65,654) 115,509
SDCZ-966 Climate Smart Rural Development Project
1-Oct-11 31-Dec-12 CHF 70,672 - 67,220 67,220
Swedish International Development Cooperation Agency
SIDA-912 Conservation Agriculture with Trees (CAWT)
1-Dec-10 31-Mar-12 SEK 5,000,000 282,460 405,781 688,241
Exhibit 1a: Schedule of Restricted Grant Revenue

Exhibits 73
Exhibit 1a: Schedule of Restricted Grant Revenue
Donor Name Donor ID Project Description Start Date End Date Currency Grant Pledged Prior Years 2012 Total
Swedish University of Agricultural Sciences
SLUZ-915 Agroforestry for Improving Food Security and Simultaneous Leverage on Climate Change Adaptation and Mitigation
10-Oct-10 31-Dec-13 US$ 51,664 51,561 103 51,664
SLUZ-945 Approaches for Analysing Multi-functionality of Agroforestry Systems in Western Kenya in Relation to Climate Change Adaptation and Mitigation and Multifunctionality of Agroforestry Systems
19-May-11 31-Jul-14 US$ 116,000 58,411 42,919 101,330
Tegemeo Institute of Egerton University
TIEU-1019 Improving Participation in Agricultural Commodity Markets for Smallholder Farmers in Kenya: Assessing Growth Opportunities for the Marginalized Groups
1-Jan-12 31-Jul-13 US$ 48,083 - 9,704 9,704
University of Copenhagen
UCOP-927 Impacts of Reducing Emissions from Deforestation and Forest Degradation and Enhancing Carbon Stocks - I-REDD
1-Jan-11 31-Dec-14 EUR 1,221,646 66,707 45,114 111,821
United Nations Development Programme
UNDP-726 Assessment of Carbon Sequestration in the Lowlands of Baringo District, Kenya
1-Aug-07 31-Jan-13 US$ 50,000 48,966 1,033 49,999
UNDP-805 Strategic Investment Program for Sustainable Land Management in Sub-Saharan Africa
1-Sep-08 30-Jun-13 US$ 217,532 181,096 36,436 217,532
United Nations Environment Programme
UNEP-942 Interim Secretariat of Nairobi Science and Policy Forum on Sustainability of Agroecosystems
20-Apr-11 19-Apr-12 US$ 30,000 - 22,000 22,000
UNEP-968 UN-REDD Panama Program 9-Jan-11 30-Apr-12 US$ 111,444 22,184 49,814 71,998
UNEP-969 Revisiting Climate Change within Maasai Mau Forest and its Future Implication on Maasai Mau Forest Complex’s Conservation
1-Sep-11 30-Jun-12 US$ 54,000 4,054 33,303 37,357
UNEP-976 Tools For Ecosystem Assessment And Management For Sustainability Of Water Regulation And Purification Services Are Developed And Demonstrated In Water-Stressed Countries (Four Countries)
29-Nov-11 31-Mar-12 US$ 50,000 15,790 34,210 50,000
Unilever
UNLV-616 To advance domestication of Allanblackia spp. In selected countries in Africa III
1-Dec-05 31-Dec-12 US$ 341,077 273,362 90 273,452
UNLV-932 Rooting and Germination of Allanblackia Tree/Seeds
1-Dec-11 30-Nov-13 EUR 70,000 16,387 32,156 48,543
United Nations Office for Project Services
UNOP-880 Sustainable Catchment Management and Sediment Control in the Lake Tanganyika Catchment Basin
1-May-10 30-Sep-12 US$ 580,208 483,472 96,736 580,208
United Nations University -Int’l Orgn Center
UNUZ-986 Steering Committe Meeting and the 2nd Global Conference of the International Partnership for the Satoyama Initiative (IPSI)
2-Feb-12 31-May-12 US$ 250,000 - 133,473 133,473

74 World Agroforestry Centre
Donor Name Donor ID Project Description Start Date End Date Currency Grant Pledged Prior Years 2012 Total
United States Agency for International Development
USAD-1001 Greening the Sahel, Building an Evidence Base (EGAT/GCC)
1-Oct-11 30-Sep-12 US$ 500,118 - 494,379 494,379
USAD-1020 2012 USAID VEGETABLE PROGRAM 1-Oct-11 30-Sep-12 US$ 998,250 - 998,250 998,250
USAD-130 Collaboration with universities 1-Jan-00 31-Dec-12 US$ 651,485 544,566 82,968 627,534
USAD-638 Strengthening the Careers of African Women Scientists
1-Jan-06 31-Dec-13 US$ 1,260,000 983,044 25,906 1,008,950
USAD-828 Food Security and Crisis Mitigation (Women in Science -G&D) - Phase II
1-Oct-08 30-Sep-12 US$ 1,048,160 836,962 86,386 923,348
USAD-909 Food Security and Crisis Mitigation (Women in Science -G&D) - Phase II
1-Oct-10 30-Sep-12 US$ 2,480,000 774,416 1,623,573 2,397,989
USAD-922 Mainstreaming Climate Change in Bioversity Planning and Conservation in the Philippines
13-Jan-11 12-Jan-13 US$ 992,229 202,286 649,918 852,204
USAD-972 Ecosystem Mapping in Kenya 17-Oct-11 16-Dec-13 US$ 115,357 33,014 68,178 101,192
United States Department of Agriculture
USDA-700 MINPLAPDAT/ICRAF - Food for Progress 2006
1-Jan-07 30-Dec-13 US$ 4,000,000 2,045,257 122,763 2,168,020
Vrije Universiteit AMSTERDAM
VUAZ-954 Provide Information of the Economic Benefits of Farmer Managed Natural Regeneration (FMNR) Practices and other Socio-Cultural Benefits
31-Mar-11 31-Mar-13 US$ 355,100 138,485 221,480 353,389
Wajibu MS Ltd
WABU-890 Towards projecting Land Use Impacts on Carbon Stocks and Soil Health in Kenya using Standardized Field Measurement Protocols and Satellite Image Analysis
1-Jul-10 31-Aug-13 US$ 297,426 288,774 - 288,774
World Vision
WDVN-1006 BEATING FAMINE CONFERENCE: Sustainable Food Security through Land Regeneration in a Changing Climate to be convened at ICRAF on April 10-13
4-Jan-12 30-Jun-12 US$ 126,000 - 125,806 125,806
William J. Clinton Foundation
WJCF-807 Agriculture Forestry Land USe Design Team (AFOLU-DT)
23-Dec-08 22-Dec-13 US$ 315,000 25,729 47,769 73,498
WJCF-960 Scale-up of Soybean Production in Rwanda to Improve Soil Fertility and Livelihood for Farmers
1-May-11 31-May-13 US$ 56,000 8,058 43,233 51,291
World Wildlife Fund
WWFZ-1013 Developing Agroforestry Innovations Based on Local Knowledge in Sub-Catchment Management in Uvira, Democratic Republic of Congo
1-Jan-11 30-Jun-12 US$ 22,900 - 22,900 22,900
WWFZ-836 Carbon Benefits Project: Modelling, Measurement and Monitoring
1-Apr-09 31-Dec-12 US$ 1,209,364 1,128,665 80,699 1,209,364
Leibniz Centre for Agricultural Landscape Research e.V.
ZALF-783 Climate Change Impact Assessment and Adaption Options in Vulnerable Agro-landscapes in East Africa
1-May-08 30-Apr-13 EUR 431,492 454,753 12,000 466,753
Centre for Development Research
ZEFZ-887 Auctioning of Performance Based Payments for Ecosystem Services - Experimental Design and Implementation
31-May-10 31-Jul-13 EUR 55,000 74,455 - 74,455
77,556,097 49,899,066 127,772,035
Exhibit 1a: Schedule of Restricted Grant Revenue
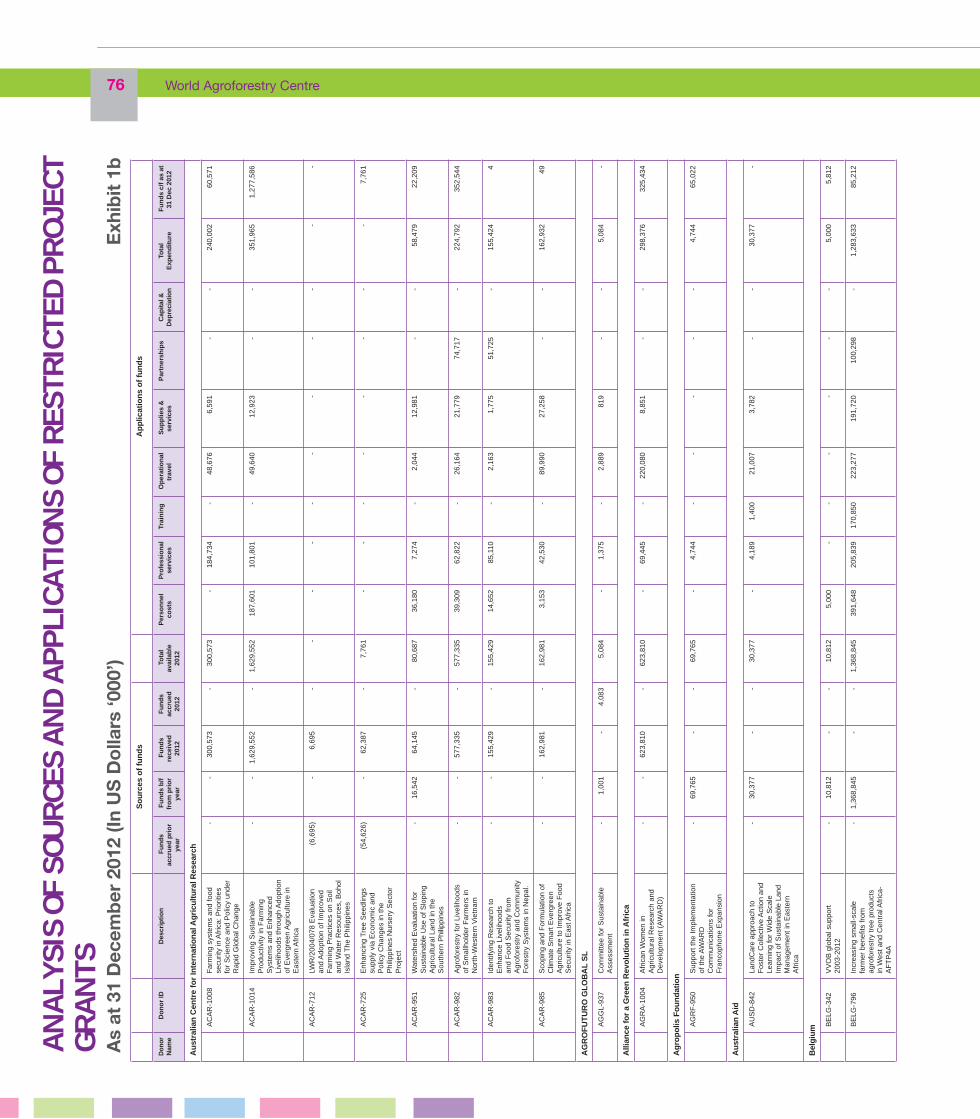
76 World Agroforestry Centre
AN
ALY
SIS
OF S
OUR
CES
AN
D A
PPLI
CATI
ONS
OF R
ESTR
ICTE
D P
ROJ
ECT
GR
AN
TS
So
urc
es o
f fu
nd
s A
pp
licat
ion
s o
f fu
nd
s
Don
or
Nam
eD
on
or
IDD
escr
ipti
on
Fu
nd
s ac
cru
ed p
rio
r ye
ar
Fu
nd
s b
/f
fro
m p
rio
r ye
ar
Fu
nd
s re
ceiv
ed
2012
Fu
nd
s ac
cru
ed
2012
To
tal
avai
lab
le
2012
Per
son
nel
co
sts
Pro
fess
iona
l se
rvic
esTr
ain
ing
Op
erat
ion
al
trav
el S
up
plie
s &
se
rvic
esP
artn
ersh
ips
Cap
ital
&
Dep
reci
atio
nTo
tal
Exp
end
itu
re F
un
ds
c/f
as a
t 31
Dec
201
2
Au
stra
lian
Cen
tre
for
Inte
rnat
ion
al A
gri
cult
ura
l Res
earc
h
AC
AR
-100
8F
arm
ing
syst
ems
and
food
se
curit
y in
Afr
ica:
Prio
ritie
s fo
r S
cien
ce a
nd P
olic
y un
der
Rap
id G
loba
l Cha
nge
-
-
300
,573
-
300
,573
-
184
,734
-
48,
676
6,5
91 -
-
2
40,0
02 6
0,57
1
AC
AR
-101
4Im
prov
ing
Sus
tain
able
P
rodu
ctiv
ity in
Far
min
g S
yste
ms
and
Enh
ance
d Li
velih
oods
thro
ugh
Ado
ptio
n of
Eve
rgre
en A
gric
ultu
re in
E
aste
rn A
fric
a
-
-
1,62
9,55
2 -
1
,629
,552
187
,601
101
,801
-
49,
640
12,
923
-
-
351
,965
1,2
77,5
86
AC
AR
-712
LWR
/200
4/07
8 E
valu
atio
n an
d A
dopt
ion
of Im
prov
ed
Far
min
g P
ract
ices
on
Soi
l an
d W
ater
Res
ourc
es, B
ohol
Is
land
The
Phi
lippi
nes
(6,
695)
-
6,6
95
-
-
-
-
-
-
-
-
-
-
-
AC
AR
-725
Enh
anci
ng T
ree
See
dlin
gs
supp
ly v
ia E
cono
mic
and
P
olic
y C
hang
es in
the
Phi
lippi
nes
Nur
sery
Sec
tor
Pro
ject
(54
,626
) -
6
2,38
7 -
7
,761
-
-
-
-
-
-
-
-
7
,761
AC
AR
-951
Wat
ersh
ed E
valu
atio
n fo
r S
usta
inab
le U
se o
f Slo
ping
A
gric
ultu
ral L
and
in th
e S
outh
ern
Phi
lippi
nes
-
16,
542
64,
145
-
80,
687
36,
180
7,2
74
-
2,0
44
12,
981
-
-
58,
479
22,
209
AC
AR
-982
Agr
ofor
estr
y fo
r Li
velih
oods
of
Sm
allh
olde
r F
arm
ers
in
Nor
th-W
este
rn V
ietn
am
-
-
577
,335
-
5
77,3
35
39,
309
62,
822
-
26,
164
21,
779
74,
717
-
224
,792
3
52,5
44
AC
AR
-983
Iden
tifyi
ng R
esea
rch
to
Enh
ance
Liv
elih
oods
an
d F
ood
Sec
urity
from
A
grof
ores
try
and
Com
mun
ity
For
estr
y S
yste
ms
in N
epal
.
-
-
155
,429
-
1
55,4
29
14,
652
85,
110
-
2,1
63
1,7
75
51,
725
-
155
,424
4
AC
AR
-985
Sco
ping
and
For
mul
atio
n of
C
limat
e S
mar
t Eve
rgre
en
Agr
icul
ture
to Im
prov
e F
ood
Sec
urity
in E
ast A
fric
a
-
-
162
,981
-
1
62,9
81
3,1
53
42,
530
-
89,
990
27,
258
-
-
162
,932
4
9
AG
RO
FU
TU
RO
GL
OB
AL
SL
AG
GL-
937
Com
mitt
ee fo
r S
usta
inab
le
Ass
essm
ent
-
1,0
01
-
4,0
83
5,0
84
-
1,3
75
-
2,8
89
819
-
-
5
,084
-
Alli
ance
fo
r a
Gre
en R
evo
luti
on
in A
fric
a
AG
RA
-100
4A
fric
an W
omen
in
Agr
icul
tura
l Res
earc
h an
d D
evel
opm
ent (
AW
AR
D)
-
-
623
,810
-
6
23,8
10
-
69,
445
-
220
,080
8
,851
-
-
2
98,3
76
325
,434
Ag
rop
olis
Fo
un
dat
ion
AG
RF
-950
Sup
port
the
Impl
emen
tatio
n of
the
AW
AR
D
Com
mun
icat
ions
for
Fra
ncop
hone
Exp
ansi
on
-
69,
765
-
-
69,
765
-
4,7
44
-
-
-
-
-
4,7
44
65,
022
Au
stra
lian
Aid
AU
SD
-842
Land
Car
e ap
proa
ch to
F
oste
r C
olle
ctiv
e A
ctio
n an
d Le
arni
ng fo
r W
ide
Sca
le
Impa
ct o
f Sus
tain
able
Lan
d M
anag
emen
t in
Eas
tern
A
fric
a
-
30,
377
-
-
30,
377
-
4,1
89
1,4
00
21,
007
3,7
82
-
-
30,
377
-
Bel
giu
m
BE
LG-3
42V
VO
B g
loba
l sup
port
20
03-2
012
-
10,
812
-
-
10,
812
5,0
00
-
-
-
-
-
-
5,0
00
5,8
12
BE
LG-7
96In
crea
sing
sm
all-s
cale
fa
rmer
ben
efits
from
ag
rofo
rest
ry tr
ee p
rodu
cts
in W
est a
nd C
entr
al A
fric
a-
AF
TP
4A
-
1,3
68,8
45
-
-
1,3
68,8
45
391
,648
2
05,8
39
170,
850
223
,277
1
91,7
20
100
,298
-
1
,283
,633
8
5,21
2
As
at 3
1 D
ecem
ber
201
2 (In
US
Do
llars
‘000
’)
Exh
ibit
1b
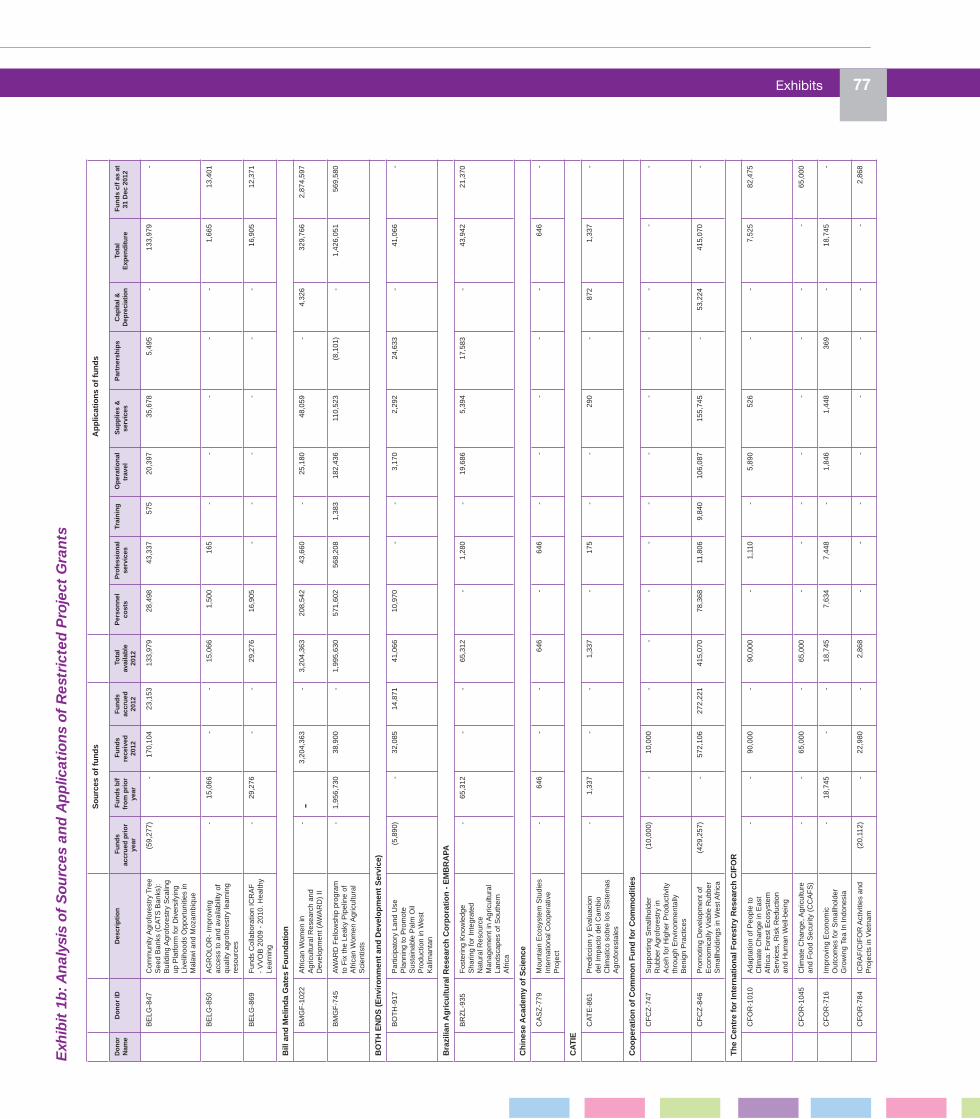
Exhibits 77
Exh
ibit
1b
: An
alys
is o
f S
ourc
es a
nd
Ap
plic
atio
ns
of R
estr
icte
d P
roje
ct G
ran
ts
So
urc
es o
f fu
nd
s A
pp
licat
ion
s o
f fu
nd
s
Don
or
Nam
eD
on
or
IDD
escr
ipti
on
Fu
nd
s ac
cru
ed p
rio
r ye
ar
Fu
nd
s b
/f
fro
m p
rio
r ye
ar
Fu
nd
s re
ceiv
ed
2012
Fu
nd
s ac
cru
ed
2012
To
tal
avai
lab
le
2012
Per
son
nel
co
sts
Pro
fess
iona
l se
rvic
esTr
ain
ing
Op
erat
ion
al
trav
el S
up
plie
s &
se
rvic
esP
artn
ersh
ips
Cap
ital
&
Dep
reci
atio
nTo
tal
Exp
end
itu
re F
un
ds
c/f
as a
t 31
Dec
201
2
BE
LG-8
47C
omm
unity
Agr
ofor
estr
y Tr
ee
See
d B
anks
(C
AT
S B
anks
):
Bui
ldin
g A
grof
ores
try
Sca
ling
up P
latfo
rm fo
r D
iver
sify
ing
Live
lihoo
ds O
ppor
tuni
ties
in
Mal
awi a
nd M
ozam
biqu
e
(59
,277
) -
1
70,1
04
23,
153
133
,979
2
8,49
8 4
3,33
7 5
75
20,
397
35,
678
5,4
95
-
133
,979
-
BE
LG-8
50A
GR
OLO
R-
Impr
ovin
g ac
cess
to a
nd a
vaila
bilit
y of
qu
ality
agr
ofor
estr
y le
arni
ng
reso
urce
s
-
15,
066
-
-
15,
066
1,5
00
165
-
-
-
-
-
1
,665
1
3,40
1
BE
LG-8
69F
unds
Col
labo
ratio
n IC
RA
F
- V
VO
B 2
009
- 20
10. H
ealth
y Le
arni
ng
-
29,
276
-
-
29,
276
16,
905
-
-
-
-
-
-
16,
905
12,
371
Bill
an
d M
elin
da
Gat
es F
ou
nd
atio
n
BM
GF
-102
2A
fric
an W
omen
in
Agr
icul
tura
l Res
earc
h an
d D
evel
opm
ent (
AW
AR
D)
II
-
-
3,2
04,3
63
-
3,2
04,3
63
208
,542
4
3,66
0 -
2
5,18
0 4
8,05
9 -
4
,326
3
29,7
66
2,8
74,5
97
BM
GF
-745
AW
AR
D F
ello
wsh
ip p
rogr
am
to F
ix th
e Le
aky
Pip
elin
e of
A
fric
an W
omen
Agr
icul
tura
l S
cien
tists
-
1,9
56,7
30
38,
900
-
1,9
95,6
30
571
,602
5
68,2
08
1,3
83
182
,436
1
10,5
23
(8,
101)
-
1,4
26,0
51
569
,580
BO
TH
EN
DS
(E
nvi
ron
men
t an
d D
evel
op
men
t S
ervi
ce)
BO
TH
-917
Par
ticip
ator
y La
nd U
se
Pla
nnin
g to
Pro
mot
e S
usta
inab
le P
alm
Oil
Pro
duct
ion
in W
est
Kal
iman
tan
(5,
890)
-
32,
085
14,
871
41,
066
10,
970
-
-
3,1
70
2,2
92
24,
633
-
41,
066
-
Bra
zilia
n A
gri
cult
ura
l Res
earc
h C
orp
ora
tio
n -
EM
BR
APA
BR
ZL-
935
Fos
terin
g K
now
ledg
e S
harin
g fo
r In
tegr
ated
N
atur
al R
esou
rce
Man
agem
ent i
n A
gric
ultu
ral
Land
scap
es o
f Sou
ther
n A
fric
a
-
65,
312
-
-
65,
312
-
1,2
80
-
19,
686
5,3
94
17,
583
-
43,
942
21,
370
Ch
ines
e A
cad
emy
of
Sci
ence
CA
SZ
-779
Mou
ntai
n E
cosy
stem
Stu
dies
In
tern
atio
nal C
oope
rativ
e P
roje
ct
-
646
-
-
6
46
-
646
-
-
-
-
-
6
46
-
CA
TIE
CA
TE
-861
Pre
dicc
ion
y E
valu
acio
n de
l Im
pact
o de
l Cam
bio
Clim
atic
o so
bre
los
Sis
tem
as
Agr
ofor
esta
les
-
1,3
37
-
-
1,3
37
-
175
-
-
2
90
-
872
1
,337
-
Co
op
erat
ion
of
Co
mm
on
Fu
nd
fo
r C
om
mo
dit
ies
CF
CZ
-747
Sup
port
ing
Sm
allh
olde
r R
ubbe
r Agr
ofor
estr
y in
A
ceh
for
Hig
her
Pro
duct
ivity
th
roug
h E
nviro
nmen
tally
B
enig
n P
ract
ices
(10
,000
) -
1
0,00
0 -
-
-
-
-
-
-
-
-
-
-
CF
CZ
-846
Pro
mot
ing
Dev
elop
men
t of
Eco
nom
ical
ly V
iabl
e R
ubbe
r S
mal
lhol
ding
s in
Wes
t Afr
ica
(42
9,25
7) -
5
72,1
06
272
,221
4
15,0
70
78,
368
11,
806
9,8
40
106
,087
1
55,7
45
-
53,
224
415
,070
-
Th
e C
entr
e fo
r In
tern
atio
nal
Fo
rest
ry R
esea
rch
CIF
OR
CF
OR
-101
0A
dapt
atio
n of
Peo
ple
to
Clim
ate
Cha
nge
in E
ast
Afr
ica:
For
est E
cosy
stem
S
ervi
ces,
Ris
k R
educ
tion
and
Hum
an W
ell-b
eing
-
-
90,
000
-
90,
000
-
1,1
10
-
5,8
90
526
-
-
7
,525
8
2,47
5
CF
OR
-104
5C
limat
e C
hang
e, A
gric
ultu
re
and
Foo
d S
ecur
ity (
CC
AF
S)
-
-
65,
000
-
65,
000
-
-
-
-
-
-
-
-
65,
000
CF
OR
-716
Impr
ovin
g E
cono
mic
O
utco
mes
for
Sm
allh
olde
r G
row
ing
Tea
In In
done
sia
-
18,
745
-
-
18,
745
7,6
34
7,4
48
-
1,8
46
1,4
48
369
-
1
8,74
5 -
CF
OR
-784
ICR
AF
/CIF
OR
Act
iviti
es a
nd
Pro
ject
s in
Vie
tnam
(20
,112
) -
2
2,98
0 -
2
,868
-
-
-
-
-
-
-
-
2
,868

78 World Agroforestry Centre
Exh
ibit
1b
: An
alys
is o
f S
ourc
es a
nd
Ap
plic
atio
ns
of R
estr
icte
d P
roje
ct G
ran
ts
So
urc
es o
f fu
nd
s A
pp
licat
ion
s o
f fu
nd
s
Don
or
Nam
eD
on
or
IDD
escr
ipti
on
Fu
nd
s ac
cru
ed p
rio
r ye
ar
Fu
nd
s b
/f
fro
m p
rio
r ye
ar
Fu
nd
s re
ceiv
ed
2012
Fu
nd
s ac
cru
ed
2012
To
tal
avai
lab
le
2012
Per
son
nel
co
sts
Pro
fess
iona
l se
rvic
esTr
ain
ing
Op
erat
ion
al
trav
el S
up
plie
s &
se
rvic
esP
artn
ersh
ips
Cap
ital
&
Dep
reci
atio
nTo
tal
Exp
end
itu
re F
un
ds
c/f
as a
t 31
Dec
201
2
CF
OR
-786
Ass
essi
ng th
e Im
plic
atio
ns o
f C
limat
e C
hang
e fo
r U
SA
ID
For
estr
y P
rogr
amm
es
-
2
(2)
-
-
-
-
-
-
-
-
-
-
-
CF
OR
-876
Chi
nese
Tra
de a
nd
Inve
stm
ent i
n A
fric
a:
Ass
essi
ng a
nd G
over
ning
Tr
ade-
offs
to N
atio
nal
Eco
nom
ies,
Loc
al
Live
lihoo
ds a
nd F
ores
t E
cosy
stem
s
-
21,
188
31,
318
-
52,
507
24,
211
7,1
71
-
10,
462
233
-
-
4
2,07
7 1
0,43
0
CF
OR
-889
CR
P6
Par
tner
Con
sulta
tion
Mee
ting
-
4,1
72
-
1,6
93
5,8
65
-
765
-
1
,165
3
,935
-
-
5
,865
-
Ch
ina
CH
NA
-766
Sci
entifi
c vi
sits
to IC
RA
F fo
r C
hine
se S
cien
tists
-
2,9
00
-
-
2,9
00
-
-
-
-
-
-
-
-
2,9
00
Cen
tro
Inte
rnac
ion
al d
e A
gri
cult
ura
l Tro
pic
al, C
olo
mb
ia
CIA
T-10
39B
est B
ets
for
Clim
ate-
Sm
art
Agr
icul
ture
: The
Sci
entifi
c B
asis
-
-
50,
000
-
50,
000
-
9,0
89
64
7,4
91
855
3
2,40
0 -
4
9,89
9 1
01
CIA
T-81
6G
loba
lly In
tegr
ated
Afr
ica
Soi
l Inf
orm
atio
n S
ervi
ce
(AfS
IS)
-
110
,059
2
99,5
31
-
409
,590
2
73,0
71
52,
288
389
1
9,01
5 6
0,66
8 -
-
4
05,4
30
4,1
60
CIA
T-82
2A
maz
on In
itiat
ive
Eco
regi
onal
Pro
gram
(A
I-E
P)
-
2,9
72
(1)
-
2,9
72
-
536
-
-
2
,436
-
-
2
,972
-
CIA
T-94
6A
maz
on In
itiat
ive
Eco
regi
onal
pro
gram
(A
I-E
P)
(9,
964)
-
9,3
20
-
(64
4) -
(
644)
-
-
-
-
-
(64
4) -
Cen
tre
for
Inte
rnat
ion
al C
oo
per
atio
n
CIC
Z-9
28W
ater
har
vest
ing
tech
nolo
gies
Rev
isite
d:
Pot
entia
ls fo
r In
nova
tions
, Im
prov
emen
ts a
nd U
psca
ling
in S
ub-S
ahar
an A
fric
a
(13
1,39
6) -
1
46,4
38
22,
097
37,
139
23,
296
6,4
96
-
9,8
43
(2,
589)
94
-
37,
139
-
Can
adia
n In
tern
atio
nal
Dev
elo
pm
ent A
gen
cy
CID
A-9
36A
grof
ores
ty a
nd F
ores
try
in
Sul
awes
i: Li
nkin
g K
now
ledg
e w
ith A
ctio
n
-
479
,726
1
,761
,049
-
2
,240
,775
4
48,4
81
343
,369
3
,547
1
28,3
03
143
,628
2
10,6
22
14,
864
1,2
92,8
13
947
,961
Cen
tre
for
Mo
un
tain
Eco
syst
em S
tud
ies
CM
ES
-776
Rur
al E
nerg
y P
rodu
ctio
n fr
om B
ioen
ergy
-
11,
637
-
-
11,
637
-
-
-
-
-
-
-
-
11,
637
Co
mm
on
Mar
ket
Fo
r E
ast
and
So
uth
ern
Afr
ica
CM
SZ
-823
To A
ssem
ble
Sci
entifi
c E
vide
nce
in S
uppo
rt o
f the
U
nifie
d A
fric
an P
ositi
on o
n B
io-C
arbo
n
(11
2,23
3) -
2
70,0
00
-
157
,767
-
-
-
-
-
-
-
-
1
57,7
67
Co
mar
t F
ou
nd
atio
n
CM
TF
-900
ICR
AF
/CO
MA
RT
F
OU
DA
TIO
N -
WE
ST
K
EN
YA
PR
OJE
CT
(1,
061)
-
-
-
(1,
061)
-
(1,
061)
-
-
-
-
-
(1,
061)
-
Go
vern
ors
of
St.
Fra
nci
s X
avie
r U
niv
ersi
ty -
CO
AD
Y
CO
DY-
1003
Ass
et-b
ased
Com
mun
ity-
Driv
en D
evel
opm
ent (
AB
CD
) m
eets
Val
ue C
hain
App
roac
h (V
CA
)
-
-
157
,111
-
1
57,1
11
43,
276
12,
120
-
7,4
24
16,
013
1,5
64
1,7
78
82,
175
74,
936
Co
rnel
l Un
iver
sity
CO
NL-
254
Pla
nnin
g w
orks
hop
on
dyna
mic
pov
erty
trap
s in
E
ast A
fric
a
-
1
(1)
-
-
-
-
-
-
-
-
-
-
-
CO
NL-
654
Res
earc
h an
d F
ield
wor
kd
Exp
ense
s -W
este
rn K
enya
-
16,
308
-
-
16,
308
3,2
16
-
2,0
96
1,5
81
9,4
15
-
-
16,
308
-
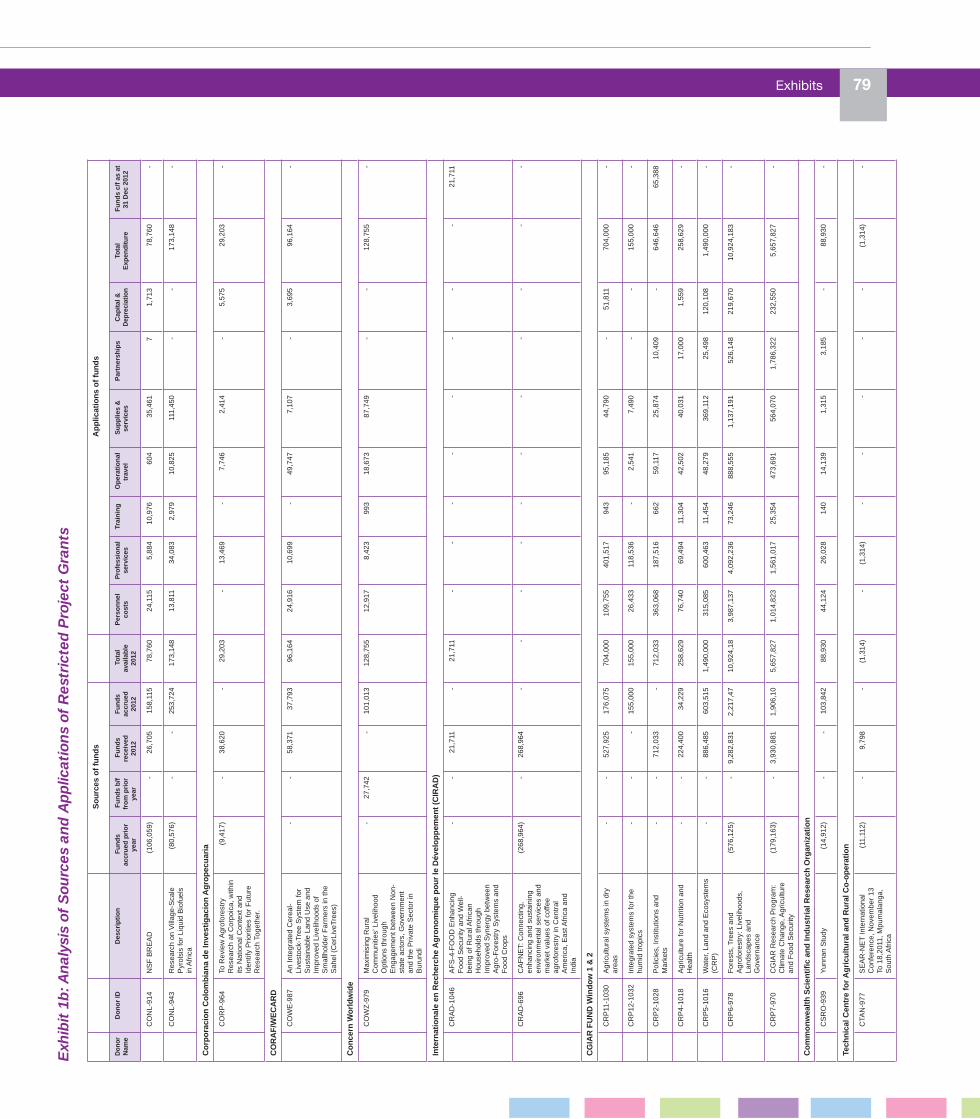
Exhibits 79E
xhib
it 1
b: A
nal
ysis
of
Sou
rces
an
d A
pp
licat
ion
s of
Res
tric
ted
Pro
ject
Gra
nts
So
urc
es o
f fu
nd
s A
pp
licat
ion
s o
f fu
nd
s
Don
or
Nam
eD
on
or
IDD
escr
ipti
on
Fu
nd
s ac
cru
ed p
rio
r ye
ar
Fu
nd
s b
/f
fro
m p
rio
r ye
ar
Fu
nd
s re
ceiv
ed
2012
Fu
nd
s ac
cru
ed
2012
To
tal
avai
lab
le
2012
Per
son
nel
co
sts
Pro
fess
iona
l se
rvic
esTr
ain
ing
Op
erat
ion
al
trav
el S
up
plie
s &
se
rvic
esP
artn
ersh
ips
Cap
ital
&
Dep
reci
atio
nTo
tal
Exp
end
itu
re F
un
ds
c/f
as a
t 31
Dec
201
2
CO
NL-
914
NS
F B
RE
AD
(10
6,05
9) -
2
6,70
5 1
58,1
15
78,
760
24,
115
5,8
84
10,
976
604
3
5,46
1 7
1
,713
7
8,76
0 -
CO
NL-
943
Res
earc
h on
Vill
age-
Sca
le
Pyr
olsi
s fo
r Li
quid
Bio
fuel
s in
Afr
ica
(80
,576
) -
-
2
53,7
24
173
,148
1
3,81
1 3
4,08
3 2
,979
1
0,82
5 1
11,4
50
-
-
173
,148
-
Co
rpo
raci
on
Co
lom
bia
na
de
Inve
stig
acio
n A
gro
pec
uar
ia
CO
RP
-964
To R
evie
w A
grof
ores
try
Res
earc
h at
Cor
poic
a, w
ithin
its
Nat
iona
l Con
text
and
Id
entif
y P
riorit
ies
for
Fut
ure
Res
earc
h To
geth
er.
(9,
417)
-
38,
620
-
29,
203
-
13,
469
-
7,7
46
2,4
14
-
5,5
75
29,
203
-
CO
RA
F/W
EC
AR
D
CO
WE
-987
An
Inte
grat
ed C
erea
l-Li
vest
ock-
Tree
Sys
tem
for
Sus
tain
able
Lan
d U
se a
nd
Impr
oved
Liv
elih
oods
of
Sm
allh
olde
r F
arm
ers
in th
e S
ahel
(C
erLi
veTr
ees)
-
-
58,
371
37,
793
96,
164
24,
916
10,
699
-
49,
747
7,1
07
-
3,6
95
96,
164
-
Co
nce
rn W
orl
dw
ide
CO
WZ
-979
Max
imis
ing
Rur
al
Com
mun
ities
’ Liv
elih
ood
Opt
ions
thro
ugh
Eng
agem
ent b
etw
een
Non
-st
ate
acto
rs, G
over
nmen
t an
d th
e P
rivat
e S
ecto
r in
B
urun
di
-
27,
742
-
101
,013
1
28,7
55
12,
917
8,4
23
993
1
8,67
3 8
7,74
9 -
-
1
28,7
55
-
Inte
rnat
ion
ale
en R
ech
erch
e A
gro
no
miq
ue
po
ur
le D
ével
op
pem
ent
(CIR
AD
)
CR
AD
-104
6A
FS
-4-F
OO
D E
nhan
cing
F
ood
Sec
urity
and
Wel
l-be
ing
of R
ural
Afr
ican
H
ouse
hold
s th
roug
h Im
prov
ed S
yner
gy b
etw
een
Agr
o-F
ores
try
Sys
tem
s an
d F
ood
Cro
ps
-
-
21,
711
-
21,
711
-
-
-
-
-
-
-
-
21,
711
CR
AD
-696
CA
FN
ET:
Con
nect
ing,
en
hanc
ing
and
sust
aini
ng
envi
ronm
enta
l ser
vice
s an
d m
arke
t val
ues
of c
offe
e ag
rofo
rest
ry in
Cen
tral
A
mer
ica,
Eas
t Afr
ica
and
Indi
a
(26
8,96
4) -
2
68,9
64
-
-
-
-
-
-
-
-
-
-
-
CG
IAR
FU
ND
Win
do
w 1
& 2
CR
P11
-103
0A
gric
ultu
ral s
yste
ms
in d
ry
area
s -
-
5
27,9
25
176
,075
7
04,0
00
109
,755
4
01,5
17
943
9
5,18
5 4
4,79
0 -
5
1,81
1 7
04,0
00
-
CR
P12
-103
2In
tegr
ated
sys
tem
s fo
r th
e hu
mid
trop
ics
-
-
-
155
,000
1
55,0
00
26,
433
118
,536
-
2
,541
7
,490
-
-
1
55,0
00
-
CR
P2-
1028
Pol
icie
s, In
stitu
tions
and
M
arke
ts -
-
7
12,0
33
-
712
,033
3
63,0
68
187
,516
6
62
59,
117
25,
874
10,
409
-
646
,646
6
5,38
8
CR
P4-
1018
Agr
icul
ture
for
Nut
ritio
n an
d H
ealth
-
-
224
,400
3
4,22
9 2
58,6
29
76,
740
69,
494
11,
304
42,
502
40,
031
17,
000
1,5
59
258
,629
-
CR
P5-
1016
Wat
er, L
and
and
Eco
syst
ems
(CR
P)
-
-
886
,485
6
03,5
15
1,4
90,0
00
315
,085
6
00,4
63
11,
454
48,
279
369
,112
2
5,49
8 1
20,1
08
1,4
90,0
00
-
CR
P6-
978
For
ests
, Tre
es a
nd
Agr
ofor
estr
y: L
ivel
ihoo
ds,
Land
scap
es a
nd
Gov
erna
nce
(57
6,12
5) -
9
,282
,831
2
,217
,47
10,
924,
18 3
,987
,137
4
,092
,236
7
3,24
6 8
88,5
55
1,1
37,1
91
526
,148
2
19,6
70
10,
924,
183
-
CR
P7-
970
CG
IAR
Res
earc
h P
rogr
am:
Clim
ate
Cha
nge,
Agr
icul
ture
an
d F
ood
Sec
urity
(17
9,16
3) -
3
,930
,881
1
,906
,10
5,6
57,8
27
1,0
14,8
23
1,5
61,0
17
25,
354
473
,691
5
64,0
70
1,7
86,3
22
232
,550
5
,657
,827
-
Co
mm
on
wea
lth
Sci
enti
fic
and
Ind
ust
rial
Res
earc
h O
rgan
izat
ion
CS
RO
-939
Yun
nan
Stu
dy (
14,9
12)
-
-
103
,842
8
8,93
0 4
4,12
4 2
6,02
8 1
40
14,
139
1,3
15
3,1
85
-
88,
930
-
Tech
nic
al C
entr
e fo
r A
gri
cult
ura
l an
d R
ura
l Co
-op
erat
ion
CTA
N-9
77S
EA
R-N
ET
Inte
rnat
iona
l C
onfe
renc
e, N
ovem
ber
13
To 1
8,20
11, M
pum
alan
ga,
Sou
th A
fric
a
(11
,112
) -
9
,798
-
(
1,31
4) -
(
1,31
4) -
-
-
-
-
(
1,31
4) -

80 World Agroforestry Centre S
ou
rces
of
fun
ds
Ap
plic
atio
ns
of
fun
ds
Don
or
Nam
eD
on
or
IDD
escr
ipti
on
Fu
nd
s ac
cru
ed p
rio
r ye
ar
Fu
nd
s b
/f
fro
m p
rio
r ye
ar
Fu
nd
s re
ceiv
ed
2012
Fu
nd
s ac
cru
ed
2012
To
tal
avai
lab
le
2012
Per
son
nel
co
sts
Pro
fess
iona
l se
rvic
esTr
ain
ing
Op
erat
ion
al
trav
el S
up
plie
s &
se
rvic
esP
artn
ersh
ips
Cap
ital
&
Dep
reci
atio
nTo
tal
Exp
end
itu
re F
un
ds
c/f
as a
t 31
Dec
201
2
Inte
rnat
ion
al M
aize
an
d W
hea
t Im
pro
vem
ent
Cen
ter
(CIM
MY
T)
CY
MT-
941
Enh
anci
ng T
otal
Far
m
Pro
duct
ivity
in S
mal
lhol
der
Con
serv
atio
n A
gric
ultu
re
Bas
ed S
yste
ms
in E
aste
rn
Afr
ica
-
35,
032
117
,349
-
1
52,3
81
16,
038
28,
162
2,6
84
28,
701
17,
900
5,8
27
-
99,
311
53,
070
Dep
artm
ent
for
Inte
rnat
ion
al D
evel
op
men
t
DF
ID-1
034
Rev
iew
of A
gric
ultu
re
Env
ironm
ent I
ndic
ator
s an
d M
etric
s
-
-
-
23,
785
23,
785
-
23,
753
-
-
32
-
-
23,
785
-
DF
ID-7
78P
rotr
acte
d R
elie
f Pro
gram
me
Pha
se 2
(P
RP
2)
(13
1) -
-
-
(
131)
-
(13
1) -
-
-
-
-
(
131)
-
Eb
on
y E
nte
rpri
ses
Ltd
EE
LZ-8
21R
wan
da M
aste
r P
lan
For
Ir
rigat
ion
(19
0,50
5) -
-
1
90,5
05
-
-
-
-
-
-
-
-
-
-
Ear
th In
stit
ute
- C
olu
mb
ia U
niv
ersi
ty
EIC
U-6
48M
onito
ring
and
Impa
ct
asse
ssm
ent i
n th
e M
illen
ium
V
illag
es
(28
,662
) -
-
2
8,66
2 -
-
-
-
-
-
-
-
-
-
Eu
rop
ean
Un
ion
EU
RU
-755
EC
/IFA
D C
GIA
R
PR
OG
RA
MM
E -
Pol
icy
Opt
ions
and
Ince
ntiv
es
Mec
hani
sm fo
r S
tren
gthe
ning
Agr
ofor
estr
y
(31
7,39
5) -
3
17,3
95
-
-
-
-
-
-
-
-
-
-
-
EU
RU
-810
Acc
ount
abili
ty a
nd L
ocal
Le
vel I
nitia
tive
to r
educ
e E
mis
sion
from
Def
ores
tatio
n an
d de
grad
atio
n in
Indo
nesi
a (A
LLR
ED
DI)
(32
3,99
2) -
3
52,0
29
-
28,
036
-
28,
036
-
-
-
-
-
28,
036
-
EU
RU
-975
Afr
ica
at a
Mes
o-S
cale
: A
dapt
ive
and
Inte
grat
ed to
ols
and
Str
ateg
ies
for
Nat
ural
R
esou
rces
Man
agem
ent.
-
71,
571
-
22,
139
93,
710
22,
771
47,
859
4,6
20
4,8
96
13,
564
-
-
93,
710
-
EU
RU
-981
Upt
ake
of C
limat
e R
elat
ed
Res
earc
h R
esul
ts th
roug
h K
now
ledg
e P
latfo
rms
with
Afr
ican
Col
labo
ratio
n P
artn
ers
- Afr
iCA
N C
limat
e
-
35,
931
-
35,
378
71,
309
45,
814
10,
361
-
8,6
70
6,4
63
-
-
71,
309
-
Fo
od
an
d A
gri
cult
ure
Org
aniz
atio
n o
f th
e U
nit
ed N
atio
ns
FAO
Z-1
037
Tree
Cro
ps D
evel
opm
ent i
n A
fric
a an
d A
sia
to B
enefi
t th
e P
oor
-
-
200
,000
-
2
00,0
00
12,
645
8,8
48
-
9,4
35
8,9
85
-
-
39,
912
160
,088
FAO
Z-8
33M
obili
zatio
n an
d R
einf
orce
men
t of t
he
Cap
acity
of S
mal
l and
M
ediu
m E
nter
pris
es in
volv
ed
in th
e M
arke
t of N
on-w
oody
F
ores
t pro
duct
s in
Cen
tral
A
fric
a
(6,
177)
-
6,1
77
-
-
-
-
-
-
-
-
-
-
-
FAO
Z-8
88M
obili
satio
n an
d E
mpo
wer
men
t of S
mal
l and
M
ediu
m S
ized
Ent
erpr
ises
In
volv
ed in
the
Non
-Tim
ber
For
est P
rodu
cts
in C
entr
al
Afr
ica
(11
,578
) -
1
1,57
8 -
-
-
-
-
-
-
-
-
-
-
FAO
Z-8
93M
obili
sing
and
Em
pow
erin
g S
mal
l and
Med
ium
Siz
e E
nter
pris
es In
volv
ed in
the
Non
-Tim
ber
For
est P
rodu
cts
in C
entr
al A
fric
a (G
CP
/R
AF
/408
/EC
Pro
ject
)
(32
,510
) -
3
2,51
0 -
-
-
-
-
-
-
-
-
-
-
FAO
Z-9
11P
roje
ct D
esig
n D
ocum
ent
and
Con
trib
ute
to th
e dr
aftin
g of
a C
arbo
n A
ccou
ntin
g m
etho
dolo
gy to
Sup
port
the
Impl
emen
tatio
n of
the
Thr
ee
Riv
ers
Sus
tain
able
Gra
zing
P
roje
ct
(31
,113
) -
3
1,00
0 -
(
113)
-
(11
3) -
-
-
-
-
(
113)
-
Exh
ibit
1b
: An
alys
is o
f S
ourc
es a
nd
Ap
plic
atio
ns
of R
estr
icte
d P
roje
ct G
ran
ts
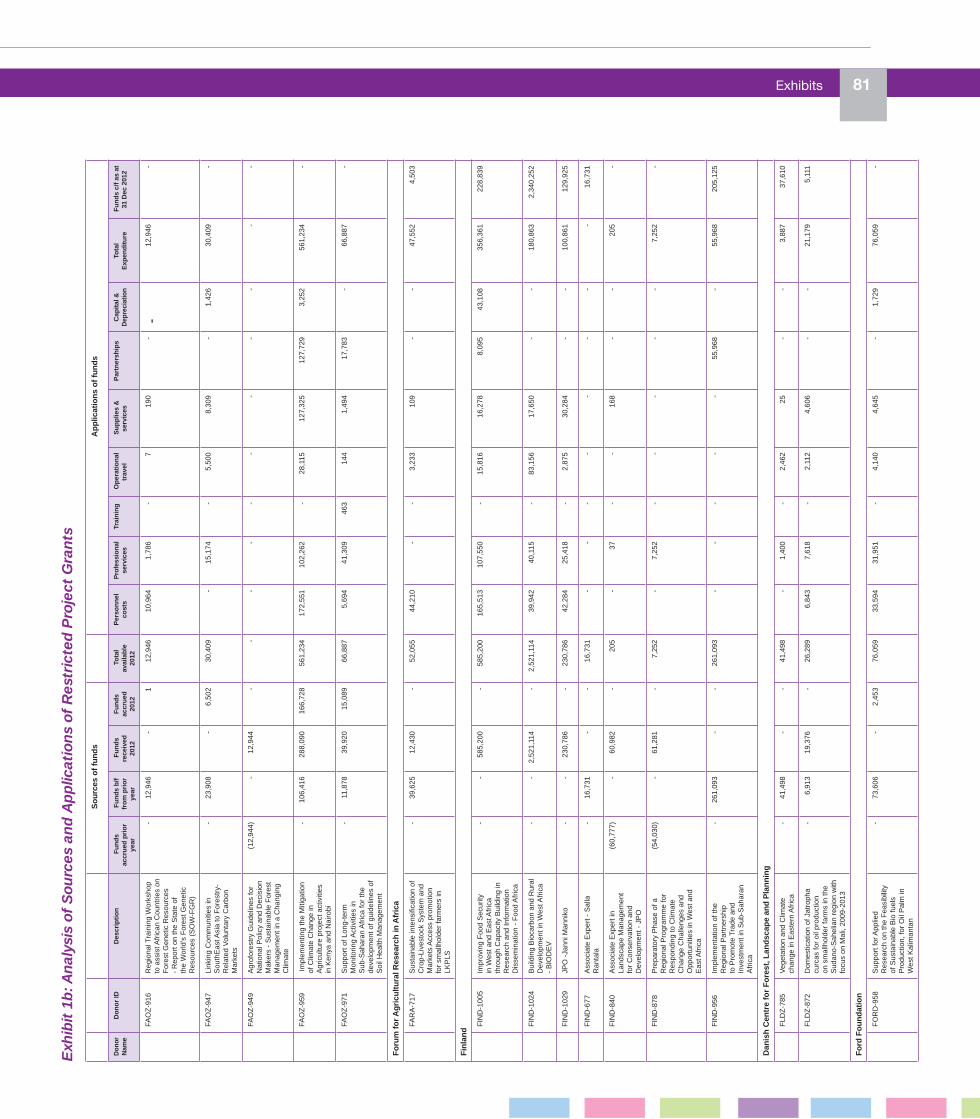
Exhibits 81 S
ou
rces
of
fun
ds
Ap
plic
atio
ns
of
fun
ds
Don
or
Nam
eD
on
or
IDD
escr
ipti
on
Fu
nd
s ac
cru
ed p
rio
r ye
ar
Fu
nd
s b
/f
fro
m p
rio
r ye
ar
Fu
nd
s re
ceiv
ed
2012
Fu
nd
s ac
cru
ed
2012
To
tal
avai
lab
le
2012
Per
son
nel
co
sts
Pro
fess
iona
l se
rvic
esTr
ain
ing
Op
erat
ion
al
trav
el S
up
plie
s &
se
rvic
esP
artn
ersh
ips
Cap
ital
&
Dep
reci
atio
nTo
tal
Exp
end
itu
re F
un
ds
c/f
as a
t 31
Dec
201
2
FAO
Z-9
16R
egio
nal T
rain
ing
Wor
ksho
p to
ass
ist A
fric
an C
ount
ries
on
For
est G
enet
ic R
esou
rces
-
Rep
ort o
n th
e S
tate
of
the
Wor
ld’s
For
est G
enet
ic
Res
ourc
es (
SO
W-F
GR
)
-
12,
946
-
1
12,
946
10,
964
1,7
86
-
7
190
-
-
1
2,94
6 -
FAO
Z-9
47Li
nkin
g C
omm
uniti
es in
S
outh
Eas
t Asi
a to
For
estr
y-R
elat
ed V
olun
tary
Car
bon
Mar
kets
-
23,
908
-
6,5
02
30,
409
-
15,
174
-
5,5
00
8,3
09
-
1,4
26
30,
409
-
FAO
Z-9
49A
grof
ores
try
Gui
delin
es fo
r N
atio
nal P
olic
y an
d D
ecis
ion
Mak
ers
- S
usta
inab
le F
ores
t M
anag
emen
t in
a C
hang
ing
Clim
ate
(12
,944
) -
1
2,94
4 -
-
-
-
-
-
-
-
-
-
-
FAO
Z-9
59 Im
plem
entin
g th
e M
itiga
tion
of C
limat
e C
hang
e in
A
gric
ultu
re p
roje
ct a
ctiv
ities
in
Ken
ya a
nd N
airo
bi
-
106
,416
2
88,0
90
166
,728
5
61,2
34
172
,551
1
02,2
62
-
28,
115
127
,325
1
27,7
29
3,2
52
561
,234
-
FAO
Z-9
71S
uppo
rt o
f Lon
g-te
rm
Mon
itorin
g A
ctiv
ities
in
Sub
-Sah
aran
Afr
ica
for
the
deve
lopm
ent o
f gui
delin
es o
f S
oil H
ealth
Man
agem
ent
-
11,
878
39,
920
15,
089
66,
887
5,6
94
41,
309
463
1
44
1,4
94
17,
783
-
66,
887
-
Fo
rum
fo
r A
gri
cult
ura
l Res
earc
h in
Afr
ica
FAR
A-7
17
Sus
tain
able
inte
nsifi
catio
n of
C
rop-
Live
stoc
k S
yste
m a
nd
Mar
kets
Acc
ess
prom
otio
n fo
r sm
allh
olde
r fa
rmer
s in
LK
PLS
-
39,
625
12,
430
-
52,
055
44,
210
-
-
3,2
33
109
-
-
4
7,55
2 4
,503
Fin
lan
d
FIN
D-1
005
Impr
ovin
g F
ood
Sec
urity
in
Wes
t and
Eas
t Afr
ica
thro
ugh
Cap
acity
Bui
ldin
g in
R
esea
rch
and
Info
rmat
ion
Dis
sem
inat
ion
- F
ood
Afr
ica
-
-
585
,200
-
5
85,2
00
165
,513
1
07,5
50
-
15,
816
16,
278
8,0
95
43,
108
356
,361
2
28,8
39
FIN
D-1
024
Bui
ldin
g B
ioca
rbon
and
Rur
al
Dev
elop
men
t in
Wes
t Afr
ica
- B
IOD
EV
-
-
2,5
21,1
14
-
2,5
21,1
14
39,
942
40,
115
-
83,
156
17,
650
-
-
180
,863
2
,340
,252
FIN
D-1
029
JPO
-Ja
nni M
anni
ko -
-
2
30,7
86
-
230
,786
4
2,28
4 2
5,41
8 -
2
,875
3
0,28
4 -
-
1
00,8
61
129
,925
FIN
D-6
77A
ssoc
iate
Exp
ert -
Sal
la
Ran
tala
-
16,
731
-
-
16,
731
-
-
-
-
-
-
-
-
16,
731
FIN
D-8
40A
ssoc
iate
Exp
ert i
n La
ndsc
ape
Man
agem
ent
for
Con
serv
atio
n an
d D
evel
opm
ent -
JP
O
(60
,777
) -
6
0,98
2 -
2
05
-
37
-
-
168
-
-
2
05
-
FIN
D-8
78P
repa
rato
ry P
hase
of a
R
egio
nal P
rogr
amm
e fo
r R
espo
ndin
g to
Clim
ate
Cha
nge
Cha
lleng
es a
nd
Opp
ortu
nitie
s in
Wes
t and
E
ast A
fric
a
(54
,030
) -
6
1,28
1 -
7
,252
-
7
,252
-
-
-
-
-
7
,252
-
FIN
D-9
56Im
plem
enta
tion
of th
e R
egio
nal P
artn
ersh
ip
to P
rom
ote
Trad
e an
d In
vest
men
t in
Sub
-Sah
aran
A
fric
a
-
261
,093
-
-
2
61,0
93
-
-
-
-
-
55,
968
-
55,
968
205
,125
Dan
ish
Cen
tre
for
Fo
rest
, Lan
dsc
ape
and
Pla
nn
ing
FLD
Z-7
85V
eget
atio
n an
d C
limat
e ch
ange
in E
aste
rn A
fric
a -
4
1,49
8 -
-
4
1,49
8 -
1
,400
-
2
,462
2
5 -
-
3
,887
3
7,61
0
FLD
Z-8
72D
omes
ticat
ion
of J
atro
pha
curc
as fo
r oi
l pro
duct
ion
on s
mal
lhol
der
farm
s in
the
Sud
ano-
Sah
elia
n re
gion
with
fo
cus
on M
ali,
2009
-201
3
-
6,9
13
19,
376
-
26,
289
6,8
43
7,6
18
-
2,1
12
4,6
06
-
-
21,
179
5,1
11
Fo
rd F
ou
nd
atio
n
FO
RD
-958
Sup
port
for A
pplie
d R
esea
rch
on th
e F
easi
bilit
y of
Sus
tain
able
Bio
fuel
s P
rodu
ctio
n, fo
r O
il P
alm
in
Wes
t Kal
iman
tan
-
73,
606
-
2,4
53
76,
059
33,
594
31,
951
-
4,1
40
4,6
45
-
1,7
29
76,
059
-
Exh
ibit
1b
: An
alys
is o
f S
ourc
es a
nd
Ap
plic
atio
ns
of R
estr
icte
d P
roje
ct G
ran
ts

82 World Agroforestry Centre S
ou
rces
of
fun
ds
Ap
plic
atio
ns
of
fun
ds
Don
or
Nam
eD
on
or
IDD
escr
ipti
on
Fu
nd
s ac
cru
ed p
rio
r ye
ar
Fu
nd
s b
/f
fro
m p
rio
r ye
ar
Fu
nd
s re
ceiv
ed
2012
Fu
nd
s ac
cru
ed
2012
To
tal
avai
lab
le
2012
Per
son
nel
co
sts
Pro
fess
iona
l se
rvic
esTr
ain
ing
Op
erat
ion
al
trav
el S
up
plie
s &
se
rvic
esP
artn
ersh
ips
Cap
ital
&
Dep
reci
atio
nTo
tal
Exp
end
itu
re F
un
ds
c/f
as a
t 31
Dec
201
2
Geo
rg-A
ug
ust
-Un
iver
sita
t G
ott
ing
en
GA
UG
-824
Ada
ptat
ion
of L
andu
se to
C
limat
e C
hang
e in
Sub
-S
ahar
an A
fric
a (A
LUC
CS
A)
(21
,888
) -
2
1,88
8 -
-
-
-
-
-
-
-
-
-
-
Glo
bal
Cro
p D
iver
sity
Tru
st
GC
DT-
1033
Gen
eban
k C
RP
-
-
-
344
,917
3
44,9
17
99,
813
139
,414
6
4 1
0,80
3 8
6,71
4 8
,109
-
3
44,9
17
-
Glo
bal
Fo
od
an
d F
arm
ing
Fu
ture
s
GF
FF
-875
For
esig
ht G
loba
l Foo
d an
d F
arm
ing
Fut
ures
-
15,
981
-
16
15,
997
10,
298
5,6
99
-
-
-
-
-
15,
997
-
Glo
bal
Fo
rum
fo
r R
ura
l Ad
viso
ry S
ervi
ces
GF
RS
-955
Logi
stic
Sup
port
to G
FR
AS
fo
r th
e G
FR
AS
Ann
ual
mee
ting,
the
Inte
rnat
iona
l C
onfe
renc
e (I
nnov
atio
ns
in E
xten
sion
and
Adv
isor
y S
ervi
ces)
and
the
GF
RA
S
Ste
erin
g C
omm
ittee
Mee
ting,
in
Nai
robi
, Nov
embe
r 20
11
(11
5,74
7) -
1
49,5
20
-
33,
773
-
187
-
-
1
,867
-
-
2
,054
3
1,71
8
GIZ
Inte
rnat
ion
al
GT
ZG
-803
Pos
tDoc
Pro
ject
: Dev
elop
ing
Hig
h In
tens
ity F
ruit
Gar
den
Agr
ofor
estr
y S
yste
ms
for
Sm
all-s
cale
Far
mer
s of
E
aste
rn A
fric
a
-
2,0
89
-
-
2,0
89
-
-
-
-
-
-
-
-
2,0
89
GT
ZG
-804
GIS
Spa
tial A
naly
sis
:-
Sui
tabi
lity
Map
s fo
r B
iofu
el
Fee
dsto
ck fo
r E
thio
pa,
Uga
nda,
Tan
zani
a
-
1,6
01
-
-
1,6
01
-
-
-
-
-
-
-
-
1,6
01
GT
ZG
-817
Mak
ing
the
Mek
ong
Con
nect
ed (
MM
C):
D
evel
opm
ent o
f car
bon
mar
ket a
nd c
onse
rvat
ion
finan
cing
mec
hani
sms
for
mul
tifun
ctio
nal l
ands
cape
bi
o-co
rrid
ors
in th
e U
pper
M
ekon
g
-
537
,489
-
1
75,3
12
712
,801
9
,098
1
27,7
75
7,8
72
28,
454
6,5
54
526
,633
6
,416
7
12,8
01
-
GT
ZG
-965
Pro
vide
AC
CI w
ith S
cena
rio
of C
limat
e C
hang
e &
V
aria
bilit
y &
its
Pot
entia
l E
ffect
s on
the
Mai
n F
arm
ing
Act
iviti
es
-
35,
576
-
-
35,
576
29,
346
6,1
96
-
32
1
-
-
35,
576
-
Hei
fer
Inte
rnat
ion
al
HF
ER
-749
Eas
t Afr
ica
Dai
ry
Dev
elop
men
t (E
AD
D)
(18
0,85
7) -
6
56,6
82
-
475
,825
1
20,6
60
46,
805
-
141
,339
3
9,39
5 -
-
3
48,1
99
127
,626
HK
Lo
gis
tics
LT
D. G
lob
al S
olu
tio
ns
HK
LZ-8
20S
usta
inab
le L
ivel
ihoo
d O
ptio
ns a
nd C
arbo
n R
ight
s as
a b
asis
for
effic
ient
and
fa
ir em
issi
on r
educ
tion
in th
e ce
ntra
l Kal
iman
tan
Ex-
Meg
a R
ice
Pro
ject
-
28,
564
-
-
28,
564
-
-
-
-
-
-
-
-
28,
564
Har
vard
Un
iver
sity
HV
UN
-780
Allo
catio
n of
ince
ntiv
e co
ntra
cts
for
envi
ronm
enta
l se
rvic
e pr
ovis
ion
in
agric
ultu
ral l
ands
cape
s
-
14,
774
-
-
14,
774
-
2,2
51
-
5,0
22
7,5
01
-
-
14,
774
-
Wo
rld
Ban
k
IBR
D-7
74S
tudy
on
Hyd
rolo
gica
l S
ervi
ces
in S
asum
ua
Wat
ersh
ed
-
16,
149
-
-
16,
149
-
13,
832
-
1,7
48
569
-
-
1
6,14
9 -
IBR
D-8
34C
apac
ity B
uild
ing
Pro
gram
on
the
Opp
ortu
nity
Cos
ts o
f R
educ
ing
Em
issi
ons
from
D
efor
esta
tion
and
Land
Use
C
hang
e
-
72,
066
1,5
00
-
73,
566
-
15,
401
-
39,
112
5,8
58
13,
195
-
73,
566
-
Exh
ibit
1b
: An
alys
is o
f S
ourc
es a
nd
Ap
plic
atio
ns
of R
estr
icte
d P
roje
ct G
ran
ts

Exhibits 83E
xhib
it 1
b: A
nal
ysis
of
Sou
rces
an
d A
pp
licat
ion
s of
Res
tric
ted
Pro
ject
Gra
nts
So
urc
es o
f fu
nd
s A
pp
licat
ion
s o
f fu
nd
s
Don
or
Nam
eD
on
or
IDD
escr
ipti
on
Fu
nd
s ac
cru
ed p
rio
r ye
ar
Fu
nd
s b
/f
fro
m p
rio
r ye
ar
Fu
nd
s re
ceiv
ed
2012
Fu
nd
s ac
cru
ed
2012
To
tal
avai
lab
le
2012
Per
son
nel
co
sts
Pro
fess
iona
l se
rvic
esTr
ain
ing
Op
erat
ion
al
trav
el S
up
plie
s &
se
rvic
esP
artn
ersh
ips
Cap
ital
&
Dep
reci
atio
nTo
tal
Exp
end
itu
re F
un
ds
c/f
as a
t 31
Dec
201
2
IBR
D-8
56F
inan
cing
Impl
emen
tatio
n of
20
09 W
ork
Pro
gram
-
209
,162
(
209,
032)
-
130
-
1
30
-
-
-
-
-
130
-
IBR
D-8
74C
GIA
R S
trat
egic
C
omm
unic
atio
n an
d M
edia
D
evel
opm
ent
(5,
438)
-
5,4
38
-
-
-
-
-
-
-
-
-
-
-
IBR
D-9
29Tr
ee-b
ased
Tec
hnol
ogie
s fo
r La
ndsc
ape
Res
tora
tion
in A
fric
a
-
4,8
55
-
-
4,8
55
-
4,8
55
-
-
-
-
-
4,8
55
-
Inte
rnat
ion
al C
ente
r fo
r A
gri
cult
ura
l Res
earc
h in
th
e D
ry A
reas
ICA
D-9
07M
P1.
1 D
ry A
reas
Pla
nnin
g M
eetin
g (
146,
104)
-
147
,569
-
1
,465
-
1
,465
-
-
-
-
-
1
,465
-
Ind
ia C
ou
nci
l fo
r A
gri
cult
ura
l Res
earc
h
ICA
R-8
51E
nabl
ing
Sm
all H
olde
rs to
Im
prov
e th
eir
Live
lihoo
ds
and
Ben
efit f
rom
Car
bon
Fin
ance
und
er th
e N
atio
nal
Agr
icul
tura
l Inn
ovat
ion
Pro
ject
(N
AIP
)
-
209
,834
-
-
2
09,8
34
-
695
-
3
,073
1
0,20
4 -
-
1
3,97
2 1
95,8
62
ICA
R-9
84E
nabl
ing
Sm
all H
olde
r V
ulne
rabl
e C
omm
uniti
es
to S
ecur
e S
usta
inab
le
Live
lihoo
ds u
nder
Cha
ngin
g C
limat
e in
Indi
a
-
-
103
,732
-
1
03,7
32
3,0
76
5,0
12
-
2,4
48
8,0
18
29,
880
-
48,
435
55,
297
Inte
rnat
ion
al C
oo
per
atio
n C
ente
r fo
r A
gri
cult
ura
l Ed
uca
tio
n -
Nag
oya
Un
iver
sity
ICC
A-8
91Ja
pan
Cap
acity
Bui
ldin
g P
rogr
am fo
r Afr
ican
A
gric
ultu
ral R
esea
rche
rs
-
1,0
27
-
-
1,0
27
-
1,0
27
-
-
-
-
-
1,0
27
-
ICL
AR
M
ICLM
-953
Fro
m R
idge
to R
eef:
An
Eco
syst
em B
ased
App
roac
h to
Bio
dive
rsity
Con
serv
atio
n an
d D
evel
opm
ent i
n th
e P
hilip
pine
s
-
4,2
55
140
,408
1
,916
1
46,5
79
63,
661
41,
596
-
16,
241
20,
127
4,4
45
510
1
46,5
79
-
Inte
rnat
ion
al C
rop
Res
each
Inst
itu
te f
or
the
Sem
i Ari
d T
rop
ics
ICR
I-10
26A
fric
a R
isin
g: S
usta
inab
le
Inte
nsifi
catio
n of
Cer
eal-
Bas
ed F
arm
ing
Sys
tem
s in
th
e S
udan
o-S
ahel
ian
Zon
e
-
-
101
,705
-
1
01,7
05
24,
000
24,
279
-
11,
504
41,
913
-
-
101
,696
9
ICR
I-98
8D
evel
opin
g C
omm
unity
-ba
sed
Clim
ate
Sm
art
Agr
icul
ture
thro
ugh
Par
ticip
ator
y A
ctio
n R
esea
rch
in C
CA
FS
B
ench
mar
k S
ites
in W
est
Afr
ica
-
-
345
,766
5
2,95
0 3
98,7
16
77,
857
80,
136
-
24,
670
214
,735
-
1
,318
3
98,7
16
-
IDH
IDH
Z-1
031
IDH
-MA
RS
Coc
oa
Pro
duct
ivity
and
Qua
lity
Pro
gram
(C
PQ
P):
Coc
oa
Dev
elop
men
t Cen
ter
Pla
tform
s fo
r Tr
ansf
er
of C
ocoa
Reg
ener
atio
n Te
chno
logi
es
-
-
358
,407
-
3
58,4
07
24,
013
107
-
1
3,48
0 1
01,6
82
97,
156
107
,947
3
44,3
85
14,
022
Inte
rnat
ion
al D
evel
op
men
t R
esea
rch
Cen
tre
IDR
C-8
19G
oing
to S
cale
: Enh
anci
ng
the
Ada
ptiv
e M
anag
emen
t C
apac
ities
for
Sus
tain
able
La
nd M
anag
emen
t in
the
Hig
hlan
ds o
f Eas
tern
Afr
ica
-
20,
188
38,
123
-
58,
311
11,
664
3,5
75
-
12,
335
3,4
98
-
-
31,
072
27,
239
Inte
rnat
ion
al F
un
d f
or
Ag
ricu
ltu
ral D
evel
op
men
t
IFA
D-1
035
Tree
Cro
ps D
evel
opm
ent i
n A
fric
a an
d A
sia
to B
enefi
t th
e P
oor
-
-
-
184
,207
1
84,2
07
-
184
,132
-
-
7
5 -
-
1
84,2
07
-
IFA
D-1
040
Sha
ring
Kno
wle
dge
on
Rea
dy-t
o-S
cale
Hig
h P
oten
tial P
ro-P
oor
Agr
icul
tura
l Tec
hnol
ogie
s in
Indi
a.
-
-
40,
000
-
40,
000
-
-
-
-
-
-
-
-
40,
000
IFA
D-7
37P
rogr
amm
e fo
r P
ro-p
oor
Rew
ards
for
Env
ironm
enta
l S
ervi
ces
in A
fric
a
(21
1,80
5) -
2
11,8
05
-
-
-
-
-
-
-
-
-
-
-
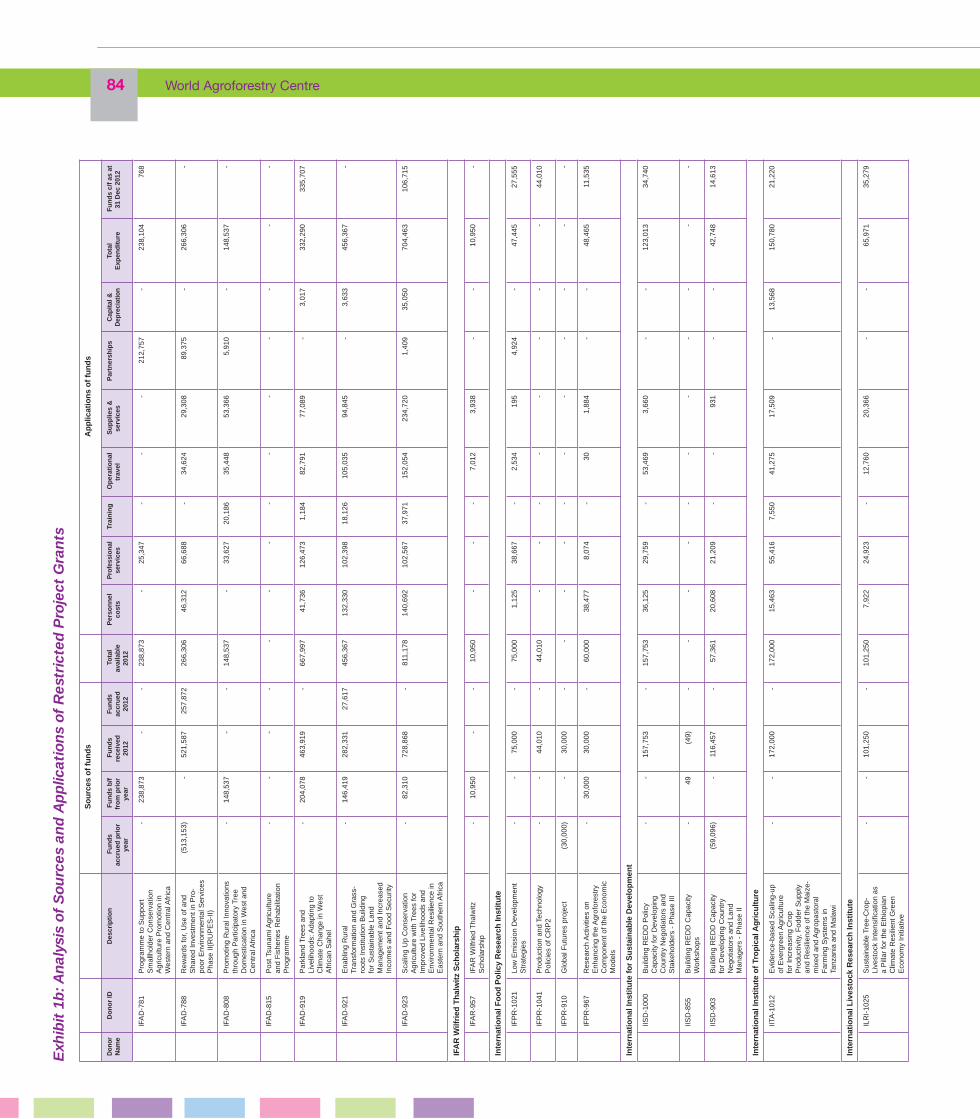
84 World Agroforestry Centre S
ou
rces
of
fun
ds
Ap
plic
atio
ns
of
fun
ds
Don
or
Nam
eD
on
or
IDD
escr
ipti
on
Fu
nd
s ac
cru
ed p
rio
r ye
ar
Fu
nd
s b
/f
fro
m p
rio
r ye
ar
Fu
nd
s re
ceiv
ed
2012
Fu
nd
s ac
cru
ed
2012
To
tal
avai
lab
le
2012
Per
son
nel
co
sts
Pro
fess
iona
l se
rvic
esTr
ain
ing
Op
erat
ion
al
trav
el S
up
plie
s &
se
rvic
esP
artn
ersh
ips
Cap
ital
&
Dep
reci
atio
nTo
tal
Exp
end
itu
re F
un
ds
c/f
as a
t 31
Dec
201
2
IFA
D-7
81P
rogr
amm
e to
Sup
port
S
mal
lhol
der
Con
serv
atio
n A
gric
ultu
re P
rom
otio
n in
W
este
rn a
nd C
entr
al A
fric
a
-
238
,873
-
-
2
38,8
73
-
25,
347
-
-
-
212
,757
-
2
38,1
04
768
IFA
D-7
88R
ewar
ds fo
r, U
se o
f and
S
hare
d In
vest
men
t in
Pro
-po
or E
nviro
nmen
tal S
ervi
ces
Pha
se II
(RU
PE
S-I
I)
(51
3,15
3) -
5
21,5
87
257
,872
2
66,3
06
46,
312
66,
688
-
34,
624
29,
308
89,
375
-
266
,306
-
IFA
D-8
08P
rom
otin
g R
ural
Inno
vatio
ns
thro
ugh
Par
ticip
ator
y Tr
ee
Dom
estic
atio
n in
Wes
t and
C
entr
al A
fric
a
-
148
,537
-
-
1
48,5
37
-
33,
627
20,
186
35,
448
53,
366
5,9
10
-
148
,537
-
IFA
D-8
15P
ost T
suna
mi A
gric
ultu
re
and
Fis
herie
s R
ehab
ilita
tion
Pro
gram
me
-
-
-
-
-
-
-
-
-
-
-
-
-
-
IFA
D-9
19P
arkl
and
Tree
s an
d Li
velih
oods
: Ada
ptin
g to
C
limat
e C
hang
e in
Wes
t A
fric
an S
ahel
-
204
,078
4
63,9
19
-
667
,997
4
1,73
6 1
26,4
73
1,1
84
82,
791
77,
089
-
3,0
17
332
,290
3
35,7
07
IFA
D-9
21E
nabl
ing
Rur
al
Tran
sfor
mat
ion
and
Gra
ss-
root
s In
stitu
tion
Bui
ldin
g fo
r S
usta
inab
le L
and
Man
agem
ent a
nd In
crea
sed
Inco
mes
and
Foo
d S
ecur
ity
-
146
,419
2
82,3
31
27,
617
456
,367
1
32,3
30
102
,398
1
8,12
6 1
05,0
35
94,
845
-
3,6
33
456
,367
-
IFA
D-9
23S
calin
g U
p C
onse
rvat
ion
Agr
icul
ture
with
Tre
es fo
r Im
prov
ed L
ivel
ihoo
ds a
nd
Env
ironm
enta
l Res
ilien
ce in
E
aste
rn a
nd S
outh
ern
Afr
ica
-
82,
310
728
,868
-
8
11,1
78
140
,692
1
02,5
67
37,
971
152
,054
2
34,7
20
1,4
09
35,
050
704
,463
1
06,7
15
IFA
R W
ilfri
ed T
hal
wit
z S
cho
lars
hip
IFA
R-9
57IF
AR
Wilf
ried
Tha
lwitz
S
chol
arsh
ip -
1
0,95
0 -
-
1
0,95
0 -
-
-
7
,012
3
,938
-
-
1
0,95
0 -
Inte
rnat
ion
al F
oo
d P
olic
y R
esea
rch
Inst
itu
te
IFP
R-1
021
Low
Em
issi
on D
evel
opm
ent
Str
ateg
ies
-
-
75,
000
-
75,
000
1,1
25
38,
667
-
2,5
34
195
4
,924
-
4
7,44
5 2
7,55
5
IFP
R-1
041
Pro
duct
ion
and
Tech
nolo
gy
Pol
icie
s of
CR
P2
-
-
44,
010
-
44,
010
-
-
-
-
-
-
-
-
44,
010
IFP
R-9
10G
loba
l Fut
ures
pro
ject
(30
,000
) -
3
0,00
0 -
-
-
-
-
-
-
-
-
-
-
IFP
R-9
67R
esea
rch
Act
iviti
es o
n E
nhan
cing
the
Agr
ofor
estr
y C
ompo
nent
of t
he E
cono
mic
M
odel
s
-
30,
000
30,
000
-
60,
000
38,
477
8,0
74
-
30
1,8
84
-
-
48,
465
11,
535
Inte
rnat
ion
al In
stit
ute
fo
r S
ust
ain
able
Dev
elo
pm
ent
IISD
-100
0B
uild
ing
RE
DD
Pol
icy
Cap
acity
for
Dev
elop
ing
Cou
ntry
Neg
otia
tors
and
S
take
hold
ers
- P
hase
III
-
-
157
,753
-
1
57,7
53
36,
125
29,
759
-
53,
469
3,6
60
-
-
123
,013
3
4,74
0
IISD
-855
Bui
ldin
g R
ED
D C
apac
ity
Wor
ksho
ps -
4
9 (
49)
-
-
-
-
-
-
-
-
-
-
-
IISD
-903
Bui
ldin
g R
ED
D C
apac
ity
for
Dev
elop
ing
Cou
ntry
N
egot
iato
rs a
nd L
and
Man
ager
s -
Pha
se II
(59
,096
) -
1
16,4
57
-
57,
361
20,
608
21,
209
-
-
931
-
-
4
2,74
8 1
4,61
3
Inte
rnat
ion
al In
stit
ute
of
Tro
pic
al A
gri
cult
ure
IITA
-101
2E
vide
nce-
base
d S
calin
g-up
of
Eve
rgre
en A
gric
ultu
re
for
Incr
easi
ng C
rop
Pro
duct
ivity
, Fod
der
Sup
ply
and
Res
ilien
ce o
f the
Mai
ze-
mix
ed a
nd A
grop
asto
ral
Far
min
g S
yste
ms
in
Tanz
ania
and
Mal
awi
-
-
172
,000
-
1
72,0
00
15,
463
55,
416
7,5
50
41,
275
17,
509
-
13,
568
150
,780
2
1,22
0
Inte
rnat
ion
al L
ives
tock
Res
earc
h In
stit
ute
ILR
I-10
25S
usta
inab
le T
ree-
Cro
p-Li
vest
ock
Inte
nsifi
catio
n as
a
Pill
ar fo
r th
e E
thio
pian
C
limat
e R
esili
ent G
reen
E
cono
my
Initi
ativ
e
-
-
101
,250
-
1
01,2
50
7,9
22
24,
923
-
12,
760
20,
366
-
-
65,
971
35,
279
Exh
ibit
1b
: An
alys
is o
f S
ourc
es a
nd
Ap
plic
atio
ns
of R
estr
icte
d P
roje
ct G
ran
ts
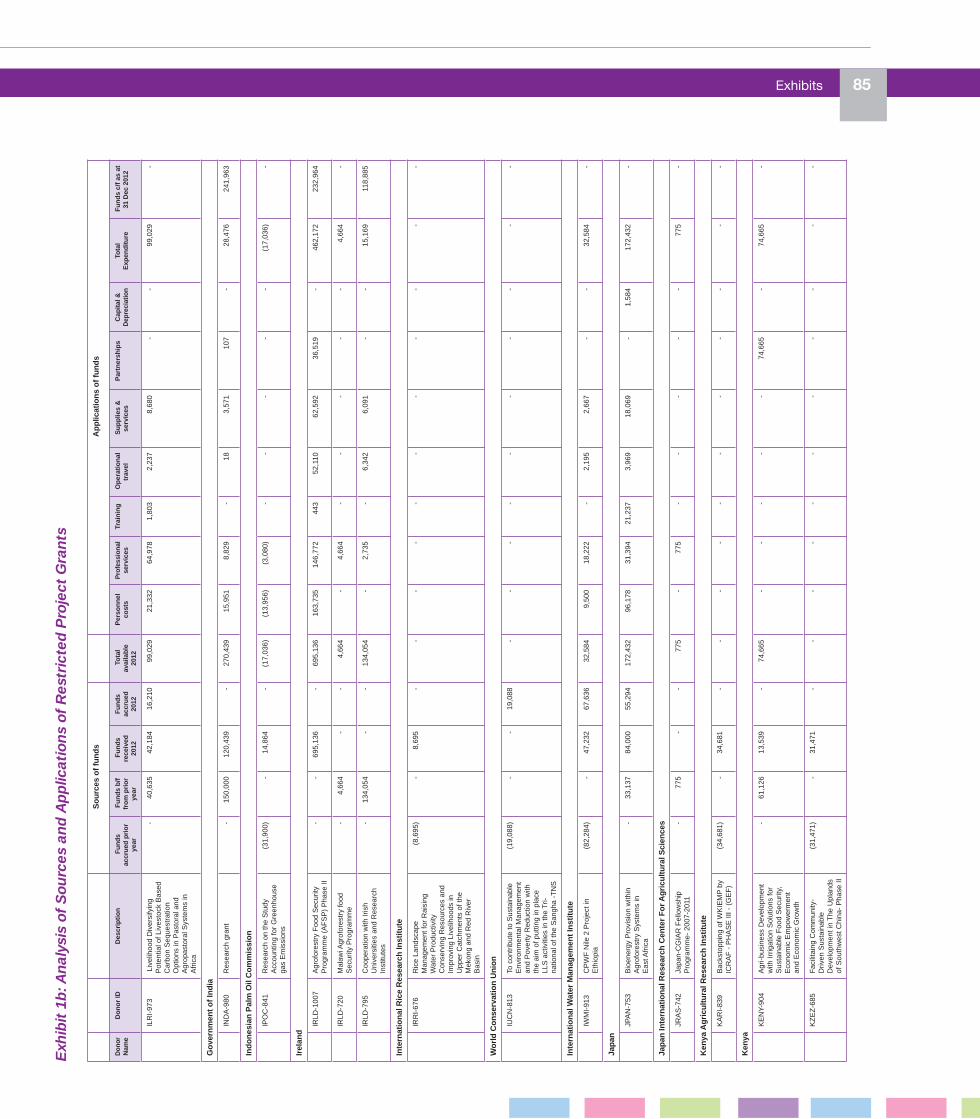
Exhibits 85 S
ou
rces
of
fun
ds
Ap
plic
atio
ns
of
fun
ds
Don
or
Nam
eD
on
or
IDD
escr
ipti
on
Fu
nd
s ac
cru
ed p
rio
r ye
ar
Fu
nd
s b
/f
fro
m p
rio
r ye
ar
Fu
nd
s re
ceiv
ed
2012
Fu
nd
s ac
cru
ed
2012
To
tal
avai
lab
le
2012
Per
son
nel
co
sts
Pro
fess
iona
l se
rvic
esTr
ain
ing
Op
erat
ion
al
trav
el S
up
plie
s &
se
rvic
esP
artn
ersh
ips
Cap
ital
&
Dep
reci
atio
nTo
tal
Exp
end
itu
re F
un
ds
c/f
as a
t 31
Dec
201
2
ILR
I-97
3 L
ivel
ihoo
d D
iver
sify
ing
Pot
entia
l of L
ives
tock
Bas
ed
Car
bon
Seq
uest
ratio
n O
ptio
ns in
Pas
tora
l and
A
grop
asto
ral S
yste
ms
in
Afr
ica
-
40,
635
42,
184
16,
210
99,
029
21,
332
64,
978
1,8
03
2,2
37
8,6
80
-
-
99,
029
-
Go
vern
men
t o
f In
dia
IND
A-9
80R
esea
rch
gran
t -
1
50,0
00
120
,439
-
2
70,4
39
15,
951
8,8
29
-
18
3,5
71
107
-
2
8,47
6 2
41,9
63
Ind
on
esia
n P
alm
Oil
Co
mm
issi
on
IPO
C-8
41R
esea
rch
on th
e S
tudy
A
ccou
ntin
g fo
r G
reen
hous
e ga
s E
mis
sion
s
(31
,900
) -
1
4,86
4 -
(
17,0
36)
(13
,956
) (
3,08
0) -
-
-
-
-
(
17,0
36)
-
Irel
and
IRLD
-100
7A
grof
ores
try
Foo
d S
ecur
ity
Pro
gram
me
(AF
SP
) P
hase
II -
-
6
95,1
36
-
695
,136
1
63,7
35
146
,772
4
43
52,
110
62,
592
36,
519
-
462
,172
2
32,9
64
IRLD
-720
Mal
awi A
grof
ores
try
food
S
ecur
ity P
rogr
amm
e -
4
,664
-
-
4
,664
-
4
,664
-
-
-
-
-
4
,664
-
IRLD
-795
Coo
pera
tion
with
Iris
h U
nive
rsiti
es a
nd R
esea
rch
Inst
itute
s
-
134
,054
-
-
1
34,0
54
-
2,7
35
-
6,3
42
6,0
91
-
-
15,
169
118
,885
Inte
rnat
ion
al R
ice
Res
earc
h In
stit
ute
IRR
I-67
6R
ice
Land
scap
e M
anag
emen
t for
Rai
sing
W
ater
Pro
duct
ivity
C
onse
rvin
g R
esou
rces
and
Im
prov
ing
Live
lihoo
ds in
U
pper
Cat
chm
ents
of t
he
Mek
ong
and
Red
Riv
er
Bas
in
(8,
695)
-
8,6
95
-
-
-
-
-
-
-
-
-
-
-
Wo
rld
Co
nse
rvat
ion
Un
ion
IUC
N-8
13To
con
trib
ute
to S
usta
inab
le
Env
ironm
enta
l Man
agem
ent
and
Pov
erty
Red
uctio
n w
ith
the
aim
of p
uttin
g in
pla
ce
LLS
act
iviti
es in
the
Tri-
natio
nal o
f the
San
gha
-TN
S
(19
,088
) -
-
1
9,08
8 -
-
-
-
-
-
-
-
-
-
Inte
rnat
ion
al W
ater
Man
agem
ent
Inst
itu
te
IWM
I-91
3C
PW
F N
ile 2
Pro
ject
in
Eth
iopi
a (
82,2
84)
-
47,
232
67,
636
32,
584
9,5
00
18,
222
-
2,1
95
2,6
67
-
-
32,
584
-
Jap
an
JPA
N-7
53B
ioen
ergy
Pro
visi
on w
ithin
A
grof
ores
try
Sys
tem
s in
E
ast A
fric
a
-
33,
137
84,
000
55,
294
172
,432
9
6,17
8 3
1,39
4 2
1,23
7 3
,969
1
8,06
9 -
1
,584
1
72,4
32
-
Jap
an In
tern
atio
nal
Res
earc
h C
ente
r F
or
Ag
ricu
ltu
ral S
cien
ces
JRA
S-7
42Ja
pan-
CG
IAR
Fel
low
ship
P
rogr
amm
e- 2
007-
2011
-
775
-
-
7
75
-
775
-
-
-
-
-
7
75
-
Ken
ya A
gri
cult
ura
l Res
earc
h In
stit
ute
KA
RI-
839
Bac
ksto
ppin
g of
WK
IEM
P b
y IC
RA
F -
PH
AS
E II
I - (
GE
F)
(34
,681
) -
3
4,68
1 -
-
-
-
-
-
-
-
-
-
-
Ken
ya
KE
NY-
904
Agr
i-bus
ines
s D
evel
opm
ent
with
Irrig
atio
n S
olut
ions
for
Sus
tain
able
Foo
d S
ecur
ity,
Eco
nom
ic E
mpo
wer
men
t an
d E
cono
mic
Gro
wth
-
61,
126
13,
539
-
74,
665
-
-
-
-
-
74,
665
-
74,
665
-
KZ
EZ
-685
Fac
ilita
ing
Com
mun
ity-
Driv
en S
usta
inab
le
Dev
elop
men
t in
The
Upl
ands
of
Sou
thw
est C
hina
- P
hase
II
(31
,471
) -
3
1,47
1 -
-
-
-
-
-
-
-
-
-
-
Exh
ibit
1b
: An
alys
is o
f S
ourc
es a
nd
Ap
plic
atio
ns
of R
estr
icte
d P
roje
ct G
ran
ts
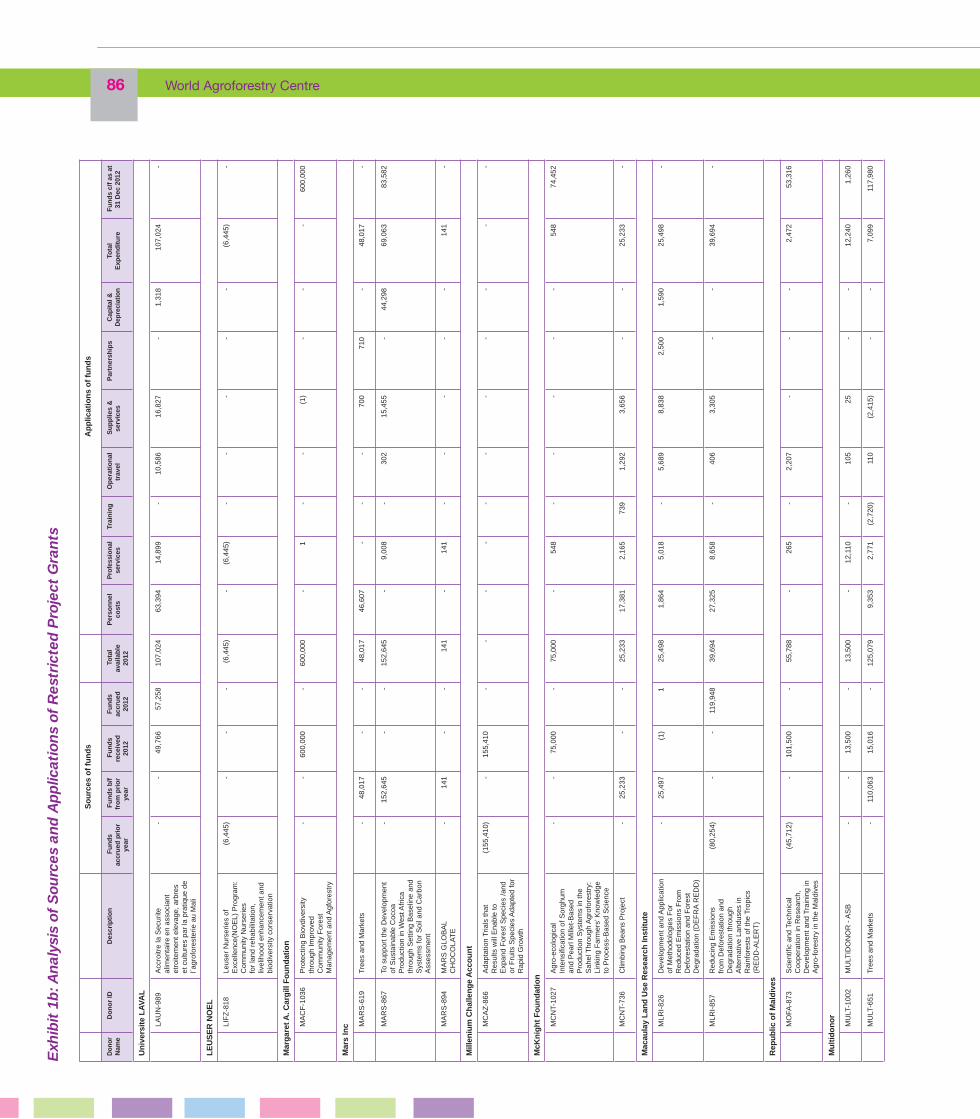
86 World Agroforestry Centre S
ou
rces
of
fun
ds
Ap
plic
atio
ns
of
fun
ds
Don
or
Nam
eD
on
or
IDD
escr
ipti
on
Fu
nd
s ac
cru
ed p
rio
r ye
ar
Fu
nd
s b
/f
fro
m p
rio
r ye
ar
Fu
nd
s re
ceiv
ed
2012
Fu
nd
s ac
cru
ed
2012
To
tal
avai
lab
le
2012
Per
son
nel
co
sts
Pro
fess
iona
l se
rvic
esTr
ain
ing
Op
erat
ion
al
trav
el S
up
plie
s &
se
rvic
esP
artn
ersh
ips
Cap
ital
&
Dep
reci
atio
nTo
tal
Exp
end
itu
re F
un
ds
c/f
as a
t 31
Dec
201
2
Un
iver
site
LA
VAL
LAU
N-9
89A
ccro
itre
la S
ecur
ite
alim
enta
ire e
n as
soci
ant
etro
item
ent e
leva
ge, a
rbre
s et
cul
ture
s pa
r la
pra
tique
de
l´agr
ofor
este
rie a
u M
ali
-
-
49,
766
57,
258
107
,024
6
3,39
4 1
4,89
9 -
1
0,58
6 1
6,82
7 -
1
,318
1
07,0
24
-
LE
US
ER
NO
EL
LIF
Z-8
18Le
user
Nur
serie
s of
E
xcel
lenc
e(N
OE
L) P
rogr
am:
Com
mun
ity N
urse
ries
for
land
reh
abili
tatio
n,
livel
ihoo
d en
hanc
emen
t and
bi
odiv
ersi
ty c
onse
rvat
ion
(6,
445)
-
-
-
(6,
445)
-
(6,
445)
-
-
-
-
-
(6,
445)
-
Mar
gar
et A
. Car
gill
Fo
un
dat
ion
MA
CF
-103
6P
rote
ctin
g B
iovd
iver
sity
th
roug
h Im
prov
ed
Com
mun
ity F
ores
t M
anag
emen
t and
Agf
ores
try
-
-
600
,000
-
6
00,0
00
-
1
-
-
(1)
-
-
-
600
,000
Mar
s In
c MA
RS
-619
Tree
s an
d M
arke
ts -
4
8,01
7 -
-
4
8,01
7 4
6,60
7 -
-
-
7
00
710
-
4
8,01
7 -
MA
RS
-867
To s
uppo
rt th
e D
evel
opm
ent
of S
usta
inab
le C
ocoa
P
rodu
ctio
n in
Wes
t Afr
ica
thro
ugh
Set
ting
Bas
elin
e an
d S
yste
ms
for
Soi
l and
Car
bon
Ass
essm
ent
-
152
,645
-
-
1
52,6
45
-
9,0
08
-
302
1
5,45
5 -
4
4,29
8 6
9,06
3 8
3,58
2
MA
RS
-894
MA
RS
GLO
BA
L C
HO
CO
LAT
E -
1
41
-
-
141
-
1
41
-
-
-
-
-
141
-
Mill
eniu
m C
hal
len
ge
Acc
ou
nt
MC
AZ
-866
Ada
ptat
ion
Tria
ls th
at
Res
ults
will
Ena
ble
to
Exp
and
For
est S
peci
es /a
nd
or F
ruits
Spe
cies
Ada
pted
for
Rap
id G
row
th
(15
5,41
0) -
1
55,4
10
-
-
-
-
-
-
-
-
-
-
-
McK
nig
ht
Fo
un
dat
ion
MC
NT-
1027
Agr
o-ec
olog
ical
In
tens
ifica
tion
of S
orgh
um
and
Pea
rl M
illet
-Bas
ed
Pro
duct
ion
Sys
tem
s in
the
Sah
el T
hrou
gh A
grof
ores
try:
Li
nkin
g F
arm
ers’
Kno
wle
dge
to P
roce
ss-B
ased
Sci
ence
-
-
75,
000
-
75,
000
-
548
-
-
-
-
-
5
48
74,
452
MC
NT-
736
Clim
bing
Bea
ns P
roje
ct -
2
5,23
3 -
-
2
5,23
3 1
7,38
1 2
,165
7
39
1,2
92
3,6
56
-
-
25,
233
-
Mac
aula
y L
and
Use
Res
earc
h In
stit
ute
MLR
I-82
6D
evel
opm
ent a
nd A
pplic
atio
n of
Met
hodo
logi
es F
or
Red
uced
Em
issi
ons
Fro
m
Def
ores
tatio
n an
d F
ores
t D
egra
datio
n (D
EF
RA
RE
DD
)
-
25,
497
(1)
1
25,
498
1,8
64
5,0
18
-
5,6
89
8,8
38
2,5
00
1,5
90
25,
498
-
MLR
I-85
7R
educ
ing
Em
issi
ons
from
Def
ores
tatio
n an
d D
egra
datio
n th
roug
h A
ltern
ativ
e La
ndus
es in
R
ainf
ores
ts o
f the
Tro
pics
(R
ED
D-A
LER
T)
(80
,254
) -
-
1
19,9
48
39,
694
27,
325
8,6
58
-
406
3
,305
-
-
3
9,69
4 -
Rep
ub
lic o
f M
ald
ives
MO
FA-8
73S
cien
tific
and
Tech
nica
l C
oope
ratio
n in
Res
earc
h,
Dev
elop
men
t and
Tra
inin
g in
A
gro-
fore
stry
in th
e M
aldi
ves
(45
,712
) -
1
01,5
00
-
55,
788
-
265
-
2
,207
-
-
-
2
,472
5
3,31
6
Mu
ltid
on
or
MU
LT-1
002
MU
LTID
ON
OR
- A
SB
-
-
13,
500
-
13,
500
-
12,
110
-
105
2
5 -
-
1
2,24
0 1
,260
MU
LT-6
51Tr
ees
and
Mar
kets
-
110
,063
1
5,01
6 -
1
25,0
79
9,3
53
2,7
71
(2,
720)
110
(
2,41
5) -
-
7
,099
1
17,9
80
Exh
ibit
1b
: An
alys
is o
f S
ourc
es a
nd
Ap
plic
atio
ns
of R
estr
icte
d P
roje
ct G
ran
ts
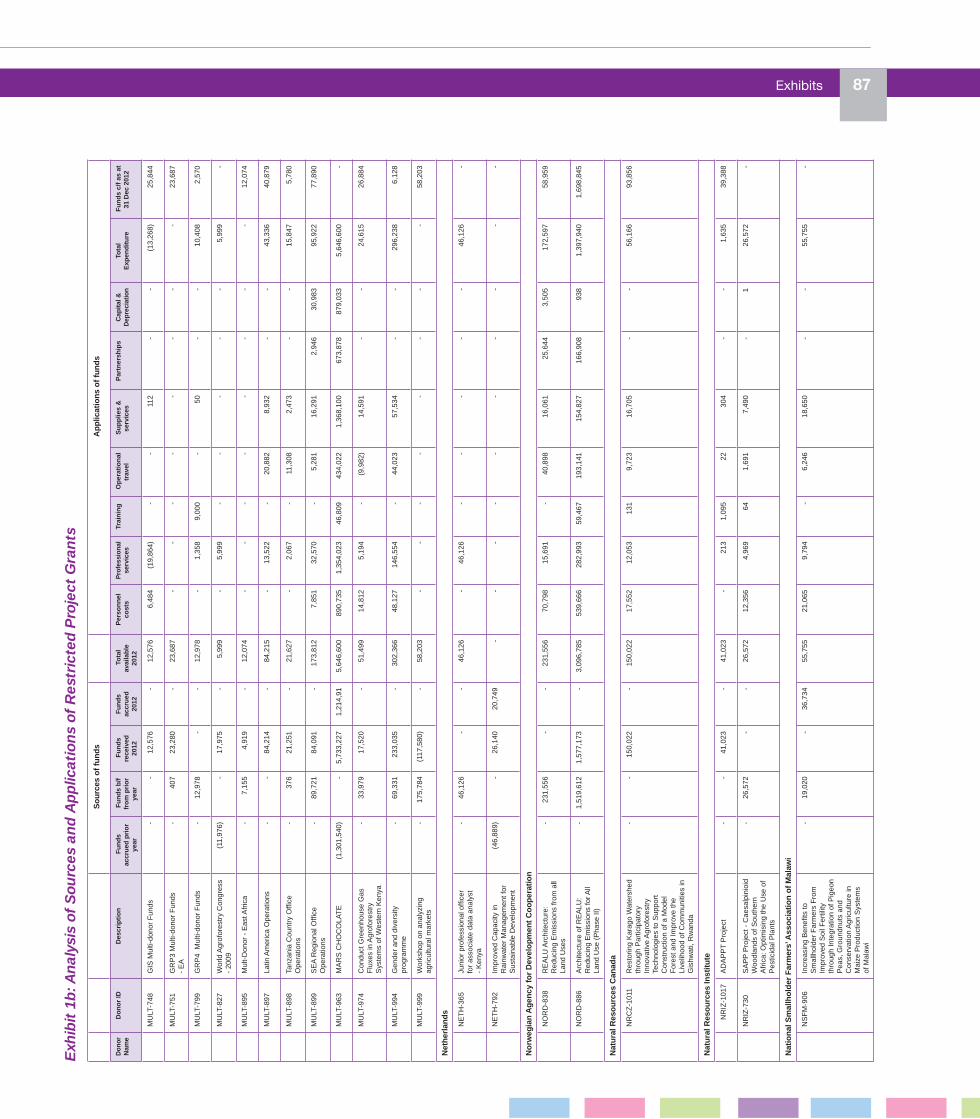
Exhibits 87E
xhib
it 1
b: A
nal
ysis
of
Sou
rces
an
d A
pp
licat
ion
s of
Res
tric
ted
Pro
ject
Gra
nts
So
urc
es o
f fu
nd
s A
pp
licat
ion
s o
f fu
nd
s
Don
or
Nam
eD
on
or
IDD
escr
ipti
on
Fu
nd
s ac
cru
ed p
rio
r ye
ar
Fu
nd
s b
/f
fro
m p
rio
r ye
ar
Fu
nd
s re
ceiv
ed
2012
Fu
nd
s ac
cru
ed
2012
To
tal
avai
lab
le
2012
Per
son
nel
co
sts
Pro
fess
iona
l se
rvic
esTr
ain
ing
Op
erat
ion
al
trav
el S
up
plie
s &
se
rvic
esP
artn
ersh
ips
Cap
ital
&
Dep
reci
atio
nTo
tal
Exp
end
itu
re F
un
ds
c/f
as a
t 31
Dec
201
2
MU
LT-7
48G
IS M
ulti-
dono
r F
unds
-
-
12,
576
-
12,
576
6,4
84
(19
,864
) -
-
1
12
-
-
(13
,268
) 2
5,84
4
MU
LT-7
51G
RP
3 M
ulti-
dono
r F
unds
-
EA
-
407
2
3,28
0 -
2
3,68
7 -
-
-
-
-
-
-
-
2
3,68
7
MU
LT-7
99G
RP
4 M
ulti-
dono
r F
unds
-
12,
978
-
-
12,
978
-
1,3
58
9,0
00
-
50
-
-
10,
408
2,5
70
MU
LT-8
27W
orld
Agr
ofor
estr
y C
ongr
ess
- 20
09 (
11,9
76)
-
17,
975
-
5,9
99
-
5,9
99
-
-
-
-
-
5,9
99
-
MU
LT-8
95M
ult-
Don
or -
Eas
t Afr
ica
-
7,1
55
4,9
19
-
12,
074
-
-
-
-
-
-
-
-
12,
074
MU
LT-8
97La
tin A
mer
ica
Ope
ratio
ns -
-
8
4,21
4 -
8
4,21
5 -
1
3,52
2 -
2
0,88
2 8
,932
-
-
4
3,33
6 4
0,87
9
MU
LT-8
98Ta
nzan
ia C
ount
ry O
ffice
O
pera
tions
-
376
2
1,25
1 -
2
1,62
7 -
2
,067
-
1
1,30
8 2
,473
-
-
1
5,84
7 5
,780
MU
LT-8
99S
EA
Reg
iona
l Offi
ce
Ope
ratio
ns -
8
9,72
1 8
4,09
1 -
1
73,8
12
7,8
51
32,
570
-
5,2
81
16,
291
2,9
46
30,
983
95,
922
77,
890
MU
LT-9
63M
AR
S C
HO
CO
LAT
E (
1,30
1,54
0) -
5
,733
,227
1
,214
,91
5,6
46,6
00
890
,735
1
,354
,023
4
6,80
9 4
34,0
22
1,3
68,1
00
673
,878
8
79,0
33
5,6
46,6
00
-
MU
LT-9
74C
ondu
ct G
reen
hous
e G
as
Flu
xes
in A
grof
ores
try
Sys
tem
s of
Wes
tern
Ken
ya
-
33,
979
17,
520
-
51,
499
14,
812
5,1
94
-
(9,
982)
14,
591
-
-
24,
615
26,
884
MU
LT-9
94G
ende
r an
d di
vers
ity
prog
ram
me
-
69,
331
233
,035
-
3
02,3
66
48,
127
146
,554
-
4
4,02
3 5
7,53
4 -
-
2
96,2
38
6,1
28
MU
LT-9
99W
orks
hop
on a
naly
zing
ag
ricul
tura
l mar
kets
-
175
,784
(
117,
580)
-
58,
203
-
-
-
-
-
-
-
-
58,
203
Net
her
lan
ds
NE
TH
-365
Juni
or p
rofe
ssio
nal o
ffice
r fo
r as
soci
ate
data
ana
lyst
-
Ken
ya
-
46,
126
-
-
46,
126
-
46,
126
-
-
-
-
-
46,
126
-
NE
TH
-792
Impr
oved
Cap
acity
in
Rai
nwat
er M
anag
emen
t for
S
usta
inab
le D
evel
opm
ent
(46
,889
) -
2
6,14
0 2
0,74
9 -
-
-
-
-
-
-
-
-
-
No
rweg
ian
Ag
ency
fo
r D
evel
op
men
t C
oo
per
atio
n
NO
RD
-838
RE
ALU
Arc
hite
ctur
e:
Red
ucin
g E
mis
sion
s fr
om a
ll La
nd U
ses
-
231
,556
-
-
2
31,5
56
70,
798
15,
691
-
40,
898
16,
061
25,
644
3,5
05
172
,597
5
8,95
9
NO
RD
-886
Arc
hite
ctur
e of
RE
ALU
: R
educ
ing
Em
issi
ons
for A
ll La
nd U
se (
Pha
se II
)
-
1,5
19,6
12
1,5
77,1
73
-
3,0
96,7
85
539
,666
2
82,9
93
59,
467
193
,141
1
54,8
27
166
,908
9
38
1,3
97,9
40
1,6
98,8
45
Nat
ura
l Res
ou
rces
Can
ada
NR
CZ
-101
1R
esto
ring
Kar
ago
Wat
ersh
ed
thro
ugh
Par
ticip
ator
y In
nova
tive
Agr
ofor
estr
y Te
chno
logi
es to
Sup
port
C
onst
ruct
ion
of a
Mod
el
For
est a
nd Im
prov
e th
e Li
velih
ood
of C
omm
uniti
es in
G
ishw
ati,
Rw
anda
-
-
150
,022
-
1
50,0
22
17,
552
12,
053
131
9
,723
1
6,70
5 -
-
5
6,16
6 9
3,85
6
Nat
ura
l Res
ou
rces
Inst
itu
te
NR
IZ-1
017
AD
AP
PT
Pro
ject
-
-
41,
023
-
41,
023
-
213
1
,095
2
2 3
04
-
-
1,6
35
39,
388
NR
IZ-7
30S
AP
P P
roje
ct -
Cae
salp
inio
id
Woo
dlan
ds o
f Sou
ther
n A
fric
a: O
ptim
isin
g th
e U
se o
f P
estic
idal
Pla
nts
-
26,
572
-
-
26,
572
12,
356
4,9
69
64
1,6
91
7,4
90
-
1
26,
572
-
Nat
ion
al S
mal
lho
lder
Far
mer
s’ A
sso
ciat
ion
of
Mal
awi
NS
FM
-906
Incr
easi
ng B
enefi
ts to
S
mal
lhol
der
Far
mer
s F
rom
Im
prov
ed S
oil F
ertil
ity
thro
ugh
Inte
grat
ion
of P
igeo
n P
eas,
Gro
undn
uts
and
Con
serv
atio
n A
gric
ultu
re in
M
aize
Pro
duct
ion
Sys
tem
s of
Mal
awi
-
19,
020
-
36,
734
55,
755
21,
065
9,7
94
-
6,2
46
18,
650
-
-
55,
755
-

88 World Agroforestry Centre S
ou
rces
of
fun
ds
Ap
plic
atio
ns
of
fun
ds
Don
or
Nam
eD
on
or
IDD
escr
ipti
on
Fu
nd
s ac
cru
ed p
rio
r ye
ar
Fu
nd
s b
/f
fro
m p
rio
r ye
ar
Fu
nd
s re
ceiv
ed
2012
Fu
nd
s ac
cru
ed
2012
To
tal
avai
lab
le
2012
Per
son
nel
co
sts
Pro
fess
iona
l se
rvic
esTr
ain
ing
Op
erat
ion
al
trav
el S
up
plie
s &
se
rvic
esP
artn
ersh
ips
Cap
ital
&
Dep
reci
atio
nTo
tal
Exp
end
itu
re F
un
ds
c/f
as a
t 31
Dec
201
2
Ove
rsea
s D
evel
op
men
t In
stit
ute
OD
IT-9
24B
ioen
ergy
in A
fric
a -
Jatr
opha
-
8,9
41
(7,
727)
-
1,2
14
-
1,2
14
-
-
-
-
-
1,2
14
-
Per
u
PE
RU
-102
3M
anej
o in
tegr
ado
de la
m
anch
a an
illad
a de
l pap
ayo
ocas
iona
da p
or e
l Pap
aya
Rin
gspo
t Viru
s (P
RS
V)
en la
s pr
inci
pale
s zo
nas
prod
ucto
ras
del P
erú
AN
D
For
tale
cim
ient
o in
stitu
cion
al
para
con
solid
ar la
in
vest
igac
ión
agro
fore
stal
-
-
50,
000
-
50,
000
-
-
-
-
-
-
-
-
50,
000
PE
RU
-930
Inve
stig
ació
n ag
rofo
rest
al
amaz
ónic
a pa
ra u
sos
de
la ti
erra
con
alta
pro
visi
ón
de s
ervi
cios
am
bien
tale
s,
baja
s em
isio
nes
de g
ases
y
rent
abili
dad
econ
ómic
a-
(201
1-20
13)
-
18,
823
49,
975
-
68,
798
22,
756
5,0
84
-
454
7
,052
-
-
3
5,34
6 3
3,45
2
Rw
and
a A
gri
cult
ura
l Dev
elo
pm
ent A
uth
ori
ty
RA
DA
-865
Sus
tain
able
Lan
d M
anag
emen
t Pro
ject
(R
wan
da)
(15
3,07
1) -
1
04,8
72
-
(48
,199
) (
57,1
43)
-
-
-
-
-
-
(57
,143
) 8
,944
Rai
nw
ater
Har
vest
ing
Imp
lem
enta
tio
n N
etw
ork
Fo
un
dat
ion
RA
IN-1
009
Inst
itutio
nal S
tren
gthe
ning
of
Sou
ther
n an
d E
aste
rn
Afr
ica
Rai
nwat
er N
etw
ork
- S
EA
RN
ET
Con
fere
nce.
-
-
28,
308
9,4
92
37,
800
8,8
20
9,2
02
-
3,6
13
16,
165
-
-
37,
800
-
RA
IN-9
52M
appi
ng In
terv
entio
ns
and
Ass
essi
ng F
inan
cing
M
echa
nism
s an
d In
stitu
tiona
l F
ram
ewor
ks fo
r S
usta
inab
le
Pro
mot
ion
of R
ainw
ater
H
arve
stin
g
(71
,857
) -
2
5,63
7 5
,258
(
40,9
61)
(5,
911)
(7,
109)
-
(1,
195)
(26
,747
) -
-
(
40,9
61)
-
Rig
hts
an
d R
eso
urc
es G
rou
p
RR
GZ
-814
Rig
hts
Rec
ogni
tion
Map
ping
an
d A
naly
zing
Les
sons
from
Te
nure
Ref
orm
(6,
902)
-
(60
5) 7
,507
-
-
-
-
-
-
-
-
-
-
RR
GZ
-858
Ana
lysi
s of
For
est P
rogr
am
Impa
cts
on E
nviro
nmen
t and
E
colo
gy
-
572
-
-
5
72
-
572
-
-
-
-
-
5
72
-
RR
GZ
-892
App
ropr
iate
pro
pert
y rig
hts
for
cust
omar
y us
e zo
nes
of lo
cal c
omm
uniti
es a
nd
indi
geno
us p
eopl
e in
C
amer
oon
AN
D M
ALI
-
Ela
bora
tion
et d
iffus
ion
d’un
do
cum
ent d
’orie
ntat
ion
sur
les
conv
entio
ns lo
cale
s
(2,
849)
-
(10
,000
) 1
2,84
9 -
-
-
-
-
-
-
-
-
-
RR
GZ
-920
Lega
l Pol
icy
Ref
orm
, Ten
ure
and
Ada
t Rig
hts
-
42,
176
-
-
42,
176
-
-
-
-
-
-
-
-
42,
176
Rep
ub
lic o
f S
ou
th A
fric
a G
ov’
t
RS
AZ
-101
5D
epar
tmen
t of A
gric
ultu
re,
For
estr
y an
d F
ishe
ries
-
-
107
,800
-
1
07,8
00
35,
869
24,
028
-
40,
016
4,0
89
-
-
104
,002
3
,798
Ro
un
dta
ble
on
Su
stai
nab
le P
alm
Oil
RS
PO
-938
Sci
entifi
c P
anel
of R
SP
O
Gre
enho
use
Gas
Wor
king
G
roup
(12
5) -
-
-
(
125)
-
(12
5) -
-
-
-
-
(
125)
-
Sw
iss
Dev
elo
pm
ent
Co
rpo
rati
on
SD
CZ
-103
8C
onsu
ltanc
y to
the
SD
C-
MoL
EP
Pro
ject
on
Slo
ping
La
nd M
anag
emen
t in
DP
RK
-
-
59,
124
48,
336
107
,460
3
2,14
5 5
9,76
9 -
1
5,10
6 4
40
-
-
107
,460
-
SD
CZ
-831
DP
RK
-C
apac
ity B
uild
ing
Mis
sion
s fo
r th
e S
lopi
ng
Land
Man
agem
ent P
roje
ct
-
28,
377
-
-
28,
377
-
-
-
-
-
-
-
-
28,
377
Exh
ibit
1b
: An
alys
is o
f S
ourc
es a
nd
Ap
plic
atio
ns
of R
estr
icte
d P
roje
ct G
ran
ts
-

Exhibits 89E
xhib
it 1
b: A
nal
ysis
of
Sou
rces
an
d A
pp
licat
ion
s of
Res
tric
ted
Pro
ject
Gra
nts
So
urc
es o
f fu
nd
s A
pp
licat
ion
s o
f fu
nd
s
Don
or
Nam
eD
on
or
IDD
escr
ipti
on
Fu
nd
s ac
cru
ed p
rio
r ye
ar
Fu
nd
s b
/f
fro
m p
rio
r ye
ar
Fu
nd
s re
ceiv
ed
2012
Fu
nd
s ac
cru
ed
2012
To
tal
avai
lab
le
2012
Per
son
nel
co
sts
Pro
fess
iona
l se
rvic
esTr
ain
ing
Op
erat
ion
al
trav
el S
up
plie
s &
se
rvic
esP
artn
ersh
ips
Cap
ital
&
Dep
reci
atio
nTo
tal
Exp
end
itu
re F
un
ds
c/f
as a
t 31
Dec
201
2
SD
CZ
-870
DP
RK
-S
usta
inab
le S
lopi
ng
Land
Man
agem
ent
-
351
-
-
3
51
-
351
-
-
-
-
-
3
51
-
SD
CZ
-931
DP
RK
- S
usta
inab
ility
and
In
stitu
tiona
lizat
ion
of S
lopi
ng
Land
Man
agem
ent
(12
0,31
4) -
5
4,66
0 -
(
65,6
54)
(6,
689)
(55
,755
) -
(
3,05
5) (
155)
-
-
(65
,654
) -
SD
CZ
-966
Clim
ate
Sm
art R
ural
D
evel
opm
ent P
roje
ct -
7
0,99
2 -
-
7
0,99
2 -
6
8,00
0 -
(
1,80
5) 1
,025
-
-
6
7,22
0 3
,772
Sw
edis
h In
tern
atio
nal
Dev
elo
pm
ent
Co
op
erat
ion
Ag
ency
SID
A-9
12C
onse
rvat
ion
Agr
icul
ture
with
Tr
ees
(CA
WT
) -
4
45,7
22
-
-
445
,722
1
7,40
7 3
1,40
9 2
,638
3
7,09
0 1
3,61
6 3
03,6
20
-
405
,781
3
9,94
1
Sw
edis
h U
niv
ersi
ty o
f Ag
ricu
ltu
ral S
cien
ces
SLU
Z-9
15A
grof
ores
try
for
Impr
ovin
g F
ood
Sec
urity
and
S
imul
tane
ous
Leve
rage
on
Clim
ate
Cha
nge
Ada
ptat
ion
and
Miti
gatio
n
-
103
-
-
1
03
-
103
-
-
-
-
-
1
03
-
SLU
Z-9
45A
ppro
ache
s fo
r Ana
lysi
ng
Mul
ti-fu
nctio
nalit
y of
A
grof
ores
try
Sys
tem
s in
Wes
tern
Ken
ya in
R
elat
ion
to C
limat
e C
hang
e A
dapt
atio
n an
d M
itiga
tion
and
Mul
tifun
ctio
nalit
y of
A
grof
ores
try
Sys
tem
s
-
57,
571
-
-
57,
571
11,
952
7,6
49
13,
682
8,3
47
1,2
90
-
-
42,
919
14,
652
Teg
emeo
Inst
itu
te o
f E
ger
ton
Un
iver
sity
TIE
U-1
019
Impr
ovin
g P
artic
ipat
ion
in
Agr
icul
tura
l Com
mod
ity
Mar
kets
for
Sm
allh
olde
r F
arm
ers
in K
enya
: Ass
essi
ng
Gro
wth
Opp
ortu
nitie
s fo
r th
e M
argi
naliz
ed G
roup
s
-
-
54,
044
-
54,
044
8,9
85
719
-
-
-
-
-
9
,704
4
4,34
0
Un
iver
sity
of
Co
pen
hag
en
UC
OP
-927
Impa
cts
of R
educ
ing
Em
issi
ons
from
D
efor
esta
tion
and
For
est
Deg
rada
tion
and
Enh
anci
ng
Car
bon
Sto
cks
- I-
RE
DD
-
72,
898
-
-
72,
898
15,
667
10,
975
-
9,3
45
8,2
74
853
-
4
5,11
4 2
7,78
3
Un
ited
Nat
ion
s D
evel
op
men
t P
rog
ram
me
UN
DP
-726
Ass
essm
ent o
f Car
bon
Seq
uest
ratio
n in
the
Low
land
s of
Bar
ingo
Dis
tric
t, K
enya
-
1,0
33
-
-
1,0
33
-
1,0
33
-
-
-
-
-
1,0
33
-
UN
DP
-731
UN
DP
Bio
Car
bon
Cer
tifica
tion
Cou
rse
-
2
(2)
-
-
-
-
-
-
-
-
-
-
-
UN
DP
-805
Str
ateg
ic In
vest
men
t P
rogr
am fo
r S
usta
inab
le
Land
Man
agem
ent i
n S
ub-
Sah
aran
Afr
ica
-
15,
996
20,
440
-
36,
436
12,
296
-
-
14,
843
9,2
97
-
-
36,
436
-
Un
ited
Nat
ion
s E
nvi
ron
men
t P
rog
ram
me
UN
EP
-535
An
Eco
syst
em A
ppro
ach
to R
esto
ring
Wes
t Afr
ican
D
ryla
nds
and
Impr
ovin
g R
ural
Liv
elih
oods
thro
ugh
Agr
ofor
estr
y-ba
sed
Land
M
anag
emen
t Int
erve
ntio
ns
-
-
36,
426
-
36,
426
-
-
-
-
-
-
-
-
36,
426
UN
EP
-561
Rai
n W
ater
Par
tner
ship
P
rogr
amm
e -
1
(
1) -
-
-
-
-
-
-
-
-
-
-
UN
EP
-942
Inte
rim S
ecre
taria
t of
Nai
robi
Sci
ence
and
Pol
icy
For
um o
n S
usta
inab
ility
of
Agr
oeco
syst
ems
-
30,
000
-
-
30,
000
-
22,
000
-
-
-
-
-
22,
000
8,0
00
UN
EP
-968
UN
-RE
DD
Pan
ama
Pro
gram
-
44,
682
22,
289
-
66,
971
4,8
43
43,
187
-
1,7
59
25
-
-
49,
814
17,
156
UN
EP
-969
Rev
isiti
ng C
limat
e C
hang
e w
ithin
Maa
sai M
au F
ores
t an
d its
Fut
ure
Impl
icat
ion
on M
aasa
i Mau
For
est
Com
plex
’s C
onse
rvat
ion
-
13,
446
16,
500
3,3
57
33,
303
14,
818
4,3
44
7,4
39
1,2
37
5,4
66
-
-
33,
303
-
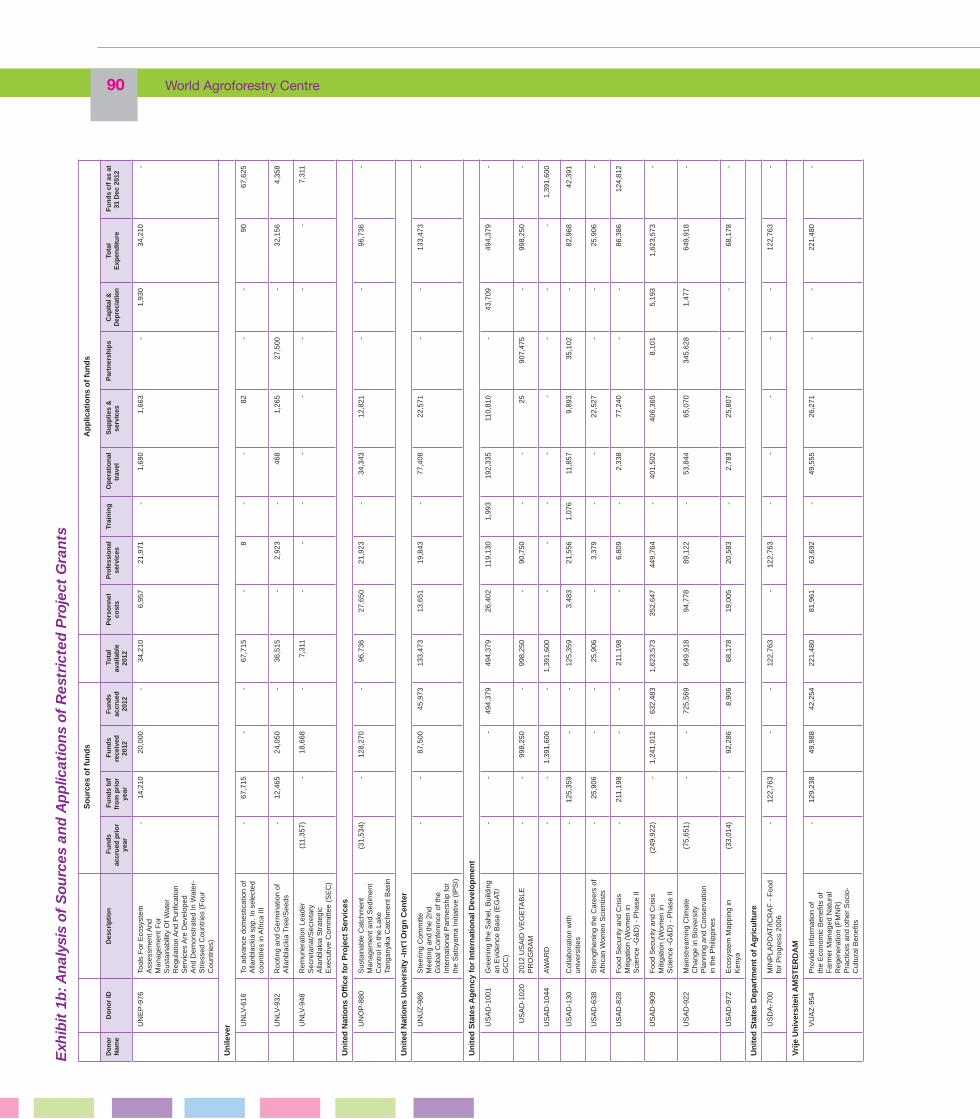
90 World Agroforestry Centre S
ou
rces
of
fun
ds
Ap
plic
atio
ns
of
fun
ds
Don
or
Nam
eD
on
or
IDD
escr
ipti
on
Fu
nd
s ac
cru
ed p
rio
r ye
ar
Fu
nd
s b
/f
fro
m p
rio
r ye
ar
Fu
nd
s re
ceiv
ed
2012
Fu
nd
s ac
cru
ed
2012
To
tal
avai
lab
le
2012
Per
son
nel
co
sts
Pro
fess
iona
l se
rvic
esTr
ain
ing
Op
erat
ion
al
trav
el S
up
plie
s &
se
rvic
esP
artn
ersh
ips
Cap
ital
&
Dep
reci
atio
nTo
tal
Exp
end
itu
re F
un
ds
c/f
as a
t 31
Dec
201
2
UN
EP
-976
Tool
s F
or E
cosy
stem
A
sses
smen
t And
M
anag
emen
t For
S
usta
inab
ility
Of W
ater
R
egul
atio
n A
nd P
urifi
catio
n S
ervi
ces
Are
Dev
elop
ed
And
Dem
onst
rate
d In
Wat
er-
Str
esse
d C
ount
ries
(Fou
r C
ount
ries)
-
14,
210
20,
000
-
34,
210
6,9
57
21,
971
-
1,6
90
1,6
63
-
1,9
30
34,
210
-
Un
ileve
r UN
LV-6
16To
adv
ance
dom
estic
atio
n of
A
llanb
lack
ia s
pp. I
n se
lect
ed
coun
trie
s in
Afr
ica
III
-
67,
715
-
-
67,
715
-
8
-
-
82
-
-
90
67,
625
UN
LV-9
32R
ootin
g an
d G
erm
inat
ion
of
Alla
nbla
ckia
Tre
e/S
eeds
-
12,
465
24,
050
-
36,
515
-
2,9
23
-
468
1
,265
2
7,50
0 -
3
2,15
6 4
,358
UN
LV-9
48R
emun
erat
ion
Lead
er
Sec
reta
riat/S
ecre
tary
A
llanb
laki
a S
trat
egic
E
xecu
tive
Com
mitt
ee (
SE
C)
(11
,357
) -
1
8,66
8 -
7
,311
-
-
-
-
-
-
-
-
7
,311
Un
ited
Nat
ion
s O
ffice
fo
r P
roje
ct S
ervi
ces
UN
OP
-880
Sus
tain
able
Cat
chm
ent
Man
agem
ent a
nd S
edim
ent
Con
trol
in th
e La
ke
Tang
anyi
ka C
atch
men
t Bas
in
(31
,534
) -
1
28,2
70
-
96,
736
27,
650
21,
923
-
34,
343
12,
821
-
-
96,
736
-
Un
ited
Nat
ion
s U
niv
ersi
ty -
Int’
l Org
n C
ente
r
UN
UZ
-986
Ste
erin
g C
omm
itte
Mee
ting
and
the
2nd
Glo
bal C
onfe
renc
e of
the
Inte
rnat
iona
l Par
tner
ship
for
the
Sat
oyam
a In
itiat
ive
(IP
SI)
-
-
87,
500
45,
973
133
,473
1
3,65
1 1
9,84
3 -
7
7,40
8 2
2,57
1 -
-
1
33,4
73
-
Un
ited
Sta
tes
Ag
ency
fo
r In
tern
atio
nal
Dev
elo
pm
ent
US
AD
-100
1G
reen
ing
the
Sah
el, B
uild
ing
an E
vide
nce
Bas
e (E
GA
T/
GC
C)
-
-
-
494
,379
4
94,3
79
26,
402
119
,130
1
,993
1
92,3
35
110
,810
-
4
3,70
9 4
94,3
79
-
US
AD
-102
020
12 U
SA
ID V
EG
ETA
BLE
P
RO
GR
AM
-
-
998
,250
-
9
98,2
50
-
90,
750
-
-
25
907
,475
-
9
98,2
50
-
US
AD
-104
4A
WA
RD
-
-
1,3
91,6
00
-
1,3
91,6
00
-
-
-
-
-
-
-
-
1,3
91,6
00
US
AD
-130
Col
labo
ratio
n w
ith
univ
ersi
ties
-
125
,359
-
-
1
25,3
59
3,4
83
21,
556
1,0
76
11,
857
9,8
93
35,
102
-
82,
968
42,
391
US
AD
-638
Str
engt
heni
ng th
e C
aree
rs o
f A
fric
an W
omen
Sci
entis
ts -
2
5,90
6 -
-
2
5,90
6 -
3
,379
-
-
2
2,52
7 -
-
2
5,90
6 -
US
AD
-828
Foo
d S
ecur
ity a
nd C
risis
M
itiga
tion
(Wom
en in
S
cien
ce -
G&
D)
- P
hase
II
-
211
,198
-
-
2
11,1
98
-
6,8
09
-
2,3
38
77,
240
-
-
86,
386
124
,812
US
AD
-909
Foo
d S
ecur
ity a
nd C
risis
M
itiga
tion
(Wom
en in
S
cien
ce -
G&
D)
- P
hase
II
(24
9,92
2) -
1
,241
,012
6
32,4
83
1,6
23,5
73
352
,647
4
49,7
64
-
401
,502
4
06,3
65
8,1
01
5,1
93
1,6
23,5
73
-
US
AD
-922
Mai
nstr
eam
ing
Clim
ate
Cha
nge
in B
iove
rsity
P
lann
ing
and
Con
serv
atio
n in
the
Phi
lippi
nes
(75
,651
) -
-
7
25,5
69
649
,918
9
4,77
8 8
9,12
2 -
5
3,84
4 6
5,07
0 3
45,6
28
1,4
77
649
,918
-
US
AD
-972
Eco
syst
em M
appi
ng in
K
enya
(33
,014
) -
9
2,28
6 8
,906
6
8,17
8 1
9,00
5 2
0,58
3 -
2
,783
2
5,80
7 -
-
6
8,17
8 -
Un
ited
Sta
tes
Dep
artm
ent
of A
gri
cult
ure
US
DA
-700
MIN
PLA
PD
AT
/ICR
AF
- F
ood
for
Pro
gres
s 20
06 -
1
22,7
63
-
-
122
,763
-
1
22,7
63
-
-
-
-
-
122
,763
-
Vri
je U
niv
ersi
teit
AM
ST
ER
DA
M
VU
AZ
-954
Pro
vide
Info
rmat
ion
of
the
Eco
nom
ic B
enefi
ts o
f F
arm
er M
anag
ed N
atur
al
Reg
ener
atio
n (F
MN
R)
Pra
ctic
es a
nd o
ther
Soc
io-
Cul
tura
l Ben
efits
-
129
,238
4
9,98
8 4
2,25
4 2
21,4
80
81,
961
63,
692
-
49,
555
26,
271
-
-
221
,480
-
Exh
ibit
1b
: An
alys
is o
f S
ourc
es a
nd
Ap
plic
atio
ns
of R
estr
icte
d P
roje
ct G
ran
ts
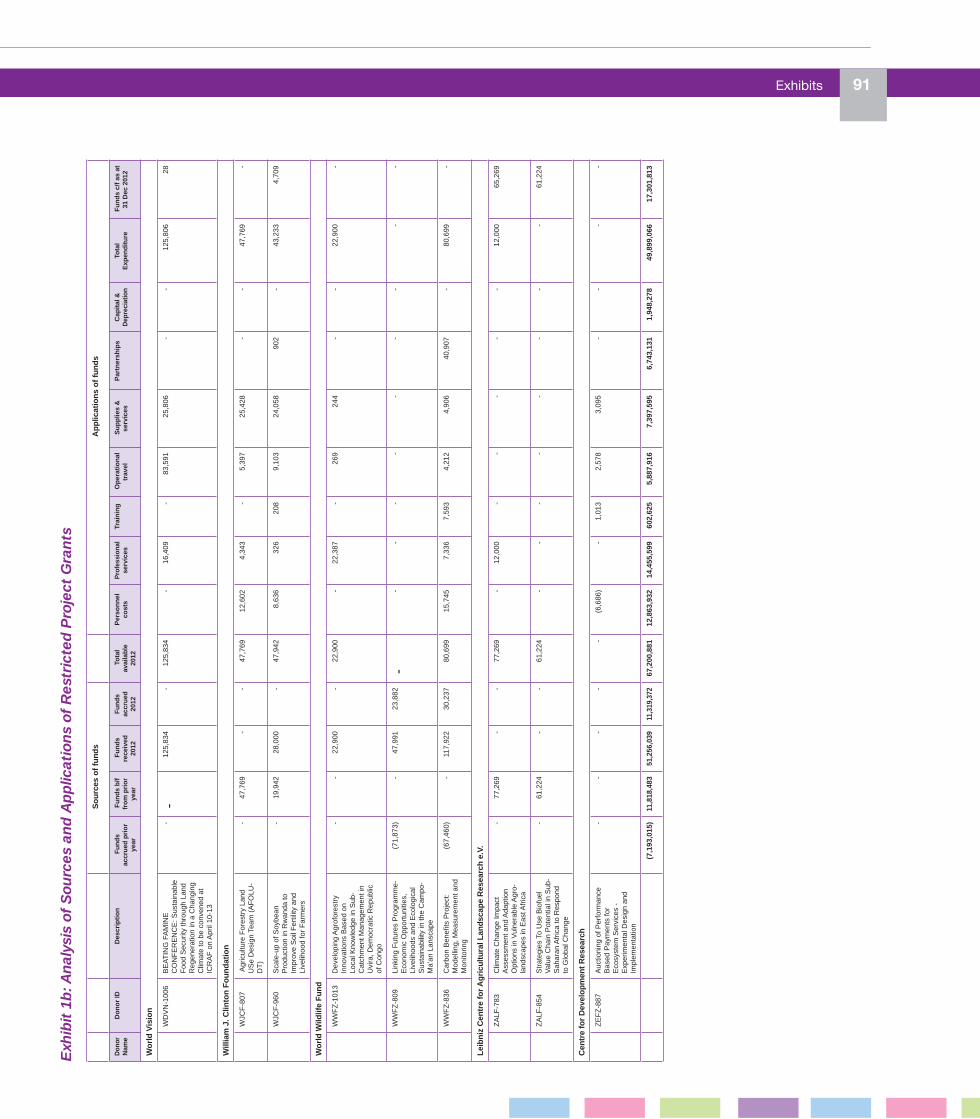
Exhibits 91E
xhib
it 1
b: A
nal
ysis
of
Sou
rces
an
d A
pp
licat
ion
s of
Res
tric
ted
Pro
ject
Gra
nts
So
urc
es o
f fu
nd
s A
pp
licat
ion
s o
f fu
nd
s
Don
or
Nam
eD
on
or
IDD
escr
ipti
on
Fu
nd
s ac
cru
ed p
rio
r ye
ar
Fu
nd
s b
/f
fro
m p
rio
r ye
ar
Fu
nd
s re
ceiv
ed
2012
Fu
nd
s ac
cru
ed
2012
To
tal
avai
lab
le
2012
Per
son
nel
co
sts
Pro
fess
iona
l se
rvic
esTr
ain
ing
Op
erat
ion
al
trav
el S
up
plie
s &
se
rvic
esP
artn
ersh
ips
Cap
ital
&
Dep
reci
atio
nTo
tal
Exp
end
itu
re F
un
ds
c/f
as a
t 31
Dec
201
2
Wo
rld
Vis
ion
WD
VN
-100
6B
EA
TIN
G F
AM
INE
C
ON
FE
RE
NC
E: S
usta
inab
le
Foo
d S
ecur
ity th
roug
h La
nd
Reg
ener
atio
n in
a C
hang
ing
Clim
ate
to b
e co
nven
ed a
t IC
RA
F o
n A
pril
10-1
3
-
-
125
,834
-
1
25,8
34
-
16,
409
-
83,
591
25,
806
-
-
125
,806
2
8
Will
iam
J. C
linto
n F
ou
nd
atio
n
WJC
F-8
07 A
gric
ultu
re F
ores
try
Land
U
Se
Des
ign
Team
(A
FO
LU-
DT
)
-
47,
769
-
-
47,
769
12,
602
4,3
43
-
5,3
97
25,
428
-
-
47,
769
-
WJC
F-9
60S
cale
-up
of S
oybe
an
Pro
duct
ion
in R
wan
da to
Im
prov
e S
oil F
ertil
ity a
nd
Live
lihoo
d fo
r F
arm
ers
-
19,
942
28,
000
-
47,
942
8,6
36
326
2
08
9,1
03
24,
058
902
-
4
3,23
3 4
,709
Wo
rld
Wild
life
Fu
nd
WW
FZ
-101
3D
evel
opin
g A
grof
ores
try
Inno
vatio
ns B
ased
on
Loca
l Kno
wle
dge
in S
ub-
Cat
chm
ent M
anag
emen
t in
Uvi
ra, D
emoc
ratic
Rep
ublic
of
Con
go
-
-
22,
900
-
22,
900
-
22,
387
-
269
2
44
-
-
22,
900
-
WW
FZ
-809
Link
ing
Fut
ures
Pro
gram
me-
E
cono
mic
Opp
ortu
nitie
s,
Live
lihoo
ds a
nd E
colo
gica
l S
usta
inab
ility
in th
e C
ampo
-M
a’an
Lan
scap
e
(71
,873
) -
4
7,99
1 2
3,88
2 -
-
-
-
-
-
-
-
-
-
WW
FZ
-836
Car
bon
Ben
efits
Pro
ject
: M
odel
ling,
Mea
sure
men
t and
M
onito
ring
(67
,460
) -
1
17,9
22
30,
237
80,
699
15,
745
7,3
36
7,5
93
4,2
12
4,9
06
40,
907
-
80,
699
-
Lei
bn
iz C
entr
e fo
r A
gri
cult
ura
l Lan
dsc
ape
Res
earc
h e
.V.
ZA
LF-7
83C
limat
e C
hang
e Im
pact
A
sses
smen
t and
Ada
ptio
n O
ptio
ns in
Vul
nera
ble
Agr
o-la
ndsc
apes
in E
ast A
fric
a
-
77,
269
-
-
77,
269
-
12,
000
-
-
-
-
-
12,
000
65,
269
ZA
LF-8
54S
trat
egie
s To
Use
Bio
fuel
V
alue
Cha
in P
oten
tial i
n S
ub-
Sah
aran
Afr
ica
to R
espo
nd
to G
loba
l Cha
nge
-
61,
224
-
-
61,
224
-
-
-
-
-
-
-
-
61,
224
Cen
tre
for
Dev
elo
pm
ent
Res
earc
h
ZE
FZ
-887
Auc
tioni
ng o
f Per
form
ance
B
ased
Pay
men
ts fo
r E
cosy
stem
Ser
vice
s -
Exp
erim
enta
l Des
ign
and
Impl
emen
tatio
n
-
-
-
-
-
(6,
686)
-
1,0
13
2,5
78
3,0
95
-
-
-
-
(7,1
93,0
15)
11,8
18,4
83
51,2
56,0
39
11,3
19,3
72
67,2
00,8
81
12,8
63,9
32
14,4
55,5
99
602,
625
5,8
87,9
16
7,39
7,59
5 6
,743
,131
1
,948
,278
49
,899
,066
17
,301
,813

92 World Agroforestry Centre
PROPERTY AND EQUIPMENT DETAILED SCHEDULE AS AT 31 DECEMBER 2012 (IN US DOLLARS ‘000’) EXHIBIT 2
2012 2011
Physical Facilities
Infrastructure & Leasehold
Furnishing & Equipment
Total
COST
Balance: January 1 7,485 463 11,943 19,891 23,966
Additions - - 2,225 2,225 1,734
Work in Progress 287 - 385 672 78
Disposals (1) - (2,523) (2,524) (5,887)
Balance December 31 7,771 463 12,030 20,264 19,891
ACCUMULATED DEPRECIATION
Balance : January 1 (3,814) (263) (10,464) (14,541) (18,536)
Additions (224) (27) (2,334) (2,585) (1,717)
Disposals 1 - 2,514 2,515 5,712
Balance December 31 (4,037) (290) (10,284) (14,611) (14,541)
NET BOOK VALUE 3,734 173 1,746 5,653 5,350
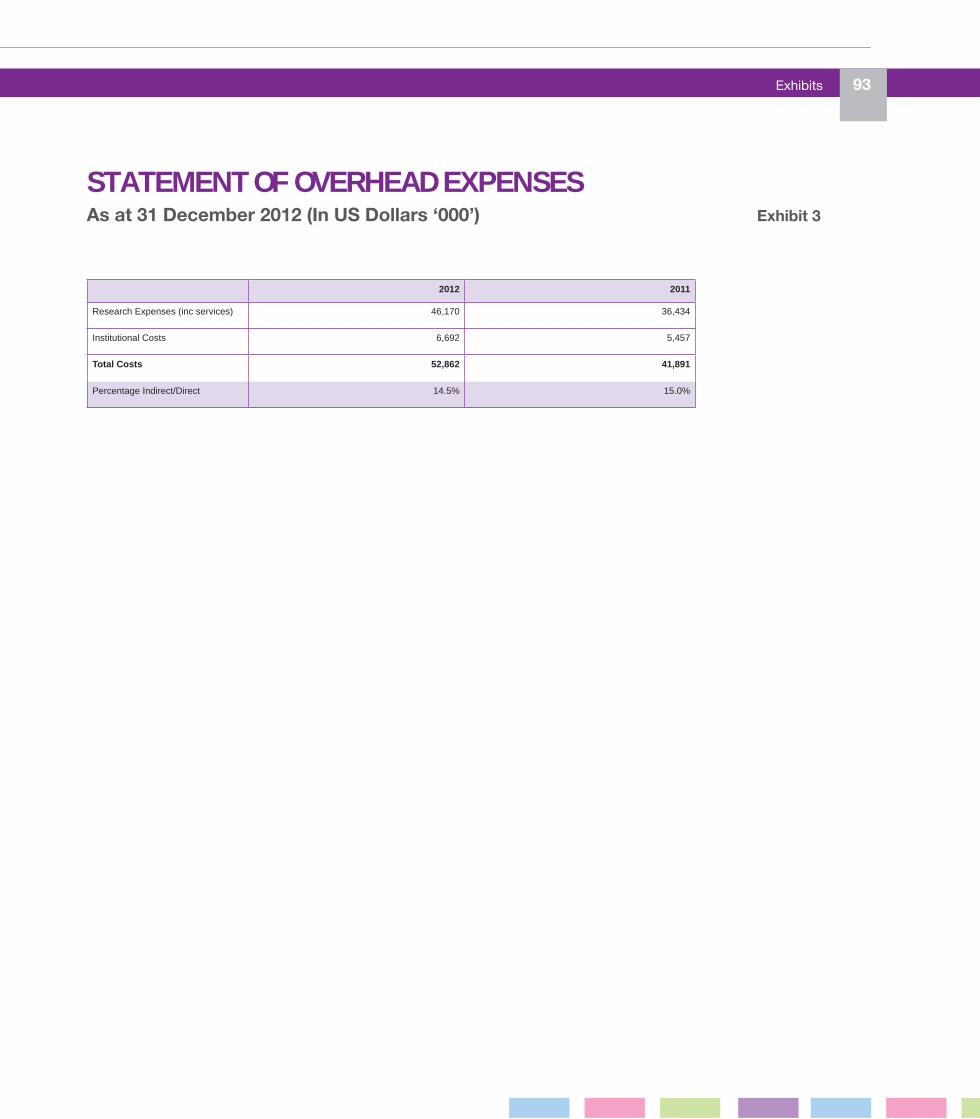
Exhibits 93
STATEMENT OF OVERHEAD EXPENSESAs at 31 December 2012 (In US Dollars ‘000’) Exhibit 3
2012 2011
Research Expenses (inc services) 46,170 36,434
Institutional Costs 6,692 5,457
Total Costs 52,862 41,891
Percentage Indirect/Direct 14.5% 15.0%
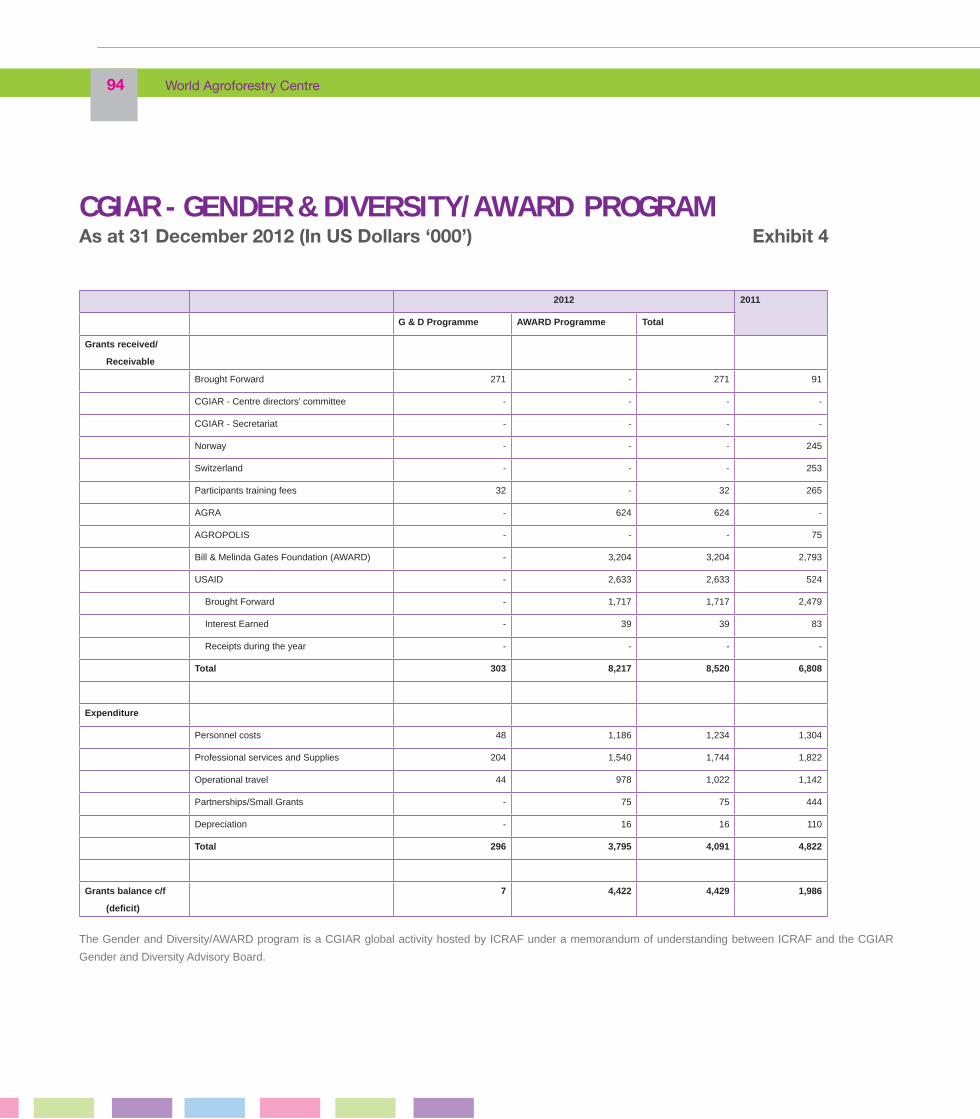
94 World Agroforestry Centre
CGIAR - GENDER & DIVERSITY/AWARD PROGRAMAs at 31 December 2012 (In US Dollars ‘000’) Exhibit 4
2012 2011
G & D Programme AWARD Programme Total
Grants received/
Receivable
Brought Forward 271 - 271 91
CGIAR - Centre directors’ committee - - - -
CGIAR - Secretariat - - - -
Norway - - - 245
Switzerland - - - 253
Participants training fees 32 - 32 265
AGRA - 624 624 -
AGROPOLIS - - - 75
Bill & Melinda Gates Foundation (AWARD) - 3,204 3,204 2,793
USAID - 2,633 2,633 524
Brought Forward - 1,717 1,717 2,479
Interest Earned - 39 39 83
Receipts during the year - - - -
Total 303 8,217 8,520 6,808
Expenditure
Personnel costs 48 1,186 1,234 1,304
Professional services and Supplies 204 1,540 1,744 1,822
Operational travel 44 978 1,022 1,142
Partnerships/Small Grants - 75 75 444
Depreciation - 16 16 110
Total 296 3,795 4,091 4,822
Grants balance c/f
(deficit)
7 4,422 4,429 1,986
The Gender and Diversity/AWARD program is a CGIAR global activity hosted by ICRAF under a memorandum of understanding between ICRAF and the CGIAR
Gender and Diversity Advisory Board.

Exhibits 95
CGIAR RESEARCH PROGRAM 1.1: INTEGRATED AGRICULTURAL PRODUCTION SYSTEMS FOR IMPROVED FOOD SECURITY AND LIVELIHOODS IN DRY AREASFor the year ended 31 December 2012 (In US Dollars) Exhibit 5
EXPENDITURE REPORT FUNDING REPORT
W1 + W2 Funds
Window 3 & Bilateral
Centre Funds
Total INCOME YEAR 1 TOTAL
Personnel 245,635 603,310 156,192 1,005,137 OP. BALANCE - -
Collaborators/Partnership Costs - CG Centers
- - - - CRP1.2 W1+W2 funds 527,925 527,925
Collaborators/Partnership Costs - Others - 36,519 - 36,519 - -
Supplies and services 219,544 211,426 58,358 489,328 TOTAL 527,925 527,925
Operational travel 95,185 213,750 53,213 362,148
Depreciation 51,810 5,012 7,328 64,150 EXPENDITURE TOTAL
Contingency (only for budgeting purposes) - - - - CRP1.1 W1+W2 Expenses
704,000 704,000
Subtotal 612,174 1,070,017 275,091 1,957,282
Institutional Overhead (15% of direct cost) 91,826 157,657 - 249,483 TOTAL EXPENDITURE 704,000 704,000
TOTAL 704,000 1,227,674 275,091 2,206,765 BALANCE (176,075) (176,075)

96 World Agroforestry Centre
CGIAR RESEARCH PROGRAM 1.2: INTEGRATED SYSTEMS FOR THE HUMID TROPICSFor the year ended 31 December 2012 (In US Dollars) Exhibit 5
EXPENDITURE REPORT FUNDING REPORT
W1 + W2 Funds
Window 3 & Bilateral
Centre Funds
Total INCOME YEAR 1 TOTAL
Personnel 79,958 121,812 54,624 256,394 OP. BALANCE - - Collaborators/Partnership Costs - CG
Centers - - - - CRP1.2 W1+W2 funds - -
Collaborators/Partnership Costs - Others 44,869 - 112,575 157,444 - - Supplies and services 7,415 98,873 30,401 136,689 TOTAL - - Operational travel 2,541 17,620 8,581 28,742
Depreciation - 2,699 2,699 EXPENDITURE TOTAL
Contingency (only for budgeting purposes) - - - - CRP1.2 W1+W2 Expenses
155,000 155,000
Subtotal 134,783 238,305 208,880 581,968
Institutional Overhead (15% of direct cost) 20,217 37,782 - 57,999 TOTAL EXPENDITURE 155,000 155,000
TOTAL 155,000 276,087 208,880 639,967 BALANCE (155,000) (155,000)
CGIAR RESEARCH PROGRAM 2: POLICIES, INSTITUTIONS AND MARKETSFor the year ended 31 December 2012 (In US Dollars)
EXPENDITURE REPORT FUNDING REPORT
W1 + W2 Funds
Window 3
& Bilateral Centre Funds
Total INCOME YEAR 1 TOTAL
Personnel Costs 467,166 80,883 100,994 649,043 OP. BALANCE - -
Collaborators/Partnership Costs - CG Centers
- - - - CRP2 W1+W2 funds 712,033 712,033
Collaborators/Partnership Costs - Others 10,409 - - 10,409 TOTAL 712,033 712,033
Supplies and Services 25,609 3,138 43,053 71,800
Operational Travel 59,117 6,980 23,242 89,339
Depreciation - - 3,266 3,266 EXPENDITURE TOTAL
Subtotal 562,301 91,001 170,555 823,857 CRP2 W1+W2 Expenses
646,646 646,646
Institutional Overhead (% of direct cost) 84,345 13,650 - 97,995 TOTAL EXPENDITURE 646,646 646,646
TOTAL 646,646 104,651 170,555 921,852 BALANCE 65,387 65,387

Exhibits 97
CGIAR RESEARCH PROGRAM 4: AGRICULTURE FOR NUTRITION AND HEALTHFor the year ended 31 December 2012 (In US Dollars) Exhibit 5
EXPENDITURE REPORT FUNDING REPORT
W1 + W2 Funds
Window 3
& Bilateral Centre Funds
Total INCOME YEAR 1 TOTAL
Personnel 99,799 75,000 19,961 194,760 OP. BALANCE - -
Collaborators/Partnership Costs - CG Centers
- - - - CRP4 W1+W2 funds 224,400 224,400
Collaborators/Partnership Costs - Others - - - - - -
Supplies and services 81,035 36,000 - 117,035 TOTAL 224,400 224,400
Operational travel 42,502 27,000 - 69,502
Depreciation 1,559 29,000 - 30,559 EXPENDITURE TOTAL
Contingency (only for budgeting purposes) - - - - CRP4 W1+W2 Expenses
258,629 258,629
Subtotal 224,895 167,000 19,961 411,856
Institutional Overhead (15% of direct cost) 33,734 25,050 - 58,784 TOTAL EXPENDITURE 258,629 258,629
TOTAL 258,629 192,050 19,961 470,640 BALANCE (34,229) (34,229)
CGIAR RESEARCH PROGRAM 5: WATER, LAND AND ECOSYSTEMS For the year ended 31 December 2012 (In US Dollars)
EXPENDITURE REPORT FUNDING REPORT
W1 + W2 Funds
Window 3
& Bilateral Centre Funds
Total INCOME YEAR 1 TOTAL
Personnel 709,353 599,222 81,982 1,390,557 OP. BALANCE - -
Collaborators/Partnership Costs - CG Centers
- - - - CRP5 W1+W2 funds 886,485 886,485
Collaborators/Partnership Costs - Others 103,196 40,972 - 144,168 SRP5 Leadership - -
Supplies and services 310,268 478,328 19,727 808,323 TOTAL 886,485 886,485
Operational travel 52,727 93,884 25,710 172,321
Depreciation 120,108 86,778 - 206,886 EXPENDITURE TOTAL
Contingency (only for budgeting purposes) - - - - CRP5 W1+W2 Expenses
1,440,001 1,440,001
Subtotal 1,295,652 1,299,184 127,419 2,722,255 SRP5 Leadership 49,999 49,999
Institutional Overhead (15% of direct cost) 194,348 224,014 - 418,362 TOTAL EXPENDITURE 1,490,000 1,490,000
TOTAL 1,490,000 1,523,198 127,419 3,140,617 BALANCE (603,515) (603,515)

98 World Agroforestry Centre
CGIAR RESEARCH PROGRAM 6: FORESTS, TREES AND AGROFORESTRYFor the year ended 31 December 2012 (In US Dollars) Exhibit 5
EXPENDITURE REPORT FUNDING REPORT
W1 + W2 Funds
Window 3 & Bilateral
Centre Funds
Total INCOME YEAR 2 TOTAL
Personnel Costs 4,867,824 6,948,424 1,390,516 13,206,764 OP. BALANCE (576,125) (576,125)
Collaborators/Partnership Costs - CG Centers
- - - -
Collaborators/Partnership Costs - Others 526,148 2,994,398 4,396 3,524,942 CRP6 W1+W2 funds 8,793,566 8,793,566
Supplies and Services 1,137,192 2,637,539 558,973 4,333,704 CRP6 Cross Cutting Funds
489,265 489,265
Travel 888,555 2,716,714 156,889 3,762,158 TOTAL 8,706,706 8,706,706
Communication and Publications 57,863 - - 57,863
Capital and other equipment 219,670 1,150,832 7,193 1,377,695 EXPENDITURE TOTAL
Research Support Costs 1,802,038 466,655 5,830 2,274,523 CRP6 W1+W2 Expenses
9,786,809 9,786,809
Subtotal 9,499,290 16,914,562 2,123,797 28,537,649 CRP6 Cross Cutting Expenses
1,137,374 1,137,374
Institutional Overhead (15% of direct cost) 1,424,893 2,823,634 - 4,248,527 TOTAL EXPENDITURE 10,924,183 10,924,183
TOTAL 10,924,183 19,738,196 2,123,797 32,786,176 BALANCE (2,217,477) (2,217,477)

Exhibits 99
CGIAR RESEARCH PROGRAM 7: CLIMATE CHANGE, AGRICULTURE AND FOOD SECURITYFor the year ended 31 December 2012 (In US Dollars) Exhibit 5
EXPENDITURE REPORT FUNDING REPORT
Categories Funding Sources INCOME YEAR 2 TOTAL
W1 + W2 Funds
Window 3 & Bilateral
Centre Funds
Total US$ US$
Personnel 1,280,116 465,782 35,327 1,781,225 OPENING BALANCE (179,163) (179,163)
Collaborators/Partnership Costs - CG Centers
356,594 92,806 - 449,400 CRP7 W1+W2 FUNDS 3,930,881 3,930,881
Collaborators/Partnership Costs - Others 1,417,833 880,378 - 2,298,211 Other Funds -
Supplies and services 1,151,700 745,623 1,249 1,898,572 TOTAL AVAILABLE 3,751,718 3,751,718
Operational travel 449,326 358,191 - 807,517
Depreciation 264,281 13,455 715 278,451 EXPENSES TOTAL
Contingency (only for budgeting purposes) - - - CRP7 W1+W2 Expenses
5,318,499 5,318,499
Subtotal 4,919,850 2,556,235 37,291 7,513,376 Other Expenses 339,328 339,328
Institutional Overhead (15% of direct cost) 737,977 353,909 - 1,091,886 TOTAL EXPENDITURE 5,657,827 5,657,827
TOTAL 5,657,827 2,910,144 37,291 8,605,262 BALANCE (1,906,109) (1,906,109)

100 World Agroforestry Centre
NOTES
The Centre 101
NOTES
United Nations Avenue, Gigiri, P.O Box 30677-00100 Nairobi, Kenya
Phone: + (254) 20 722 4000, Fax: + (254) 20 722 4001
Via USA phone: (1-650) 833-6645, Fax: (1-650) 833-6646, Email: [email protected]
www.worldagroforestry.org


