NCSL’s Legislative Conference Transforming Medicaid Lessons from Pioneering States Deborah Bachrach August 20, 2014 1 Drivers of Reform 2 Health Care Cost Growth 0 500 1000 1500 2000 2500 3000 1960 1970 1980 1990 2000 2001 2002 2003 2004 2005 2006 2007 2008 2009 2010 2011 2012 National Health Expenditures (in billions) National Health Expenditures from 1960-2012 Source: Centers for Medicare & Medicaid Services, Office of the Actuary, National Health Statistics Group; U.S. Department of Commerce, Bureau of Economic Analysis; and U.S. Bureau of the Census, http://www.cms.gov/Research-Statistics-Data-and-Systems/Statistics-Trends- and-Reports/NationalHealthExpendData/Downloads/tables.pdf In fiscal 2011, before implementation of the ACA’s Medicaid expansion, Medicaid comprised over 23 percent of total state expenditures.
Transcript
NCSL’s Legislative Conference
Transforming Medicaid Lessons from Pioneering States
Deborah Bachrach
August 20, 2014
1
Drivers of Reform
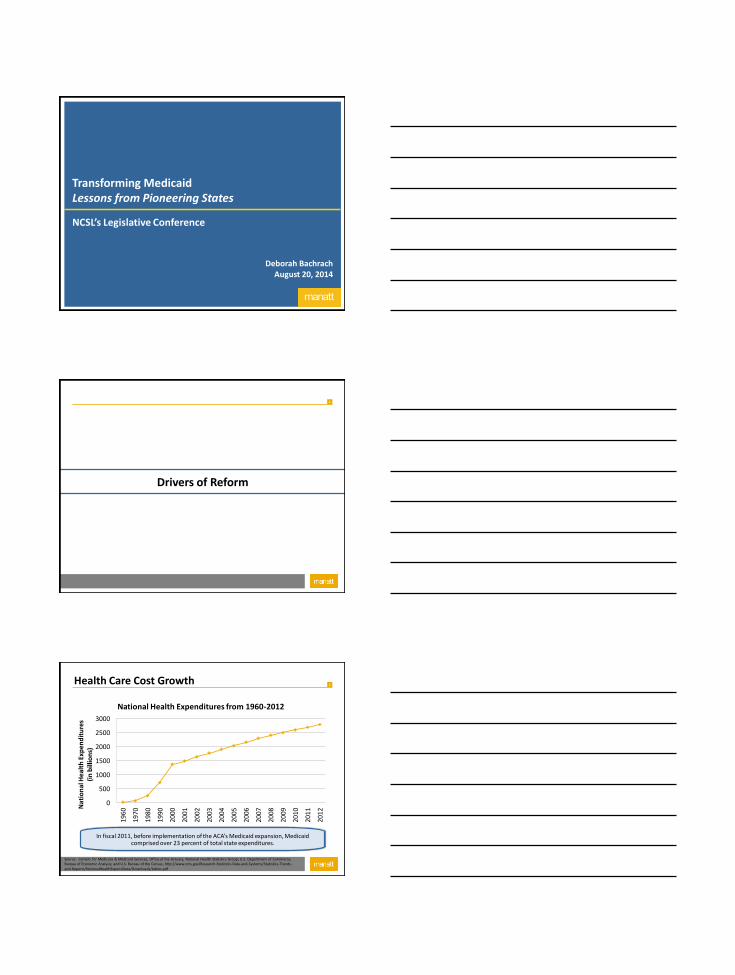
2 Health Care Cost Growth
0
500
1000
1500
2000
2500
3000
196
0
197
0
198
0
199
0
200
0
200
1
200
2
200
3
200
4
200
5
200
6
200
7
200
8
200
9
201
0
201
1
201
2 Nat
ion
al H
ealt
h E
xpen
dit
ure
s
(in
bill
ion
s)
National Health Expenditures from 1960-2012
Source: Centers for Medicare & Medicaid Services, Office of the Actuary, National Health Statistics Group; U.S. Department of Commerce, Bureau of Economic Analysis; and U.S. Bureau of the Census, http://www.cms.gov/Research-Statistics-Data-and-Systems/Statistics-Trends-and-Reports/NationalHealthExpendData/Downloads/tables.pdf
In fiscal 2011, before implementation of the ACA’s Medicaid expansion, Medicaid comprised over 23 percent of total state expenditures.
3
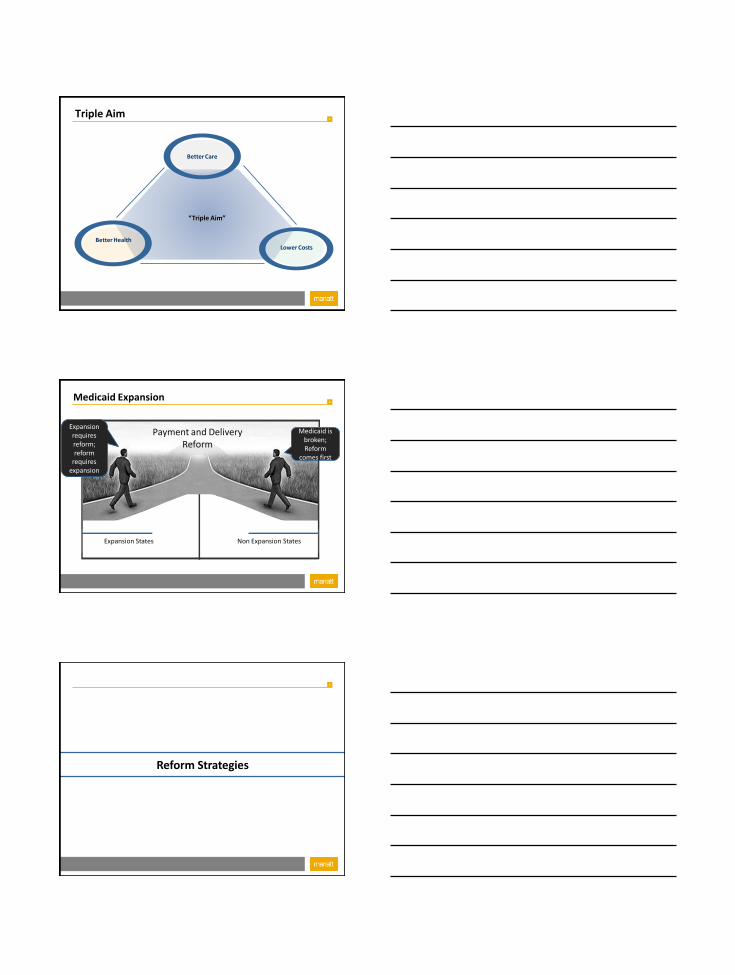
“Triple Aim”
Better Care
Better Health Lower Costs
Triple Aim
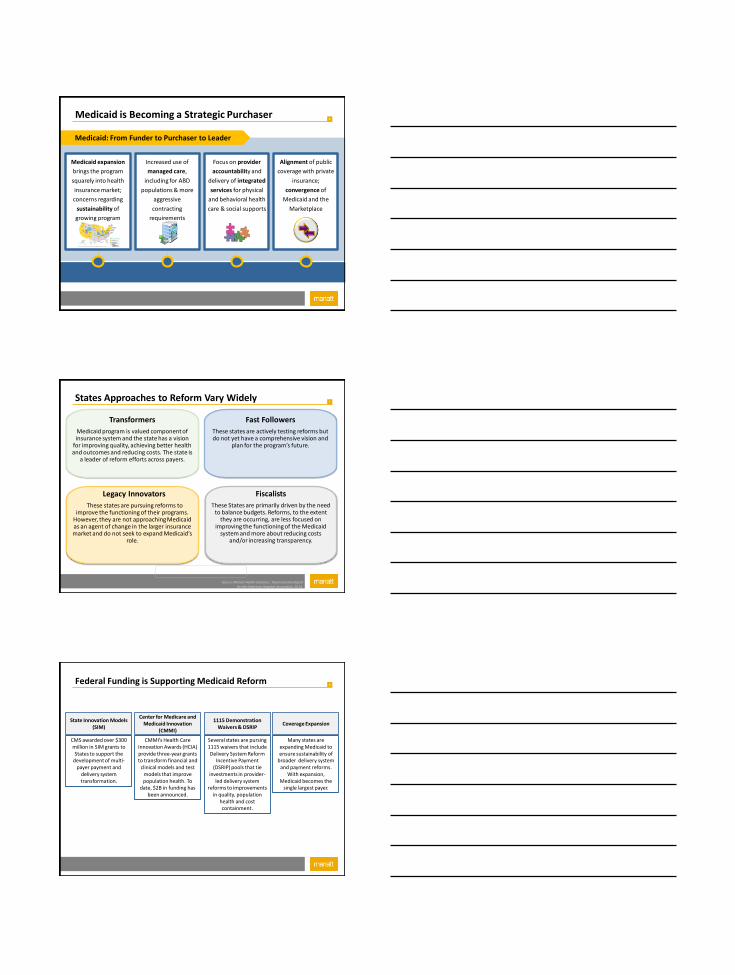
4 Medicaid Expansion
Medicaid is broken; Reform
comes first
Payment and Delivery Reform
Expansion States Non Expansion States
Expansion requires reform; reform
requires expansion
5
Reform Strategies
6 Medicaid is Becoming a Strategic Purchaser
Medicaid expansion
brings the program
squarely into health
insurance market;
concerns regarding
sustainability of
growing program
surface
Medicaid: From Funder to Purchaser to Leader
Increased use of
managed care,
including for ABD
populations & more
aggressive
contracting
requirements
Focus on provider
accountability and
delivery of integrated
services for physical
and behavioral health
care & social supports
Alignment of public
coverage with private
insurance;
convergence of
Medicaid and the
Marketplace
7
Fast Followers
These states are actively testing reforms but do not yet have a comprehensive vision and
plan for the program’s future.
Legacy Innovators
These states are pursuing reforms to improve the functioning of their programs.
However, they are not approaching Medicaid as an agent of change in the larger insurance market and do not seek to expand Medicaid’s
role.
Fiscalists
These States are primarily driven by the need to balance budgets. Reforms, to the extent
they are occurring, are less focused on improving the functioning of the Medicaid
system and more about reducing costs and/or increasing transparency.
Transformers
Medicaid program is valued component of insurance system and the state has a vision
for improving quality, achieving better health and outcomes and reducing costs. The state is
a leader of reform efforts across payers.
States Approaches to Reform Vary Widely
Source: Manatt Health Solutions. Taxonomy Developed for the American Hospital Association, 2014.
8
CMMI’s Health Care Innovation Awards (HCIA) provide three-year grants to transform financial and
clinical models and test models that improve population health. To
date, $2B in funding has been announced.
CMS awarded over $300 million in SIM grants to States to support the
development of multi-payer payment and
delivery system transformation.
State Innovation Models (SIM)
Center for Medicare and Medicaid Innovation
(CMMI)
Several states are pursing 1115 waivers that include Delivery System Reform
Incentive Payment (DSRIP) pools that tie
investments in provider-led delivery system
reforms to improvements in quality, population
health and cost containment.
1115 Demonstration Waivers & DSRIP
Many states are expanding Medicaid to ensure sustainability of
broader delivery system and payment reforms.
With expansion, Medicaid becomes the
single largest payer.
Coverage Expansion
Federal Funding is Supporting Medicaid Reform
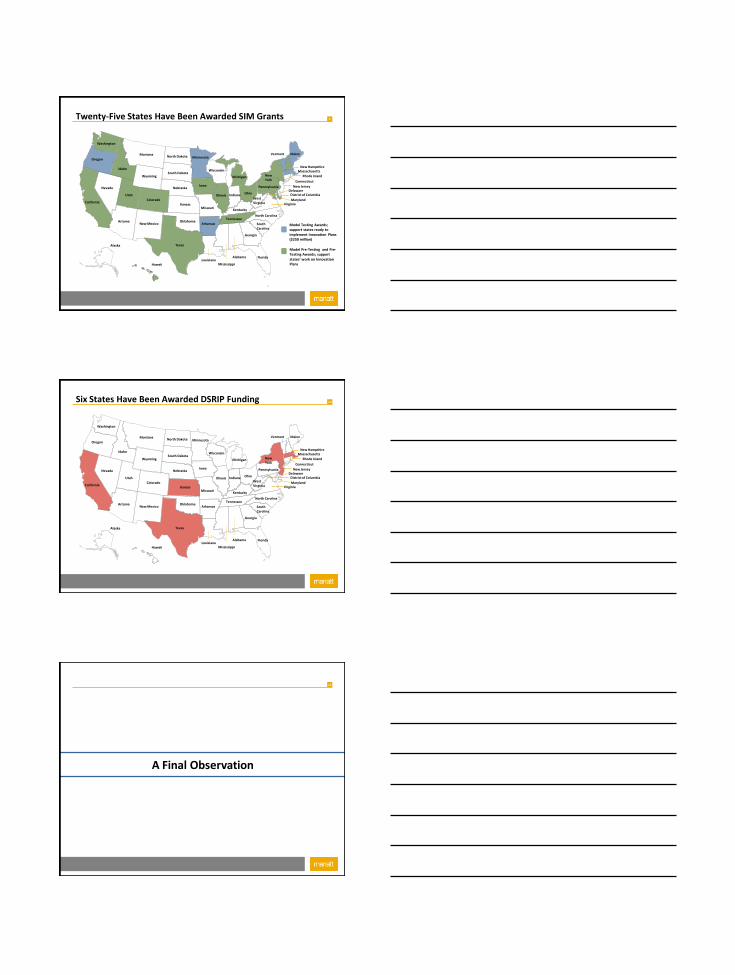
9 Twenty-Five States Have Been Awarded SIM Grants
Alaska
Hawaii
Michigan
California
Nevada
Oregon
Arizona
Utah
Idaho
Montana
Wyoming
Colorado
New Mexico
Nebraska
Maine Vermont
New York
North Carolina
Georgia
South Carolina
Florida Alabama
Mississippi Louisiana
Texas
Pennsylvania
Wisconsin
Minnesota North Dakota
Ohio
West Virginia
South Dakota
Arkansas
Missouri
Iowa
Illinois Indiana
Tennessee
Kentucky
Delaware New Jersey
Connecticut
Massachusetts New Hampshire
Virginia Maryland
Rhode Island
District of Columbia
Kansas
Oklahoma Model Testing Awards; support states ready to implement Innovation Plans ($250 million)
Model Pre-Testing and Pre-Testing Awards; support states’ work on Innovation Plans
Washington
10 Six States Have Been Awarded DSRIP Funding
Alaska
Hawaii
Michigan
California
Nevada
Oregon
Arizona
Utah
Idaho
Montana
Wyoming
Colorado
New Mexico
Nebraska
Maine Vermont
New York
North Carolina
Georgia
South Carolina
Florida Alabama
Mississippi Louisiana
Texas
Pennsylvania
Wisconsin
Minnesota North Dakota
Ohio
West Virginia
South Dakota
Arkansas
Missouri
Iowa
Illinois Indiana
Tennessee
Kentucky
Delaware New Jersey
Connecticut
Massachusetts New Hampshire
Virginia Maryland
Rhode Island
District of Columbia
Kansas
Oklahoma
Washington
11
A Final Observation
12
From Medicaid to All-Payer Reform Attributes of Successful State Transformation Initiatives