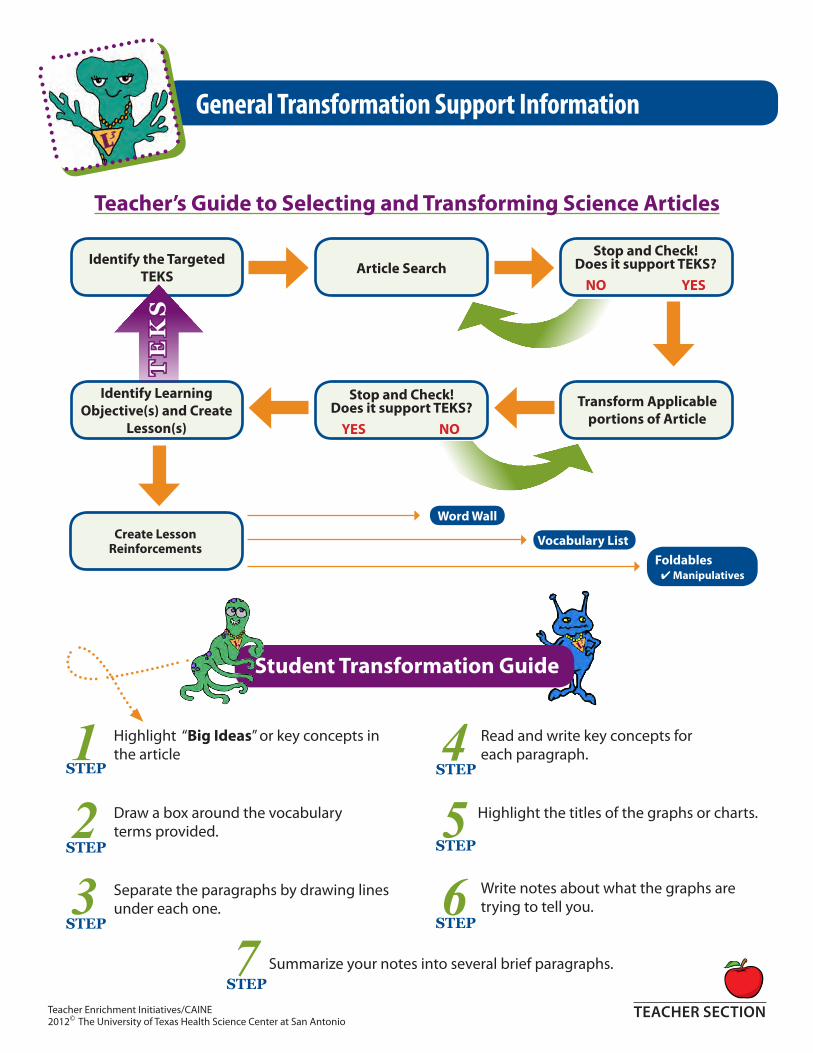
Transforming Science for Critical Thinkers The Transformation of a Peer-Reviewed Article Activity Description: How often do we hear “Research says…”? To develop critical thinking skills, students need to ask “Does it really?” At the heart of every Transforming Science for Critical Thinkers unit is a transformed peer-reviewed journal article. The transformed article uses plain language to convey the science content of the original article and maintains the outcomes of the original research. Transformation activities provide opportunities to increase student engagement with science literacy. Specific lesson objectives may change to address content specific to the article, but key objectives of all Transforming Science for Critical Thinkers units will include: Analyze, evaluate, and critique scientific explanations found while engaging in science literacy activity. Using empirical evidence and logic to examine scientific evidence. Identifying limitations and advantages of scientific research. Comparing and contrasting information from transformed peer-reviewed articles with that of media articles Users Guide: Each unit includes four sets of activities providing opportunities to apply critical thinking skills. o Thinking About the Study o The Results o Analyzing the Results o Comparing and Contrasting Each activity is designed for a specific peer-reviewed article. Each unit contains complete Teacher Materials, including answer keys and helpful background information. Each unit contains all information and student material needed to complete the activities. The activities can be modified to meet specific objectives and are designed to be used in multiple ways (individual or group activities; complete some or all unit activities)
Transcript
Transforming Science for Critical Thinkers The Transformation of a Peer-Reviewed Article
Activity Description: How often do we hear “Research says…”? To develop critical thinking skills, students need to ask “Does it really?” At the heart of every Transforming Science for Critical Thinkers unit is a transformed peer-reviewed journal article. The transformed article uses plain language to convey the science content of the original article and maintains the outcomes of the original research. Transformation activities provide opportunities to increase student engagement with science literacy. Specific lesson objectives may change to address content specific to the article, but key objectives of all Transforming Science for Critical Thinkers units will include:
Analyze, evaluate, and critique scientific explanations found while engaging in science literacy activity.
Using empirical evidence and logic to examine scientific evidence.
Identifying limitations and advantages of scientific research.
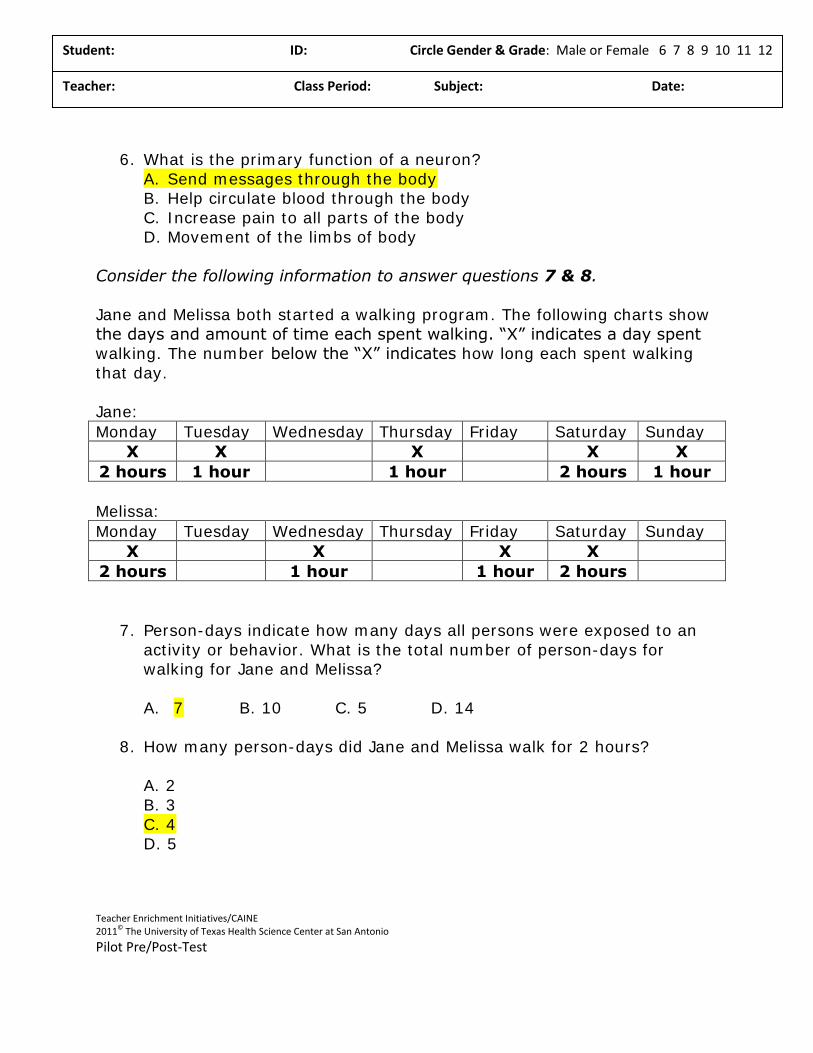
Comparing and contrasting information from transformed peer-reviewed articles with that of media articles
Users Guide:
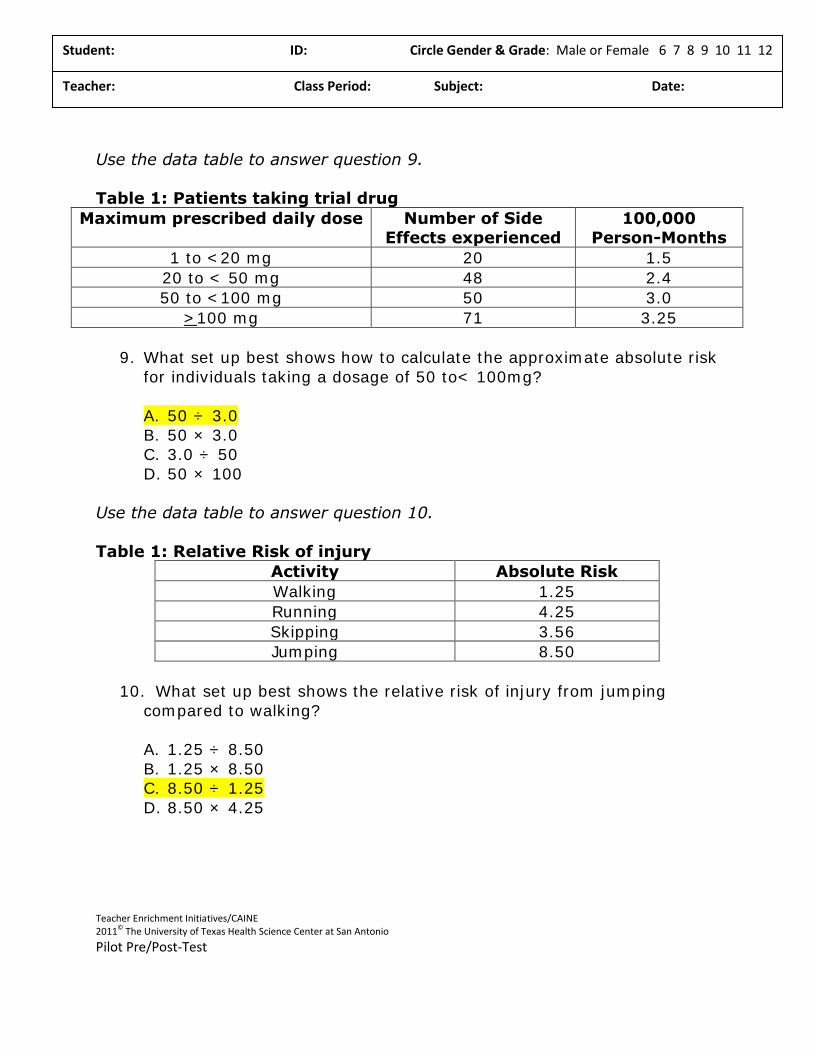
Each unit includes four sets of activities providing opportunities to apply critical thinking skills.
o Thinking About the Study o The Results o Analyzing the Results o Comparing and Contrasting
Each activity is designed for a specific peer-reviewed article.
Each unit contains complete Teacher Materials, including answer keys and helpful background information.
Each unit contains all information and student material needed to complete the activities.
The activities can be modified to meet specific objectives and are designed to be used in multiple ways (individual or group activities; complete some or all unit activities)
Transforming Science for Critical Thinkers Peer-Reviewed Article:
“Association between Opioid Prescribing Patterns and Overdose-Related Deaths” *although the article deals with opioid related deaths, the actual lessons focus on analyzing and interpreting data,
manipulation of data using calculations, and evaluating conclusions.
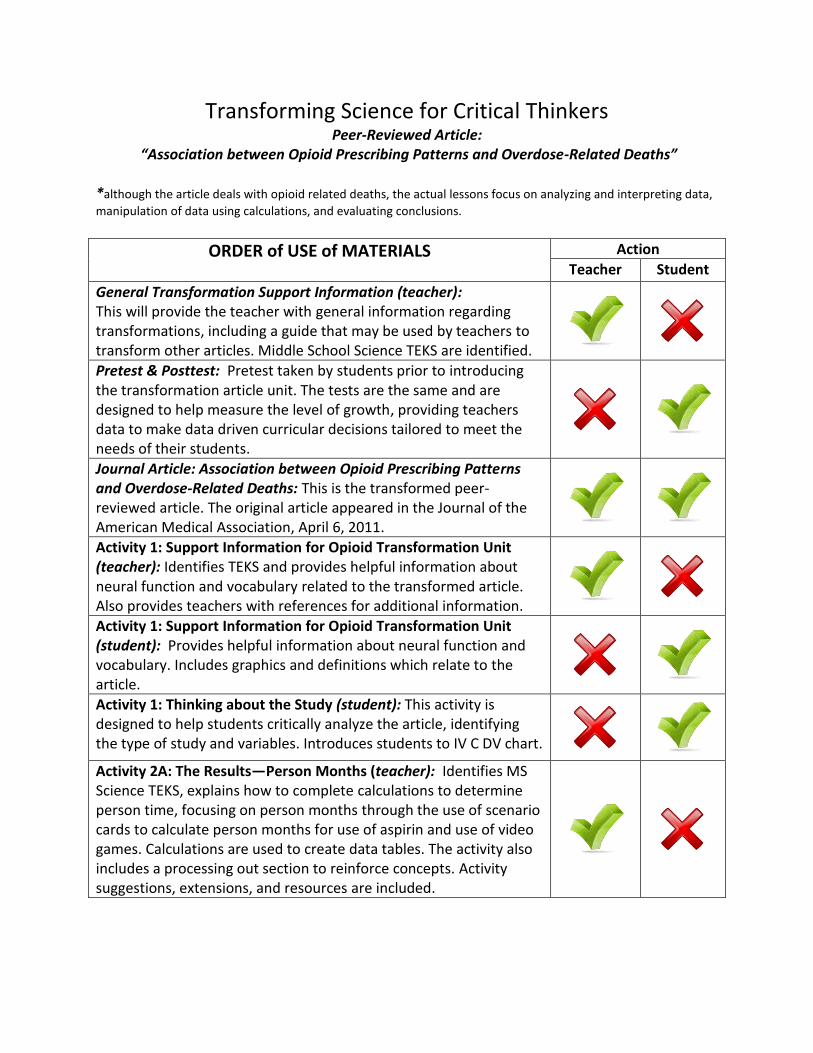
ORDER of USE of MATERIALS
Action
Teacher Student
General Transformation Support Information (teacher): This will provide the teacher with general information regarding transformations, including a guide that may be used by teachers to transform other articles. Middle School Science TEKS are identified.
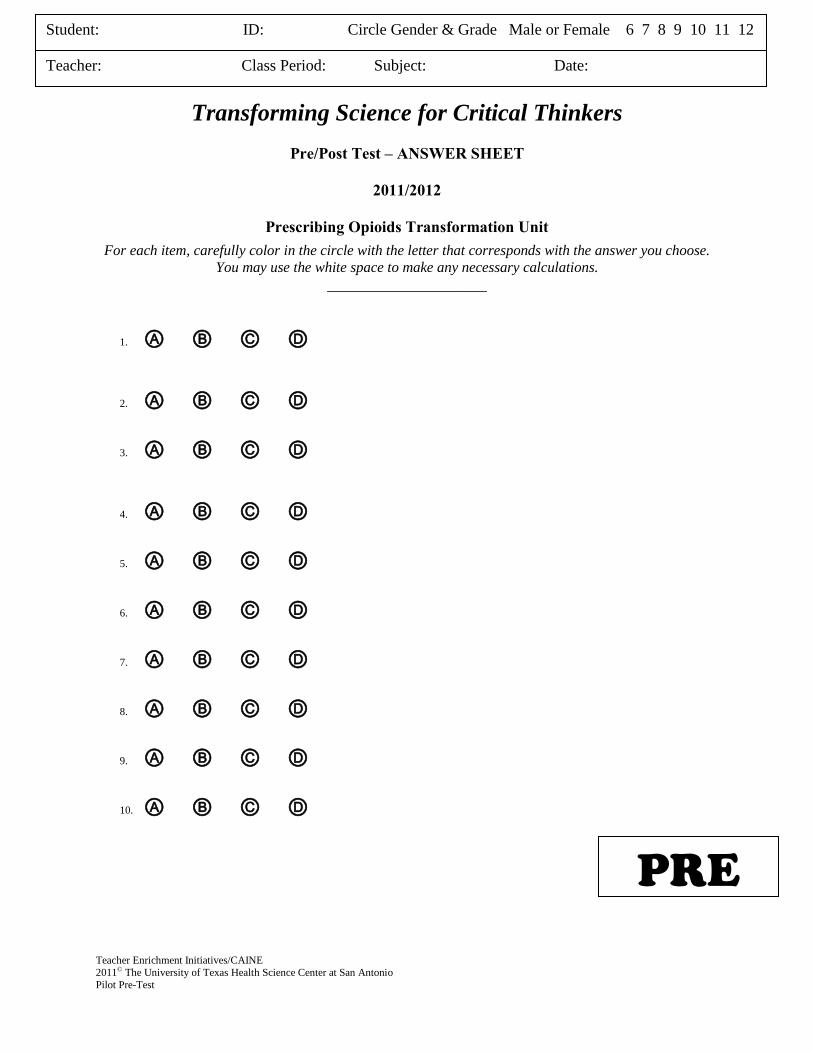
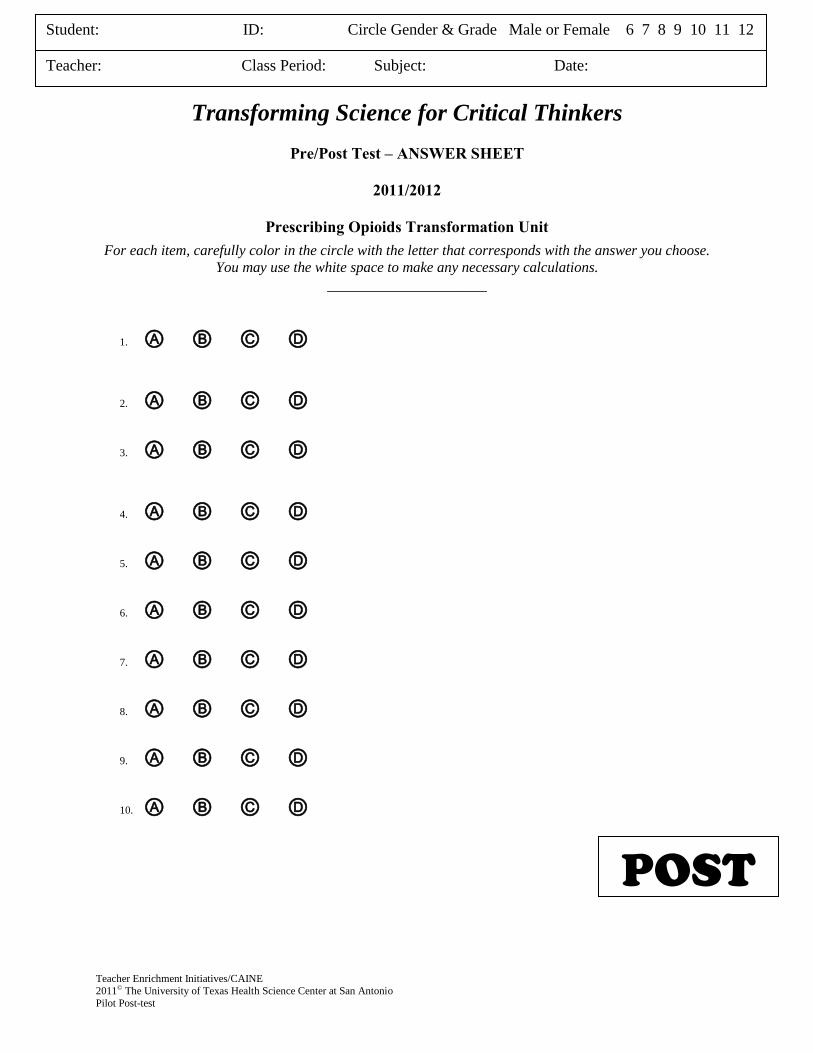
Pretest & Posttest: Pretest taken by students prior to introducing the transformation article unit. The tests are the same and are designed to help measure the level of growth, providing teachers data to make data driven curricular decisions tailored to meet the needs of their students.
Journal Article: Association between Opioid Prescribing Patterns and Overdose-Related Deaths: This is the transformed peer-reviewed article. The original article appeared in the Journal of the American Medical Association, April 6, 2011.
Activity 1: Support Information for Opioid Transformation Unit (teacher): Identifies TEKS and provides helpful information about neural function and vocabulary related to the transformed article. Also provides teachers with references for additional information.
Activity 1: Support Information for Opioid Transformation Unit (student): Provides helpful information about neural function and vocabulary. Includes graphics and definitions which relate to the article.
Activity 1: Thinking about the Study (student): This activity is designed to help students critically analyze the article, identifying the type of study and variables. Introduces students to IV C DV chart.
Activity 2A: The Results—Person Months (teacher): Identifies MS Science TEKS, explains how to complete calculations to determine person time, focusing on person months through the use of scenario cards to calculate person months for use of aspirin and use of video games. Calculations are used to create data tables. The activity also includes a processing out section to reinforce concepts. Activity suggestions, extensions, and resources are included.
ORDER of USE of MATERIALS
Action
Teacher Student
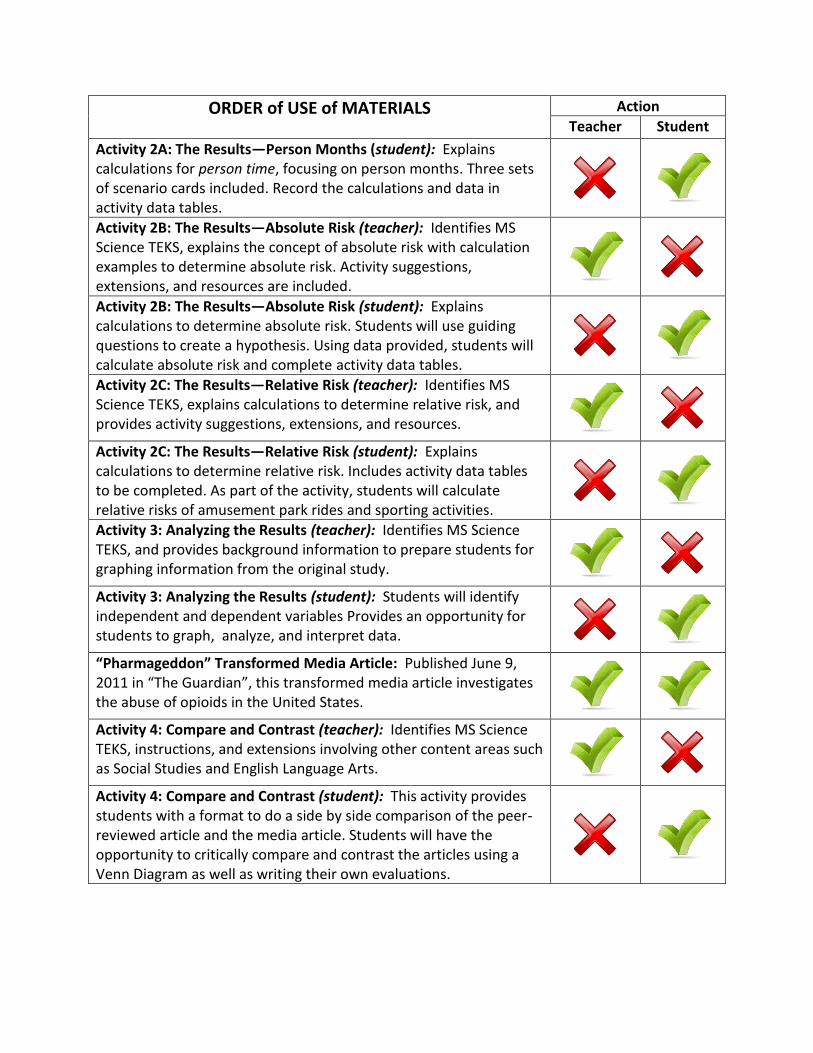
Activity 2A: The Results—Person Months (student): Explains calculations for person time, focusing on person months. Three sets of scenario cards included. Record the calculations and data in activity data tables.
Activity 2B: The Results—Absolute Risk (teacher): Identifies MS Science TEKS, explains the concept of absolute risk with calculation examples to determine absolute risk. Activity suggestions, extensions, and resources are included.
Activity 2B: The Results—Absolute Risk (student): Explains calculations to determine absolute risk. Students will use guiding questions to create a hypothesis. Using data provided, students will calculate absolute risk and complete activity data tables.
Activity 2C: The Results—Relative Risk (teacher): Identifies MS Science TEKS, explains calculations to determine relative risk, and provides activity suggestions, extensions, and resources.
Activity 2C: The Results—Relative Risk (student): Explains calculations to determine relative risk. Includes activity data tables to be completed. As part of the activity, students will calculate relative risks of amusement park rides and sporting activities.
Activity 3: Analyzing the Results (teacher): Identifies MS Science TEKS, and provides background information to prepare students for graphing information from the original study.
Activity 3: Analyzing the Results (student): Students will identify independent and dependent variables Provides an opportunity for students to graph, analyze, and interpret data.
“Pharmageddon” Transformed Media Article: Published June 9, 2011 in “The Guardian”, this transformed media article investigates the abuse of opioids in the United States.
Activity 4: Compare and Contrast (teacher): Identifies MS Science TEKS, instructions, and extensions involving other content areas such as Social Studies and English Language Arts.
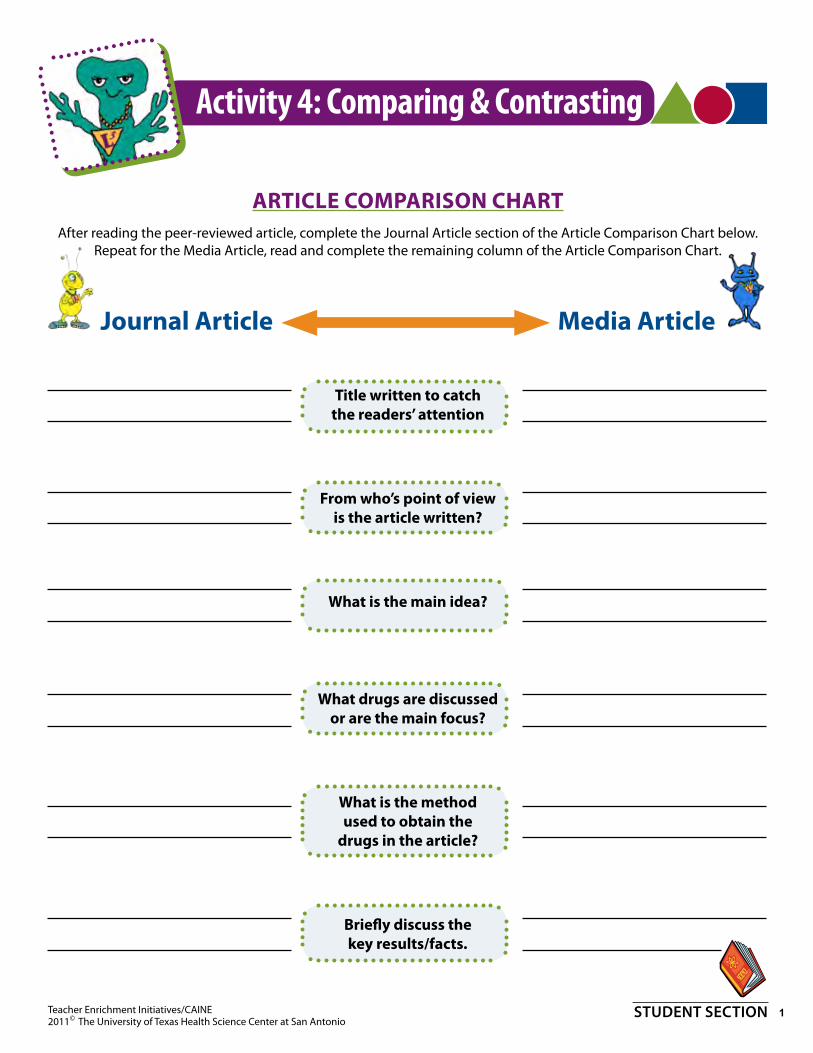
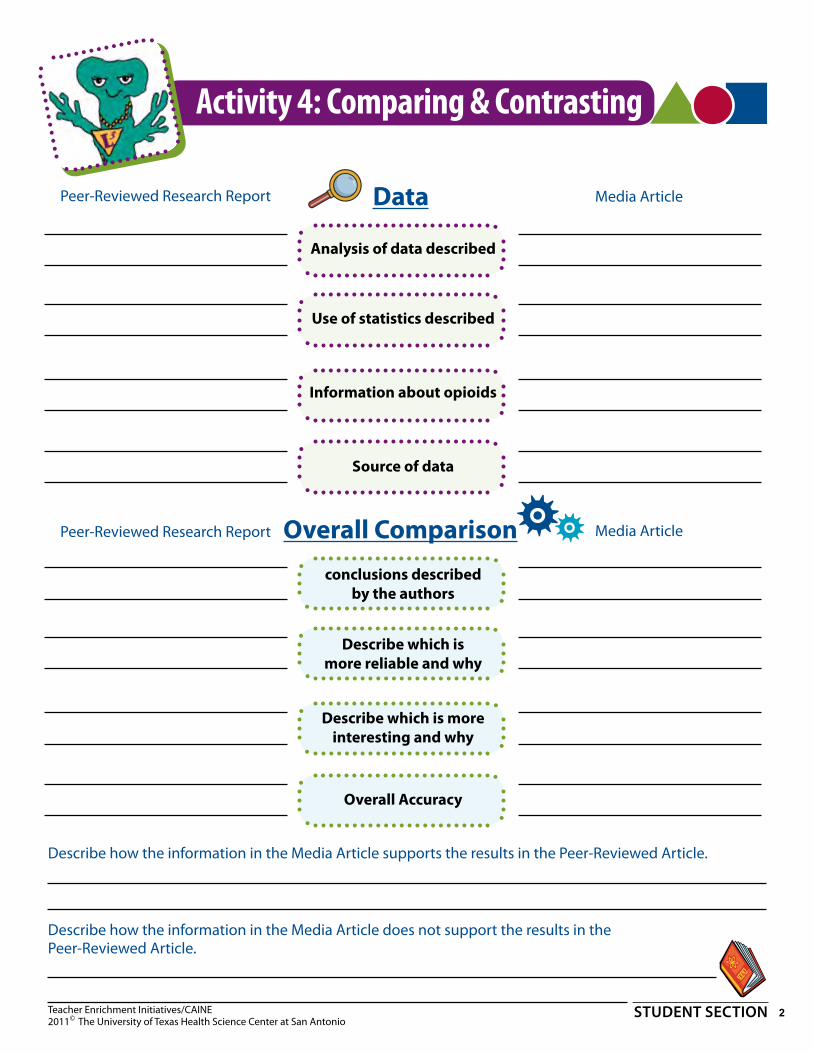
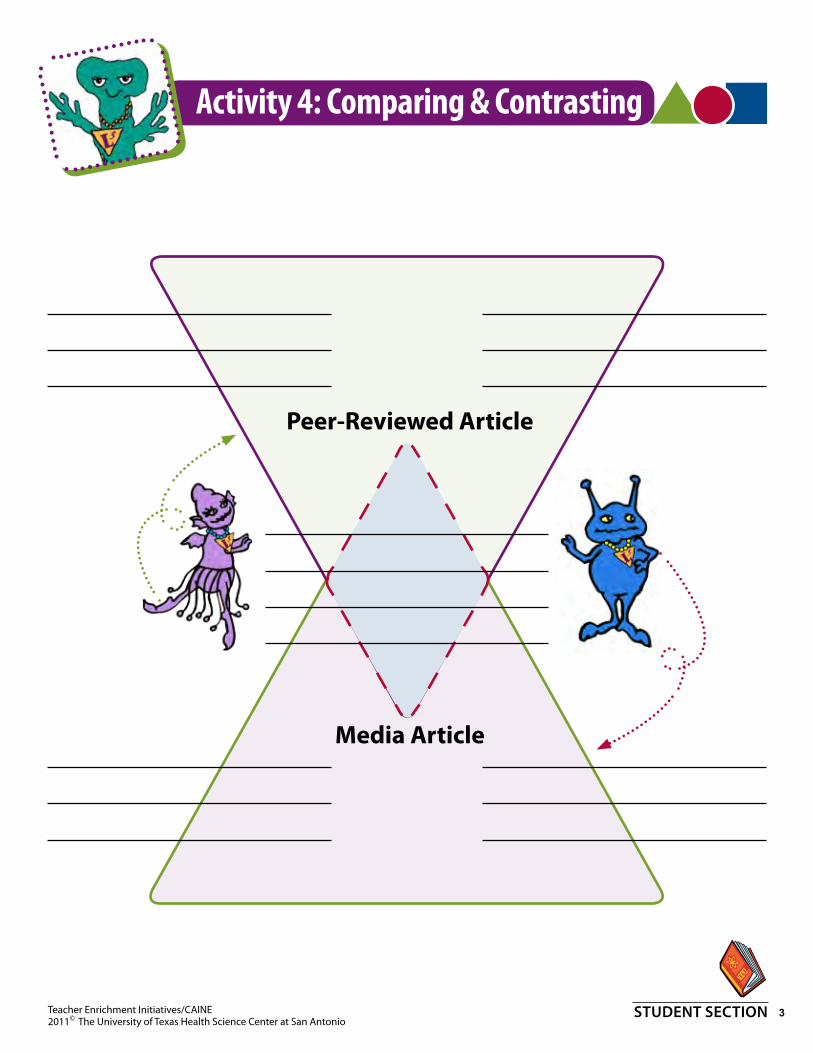
Activity 4: Compare and Contrast (student): This activity provides students with a format to do a side by side comparison of the peer-reviewed article and the media article. Students will have the opportunity to critically compare and contrast the articles using a Venn Diagram as well as writing their own evaluations.
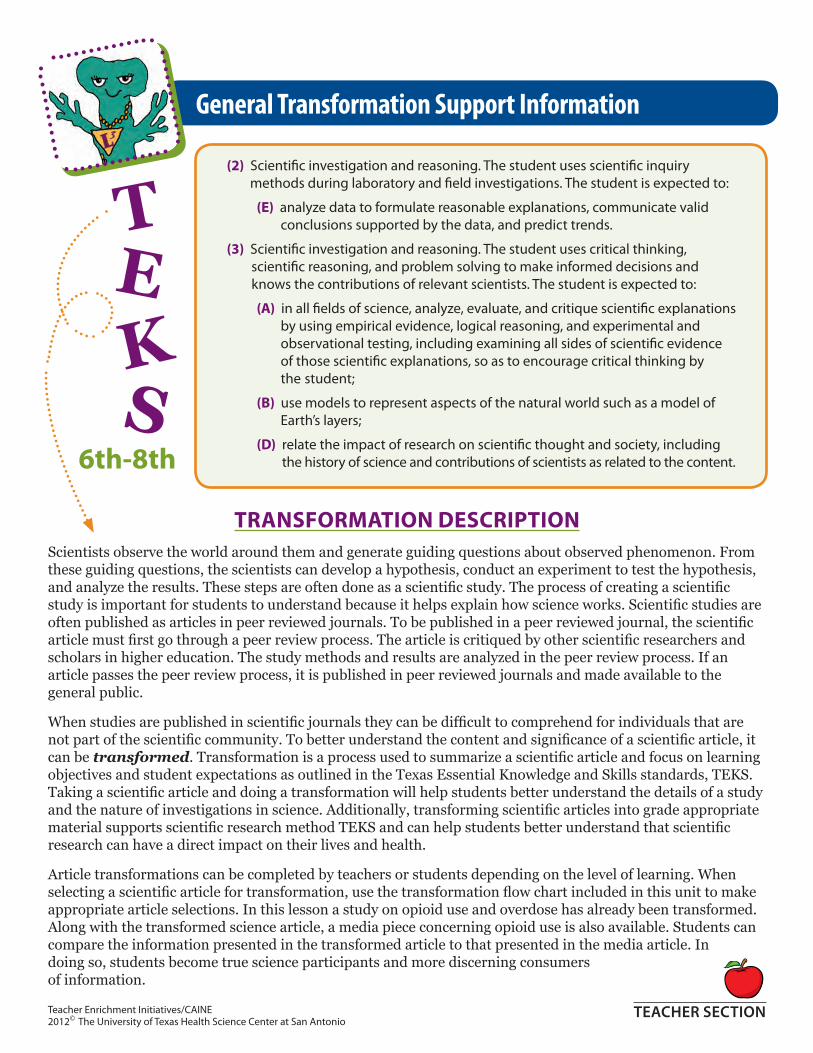
(2) Scientific investigation and reasoning. The student uses scientific inquiry methods during laboratory and field investigations. The student is expected to:
(E) analyze data to formulate reasonable explanations, communicate valid conclusions supported by the data, and predict trends.
(3) Scientific investigation and reasoning. The student uses critical thinking, scientific reasoning, and problem solving to make informed decisions and knows the contributions of relevant scientists. The student is expected to:
(A) in all fields of science, analyze, evaluate, and critique scientific explanations by using empirical evidence, logical reasoning, and experimental and observational testing, including examining all sides of scientific evidence of those scientific explanations, so as to encourage critical thinking by the student;
(B) use models to represent aspects of the natural world such as a model of Earth’s layers;
(D) relate the impact of research on scientific thought and society, including the history of science and contributions of scientists as related to the content.6th-8th
TRANSFORMATION DESCRIPTIONScientists observe the world around them and generate guiding questions about observed phenomenon. From these guiding questions, the scientists can develop a hypothesis, conduct an experiment to test the hypothesis, and analyze the results. These steps are often done as a scientific study. The process of creating a scientific study is important for students to understand because it helps explain how science works. Scientific studies are often published as articles in peer reviewed journals. To be published in a peer reviewed journal, the scientific article must first go through a peer review process. The article is critiqued by other scientific researchers and scholars in higher education. The study methods and results are analyzed in the peer review process. If an article passes the peer review process, it is published in peer reviewed journals and made available to the general public.
When studies are published in scientific journals they can be difficult to comprehend for individuals that are not part of the scientific community. To better understand the content and significance of a scientific article, it can be transformed. Transformation is a process used to summarize a scientific article and focus on learning objectives and student expectations as outlined in the Texas Essential Knowledge and Skills standards, TEKS. Taking a scientific article and doing a transformation will help students better understand the details of a study and the nature of investigations in science. Additionally, transforming scientific articles into grade appropriate material supports scientific research method TEKS and can help students better understand that scientific research can have a direct impact on their lives and health.
Article transformations can be completed by teachers or students depending on the level of learning. When selecting a scientific article for transformation, use the transformation flow chart included in this unit to make appropriate article selections. In this lesson a study on opioid use and overdose has already been transformed. Along with the transformed science article, a media piece concerning opioid use is also available. Students can compare the information presented in the transformed article to that presented in the media article. In doing so, students become true science participants and more discerning consumers of information.
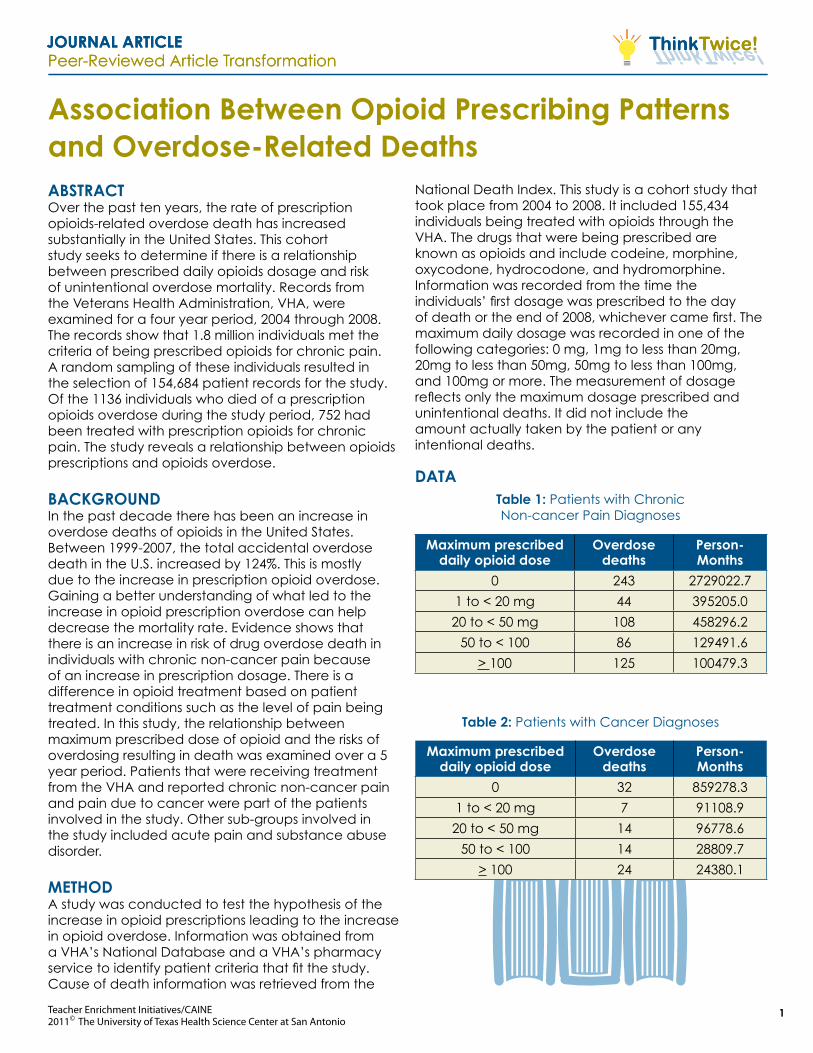
abstractOver the past ten years, the rate of prescription opioids-related overdose death has increased substantially in the United States. This cohort study seeks to determine if there is a relationship between prescribed daily opioids dosage and risk of unintentional overdose mortality. Records from the Veterans Health Administration, VHA, were examined for a four year period, 2004 through 2008. The records show that 1.8 million individuals met the criteria of being prescribed opioids for chronic pain. A random sampling of these individuals resulted in the selection of 154,684 patient records for the study. Of the 1136 individuals who died of a prescription opioids overdose during the study period, 752 had been treated with prescription opioids for chronic pain. The study reveals a relationship between opioids prescriptions and opioids overdose.
backgroundIn the past decade there has been an increase in overdose deaths of opioids in the United States. Between 1999-2007, the total accidental overdose death in the U.S. increased by 124%. This is mostly due to the increase in prescription opioid overdose. Gaining a better understanding of what led to the increase in opioid prescription overdose can help decrease the mortality rate. Evidence shows that there is an increase in risk of drug overdose death in individuals with chronic non-cancer pain because of an increase in prescription dosage. There is a difference in opioid treatment based on patient treatment conditions such as the level of pain being treated. In this study, the relationship between maximum prescribed dose of opioid and the risks of overdosing resulting in death was examined over a 5 year period. Patients that were receiving treatment from the VHA and reported chronic non-cancer pain and pain due to cancer were part of the patients involved in the study. Other sub-groups involved in the study included acute pain and substance abuse disorder.
MethodA study was conducted to test the hypothesis of the increase in opioid prescriptions leading to the increase in opioid overdose. Information was obtained from a VHA’s National Database and a VHA’s pharmacy service to identify patient criteria that fit the study. Cause of death information was retrieved from the
National Death Index. This study is a cohort study that took place from 2004 to 2008. It included 155,434 individuals being treated with opioids through the VHA. The drugs that were being prescribed are known as opioids and include codeine, morphine, oxycodone, hydrocodone, and hydromorphine. Information was recorded from the time the individuals’ first dosage was prescribed to the day of death or the end of 2008, whichever came first. The maximum daily dosage was recorded in one of the following categories: 0 mg, 1mg to less than 20mg, 20mg to less than 50mg, 50mg to less than 100mg, and 100mg or more. The measurement of dosage reflects only the maximum dosage prescribed and unintentional deaths. It did not include the amount actually taken by the patient or any intentional deaths.
datatable 1: Patients with Chronic Non-cancer Pain Diagnoses
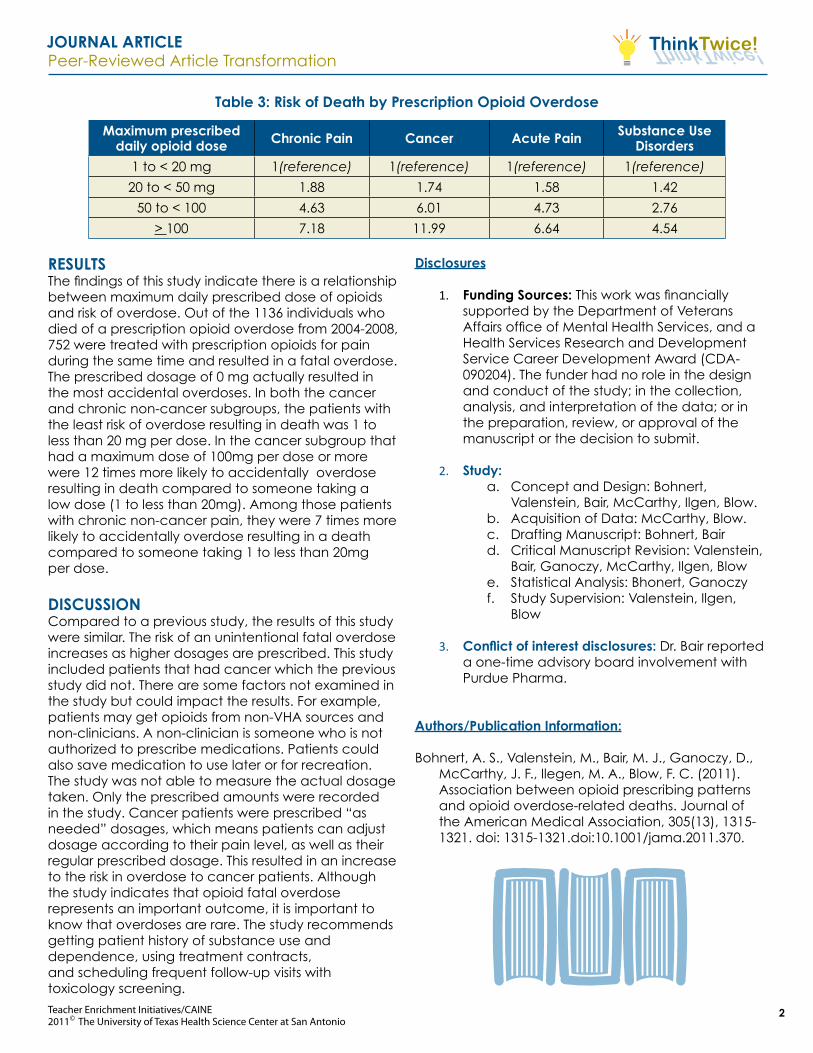
resultsThe findings of this study indicate there is a relationship between maximum daily prescribed dose of opioids and risk of overdose. Out of the 1136 individuals who died of a prescription opioid overdose from 2004-2008, 752 were treated with prescription opioids for pain during the same time and resulted in a fatal overdose. The prescribed dosage of 0 mg actually resulted in the most accidental overdoses. In both the cancer and chronic non-cancer subgroups, the patients with the least risk of overdose resulting in death was 1 to less than 20 mg per dose. In the cancer subgroup that had a maximum dose of 100mg per dose or more were 12 times more likely to accidentally overdose resulting in death compared to someone taking a low dose (1 to less than 20mg). Among those patients with chronic non-cancer pain, they were 7 times more likely to accidentally overdose resulting in a death compared to someone taking 1 to less than 20mg per dose.
discussionCompared to a previous study, the results of this study were similar. The risk of an unintentional fatal overdose increases as higher dosages are prescribed. This study included patients that had cancer which the previous study did not. There are some factors not examined in the study but could impact the results. For example, patients may get opioids from non-VHA sources and non-clinicians. A non-clinician is someone who is not authorized to prescribe medications. Patients could also save medication to use later or for recreation. The study was not able to measure the actual dosage taken. Only the prescribed amounts were recorded in the study. Cancer patients were prescribed “as needed” dosages, which means patients can adjust dosage according to their pain level, as well as their regular prescribed dosage. This resulted in an increase to the risk in overdose to cancer patients. Although the study indicates that opioid fatal overdose represents an important outcome, it is important to know that overdoses are rare. The study recommends getting patient history of substance use and dependence, using treatment contracts, and scheduling frequent follow-up visits with toxicology screening.
disclosures
1. Funding sources: This work was financially supported by the Department of Veterans Affairs office of Mental Health Services, and a Health Services Research and Development Service Career Development Award (CDA-090204). The funder had no role in the design and conduct of the study; in the collection, analysis, and interpretation of the data; or in the preparation, review, or approval of the manuscript or the decision to submit.
3. conflict of interest disclosures: Dr. Bair reported a one-time advisory board involvement with Purdue Pharma.
authors/Publication information:
Bohnert, A. S., Valenstein, M., Bair, M. J., Ganoczy, D., McCarthy, J. F., Ilegen, M. A., Blow, F. C. (2011). Association between opioid prescribing patterns and opioid overdose-related deaths. Journal of the American Medical Association, 305(13), 1315-1321. doi: 1315-1321.doi:10.1001/jama.2011.370.
table 3: risk of death by Prescription opioid overdose
Maximum prescribed daily opioid dose chronic Pain cancer acute Pain substance use
disorders
1 to < 20 mg 1(reference) 1(reference) 1(reference) 1(reference)
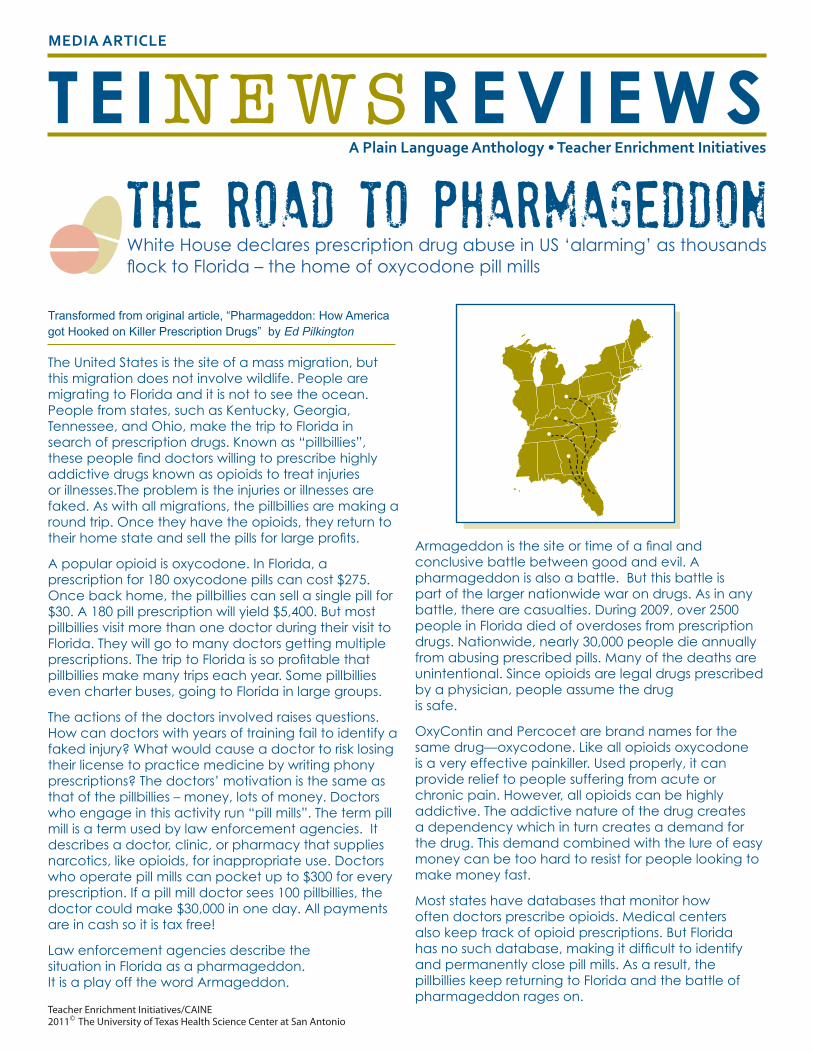
The United States is the site of a mass migration, but this migration does not involve wildlife. People are migrating to Florida and it is not to see the ocean. People from states, such as Kentucky, Georgia, Tennessee, and Ohio, make the trip to Florida in search of prescription drugs. Known as “pillbillies”, these people find doctors willing to prescribe highly addictive drugs known as opioids to treat injuries or illnesses.The problem is the injuries or illnesses are faked. As with all migrations, the pillbillies are making a round trip. Once they have the opioids, they return to their home state and sell the pills for large profits.
A popular opioid is oxycodone. In Florida, a prescription for 180 oxycodone pills can cost $275. Once back home, the pillbillies can sell a single pill for $30. A 180 pill prescription will yield $5,400. But most pillbillies visit more than one doctor during their visit to Florida. They will go to many doctors getting multiple prescriptions. The trip to Florida is so profitable that pillbillies make many trips each year. Some pillbillies even charter buses, going to Florida in large groups.
The actions of the doctors involved raises questions. How can doctors with years of training fail to identify a faked injury? What would cause a doctor to risk losing their license to practice medicine by writing phony prescriptions? The doctors’ motivation is the same as that of the pillbillies – money, lots of money. Doctors who engage in this activity run “pill mills”. The term pill mill is a term used by law enforcement agencies. It describes a doctor, clinic, or pharmacy that supplies narcotics, like opioids, for inappropriate use. Doctors who operate pill mills can pocket up to $300 for every prescription. If a pill mill doctor sees 100 pillbillies, the doctor could make $30,000 in one day. All payments are in cash so it is tax free!
Law enforcement agencies describe the situation in Florida as a pharmageddon. It is a play off the word Armageddon.
Armageddon is the site or time of a final and conclusive battle between good and evil. A pharmageddon is also a battle. But this battle is part of the larger nationwide war on drugs. As in any battle, there are casualties. During 2009, over 2500 people in Florida died of overdoses from prescription drugs. Nationwide, nearly 30,000 people die annually from abusing prescribed pills. Many of the deaths are unintentional. Since opioids are legal drugs prescribed by a physician, people assume the drug is safe.
OxyContin and Percocet are brand names for the same drug—oxycodone. Like all opioids oxycodone is a very effective painkiller. Used properly, it can provide relief to people suffering from acute or chronic pain. However, all opioids can be highly addictive. The addictive nature of the drug creates a dependency which in turn creates a demand for the drug. This demand combined with the lure of easy money can be too hard to resist for people looking to make money fast.
Most states have databases that monitor how often doctors prescribe opioids. Medical centers also keep track of opioid prescriptions. But Florida has no such database, making it difficult to identify and permanently close pill mills. As a result, the pillbillies keep returning to Florida and the battle of pharmageddon rages on.
MEDIA ARTICLE
TE INEWSREVIEWS
Transformed from original article, “Pharmageddon: How America got Hooked on Killer Prescription Drugs” by Ed Pilkington
A Plain Language Anthology • Teacher Enrichment Initiatives
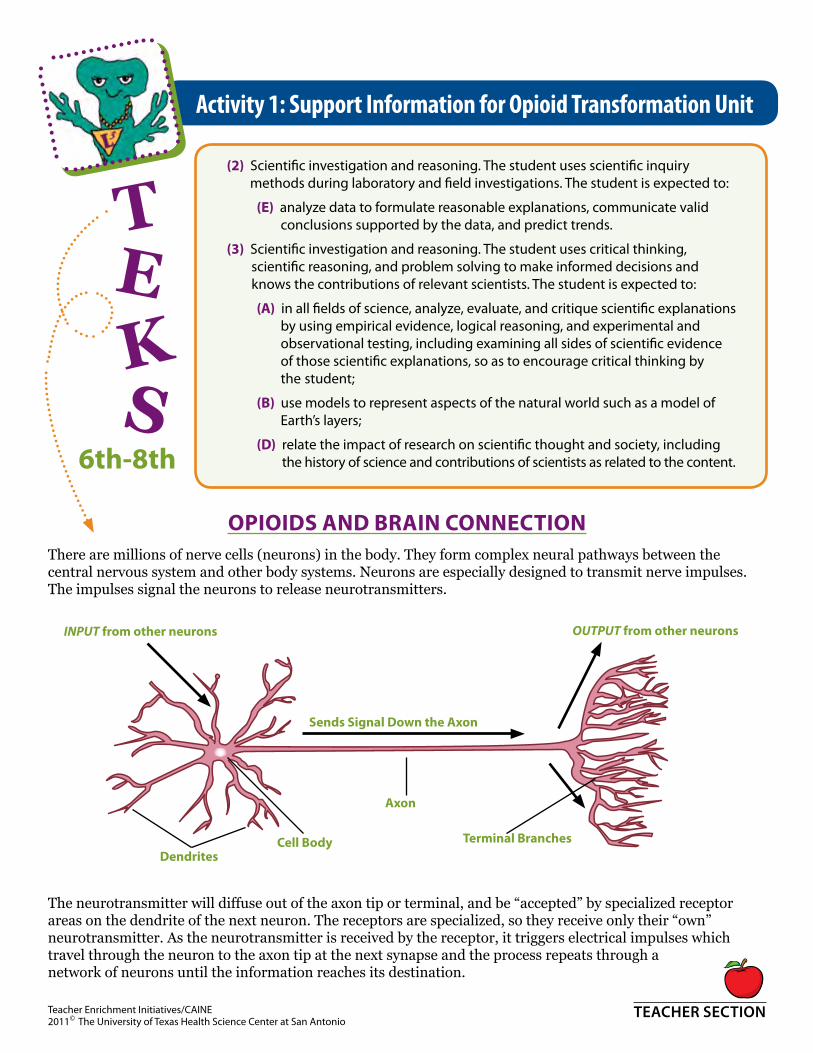
OpiOids and Brain COnneCtiOn There are millions of nerve cells (neurons) in the body. They form complex neural pathways between the central nervous system and other body systems. Neurons are especially designed to transmit nerve impulses. The impulses signal the neurons to release neurotransmitters.
The neurotransmitter will diffuse out of the axon tip or terminal, and be “accepted” by specialized receptor areas on the dendrite of the next neuron. The receptors are specialized, so they receive only their “own” neurotransmitter. As the neurotransmitter is received by the receptor, it triggers electrical impulses which travel through the neuron to the axon tip at the next synapse and the process repeats through a network of neurons until the information reaches its destination.
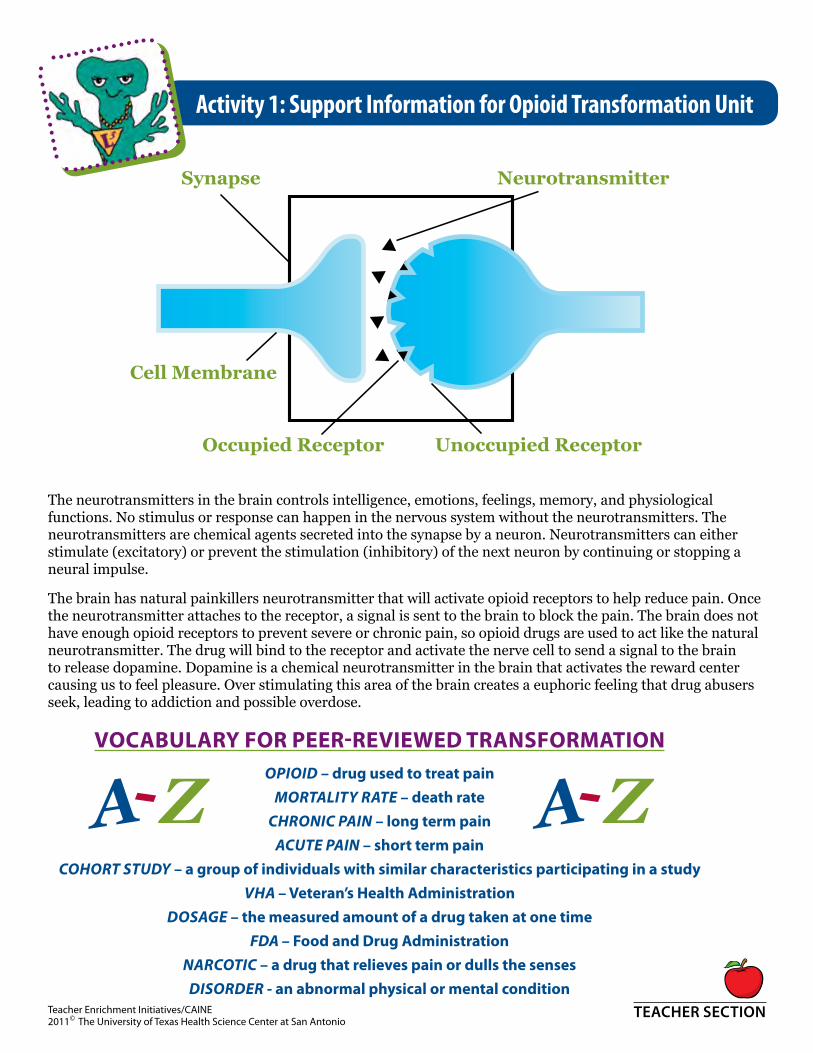
Synapse
Cell Membrane
Occupied Receptor Unoccupied Receptor
Neurotransmitter
INPUT from other neurons
dendrites
axon
Cell Body
sends signal down the axon
terminal Branches
OUTPUT from other neurons
(2) Scientific investigation and reasoning. The student uses scientific inquiry methods during laboratory and field investigations. The student is expected to:
(e) analyze data to formulate reasonable explanations, communicate valid conclusions supported by the data, and predict trends.
(3) Scientific investigation and reasoning. The student uses critical thinking, scientific reasoning, and problem solving to make informed decisions and knows the contributions of relevant scientists. The student is expected to:
(a) in all fields of science, analyze, evaluate, and critique scientific explanations by using empirical evidence, logical reasoning, and experimental and observational testing, including examining all sides of scientific evidence of those scientific explanations, so as to encourage critical thinking by the student;
(B) use models to represent aspects of the natural world such as a model of Earth’s layers;
(d) relate the impact of research on scientific thought and society, including the history of science and contributions of scientists as related to the content.6th-8th
Activity 1: Support Information for Opioid Transformation Unit
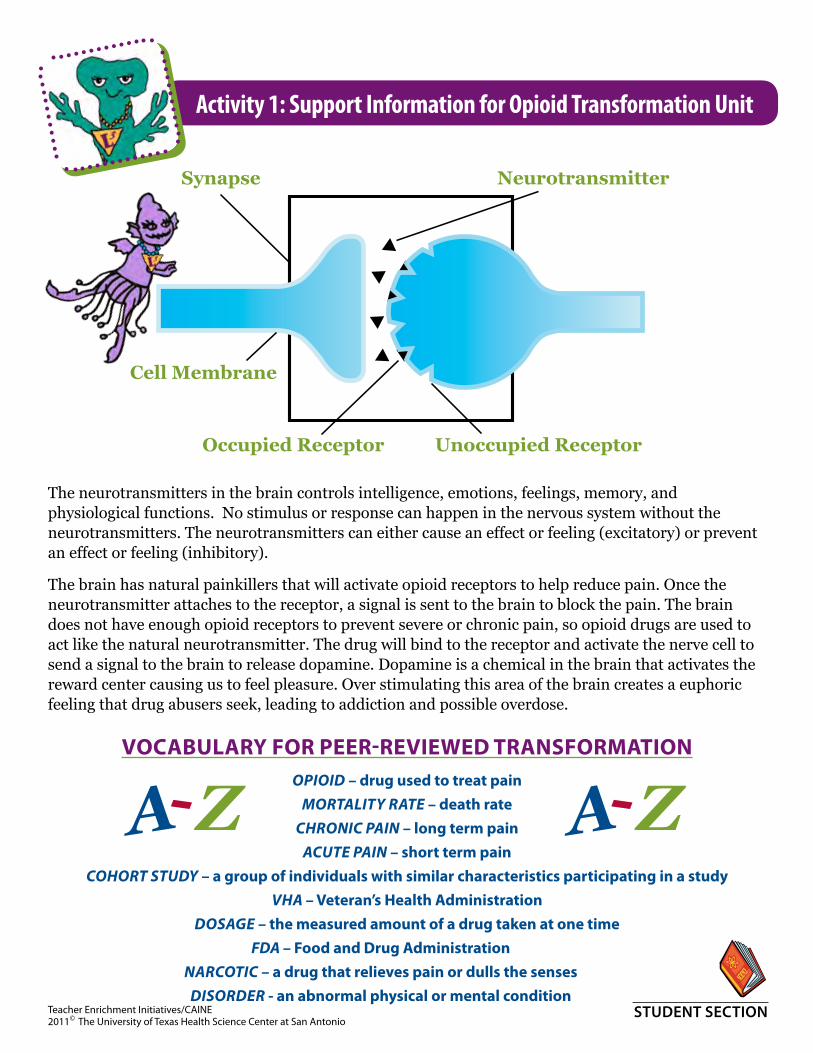
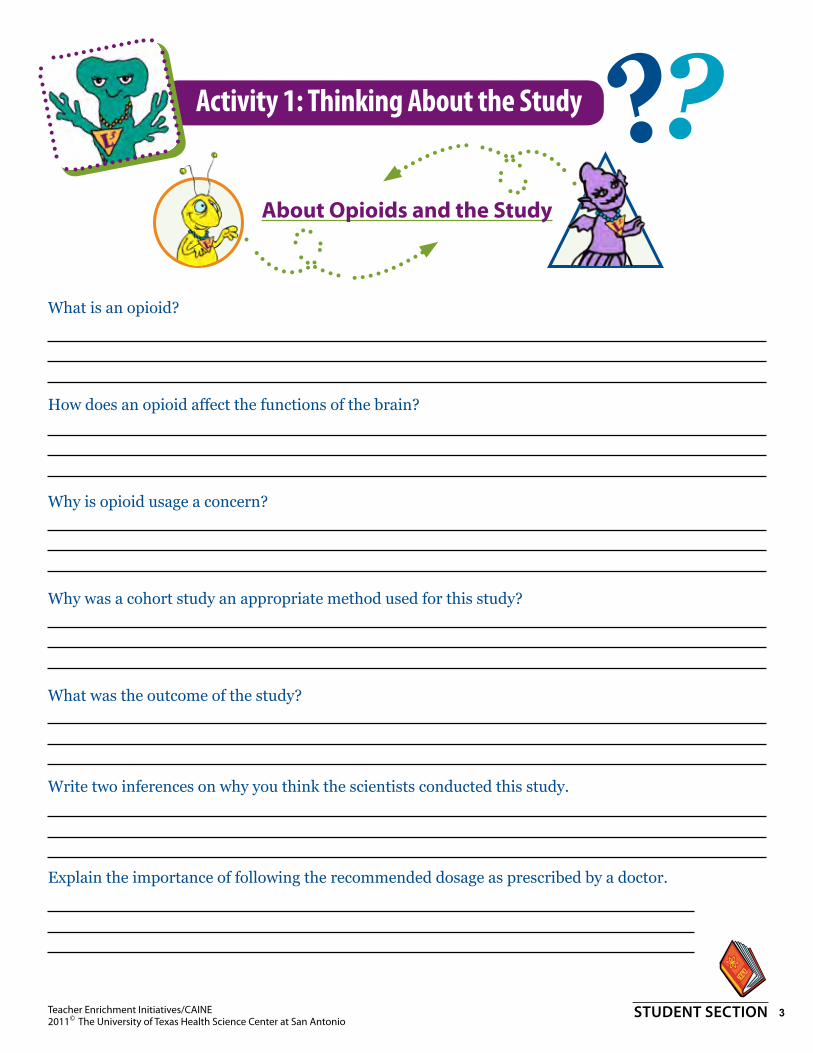
The neurotransmitters in the brain controls intelligence, emotions, feelings, memory, and physiological functions. No stimulus or response can happen in the nervous system without the neurotransmitters. The neurotransmitters are chemical agents secreted into the synapse by a neuron. Neurotransmitters can either stimulate (excitatory) or prevent the stimulation (inhibitory) of the next neuron by continuing or stopping a neural impulse.
The brain has natural painkillers neurotransmitter that will activate opioid receptors to help reduce pain. Once the neurotransmitter attaches to the receptor, a signal is sent to the brain to block the pain. The brain does not have enough opioid receptors to prevent severe or chronic pain, so opioid drugs are used to act like the natural neurotransmitter. The drug will bind to the receptor and activate the nerve cell to send a signal to the brain to release dopamine. Dopamine is a chemical neurotransmitter in the brain that activates the reward center causing us to feel pleasure. Over stimulating this area of the brain creates a euphoric feeling that drug abusers seek, leading to addiction and possible overdose.
VOCaBulary fOr peer-reViewed transfOrmatiOnOPIOId – drug used to treat pain
MOrTalITy raTe – death rateChrONIC PaIN – long term pain
aCUTe PaIN – short term painCOhOrT sTUdy – a group of individuals with similar characteristics participating in a study
Vha – Veteran’s Health administrationdOsage – the measured amount of a drug taken at one time
Fda – food and drug administration NarCOTIC – a drug that relieves pain or dulls the senses
dIsOrder - an abnormal physical or mental condition
A Z- A Z-
Activity 1: Support Information for Opioid Transformation Unit
Bohnert, A. S., Valenstein, M., Bair, M. J., Ganoczy, D., McCarthy, J. F., Ilegen, M. A., Blow, F. C. (2011). Association between opioid prescribing patterns and opioid overdose-related deaths. Journal of the American Medical Association, 305(13), 1315-1321. doi: 1315-1321.doi:10.1001/jama.2011.370.
Chronic pain: Opioids and chronic pain. NIH Medline Plus. Spring 2011, 6(1). Retrieved July 11, 2011, from http://www.nlm.nih.gob/medlinplus/magazine/issues/spring11/articles/spring11pg4.html.
Dunn, K. M., Saunders, K. W., Rutter, C. M., Banta-Green, C. J., Merrill, J. O., Sullivan, M. D.,. . . Von Korff, M. (2010). Overdose and prescribed opioids: Associations among chronic non-cancer pain patients. Annals of Internal Medicine, 152(2), 85-92. doi: 10.1059/0003-4819-152-2-201001190-00006.
FDA acts to reduce harm from opioid drugs. U.S. Food and Drug Administration. Retrieved July 11, 2011, from http://www.fda.gov./ForConsumers/ConsumerUpdates/ucm251830.htm
How do opioids work in the brain? The National Alliance of Advocates for Buprenorphine Treatment. December 2008. Retrieved on July 11, 2011 from http://www.naabt.org/faq_answers.cfm?ID=6.
Malbran, P. (2007, May 31). What’s a pill mill? CBS News. Retrieved on July 11, 2007 from http://www.cbsnews.com/8301-501263_162-2872835-501263.html#ixzz1QbSZC4V0.
Pilkington, E. (2011, June 9). Pharmageddon: How America got hooked on killer prescription drugs. The Guardian. Retrieved from http://www.guardian.co.uk/world/2011/jun/09/us-drugs-oxycodone-painkillers-florida?INTCMP=SRCH.
Tucker, T. (2009, July 5). Why does the brain contain opioid receptors? Lexington Herald-Leader, C6. Retrieved from http://www.addictionsurvivors.org/vbulletin/showthread.php?t=21931.
Student Section
Activity 1: Support Information for Opioid Transformation Unit
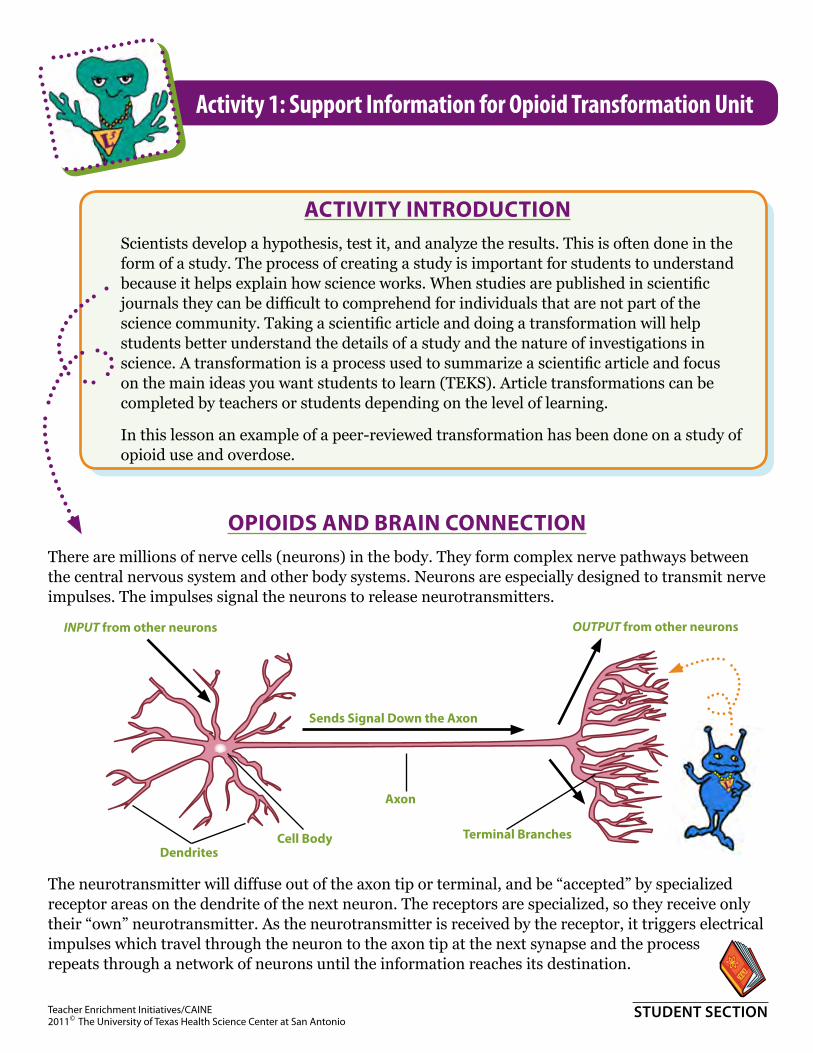
OpiOids and Brain COnneCtiOn There are millions of nerve cells (neurons) in the body. They form complex nerve pathways between the central nervous system and other body systems. Neurons are especially designed to transmit nerve impulses. The impulses signal the neurons to release neurotransmitters.
The neurotransmitter will diffuse out of the axon tip or terminal, and be “accepted” by specialized receptor areas on the dendrite of the next neuron. The receptors are specialized, so they receive only their “own” neurotransmitter. As the neurotransmitter is received by the receptor, it triggers electrical impulses which travel through the neuron to the axon tip at the next synapse and the process repeats through a network of neurons until the information reaches its destination.
aCtivity intrOduCtiOnScientists develop a hypothesis, test it, and analyze the results. This is often done in the form of a study. The process of creating a study is important for students to understand because it helps explain how science works. When studies are published in scientific journals they can be difficult to comprehend for individuals that are not part of the science community. Taking a scientific article and doing a transformation will help students better understand the details of a study and the nature of investigations in science. A transformation is a process used to summarize a scientific article and focus on the main ideas you want students to learn (TEKS). Article transformations can be completed by teachers or students depending on the level of learning.
In this lesson an example of a peer-reviewed transformation has been done on a study of opioid use and overdose.
Synapse
Cell Membrane
Occupied Receptor Unoccupied Receptor
Neurotransmitter
INPUT from other neurons
dendrites
axon
Cell Body
sends signal down the axon
terminal Branches
OUTPUT from other neurons
Student Section
Activity 1: Support Information for Opioid Transformation Unit
The neurotransmitters in the brain controls intelligence, emotions, feelings, memory, and physiological functions. No stimulus or response can happen in the nervous system without the neurotransmitters. The neurotransmitters can either cause an effect or feeling (excitatory) or prevent an effect or feeling (inhibitory).
The brain has natural painkillers that will activate opioid receptors to help reduce pain. Once the neurotransmitter attaches to the receptor, a signal is sent to the brain to block the pain. The brain does not have enough opioid receptors to prevent severe or chronic pain, so opioid drugs are used to act like the natural neurotransmitter. The drug will bind to the receptor and activate the nerve cell to send a signal to the brain to release dopamine. Dopamine is a chemical in the brain that activates the reward center causing us to feel pleasure. Over stimulating this area of the brain creates a euphoric feeling that drug abusers seek, leading to addiction and possible overdose.
vOCaBulary fOr peer-reviewed transfOrmatiOnOPIOId – drug used to treat pain
MOrTalITy raTe – death rateChrONIC PaIN – long term pain
aCUTe PaIN – short term painCOhOrT sTUdy – a group of individuals with similar characteristics participating in a study
Vha – veteran’s Health administrationdOsage – the measured amount of a drug taken at one time
Fda – food and drug administration NarCOTIC – a drug that relieves pain or dulls the senses
dIsOrder - an abnormal physical or mental condition
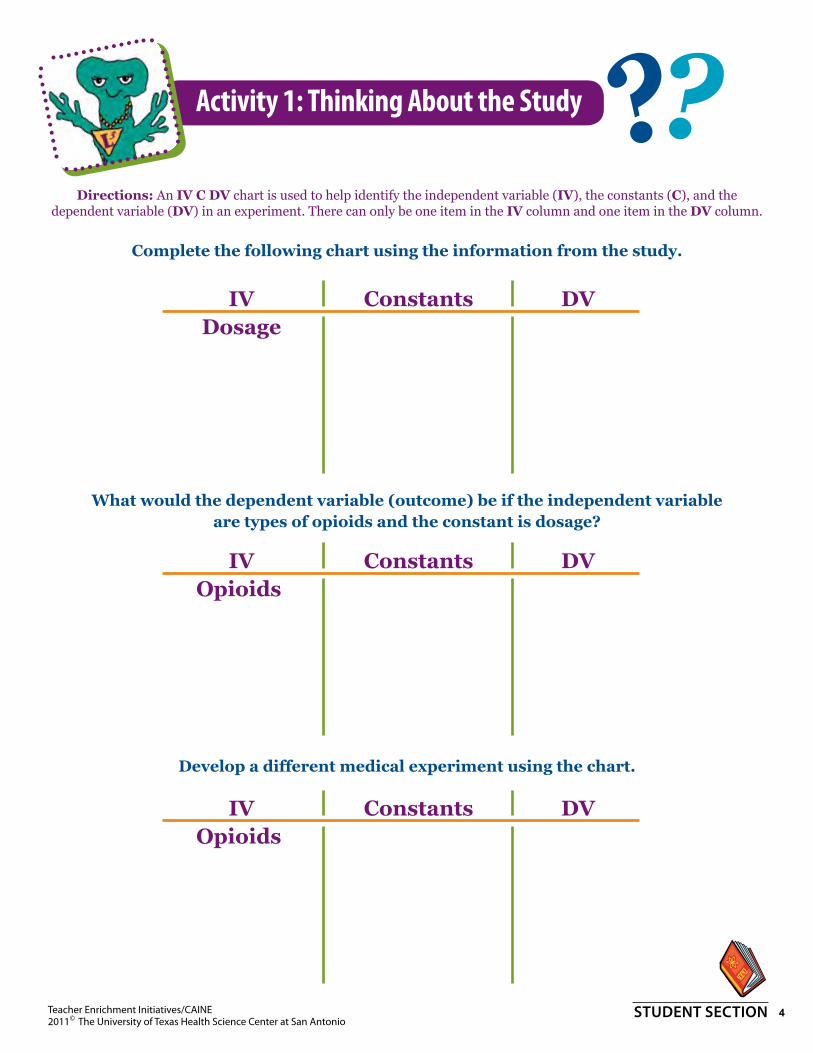
Complete the following chart using the information from the study.
What would the dependent variable (outcome) be if the independent variable are types of opioids and the constant is dosage?
Develop a different medical experiment using the chart.
Constants DVIVDosage
Constants DVIVopioids
Constants DVIVopioids
Directions: An IV C DV chart is used to help identify the independent variable (IV), the constants (C), and the dependent variable (DV) in an experiment. There can only be one item in the IV column and one item in the DV column.
Activity 2A: The Results Support Information - Person Months
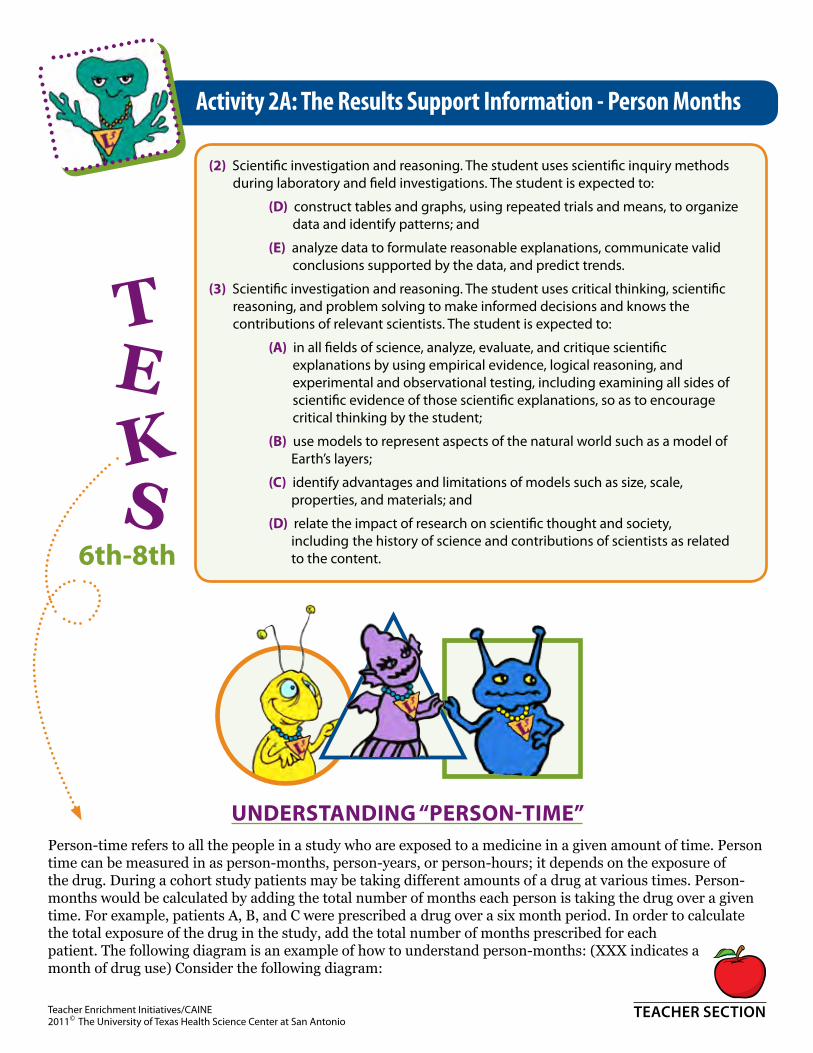
(2) Scientific investigation and reasoning. The student uses scientific inquiry methods during laboratory and field investigations. The student is expected to:
(D) construct tables and graphs, using repeated trials and means, to organize data and identify patterns; and
(E) analyze data to formulate reasonable explanations, communicate valid conclusions supported by the data, and predict trends.
(3) Scientific investigation and reasoning. The student uses critical thinking, scientific reasoning, and problem solving to make informed decisions and knows the contributions of relevant scientists. The student is expected to:
(A) in all fields of science, analyze, evaluate, and critique scientificexplanations by using empirical evidence, logical reasoning, and experimental and observational testing, including examining all sides of scientific evidence of those scientific explanations, so as to encourage critical thinking by the student;
(B) use models to represent aspects of the natural world such as a model of Earth’s layers;
(C) identify advantages and limitations of models such as size, scale, properties, and materials; and
(D) relate the impact of research on scientific thought and society, including the history of science and contributions of scientists as related to the content.6th-8th
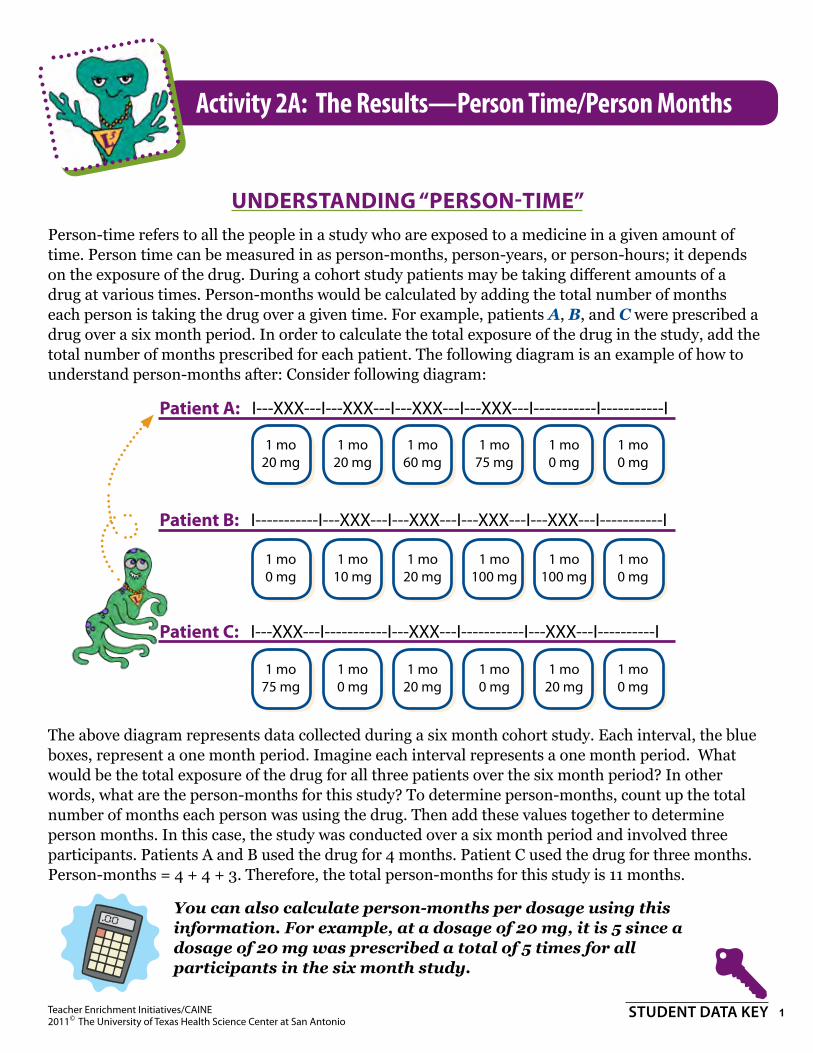
UnDErstAnDing “PErson-timE”Person-time refers to all the people in a study who are exposed to a medicine in a given amount of time. Person time can be measured in as person-months, person-years, or person-hours; it depends on the exposure of the drug. During a cohort study patients may be taking different amounts of a drug at various times. Person-months would be calculated by adding the total number of months each person is taking the drug over a given time. For example, patients A, B, and C were prescribed a drug over a six month period. In order to calculate the total exposure of the drug in the study, add the total number of months prescribed for each patient. The following diagram is an example of how to understand person-months: (XXX indicates a month of drug use) Consider the following diagram:
Activity 2A: The Results Support Information - Person Months
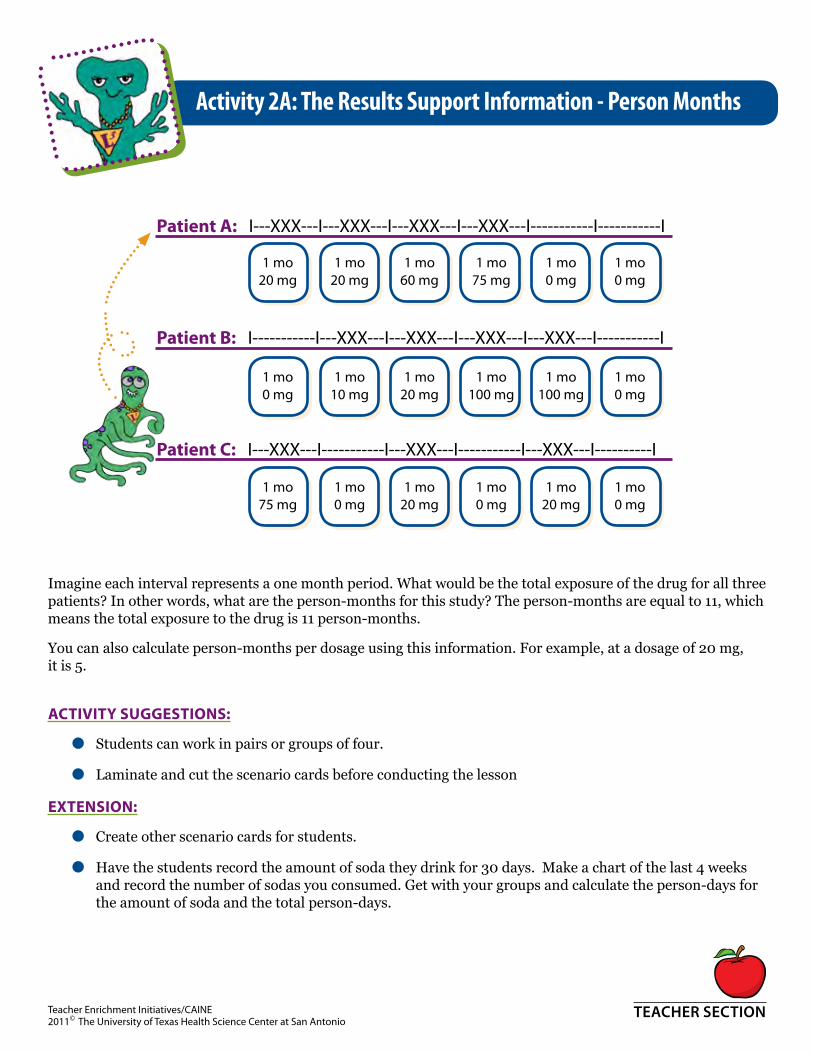
Imagine each interval represents a one month period. What would be the total exposure of the drug for all three patients? In other words, what are the person-months for this study? The person-months are equal to 11, which means the total exposure to the drug is 11 person-months.
You can also calculate person-months per dosage using this information. For example, at a dosage of 20 mg, it is 5.
ACtivity sUggEstions:
●● Students can work in pairs or groups of four.
●● Laminate and cut the scenario cards before conducting the lesson
ExtEnsion:
●● Create other scenario cards for students.
●● Have the students record the amount of soda they drink for 30 days. Make a chart of the last 4 weeks and record the number of sodas you consumed. Get with your groups and calculate the person-days for the amount of soda and the total person-days.
Activity 2A: The Results—Person Time/Person Months
Understanding “Person-time”Person-time refers to all the people in a study who are exposed to a medicine in a given amount of time. Person time can be measured in as person-months, person-years, or person-hours; it depends on the exposure of the drug. During a cohort study patients may be taking different amounts of a drug at various times. Person-months would be calculated by adding the total number of months each person is taking the drug over a given time. For example, patients A, B, and C were prescribed a drug over a six month period. In order to calculate the total exposure of the drug in the study, add the total number of months prescribed for each patient. The following diagram is an example of how to understand person-months after: Consider following diagram:
The above diagram represents data collected during a six month cohort study. Each interval, the blue boxes, represent a one month period. Imagine each interval represents a one month period. What would be the total exposure of the drug for all three patients over the six month period? In other words, what are the person-months for this study? To determine person-months, count up the total number of months each person was using the drug. Then add these values together to determine person months. In this case, the study was conducted over a six month period and involved three participants. Patients A and B used the drug for 4 months. Patient C used the drug for three months. Person-months = 4 + 4 + 3. Therefore, the total person-months for this study is 11 months.
You can also calculate person-months per dosage using this information. For example, at a dosage of 20 mg, it is 5 since a dosage of 20 mg was prescribed a total of 5 times for all participants in the six month study.
1. Handout the first set of scenario cards to each group. 2. Record the dosages for each person into the appropriate data table. 3. Calculate the total person months for each dosage and write it in the appropriate data table. 4. Repeat steps 1 and 2 for Part 2 using the 2nd set of scenario cards. 5. Create a table to record the total person-months for each dosage. Record your data.6. Answer the questions.7. Create the data tables needed to complete Part 3. 8. Repeat steps 1, 2, and 3 for the 3rd set of scenario cards. 9. Answer the processing out questions.
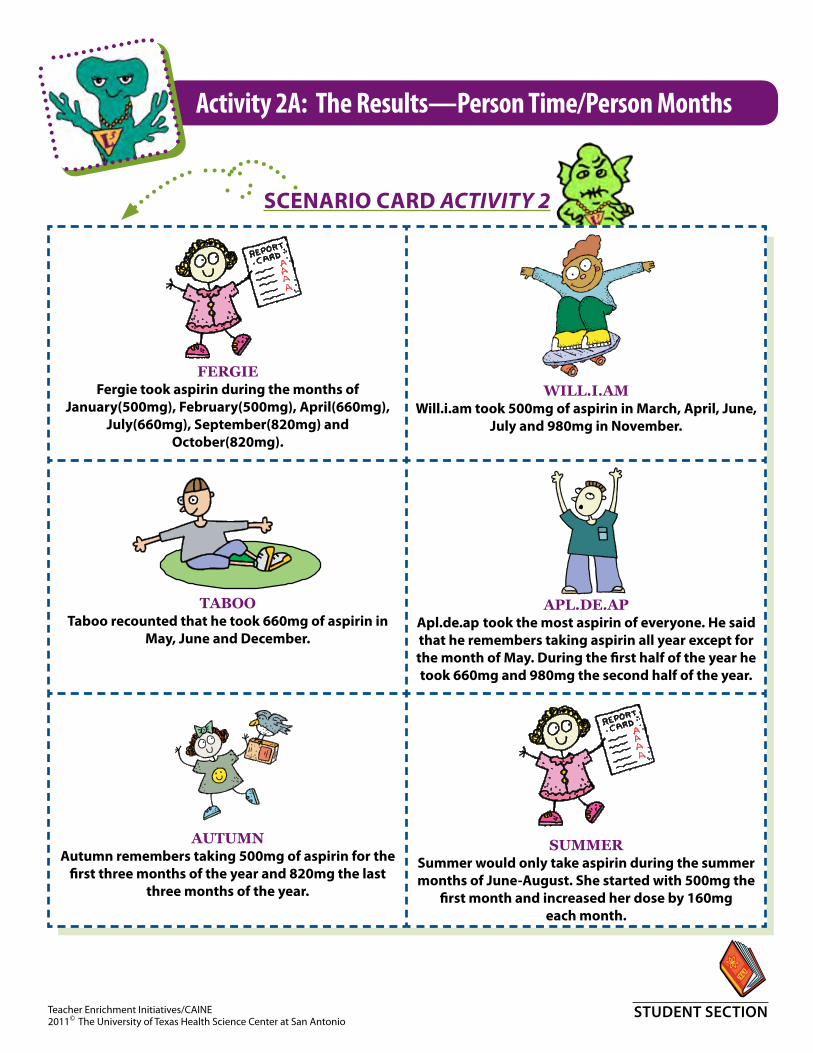
Activity 2A: The Results—Person Time/Person Months
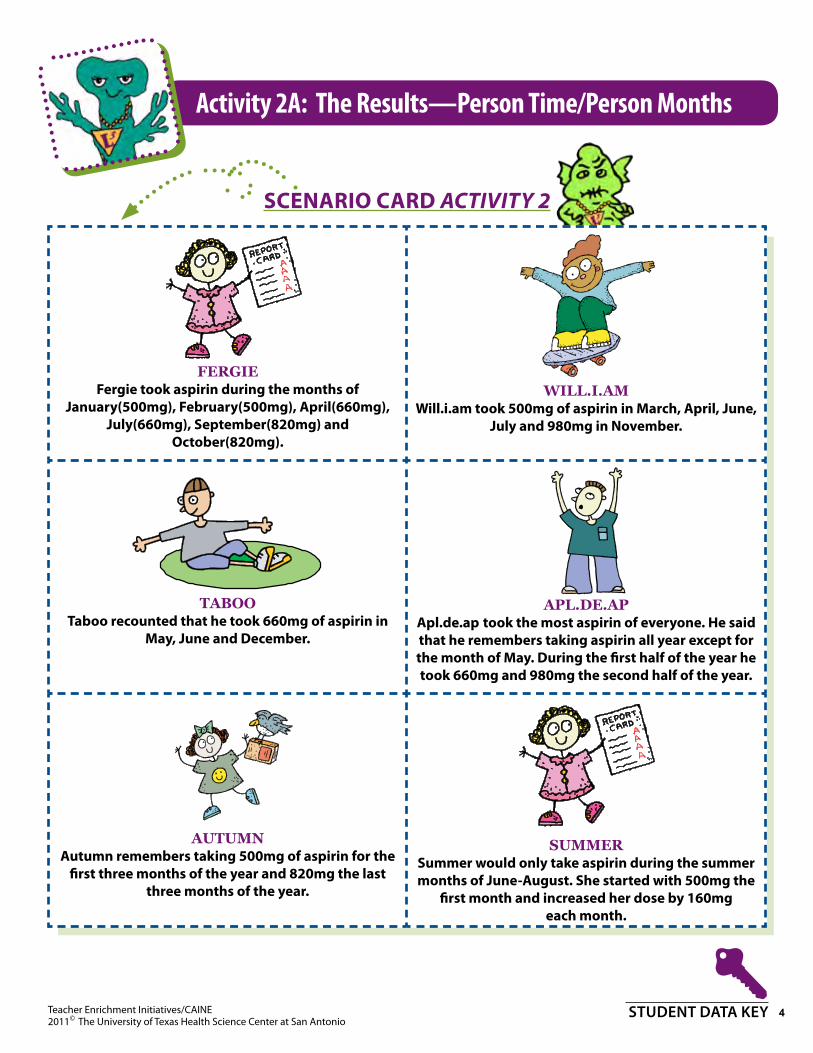
January(500mg), February(500mg), april(660mg), July(660mg), september(820mg) and
october(820mg).
will.i.AmWill.i.am took 500mg of aspirin in march, april, June,
July and 980mg in november.
tAbootaboo recounted that he took 660mg of aspirin in
may, June and december.
Apl.de.Apapl.de.ap took the most aspirin of everyone. He said that he remembers taking aspirin all year except for the month of may. during the first half of the year he took 660mg and 980mg the second half of the year.
Autumnautumn remembers taking 500mg of aspirin for the
first three months of the year and 820mg the last three months of the year.
Summersummer would only take aspirin during the summer months of June-august. she started with 500mg the
first month and increased her dose by 160mg each month.
Activity 2A: The Results—Person Time/Person Months
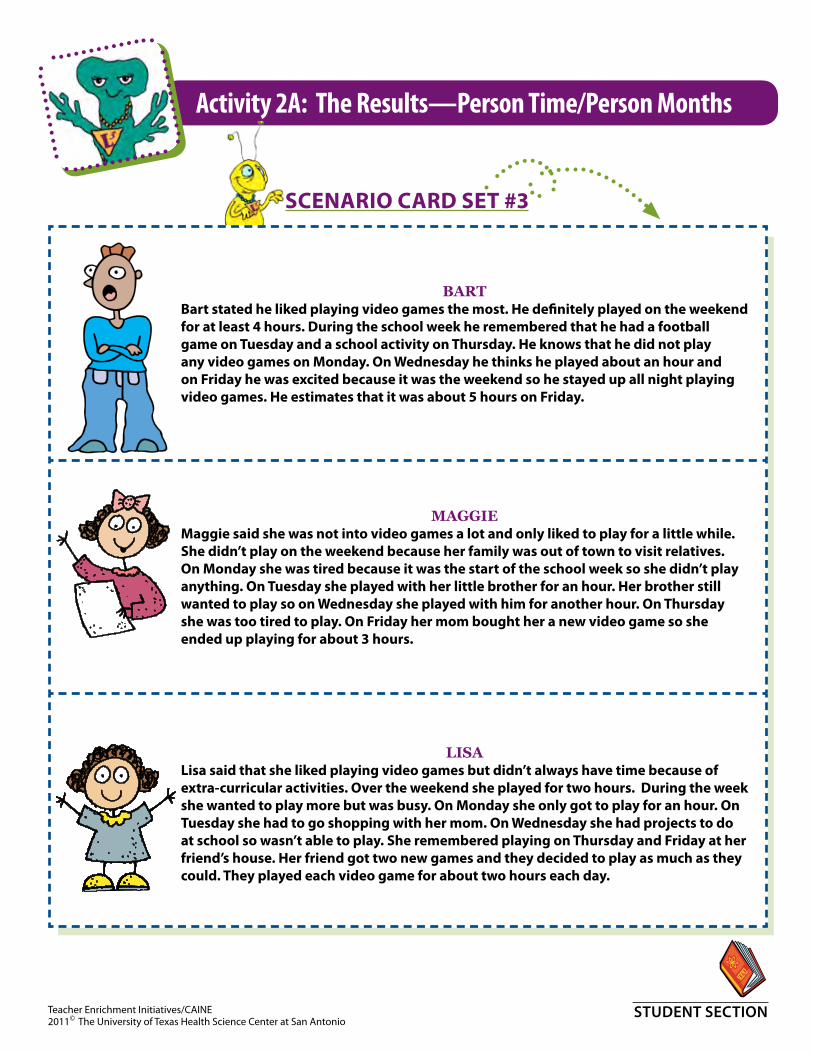
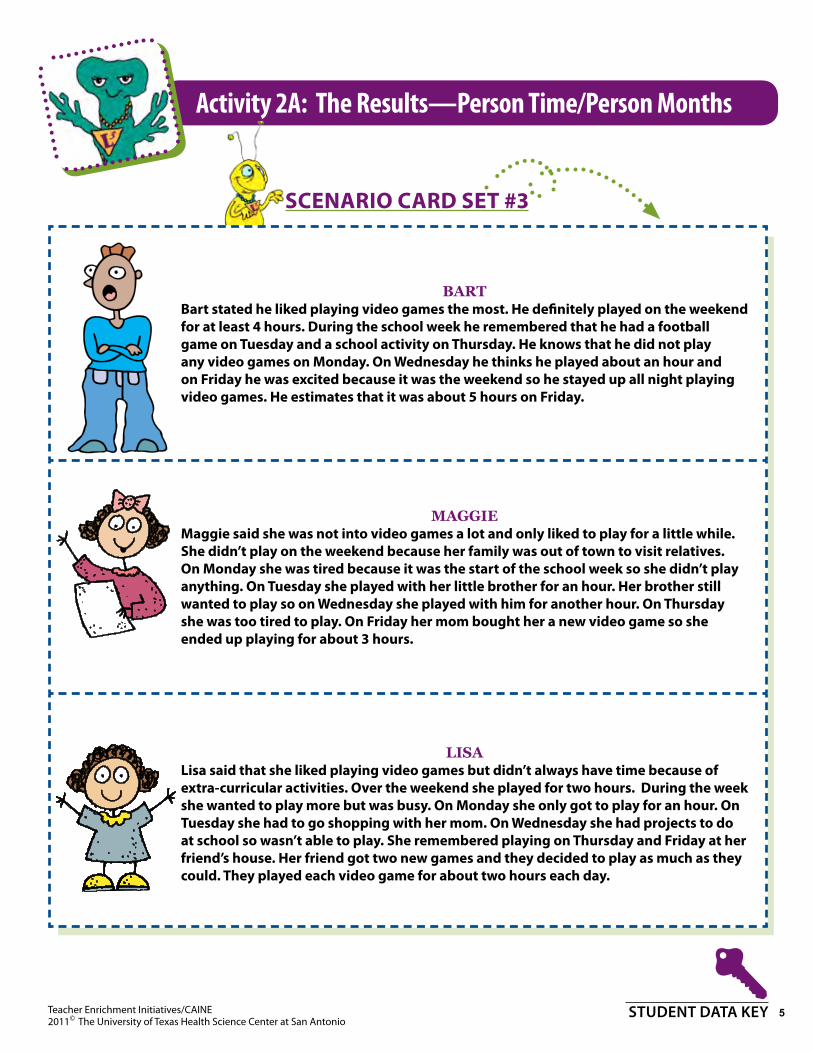
bArtBart stated he liked playing video games the most. He definitely played on the weekend for at least 4 hours. during the school week he remembered that he had a football game on tuesday and a school activity on thursday. He knows that he did not play any video games on monday. on Wednesday he thinks he played about an hour and on Friday he was excited because it was the weekend so he stayed up all night playing video games. He estimates that it was about 5 hours on Friday.
mAggiemaggie said she was not into video games a lot and only liked to play for a little while. she didn’t play on the weekend because her family was out of town to visit relatives. on monday she was tired because it was the start of the school week so she didn’t play anything. on tuesday she played with her little brother for an hour. Her brother still wanted to play so on Wednesday she played with him for another hour. on thursday she was too tired to play. on Friday her mom bought her a new video game so she ended up playing for about 3 hours.
liSAlisa said that she liked playing video games but didn’t always have time because of extra-curricular activities. over the weekend she played for two hours. during the week she wanted to play more but was busy. on monday she only got to play for an hour. on tuesday she had to go shopping with her mom. on Wednesday she had projects to do at school so wasn’t able to play. she remembered playing on thursday and Friday at her friend’s house. Her friend got two new games and they decided to play as much as they could. they played each video game for about two hours each day.
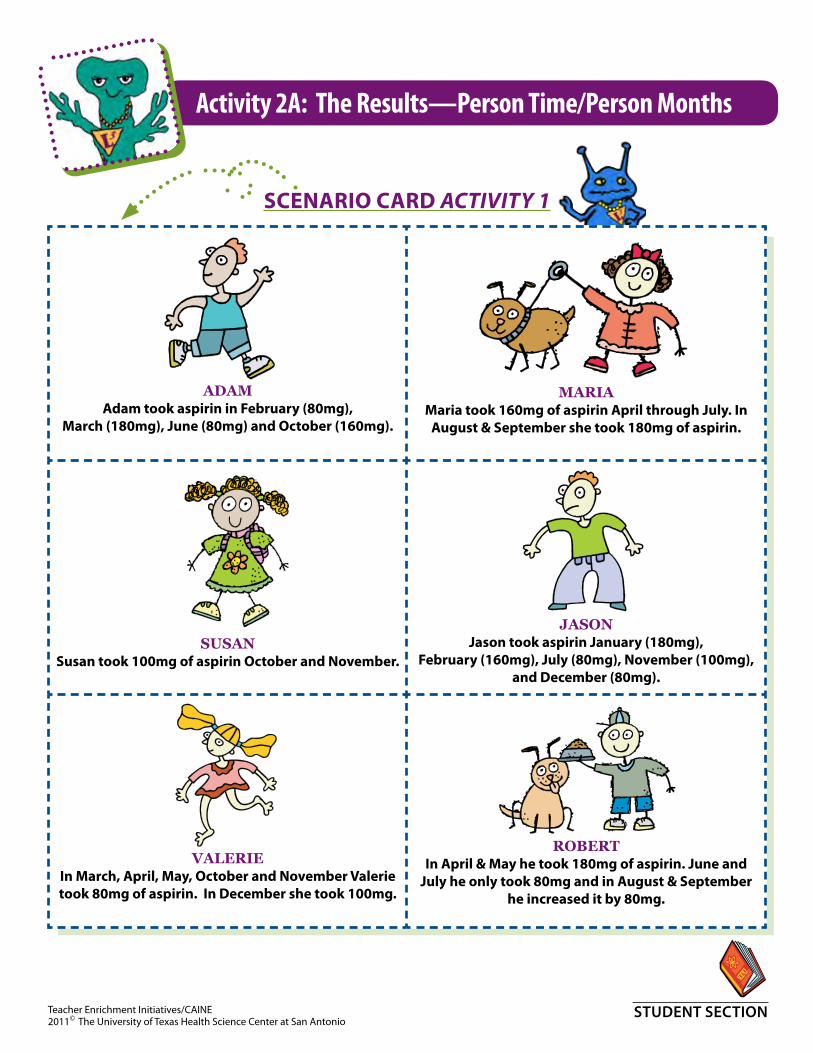
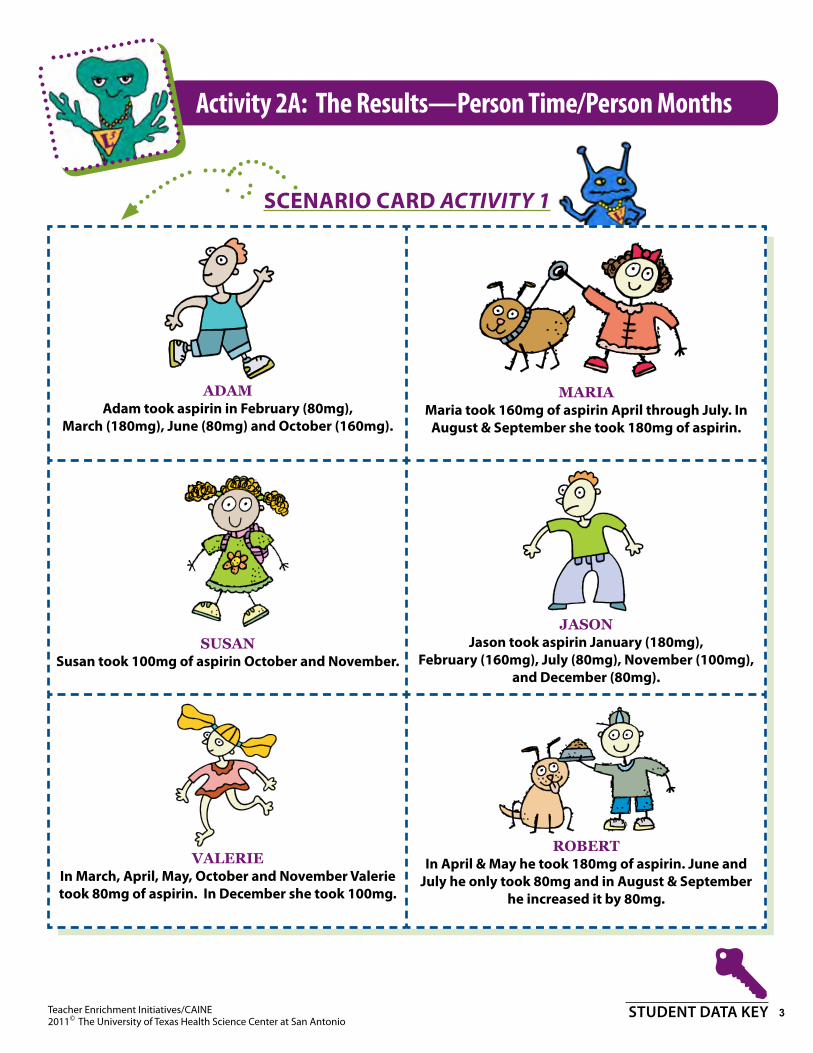
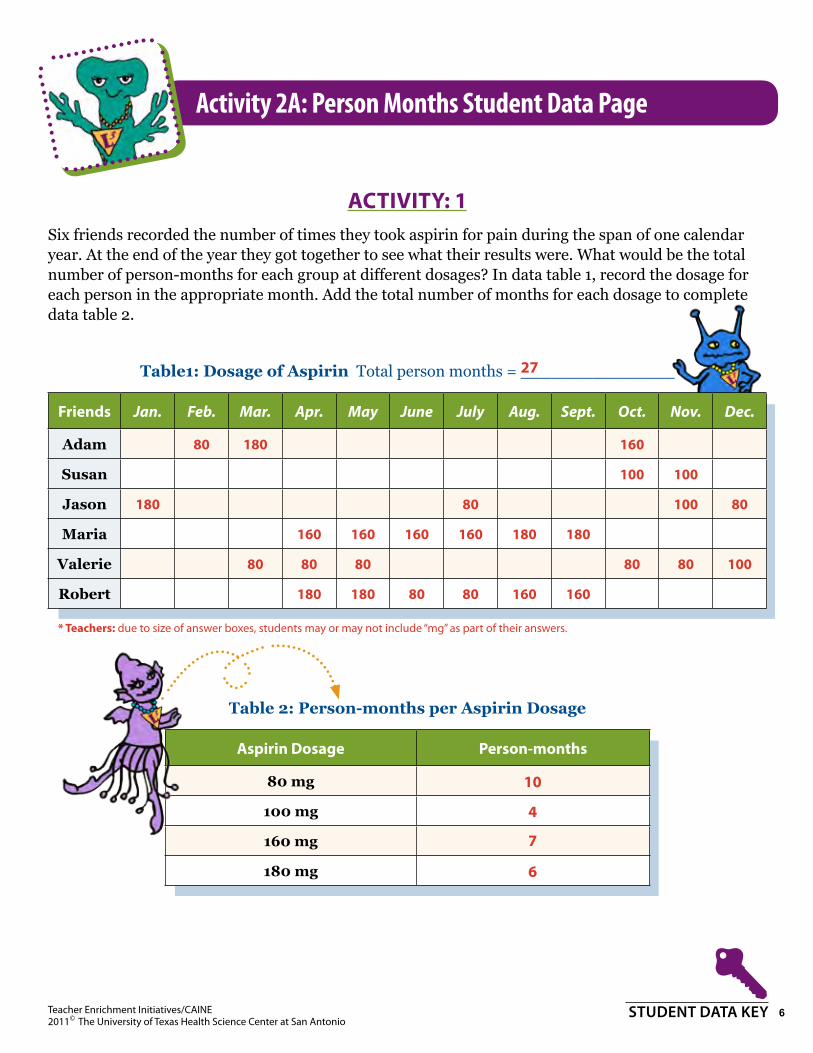
aCtivity: 1Six friends recorded the number of times they took aspirin for pain during the span of one calendar year. At the end of the year they got together to see what their results were. What would be the total number of person-months for each group at different dosages? In data table 1, record the dosage for each person in the appropriate month. Add the total number of months for each dosage to complete data table 2.
table1: dosage of Aspirin Total person months = _______________
Friends Jan. Feb. Mar. Apr. May June July Aug. Sept. Oct. Nov. Dec.
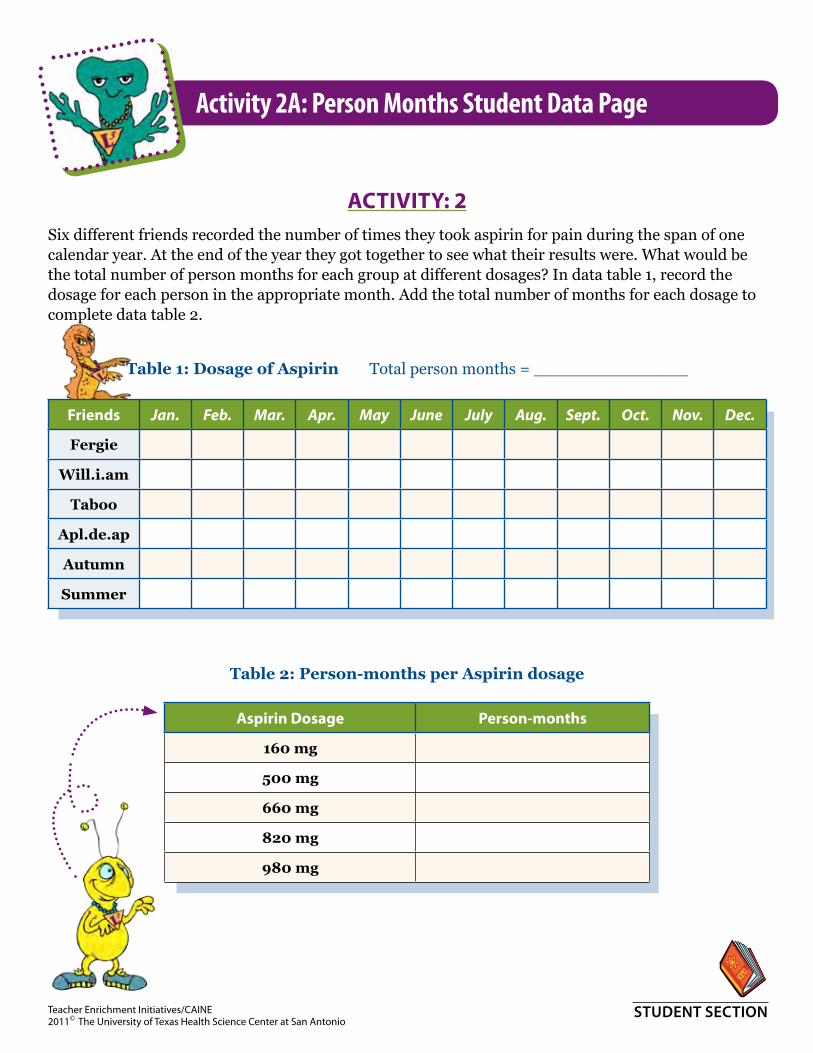
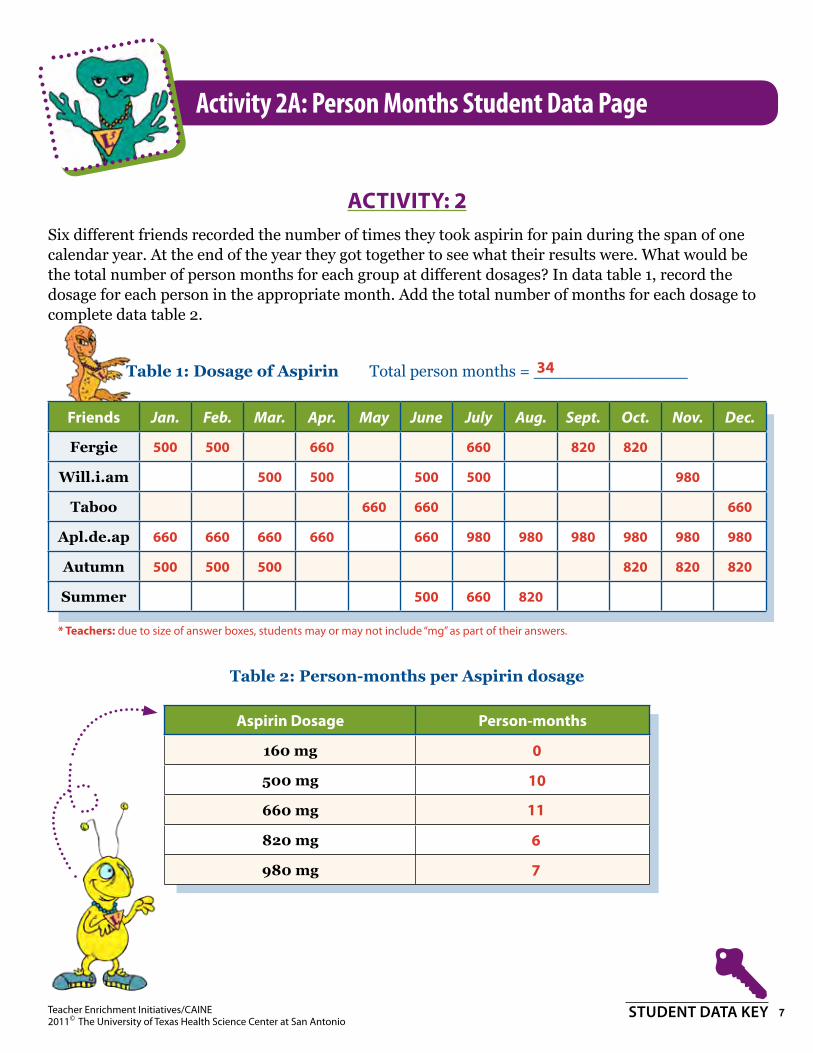
aCtivity: 2 Six different friends recorded the number of times they took aspirin for pain during the span of one calendar year. At the end of the year they got together to see what their results were. What would be the total number of person months for each group at different dosages? In data table 1, record the dosage for each person in the appropriate month. Add the total number of months for each dosage to complete data table 2.
table 1: dosage of Aspirin Total person months = _______________
Friends Jan. Feb. Mar. Apr. May June July Aug. Sept. Oct. Nov. Dec.
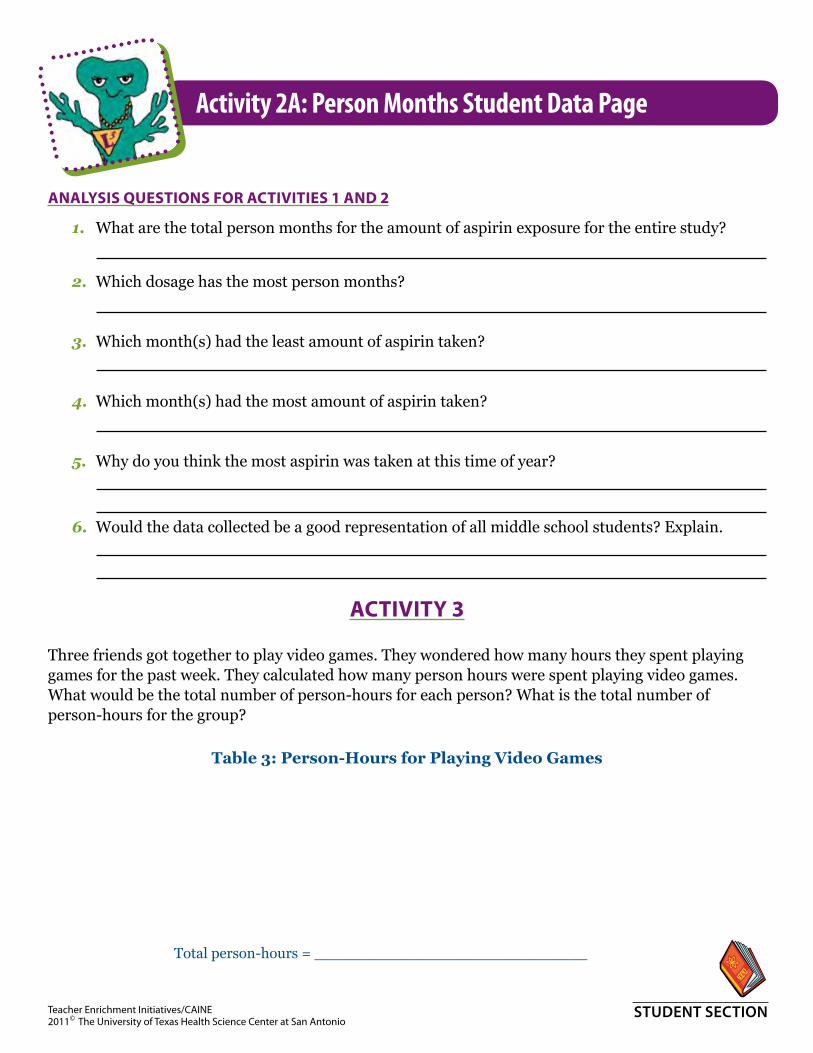
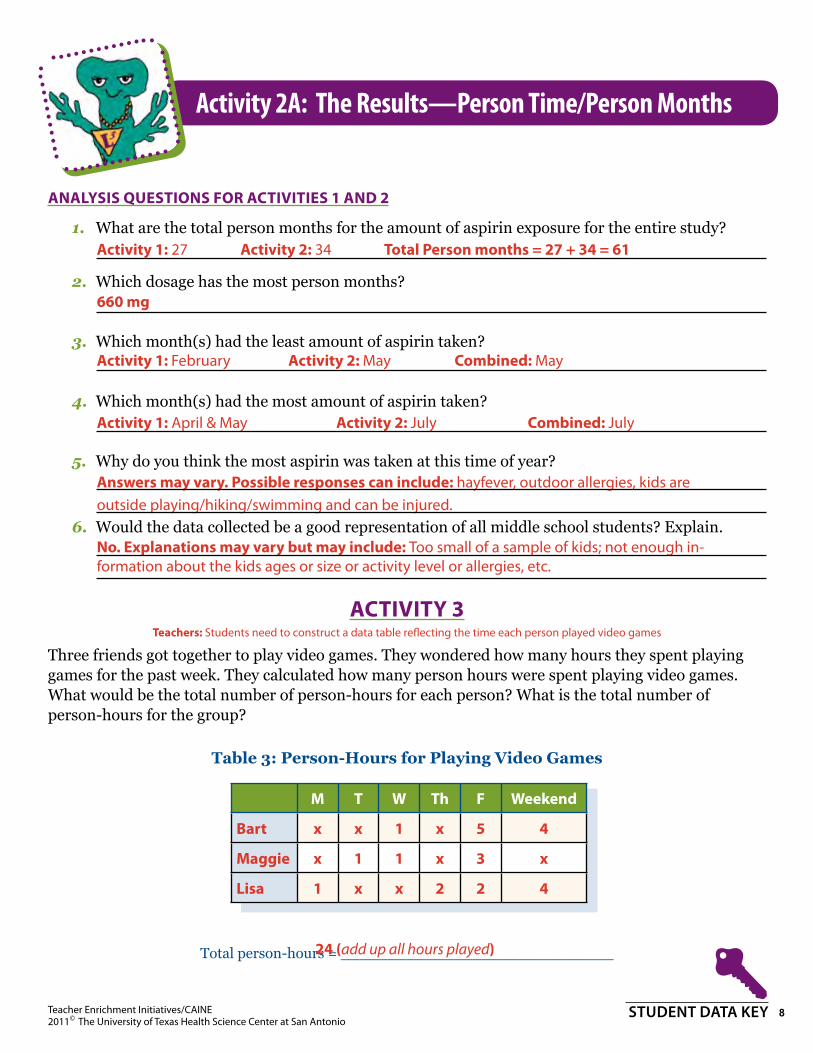
1. What are the total person months for the amount of aspirin exposure for the entire study?
2. Which dosage has the most person months?
3. Which month(s) had the least amount of aspirin taken?
4. Which month(s) had the most amount of aspirin taken?
5. Why do you think the most aspirin was taken at this time of year?
6. Would the data collected be a good representation of all middle school students? Explain.
aCtivity 3
Three friends got together to play video games. They wondered how many hours they spent playing games for the past week. They calculated how many person hours were spent playing video games. What would be the total number of person-hours for each person? What is the total number of person-hours for the group?
table 3: person-Hours for playing Video games
Total person-hours = _____________________________
(2) Scientific investigation and reasoning. The student uses scientific inquiry methods during laboratory and field investigations. The student is expected to:
(D) construct tables and graphs, using repeated trials and means, to organize data and identify patterns; and
(E) analyze data to formulate reasonable explanations, communicate valid conclusions supported by the data, and predict trends.
(3) Scientific investigation and reasoning. The student uses critical thinking, scientific reasoning, and problem solving to make informed decisions and knows the contributions of relevant scientists. The student is expected to:
(A) in all fields of science, analyze, evaluate, and critique scientific explanations by using empirical evidence, logical reasoning, and experimental and observational testing, including examining all sides of scientific evidence of those scientific explanations, so as to encourage critical thinking by the student;
(D) relate the impact of research on scientific thought and society, including the history of science and contributions of scientists as related to the content.6th-8th
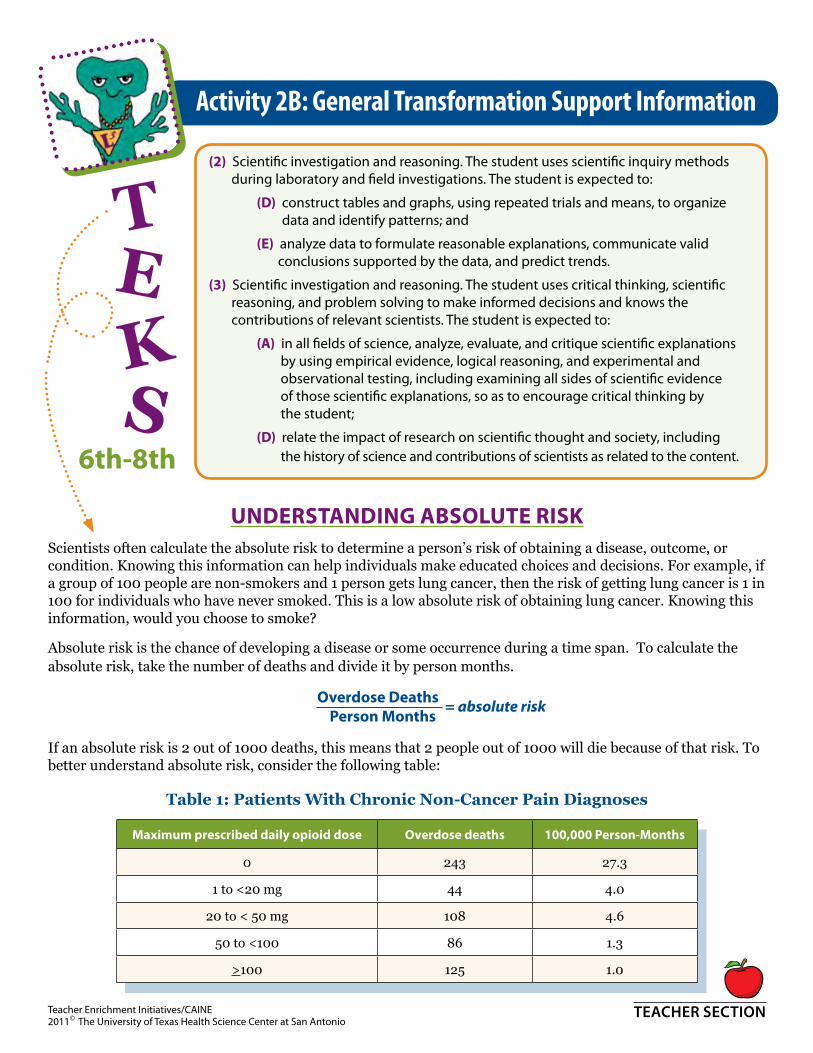
UnDErstAnDing AbsolUtE riskScientists often calculate the absolute risk to determine a person’s risk of obtaining a disease, outcome, or condition. Knowing this information can help individuals make educated choices and decisions. For example, if a group of 100 people are non-smokers and 1 person gets lung cancer, then the risk of getting lung cancer is 1 in 100 for individuals who have never smoked. This is a low absolute risk of obtaining lung cancer. Knowing this information, would you choose to smoke?
Absolute risk is the chance of developing a disease or some occurrence during a time span. To calculate the absolute risk, take the number of deaths and divide it by person months.
overdose Deaths = absolute risk Person Months
If an absolute risk is 2 out of 1000 deaths, this means that 2 people out of 1000 will die because of that risk. To better understand absolute risk, consider the following table:
Table 1: Patients With Chronic Non-Cancer Pain Diagnoses
Maximum prescribed daily opioid dose overdose deaths 100,000 Person-Months
0 243 27.3
1 to <20 mg 44 4.0
20 to < 50 mg 108 4.6
50 to <100 86 1.3
>100 125 1.0
Activity 2B: General Transformation Support Information
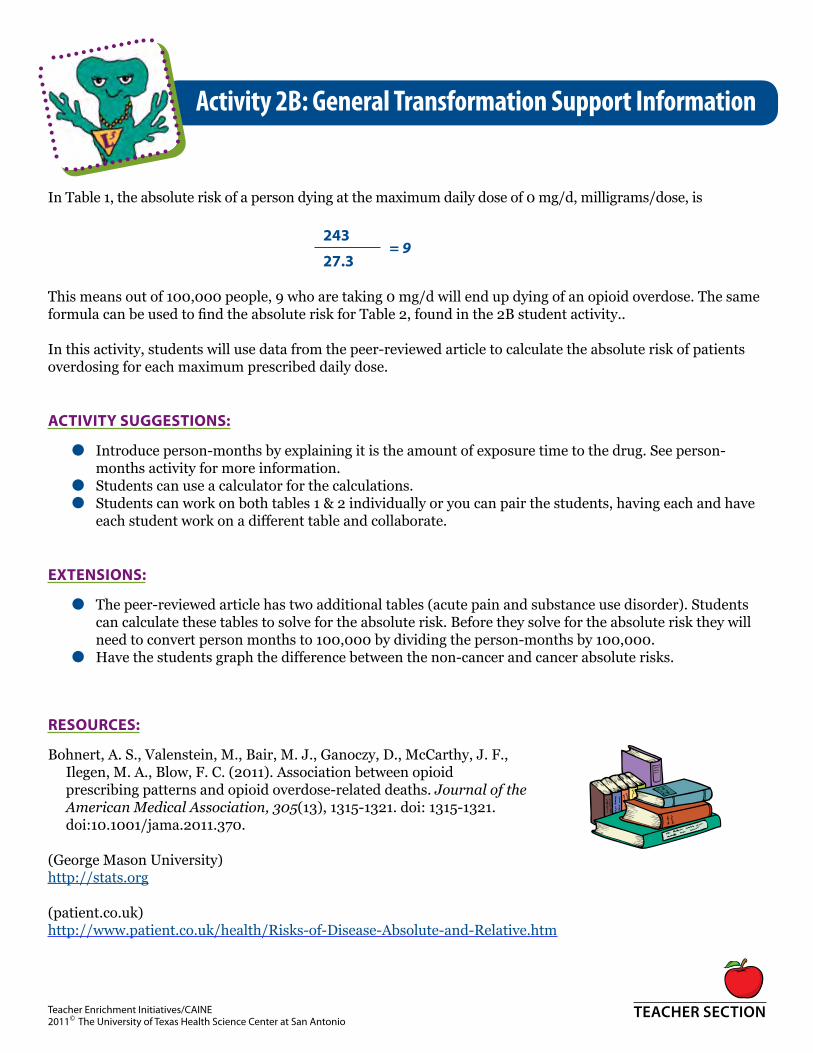
In Table 1, the absolute risk of a person dying at the maximum daily dose of 0 mg/d, milligrams/dose, is
243 = 927.3
This means out of 100,000 people, 9 who are taking 0 mg/d will end up dying of an opioid overdose. The same formula can be used to find the absolute risk for Table 2, found in the 2B student activity..
In this activity, students will use data from the peer-reviewed article to calculate the absolute risk of patients overdosing for each maximum prescribed daily dose.
Activity sUggEstions:
●● Introduce person-months by explaining it is the amount of exposure time to the drug. See person-months activity for more information.
●● Students can use a calculator for the calculations.●● Students can work on both tables 1 & 2 individually or you can pair the students, having each and have
each student work on a different table and collaborate.
ExtEnsions:
●● The peer-reviewed article has two additional tables (acute pain and substance use disorder). Students can calculate these tables to solve for the absolute risk. Before they solve for the absolute risk they will need to convert person months to 100,000 by dividing the person-months by 100,000.
●● Have the students graph the difference between the non-cancer and cancer absolute risks.
rEsoUrcEs:
Bohnert, A. S., Valenstein, M., Bair, M. J., Ganoczy, D., McCarthy, J. F., Ilegen, M. A., Blow, F. C. (2011). Association between opioid prescribing patterns and opioid overdose-related deaths. Journal of the American Medical Association, 305(13), 1315-1321. doi: 1315-1321. doi:10.1001/jama.2011.370.
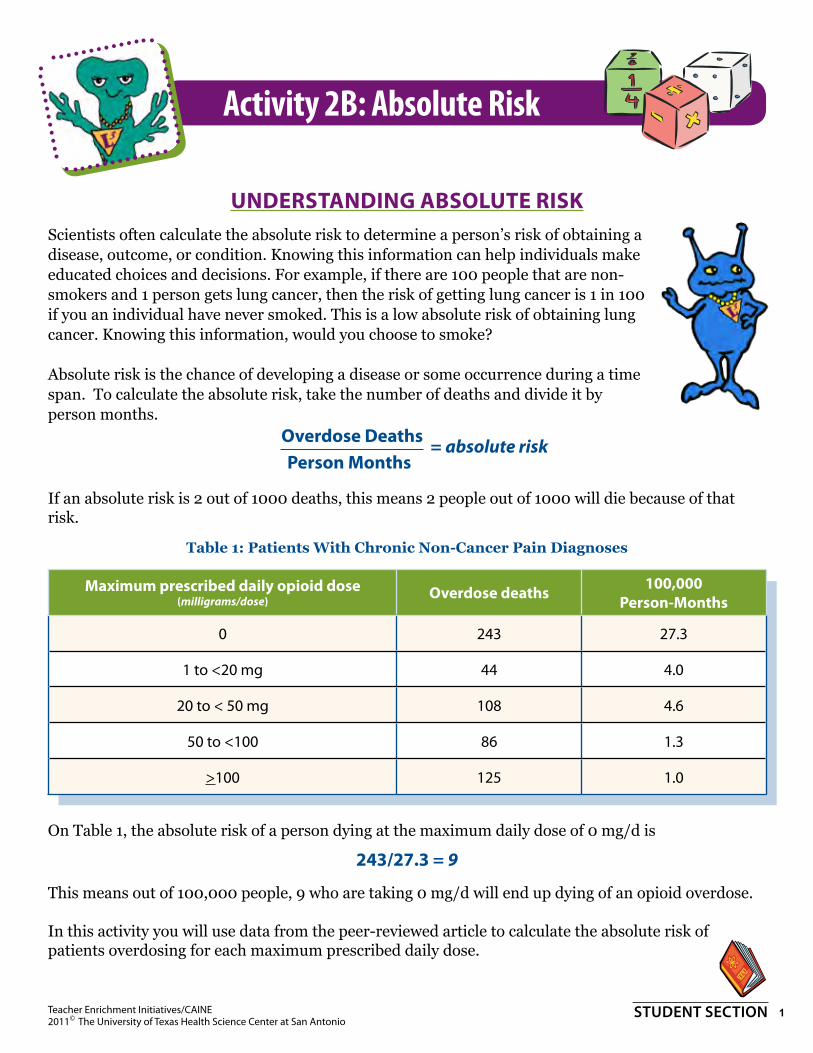
Understanding absolUte riskScientists often calculate the absolute risk to determine a person’s risk of obtaining a disease, outcome, or condition. Knowing this information can help individuals make educated choices and decisions. For example, if there are 100 people that are non-smokers and 1 person gets lung cancer, then the risk of getting lung cancer is 1 in 100 if you an individual have never smoked. This is a low absolute risk of obtaining lung cancer. Knowing this information, would you choose to smoke?
Absolute risk is the chance of developing a disease or some occurrence during a time span. To calculate the absolute risk, take the number of deaths and divide it by person months.
overdose deaths = absolute riskPerson Months
If an absolute risk is 2 out of 1000 deaths, this means 2 people out of 1000 will die because of that risk.
Table 1: Patients With Chronic Non-Cancer Pain Diagnoses
Maximum prescribed daily opioid dose (milligrams/dose) overdose deaths 100,000
Person-Months
0 243 27.3
1 to <20 mg 44 4.0
20 to < 50 mg 108 4.6
50 to <100 86 1.3
>100 125 1.0
On Table 1, the absolute risk of a person dying at the maximum daily dose of 0 mg/d is
243/27.3 = 9
This means out of 100,000 people, 9 who are taking 0 mg/d will end up dying of an opioid overdose.
In this activity you will use data from the peer-reviewed article to calculate the absolute risk of patients overdosing for each maximum prescribed daily dose.
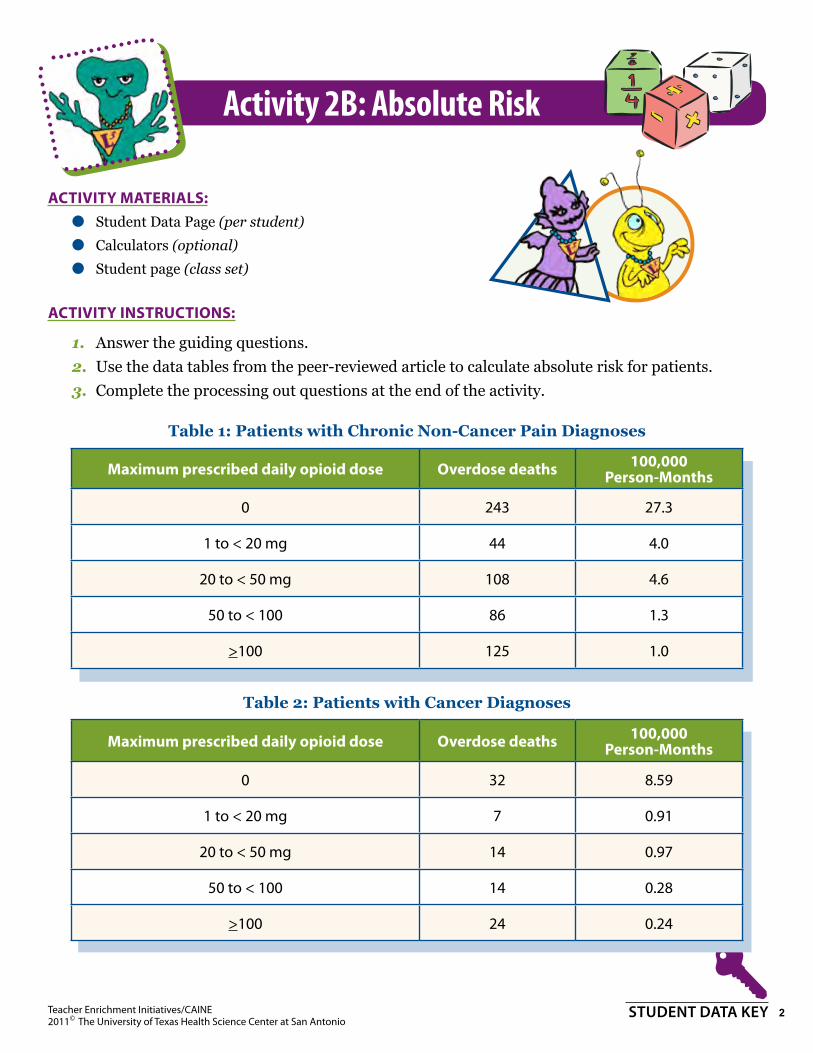
activity Materials: ●● Student Data Page (per student)
●● Calculators (optional)
●● Student page (class set)
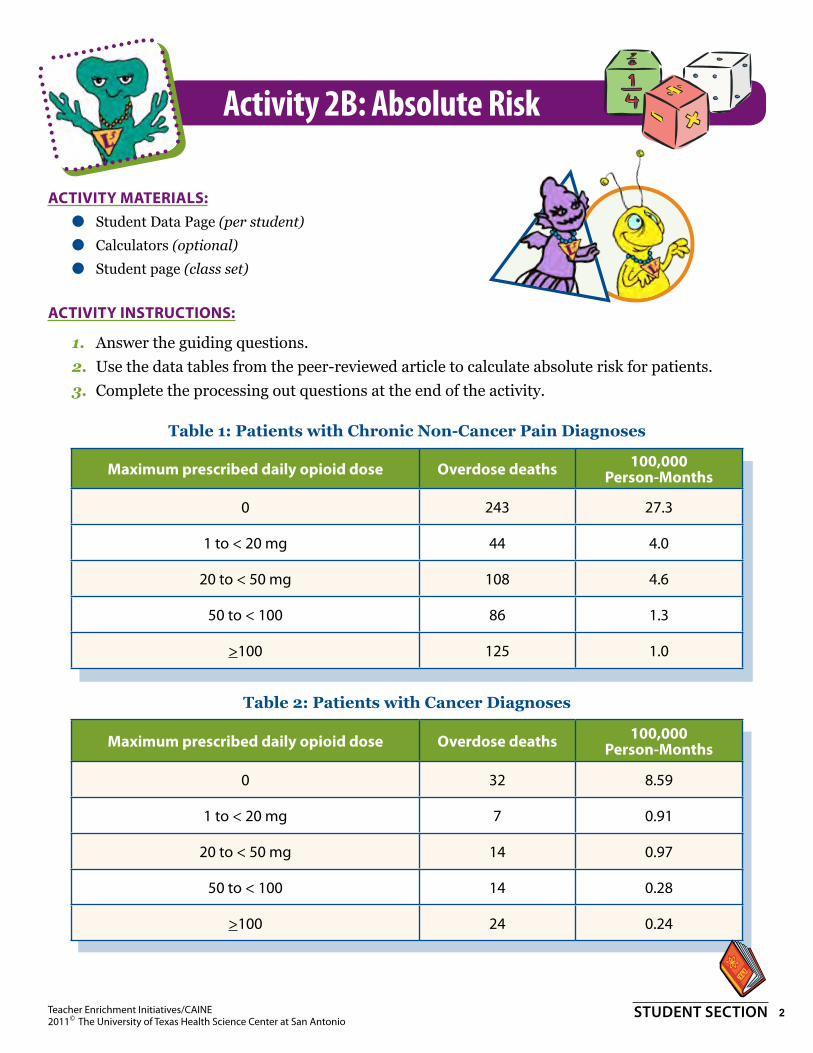
activity instrUctions:
1. Answer the guiding questions. 2. Use the data tables from the peer-reviewed article to calculate absolute risk for patients. 3. Complete the processing out questions at the end of the activity.
Table 1: Patients with Chronic Non-Cancer Pain Diagnoses
Maximum prescribed daily opioid dose overdose deaths 100,000Person-Months
0 243 27.3
1 to < 20 mg 44 4.0
20 to < 50 mg 108 4.6
50 to < 100 86 1.3
>100 125 1.0
Table 2: Patients with Cancer Diagnoses
Maximum prescribed daily opioid dose overdose deaths 100,000Person-Months
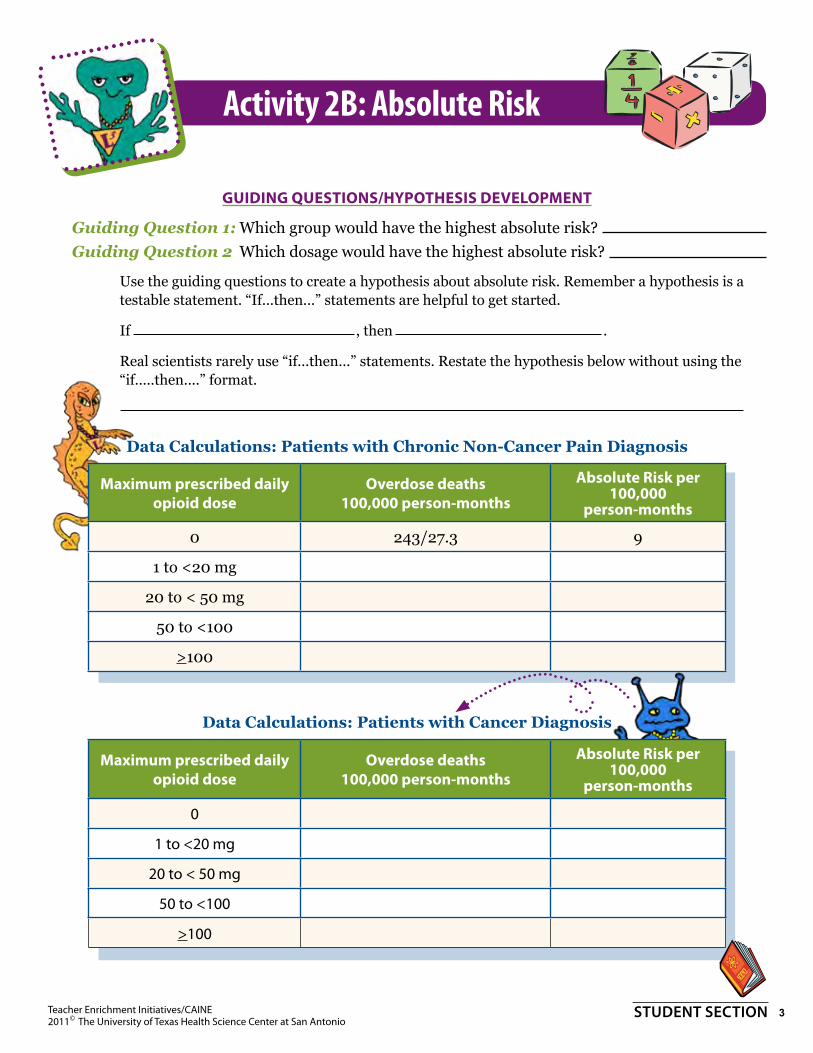
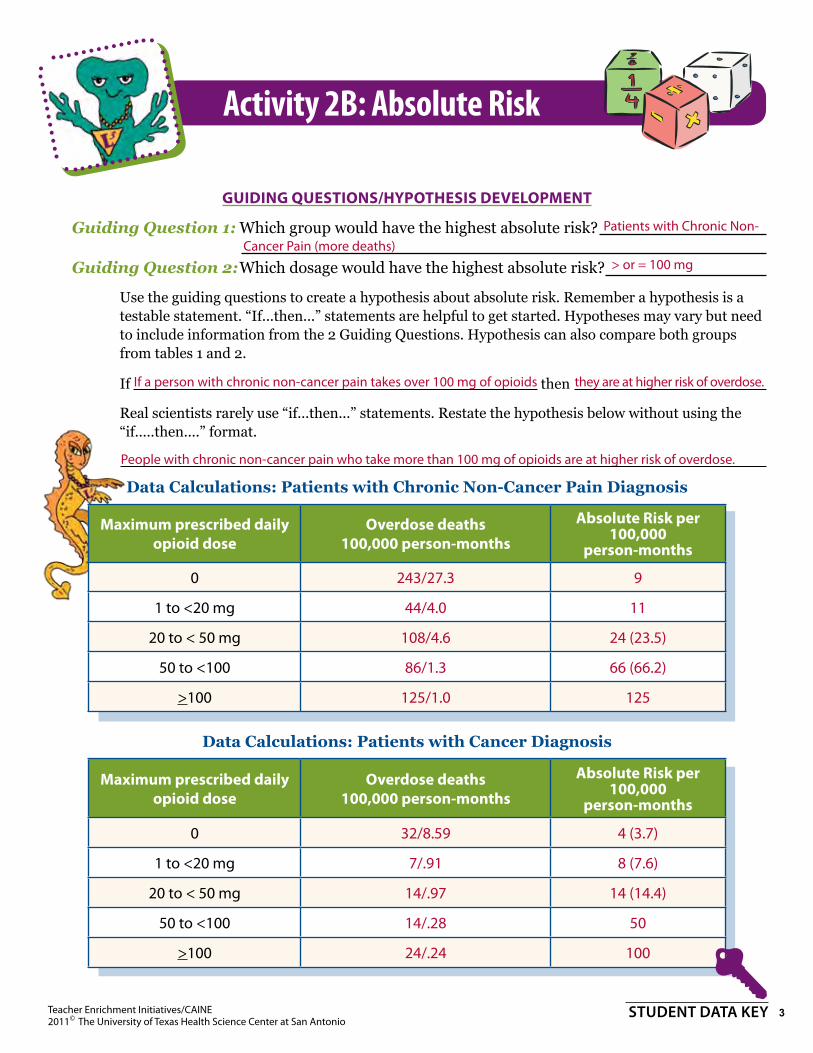
GuidingQuestion1:Which group would have the highest absolute risk? GuidingQuestion2Which dosage would have the highest absolute risk?
Use the guiding questions to create a hypothesis about absolute risk. Remember a hypothesis is a testable statement. “If...then...” statements are helpful to get started.
If________________________, then .
Real scientists rarely use “if...then...” statements. Restate the hypothesis below without using the “if.....then....” format.
Data Calculations: Patients with Chronic Non-Cancer Pain Diagnosis
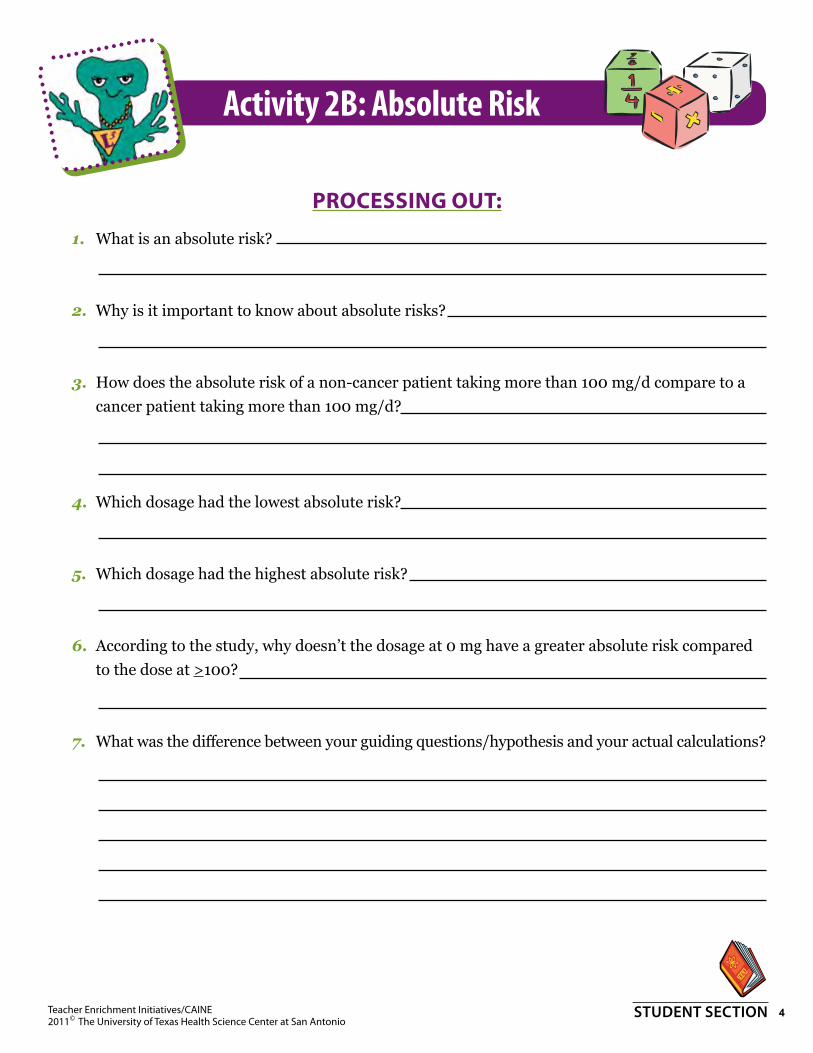
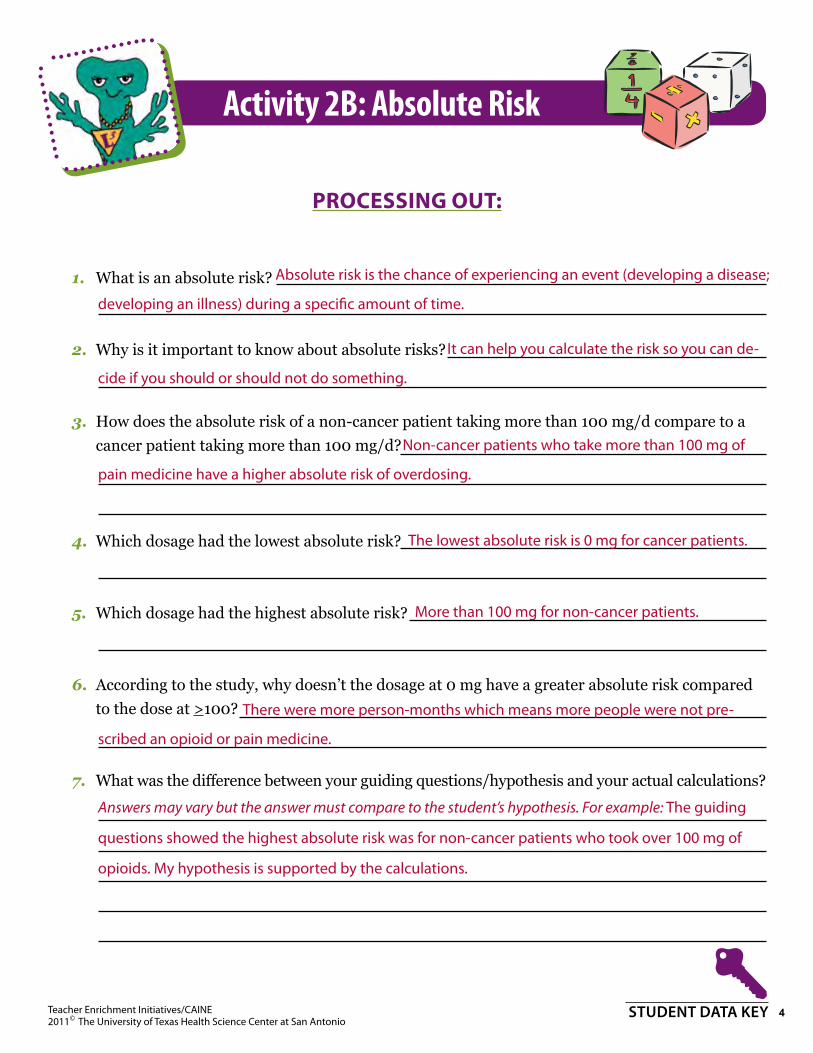
2. Why is it important to know about absolute risks?
3. How does the absolute risk of a non-cancer patient taking more than 100 mg/d compare to a cancer patient taking more than 100 mg/d?
4. Which dosage had the lowest absolute risk?
5. Which dosage had the highest absolute risk?
6. According to the study, why doesn’t the dosage at 0 mg have a greater absolute risk compared to the dose at >100?
7. What was the difference between your guiding questions/hypothesis and your actual calculations? ______________________________________________ ________________________________________________________ ________________________________________________________
(2) Scientific investigation and reasoning. The student uses scientific inquiry methods during laboratory and field investigations. The student is expected to:
(D) construct tables and graphs, using repeated trials and means, to organize data and identify patterns; and
(E) analyze data to formulate reasonable explanations, communicate valid conclusions supported by the data, and predict trends.
(3) Scientific investigation and reasoning. The student uses critical thinking, scientific reasoning, and problem solving to make informed decisions and knows the contributions of relevant scientists. The student is expected to:
(A) in all fields of science, analyze, evaluate, and critique scientific explanations by using empirical evidence, logical reasoning, and experimental and observational testing, including examining all sides of scientific evidence of those scientific explanations, so as to encourage critical thinking by the student; (D) relate the impact of research on scientific thought and society, including the history of science and contributions of scientists as related to the content.6th-8th
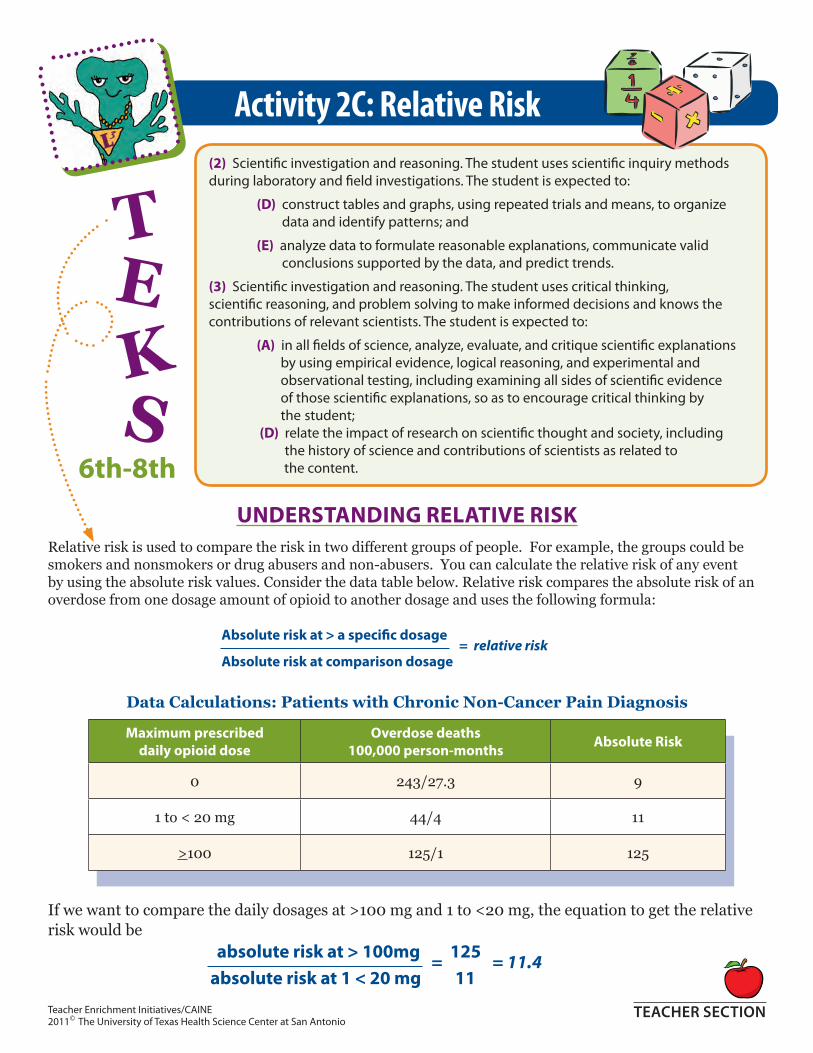
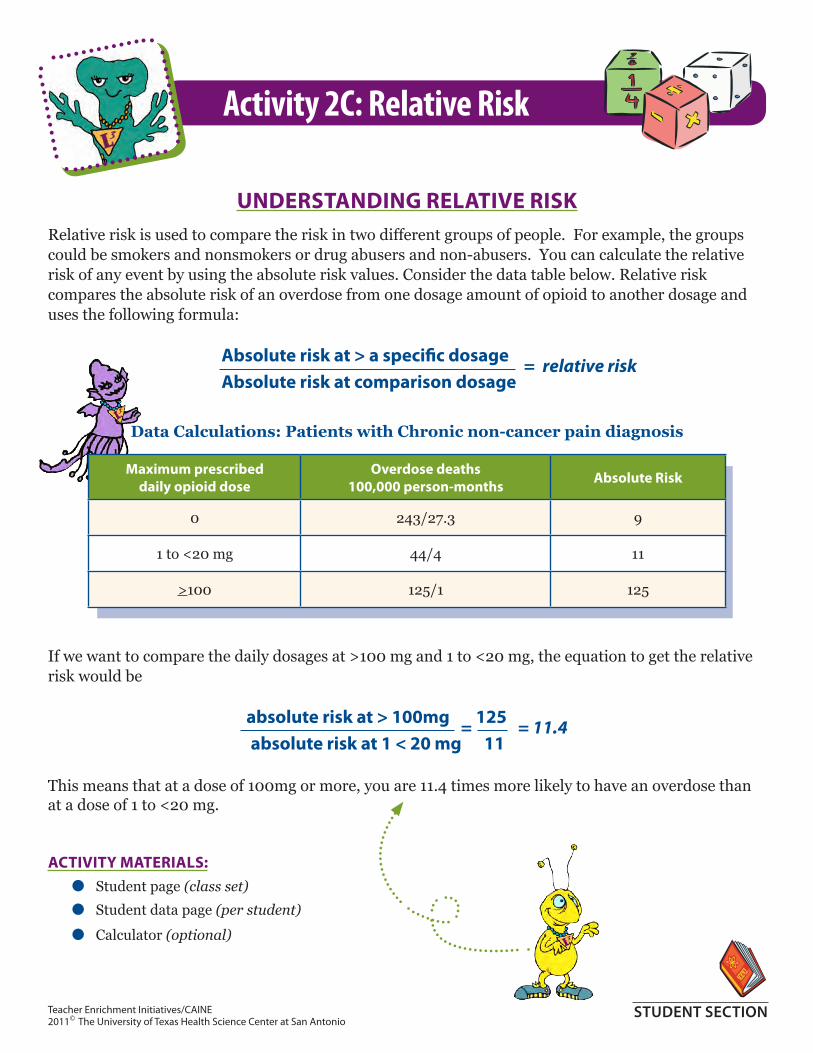
UNDERSTANDING RELATIVE RISKRelative risk is used to compare the risk in two different groups of people. For example, the groups could be smokers and nonsmokers or drug abusers and non-abusers. You can calculate the relative risk of any event by using the absolute risk values. Consider the data table below. Relative risk compares the absolute risk of an overdose from one dosage amount of opioid to another dosage and uses the following formula:
Absolute risk at > a specific dosage = relative risk
Absolute risk at comparison dosage
Data Calculations: Patients with Chronic Non-Cancer Pain Diagnosis
This means that at a dose of 100mg or more, you are 11.4 times more likely to have an overdose than at a dose of 1 to < 20 mg. (Explanation)
ACTIVITY SUGGESTIONS:
●● Students can work in pairs or individually
●● Calculators can be used for this activity
ACTIVITY EXTENSIONS:
●● Students can make graphs out of any of the data tables
RESOURCES:
Bohnert, A. S., Valenstein, M., Bair, M. J., Ganoczy, D., McCarthy, J. F., Ilegen, M. A., Blow, F. C. (2011). Association between opioid prescribing patterns and opioid overdose-related deaths. Journal of the American Medical Association, 305(13), 1315-1321. doi: 1315-1321. doi:10.1001/jama.2011.370.
Kyle, S. B., Nance, M. L., Rutherford, G. W., Winston, F. K. (2002). Skateboard-associated injuries: Participation-based estimates and injury characteristics. Journal of Trauma-Injury Infection and Critical Care. 53(4), 686-690.
UNDERSTANDING RELATIVE RISKRelative risk is used to compare the risk in two different groups of people. For example, the groups could be smokers and nonsmokers or drug abusers and non-abusers. You can calculate the relative risk of any event by using the absolute risk values. Consider the data table below. Relative risk compares the absolute risk of an overdose from one dosage amount of opioid to another dosage and uses the following formula:
Absolute risk at > a specific dosage = relative riskAbsolute risk at comparison dosage
Data Calculations: Patients with Chronic non-cancer pain diagnosis
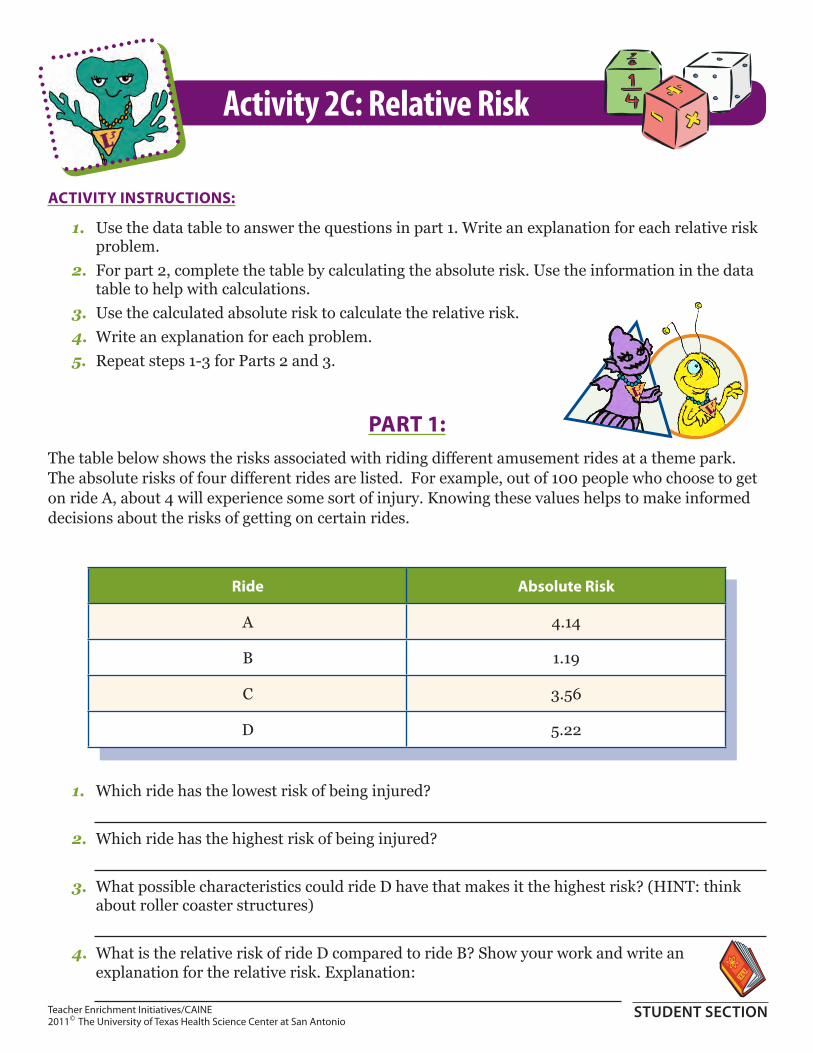
1. Use the data table to answer the questions in part 1. Write an explanation for each relative risk problem.
2. For part 2, complete the table by calculating the absolute risk. Use the information in the data table to help with calculations.
3. Use the calculated absolute risk to calculate the relative risk. 4. Write an explanation for each problem. 5. Repeat steps 1-3 for Parts 2 and 3.
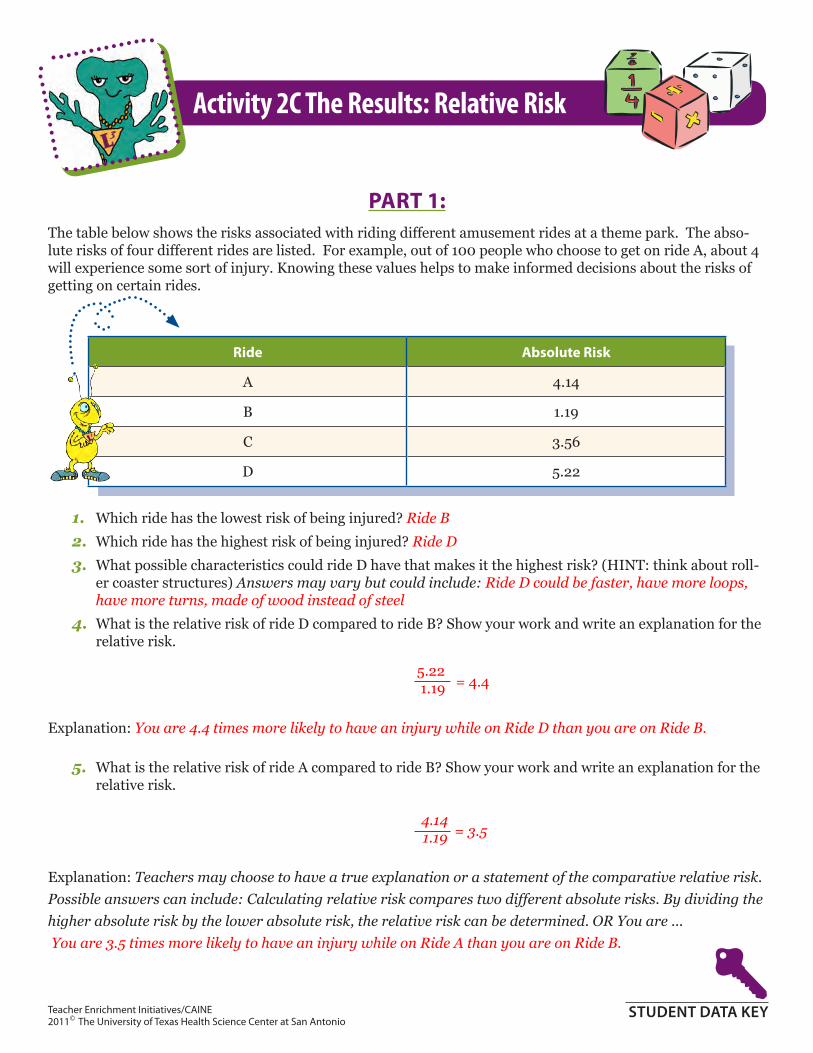
PART 1: The table below shows the risks associated with riding different amusement rides at a theme park. The absolute risks of four different rides are listed. For example, out of 100 people who choose to get on ride A, about 4 will experience some sort of injury. Knowing these values helps to make informed decisions about the risks of getting on certain rides.
Ride Absolute Risk
A 4.14
B 1.19
C 3.56
D 5.22
1. Which ride has the lowest risk of being injured?
2. Which ride has the highest risk of being injured?
3. What possible characteristics could ride D have that makes it the highest risk? (HINT: think about roller coaster structures)
4. What is the relative risk of ride D compared to ride B? Show your work and write an explanation for the relative risk. Explanation:
5. What is the relative risk of ride A compared to ride B? Show your work and write an explanation for the relative risk.
Explanation:
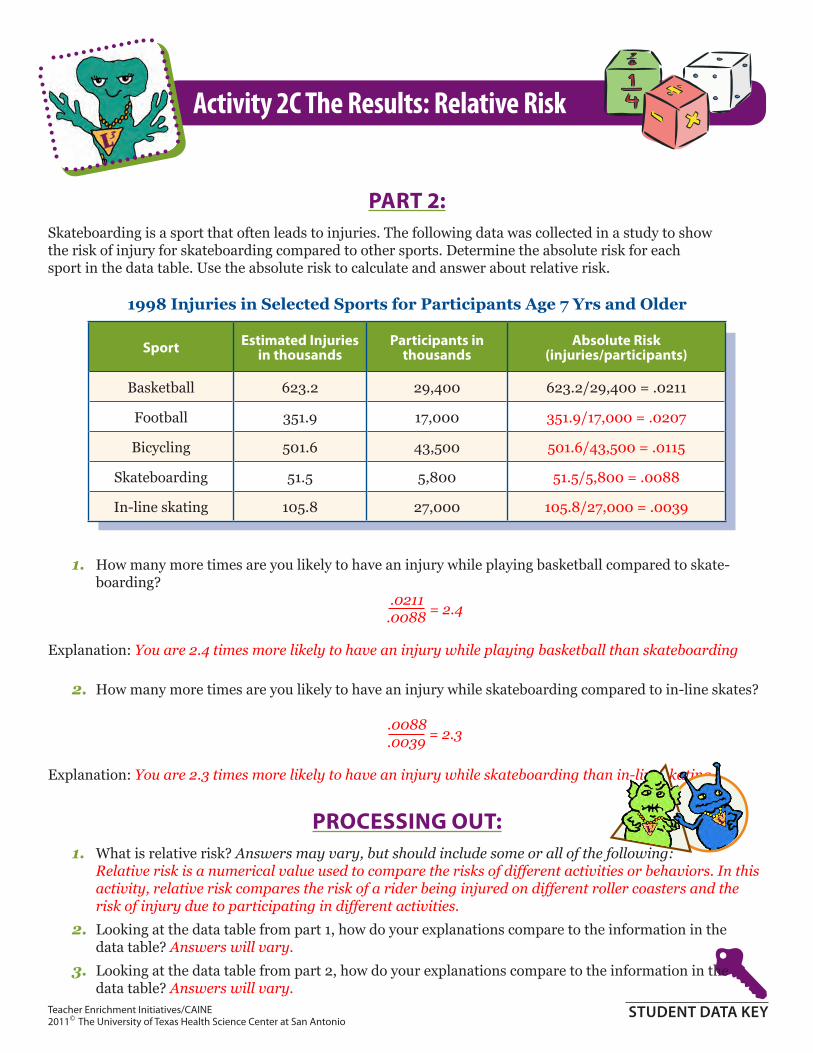
PART 2: Skateboarding is a sport that often leads to injuries. The following data was collected in a study to show the risk of injury for skateboarding compared to other sports. Determine the absolute risk for each sport in the data table. Use the absolute risk to calculate and answer about relative risk.
1998 Injuries in Selected Sports for Participants Age 7 Yrs and Older
SportEstimated Injuries in thousands
Participants in thousands
Absolute Risk(injuries/participants)
Basketball 623.2 29,400 623.2/29,400 = .02
Football 351.9 17,000
Bicycling 501.6 43,500
Skateboarding 51.5 5,800
In-line skating 105.8 27,000
1. How many more times are you likely to have an injury while playing basketball compared to skateboarding? Show your work.
Activity Description: Graphs are commonly used by scientists to compare and predict trends in data that is collected during an investigation. Two common types of graphs are line and bar graphs. Both types of graphs are needed to display different types of data. Line graphs are typically used to demonstrate a change in a variable over a certain amount of time. Bar graphs are used to show comparisons within the data.
Most graphs should include a title, key/legend, and titles for the x axis and y axis. The independent variable is located on the x-axis and the dependent variable is on the y-axis.
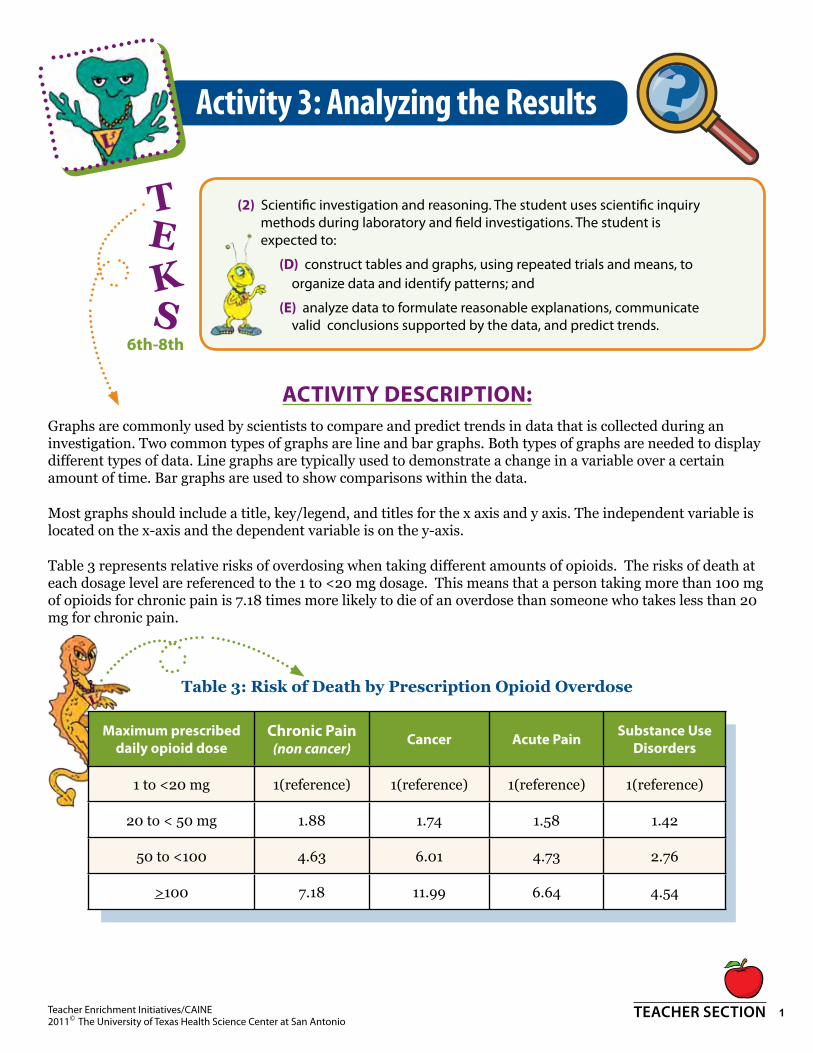
Table 3 represents relative risks of overdosing when taking different amounts of opioids. The risks of death at each dosage level are referenced to the 1 to <20 mg dosage. This means that a person taking more than 100 mg of opioids for chronic pain is 7.18 times more likely to die of an overdose than someone who takes less than 20 mg for chronic pain.
Table 3: Risk of Death by Prescription Opioid Overdose
Maximum prescribed daily opioid dose
chronic pain(non cancer)
cancer Acute pain substance Use Disorders
1 to <20 mg 1(reference) 1(reference) 1(reference) 1(reference)
20 to < 50 mg 1.88 1.74 1.58 1.42
50 to <100 4.63 6.01 4.73 2.76
>100 7.18 11.99 6.64 4.54
(2) Scientific investigation and reasoning. The student uses scientific inquiry methods during laboratory and field investigations. The student is expected to:
(D) construct tables and graphs, using repeated trials and means, to organize data and identify patterns; and
(e) analyze data to formulate reasonable explanations, communicate valid conclusions supported by the data, and predict trends.
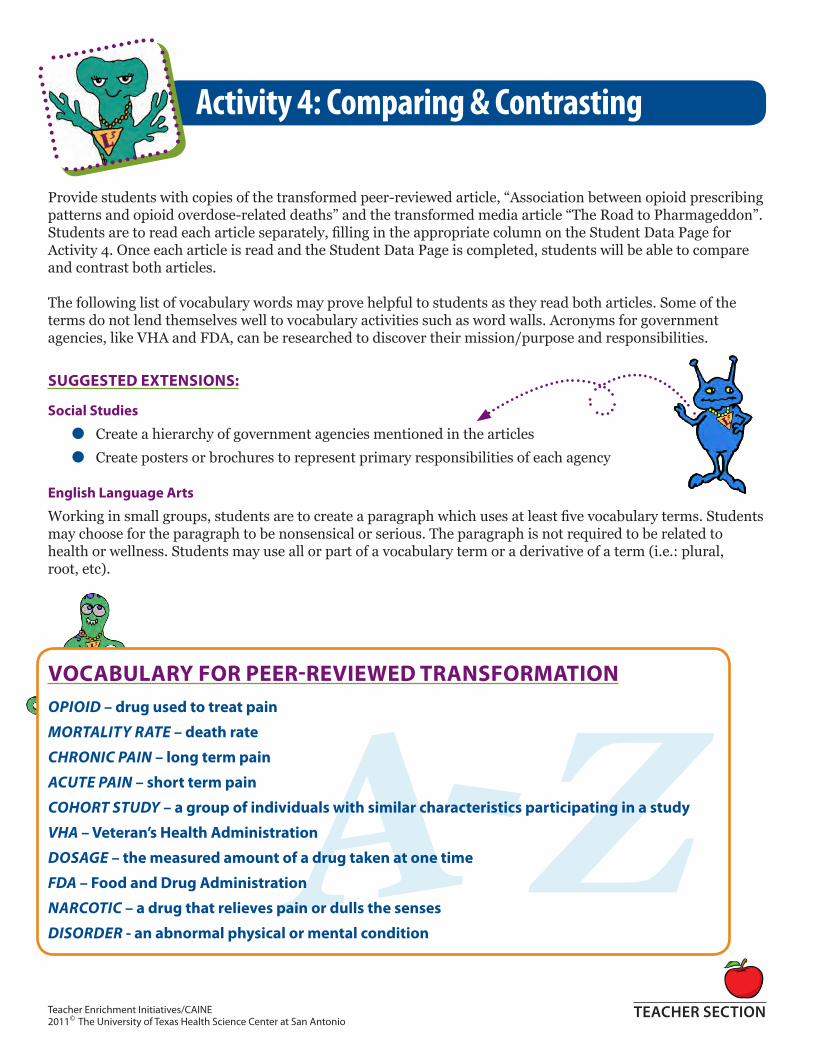
Provide students with copies of the transformed peer-reviewed article, “Association between opioid prescribing patterns and opioid overdose-related deaths” and the media article “Pharma-geddon: How America got hooked on killer prescription drugs”. Students are to read each article separately, filling in the ap-propriate column on the Student Data Page for Activity 4. Once each article is read and the Student Data Page is completed, students will be able to compare and contrast both articles.
The following list of vocabulary words may prove helpful to stu-dents as they read both articles. Some of the terms do not lend themselves well to vocabulary activities such as word walls. Ac-ronyms for government agencies, like VHA and FDA, can be re-searched to discover their mission/purpose and responsibilities.
Suggested Extensions:
Social Studies
• Create a hierarchy of government agencies discussed in the articles
• Create posters or brochures to represent primary respon-sibilities of each agency
English Language Arts
Working in small groups, students are to create a paragraph which uses at least five vocabulary terms. Students may choose for the paragraph to be nonsensical or serious. The paragraph is not required to be related to health or wellness. Students may use all or part of a vocabulary term or a derivative of a term (i.e.: plural, root, etc).
Vocabulary for Peer-reviewed Transformation
Activity 4: Comparing & Contrasting Teacher Support Information
●● Provide graph paper or have students construct their own.
●● Activity can be completed after reading the transformation peer-reviewed article.
●● If available, students can use Excel or graphing calculators to graphically represent the data.
extension:
●● Assign a sub group to each group (2-4) and have them write a conclusion based on the data. Student groups can report out the conclusions class.
AUthors/pUblicAtion inforMAtion:
Bohnert, A. S., Valenstein, M., Bair, M. J., Ganoczy, D., McCarthy, J. F., Ilegen, M. A., Blow, F. C. (2011). Association between opioid prescribing patterns and opioid overdose-related deaths. Journal of the American Medical Association, 305(13), 1315-1321. doi: 1315-1321. doi:10.1001/jama.2011.370.
References:
Bohnert, A. S., Valenstein, M., Bair, M. J., Ganoczy, D., McCarthy, J. F., Ilegen, M. A., Blow, F. C. (2011). Association between opioid prescribing patterns and opioid overdose-related deaths. Journal of the American Medical Association, 305(13), 1315-1321. doi: 1315-1321.doi:10.1001/jama.2011.370.
Chronic pain: Opioids and chronic pain. NIH Medline Plus. Spring 2011, 6(1). Retrieved July 11, 2011, from http://www.nlm.nih.gob/medlinplus/magazine/issues/spring11/articles/spring11pg4.html.
Dunn, K. M., Saunders, K. W., Rutter, C. M., Banta-Green, C. J., Merrill, J. O., Sullivan, M. D.,. . . Von Korff, M. (2010). Overdose and prescribed opioids: Associations among chronic non-cancer pain patients. Annals of Internal Medicine, 152(2), 85-92. doi: 10.1059/0003-4819-152-2-201001190-00006.
FDA acts to reduce harm from opioid drugs. U.S. Food and Drug Administration. Retrieved July 11, 2011, from http://www.fda.gov./ForConsumers/ConsumerUpdates/ucm251830.htm
How do opioids work in the brain? The National Alliance of Advocates for Buprenorphine Treatment. December 2008. Retrieved on July 11, 2011 from http://www.naabt.org/faq_answers.cfm?ID=6.
Malbran, P. (2007, May 31). What’s a pill mill? CBS News. Retrieved on July 11, 2007 from http://www.cbsnews.com/8301-501263_162-2872835-501263.html#ixzz1QbSZC4V0.
Pilkington, E. (2011, June 9). Pharmageddon: How America got hooked on killer prescription drugs. The Guardian. Retrieved from http://www.guardian.co.uk/world/2011/jun/09/us-drugs-oxycodone-painkillers-florida?INTCMP=SRCH.
Tucker, T. (2009, July 5). Why does the brain contain opioid receptors? Lexington Herald-Leader, C6. Retrieved from http://www.addictionsurvivors.org/vbulletin/showthread.php?t=21931.
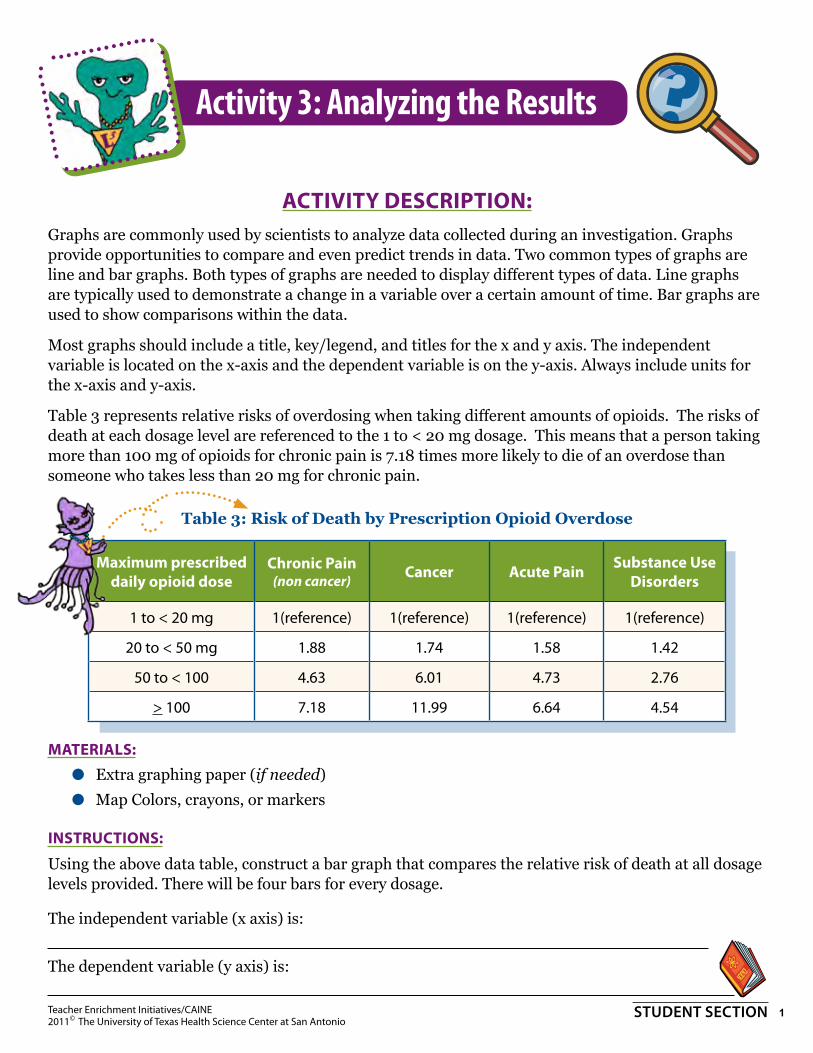
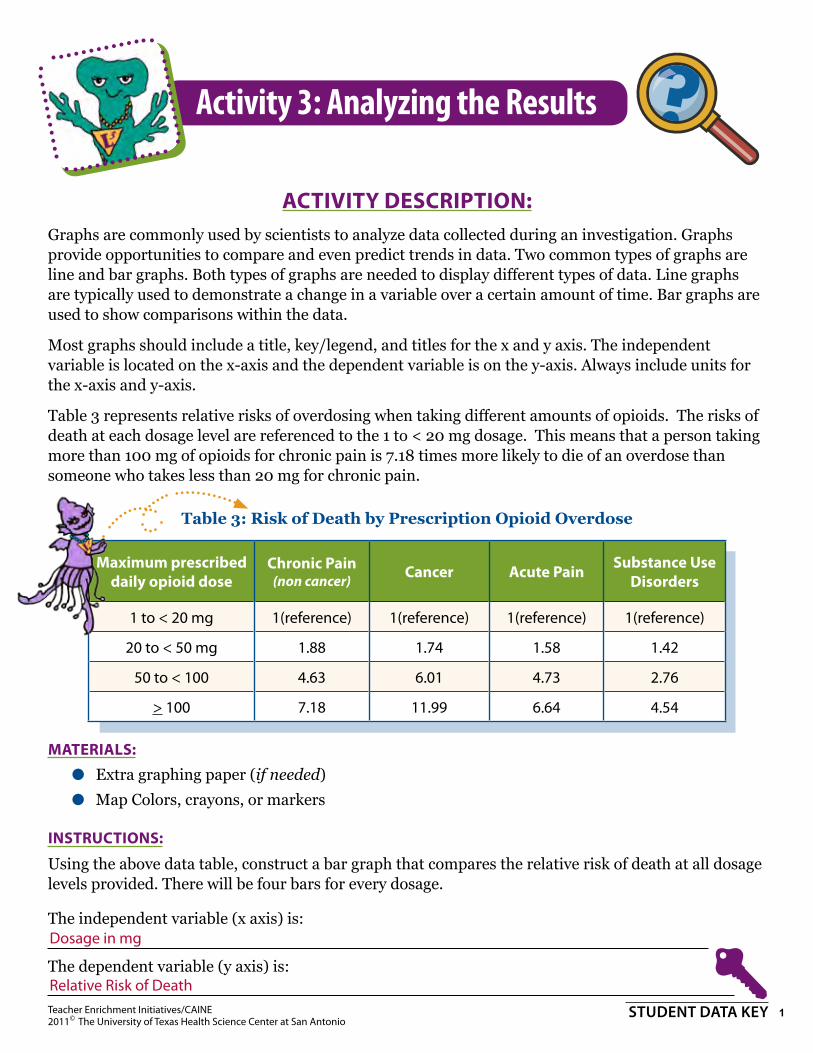
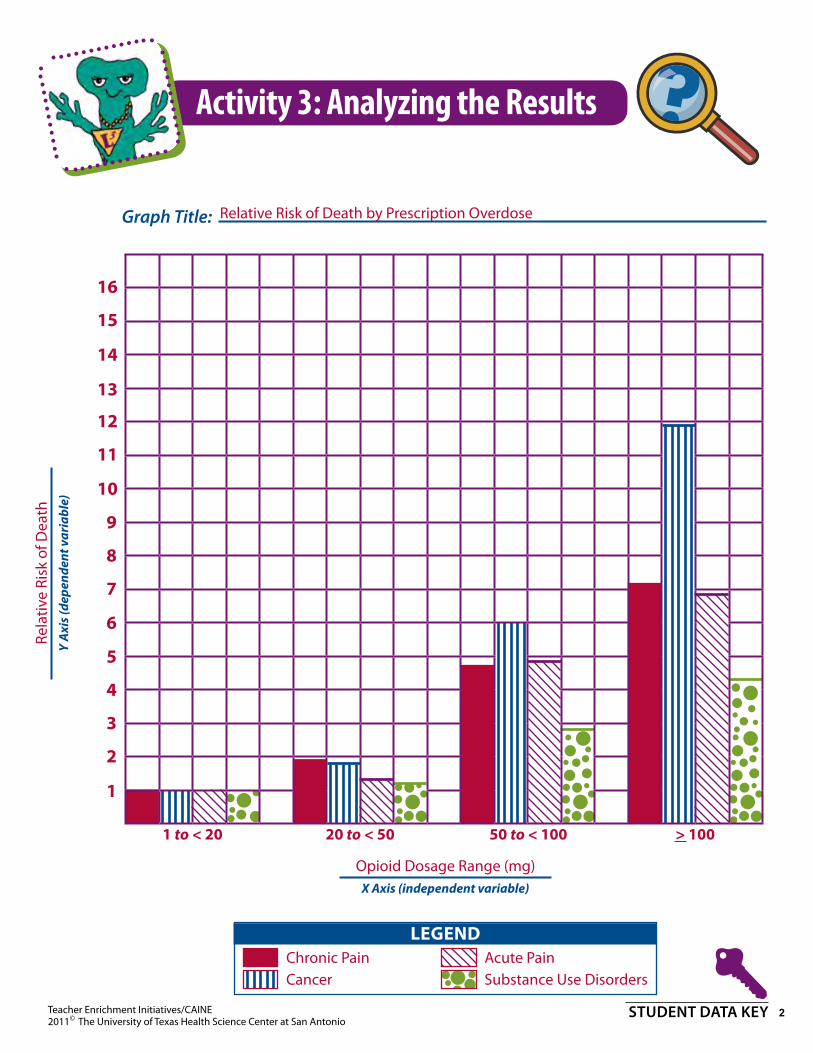
Activity Description: Graphs are commonly used by scientists to analyze data collected during an investigation. Graphs provide opportunities to compare and even predict trends in data. Two common types of graphs are line and bar graphs. Both types of graphs are needed to display different types of data. Line graphs are typically used to demonstrate a change in a variable over a certain amount of time. Bar graphs are used to show comparisons within the data.
Most graphs should include a title, key/legend, and titles for the x and y axis. The independent variable is located on the x-axis and the dependent variable is on the y-axis. Always include units for the x-axis and y-axis.
Table 3 represents relative risks of overdosing when taking different amounts of opioids. The risks of death at each dosage level are referenced to the 1 to < 20 mg dosage. This means that a person taking more than 100 mg of opioids for chronic pain is 7.18 times more likely to die of an overdose than someone who takes less than 20 mg for chronic pain.
Table 3: Risk of Death by Prescription Opioid Overdose
Maximum prescribed daily opioid dose
chronic pain(non cancer) cancer Acute pain substance Use
Disorders
1 to < 20 mg 1(reference) 1(reference) 1(reference) 1(reference)
20 to < 50 mg 1.88 1.74 1.58 1.42
50 to < 100 4.63 6.01 4.73 2.76
> 100 7.18 11.99 6.64 4.54
MAteriAls:
●● Extra graphing paper (if needed)
●● Map Colors, crayons, or markers
instrUctions:
Using the above data table, construct a bar graph that compares the relative risk of death at all dosage levels provided. There will be four bars for every dosage.
Provide students with copies of the transformed peer-reviewed article, “Association between opioid prescribing patterns and opioid overdose-related deaths” and the transformed media article “The Road to Pharmageddon”. Students are to read each article separately, filling in the appropriate column on the Student Data Page for Activity 4. Once each article is read and the Student Data Page is completed, students will be able to compare and contrast both articles.
The following list of vocabulary words may prove helpful to students as they read both articles. Some of the terms do not lend themselves well to vocabulary activities such as word walls. Acronyms for government agencies, like VHA and FDA, can be researched to discover their mission/purpose and responsibilities.
SUGGESTED EXTENSIONS:
Social Studies
●● Create a hierarchy of government agencies mentioned in the articles
●● Create posters or brochures to represent primary responsibilities of each agency
English Language Arts
Working in small groups, students are to create a paragraph which uses at least five vocabulary terms. Students may choose for the paragraph to be nonsensical or serious. The paragraph is not required to be related to health or wellness. Students may use all or part of a vocabulary term or a derivative of a term (i.e.: plural, root, etc).
VOCABULARY FOR PEER-REVIEWED TRANSFORMATIONOPIOID – drug used to treat pain
MORTALITY RATE – death rate
CHRONIC PAIN – long term pain
ACUTE PAIN – short term pain
COHORT STUDY – a group of individuals with similar characteristics participating in a study
VHA – Veteran’s Health Administration
DOSAGE – the measured amount of a drug taken at one time
FDA – Food and Drug Administration
NARCOTIC – a drug that relieves pain or dulls the senses
DISORDER - an abnormal physical or mental condition
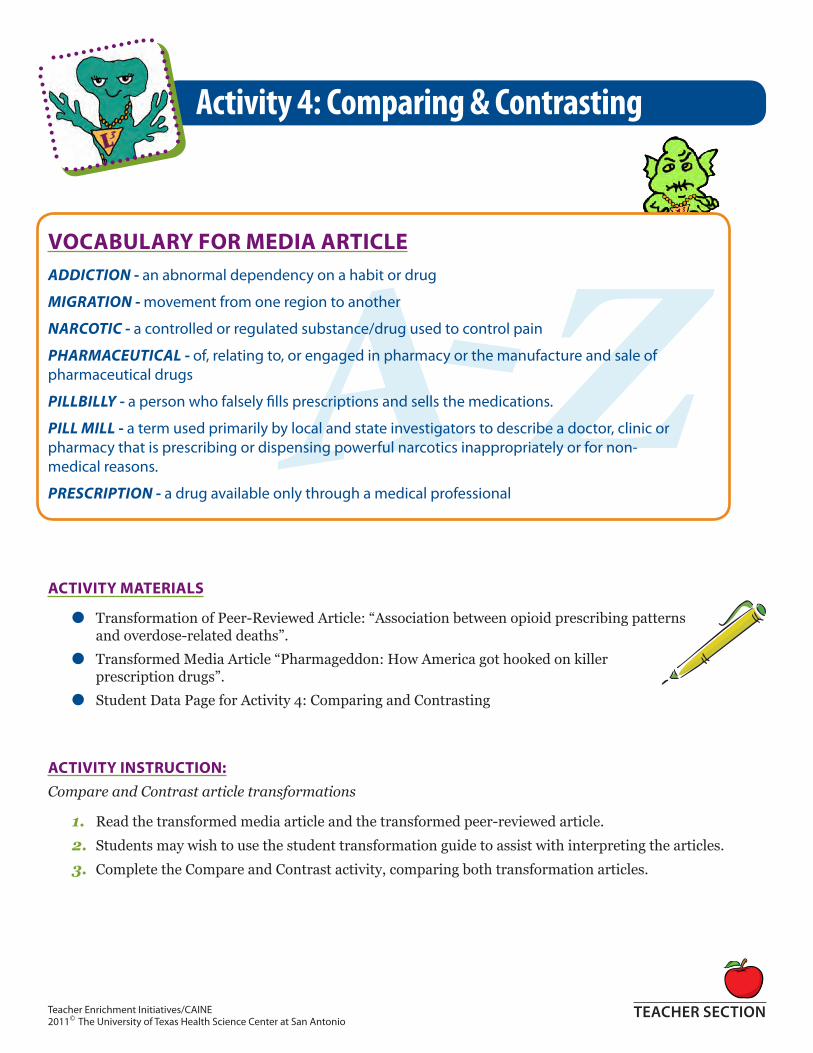
VOCABULARY FOR MEDIA ARTICLEADDICTION - an abnormal dependency on a habit or drug
MIGRATION - movement from one region to another
NARCOTIC - a controlled or regulated substance/drug used to control pain
PHARMACEUTICAL - of, relating to, or engaged in pharmacy or the manufacture and sale of pharmaceutical drugs
PILLBILLY - a person who falsely fills prescriptions and sells the medications.
PILL MILL - a term used primarily by local and state investigators to describe a doctor, clinic or pharmacy that is prescribing or dispensing powerful narcotics inappropriately or for non- medical reasons.
PRESCRIPTION - a drug available only through a medical professional
ACTIVITY MATERIALS
●● Transformation of Peer-Reviewed Article: “Association between opioid prescribing patterns and overdose-related deaths”.
●● Transformed Media Article “Pharmageddon: How America got hooked on killer prescription drugs”.
●● Student Data Page for Activity 4: Comparing and Contrasting
ACTIVITY INSTRUCTION: Compare and Contrast article transformations
1. Read the transformed media article and the transformed peer-reviewed article.
2. Students may wish to use the student transformation guide to assist with interpreting the articles.
3. Complete the Compare and Contrast activity, comparing both transformation articles.
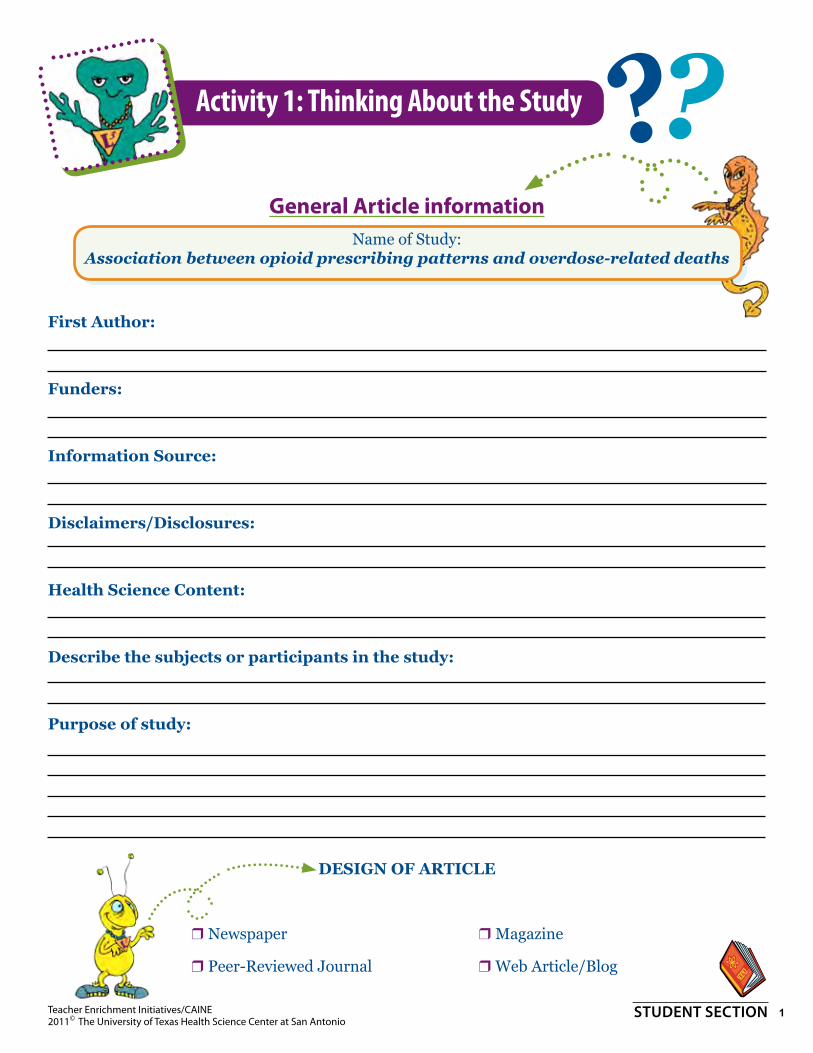
Association between opioid prescribing patterns and overdose-related deaths
First Author:
Funders:
Information Source:
Disclaimers/Disclosures:
Health Science Content:
Describe the subjects or participants in the study:
Purpose of study:
DeSIgn oF ArtICle
r Newspaper r Magazine
r Peer-Reviewed Journal r Web Article/Blog
Student Data Page
Lesson 1: Thinking About the Study
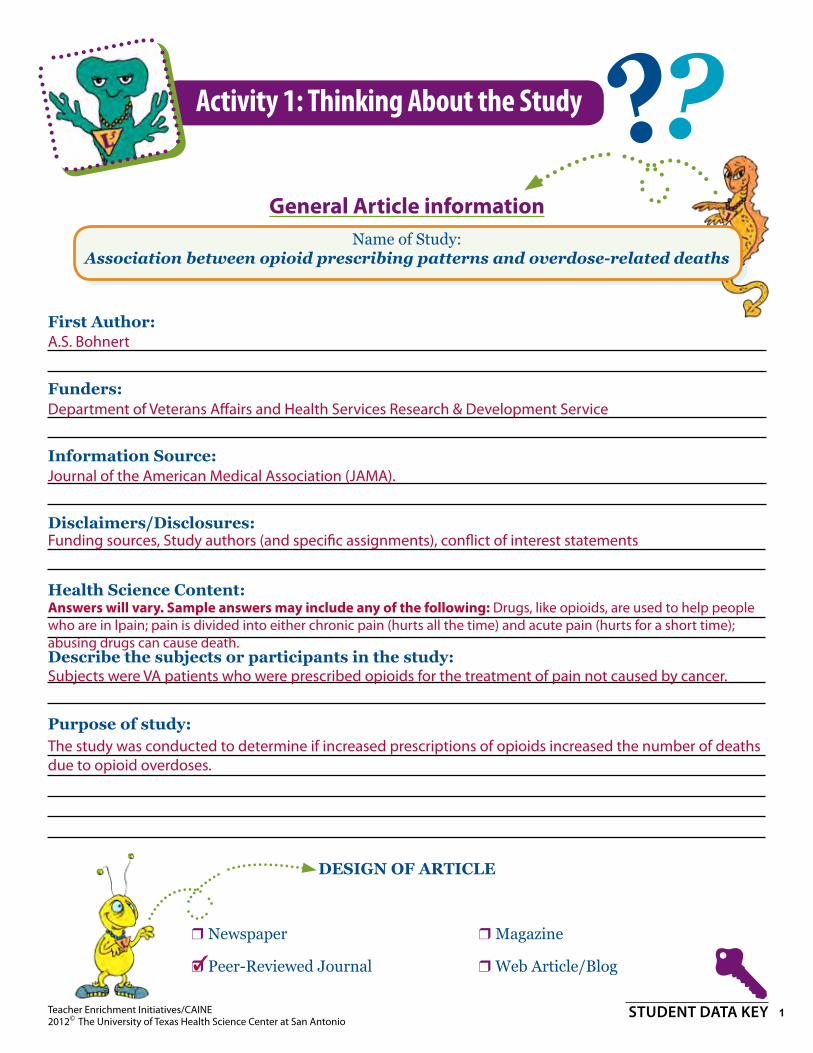
A.S. Bohnert
Department of Veterans Affairs and Health Services Research & Development Service
Journal of the American Medical Association (JAMA).
Funding sources, Study authors (and specific assignments), conflict of interest statements
Subjects were VA patients who were prescribed opioids for the treatment of pain not caused by cancer.
The study was conducted to determine if increased prescriptions of opioids increased the number of deaths due to opioid overdoses.
Answers will vary. Sample answers may include any of the following: Drugs, like opioids, are used to help people who are in lpain; pain is divided into either chronic pain (hurts all the time) and acute pain (hurts for a short time); abusing drugs can cause death.
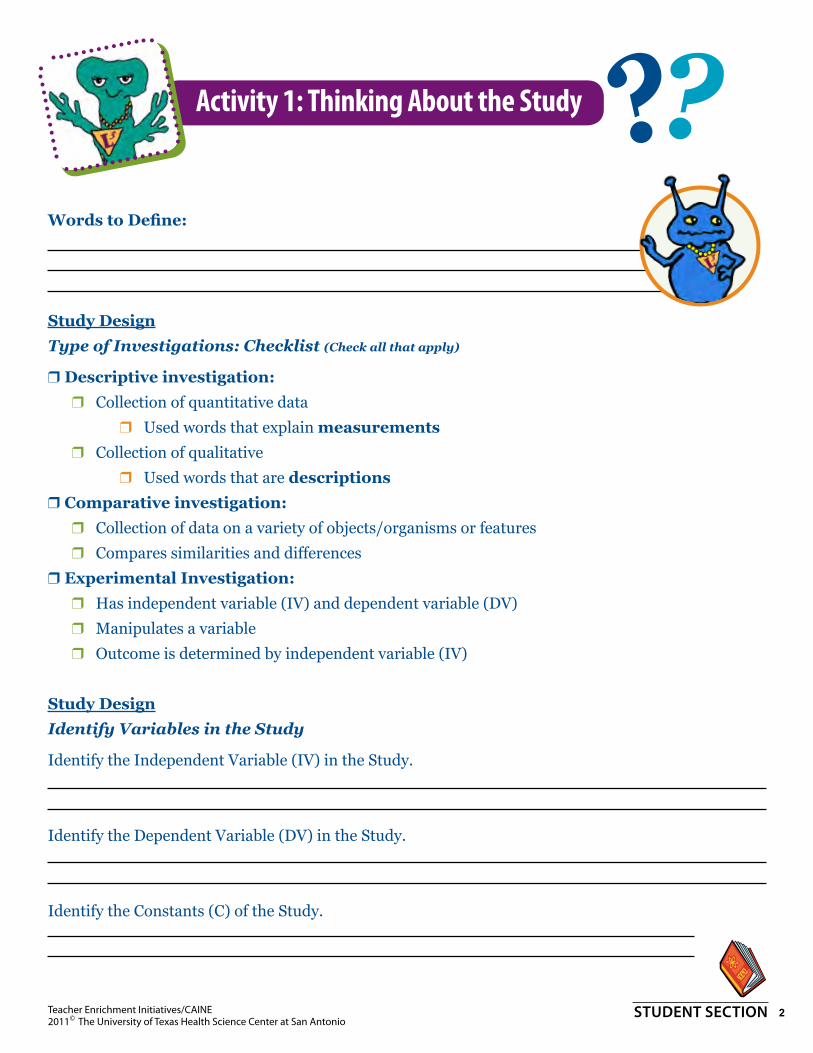
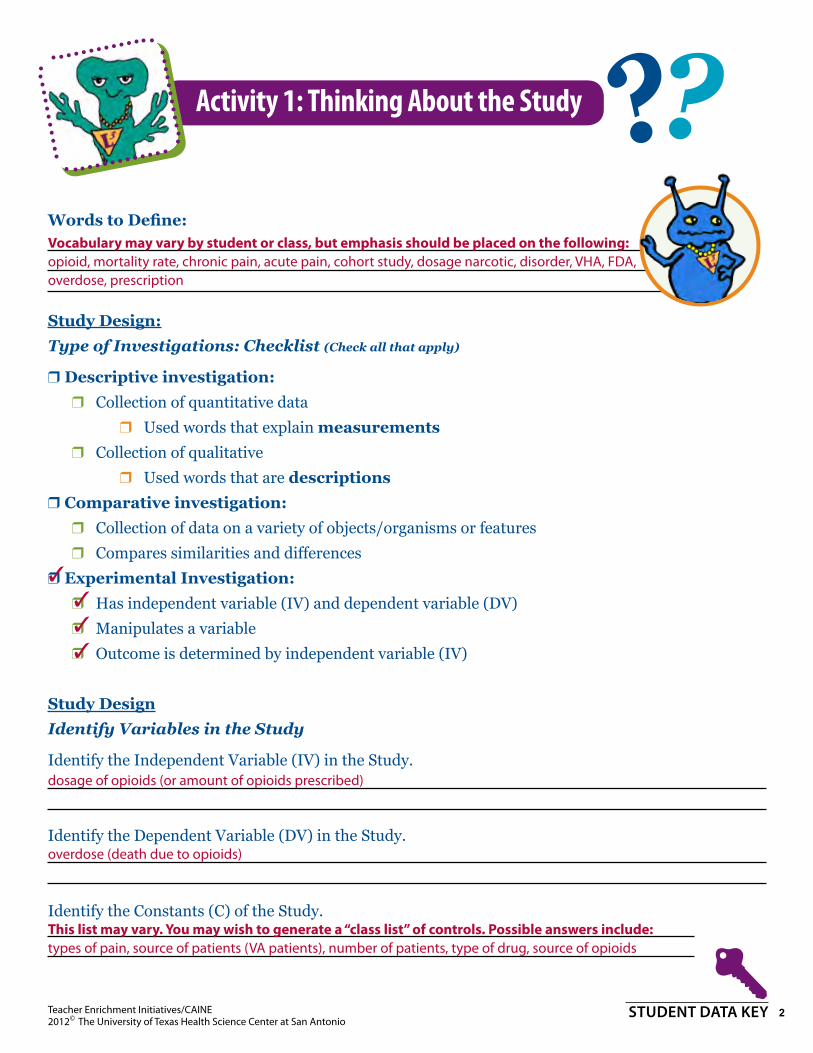
Study Design: Type of Investigations: Checklist (Check all that apply)
r Descriptive investigation: rCollection of quantitative data
rUsed words that explain measurements rCollection of qualitative
rUsed words that are descriptionsr Comparative investigation:
rCollection of data on a variety of objects/organisms or features
rCompares similarities and differences
r experimental Investigation:rHas independent variable (IV) and dependent variable (DV)
rManipulates a variable
rOutcome is determined by independent variable (IV)
Study DesignIdentify Variables in the Study
Identify the Independent Variable (IV) in the Study.
Identify the Dependent Variable (DV) in the Study.
Identify the Constants (C) of the Study.
Vocabulary may vary by student or class, but emphasis should be placed on the following:opioid, mortality rate, chronic pain, acute pain, cohort study, dosage narcotic, disorder, VHA, FDA, overdose, prescription
This list may vary. You may wish to generate a “class list” of controls. Possible answers include:types of pain, source of patients (VA patients), number of patients, type of drug, source of opioids
dosage of opioids (or amount of opioids prescribed)
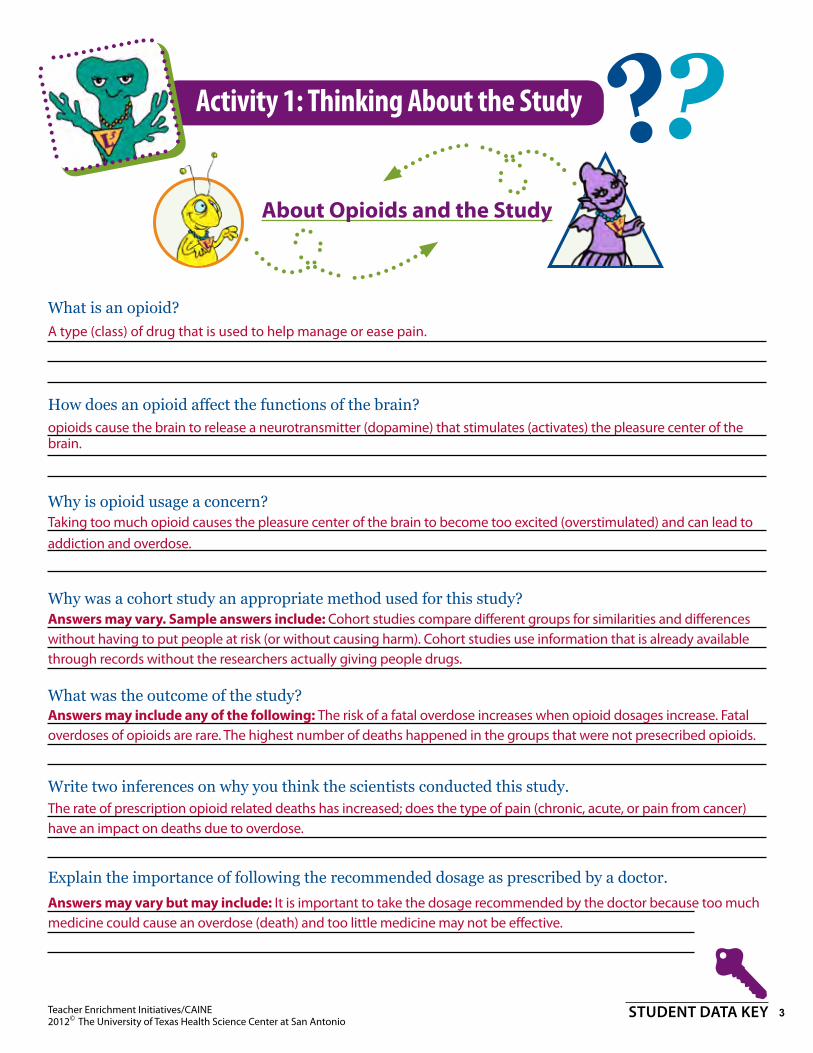
How does an opioid affect the functions of the brain?
Why is opioid usage a concern?
Why was a cohort study an appropriate method used for this study?
What was the outcome of the study?
Write two inferences on why you think the scientists conducted this study.
Explain the importance of following the recommended dosage as prescribed by a doctor.
A type (class) of drug that is used to help manage or ease pain.
opioids cause the brain to release a neurotransmitter (dopamine) that stimulates (activates) the pleasure center of the brain.
Answers may vary. Sample answers include: Cohort studies compare different groups for similarities and differences without having to put people at risk (or without causing harm). Cohort studies use information that is already available through records without the researchers actually giving people drugs.
Answers may include any of the following: The risk of a fatal overdose increases when opioid dosages increase. Fatal overdoses of opioids are rare. The highest number of deaths happened in the groups that were not presecribed opioids.
The rate of prescription opioid related deaths has increased; does the type of pain (chronic, acute, or pain from cancer) have an impact on deaths due to overdose.
Answers may vary but may include: It is important to take the dosage recommended by the doctor because too much medicine could cause an overdose (death) and too little medicine may not be effective.
Taking too much opioid causes the pleasure center of the brain to become too excited (overstimulated) and can lead to addiction and overdose.
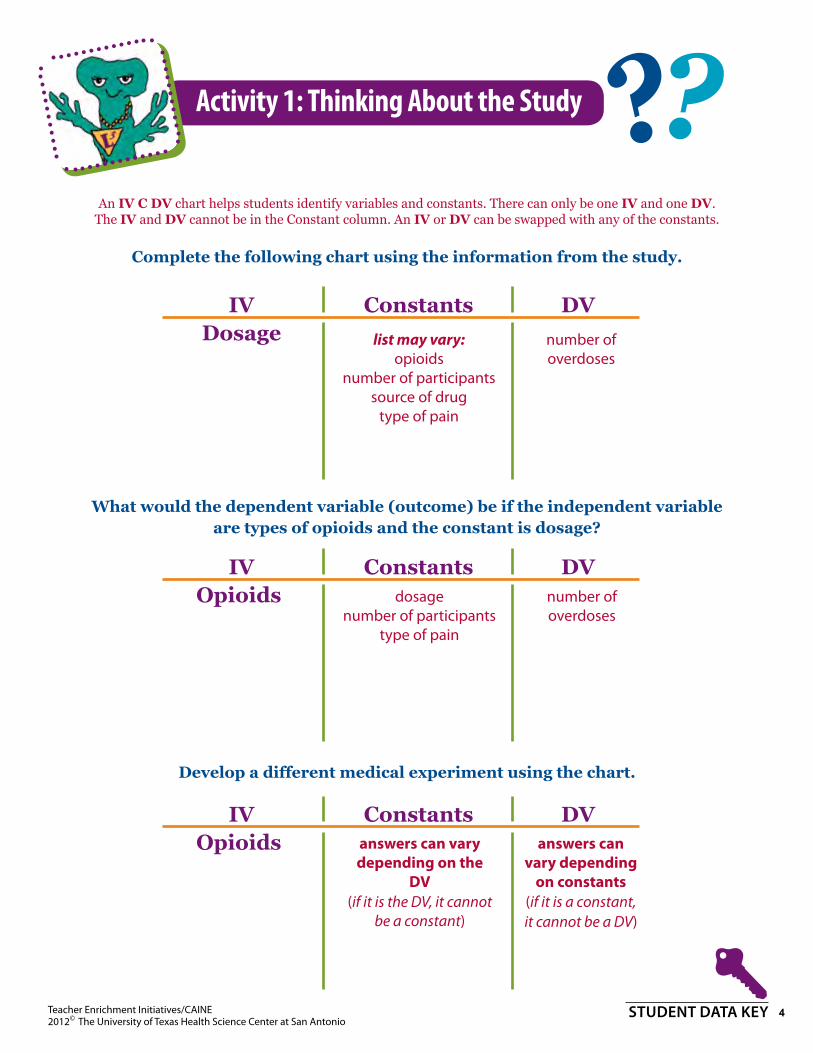
Complete the following chart using the information from the study.
What would the dependent variable (outcome) be if the independent variable are types of opioids and the constant is dosage?
Develop a different medical experiment using the chart.
Constants DVIVDosage
Constants DVIVopioids
Constants DVIVopioids
An IV C DV chart helps students identify variables and constants. There can only be one IV and one DV. The IV and DV cannot be in the Constant column. An IV or DV can be swapped with any of the constants.
list may vary:opioids
number of participantssource of drug
type of pain
dosagenumber of participants
type of pain
answers can vary depending on the
DV(if it is the DV, it cannot
be a constant)
answers can vary depending
on constants(if it is a constant, it cannot be a DV)
number of overdoses
number of overdoses
Activity 2A: The Results—Person Time/Person Months
Understanding “Person-time”Person-time refers to all the people in a study who are exposed to a medicine in a given amount of time. Person time can be measured in as person-months, person-years, or person-hours; it depends on the exposure of the drug. During a cohort study patients may be taking different amounts of a drug at various times. Person-months would be calculated by adding the total number of months each person is taking the drug over a given time. For example, patients A, B, and C were prescribed a drug over a six month period. In order to calculate the total exposure of the drug in the study, add the total number of months prescribed for each patient. The following diagram is an example of how to understand person-months after: Consider following diagram:
The above diagram represents data collected during a six month cohort study. Each interval, the blue boxes, represent a one month period. Imagine each interval represents a one month period. What would be the total exposure of the drug for all three patients over the six month period? In other words, what are the person-months for this study? To determine person-months, count up the total number of months each person was using the drug. Then add these values together to determine person months. In this case, the study was conducted over a six month period and involved three participants. Patients A and B used the drug for 4 months. Patient C used the drug for three months. Person-months = 4 + 4 + 3. Therefore, the total person-months for this study is 11 months.
You can also calculate person-months per dosage using this information. For example, at a dosage of 20 mg, it is 5 since a dosage of 20 mg was prescribed a total of 5 times for all participants in the six month study.
1. Handout the first set of scenario cards to each group. 2. Record the dosages for each person into the appropriate data table. 3. Calculate the total person months for each dosage and write it in the appropriate data table. 4. Repeat steps 1 and 2 for Part 2 using the 2nd set of scenario cards. 5. Create a table to record the total person-months for each dosage. Record your data.6. Answer the questions.7. Create the data tables needed to complete Part 3. 8. Repeat steps 1, 2, and 3 for the 3rd set of scenario cards. 9. Answer the processing out questions.
Activity 2A: The Results—Person Time/Person Months
January(500mg), February(500mg), april(660mg), July(660mg), september(820mg) and
october(820mg).
will.i.AmWill.i.am took 500mg of aspirin in march, april, June,
July and 980mg in november.
tAbootaboo recounted that he took 660mg of aspirin in
may, June and december.
Apl.de.Apapl.de.ap took the most aspirin of everyone. He said that he remembers taking aspirin all year except for the month of may. during the first half of the year he took 660mg and 980mg the second half of the year.
Autumnautumn remembers taking 500mg of aspirin for the
first three months of the year and 820mg the last three months of the year.
Summersummer would only take aspirin during the summer months of June-august. she started with 500mg the
first month and increased her dose by 160mg each month.
Activity 2A: The Results—Person Time/Person Months
bArtBart stated he liked playing video games the most. He definitely played on the weekend for at least 4 hours. during the school week he remembered that he had a football game on tuesday and a school activity on thursday. He knows that he did not play any video games on monday. on Wednesday he thinks he played about an hour and on Friday he was excited because it was the weekend so he stayed up all night playing video games. He estimates that it was about 5 hours on Friday.
mAggiemaggie said she was not into video games a lot and only liked to play for a little while. she didn’t play on the weekend because her family was out of town to visit relatives. on monday she was tired because it was the start of the school week so she didn’t play anything. on tuesday she played with her little brother for an hour. Her brother still wanted to play so on Wednesday she played with him for another hour. on thursday she was too tired to play. on Friday her mom bought her a new video game so she ended up playing for about 3 hours.
liSAlisa said that she liked playing video games but didn’t always have time because of extra-curricular activities. over the weekend she played for two hours. during the week she wanted to play more but was busy. on monday she only got to play for an hour. on tuesday she had to go shopping with her mom. on Wednesday she had projects to do at school so wasn’t able to play. she remembered playing on thursday and Friday at her friend’s house. Her friend got two new games and they decided to play as much as they could. they played each video game for about two hours each day.
aCtivity: 1Six friends recorded the number of times they took aspirin for pain during the span of one calendar year. At the end of the year they got together to see what their results were. What would be the total number of person-months for each group at different dosages? In data table 1, record the dosage for each person in the appropriate month. Add the total number of months for each dosage to complete data table 2.
table1: dosage of Aspirin Total person months = _______________
Friends Jan. Feb. Mar. Apr. May June July Aug. Sept. Oct. Nov. Dec.
Adam 80 180 160
Susan 100 100
Jason 180 80 100 80
maria 160 160 160 160 180 180
Valerie 80 80 80 80 80 100
robert 180 180 80 80 160 160
table 2: person-months per Aspirin dosage
aspirin dosage Person-months
80 mg
100 mg
160 mg
180 mg
* teachers: due to size of answer boxes, students may or may not include “mg” as part of their answers.
aCtivity: 2 Six different friends recorded the number of times they took aspirin for pain during the span of one calendar year. At the end of the year they got together to see what their results were. What would be the total number of person months for each group at different dosages? In data table 1, record the dosage for each person in the appropriate month. Add the total number of months for each dosage to complete data table 2.
table 1: dosage of Aspirin Total person months = _______________
Friends Jan. Feb. Mar. Apr. May June July Aug. Sept. Oct. Nov. Dec.
1. What are the total person months for the amount of aspirin exposure for the entire study?
2. Which dosage has the most person months?
3. Which month(s) had the least amount of aspirin taken?
4. Which month(s) had the most amount of aspirin taken?
5. Why do you think the most aspirin was taken at this time of year?
6. Would the data collected be a good representation of all middle school students? Explain.
aCtivity 3
Three friends got together to play video games. They wondered how many hours they spent playing games for the past week. They calculated how many person hours were spent playing video games. What would be the total number of person-hours for each person? What is the total number of person-hours for the group?
table 3: person-Hours for playing Video games
Total person-hours = _____________________________
teachers: Students need to construct a data table reflecting the time each person played video games
activity 1: 27 activity 2: 34 total Person months = 27 + 34 = 61
activity 1: February activity 2: May Combined: May
activity 1: April & May activity 2: July Combined: July
answers may vary. Possible responses can include: hayfever, outdoor allergies, kids are outside playing/hiking/swimming and can be injured.
no. explanations may vary but may include: Too small of a sample of kids; not enough in-formation about the kids ages or size or activity level or allergies, etc.
660 mg
24 (add up all hours played)
m t W th F Weekend
Bart x x 1 x 5 4
maggie x 1 1 x 3 x
lisa 1 x x 2 2 4
Activity 2A: The Results—Person Time/Person Months
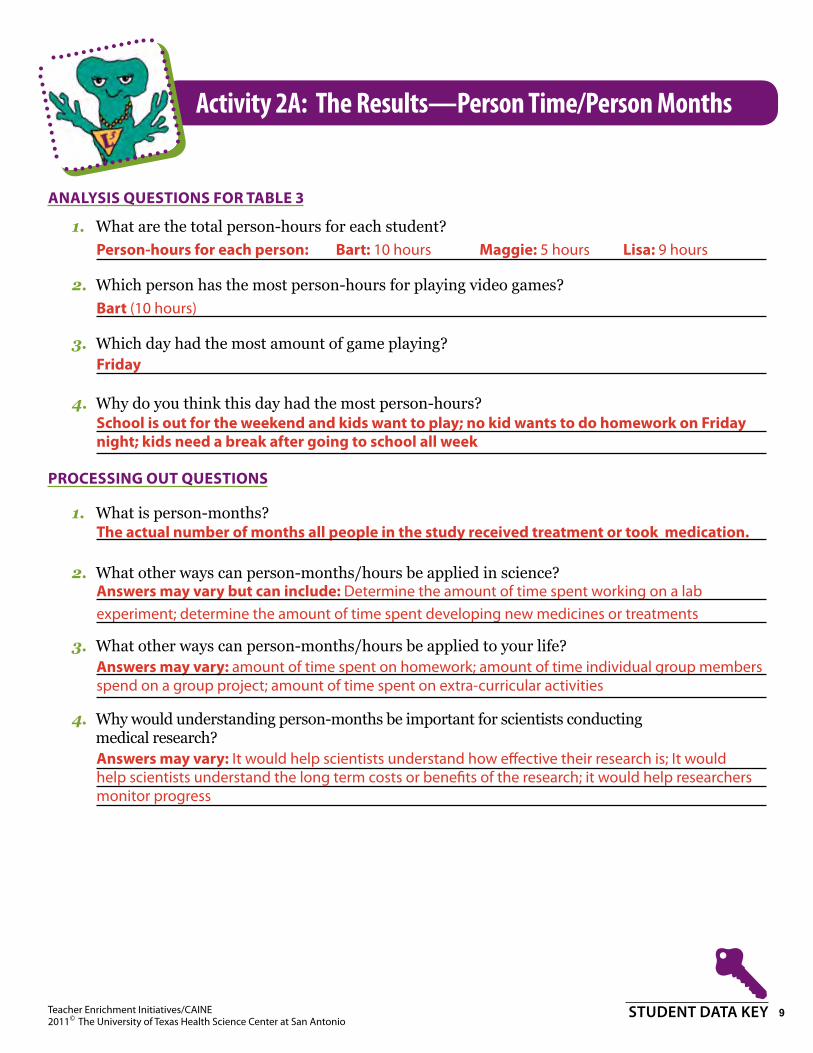
1. What are the total person-hours for each student?
2. Which person has the most person-hours for playing video games?
3. Which day had the most amount of game playing?
4. Why do you think this day had the most person-hours?
ProCessing oUt QUestions
1. What is person-months?
2. What other ways can person-months/hours be applied in science?
3. What other ways can person-months/hours be applied to your life?
4. Why would understanding person-months be important for scientists conducting medical research?
Person-hours for each person: Bart: 10 hours maggie: 5 hours lisa: 9 hours
the actual number of months all people in the study received treatment or took medication.
answers may vary but can include: Determine the amount of time spent working on a lab experiment; determine the amount of time spent developing new medicines or treatments
answers may vary: amount of time spent on homework; amount of time individual group members spend on a group project; amount of time spent on extra-curricular activities
answers may vary: It would help scientists understand how effective their research is; It would help scientists understand the long term costs or benefits of the research; it would help researchers monitor progress
school is out for the weekend and kids want to play; no kid wants to do homework on Friday night; kids need a break after going to school all week
Understanding absolUte riskScientists often calculate the absolute risk to determine a person’s risk of obtaining a disease, outcome, or condition. Knowing this information can help individuals make educated choices and decisions. For example, if there are 100 people that are non-smokers and 1 person gets lung cancer, then the risk of getting lung cancer is 1 in 100 if you an individual have never smoked. This is a low absolute risk of obtaining lung cancer. Knowing this information, would you choose to smoke?
Absolute risk is the chance of developing a disease or some occurrence during a time span. To calculate the absolute risk, take the number of deaths and divide it by person months.
overdose deaths = absolute riskPerson Months
If an absolute risk is 2 out of 1000 deaths, this means 2 people out of 1000 will die because of that risk.
Table 1: Patients With Chronic Non-Cancer Pain Diagnoses
Maximum prescribed daily opioid dose (milligrams/dose) overdose deaths 100,000
Person-Months
0 243 27.3
1 to <20 mg 44 4.0
20 to < 50 mg 108 4.6
50 to <100 86 1.3
>100 125 1.0
On Table 1, the absolute risk of a person dying at the maximum daily dose of 0 mg/d is
243/27.3 = 9
This means out of 100,000 people, 9 who are taking 0 mg/d will end up dying of an opioid overdose.
In this activity you will use data from the peer-reviewed article to calculate the absolute risk of patients overdosing for each maximum prescribed daily dose.
activity Materials: ●● Student Data Page (per student)
●● Calculators (optional)
●● Student page (class set)
activity instrUctions:
1. Answer the guiding questions. 2. Use the data tables from the peer-reviewed article to calculate absolute risk for patients. 3. Complete the processing out questions at the end of the activity.
Table 1: Patients with Chronic Non-Cancer Pain Diagnoses
Maximum prescribed daily opioid dose overdose deaths 100,000Person-Months
0 243 27.3
1 to < 20 mg 44 4.0
20 to < 50 mg 108 4.6
50 to < 100 86 1.3
>100 125 1.0
Table 2: Patients with Cancer Diagnoses
Maximum prescribed daily opioid dose overdose deaths 100,000Person-Months
GuidingQuestion1:Which group would have the highest absolute risk?
GuidingQuestion2:Which dosage would have the highest absolute risk?
Use the guiding questions to create a hypothesis about absolute risk. Remember a hypothesis is a testable statement. “If...then...” statements are helpful to get started. Hypotheses may vary but need to include information from the 2 Guiding Questions. Hypothesis can also compare both groups from tables 1 and 2.
If________________________ then
Real scientists rarely use “if...then...” statements. Restate the hypothesis below without using the “if.....then....” format.
Data Calculations: Patients with Chronic Non-Cancer Pain Diagnosis
Maximum prescribed daily opioid dose
overdose deaths100,000 person-months
absolute risk per 100,000
person-months
0 243/27.3 9
1 to <20 mg 44/4.0 11
20 to < 50 mg 108/4.6 24 (23.5)
50 to <100 86/1.3 66 (66.2)
>100 125/1.0 125
Data Calculations: Patients with Cancer Diagnosis
Maximum prescribed daily opioid dose
overdose deaths100,000 person-months
absolute risk per 100,000
person-months
0 32/8.59 4 (3.7)
1 to <20 mg 7/.91 8 (7.6)
20 to < 50 mg 14/.97 14 (14.4)
50 to <100 14/.28 50
>100 24/.24 100
Patients with Chronic Non-Cancer Pain (more deaths)
> or = 100 mg
If a person with chronic non-cancer pain takes over 100 mg of opioids
People with chronic non-cancer pain who take more than 100 mg of opioids are at higher risk of overdose.
2. Why is it important to know about absolute risks?
3. How does the absolute risk of a non-cancer patient taking more than 100 mg/d compare to a cancer patient taking more than 100 mg/d?
4. Which dosage had the lowest absolute risk?
5. Which dosage had the highest absolute risk?
6. According to the study, why doesn’t the dosage at 0 mg have a greater absolute risk compared to the dose at >100?
7. What was the difference between your guiding questions/hypothesis and your actual calculations? ______________________________________________ ________________________________________________________ ________________________________________________________
Absolute risk is the chance of experiencing an event (developing a disease;
It can help you calculate the risk so you can de-
The lowest absolute risk is 0 mg for cancer patients.
More than 100 mg for non-cancer patients.
Non-cancer patients who take more than 100 mg of
There were more person-months which means more people were not pre-
developing an illness) during a specific amount of time.
cide if you should or should not do something.
pain medicine have a higher absolute risk of overdosing.
scribed an opioid or pain medicine.
Answers may vary but the answer must compare to the student’s hypothesis. For example: The guiding
questions showed the highest absolute risk was for non-cancer patients who took over 100 mg of
opioids. My hypothesis is supported by the calculations.
PART 1: The table below shows the risks associated with riding different amusement rides at a theme park. The abso-lute risks of four different rides are listed. For example, out of 100 people who choose to get on ride A, about 4 will experience some sort of injury. Knowing these values helps to make informed decisions about the risks of getting on certain rides.
Ride Absolute Risk
A 4.14
B 1.19
C 3.56
D 5.22
1. Which ride has the lowest risk of being injured? Ride B
2. Which ride has the highest risk of being injured? Ride D
3. What possible characteristics could ride D have that makes it the highest risk? (HINT: think about roll-er coaster structures) Answers may vary but could include: Ride D could be faster, have more loops, have more turns, made of wood instead of steel
4. What is the relative risk of ride D compared to ride B? Show your work and write an explanation for the relative risk.
5.22 1.19 = 4.4
Explanation: You are 4.4 times more likely to have an injury while on Ride D than you are on Ride B.
5. What is the relative risk of ride A compared to ride B? Show your work and write an explanation for the relative risk.
4.14 1.19 = 3.5
Explanation: Teachers may choose to have a true explanation or a statement of the comparative relative risk. Possible answers can include: Calculating relative risk compares two different absolute risks. By dividing the higher absolute risk by the lower absolute risk, the relative risk can be determined. OR You are ... You are 3.5 times more likely to have an injury while on Ride A than you are on Ride B.
PART 2: Skateboarding is a sport that often leads to injuries. The following data was collected in a study to show the risk of injury for skateboarding compared to other sports. Determine the absolute risk for each sport in the data table. Use the absolute risk to calculate and answer about relative risk.
1998 Injuries in Selected Sports for Participants Age 7 Yrs and Older
Sport Estimated Injuries in thousands
Participants in thousands
Absolute Risk(injuries/participants)
Basketball 623.2 29,400 623.2/29,400 = .0211
Football 351.9 17,000 351.9/17,000 = .0207
Bicycling 501.6 43,500 501.6/43,500 = .0115
Skateboarding 51.5 5,800 51.5/5,800 = .0088
In-line skating 105.8 27,000 105.8/27,000 = .0039
1. How many more times are you likely to have an injury while playing basketball compared to skate-boarding?
.0211 .0088 = 2.4
Explanation: You are 2.4 times more likely to have an injury while playing basketball than skateboarding
2. How many more times are you likely to have an injury while skateboarding compared to in-line skates?
.0088 .0039 = 2.3
Explanation: You are 2.3 times more likely to have an injury while skateboarding than in-line skating
PROCESSING OUT: 1. What is relative risk? Answers may vary, but should include some or all of the following:
Relative risk is a numerical value used to compare the risks of different activities or behaviors. In this activity, relative risk compares the risk of a rider being injured on different roller coasters and the risk of injury due to participating in different activities.
2. Looking at the data table from part 1, how do your explanations compare to the information in the data table? Answers will vary.
3. Looking at the data table from part 2, how do your explanations compare to the information in the data table? Answers will vary.
Activity Description: Graphs are commonly used by scientists to analyze data collected during an investigation. Graphs provide opportunities to compare and even predict trends in data. Two common types of graphs are line and bar graphs. Both types of graphs are needed to display different types of data. Line graphs are typically used to demonstrate a change in a variable over a certain amount of time. Bar graphs are used to show comparisons within the data.
Most graphs should include a title, key/legend, and titles for the x and y axis. The independent variable is located on the x-axis and the dependent variable is on the y-axis. Always include units for the x-axis and y-axis.
Table 3 represents relative risks of overdosing when taking different amounts of opioids. The risks of death at each dosage level are referenced to the 1 to < 20 mg dosage. This means that a person taking more than 100 mg of opioids for chronic pain is 7.18 times more likely to die of an overdose than someone who takes less than 20 mg for chronic pain.
Table 3: Risk of Death by Prescription Opioid Overdose
Maximum prescribed daily opioid dose
chronic pain(non cancer) cancer Acute pain substance Use
Disorders
1 to < 20 mg 1(reference) 1(reference) 1(reference) 1(reference)
20 to < 50 mg 1.88 1.74 1.58 1.42
50 to < 100 4.63 6.01 4.73 2.76
> 100 7.18 11.99 6.64 4.54
MAteriAls:
●● Extra graphing paper (if needed)
●● Map Colors, crayons, or markers
instrUctions:
Using the above data table, construct a bar graph that compares the relative risk of death at all dosage levels provided. There will be four bars for every dosage.
Doctors prescribed the drugs to people who really aren’t patients.
Answers may vary: Higher doses of opi-oids increase risk of overdose; overdoses from prescription opioids are rare; doc-tors need to know their patient’s history
Answers may vary: Not all doctors are honest - they prescribe pills for money, not to help patients; many overdoses are unintentional; since opioids are prescriptions, people assume the drug is “safe”
Describe how the information in the Media Article supports the results in the Peer-Reviewed Article.
Describe how the information in the Media Article does not support the results in the Peer-Reviewed Article.
Peer-Reviewed Research Report
Peer-Reviewed Research Report
Media Article
Media Article
Data
overall comparison
Analysis of data described
conclusions described by the authors
Use of statistics described
Describe which is more reliable and why
information about opioids
Describe which is more interesting and why
source of data
overall Accuracy
*Teachers – student answers may vary considerably. This activity promotes critical thinking and creates opportunity for discussion and discourse.
Cohort study; random sampling of 154,684 patients; compared accidental overdoses between chronic non-cancer patients and cancer patients
Answers may vary: The risk of an accidental fatal overdose increases with higher prescribed doses of opioids.
Answers may vary: There is a nationwide war on drugs and people are dying of overdoses by prescription medication; addictive nature of drug creates dependency and demand for the drug; databases help stop the problem
no description of analysis provided
One of the authors did the statistical analysis; article does not describe statis-tics used
More reliable: has sources, describes how information was found, shows data, provides disclosures and informa-tion about the researchers and study
Less reliable: lots of “facts” by no sourc-es given, no data to support “facts”
no statistics description provided
describes opioids: codeine, morphine, oxycodone, hydrocodone, hydromor-phine; opioids are prescribed to treat chronic pain
Answers may vary: less interesting because some of the vocabulary is challenging, the data is confusing, there is too much to read, etc.
Answers may vary: More interesting because it is easier to read, it is shorter, it does not have tables and data, etc
opioids are narcotics; opioids are highly addictive; describes one opioid--oxyco-done and it’s brand names OxyContin and Percocet; states opioids are a very effective painkiller.
medical records from the Veterans Health Administration
The conclusions make sense when looking at the data tables; the peer-reviewed article looked at actual patient records who went to doctors who decided the patient needed opioids to help with pain.
The people in the media article are not taking opioids because they are in pain. Doctors were prescribing medication even though the patient was not in real pain.
No specific source cited.
Like the peer-reviewed article,the media article talks about opioids and how people can overdose.
The overdoses in the media piece were by people who are addicted to the drug. They were not taking the medication because of pain from a disease or illness.