Page 1
Institutslogo
Fakultät Maschinenwesen | Institut für Energietechnik | Professur für Technische Thermodynamik
Lecture Series at Fritz-Haber-Institute Berlin
„Modern Methods in Heterogeneous Catalysis“
28.01.2011
Transient methods
for the determination of
transport and adsorption phenomena
Cornelia Breitkopf
Page 2
Transient methods are a powerful tool for
gaining insights into the mechanisms of
complex catalytic reactions.
Page 3
Transient view to processes needed
Transient behaviour of chemical processes is subject of interest
Optimization of plant processes
Plants are sometimes operated under non-stationary conditions (e.g. start-up,
shut-down, switch between stationary states).
Overall economics may be improved by proper control of these non-stationary
processes.
Product losses or switching times should be minimized.
Safety analysis
Modern safety analysis requires full control of all processes including the
behaviour during technical faults.
A reliable procedure to eliminate an insafe processe is necessary.
Page 4
Transient view to processes needed
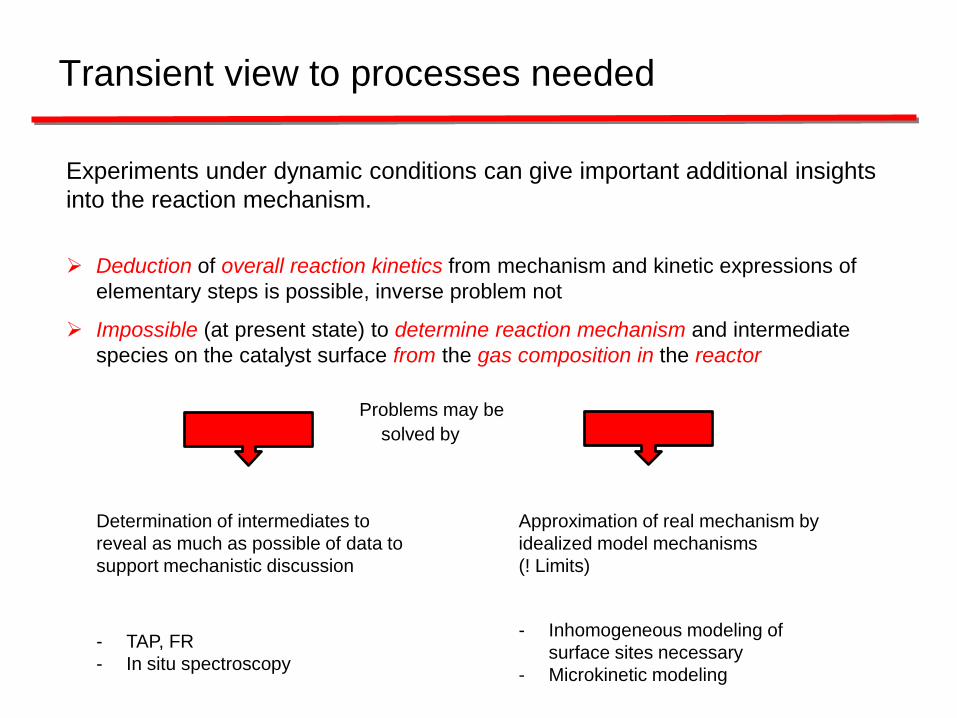
Experiments under dynamic conditions can give important additional insights
into the reaction mechanism.
Deduction of overall reaction kinetics from mechanism and kinetic expressions of
elementary steps is possible, inverse problem not
Impossible (at present state) to determine reaction mechanism and intermediate
species on the catalyst surface from the gas composition in the reactor
Problems may be
solved by
Determination of intermediates to
reveal as much as possible of data to
support mechanistic discussion
- TAP, FR
- In situ spectroscopy
Approximation of real mechanism by
idealized model mechanisms
(! Limits)
- Inhomogeneous modeling of
surface sites necessary
- Microkinetic modeling
Page 5
Application background – sorption, diffusion
o Zeolites and microporous solids as adsorbents in gas separation processes
• separation factors depend on differences in standard free energies of
adsorption of the components
• when sizes between adsorbates and channels are similar – diffusion also
influences separation
o Commercial separation units contain pellets - + inert binder
intercrystalline and intracrystalline diffusion may be important
in combination with adsorption
Page 6
Application background – sorption, diffusion
Methods for determination of inter- and intracrystalline diffusion
o Measure of uptake rates of an adsorbate molecule from the gas phase into the
zeolite pellet
! often spurious diffusion coefficients because of complex interplay with
heats of adsorption and bed-depth mass transport effects
o Several methods try to eliminate these problems:
Pulsed field gradient NMR
Tracer desroption NMR
Zero bed-depth chromatography
Single-crystal membrane
Frequency response
TAP
Page 7
What we will speak about today?
Introduction to macro- and microkinetics
Steady-state and unsteady-state experiments
General aspects of pulse methods (adsorption and diffusion)
Frequency Response approach
Temporal Analysis of Products
Page 8
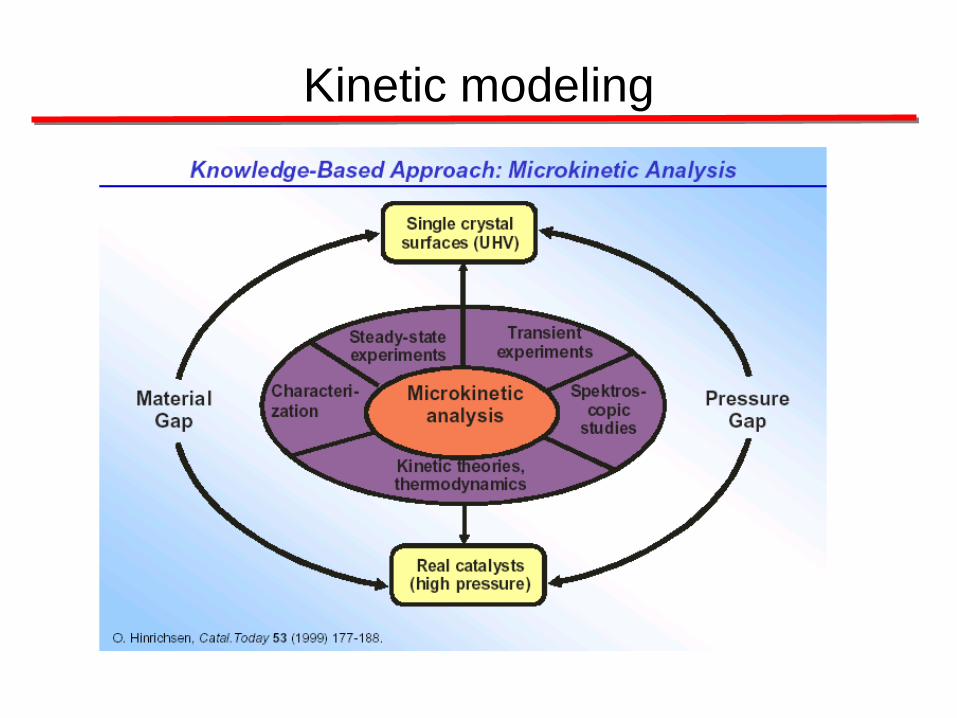
Macrokinetics and Microkinetics
Page 9
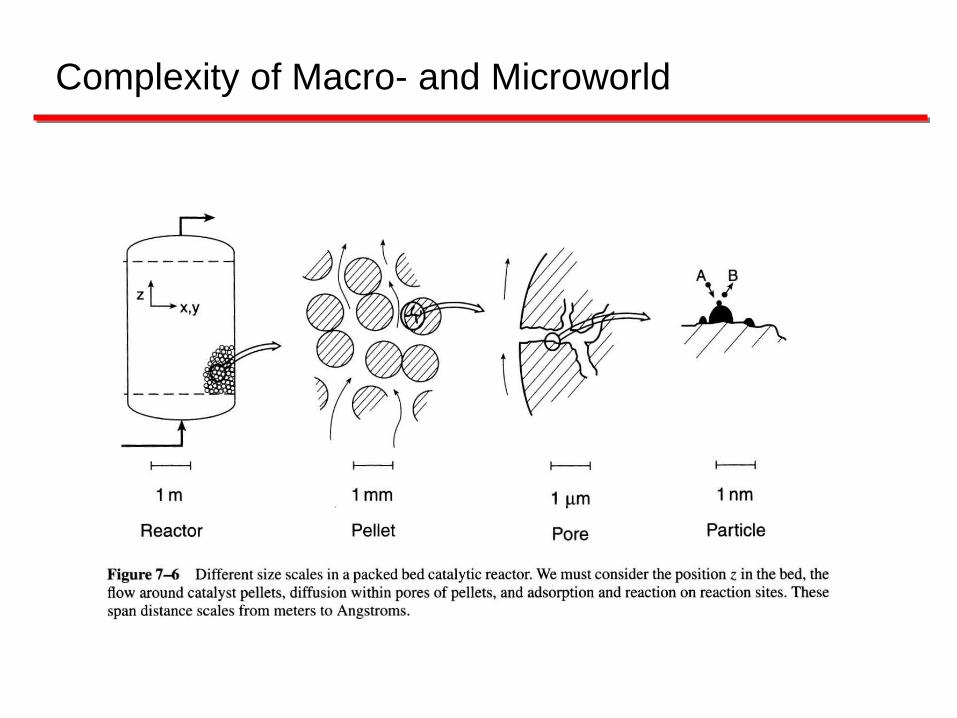
Complexity of Macro- and Microworld
Page 10
Transport
in Poren
fs
ps
ns
µs
ms
s
Zeit
Raum pm nm µm mm m
Elementar-
schritte
Katalyse-
zyklus
Molekular-
transport
Transport
im Reaktor
multidimensional
space-time problem
simultaneous knowledge of
ADSORPTION and
DIFFUSION -
is necessary to describe
complex processes
Complexity of Macro- and Microworld
Page 11
Macrokinetics and Microkinetics
Page 12
Kinetic measurements
Complexity of heterogeneously catalyzed reactions –
Macrokinetics and Microkinetics
O. Deutschmann, XXXIV. Jahrestreffen Deutscher Katalytiker/ Fachtreffen Reaktionstechnik, Weimar 21.-23.3.2001
Page 13
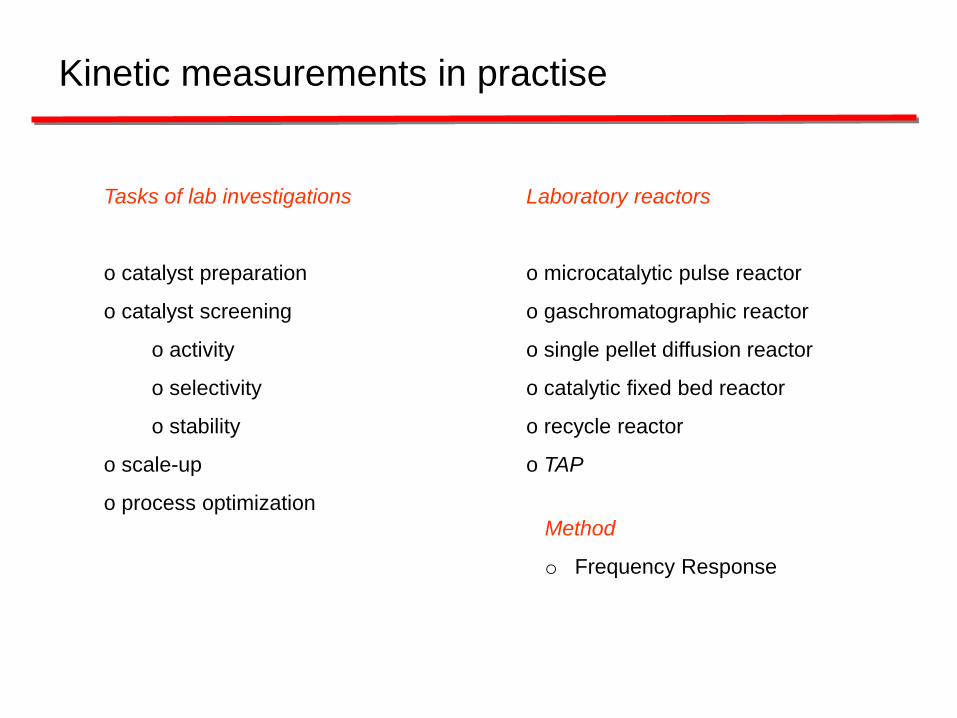
Kinetic measurements in practise
Tasks of lab investigations
o catalyst preparation
o catalyst screening
o activity
o selectivity
o stability
o scale-up
o process optimization
Laboratory reactors
o microcatalytic pulse reactor
o gaschromatographic reactor
o single pellet diffusion reactor
o catalytic fixed bed reactor
o recycle reactor
o TAP
Method
o Frequency Response
Page 14
Steady-state and unsteady-state experiments
Page 15
Kinetic investigations
• Steady-state or unsteady-state experiment ?
• Quantitative evaluation of kinetic data ?
Constructing of a
mathematical model
Evaluation of the
reaction mechanism
Parameter
estimation
How to do…?
Page 16
Steady-state experiments
• Most common reaction technique used in heterogeneous
catalysis
• Achieved by operation such that temperature, pressure,
concentration, and flow rate at any point in the reactor are
time invariant
• Access to activity, selectivity, reaction order, activation energy
Page 17
• Advantages:
- Easy to build and operate
- Results can be described with mathematical models based on
algebraic equations
- Most industrial processes are operated under steady-state conditions
• Disadvantages:
- Provide global kinetic parameters, limited information on individual
reaction steps
- Interpretations often based on „simple“ assumptions
Steady-state experiments
Page 18
Unsteady-state experiments
o Transient conditions can be achieved by introducing
different input signals into the reactor
variety of methods
- variation of residence time
- variation of temperature T
- variation of feed composition c, p
- combination of variation of , T, c or p
o Changes in composition show clearest deviation from
steady-state – therefore used quite often
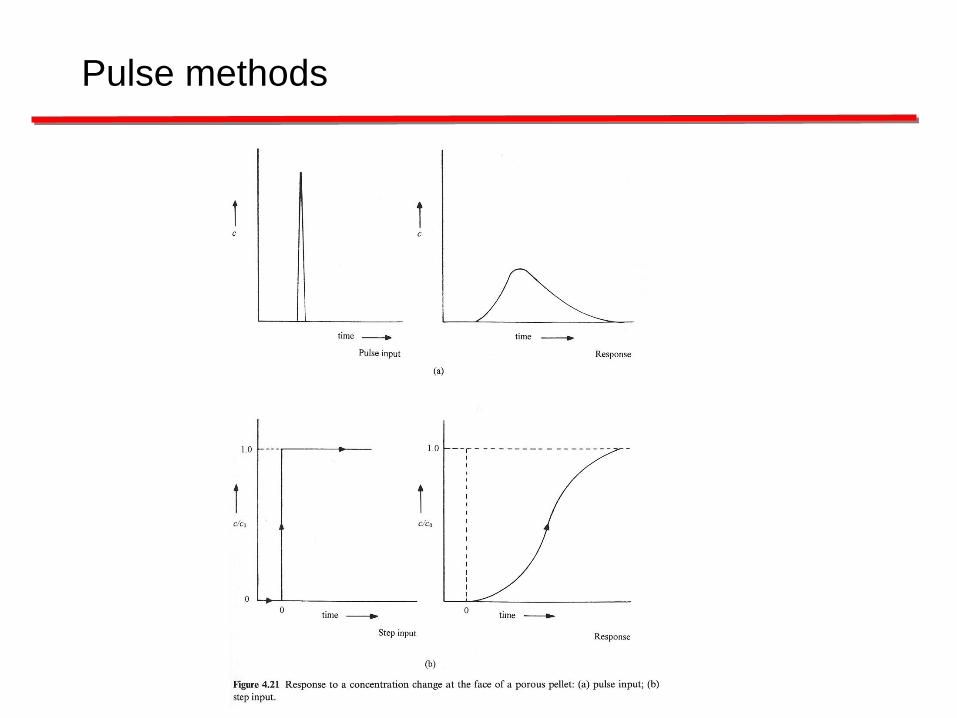
o Signals may be introduced as step or square wave
Page 19
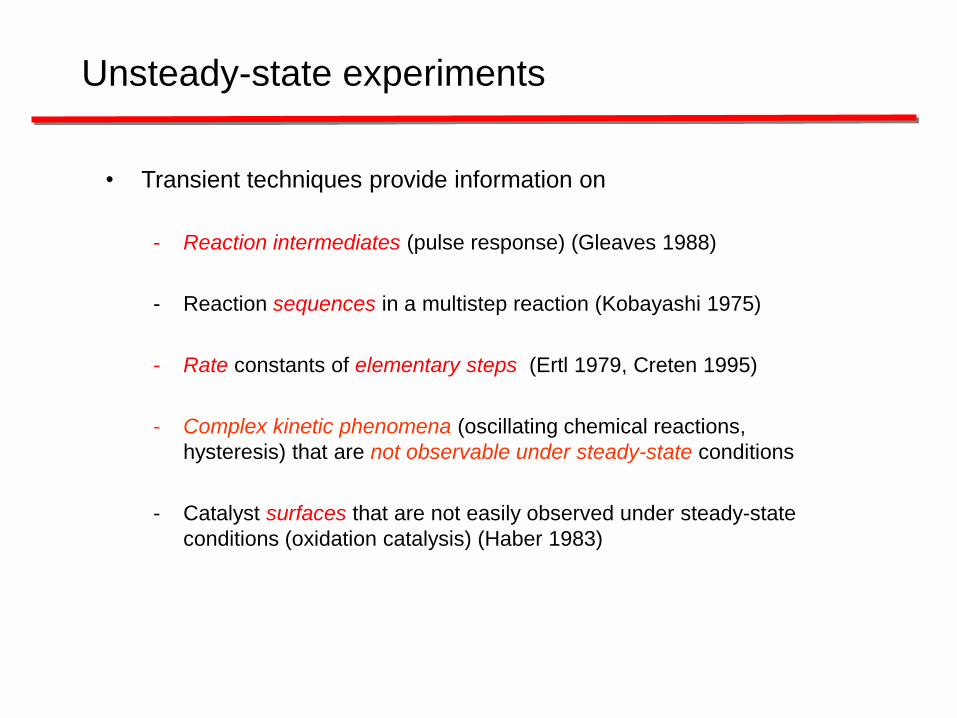
Unsteady-state experiments
• Transient techniques provide information on
- Reaction intermediates (pulse response) (Gleaves 1988)
- Reaction sequences in a multistep reaction (Kobayashi 1975)
- Rate constants of elementary steps (Ertl 1979, Creten 1995)
- Complex kinetic phenomena (oscillating chemical reactions,
hysteresis) that are not observable under steady-state conditions
- Catalyst surfaces that are not easily observed under steady-state
conditions (oxidation catalysis) (Haber 1983)
Page 20
• Disadvantages
- Not easy to build up, expensive
- Main problem: theory is very complex
Unsteady-state experiments
Page 21
Steady-state and transient methods
• measure overall performance
• give integrated picture of reaction system
• have minimum reactor residence time of 1 s
Steady-state methods
Transient methods
• give information on individual steps
• operate in millisecond time regime; resolution increase
Page 22
General aspects of pulse methods
(adsorption and diffusion)
Page 24
Pulse methods
• response to pertubations describe mathematically the transient behaviour
• evaluation of rate parameters from response measurements such as mass transfer
coefficients, diffusivities, and chemical kinetic constants
• use of: - fixed-bed (column) chromatography
- isotope technique
- slurry adsorber
- single-pellet
Page 25
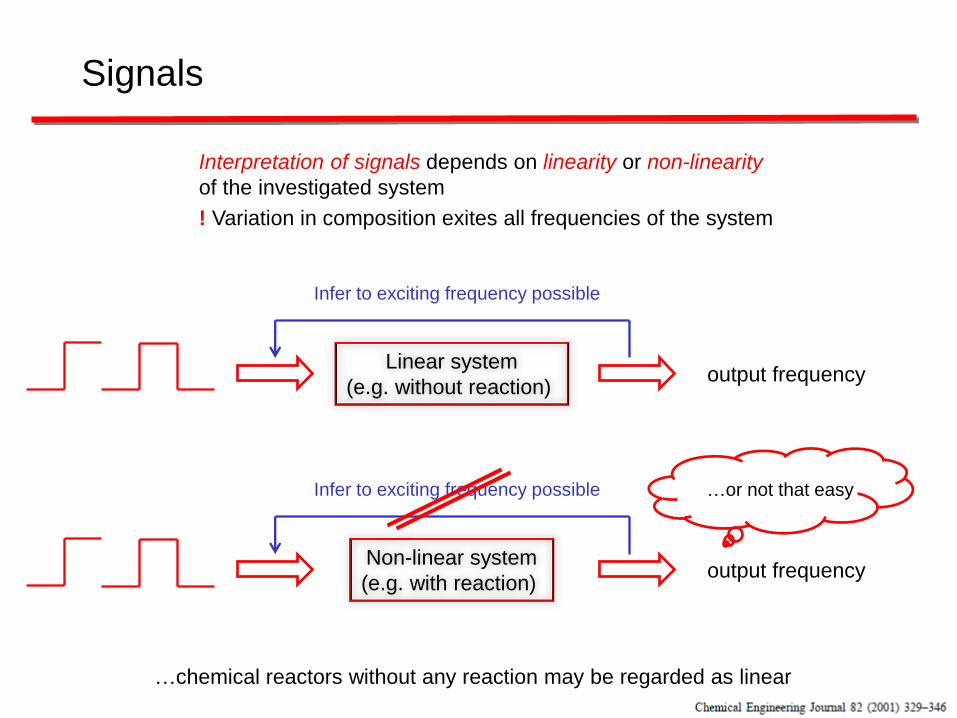
Signals
Interpretation of signals depends on linearity or non-linearity
of the investigated system
! Variation in composition exites all frequencies of the system
Linear system
(e.g. without reaction) output frequency
Infer to exciting frequency possible
Non-linear system
(e.g. with reaction) output frequency
Infer to exciting frequency possible …or not that easy
…chemical reactors without any reaction may be regarded as linear
Page 26
Diffusion in porous solids
Characteristic value to characterize the influence of internal
transport phenomena of heterogeneous reactions on the surface
between a fluid phase and a porous solid is DaII (see textbooks)
DaII = f (k, cexternal, lcharacteristic, Deff)
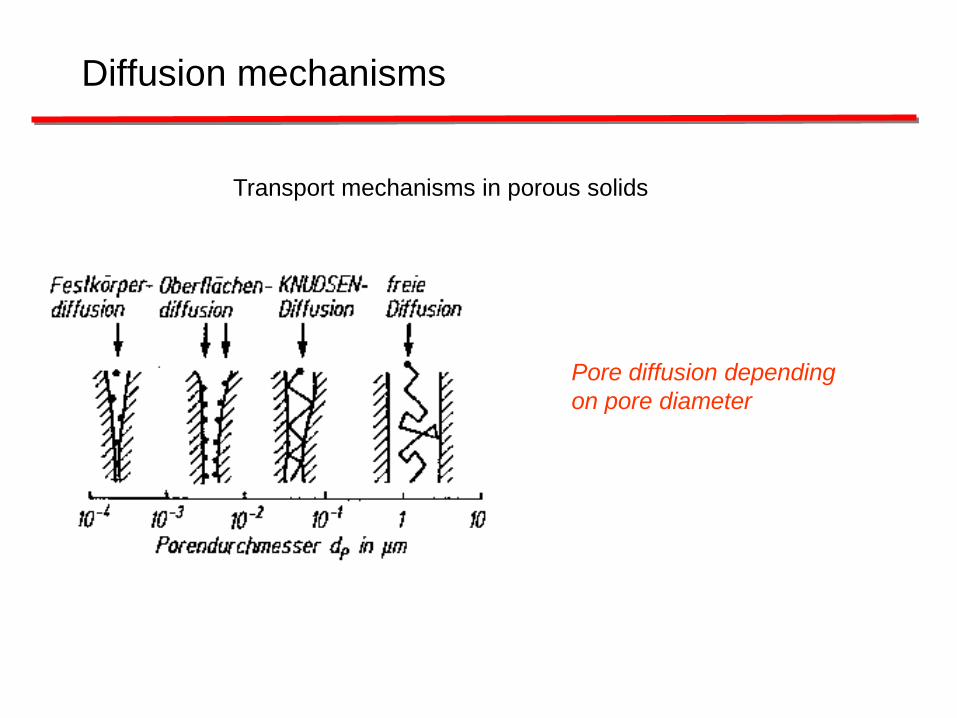
if fluid is gaseous: diffusion in pores depends on dimensions of pore
system
Page 27
Diffusion mechanisms
Transport mechanisms in porous solids
Pore diffusion depending
on pore diameter
Page 28
Molecular diffusion
Atkins
Page 29
Molecular diffusion
• mixture of two components A and B,
concentration gradient (in one dimension y):
under steady-state conditions the diffusional flow of one
component is described by 1. Fick law
• DAB ...binary molecular diffusion coefficient of component A
diffusing through B
• DAB = f( molecular properties of A and B, T, c or p)
dy
dcDJ
AABA
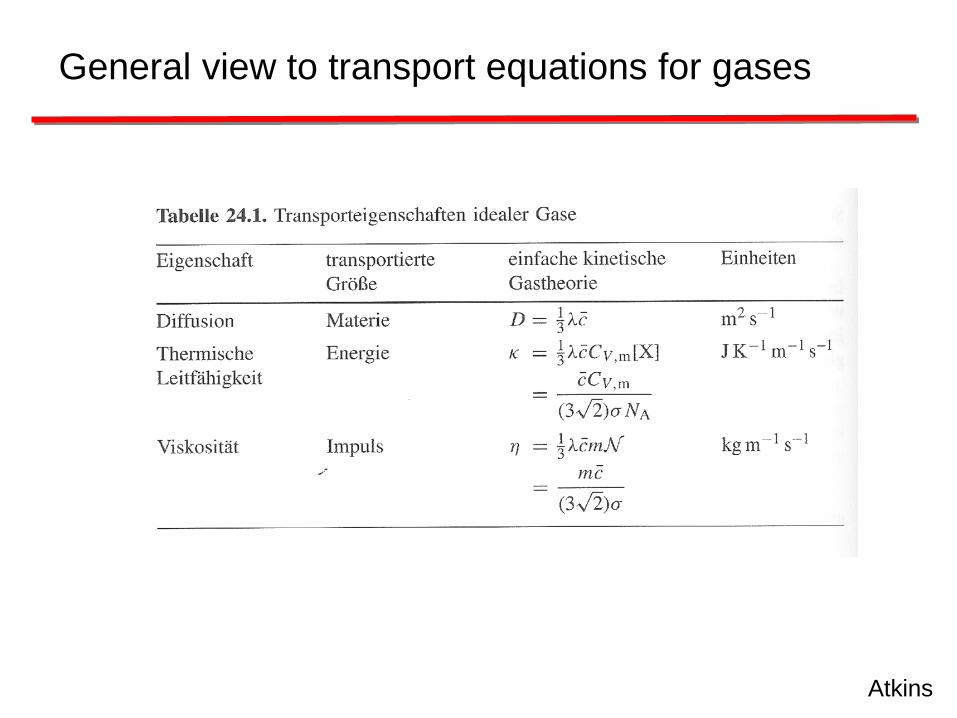
Page 30
General view to transport equations for gases
Transport
Mass Heat Energy
Flux of
mass density
Flux of
heat density
Flux of
momentum
dz
dcDj in
Fick´s Law Fourier´s Law Newton´s Law
(viscosity)
dz
dTjQ
dy
duj zP
Page 31
Atkins
General view to transport equations for gases
Page 32
• under low pressure conditions and/or for small pores:
collision of gas with pore wall > collision of gas with gas
• mean free path length of molecule > pore diameter
…mean free path length
2…molecular cross-section
V… gas molar volume at p
• NA/V at 298 K : cges 3.1019 *p (molecules/cm3)
(dimension of p 105 Pa)
• mean free path length with typical (9-20*10-16 cm2)
AN
V22
1
)(102
nmp
Knudsen diffusion
Page 33
Knudsen diffusion
)(102
nmp
• Conditions for Knudsen diffusion
dpore [nm] <1000 <100 <10 <2
p [bar] 0.1 1 10 50
Page 34
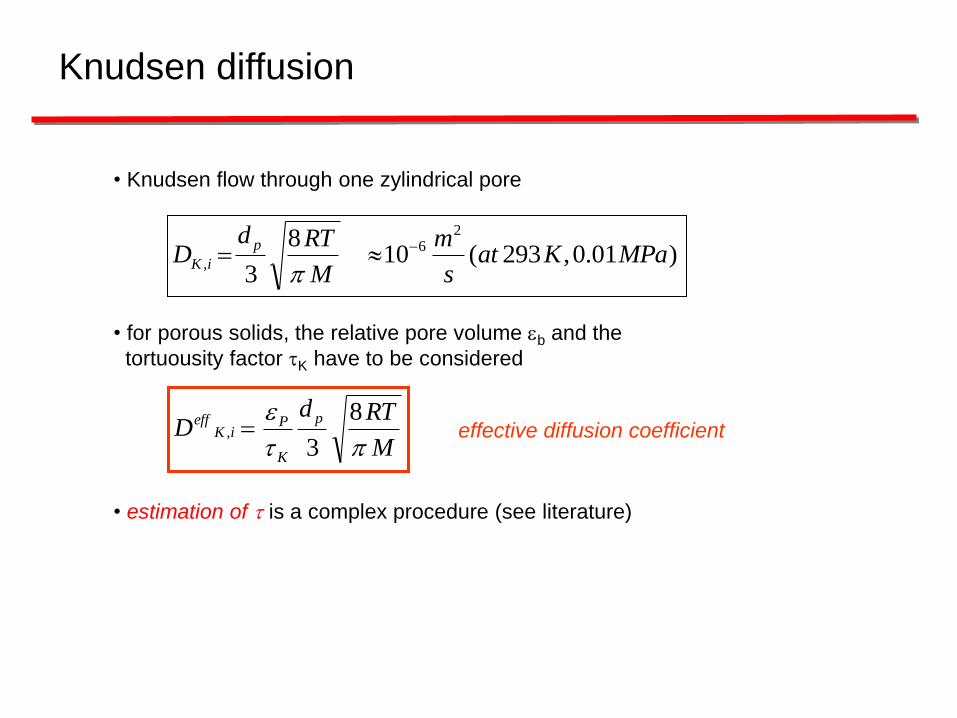
• Knudsen flow through one zylindrical pore
• for porous solids, the relative pore volume b and the
tortuousity factor K have to be considered
• estimation of is a complex procedure (see literature)
)01.0,293(108
3
26
, MPaKats
m
M
RTdD
p
iK
M
RTdD
p
K
PiK
eff
8
3,
Knudsen diffusion
effective diffusion coefficient
Page 35
Effective diffusion coefficients
• diffusional flow in the pores may be described by
an effective diffusion coefficient
• relation to surface: surface of pore mouths is representing
only a part of the outer surface of a particle
• pores are not ideally cylindrical
• pores are connected by a network
Page 36
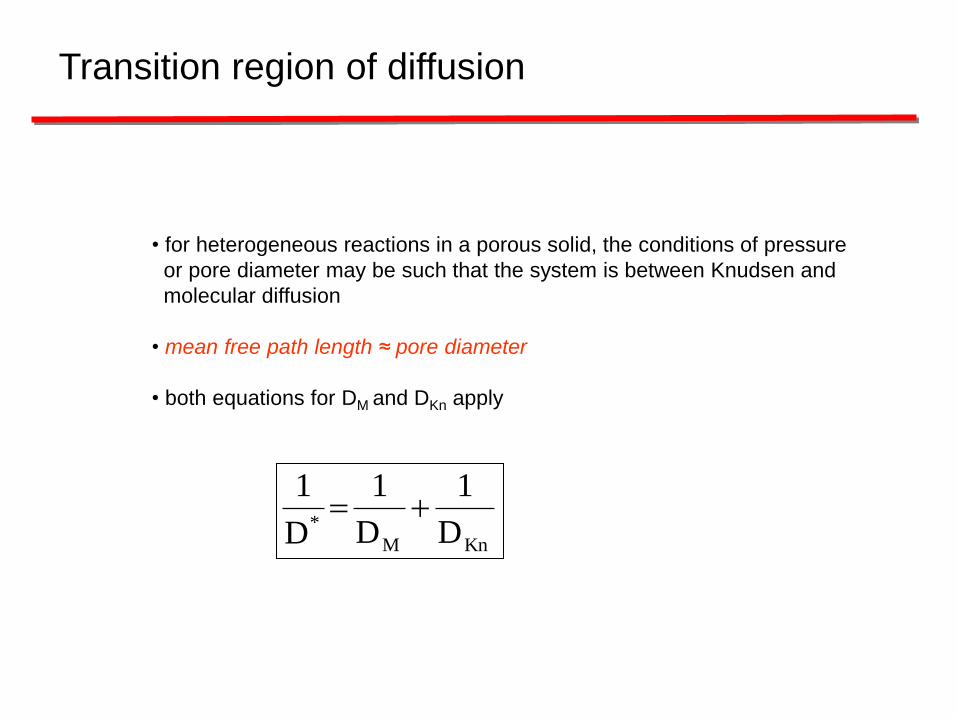
• for heterogeneous reactions in a porous solid, the conditions of pressure
or pore diameter may be such that the system is between Knudsen and
molecular diffusion
• mean free path length ≈ pore diameter
• both equations for DM and DKn apply
Transition region of diffusion
KnM
* D
1
D
1
D
1
Page 37
Frequency Response Method
Page 38
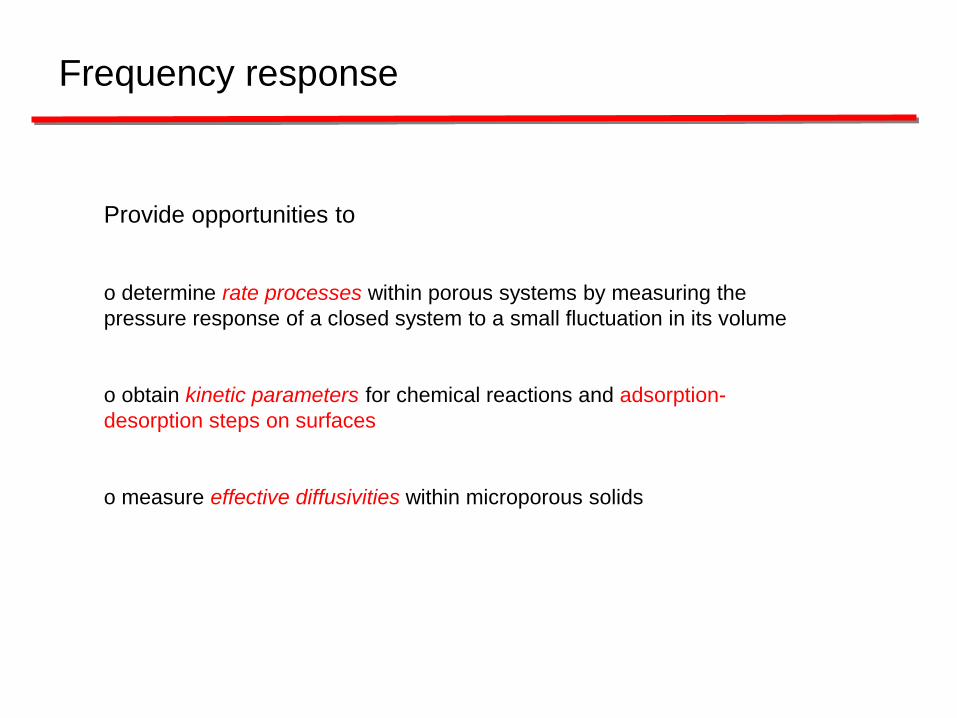
Frequency response
Provide opportunities to
o determine rate processes within porous systems by measuring the
pressure response of a closed system to a small fluctuation in its volume
o obtain kinetic parameters for chemical reactions and adsorption-
desorption steps on surfaces
o measure effective diffusivities within microporous solids
Page 39
Frequency response
Provide opportunities to
o study coupled adsorption and diffusion processes with different characteristic time
scales
! These rate processes cannot be adequately resolved by pulse
or step transient methods, by TPD or by elution chromatography.
o determine coupling of adsorption and transport particularly for high surface area
materials
(number of exchanging molecules inside > number of exchanging molecules outside)
Page 40
Frequency response
Principle
o FR exploits the change in amplitude and phase produced by a dynamic system
that is pertubed periodically around its equilibrium point
o amplitude change (attenuation) and phase shift (lag) are directly related to the
dynamics and capacities of the processes (sorption and diffusion) governing the
return to the equilibrium
Example: processes
diffusion coupled sorption and diffusion
dynamics = effective diffusivity = + kinetics of sorption
capacity = pore volume = + changes in surface coverage
Page 41
Frequency response
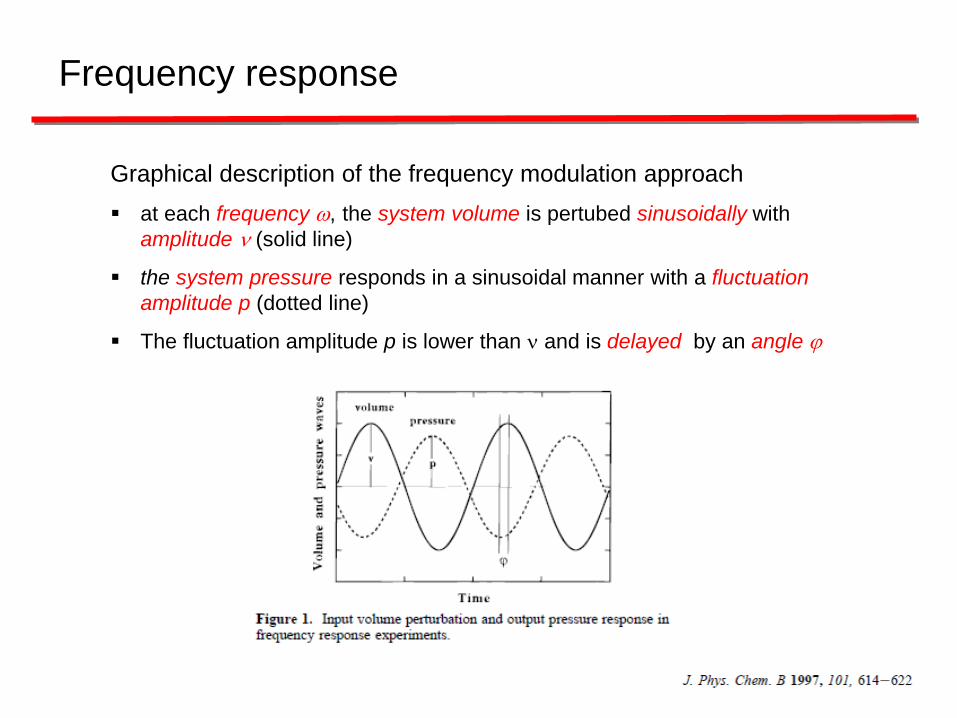
Graphical description of the frequency modulation approach
at each frequency , the system volume is pertubed sinusoidally with
amplitude (solid line)
the system pressure responds in a sinusoidal manner with a fluctuation
amplitude p (dotted line)
The fluctuation amplitude p is lower than and is delayed by an angle
Page 42
Frequency response
Extraction of rate parameters
capacities and dynamics of underlying processes are obtained by fitting of
the experimental transfer function H(, p, ) to the theoretical transfer
function H(i )
measured quantities , p,
transfer function: analytical expression in frequency domain which
contains parameters
magnitude of function measures the ratio of the pressure response to the
volume pertubation: H = p/
quantifies phase lag : = tan-1 […..]
Page 43
Frequency response
Experimental apparatus
Pertubation frequencies between 0.05 – 10 Hz
System volume V = 141,91 cm3 can be modulated by 1,38 % (V = 1,96 cm3)
Modulation by metal bellow
System volume at T = 223-400 K (pretreatment e.g. heating before experiment
via resistive heating device)
Page 44
Frequency response
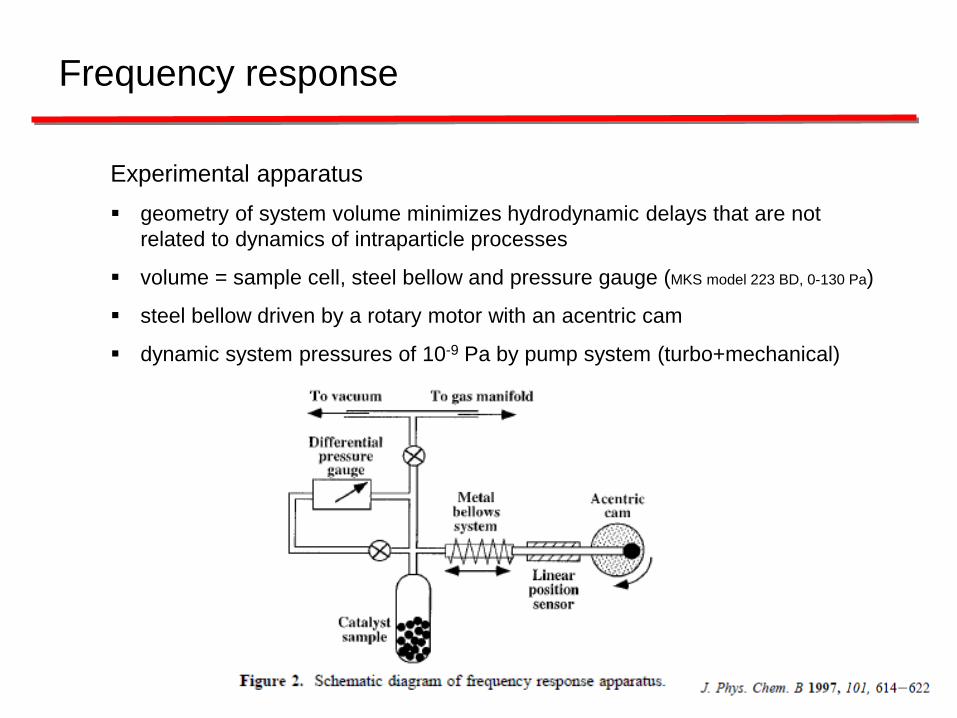
Experimental apparatus
geometry of system volume minimizes hydrodynamic delays that are not
related to dynamics of intraparticle processes
volume = sample cell, steel bellow and pressure gauge (MKS model 223 BD, 0-130 Pa)
steel bellow driven by a rotary motor with an acentric cam
dynamic system pressures of 10-9 Pa by pump system (turbo+mechanical)
Page 45
Frequency response
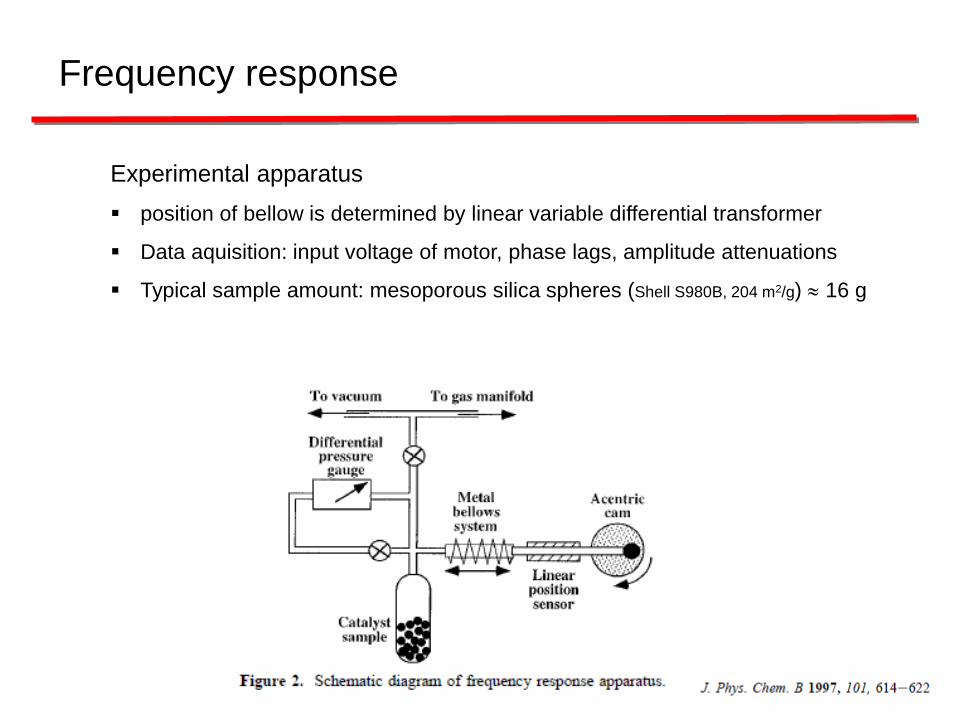
Experimental apparatus
position of bellow is determined by linear variable differential transformer
Data aquisition: input voltage of motor, phase lags, amplitude attenuations
Typical sample amount: mesoporous silica spheres (Shell S980B, 204 m2/g) 16 g
Page 46
Frequency response
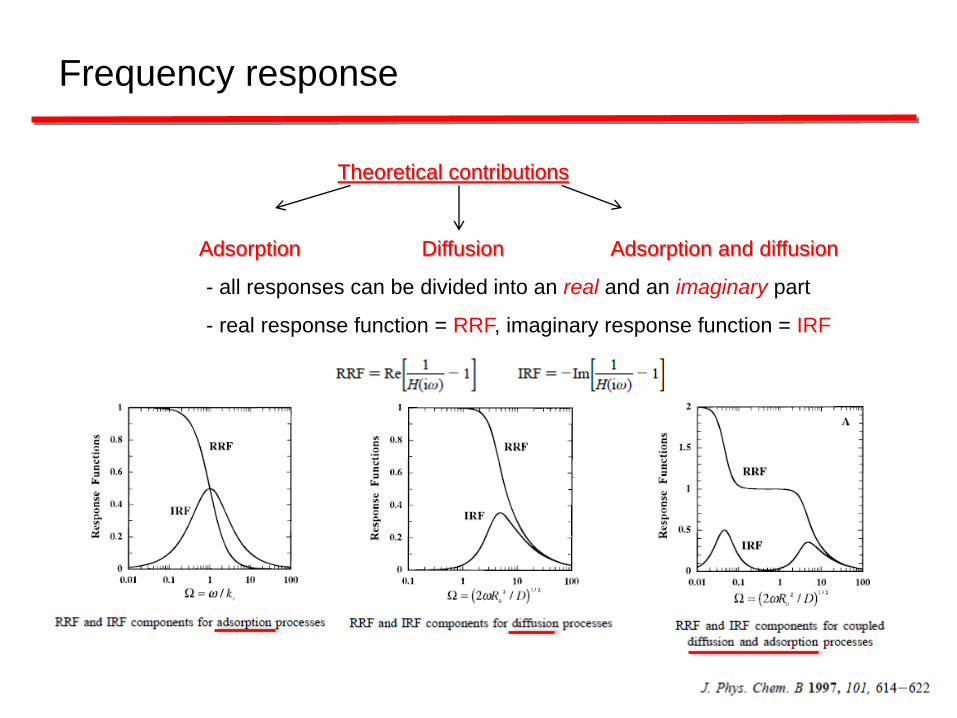
Theoretical contributions
Adsorption Diffusion Adsorption and diffusion
- all responses can be divided into an real and an imaginary part
- real response function = RRF, imaginary response function = IRF
Page 47
Frequency response
Theoretical contributions
Adsorption Diffusion Adsorption and diffusion
- all responses can be divided into a real and an imaginary part
- real response function = RRF, imaginary response function = IRF
Application to
N2, Xe, iso-butane
Page 48
Frequency response
Advantages
o FR allows to apply an additional degree of freedom in choosing
frequencies to decouple multiple dynamic processes
o FR delivers a high accuracy in realizing a smooth forcing function
o FR is able to conduct experiments at mean operating conditions
o FR anaylsis is relatively easy
o FR enables to discriminate between different rate-limiting steps
o FR weights all parts of response uniformly (no error build up in data analysis)
Page 49
Frequency response
Evaluation
o Bode plot is a graph of the transfer function of a linear, time-invariant system
versus frequency, plotted with a log-frequency axis, to show the system's frequency
response
Page 50
Frequency response
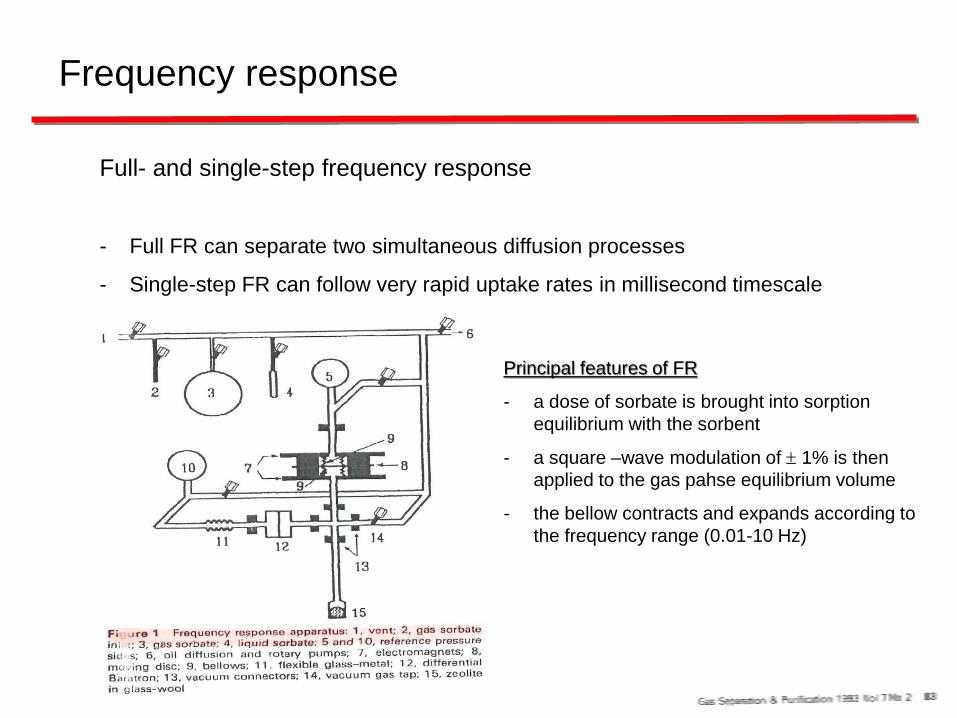
Full- and single-step frequency response
- Full FR can separate two simultaneous diffusion processes
- Single-step FR can follow very rapid uptake rates in millisecond timescale
Principal features of FR
- a dose of sorbate is brought into sorption
equilibrium with the sorbent
- a square –wave modulation of 1% is then
applied to the gas pahse equilibrium volume
- the bellow contracts and expands according to
the frequency range (0.01-10 Hz)
Page 51
Frequency response
Relationship between diffusion coefficient D,
frequency f, and crystal size r
- the range of diffusivities that can be covered
depends on the size of the adsorbent crystals
Page 52
Frequency response
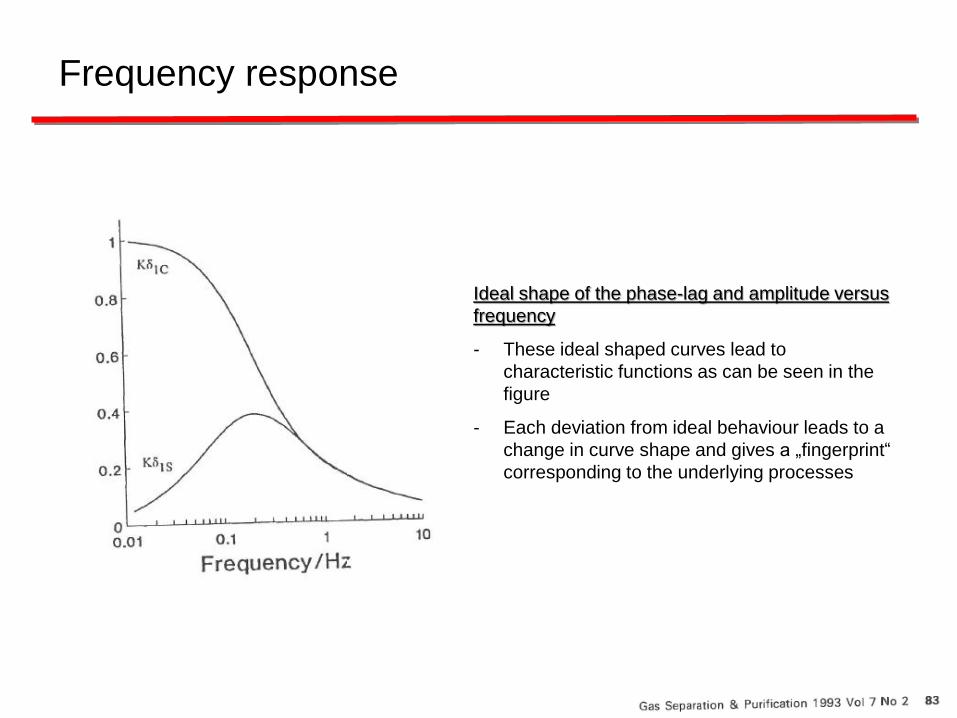
Ideal shape of the phase-lag and amplitude versus
frequency
- These ideal shaped curves lead to
characteristic functions as can be seen in the
figure
- Each deviation from ideal behaviour leads to a
change in curve shape and gives a „fingerprint“
corresponding to the underlying processes
Page 53
Frequency response
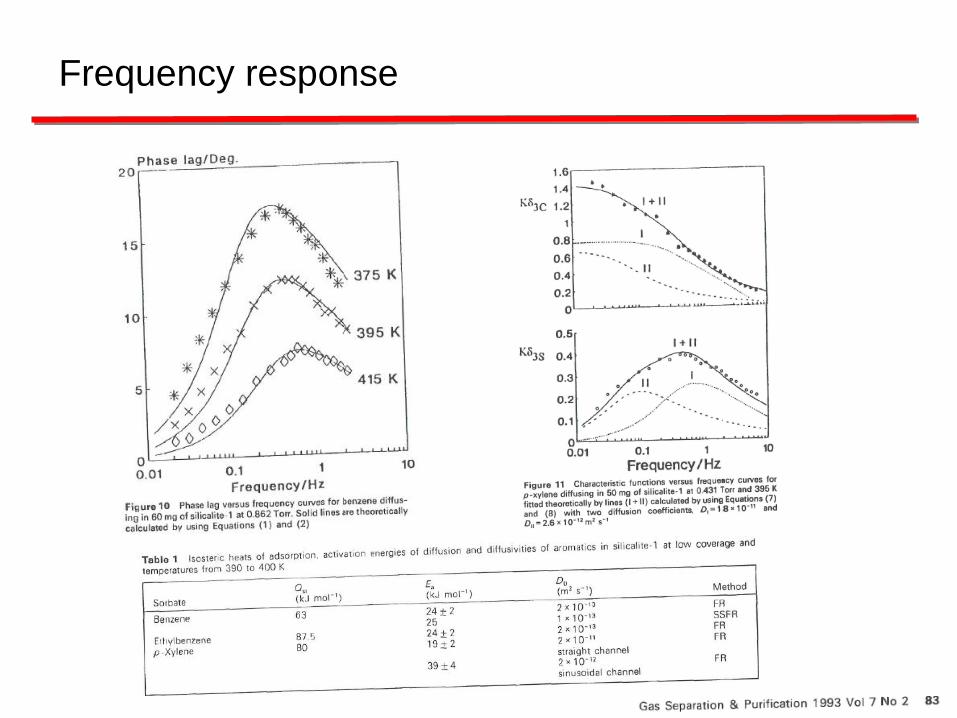
Real shape of the phase-lag and amplitude versus
frequency
- characteristic function versus frequency for two
diffusion processes (I+II)
- adsorption KI= 0.6 and KII= 0.3
- diffusion DI = 10-9 m2s-1, DII = 10-11 m2s-1
diffusion differs for a factor of 100 and adsorption
process is twice as large for the faster process
Page 54
Frequency response
Page 55
Anomalities in adsorption of hydrocarbons in
zeolites
Anomalous adsorption properties can be attributed to entropic or enthalpic effects or
combination of both effects
to energetically heterogeneous adsorption sites
to strong sorbate-sorbate interactions
How and when to realize such effects
like heterogeneity of sites?
complex profiles of isosteric heat of adsorption in calorimetry
computer simulations of adsorption complexes
sorbate-sorbate interactions
more to consider for aromatics than for alkanes in zeolites
will lead to redistribution and /or reorientation of sorbed molecules
Page 56
Anomalities in diffusion of hydrocarbons in
zeolites
Anomalous diffusion properties can be also attributed to entropic or enthalpic effects
or combination of both effects and depend (next to T, p) on
characteristics of sorbate
structure of zeolite channel
How and when to realize such effects
characteristic of sorbate (channel)
bimodal FR spectra for C1-C6 which results from dissipation of heat of
adsorption between sorbent and surrounding
at low loadings: pure single diffusion
at high loadings: efefct of heat of adsorption on diffusion
chain-length dependence of intracrystalline diffusion coefficients
Saturated cyclic hc diffuse more slowly than their aromatic equivalents
Page 57
Anomalities in adsorption and diffusion of
hydrocarbons in zeolites
Page 58
TAP – method and modeling
Page 59
TAP – A transient technique
• The key feature which distinguishes it from other pulse experiments is
that no carrier gas is used and, gas transport is the result of a pressure
gradient.
• At low pulse intensities the total gas pressure is very small, and gas
transport occurs via Knudsen diffusion only.
• Pulse residence time under vacuum conditions is much shorter than in
conventional pulse experiments. Thus a high time resolution is
achievable.
Page 60
TAP – Features
• Extraction of kinetic parameters differs compared to steady-state and
surface science experiments
- Steady-state: kinetic information is extracted from the transport-kinetics data
by experimentally eliminating effects of transport
- Surface science: gas phase is eliminated
- In TAP pulse experiments gas transport is not eliminated. The pulse
response data provides in-formation on the transport and kinetic parameters.
Page 61
• TAP pulse experiments are state-defining
- Typical pulse contains 1013 – 1014 molecules
or 1010 - 109 moles
- Example:
- Sulfated zirconia: 100 m2/g with 3 wt.% sulfur 5*1018 S/m2
- 1 pulse of n-butane: 1*1014 molecules
- per pulse 1/50000 of surface addressed
TAP – Features
Page 62
TAP – System hardware
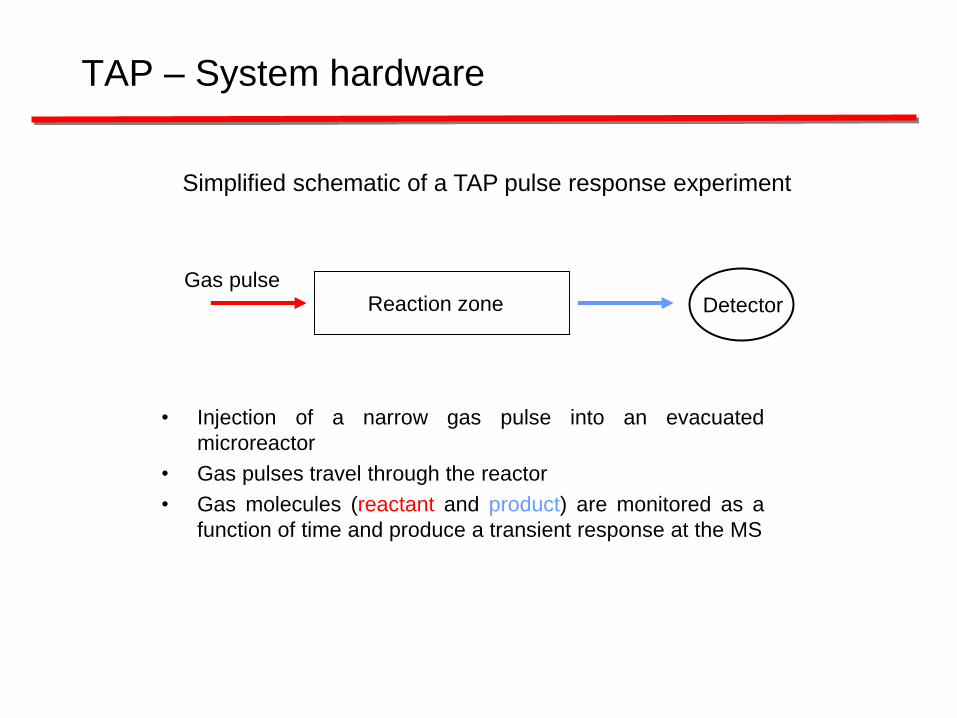
• Injection of a narrow gas pulse into an evacuated
microreactor
• Gas pulses travel through the reactor
• Gas molecules (reactant and product) are monitored as a
function of time and produce a transient response at the MS
Reaction zone Gas pulse
Detector
Simplified schematic of a TAP pulse response experiment
Page 63
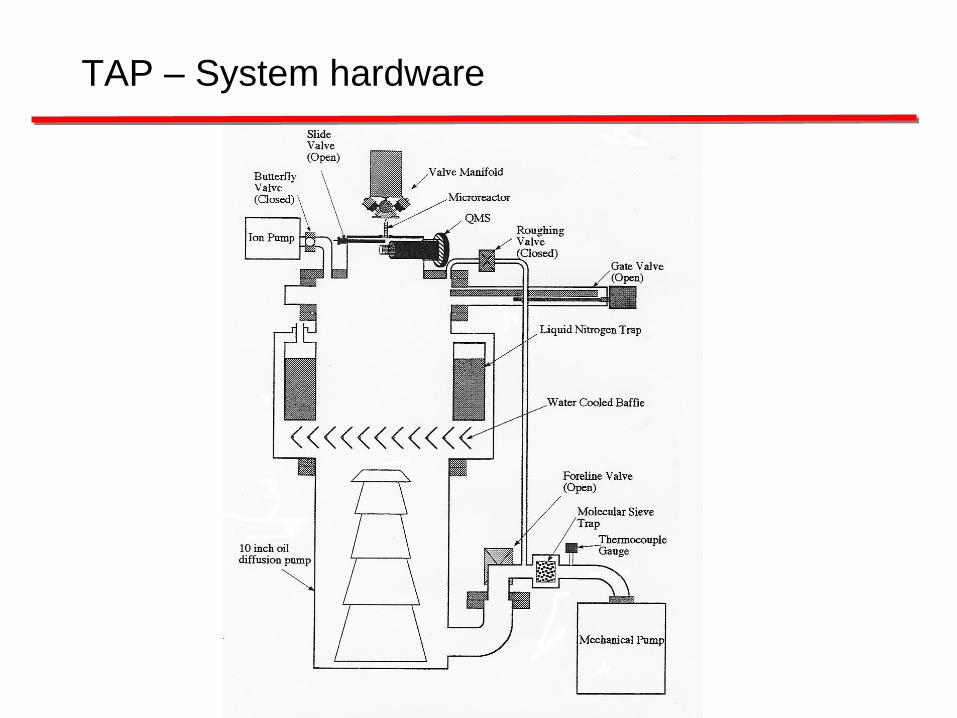
TAP – System hardware
Page 64
TAP – System hardware
1) High speed pulse valve
2) Pulse valve manifold
3) Microreactor
4) Mass spectrometer
5) Vacuum valve
6) Manual flow valve
7) Mosfet switch
Page 65
TAP – Response curves
Characteristic pulse response experimental outputs
Page 66
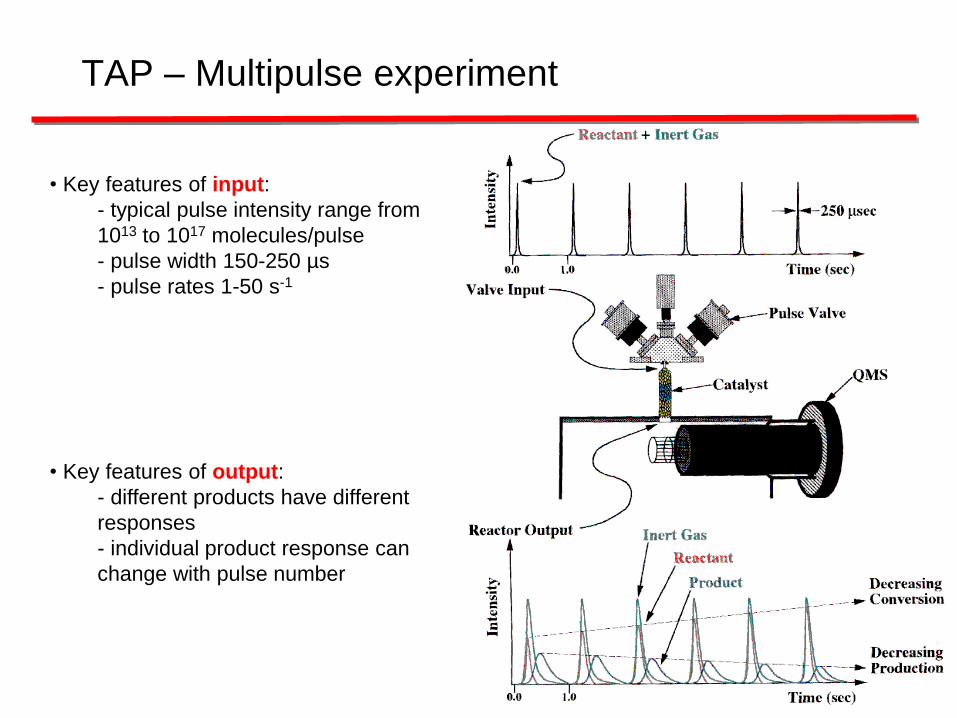
TAP – Multipulse experiment
• Key features of input:
- typical pulse intensity range from
1013 to 1017 molecules/pulse
- pulse width 150-250 µs
- pulse rates 1-50 s-1
• Key features of output:
- different products have different
responses
- individual product response can
change with pulse number
Page 67
TAP – Pump probe experiment
• Key features of input:
- different reaction mixtures are
introduced sequentially from
separate pulse valves
• Key features of output:
- output transient response
spectrum coincides with both valve
inputs
Page 68
TAP – Transient response data
In contrast to traditional kinetic methods, that measure concentrations, the observable
quantity in TAP pulse response experiments is the time dependent gas flow escaping
from the outlet of the microreactor.
The outlet flow is measured with a MS (QMS) that detects individual components of
the flow with great sensitivity.
The composition of the flow provides information on the types of chemical
transformation in the microreactor.
The time dependence of the flow contains information on gas transport and kinetics.
Page 69
TAP – Theory
Goal
• Interpretation of pulse response data
- determine typical processes
- find parameters for these processes
- develop a model
• Analysis of experiments that provide parameters of diffusion,
irreversible adsorption or reaction and reversible reaction
Page 70
TAP – General models
The mathematical framework for the one-zone-model was first
published in 1988 (Gleaves).
Basic assumptions of one-zone-model:
- catalyst and inert particle bed is uniform
- no radial gradient of concentration in the bed
- no temperature gradient (axial or radial)
- diffusivity of each gas is constant
Page 71
TAP – Gas transport model
The gas transport is the result of Knudsen diffusion.
An important characteristic of this tranport process is that the diffusivities
of the individual components of a gas mixture are independent of the
presssure or the composition of the mixture.
2
2
2
1
1
1T
MD
T
MD ee
De,i …effective Knudsen diffusivity
Mi …molecular weight
Ti …temperature
1,2 …gas 1, gas 2
Page 72
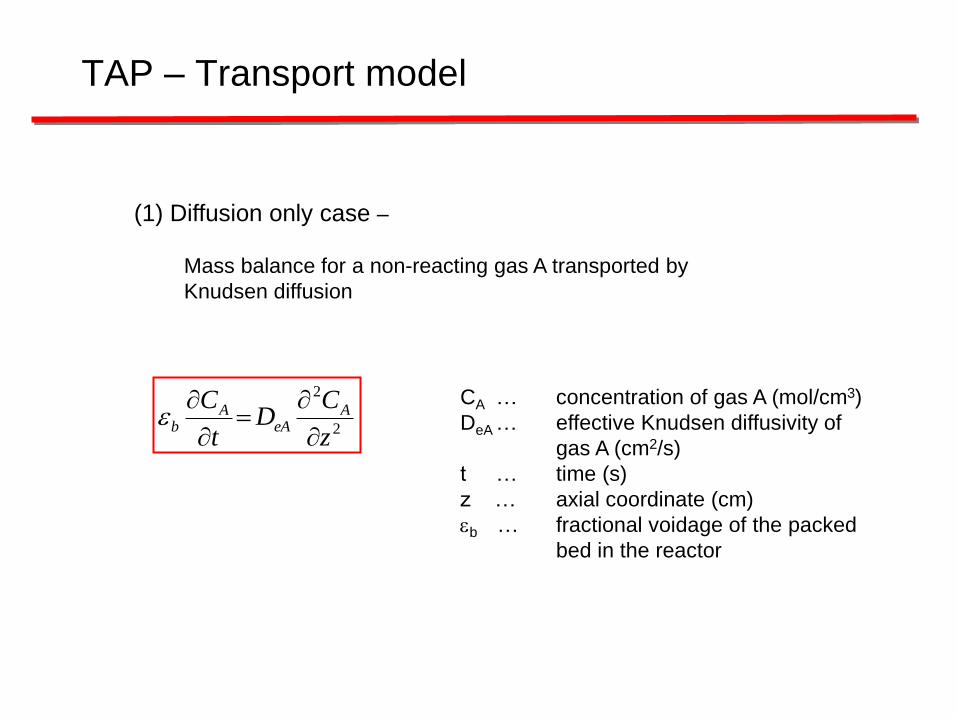
TAP – Transport model
2
2
z
CD
t
C AeA
Ab
(1) Diffusion only case –
Mass balance for a non-reacting gas A transported by
Knudsen diffusion
CA … concentration of gas A (mol/cm3)
DeA … effective Knudsen diffusivity of
gas A (cm2/s)
t … time (s)
z … axial coordinate (cm)
b … fractional voidage of the packed
bed in the reactor
Page 73
TAP – Transport model
a) Standard diffusion curve showing key time characteristics and the criterion for
Knudsen diffusion
b) Comparison of standard curve with experimental inert gas curve over inert
packed bed
Characteristic fingerprints for response curves
Page 74
TAP – Transport + adsorption model
AabvsA
eAA
b CkSaz
CD
t
C)1(
2
2
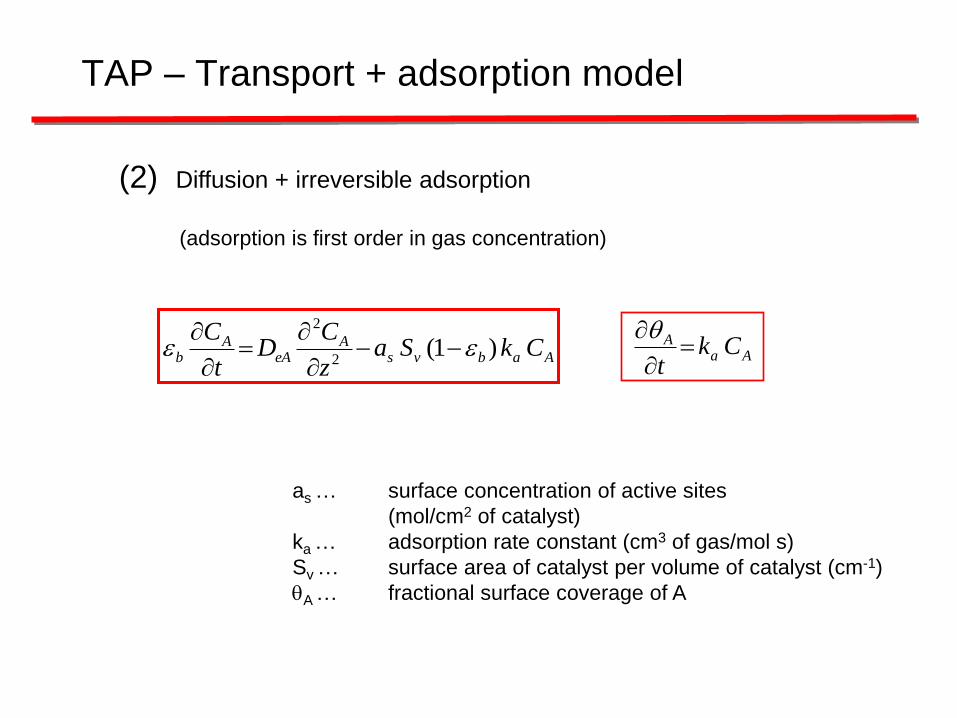
(2) Diffusion + irreversible adsorption
(adsorption is first order in gas concentration)
as … surface concentration of active sites
(mol/cm2 of catalyst)
ka … adsorption rate constant (cm3 of gas/mol s)
Sv … surface area of catalyst per volume of catalyst (cm-1)
A … fractional surface coverage of A
AaA Ckt
Page 75
TAP - Transport + adsorption model
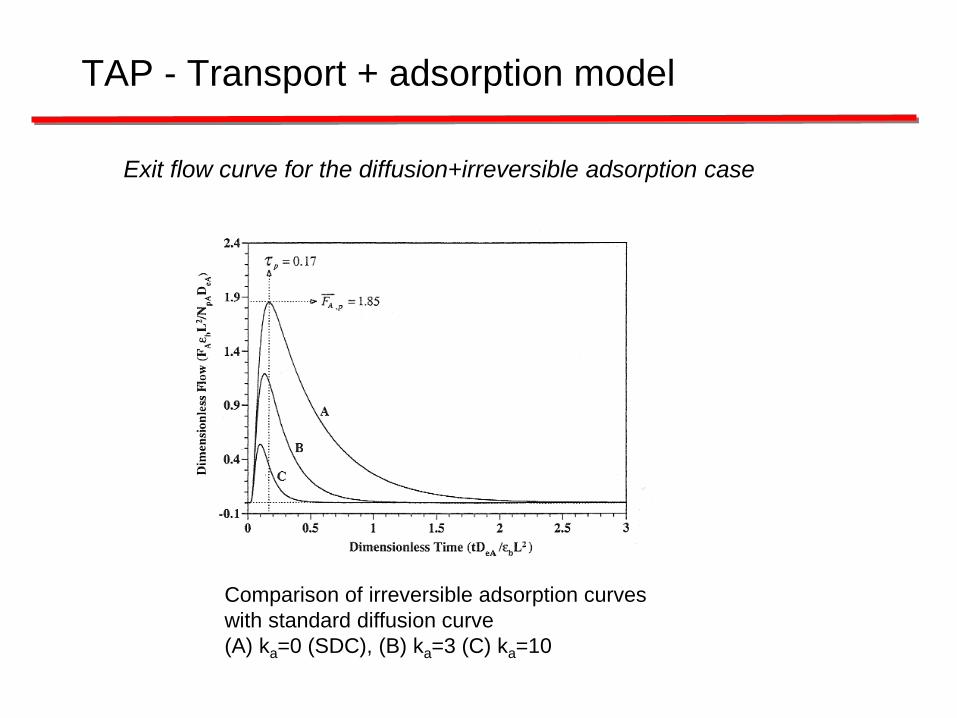
Exit flow curve for the diffusion+irreversible adsorption case
Comparison of irreversible adsorption curves
with standard diffusion curve
(A) ka=0 (SDC), (B) ka=3 (C) ka=10
Page 76
(3) Diffusion + reversible adsorption
Mass balances
- for component A in gas phase
)()1(2
2
AdAabvsA
eAA
b kCkSaz
CD
t
C
AdAaA kCkt
- for component A on the catalyst surface
kd …desorption rate constant (s-1)
TAP – Transport and adsorption model
Page 77
TAP - Transport + adsorption model
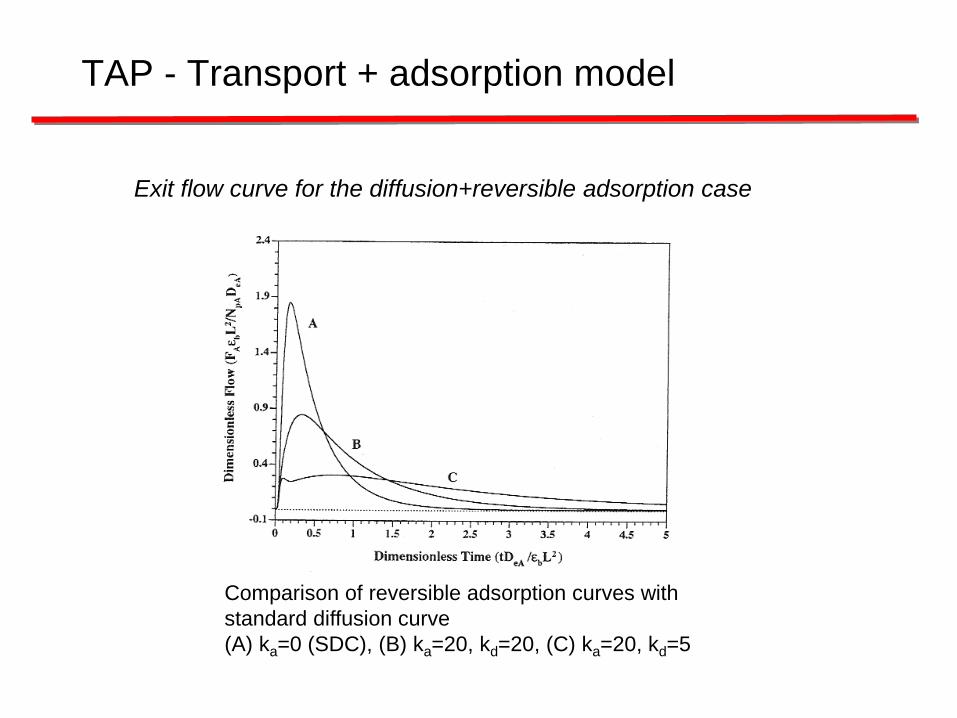
Exit flow curve for the diffusion+reversible adsorption case
Comparison of reversible adsorption curves with
standard diffusion curve
(A) ka=0 (SDC), (B) ka=20, kd=20, (C) ka=20, kd=5
Page 78
Applications of TAP
Page 79
Sulfated zirconias - catalysts and
porous model systems
A transient TAP study of the adsorption of C4-hydrocarbons on sulfated zirconias
C. Breitkopf. J. Mol. Catal. A: Chem. 226 (2005) 269.
Improvement of the catalytic isomerization performance for sulfated zirconias by use of templating techniques
M. Lutecki, C. Breitkopf, Appl. Catal. A: General (2009), 352(1-2), 171-178.
An Integrated Catalytic and Transient Study of Sulfated Zirconias:
Investigation of the Reaction Mechanism and the Role of Acidic Sites in n-Butane Isomerization
C. Breitkopf. ChemCatChem 1(2) 2009.
Diffusion and reaction in hierarchical structured metal oxides - a transient TAP study
Galinsky, M.; Lutecki, M.; Breitkopf, C.:
Diffusion and Defect Data--Solid State Data, Pt. A: Defect and Diffusion Forum (2010), 297-301
Synthesis and characterization of nanostructured sulfated zirconias
Lutecki, M.; Solcova, O.; Werner, St.; Breitkopf, C.:
Journal of Sol-Gel Science and Technology (2010), 53(1), 13-20
Sorption of Alkanes on Sulfated Zirconias - Modeling of TAP Response Curves
Matthias Galinsky, Michal Lutecki; Jürgen Böhm; Helmut Papp; Cornelia Breitkopf
accepted for publication in Chem. Eng. Sci.
Page 81
Thank you for your attention!
Page 82
Recommended literature and books
• Gleaves JT et al. Appl. Cat. A 160 (1997) 55-88.
• Phanawadee P. PhD thesis Washington 1997.
• Chen S. PhD thesis Washington 1996.
• Yablonsky GS et al. J. Catal. 216 (2003) 120-134.
• Gleaves JT et al. Cat. Rev.-Sci. Eng. 30 (1988) 49-116.
• Dumesic JA et al (Ed) „The Microkinetics of Heterogeneous Catalysis“ ACS, Washington 1993.
• Stoltze P. Progress in Surface Science 65 (2000) 65-150.
• Kobayashi H et al.. Cat. Rev.-Sci. Eng. 10 (1974) 139-176.
• Engel T, Ert G. Adv. Catal. 28 (1979) 1-78.
• Ertl G. The dynamics of interactions between molecules and surfaces. Berichte Bunsengesellschaft
für Physikalische Chemie 99 (1995) 1282.
• Creten G et al. J. Catal. 154 (1995) 151-152.
• Haber J. 1983. Concepts in catalysis by transition metal oxides. Bonelle JP et al. (Ed.) D. Reidel
Publishing Company. Surface Properties and Catalysis by Nonmetals. 45, 1-45.
• Hinrichsen O. DECHEMA-Kurs „Angewandte Heterogene Katalyse“, Bochum 2001.
• Dewaele O, Froment GF. J. Catal. 184 (1999) 499-513.
• Christoffel EG „Laboratory Studies of Heterogeneous Catalytic Processes“ Stud.Surf.Sci.Catal. 42.
• Müller-Erlwein E. Chemische Reaktionstechnik, Teubner Stuttgart-Leipzig, 1998, 237.
Page 83
Recommended literature and books
Frequency Response
….
Page 84
…continued
Jens Hagen
- Emig G., Klemm E.. Technische Chemie. Springer 2005.
- Baerns M., Behr A., Brehm A., Gmehling J., Hofmann H., Onken U., Renken A..
Technische Chemie, Viley VCH 2006.