Article Transient Modeling of Tubular-Designed IIR-SOFC Fueled by Methane, Methanol, and Ethanol Pannipha Dokamaingam 1,2,a* , Sureewan Areesinpitak 3,b, , and Navadol Laosiripojana 3,c 1 School of Health Science, Mae Fah Luang University, Chiang Rai, 57100, Thailand 2 Materials for Energy and Environment Research Group, Mae Fah Luang University, Chiang Rai, 57100, Thailand 3 The Joint Graduate School of Energy and Environment, King Mongkut’s University of Technology Thonburi, Bangkok 10140, Thailand E-mail: a [email protected](Corresponding author), b [email protected], c [email protected]Abstract. It is known that the heating rate during starting-up of Solid Oxide Fuel Cell (SOFC) plays an important role of system performance and lifetime. In the present work, an axial 2-D tubular Indirect Internal Reforming SOFC (IIR-SOFC) model fueled by methane, methanol, and ethanol was developed with the aim of predicting the system temperature gradient during the starting-up period. All predicted results was calculated by using COMSOL ® . The system was also compared with typical SOFC fueled by hydrogen. It was found that hydrogen heating gas required the lowest time to achieve the steady state (around 2 minutes) with the highest heating rate 0.93 K/s, which is not compatible for the thermal stress of SOFC material. The uses of methane, methanol, and ethanol as primary fuel can enhance compatible heating rate with the cell material, from which IIR-SOFC fueled by methanol is the best option in terms of its slow heating rate and high system efficiency. It is noted that the effects of inlet steam/carbon (S/C) ratio and gas flow pattern were also studied. It was observed that changing in S/C ratio is not significantly influence to temperature behaviors of the system. Meanwhile, IIR-SOFC with co-flow pattern provided smoother temperature gradient along cell and higher power density at steady state condition than that with counter-flow pattern. Keywords: Indirect internal reforming, heat-up period, transient, dynamic model, solid oxide fuel cell. ENGINEERING JOURNAL Volume 21 Issue 3 Received 10 July 2016 Accepted 1 November 2016 Published 15 June 2017 Online at http://www.engj.org/ DOI:10.4186/ej.2017.21.3.235
Transcript
Article
Transient Modeling of Tubular-Designed IIR-SOFC Fueled by Methane, Methanol, and Ethanol Pannipha Dokamaingam1,2,a*, Sureewan Areesinpitak3,b, , and Navadol Laosiripojana3,c
1 School of Health Science, Mae Fah Luang University, Chiang Rai, 57100, Thailand 2 Materials for Energy and Environment Research Group, Mae Fah Luang University, Chiang Rai, 57100, Thailand 3 The Joint Graduate School of Energy and Environment, King Mongkut’s University of Technology Thonburi, Bangkok 10140, Thailand E-mail: [email protected](Corresponding author), [email protected], [email protected] Abstract. It is known that the heating rate during starting-up of Solid Oxide Fuel Cell (SOFC) plays an important role of system performance and lifetime. In the present work, an axial 2-D tubular Indirect Internal Reforming SOFC (IIR-SOFC) model fueled by methane, methanol, and ethanol was developed with the aim of predicting the system temperature gradient during the starting-up period. All predicted results was calculated by using COMSOL®. The system was also compared with typical SOFC fueled by hydrogen. It was found that hydrogen heating gas required the lowest time to achieve the steady state (around 2 minutes) with the highest heating rate 0.93 K/s, which is not compatible for the thermal stress of SOFC material. The uses of methane, methanol, and ethanol as primary fuel can enhance compatible heating rate with the cell material, from which IIR-SOFC fueled by methanol is the best option in terms of its slow heating rate and high system efficiency. It is noted that the effects of inlet steam/carbon (S/C) ratio and gas flow pattern were also studied. It was observed that changing in S/C ratio is not significantly influence to temperature behaviors of the system. Meanwhile, IIR-SOFC with co-flow pattern provided smoother temperature gradient along cell and higher power density at steady state condition than that with counter-flow pattern. Keywords: Indirect internal reforming, heat-up period, transient, dynamic model, solid oxide fuel cell. ENGINEERING JOURNAL Volume 21 Issue 3 Received 10 July 2016 Accepted 1 November 2016 Published 15 June 2017 Online at http://www.engj.org/ DOI:10.4186/ej.2017.21.3.235
1. Introduction SOFC is the system that could directly convert chemical energy to electrical energy. Each single cell consists of porous ceramic electrodes and a solid oxide electrolyte. This system is operated at high temperature (1073-1273 K). Theoretically, SOFC system should be operated smoothly and continuously during working period, as called steady state operation. In order to achieve the steady-state condition, the SOFC system must be heated to a minimum operating temperature. During heat up period, kinetic and thermodynamic properties are fluctuated, as known as transient operating condition. This is also affected to the temperature distribution character in the system, especially, SOFC integrated with reforming system. Generally, the SOFC could be integrated with a reformer in an autothermal operation approach. This integrated system might be fabricated into 2 configurations [1, 2] direct internal reforming (DIR-SOFC) and indirect internal reforming (IIR-SOFC). In DIR-SOFC, endothermic reforming reactions and exothermic electrochemical reactions take places simultaneously at the anode side of SOFC. Thus, anode material could be easily poisoned by carbon deposition from the hydrocarbons reforming reactions. As IIR-SOFC configuration, the reforming reaction presents in a reformer, which is close thermal contact with the anode side of an SOFC. Therefore, the anode material of the IIR-SOFC is prevented from carbon formation. Essentially, another main problem of both the DIR-SOFC and the IIR-SOFC approach is the possible mismatch between rates of endothermic and exothermic reactions. This draws significant local temperature reduction and subsequently results in mechanical failure due to thermal induced stresses [3-6].
In order to minimize the effect of the cell structural failure form thermal stress, the desired dynamic operating condition for SOFC/IR-SOFC was simulated by several researches [7-10]. During heat up phase application, the effect of heat/mass transfer and electrochemical reaction of dynamic modeling of a single tubular SOFC was developed by Xue et al. [11]. The calculation showed that system temperature is fluctuated during heat up period and reached steady state after 4,000 s. Serincan et al. [5] developed a 2-D axial symmetry model to simulate thermal stress of the micro tubular SOFC tubular at steady state condition. In their result, the thermal stresses rising during the operation cause increased system temperature around 284 K at 0.7 V. They were also simulated this cell geometry under the transient condition and found that the system reaches steady state operation within 20 s. During this period, temperature of the system was also increases from 831 to 840 K [6]. Peksen et al. [12] improved the dynamic 3-D model for planar SOFCs to calculate the distributions of temperature, thermo-mechanical stress in their geometry during heat up, operation and cool down stage. Through heating-up phase within the first two hours, temperature gradient across the assembly at the earlier stages was higher than the end phase. Moreover, the dynamic temperature behavior of IR-SOFC was more calculated in DIR-SOFC configuration [13, 14]. Furthermore, Selimovic et al. [15] was also study the dynamic behavior of a planar electrolyte supported SOFC with internal reforming and bipolar interconnect plates during heat up period by using the 2-D mathematical model. They found that the system would reach steady state within 30 minutes when heated up by using H2. This was 30 minutes faster than using CH4.
Since the dynamic characteristic of a tubular IIR-SOFC is less studied. However, the previous work presented that the temperature distribution of a tubular IIR-SOFC with internal catalytic coated wall internal reformer was smoother than a packed bed internal reformer [16]. As the objective to reduce the thermal cracking of the IIR-SOFC, this configuration was selected in this study. In order to achieve the practical operating condition for the coated wall tubular IIR-SOFC, the transient 2-D mathematical model was also developed. The thermal and electrical performance was studied when using different heating fuel types. Furthermore, the influences of the inlet steam/carbon (S/C) ratio and the gas flow pattern on the thermal and electrical performance of selected heating fuel was also simulated.
2. Mathematical Models 2.1. Model Geometry As the previous study, the tubular IIR-SOFC with coated-wall internal reformer provided smoother methane conversion and significant lower local cooling at the entrance of internal reformer [16]. Thus, that configuration, shown in Fig. 1, was selected in this present work. According to Fig. 1, primary fuels are converted to hydrogen-rich gas at internal reformer before introduced to fuel channel of tubular SOFC. Simultaneously, air is fed with opposite flow direction through air channel. It is noted that all dimensions
and physical properties of SOFC system in the present work, which are summarized in Table 1, are based on previous reports from literatures [11, 17, 18]. Since this configuration is a tubular design, the simplified mathematical model is set as 2-D axisymmetric boundary in COMSOL®
Fig. 1. Schematic view of tubular IIR-SOFC with coated-wall reformer. Table 1. Dimension and constant parameter values of tubular IIR-SOFC system.
Parameter Value Reference
Fuel cell Length 0.60 m [18]
Reformer radius 32 10 m [18]
In side radius of the cell 35.4 10 m [18]
Anode thickness 31 10 m [18]
Electrolyte thickness 54 10 m [18]
Cathode thickness 55 10 m [18]
Anode permeability 121 10 [17]
Cathode permeability 121 10 [17]
Average density of triple phase 633.73 kg/m3 [11]
Average specific heat of triple phase 574.3 J/kg/K [11]
Anode thermal conductivity 6.23 W/m/K [11]
Electrolyte conductivity 2.7 W/m/K [11]
Cathode thermal conductivity 9.6 W/m/K [11]
Convection coefficient in the fuel channel 2,987 W/m2/K [11]
Convection coefficient in the air channel 1,322.8 W/m2/K [11]
2.2. Model Assumption and Equations The model is developed as the smallest unit cell taking into account the effect of temperature on the gas distribution and the conversion of reactants. All assumptions made are:
• Each section is considered as non-isothermal transient conditions. • Ideal gas behavior is applied for all gas components. • Pressure drop in SOFC stack and coated-wall reformer are neglected. • Fuel utilization was fixed constantly at 80% along the cell coordinate. • Radiation heat transfer is not accounted.
A number of equations were applied to predict concentration and temperature gradients along this tubular IIR-SOFC system. Details for these set of equations were presented below. 2.2.1. Gas distribution Brinkman equation (Eq. (1)) is applied to calculate gas distribution in electrodes (considering the effect of porous media on gas flow character and velocity gradient), while incompressible Navier-Stokes equation (Eq. (2)) [19] is used to predict gas flow pattern in all gas channels.
where v is fluid velocity, is density, p is pressure, is effective viscosity, and pk is permeability. It is
noted that the influences of pressure and velocity gradients on gas diffusion properties are taken into account by applying molecular diffusion and binary diffusion equations (Eq. (3) and (4), respectively) [20].
,
,
(1 )( )
ii mix
j ij
j j
yD
y D
(3)
1.75
1 2 1 3 1 3 2,,
(0.00143)[ ]i j
i j i j
TD
pM
(4)
where ,i mixD and , i jD are molecular diffusion and binary diffusion flux of species i in mixed gas (m2/s), iy
is the mole fraction of species i, p is pressure, , 2 / (1/ 1/ )i j i jM M M and Mi is molecular weight of
component i, and is the special diffusion volume as reported by Fuller [21]. In the case of porous media,
the diffusion behaviour is corrected by applying porosity ( ) and tortuosity ( ); as called effective
diffusivity coefficient, ,
e
i pmixD (Eq. (5)). Furthermore, gas diffusion through porous media, ,i pmixD , is
explained by two mechanisms i.e. molecular diffusion ( ,i mixD ) (from Eq. (6)), and Knudsen diffusion ( ,i kuD )
[22] (from Eq. (7)) depending on the relation between pore diameter ( pd ) and mean free path of molecular
species.
, ,
e
i pmix i pmixD D
(5)
, , ,
1 1 1
i pmix i mix i kuD D D (6)
.
1 8
3i ku p
i
RTD d
M (7)
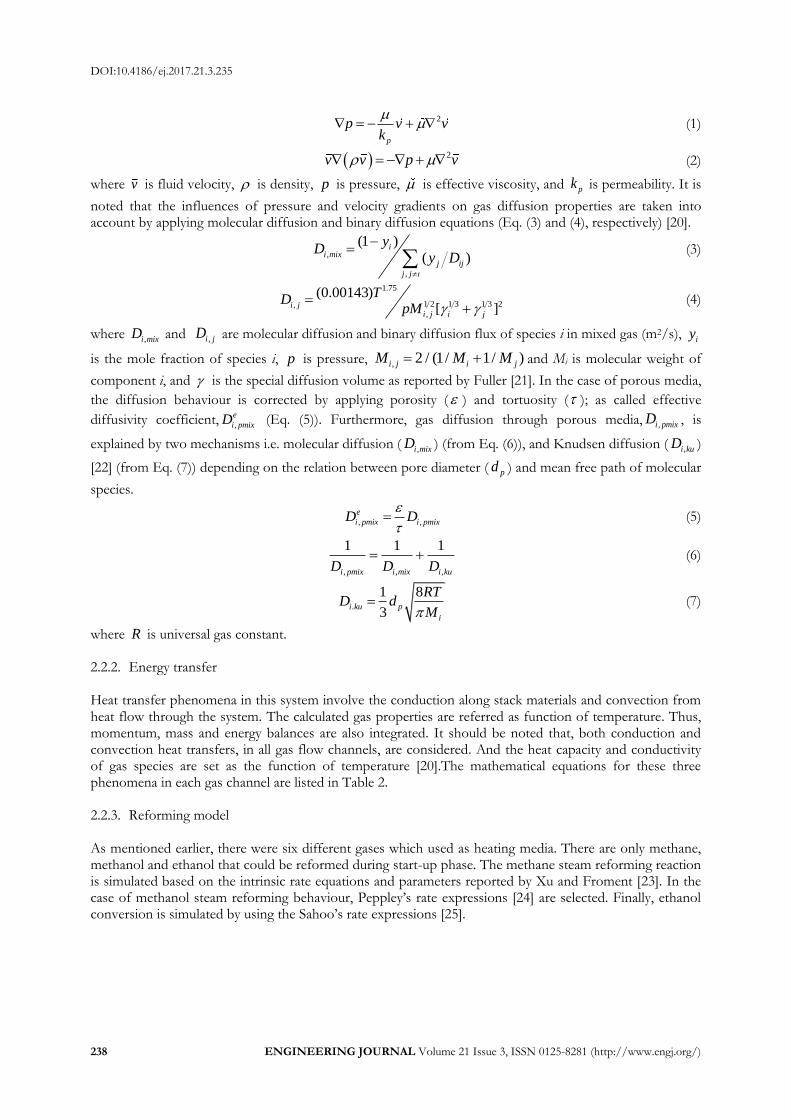
where R is universal gas constant. 2.2.2. Energy transfer Heat transfer phenomena in this system involve the conduction along stack materials and convection from heat flow through the system. The calculated gas properties are referred as function of temperature. Thus, momentum, mass and energy balances are also integrated. It should be noted that, both conduction and convection heat transfers, in all gas flow channels, are considered. And the heat capacity and conductivity of gas species are set as the function of temperature [20].The mathematical equations for these three phenomena in each gas channel are listed in Table 2. 2.2.3. Reforming model As mentioned earlier, there were six different gases which used as heating media. There are only methane, methanol and ethanol that could be reformed during start-up phase. The methane steam reforming reaction is simulated based on the intrinsic rate equations and parameters reported by Xu and Froment [23]. In the case of methanol steam reforming behaviour, Peppley’s rate expressions [24] are selected. Finally, ethanol conversion is simulated by using the Sahoo’s rate expressions [25].
Table 2. List of transient 2-D equations model for tubular coated-wall reformer.
Coated-wall reforming model
Mass balance ( )ii i i i
cD c R u c
t
(8)
Energy Balance ( )p
TC u T k T Q
t
(9)
Momentum Balance ( ) [ ( ( ) )]Tuu u pI u u
t
(10)
Fuel Channel and Air Channel
Mass Balance ( ) 0ii i
cD c
t
(11)
Energy Balance ( )p
TC u T k T Q
t
(12)
Momentum Balance ( ) [ ( ( ) )]Tuu u pI u u
t
(13)
Solid cell
Energy Balance ( )p
TC k T Q
t
(14)
2.2.4. SOFC model All momentum, mass, heat and charge balance equations for SOFC systems in the present work are given in Table 2, Eq. (8)-(14). In detail, all electrochemical reactions take place at electrodes and electrolyte interface to generate electricity from both hydrogen and carbon monoxide. The cell voltage is theoretically calculated from the Nernst Equation. However, the actual voltage is usually less than the theoretical value since the presences of activation, concentration and ohmic over potentials [1, 2]. 2.2.5. Activation loss
Activation loss,act , is the activation barrier of electrochemical reaction at electrode, which is significant at
low current density [2]. This overpotential is determined from Butler-Volmer equation, Eq. (15). The relations of current density with hydrogen and oxygen concentrations at electrodes are given in Eq. (16) and Eq. (17) [17]. Since the expression of activation loss from carbon monoxide oxidation is not well ascertained, the current density from CO is assumed to be 3 times lower than that from H2 (Eq. (18)) [26].
0 exp exp (1e eact act
n F n Fj j
RT RT
(15)
2 2
2
,
0, expH H O act anode
H anode
ref ref
p p Ej
p p RT
(16)
2
2
0.25
,
0, expO act cathode
O cathode
ref
p Ej
p RT
(17)
20, 0,
1
3CO Hj j (18)
where 0j is exchange current density, j is current density, is exchange current density constant, is
charge transfer coefficient, en is number of electron, F is Faraday’s constant and actE is activation energy.
This overpotential, con , is caused by the dropping of pressure or partial pressure of reactant gases along
porous electrodes at reaction sites [2]. It is normally reduced at high current density. The diffusion at bulk zone as defined in term of concentration overpotential is given in Eq. (19) [27, 28]. According to the works from Suwanwarangkul et al. [28] and Hernández-Pacheco [29], the dusty gas model is applied to calculate concentration at active site.
2 2 2 2
2 2 2 2
* *ln( ) ln( ) ln( )
2 2 4
H H O CO CO O
con
H H O CO CO O
p p p p pRT RT RT
F p p F p p F p
(19)
where * represent gas partial pressure at active site. 2.2.7. Ohmic overpotential
This overpotential, ohm , occurs from the ion transport across the cell, which mainly depends on ionic
conductivity of cell material [2]. By applying ohm’s law, the relation of ohmic overpotential and material resistivity is given in Eq. (20)-(21) [30], in which the resistivity is determined from Eq. (15) based on the data in Table 3.
ohm ohmjR (20)
ohm
elec
RA
(21)
exp( )a b T (22)
where ohmR is ohmic resistance, is ionic conductivity, is thickness of electrode or electrolyte layer, and
,a b are constant property of material.
Table 3. Resistivity of cell components, Ni-YSZ/YSZ/LSM [30].
Anode resistance constant 0.0000298, 1392 a b
Cathode resistance constant 0.0000811, 600a b
Electrolyte resistance constant 0.0000294, 10350a b
Considering all polarizations, the cell performance is determined in terms of the electrical efficiency. It
is noted that the anodic current is calculated from both H2 and CO conversion rates, whereas the cell
efficiency,elec , is calculated from the ratio between output power density (P) and the energy of the all
input fluids, Eq. (23).
,1173
. actelec in
i i K
P A
y LHV
(23)
where actA is the activation area, (m2 ), P is the power density (W/cm2), ,1173i KLHV is the lower heating
value of component i at 1173 K., and in
iy is the mole fraction of the inlet gas, i.
The governing equations of mass and heat transfers for anode SOFC are summarized in Table 2. It should be noted that the electric current and voltage obtained from the developed model in the present work is validated with the work from Leng et al. [31], both results are in good agreement, as compared in Fig. 2.
Fig. 2. I-V curve comparison between simulation and experimental result [31].
3. Results and Discussion The axial 2-D tubular IIR-SOFC has been calculated in terms of reactant gas conversion, temperature distribution and flow configuration under transient condition. The parameters are taken in consideration in order to evaluate the heating rates during starting-up period of IIR-SOFC that compatible with SOFC material. 3.1. Temperature Behavior with Different Heat up Media Types The initial temperature of dynamic tubular IIR-SOFC model with coated wall reformer is fixed at 500 K. The model is firstly simulated at inlet temperature and pressure are 1173 K and 1 bar, respectively. The inlet gases velocity is also controlled at 30.5 x 10⁻³ m/s. As described above, methane, methanol and ethanol could be reforming via steam reforming reactions during heat up phase. In this study, S/C ratio of methane, methanol and ethanol are 3/1, 2/1 and 4/1, respectively. In all study case, each heat-up gas is fed at the entrance of reformer (dimensionless axial = 0) and flow out the cell via fuel channel (dimensionless axial = 0) whereas air steam is fed at the end of the system (dimensionless axial = 0). Therefore, the gases steam in a fuel channel is counter to gases in an air channel. For comparison, the hydrogen gas is also chosen as the primary fuel. From the simulation, the hydrogen-fed system reaches the steady state temperature after 2 minutes. Although this heat-up pattern provides relatively short start-up time, the extremely high heating rate (0.93 K/s) could result in the high thermal stress of material and consequently damage the SOFC system [32].
When hydrocarbon gases are used as primary fuels, the endothermic steam reforming reactions are initiated together with the exothermic electrochemical reaction. For methane, the system temperature is achieved 1173 K after 36 minutes and continuously increased until reach the steady state after 1 hour. Figure 3 shows the profile of methane at different times. Under this operation, the heating rate during this starting-up period is observed to be 0.31 K/s, which is compatible with the cell material. Alternatively, considering other potential primary fuels, ethanol and methanol are also interesting candidates due to their ready availability, high-specific energy, sulfur free and convenience for storage and transportation. Moreover, they can be produced renewably from both chemical and biological processes. Therefore, these
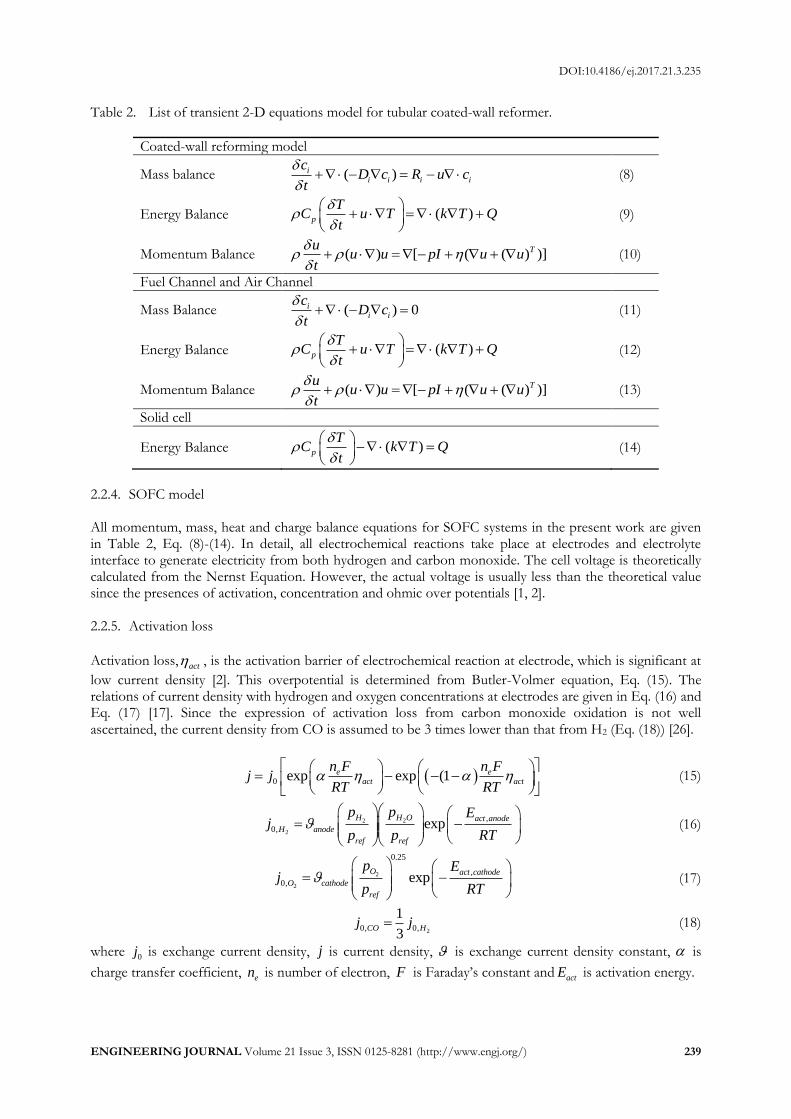
alcohols are selected for study as the heating-up gases. Similar to the case of methane, the methanol steam reforming reaction(S/C ratio = 2/1) occurs firstly at the internal reformer prior to the electrochemical reaction at the fuel channel, as shown in Fig. 4. It can be seen that the system temperature reaches 1173 K after 1.6 hours and become steady state after 5 hours. The heating-up rate for this case is observed to be 0.11 K/s, which is relatively lower than that of hydrogen, and methane. For the case of IIR-SOFC fueled by ethanol, the similar trend of temperature concentration gradients with time as IIR-SOFC fueled by methanol were observed. Nevertheless, it takes shorter time to reach the SOFC operating temperature than methanol (around 7 minutes) whereas heating-up rate about 0.26 K/s. However, it should be noted that this IIR-SOFC fueled by ethanol becomes steady state after 3 hours (Fig. 5).
Fig. 3. Concentration of CH4 along the cell for methane heat up gas at (a) 6 mins, (b) 40 mins, (c) 1 hour, (d) 2 hours, (e) 4 hours.
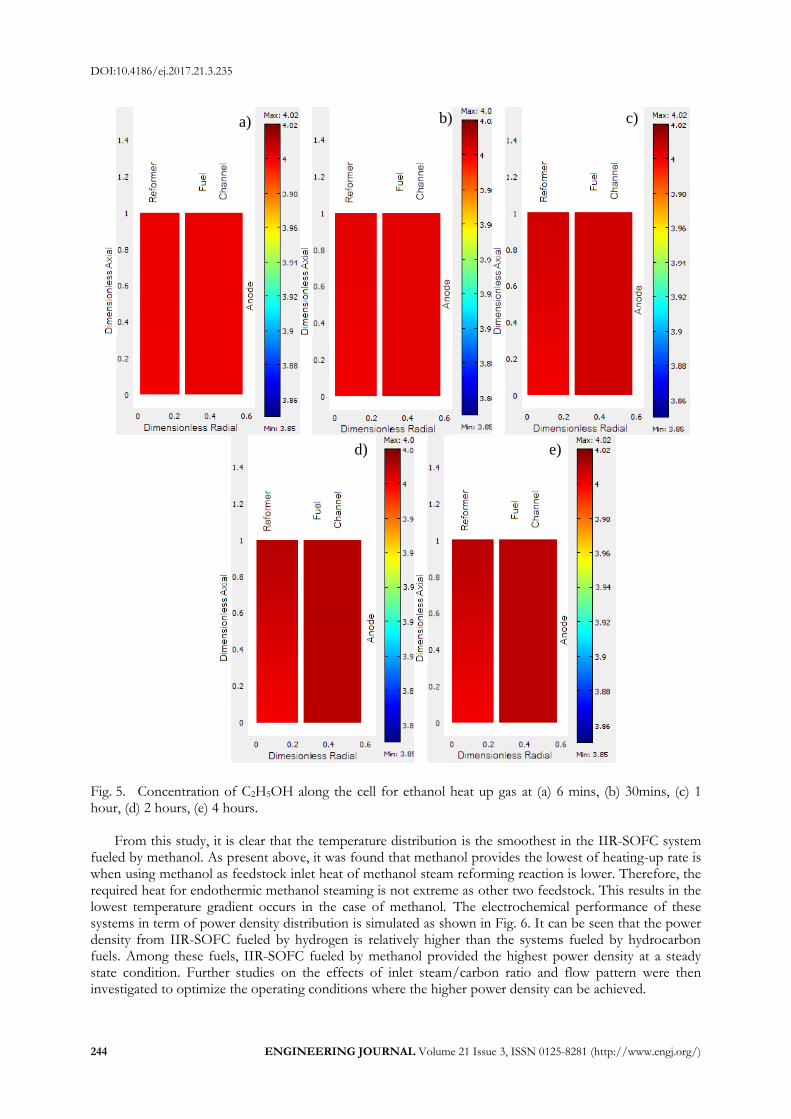
Fig. 5. Concentration of C2H5OH along the cell for ethanol heat up gas at (a) 6 mins, (b) 30mins, (c) 1 hour, (d) 2 hours, (e) 4 hours.
From this study, it is clear that the temperature distribution is the smoothest in the IIR-SOFC system fueled by methanol. As present above, it was found that methanol provides the lowest of heating-up rate is when using methanol as feedstock inlet heat of methanol steam reforming reaction is lower. Therefore, the required heat for endothermic methanol steaming is not extreme as other two feedstock. This results in the lowest temperature gradient occurs in the case of methanol. The electrochemical performance of these systems in term of power density distribution is simulated as shown in Fig. 6. It can be seen that the power density from IIR-SOFC fueled by hydrogen is relatively higher than the systems fueled by hydrocarbon fuels. Among these fuels, IIR-SOFC fueled by methanol provided the highest power density at a steady state condition. Further studies on the effects of inlet steam/carbon ratio and flow pattern were then investigated to optimize the operating conditions where the higher power density can be achieved.
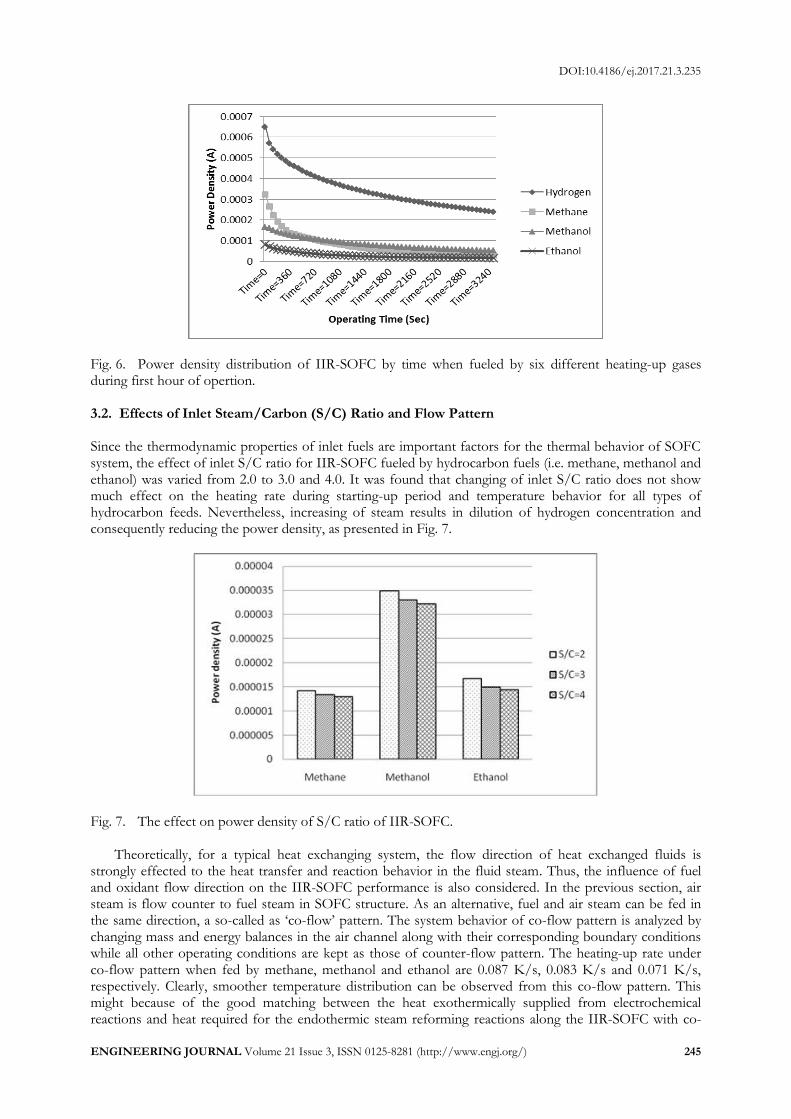
Fig. 6. Power density distribution of IIR-SOFC by time when fueled by six different heating-up gases during first hour of opertion. 3.2. Effects of Inlet Steam/Carbon (S/C) Ratio and Flow Pattern Since the thermodynamic properties of inlet fuels are important factors for the thermal behavior of SOFC system, the effect of inlet S/C ratio for IIR-SOFC fueled by hydrocarbon fuels (i.e. methane, methanol and ethanol) was varied from 2.0 to 3.0 and 4.0. It was found that changing of inlet S/C ratio does not show much effect on the heating rate during starting-up period and temperature behavior for all types of hydrocarbon feeds. Nevertheless, increasing of steam results in dilution of hydrogen concentration and consequently reducing the power density, as presented in Fig. 7.
Fig. 7. The effect on power density of S/C ratio of IIR-SOFC.
Theoretically, for a typical heat exchanging system, the flow direction of heat exchanged fluids is strongly effected to the heat transfer and reaction behavior in the fluid steam. Thus, the influence of fuel and oxidant flow direction on the IIR-SOFC performance is also considered. In the previous section, air steam is flow counter to fuel steam in SOFC structure. As an alternative, fuel and air steam can be fed in the same direction, a so-called as ‘co-flow’ pattern. The system behavior of co-flow pattern is analyzed by changing mass and energy balances in the air channel along with their corresponding boundary conditions while all other operating conditions are kept as those of counter-flow pattern. The heating-up rate under co-flow pattern when fed by methane, methanol and ethanol are 0.087 K/s, 0.083 K/s and 0.071 K/s, respectively. Clearly, smoother temperature distribution can be observed from this co-flow pattern. This might because of the good matching between the heat exothermically supplied from electrochemical reactions and heat required for the endothermic steam reforming reactions along the IIR-SOFC with co-
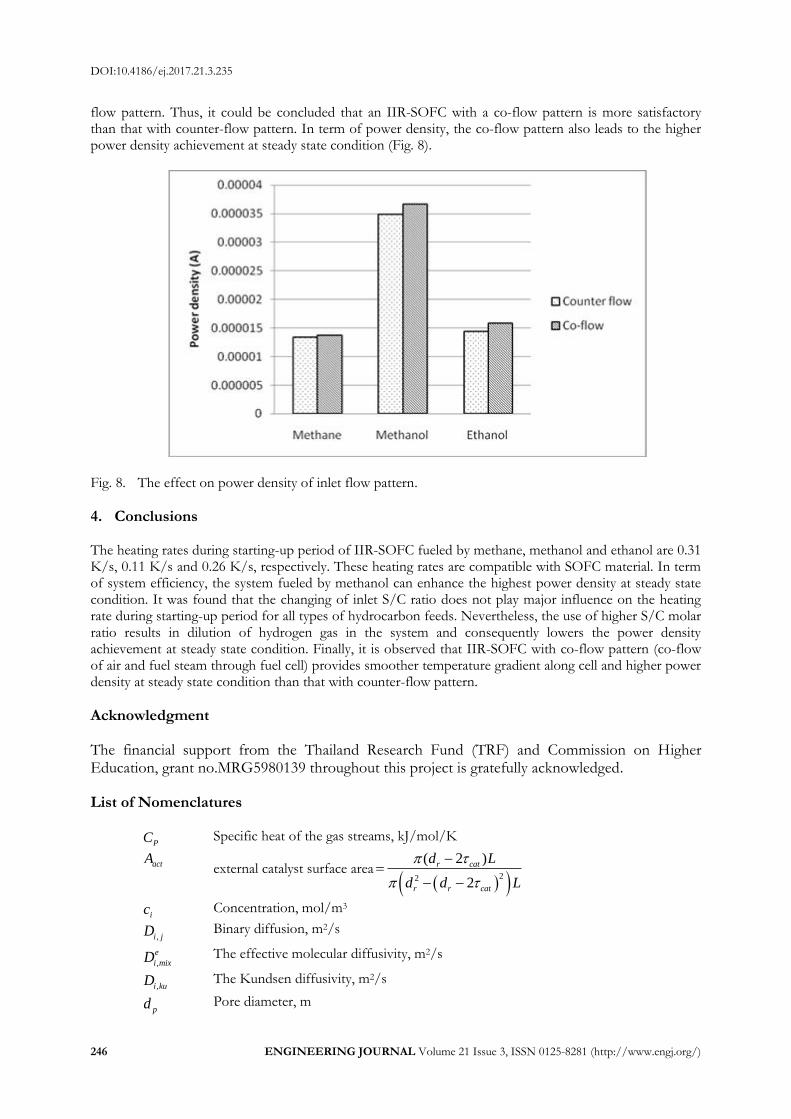
flow pattern. Thus, it could be concluded that an IIR-SOFC with a co-flow pattern is more satisfactory than that with counter-flow pattern. In term of power density, the co-flow pattern also leads to the higher power density achievement at steady state condition (Fig. 8).
Fig. 8. The effect on power density of inlet flow pattern.
4. Conclusions The heating rates during starting-up period of IIR-SOFC fueled by methane, methanol and ethanol are 0.31 K/s, 0.11 K/s and 0.26 K/s, respectively. These heating rates are compatible with SOFC material. In term of system efficiency, the system fueled by methanol can enhance the highest power density at steady state condition. It was found that the changing of inlet S/C ratio does not play major influence on the heating rate during starting-up period for all types of hydrocarbon feeds. Nevertheless, the use of higher S/C molar ratio results in dilution of hydrogen gas in the system and consequently lowers the power density achievement at steady state condition. Finally, it is observed that IIR-SOFC with co-flow pattern (co-flow of air and fuel steam through fuel cell) provides smoother temperature gradient along cell and higher power density at steady state condition than that with counter-flow pattern.
Acknowledgment
The financial support from the Thailand Research Fund (TRF) and Commission on Higher Education, grant no.MRG5980139 throughout this project is gratefully acknowledged.
References [1] H. Gregor, “Fuel cell components and their impact on performance”, in Fuel Cell Technology Handbook,
H. Gregor, Ed. Florida: CRC Press, 2003, pp. 414-427. [2] J. Larminie, A. Dicks, M. S. McDonald, Fuel Cell Systems Explained. Chichester: John Wiley, 2003. [3] P. Aguiar, C. S. Adjiman, and N. P. Brandon, “Anode-supported intermediate temperature direct
internal reforming solid oxide fuel cell. I: model-based steady-state performance,” J. Power Sources, vol. 138, pp. 120-136, Nov. 2004.
[4] L. Liu, G.-Y. Kim, and A. Chandra, “Modeling of thermal stresses and lifetime prediction of planar solid oxide fuel cell under thermal cycling conditions,” J. Power Sources, vol. 195, pp. 2310-2318, Apr. 2010.
[5] M. F. Serincan, U. Pasaogullari, and N. M. Sammes, “Thermal stresses in an operating micro-tubular solid oxide fuel cell,” J. Power Sources, vol. 195, pp. 4905-4914, Aug. 2010.
[6] M. F Serincan, U. Pasaogullari, and N. M. Sammes, “A transient analysis of a micro-tubular solid oxide fuel cell (SOFC),” J. Power Sources, vol. 194, p. 864-872, Dec. 2009.
[7] E. Achenbach and E. Riensche, “Methane/steam reforming kinetics for solid oxide fuel cells,” J. Power Sources, vol. 52, pp. 283-288, Dec. 1994.
[8] D. J. Hall and R. G. Colclaser, “Transient modeling and simulation of a tubular solid oxide fuel cell,” IEEE. T. Energy Conver., vol. 14, no. 1, pp. 749-753, Sep. 1999.
[9] S. G. Neophytides, “The reversed flow operation of a crossflow solid oxide fuel cell monolith,” Chem. Eng. Sci., vol. 54, pp. 4603-4613, Oct. 1999.
[10] T. Ota, M. Koyama, C. Wem, K. Yamada, and H. Takahashi, “Object-based modeling of SOFC system: dynamic behavior of micro-tube SOFC,” J. Power Sources, vol. 118, pp. 430-439, May 2003.
[11] X. Xue, and J. Tanga, N. Sammesa, and Y. Dub, “Dynamic modeling of single tubular SOFC combining heat/mass transfer and electrochemical reaction effects,” J. Power Sources, vol. 142, pp. 211-222, Mar. 2005.
[12] M. Peksen, A. Al-Masri, L. Blum, and D. Stolten, “3D transient thermomechanical behaviour of a full scale SOFC short stack,” Int. J. Hydrogen Energ., vol. 38, pp. 4099-4107, Apr. 2013.
[13] P. Aguiar, C. S. Adjiman, and N. P. Brandon, “Anode-supported intermediate-temperature direct internal reforming solid oxide fuel cell: II. Model-based dynamic performance and control,” J. Power Sources, vol. 147, pp. 136-147, Sep. 2005.
[14] J.-M. Klein, Y. Bultel, S. Georges, and M. Pons, “Modeling of a SOFC fuelled by methane: From direct internal reforming to gradual internal reforming,” Chem. Eng Sci., vol. 62, pp. 1636-1649, Mar. 2007.
[15] A. Selimovic, M. Kemm, T. Torisson, and M. Assadi, “Steady state and transient thermal stress analysis in planar solid oxide fuel cells,” J. Power Sources, vol. 145, no. 2, pp. 463-469, Aug. 2005.
[16] P. Dokamaingam, S. Assabumrungrat, A. Soottitantawat, I. Sramala, and N. Laosiripojana, “Modeling of SOFC with indirect internal reforming operation: Comparison of conventional packed-bed and catalytic coated-wall internal reformer,” Int. J. Hydrogen Energ., vol. 34, pp. 410-421, Jan. 2009.
[17] P. Costamagnaa, A. Selimovicb, M. D. Borghia, and G. Agnew, “Electrochemical model of the integrated planar solid oxide fuel cell (IP-SOFC),” Chem. Eng. J., vol. 102, pp. 61-69, Aug. 2004.
[18] H. Zhu, A. M. Colclasure, R. J. Kee, Y. Lin, and S. A. Barnett, Anode barrier layers for tubular solid-oxide fuel cells with methane fuel streams,” J. Power Sources, vol. 161, pp. 413-419, Oct. 2006.
[19] R. Mauri, “A new application of the reciprocity relations to the study of fluid flows through fixed beds,” J. Eng. Math., vol. 33, pp. 103-112, Feb. 1998.
[20] B. Todd and J. B. Young, “Thermodynamic and transport properties of gases for use in solid oxide fuel cell modelling,” J. Power Sources, vol. 110, pp. 186-200, Jul. 2002.
[21] E. N. Fuller, P. D. Schettler, and J. C. Giddings, “New method for prediction of binary gas-phase diffusion coefficients,” Ind. Eng. Chem., vol. 58, pp. 18-27, May 1966.
[22] O. Yamazaki, K. Tomishige, and K. Fujimoto, “Development of highly stable nickel catalyst for methane-steam reaction under low steam to carbon ratio,”Appl. Catal. A- Gen., vol. 136, pp. 49-56, Feb. 1996.
[23] J. Xu and G. F. Froment, “Methane steam reforming, methanation and water-gas shift: I. Intrinsic kinetics,” AIChE J., vol. 35, pp. 88-96, Jan. 1989.
[24] B. A. Peppley, J. C. Amphlett, L. M. Kearns, and R. F. Mann, “Methanol–steam reforming on Cu/ZnO/Al2O3 catalysts. Part 2. A comprehensive kinetic model,” Appl. Catal. A- Gen., vol. 179, pp. 31-49, Apr. 1999.
[25] D. R. Sahoo, S. Vajpai, S. Patel, and K. K. Pant, “Kinetic modeling of steam reforming of ethanol for the production of hydrogen over Co/Al2O3 catalyst,” Chem. Eng. J., vol. 125, pp. 139-147, Jan. 2007.
[26] Y. Matsuzaki and I. Yasuda, “Relationship between the steady-state polarization of the SOFC air
electrode, La0.6Sr0.4MnO3+δ/YSZ, and its complex impedance measured at the equilibrium potential,” Solid State Ionics, vol. 126, pp. 307-313, Nov. 1999.
[27] F. Zhao and A. V. Virkar, “Dependence of polarization in anode-supported solid oxide fuel cells on various cell parameters,” J. Power Sources, vol. 141, pp. 79-95, Feb. 2005.
[28] R. Suwanwarangkul, E. Croiset, M. W. Fowler, P. L. Douglas, E. Entchev, and M. A. Douglas, “Performance comparison of Fick’s, dusty-gas and Stefan–Maxwell models to predict the concentration overpotential of a SOFC anode,” J Power Sources, vol. 122, pp. 9-18, Jul. 2003.
[29] E. Hernández-Pacheco, D. Singh, P. N. Hutton, N. Patel, and M. D. Mann, “A macro-level model for determining the performance characteristics of solid oxide fuel cells,” J. Power Sources, vol. 138, pp. 174-186, Nov. 2004.
[30] S. H. Chan, K. A. Khor, and Z. T. Xia, “A complete polarization model of a solid oxide fuel cell and its sensitivity to the change of cell component thickness,” J. Power Sources, vol. 93, pp. 130-140, Feb. 2001.
[31] Y. J. Leng, S. H. Chan, K. A. Khor, and S. P. Jiang, “Performance evaluation of anode-supported solid oxide fuel cells with thin film YSZ electrolyte,” Int. J. Hydrogen Energ., vol. 29, pp. 1025-1033, Aug. 2004.
[32] Y. M. Barzi, M. Ghassemi, and M. H. Hamedi, “Numerical analysis of start-up operation of a tubular solid oxide fuel cell,” Int. J. Hydrogen Energ., vol. 34, pp. 2015-2025, Feb. 2009.