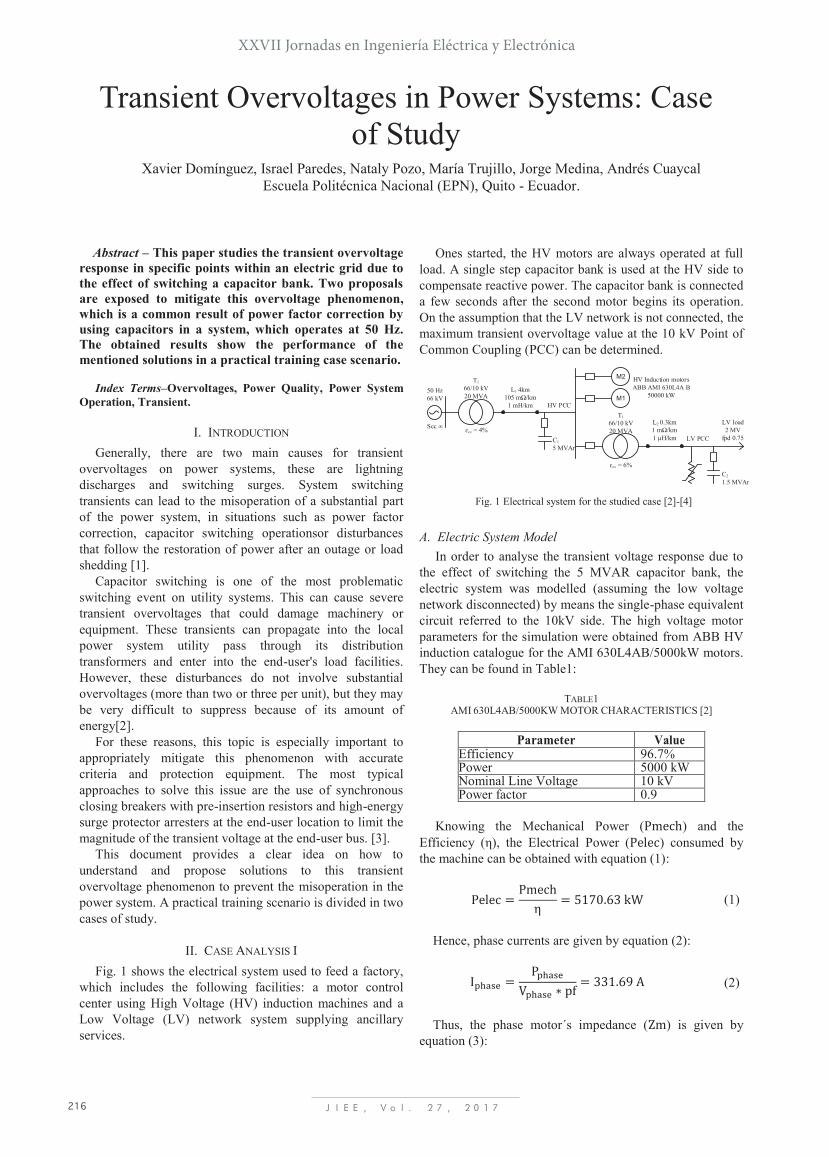
XXVII Jornadas en Ingeniería Eléctrica y Electrónica JIEE, Vol. 27, 2017 216 Abstract – This paper studies the transient overvoltage response in specific points within an electric grid due to the effect of switching a capacitor bank. Two proposals are exposed to mitigate this overvoltage phenomenon, which is a common result of power factor correction by using capacitors in a system, which operates at 50 Hz. The obtained results show the performance of the mentioned solutions in a practical training case scenario. Index Terms–Overvoltages, Power Quality, Power System Operation, Transient. I. INTRODUCTION Generally, there are two main causes for transient overvoltages on power systems, these are lightning discharges and switching surges. System switching transients can lead to the misoperation of a substantial part of the power system, in situations such as power factor correction, capacitor switching operationsor disturbances that follow the restoration of power after an outage or load shedding [1]. Capacitor switching is one of the most problematic switching event on utility systems. This can cause severe transient overvoltages that could damage machinery or equipment. These transients can propagate into the local power system utility pass through its distribution transformers and enter into the end-user's load facilities. However, these disturbances do not involve substantial overvoltages (more than two or three per unit), but they may be very difficult to suppress because of its amount of energy[2]. For these reasons, this topic is especially important to appropriately mitigate this phenomenon with accurate criteria and protection equipment. The most typical approaches to solve this issue are the use of synchronous closing breakers with pre-insertion resistors and high-energy surge protector arresters at the end-user location to limit the magnitude of the transient voltage at the end-user bus. [3]. This document provides a clear idea on how to understand and propose solutions to this transient overvoltage phenomenon to prevent the misoperation in the power system. A practical training scenario is divided in two cases of study. II. CASE ANALYSIS I Fig. 1 shows the electrical system used to feed a factory, which includes the following facilities: a motor control center using High Voltage (HV) induction machines and a Low Voltage (LV) network system supplying ancillary services. Ones started, the HV motors are always operated at full load. A single step capacitor bank is used at the HV side to compensate reactive power. The capacitor bank is connected a few seconds after the second motor begins its operation. On the assumption that the LV network is not connected, the maximum transient overvoltage value at the 10 kV Point of Common Coupling (PCC) can be determined. M1 M2 50 Hz 66 kV Scc ɛcc = 4% T1 66/10 kV 20 MVA L1 4km 105 m/km 1 mH/km C1 5 MVAr ɛcc = 6% C2 1.5 MVAr HV PCC T1 66/10 kV 20 MVA HV Induction motors ABB AMI 630L4A B 50000 kW L2 0.3km 1 m/km 1 μH/km LV PCC LV load 2 MV fpd 0.75 A. Electric System Model In order to analyse the transient voltage response due to the effect of switching the 5 MVAR capacitor bank, the electric system was modelled (assuming the low voltage network disconnected) by means the single-phase equivalent circuit referred to the 10kV side. The high voltage motor parameters for the simulation were obtained from ABB HV induction catalogue for the AMI 630L4AB/5000kW motors. They can be found in Table1: TABLE1 AMI 630L4AB/5000KW MOTOR CHARACTERISTICS [2] Parameter Value Efficiency 96.7% Power 5000 kW Nominal Line Voltage 10 kV Power factor 0.9 Knowing the Mechanical Power (Pmech) and the Efficiency (η), the Electrical Power (Pelec) consumed by the machine can be obtained with equation (1): Pelec = Pmech η = 5170.63 kW (1) Hence, phase currents are given by equation (2): I phase = P phase V phase ∗ pf = 331.69 A (2) Thus, the phase motor´s impedance (Zm) is given by equation (3): Xavier Domínguez, Israel Paredes, Nataly Pozo, María Trujillo, Jorge Medina, Andrés Cuaycal Escuela Politécnica Nacional (EPN), Quito - Ecuador. Transient Overvoltages in Power Systems: Case of Study Fig. 1 Electrical system for the studied case [2]-[4]
Transcript
XXVII Jornadas en Ingeniería Eléctrica y Electrónica
JIEE, Vol. 27, 2017216
Abstract – This paper studies the transient overvoltage
response in specific points within an electric grid due to the effect of switching a capacitor bank. Two proposals are exposed to mitigate this overvoltage phenomenon, which is a common result of power factor correction by using capacitors in a system, which operates at 50 Hz. The obtained results show the performance of the mentioned solutions in a practical training case scenario.
Index Terms–Overvoltages, Power Quality, Power System
Operation, Transient.
I. INTRODUCTION Generally, there are two main causes for transient
overvoltages on power systems, these are lightning discharges and switching surges. System switching transients can lead to the misoperation of a substantial part of the power system, in situations such as power factor correction, capacitor switching operationsor disturbances that follow the restoration of power after an outage or load shedding [1].
Capacitor switching is one of the most problematic switching event on utility systems. This can cause severe transient overvoltages that could damage machinery or equipment. These transients can propagate into the local power system utility pass through its distribution transformers and enter into the end-user's load facilities. However, these disturbances do not involve substantial overvoltages (more than two or three per unit), but they may be very difficult to suppress because of its amount of energy[2].
For these reasons, this topic is especially important to appropriately mitigate this phenomenon with accurate criteria and protection equipment. The most typical approaches to solve this issue are the use of synchronous closing breakers with pre-insertion resistors and high-energy surge protector arresters at the end-user location to limit the magnitude of the transient voltage at the end-user bus. [3].
This document provides a clear idea on how to understand and propose solutions to this transient overvoltage phenomenon to prevent the misoperation in the power system. A practical training scenario is divided in two cases of study.
II. CASE ANALYSIS I Fig. 1 shows the electrical system used to feed a factory,
which includes the following facilities: a motor control center using High Voltage (HV) induction machines and a Low Voltage (LV) network system supplying ancillary services.
Ones started, the HV motors are always operated at full
load. A single step capacitor bank is used at the HV side to compensate reactive power. The capacitor bank is connected a few seconds after the second motor begins its operation. On the assumption that the LV network is not connected, the maximum transient overvoltage value at the 10 kV Point of Common Coupling (PCC) can be determined.
M1
M2
50 Hz66 kV
Scc ɛcc = 4%
T1
66/10 kV20 MVA
L1 4km105 m /km
1 mH/km
C1
5 MVAr
ɛcc = 6%C2
1.5 MVAr
HV PCCT1
66/10 kV20 MVA
HV Induction motorsABB AMI 630L4A B
50000 kW
L2 0.3km1 m /km 1 µH/km LV PCC
LV load2 MV
fpd 0.75
A. Electric System Model In order to analyse the transient voltage response due to
the effect of switching the 5 MVAR capacitor bank, the electric system was modelled (assuming the low voltage network disconnected) by means the single-phase equivalent circuit referred to the 10kV side. The high voltage motor parameters for the simulation were obtained from ABB HV induction catalogue for the AMI 630L4AB/5000kW motors. They can be found in Table1:
TABLE1
AMI 630L4AB/5000KW MOTOR CHARACTERISTICS [2]
Parameter Value Efficiency 96.7% Power 5000 kW Nominal Line Voltage 10 kV Power factor 0.9
Knowing the Mechanical Power (Pmech) and the
Efficiency (η), the Electrical Power (Pelec) consumed by the machine can be obtained with equation (1):
Pelec = Pmechη = 5170.63 kW (1)
Hence, phase currents are given by equation (2):
Iphase =Pphase
Vphase ∗ pf = 331.69 A (2)
Thus, the phase motor´s impedance (Zm) is given by
equation (3):
Xavier Domínguez, Israel Paredes, Nataly Pozo, María Trujillo, Jorge Medina, Andrés Cuaycal Escuela Politécnica Nacional (EPN), Quito - Ecuador.
Transient Overvoltages in Power Systems: Case of Study
Fig. 1 Electrical system for the studied case [2]-[4]
XXVII Jornadas en Ingeniería Eléctrica y Electrónica
JIEE, Vol. 27, 2017 217
Zm =VphaseIphase
= 10.40 Ω (3)
As the power factor is 0.9 (φ=25.84º), the resistance of
the motor (Rm) and the reactance (Xm) are presented in equations (4) and (5) respectively:
On the other hand, the inductance of the motor (Lm) is obtained following equation (6):
Lm = Xm2πf = 24.1 mH (6)
In order to obtain the high voltage capacitor parameters,
the phase current flowing through the capacitor and its capacitance are given by equations (7) and (8):
Iphase_c =Qphase_c
Vphasesin (90°) = 866.02 A (7)
CHV =Iphase_c
2𝜋𝜋𝜋𝜋 ∗ Vphase= 159.15 uF (8)
Otherwise, the parameters of a transformer of 20 MVA
such us reactance (XTX_20) and leakage inductance (LTX_20) are obtained using equation (9) and (10). In these parameters the resistance of the transformer was neglected.
XTX_20 = Vline2
SSCεcc = 200 mΩ (9)
LTX_20 = XTX_202πf = 636.61 uH (10)
In the high voltage line impedance, according to Fig. 1,
the line resistance and inductance have values of 42 mΩ and 0.4 mH respectively [1]-[6].Moreover, in Fig. 2can be observed the per-phase equivalent circuit implemented in Simulink-Matlab® using the obtained parameters.
1 p.u
Trafo impedance0.6366 mH
Breaker
(5/3) MVArCapacito r159.15 µF
Mo tor 115.66
Motor 215.66
24.25 mH 24.25 mH
Line impedance0.042 0.4 mH
Fig. 2 Per-phase equivalent circuit implemented.
B. Transient Voltage response Once all the parameters have been obtained, it is
necessary to analyse the transient voltage response due to the capacitor switching at the High Voltage Point of Common Coupling (HV PCC) [2]-[5].However, it must be noticed that depending on the point of wave where the switching action takes place, different transient
overvoltage responses will be obtained. In Fig. 3, it is shown the voltage response for switching the capacitor at two different moments at PCC [10].
Fig. 3 Voltage response for two different switching periods As can be seen in Fig. 3, the wave period is 20 ms
because the system operates at 50 Hz. In order to find an acceptable degree of accuracy the switching point on wave that leads the worst transient response with the highest overvoltage, 40 simulations were performed for the system using steps of 0.5 ms on wave switching time. Then, the highest peak overvoltage values from each simulation will be compared so that the global maximum voltage response with the worst condition can be obtained.
The study case showed that the worst transient response has a peak value of 1.9065 p.u. and it occurs when the capacitor switching takes place at a point on wave of 4.5 ms as can be seen in Fig. 4.
1.965
0.0045
Fig. 4 Maximum p.u. voltages obtained as a function of point-on-wave capacitor switching.
The particular voltage response for this worst-case
condition can be seen in Fig. 5. On the other hand, as the peak current in steady state (reference base value) can be obtained, the p.u. current response as a function of the point on wave switching instant can also be obtained by dividing the current throughout the simulation for this base value. These can be observed in Fig. 6.
0.1045
1.9065
Fig. 5 Voltage response in p.u. for the worst case condition
XXVII Jornadas en Ingeniería Eléctrica y Electrónica
JIEE, Vol. 27, 2017218
0.0045
4.1855
Fig. 6 Maximum p.u. currents obtained as a function of point-on-wave
capacitor switching [7]
Fig. 7. Current response in p.u. for the worst case condition According to Fig. 5 and Fig.7 values, the voltage and
current transient responses can be really harmful for the system unless corrective actions are implemented.
C. Analytical calculation for the transient frequency response
Neglecting the reactance of the induction motors (with the aim of reducing the order system), the transient voltage frequency response at the 10 kV PCC is modelled into the frequency domain using the Laplace Transform. The equivalent circuit is presented in Fig. 8.
Fig. 8 Frequency domain equivalent circuit [8]
Using the mesh method, equation (11) – (13) is given by:
V = I1 [R2 + sL + 1sC] + I2[R2 + sL] (11)
V = I1[R2 + sL] + I2[R2 + R1 + sL] (12)
|R2 + sL + 1sC R2 + sL
R2 + sL R2 + R1 + sL| = 0 (13)
Solving the determinant created, the system is given by a
second order expression of equation (14):
s2(R1L) + s (R1 + R2 + LC) + R1 + R2
C = 0 (14)
Where, the roots of this equation are given by equation
(15) and equation (16) presents the structure of the found roots.
s = −421.74 ± j244.15 (15) s = Real ± j(2πf) (16)
Comparing terms, the resonant frequency is inferred, as
can be observed in equation (17):
f = 388.57 Hz (17) Hence, a detailed observation of the plot for the transient
response of Fig. 9,the frequency is obtained as one over the observed period given a value of 1/0.0026= 384 Hz, which is very close to the one obtained analytically (388.57 Hz); validating the mathematical approach performed previously.
2.6[ms]
Fig. 9 Interface for the frequency on the transient voltaje response
III. CASE ANALYSIS 2 The second case scenario considers the LV network in
Operation (LV capacitor bank included), both of the HV induction motors are started. The HV capacitor bank is switched on in order to determine the maximum value for the transient overvoltage in conditions at the 400 V PCC [2],[9].
A. Electric System Model The low voltage network side parameters will also be
obtained to model the entire system. Notice that, using the transformation ratio (Rt=25), the parameters must be referred to the high voltage side to make an appropriate simulation into a total per-phase equivalent circuit basis.
Following similar criteria used in for the first motor analysed, the parameters of the high voltage are given by equation(18):
XXVII Jornadas en Ingeniería Eléctrica y Electrónica
JIEE, Vol. 27, 2017 219
Iphase =Pphase
Vphasepf = 3849 A (18)
Thus, the phase load impedance (Zl) is expressed in
equation (19):
Zl =VphaseIphase
= 60 mΩ (19)
As the power factor is 0.75 (Zl=41.41º), the load
resistance (R1) and load reactance (X1) arepresented in equations (20) and (21):
R1 = Z1 ∗ cos(φ) = 45 mΩ (20)
X1 = Z1 ∗ sin(φ) = 39.68 mΩ (21) The load inductance (L1) is obtained by equation (22):
L1 = Xl2πf = 126.325 µH (22)
Transformer ratio relationis applied to refer the variables
to the high voltage side, following equation (23) and (24):
RlHV = R1Rt2 = 28.12[mΩ] (23)
LlHV = L1Rt2 = 78.95[mH] (24) On the other side, the parameters of the low voltage
capacitor are given following equations (25) – (27).
Iphase_c =Qphase_c
Vphasesin (90°) = 2165.1 [A] (25)
CLV =Iphase_c
2𝜋𝜋𝜋𝜋(Vphase) = 29.84 [mF]
(26)
𝐶𝐶𝐿𝐿𝐿𝐿𝐻𝐻𝐻𝐻 = CLV ( 1𝑅𝑅𝑅𝑅)
2= 47.74[µH] (27)
As the voltage reference used is 10 kV, no transformation ratio relation is needed for the leakage inductance of the transformer, this can be observed in equations (28) and (29).
XTX_8 = Vline2
SSCεcc = 750 mΩ (28)
LTX_8 = XTX_82πf = 2.38 mH (29)
Considering Fig. 1, the low voltage line resistance and
inductance will be 300 µ Ω and 0.9 µH respectively. These values must be referred to the high voltage side:
RLV_HV = RLV ∗ Rt2 = 187.5 mΩ (30)
XLV_HV = XLV ∗ Rt2 = 562.5 µH (31)
Figure 10 shows the complete per-phase equivalent
circuit of the system using the calculated values.
1 p.u
Trafo impedance0.6366 mH
Breaker
(5/3) MVArCapacitor159.15 µF
Motor 115.66
Motor 215.66
24.25 mH 24.25 mH
Line impedance0.042 0.4 mH
LV Load15.66
78.95 mH
Line impedance0.1875 0.5625 mH
(1.5/3) MVArCapacitor47.745 µF
Trafo impedance2.387 mH
Fig. 10 Per-phase equivalent circuit of the complete system
B. Transient Voltage response
To obtain the highest transient overvoltage, same methodology that previous section is applied. This is performing 40 simulations representing the high voltage capacitor switching in steps of 0.5 ms from zero to 20 ms.
For this analysis, the end customer´s voltage at the PCC for the low voltage side is the most important part, where the worst transient response found has a peak value of 2.4986 p.u. as is presented in Fig. 11.
The transient happens when the capacitor switching is done at a point on wave of 4.5 ms. Similarly, the highest possible current is show in Fig.12, which appears and it appears if the capacitor is connected at a point on wave of 5 ms and takes a value of 9.8261 p.u.
0.0045
2.4986
Fig. 11 Maximum p.u. voltages at the LV PCC as a function of
point-on-wave capacitor switching
9.8261
0.005
Fig. 12 Maximum p.u. currents at the LV PCC as a function of pointon-
wave capacitor switching
2.4986
0.1045
Fig. 13 Voltage response in p.u. at the LV PCC for the worst case condition
XXVII Jornadas en Ingeniería Eléctrica y Electrónica
JIEE, Vol. 27, 2017220
9.8261
0.115
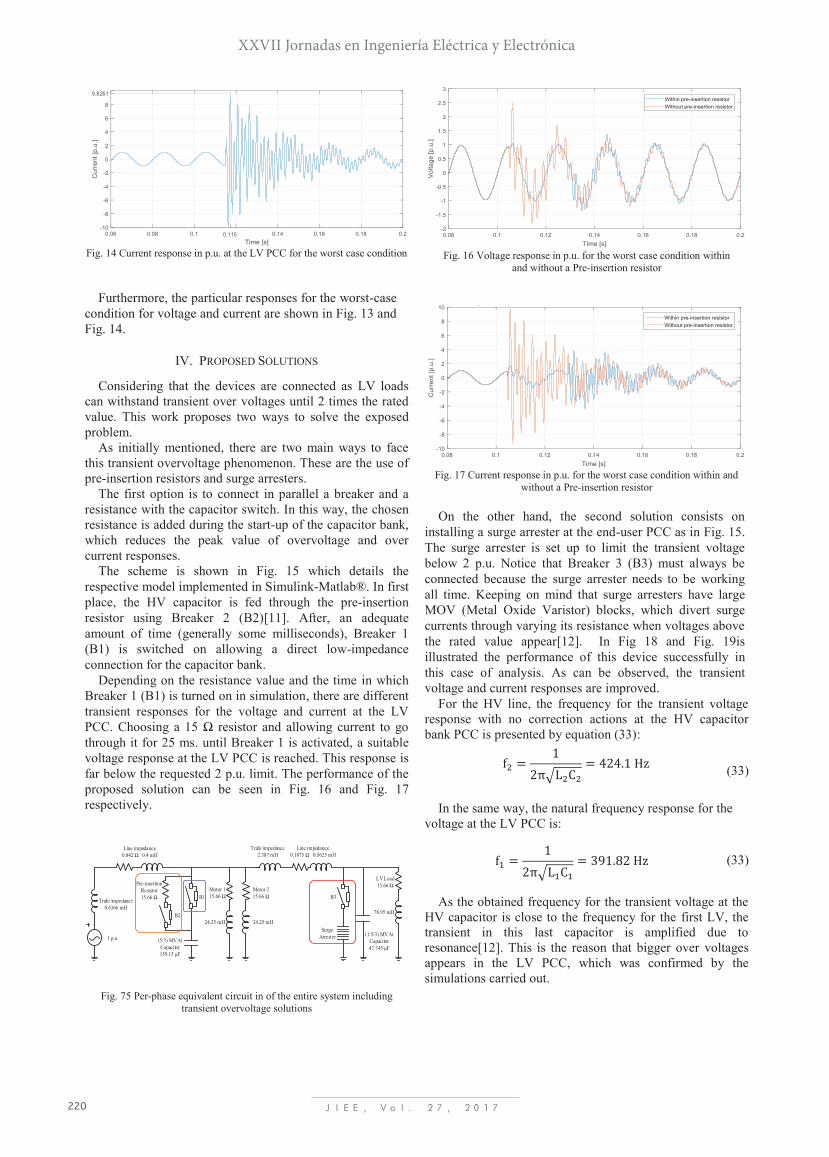
Fig. 14 Current response in p.u. at the LV PCC for the worst case condition
Furthermore, the particular responses for the worst-case
condition for voltage and current are shown in Fig. 13 and Fig. 14.
IV. PROPOSED SOLUTIONS
Considering that the devices are connected as LV loads can withstand transient over voltages until 2 times the rated value. This work proposes two ways to solve the exposed problem.
As initially mentioned, there are two main ways to face this transient overvoltage phenomenon. These are the use of pre-insertion resistors and surge arresters.
The first option is to connect in parallel a breaker and a resistance with the capacitor switch. In this way, the chosen resistance is added during the start-up of the capacitor bank, which reduces the peak value of overvoltage and over current responses.
The scheme is shown in Fig. 15 which details the respective model implemented in Simulink-Matlab®. In first place, the HV capacitor is fed through the pre-insertion resistor using Breaker 2 (B2)[11]. After, an adequate amount of time (generally some milliseconds), Breaker 1 (B1) is switched on allowing a direct low-impedance connection for the capacitor bank.
Depending on the resistance value and the time in which Breaker 1 (B1) is turned on in simulation, there are different transient responses for the voltage and current at the LV PCC. Choosing a 15 Ω resistor and allowing current to go through it for 25 ms. until Breaker 1 is activated, a suitable voltage response at the LV PCC is reached. This response is far below the requested 2 p.u. limit. The performance of the proposed solution can be seen in Fig. 16 and Fig. 17 respectively.
1 p.u
Trafo impedance0.6366 mH
B1
(5/3) MVArCapacitor159.15 µF
Motor 115.66
Motor 215.66
24.25 mH 24.25 mH
Line impedance0.042 0.4 mH
LV Load15.66
78.95 mH
Line impedance0.1875 0.5625 mH
(1.5/3) MVArCapacitor47.745 µF
Trafo impedance2.387 mH
B2
Pre-insertionResistor15.66 B3
SurgeArrester
Fig. 75 Per-phase equivalent circuit in of the entire system including transient overvoltage solutions
Fig. 16 Voltage response in p.u. for the worst case condition within
and without a Pre-insertion resistor
Fig. 17 Current response in p.u. for the worst case condition within and
without a Pre-insertion resistor
On the other hand, the second solution consists on installing a surge arrester at the end-user PCC as in Fig. 15. The surge arrester is set up to limit the transient voltage below 2 p.u. Notice that Breaker 3 (B3) must always be connected because the surge arrester needs to be working all time. Keeping on mind that surge arresters have large MOV (Metal Oxide Varistor) blocks, which divert surge currents through varying its resistance when voltages above the rated value appear[12]. In Fig 18 and Fig. 19is illustrated the performance of this device successfully in this case of analysis. As can be observed, the transient voltage and current responses are improved.
For the HV line, the frequency for the transient voltage response with no correction actions at the HV capacitor bank PCC is presented by equation (33):
In the same way, the natural frequency response for the voltage at the LV PCC is:
As the obtained frequency for the transient voltage at the
HV capacitor is close to the frequency for the first LV, the transient in this last capacitor is amplified due to resonance[12]. This is the reason that bigger over voltages appears in the LV PCC, which was confirmed by the simulations carried out.
f2 = 12π√L2C2
= 424.1 Hz
(33)
f1 = 12π√L1C1
= 391.82 Hz
(33)
XXVII Jornadas en Ingeniería Eléctrica y Electrónica
JIEE, Vol. 27, 2017 221
Fig. 18 Voltage response in p.u. for the worst case condition within and without a Surge Arrester
Fig. 19Current response in p.u. for the worst case condition within
and without a Surge Arrester
V. CONCLUSIONS Transient overvoltages produced by the switching action
of power-factor-correction capacitors have been studied in this report. This phenomenon can be harmful in electrical systems as it has been verified by simulation. For that reason, it is important to protect end user´s loads against these threads by using solutions like pre-insertion resistors and surge arresters. If these devices are correctly calibrated, a normal operation in the load even when typical transient overvoltages take place is expected.Mitigate overvoltage phenomenon using capacitors gives more tools to affront the misoperation of a substantial part of the power system that involves important troubles.
VI. . REFERENCES [1] Cano J, Unit 3- Transient Overvoltages Slides, EECPS
Master,Gijón/Spain, Feb 2013 [2] Domínguez X, Power Quality Practical Training: Transient
Overvoltages [3] Martinez Juan, Transient Analysis of Power Systems: Solutions
Techniques, Tools and Applications, First Edition, John Wiley andSons, Ltd, 2015.
[4] Expósito, A. G., Gomez-Exposito, A., Conejo, A. J., &Canizares, C. (Eds.). (2016). Electric energy systems: analysis and operation. CRC Press.
[5] Huang, Z., Ni, Y., Shen, C. M., Wu, F. F., Chen, S., & Zhang, B. (2000). Application of unified power flow controller in interconnected power systems-modeling, interface, control strategy, and case study. IEEE Transactions on Power Systems, 15(2), 817-824.
[6] Mendis, S. R., &Gonzalez, D. A. (1992). Harmonic and transient overvoltage analyses in arc furnace power systems. IEEE transactions on industry applications, 28(2), 336-342.
[7] Mahseredjian, J., Dinavahi, V., &Martinez, J. A. (2009). Simulation tools for electromagnetic transients in power systems: Overview and challenges. IEEE Transactions on Power Delivery, 24(3), 1657-1669.
[8] Belkhayat M., Edwards J., Hoonchareon N, Transients in Power Sistems, School of Electrical and Computer Engineering Purdue University, TR-ECE 95-29, December 1995.
[9] Kunder, Prabha, Power System Stability and Control, McGraw-Hill Inc., New York, 1994.
[10] Pawar, V. S., &Shembekar, S. M. (2013). Transient Overvoltages in Power System. International Journal of Science, Spirituality, Business and Technology (IJSSBT).
[11] M. Beanland, T. Speas, J. Rostron, ―Pre-insertion Resistors in High Voltage Capacitor Switching, – Western Protective Relay Conference, Oct. 19 – 21, 2004, Spokane, WA.
[12] Crouse, Hinds, Lightning and surge protection – basic principles, Application note MTL surge protection, October 2016, EATON Powering Business Worldwide.
[13] M. B. Marz, T. E. Royster, C. M. Wahlgren, ―A Utility‘s Approach to the Application of Scout Arresters for Overvoltage Protection of Underground Distribution Circuits, –2994 IEEE Transmission and Distribution Conference Record, Chicago, April 1994
VII. BIOGRAPHY X. Domínguez obtained his engineering degree in Electronics and Control at Escuela Politécnica Nacional (EPN) in Quito-Ecuador - 2010. The, he studied from 2012 to 2014 in Spain at Universidad de Oviedo, where he got his maste’s degree in Conversión de Energía Eléctrica y Sistemas de Potencia. Nowadays, he work as full time teacher at Universidad Técnica del Norte (Ibarra-Ecuador). Areas of interest: Power electronics,
Energy Quality and Industrial Control.
Israel Paredes, was born in Riobamba-Ecuador on June 24, 1988. He completed his high school studies at the Salesiano’sHightSchool “STAR”. He graduated from the Escuela Politécnica Nacional in 2013 obtaining the degree of Electronics and Control Engineer. He is currently a teacher at the Escuela Politécnica Nacional and he is studying a master program in Automation and Industrial Electronic Control at the EPN. Areas of interest: Industrial control,
control systems and power electronics.
Nataly PozoViera was born in Píllaro-Ecuador on February 10, 1991. She studied at “Santo Domingo de Guzmán”-Ambato High School. In 2014 she obtained her degree as an Engineer in Electronics and Controlat Escuela Politécnica Nacional. Next, she obtained her Master in Science's degree in Electrical Power in 2016, at Newcastle University - United Kingdom. Nowadays, Nataly works as Full Time Teacher in the Department of
Automation and Industrial Control - EPN. Areas of interest: Control drives, Power Electronics, Smart Grids, Power systems and Machine design,
María Trujillo was born in Riobamba-Ecuador on February 15, 1990. She completed his secondary studies at Santa Mariana de Jesús de Riobamba. She graduated from the Escuela Politécnica Nacional as an Engineer in Electronics and Control in 2014. She obtained her Master's degree in Biomedical Engineering in 2016 at Universidad Politécnica de Madrid in Spain. At the same time she works like an intern in the
Center for Biomedical Technology in the bio instrumentation area. Actually holds the position of Teacher in the Department of Automation and Industrial Control - EPN.
XXVII Jornadas en Ingeniería Eléctrica y Electrónica
JIEE, Vol. 27, 2017222
Areas of interest: computer vision, computer and networks, diagnostic assisted by computer, artificial intelligent, bio-instrumentation, bio-mechanic automation and industrial control.
Jorge Luis Medina Mora was born in Ambato-Ecuador on August 10, 1988. He completed his secondary studies at Instituto Tecnológico Superior Bolívar de Ambato. He graduated from the Escuela Politécnica Nacional as an Engineer in Electronics and Control in 2013. In 2015 he obtained a scholarship from the Ecuadorian Government to pursue his postgraduate studies and obtained his Master's degree in Electronic and Electrical Engineering in
2016 at The University of Sheffield in United Kingdom. Currently holds the position of Full Time Teacher in the Department of Automation and Industrial Control. Areas of interest: control of electrical machines, power electronics, robotics, computer vision, computer and networks, embedded systems, automation and industrial control.
Andrés Cuaycal, was born in Quito-Ecuador on August 8, 1990. He completed his high school studies at Instituto Tecnológico Superior “Sucre”. He graduated from the Escuela Politécnica Nacional in 2015 obtaining the degree of Electronics and Control Engineer. He worked as Laboratory Assistant for Embedded Systems and Electrical Circuits at Escuela Politécnica Nacional. He has developed several applications in
control systems emphasizing the three-phase motor scalar control, the control of a robotic arm with 6 degrees of freedom using inverse kinematics and the simulation and control of a hexacopter. He is currently a teacher at the Escuela Politécnica Nacional. Areas of interest: Mobile robotics, embedded systems, control systems and power electronics.