International Journal on Electrical Engineering and Informatics - Volume 1, Number 2, 2009 103 Transient Stability Assessment of Power Systems using Probabilistic Neural Network with Enhanced Feature Selection and Extraction Noor Izzri Abdul Wahab 1 and Azah Mohamed 2 Department of Electrical, Electronic and Systems Engineering, Faculty of Engineering, Universiti Kebangsaan Malaysia, 43600 Selangor, Malaysia 1 [email protected]2 [email protected]Abstract: This paper presents transient stability assessment of a large actual 87-bus system and the IEEE 39-bus system using the probabilistic neural network (PNN) with enhanced feature selection and extraction methods. The investigated power systems are divided into smaller areas depending on the coherency of the areas when subjected to disturbances. This is to reduce the amount of data sets collected for the respective areas. Transient stability of the power system is first determined based on the generator relative rotor angles obtained from time domain simulations carried out by considering three phase faults at different loading conditions. The data collected from the time domain simulations are then used as inputs to the PNN. An enhanced feature selection and extraction methods are then incorporated to reduce the input features to the PNN which is used as a classifier to determine whether the power system is stable or unstable. It can be concluded that the PNN with enhanced feature selection and extraction methods reduces the time taken to train the PNN without affecting the accuracy of the classification results. Keywords: Dynamic security assessment, transient stability assessment, feature selection, feature extraction. 1. Introduction Transient stability assessment (TSA) is part of dynamic security assessment of power systems which involves the evaluation of the ability of a power system to maintain synchronism under severe but credible contingencies. Methods normally employed to assess TSA are by using time domain simulation, direct and artificial intelligence methods. Time domain simulation and direct methods are considered most accurate but are time consuming and need heavy computational effort. The use of artificial neural network, for instance multilayer perceptron NN (MLPNN) in TSA has gained a lot of interest among researchers due to its ability to do parallel data processing, high accuracy and fast response. Although successfully applied to TSA, MLPNN implementation requires extensive training process [1]. A major drawback of MLPNN for applications in large sized power systems is that it requires a large number of input features in training the neural network. The emergence of support vector machines in TSA has addressed these problems [1, 2]. Another method which can be used for TSA is the probabilistic neural networks (PNN) [3], which is a class of radial basis function (RBF) network is useful for automatic pattern recognition, nonlinear mapping and estimation of probabilities of class membership and likelihood ratios [4]. In this paper, the research done in [3] on PNN is continued with bigger and larger power systems, i.e. IEEE 39-bus and 87-bus systems. PNN is used as a classifier for assessing transient stability state of a large sized and practical power system. The power system is divided into smaller coherent areas so as to reduce the amount of input data to the neural networks.
Transcript
International Journal on Electrical Engineering and Informatics - Volume 1, Number 2, 2009
103
Transient Stability Assessment of Power Systems using Probabilistic Neural Network with Enhanced Feature Selection and Extraction
Noor Izzri Abdul Wahab1 and Azah Mohamed2
Department of Electrical, Electronic and Systems Engineering, Faculty of Engineering,
Universiti Kebangsaan Malaysia, 43600 Selangor, Malaysia [email protected]
Abstract: This paper presents transient stability assessment of a large actual 87-bus system and the IEEE 39-bus system using the probabilistic neural network (PNN) with enhanced feature selection and extraction methods. The investigated power systems are divided into smaller areas depending on the coherency of the areas when subjected to disturbances. This is to reduce the amount of data sets collected for the respective areas. Transient stability of the power system is first determined based on the generator relative rotor angles obtained from time domain simulations carried out by considering three phase faults at different loading conditions. The data collected from the time domain simulations are then used as inputs to the PNN. An enhanced feature selection and extraction methods are then incorporated to reduce the input features to the PNN which is used as a classifier to determine whether the power system is stable or unstable. It can be concluded that the PNN with enhanced feature selection and extraction methods reduces the time taken to train the PNN without affecting the accuracy of the classification results. Keywords: Dynamic security assessment, transient stability assessment, feature selection, feature extraction. 1. Introduction
Transient stability assessment (TSA) is part of dynamic security assessment of power systems which involves the evaluation of the ability of a power system to maintain synchronism under severe but credible contingencies. Methods normally employed to assess TSA are by using time domain simulation, direct and artificial intelligence methods. Time domain simulation and direct methods are considered most accurate but are time consuming and need heavy computational effort.
The use of artificial neural network, for instance multilayer perceptron NN (MLPNN) in TSA has gained a lot of interest among researchers due to its ability to do parallel data processing, high accuracy and fast response. Although successfully applied to TSA, MLPNN implementation requires extensive training process [1]. A major drawback of MLPNN for applications in large sized power systems is that it requires a large number of input features in training the neural network.
The emergence of support vector machines in TSA has addressed these problems [1, 2]. Another method which can be used for TSA is the probabilistic neural networks (PNN) [3], which is a class of radial basis function (RBF) network is useful for automatic pattern recognition, nonlinear mapping and estimation of probabilities of class membership and likelihood ratios [4]. In this paper, the research done in [3] on PNN is continued with bigger and larger power systems, i.e. IEEE 39-bus and 87-bus systems. PNN is used as a classifier for assessing transient stability state of a large sized and practical power system. The power system is divided into smaller coherent areas so as to reduce the amount of input data to the neural networks.
My Computer
Line
My Computer
Text Box
Received: November 5, 2009. Accepted: November 30, 2009
104
In addition, feature reduction techniques, namely correlation analysis and PCA techniques are employed in order to enhance the performance of the PNN in terms of improving the training time and accuracy. The performance of PNN with and without feature reduction techniques are analyzed and compared.
2. Probabilistic Neural Network (PNN)
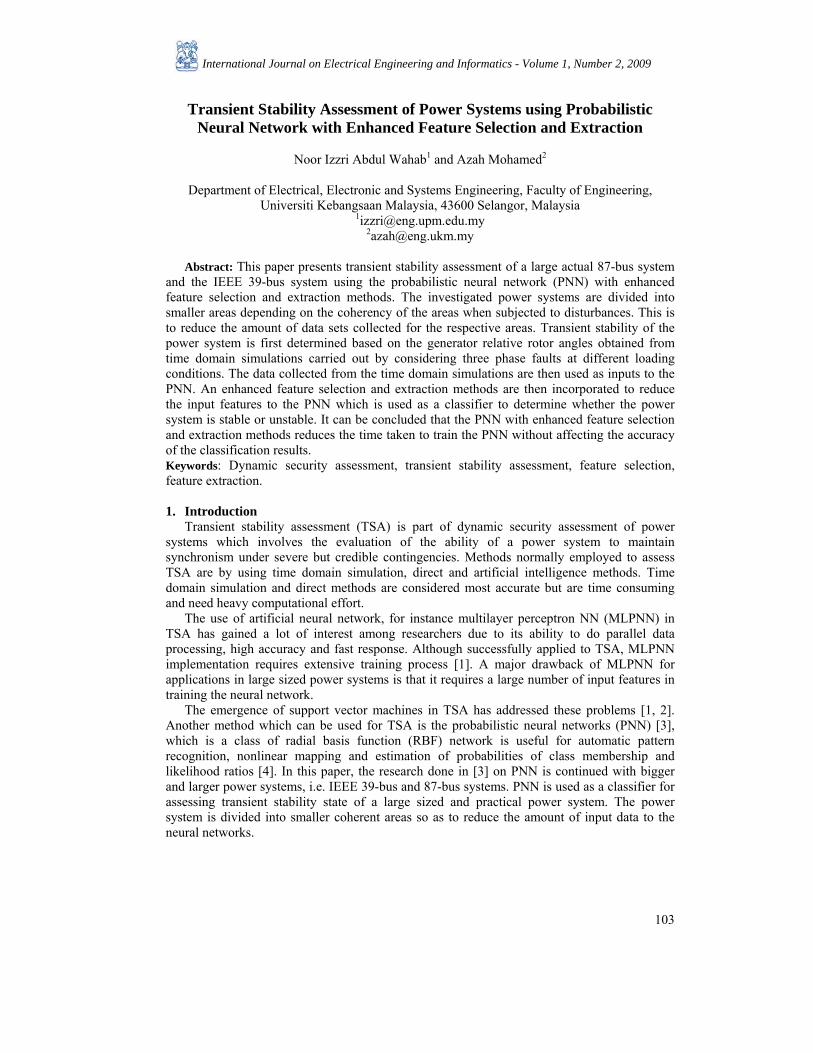
PNN is a direct continuation of the work on Bayes classifiers [5] in which it is interpreted as a function that approximates the probability density of the underlying example distribution. The PNN consists of nodes with four layers namely input, pattern, summation and output layers as shown in Figure 1. The input layer consists of merely distribution units that give similar values to the entire pattern layer.
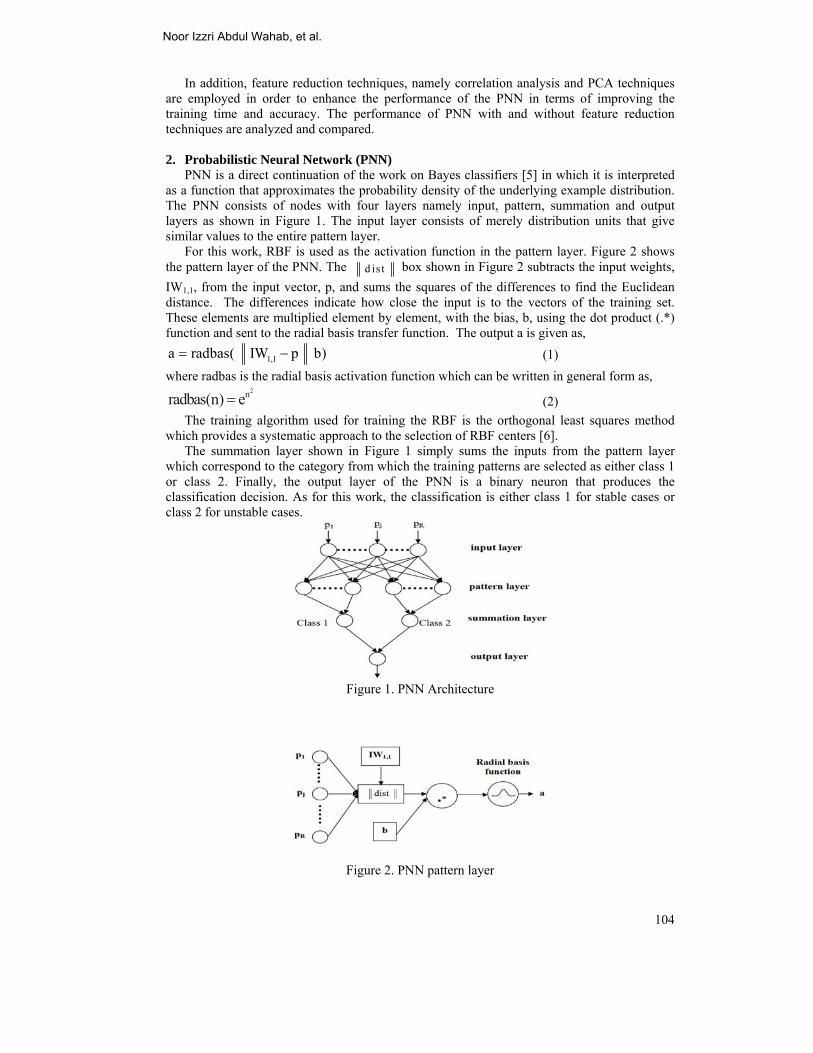
For this work, RBF is used as the activation function in the pattern layer. Figure 2 shows the pattern layer of the PNN. The d is t box shown in Figure 2 subtracts the input weights, IW1,1, from the input vector, p, and sums the squares of the differences to find the Euclidean distance. The differences indicate how close the input is to the vectors of the training set. These elements are multiplied element by element, with the bias, b, using the dot product (.*) function and sent to the radial basis transfer function. The output a is given as,
1,1a radbas( IW p b) = − (1) where radbas is the radial basis activation function which can be written in general form as,
2nradbas(n) e= (2) The training algorithm used for training the RBF is the orthogonal least squares method
which provides a systematic approach to the selection of RBF centers [6]. The summation layer shown in Figure 1 simply sums the inputs from the pattern layer
which correspond to the category from which the training patterns are selected as either class 1 or class 2. Finally, the output layer of the PNN is a binary neuron that produces the classification decision. As for this work, the classification is either class 1 for stable cases or class 2 for unstable cases.
Figure 1. PNN Architecture
Figure 2. PNN pattern layer
Noor Izzri Abdul Wahab, et al.
105
A. Performance Evaluation
Performance of the developed PNN network can be gauged by calculating the error of the actual and desired test data. Firstly, error is defined as,
n n nError,E Desired Output,DO Actual Output,AO = − (3) where, n is the test data number. The desired output (DO) is the specified output data whereas the actual output (AO) is the output obtained from testing the trained network.
From (3), the percentage mean error (ME) can be obtained as:
Nn
n 1
EME (%) 100N
=
= ×∑ (4)
where N is the total number of test data.
The percentage classification error (CE) is given by,
no. of test data misclassificationCE (%) 100N
= × (5)
3. Feature Selection And Extraction
Feature selection is the process of identifying those features that contribute most to the discrimination ability of the neural network [7], or the process of finding the best feature subset from the original set of features, without additional feature transformation. The number of features is reduced without loosing the main information represented by the original set of features [8]. Whereas, feature extraction transformed the original input features into reduced input features. The transformation of the original input features should maintain a high degree of classification accuracy for the intelligent system. The common methods for feature extraction are the linear discriminant analysis (LDA) and principle component analysis (PCA). In this work, correlation analysis method and PCA are used for the intelligent system feature selection and extraction methods.
A. Correlation Analysis Correlation analysis (CA) is a statistical method of indicating the strength and direction of a linear relationship between two random variables. The correlation coefficient matrix represents the normalized measure of the strength of linear relationship between variables. Correlation coefficient (ρ) between two random variables x and y is defined as [9],
cov( , )( , )var( ) var( )
x yx yx y
ρ = (6)
where var( ) denotes the variance of a variable and cov( ) denotes the covariance between two variables. The correlation coefficients (ρ) range from -1 to 1, where, values close to 1 suggest that there is a positive linear relationship between the data columns, values close to -1 suggest that one column of data has a negative linear relationship to another column of data, values close to or equal to 0 suggest there is no linear relationship between the data columns. For an m-by-n matrix, the correlation coefficient matrix is a square matrix of n-by-n. The arrangement of the elements in the correlation coefficient matrix corresponds to the location of the elements in the covariance matrix. The matrix is symmetrical at the diagonal with diagonal is equal to zero and the upper and lower of the triangular matrices is equal.
Transient Stability Assessment of Power Systems using Probabilistic
106
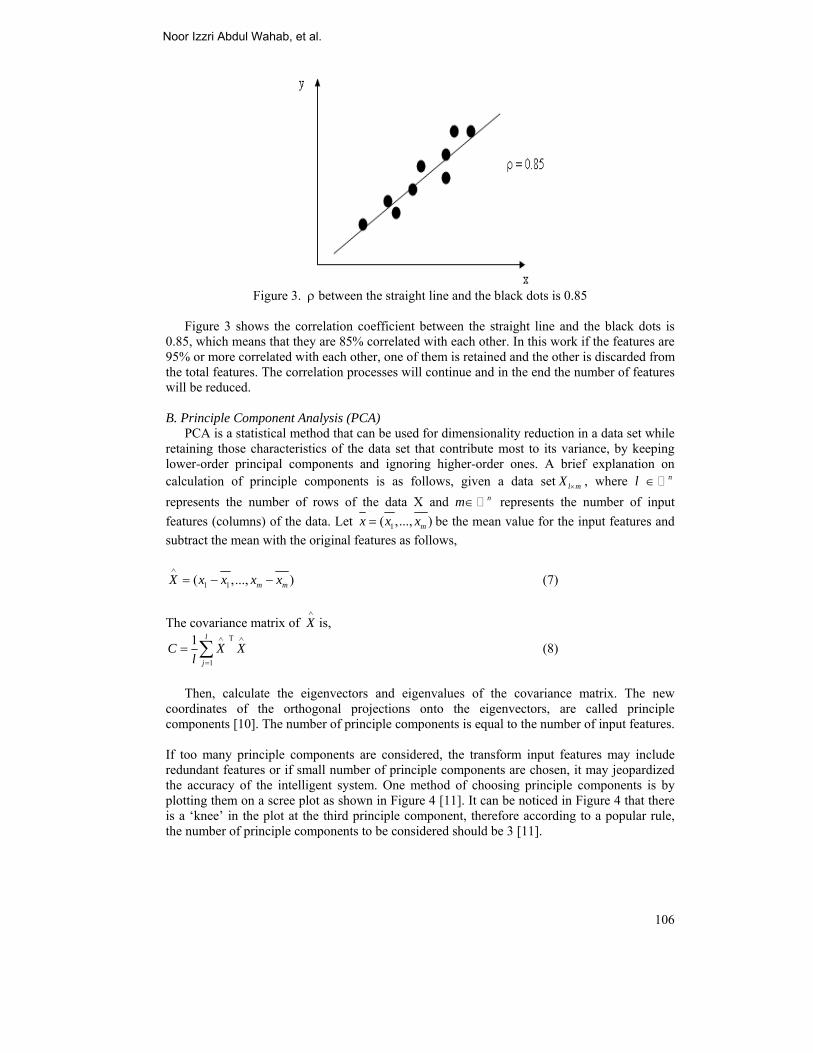
Figure 3. ρ between the straight line and the black dots is 0.85
Figure 3 shows the correlation coefficient between the straight line and the black dots is
0.85, which means that they are 85% correlated with each other. In this work if the features are 95% or more correlated with each other, one of them is retained and the other is discarded from the total features. The correlation processes will continue and in the end the number of features will be reduced.
B. Principle Component Analysis (PCA)
PCA is a statistical method that can be used for dimensionality reduction in a data set while retaining those characteristics of the data set that contribute most to its variance, by keeping lower-order principal components and ignoring higher-order ones. A brief explanation on calculation of principle components is as follows, given a data set l mX × , where l n∈ represents the number of rows of the data X and m n∈ represents the number of input features (columns) of the data. Let 1( ,..., )mx x x= be the mean value for the input features and subtract the mean with the original features as follows,
1 1( ,..., )m mX x x x x∧
= − − (7)
The covariance matrix of X∧
is, T
1
1 l
j
C X Xl
∧ ∧
=
= ∑ (8)
Then, calculate the eigenvectors and eigenvalues of the covariance matrix. The new
coordinates of the orthogonal projections onto the eigenvectors, are called principle components [10]. The number of principle components is equal to the number of input features.
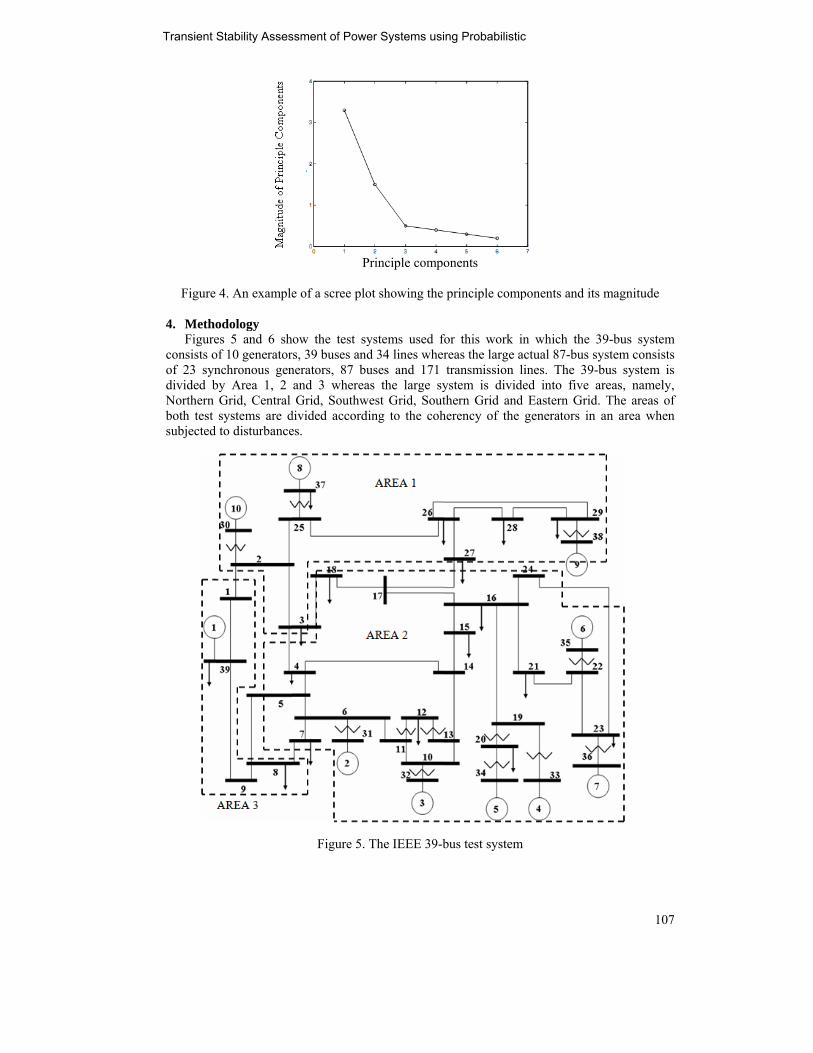
If too many principle components are considered, the transform input features may include redundant features or if small number of principle components are chosen, it may jeopardized the accuracy of the intelligent system. One method of choosing principle components is by plotting them on a scree plot as shown in Figure 4 [11]. It can be noticed in Figure 4 that there is a ‘knee’ in the plot at the third principle component, therefore according to a popular rule, the number of principle components to be considered should be 3 [11].
Noor Izzri Abdul Wahab, et al.
Figure
4. MethoFigure
consists oof 23 syndivided bNorthern both test subjected
4. An example
odology es 5 and 6 shof 10 generatornchronous genby Area 1, 2
Grid, Central systems are d
d to disturbance
P
e of a scree plo
how the test syrs, 39 buses andnerators, 87 buand 3 whereaGrid, Southw
divided accordies.
Figure 5.
Principle compo
ot showing the
ystems used fd 34 lines wheruses and 171 as the large sy
west Grid, Souting to the coh
The IEEE 39-b
onents
principle comp
for this work ireas the large atransmission l
ystem is dividthern Grid andherency of the
bus test system
ponents and its
in which the 3actual 87-bus slines. The 39-
ded into five ad Eastern Grid
generators in
m
107
s magnitude
39-bus systemsystem consists-bus system isareas, namely,
d. The areas ofan area when
7
m s s , f n
Transient Stability Assessment of Power Systems using Probabilistic
108
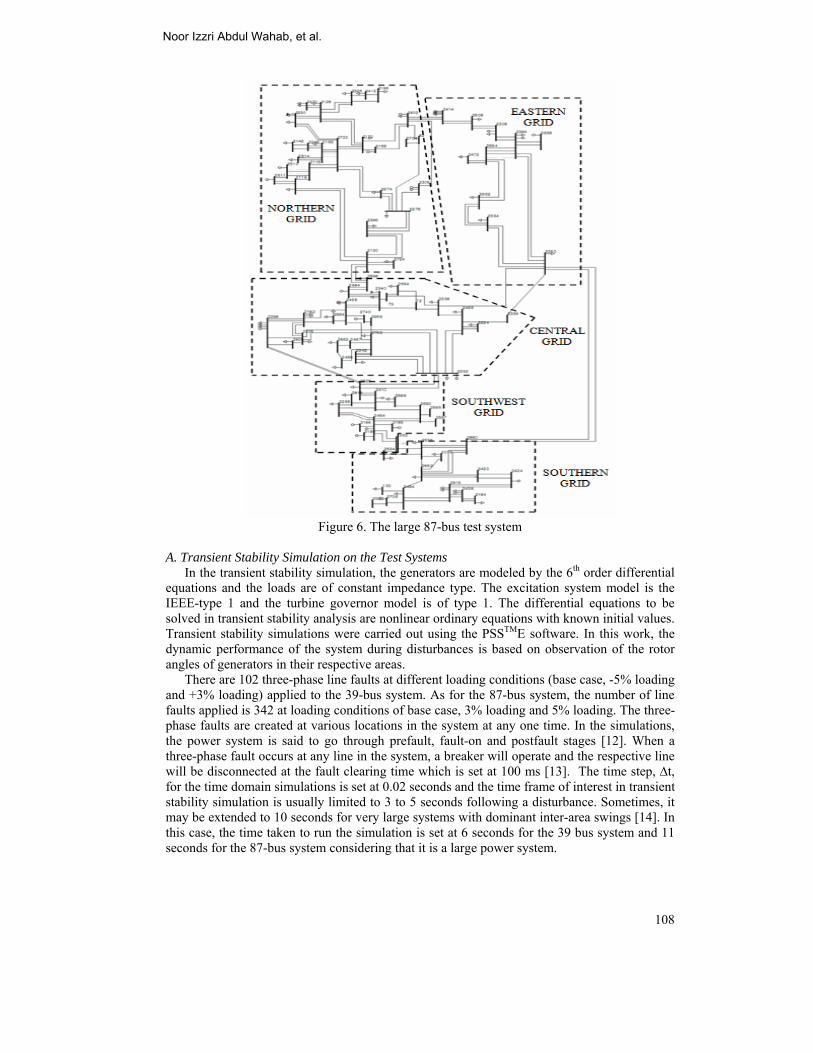
Figure 6. The large 87-bus test system
A. Transient Stability Simulation on the Test Systems In the transient stability simulation, the generators are modeled by the 6th order differential
equations and the loads are of constant impedance type. The excitation system model is the IEEE-type 1 and the turbine governor model is of type 1. The differential equations to be solved in transient stability analysis are nonlinear ordinary equations with known initial values. Transient stability simulations were carried out using the PSSTME software. In this work, the dynamic performance of the system during disturbances is based on observation of the rotor angles of generators in their respective areas.
There are 102 three-phase line faults at different loading conditions (base case, -5% loading and +3% loading) applied to the 39-bus system. As for the 87-bus system, the number of line faults applied is 342 at loading conditions of base case, 3% loading and 5% loading. The three-phase faults are created at various locations in the system at any one time. In the simulations, the power system is said to go through prefault, fault-on and postfault stages [12]. When a three-phase fault occurs at any line in the system, a breaker will operate and the respective line will be disconnected at the fault clearing time which is set at 100 ms [13]. The time step, ∆t, for the time domain simulations is set at 0.02 seconds and the time frame of interest in transient stability simulation is usually limited to 3 to 5 seconds following a disturbance. Sometimes, it may be extended to 10 seconds for very large systems with dominant inter-area swings [14]. In this case, the time taken to run the simulation is set at 6 seconds for the 39 bus system and 11 seconds for the 87-bus system considering that it is a large power system.
Noor Izzri Abdul Wahab, et al.
109
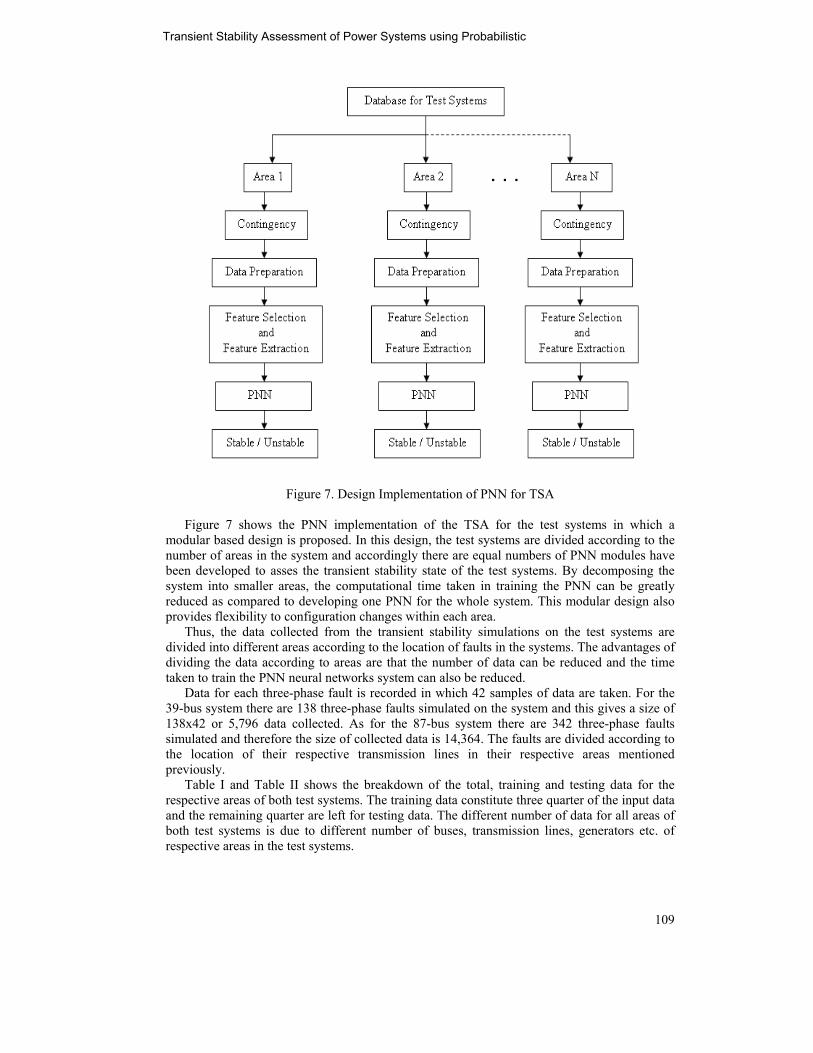
Figure 7. Design Implementation of PNN for TSA
Figure 7 shows the PNN implementation of the TSA for the test systems in which a
modular based design is proposed. In this design, the test systems are divided according to the number of areas in the system and accordingly there are equal numbers of PNN modules have been developed to asses the transient stability state of the test systems. By decomposing the system into smaller areas, the computational time taken in training the PNN can be greatly reduced as compared to developing one PNN for the whole system. This modular design also provides flexibility to configuration changes within each area.
Thus, the data collected from the transient stability simulations on the test systems are divided into different areas according to the location of faults in the systems. The advantages of dividing the data according to areas are that the number of data can be reduced and the time taken to train the PNN neural networks system can also be reduced.
Data for each three-phase fault is recorded in which 42 samples of data are taken. For the 39-bus system there are 138 three-phase faults simulated on the system and this gives a size of 138x42 or 5,796 data collected. As for the 87-bus system there are 342 three-phase faults simulated and therefore the size of collected data is 14,364. The faults are divided according to the location of their respective transmission lines in their respective areas mentioned previously.
Table I and Table II shows the breakdown of the total, training and testing data for the respective areas of both test systems. The training data constitute three quarter of the input data and the remaining quarter are left for testing data. The different number of data for all areas of both test systems is due to different number of buses, transmission lines, generators etc. of respective areas in the test systems.
Transient Stability Assessment of Power Systems using Probabilistic
110
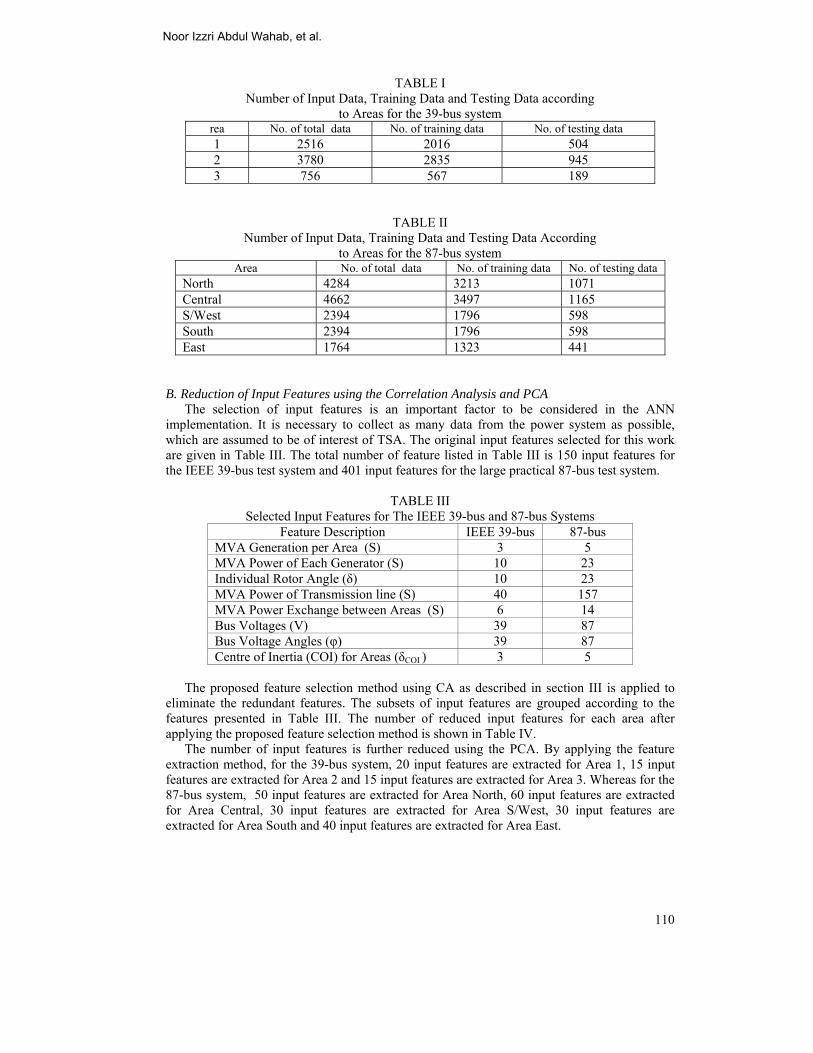
TABLE I Number of Input Data, Training Data and Testing Data according
to Areas for the 39-bus system rea No. of total data No. of training data No. of testing data 1 2516 2016 504 2 3780 2835 945 3 756 567 189
TABLE II Number of Input Data, Training Data and Testing Data According
to Areas for the 87-bus system Area No. of total data No. of training data No. of testing data
North 4284 3213 1071 Central 4662 3497 1165 S/West 2394 1796 598 South 2394 1796 598 East 1764 1323 441
B. Reduction of Input Features using the Correlation Analysis and PCA
The selection of input features is an important factor to be considered in the ANN implementation. It is necessary to collect as many data from the power system as possible, which are assumed to be of interest of TSA. The original input features selected for this work are given in Table III. The total number of feature listed in Table III is 150 input features for the IEEE 39-bus test system and 401 input features for the large practical 87-bus test system.
TABLE III
Selected Input Features for The IEEE 39-bus and 87-bus Systems Feature Description IEEE 39-bus 87-bus
MVA Generation per Area (S) 3 5 MVA Power of Each Generator (S) 10 23 Individual Rotor Angle (δ) 10 23 MVA Power of Transmission line (S) 40 157 MVA Power Exchange between Areas (S) 6 14 Bus Voltages (V) 39 87 Bus Voltage Angles (φ) 39 87 Centre of Inertia (COI) for Areas (δCOI ) 3 5
The proposed feature selection method using CA as described in section III is applied to
eliminate the redundant features. The subsets of input features are grouped according to the features presented in Table III. The number of reduced input features for each area after applying the proposed feature selection method is shown in Table IV.
The number of input features is further reduced using the PCA. By applying the feature extraction method, for the 39-bus system, 20 input features are extracted for Area 1, 15 input features are extracted for Area 2 and 15 input features are extracted for Area 3. Whereas for the 87-bus system, 50 input features are extracted for Area North, 60 input features are extracted for Area Central, 30 input features are extracted for Area S/West, 30 input features are extracted for Area South and 40 input features are extracted for Area East.
Noor Izzri Abdul Wahab, et al.
111
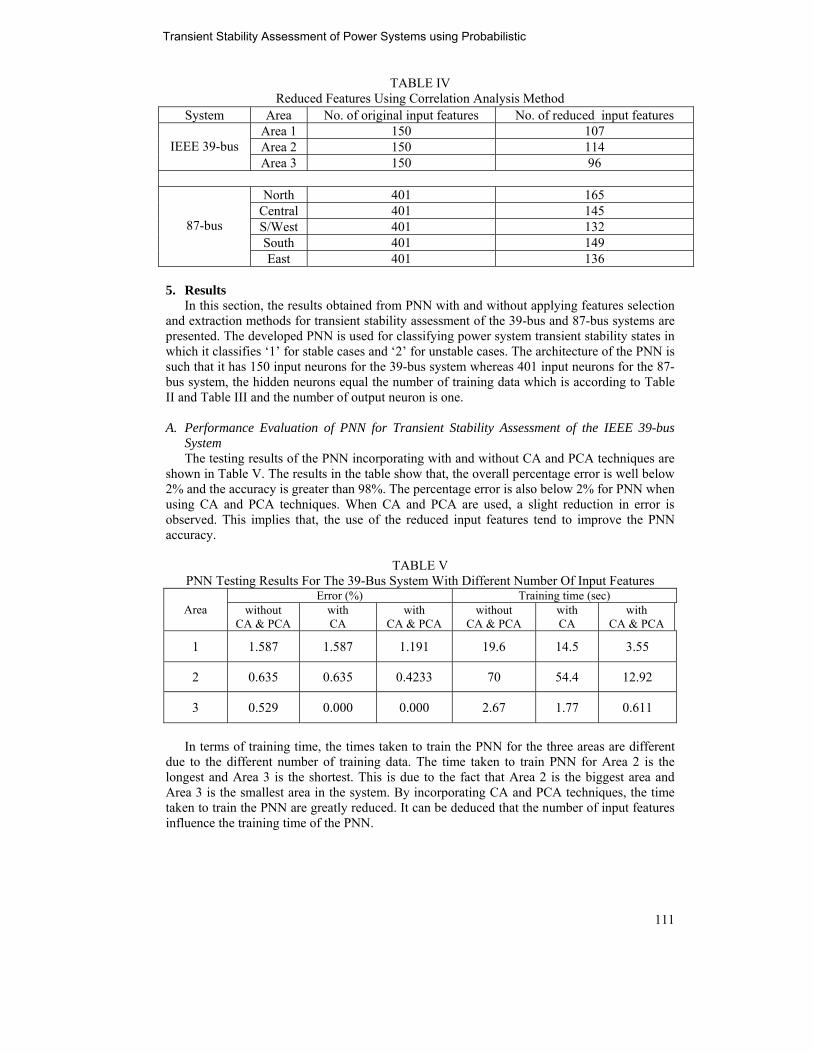
TABLE IV Reduced Features Using Correlation Analysis Method
5. Results
In this section, the results obtained from PNN with and without applying features selection and extraction methods for transient stability assessment of the 39-bus and 87-bus systems are presented. The developed PNN is used for classifying power system transient stability states in which it classifies ‘1’ for stable cases and ‘2’ for unstable cases. The architecture of the PNN is such that it has 150 input neurons for the 39-bus system whereas 401 input neurons for the 87-bus system, the hidden neurons equal the number of training data which is according to Table II and Table III and the number of output neuron is one.
A. Performance Evaluation of PNN for Transient Stability Assessment of the IEEE 39-bus
System The testing results of the PNN incorporating with and without CA and PCA techniques are
shown in Table V. The results in the table show that, the overall percentage error is well below 2% and the accuracy is greater than 98%. The percentage error is also below 2% for PNN when using CA and PCA techniques. When CA and PCA are used, a slight reduction in error is observed. This implies that, the use of the reduced input features tend to improve the PNN accuracy.
TABLE V PNN Testing Results For The 39-Bus System With Different Number Of Input Features
Area Error (%) Training time (sec)
without CA & PCA
with CA
with CA & PCA
without CA & PCA
with CA
with CA & PCA
1 1.587 1.587 1.191 19.6 14.5 3.55
2 0.635 0.635 0.4233 70 54.4 12.92
3 0.529 0.000 0.000 2.67 1.77 0.611
In terms of training time, the times taken to train the PNN for the three areas are different
due to the different number of training data. The time taken to train PNN for Area 2 is the longest and Area 3 is the shortest. This is due to the fact that Area 2 is the biggest area and Area 3 is the smallest area in the system. By incorporating CA and PCA techniques, the time taken to train the PNN are greatly reduced. It can be deduced that the number of input features influence the training time of the PNN.
System Area No. of original input features No. of reduced input features
IEEE 39-bus Area 1 150 107 Area 2 150 114 Area 3 150 96
87-bus
North 401 165 Central 401 145 S/West 401 132 South 401 149 East 401 136
Transient Stability Assessment of Power Systems using Probabilistic
112
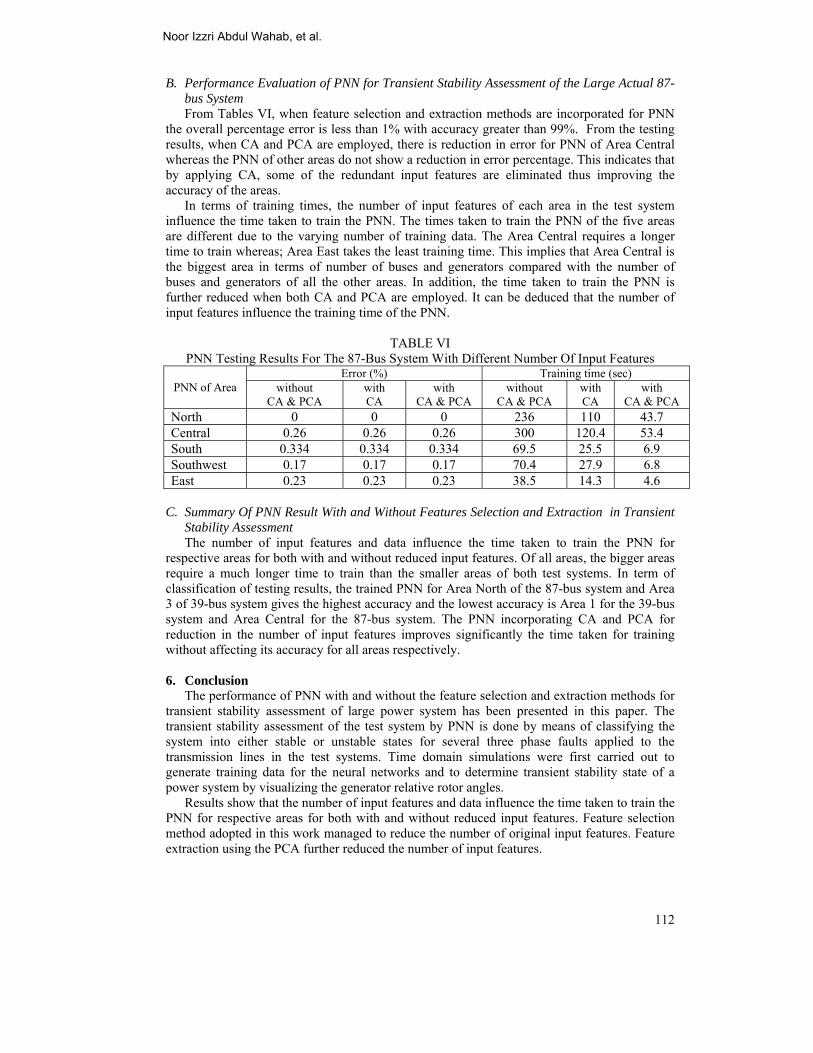
B. Performance Evaluation of PNN for Transient Stability Assessment of the Large Actual 87-bus System From Tables VI, when feature selection and extraction methods are incorporated for PNN
the overall percentage error is less than 1% with accuracy greater than 99%. From the testing results, when CA and PCA are employed, there is reduction in error for PNN of Area Central whereas the PNN of other areas do not show a reduction in error percentage. This indicates that by applying CA, some of the redundant input features are eliminated thus improving the accuracy of the areas.
In terms of training times, the number of input features of each area in the test system influence the time taken to train the PNN. The times taken to train the PNN of the five areas are different due to the varying number of training data. The Area Central requires a longer time to train whereas; Area East takes the least training time. This implies that Area Central is the biggest area in terms of number of buses and generators compared with the number of buses and generators of all the other areas. In addition, the time taken to train the PNN is further reduced when both CA and PCA are employed. It can be deduced that the number of input features influence the training time of the PNN.
TABLE VI PNN Testing Results For The 87-Bus System With Different Number Of Input Features
PNN of Area Error (%) Training time (sec)
without CA & PCA
with CA
with CA & PCA
without CA & PCA
with CA
with CA & PCA
North 0 0 0 236 110 43.7 Central 0.26 0.26 0.26 300 120.4 53.4 South 0.334 0.334 0.334 69.5 25.5 6.9 Southwest 0.17 0.17 0.17 70.4 27.9 6.8 East 0.23 0.23 0.23 38.5 14.3 4.6
C. Summary Of PNN Result With and Without Features Selection and Extraction in Transient
Stability Assessment The number of input features and data influence the time taken to train the PNN for
respective areas for both with and without reduced input features. Of all areas, the bigger areas require a much longer time to train than the smaller areas of both test systems. In term of classification of testing results, the trained PNN for Area North of the 87-bus system and Area 3 of 39-bus system gives the highest accuracy and the lowest accuracy is Area 1 for the 39-bus system and Area Central for the 87-bus system. The PNN incorporating CA and PCA for reduction in the number of input features improves significantly the time taken for training without affecting its accuracy for all areas respectively. 6. Conclusion
The performance of PNN with and without the feature selection and extraction methods for transient stability assessment of large power system has been presented in this paper. The transient stability assessment of the test system by PNN is done by means of classifying the system into either stable or unstable states for several three phase faults applied to the transmission lines in the test systems. Time domain simulations were first carried out to generate training data for the neural networks and to determine transient stability state of a power system by visualizing the generator relative rotor angles.
Results show that the number of input features and data influence the time taken to train the PNN for respective areas for both with and without reduced input features. Feature selection method adopted in this work managed to reduce the number of original input features. Feature extraction using the PCA further reduced the number of input features.
Noor Izzri Abdul Wahab, et al.
113
Among the two methods used in this work, the PNN with feature selection and extraction methods gives better results in reducing the time taken for training without affecting its accuracy for all areas of the 39-bus system and the large actual power system. From the results, it can be concluded that PNN, are capable of assessing the transient stability of the 87-bus system with percentage error less than 1% and with percentage error less than 2% for the IEEE 39-bus system. References [1] L.S. Moulin, A.P.A. da Silva, M.A. El-Sharkawi, R.J. Marks, “Support vector and
multilayer perceptron neural networks applied to power systems transient stability analysis with input dimensionality reduction,” IEEE PES Summer Meeting, vol. 3, pp. 1308 – 1313, July 2002.
[2] L.S. Moulin, A.P.A. da Silva,M.A. El-Sharkawi, R.J. Marks, “Support vector machines for transient stability analysis of large-scale power systems,” IEEE Transactions on Power Systems, vol. 19(2), pp. 818-825, May 2004.
[3] N.I. Abdul Wahab, A. Mohamed, A. Hussain, “Transient stability assessment of a power system using PNN and LS-SVM methods,” Journal of Applied Sciences, vol. 7(21), pp. 3208-3216, November 2007.
[4] F. Specht, Enhancements to probabilistic neural networks. International Joint Conference on Neural Networks vol. (1), pp. 525 – 532, June 1992.
[5] P. Burrascano, “Learning vector quantization for the probabilistic neural network,” IEEE Transactions on Neural Networks vol. 2(4), pp. 458 – 461, July 1991.
[6] S. Chen, C.F.N. Cowan, P.M. Grant, “Orthogonal least squares learning algorithm for radial basis function networks,” IEEE Transactions on Neural Networks vol. 2(2), pp. 302-309, March 1991.
[7] C.A. Jensen, M. El-Sharkawi, R.J. Marks, “Power system security assessment using neural networks: feature selection using Fisher discrimination,” IEEE Trans. On Power Systems, vol. 16(4), pp. 757-763, November 2001.
[8] S. Harinder, B. Jeyasurya, “A feed-forward artificial neural network with enhanced feature selection for power system transient stability assessment,” Electric Power System Research, vol.76(12), pp. 1047-1054, August 2006.
[9] P. Mitra, C.A. Murthy, S.K. Pal, “Unsupervised Feature Selection using Feature Similarity,” IEEE Trans. On Pattern Analysis and Machine Intelligence, vol. 24(3), pp. 301-312, March 2002.
[10] B. Scholkopf, A. Smola, and K.-R. Muller, Kernel Principal Component Analysis, in Advances in Kernel Methods - SV Learning, Cambridge, MA: MIT Press, 1999, pp. 327–352.
[11] C. Andersson, “Power System Security Assessment: Application of Learning Algorithm,” PhD thesis, Dept. of Industrial Electrical Engineering and Automation, Lund University, Lund, Sweden, Aug. 2005.
[12] N. Amjady and S. F. Majedi, “Transient stability prediction by a hybrid intelligent system,” IEEE Trans. on Power System, vol. 22(3), pp. 1275-1283, August 2007.
[13] G. Ziegler, Numerical Distance Protection: Principle and Applications. Publicis MCD, Munich and Erlangen, 1999, pp. 191-193.
[14] P. Kundur, J. Paserba, V. Ajjarapu, G. Anderson, A. Bose, C. Canizares, N. Hatziargyriou, D. Hill, A. Stankovic, C. Taylor, T. V. Cutsem, and V. Vittal. 2004. Definition and classification of power system stability, IEEE Trans. Power Syst., 19(3): 1387-1401.
[15] N.I. Abdul Wahab, A. Mohamed, “Transient stability assessment on a practical power system using area based COI-referred rotor angles,” European Journal of Scientific Research, vol. 20(1), pp. 152-162, April 2008.
Transient Stability Assessment of Power Systems using Probabilistic
114
Noor Izzri Abd. Wahab, graduated from University of Manchester Institute of Science and Technology (UMIST), UK in Electrical and Electronic Engineering (1998), received MSc. in Electrical Power Engineering from Universiti Putra Malaysia (UPM) (2002), and currently is pursuing PhD from Universiti Kebangsaan Malaysia. He is a lecturer in the Electrical and Electronic Engineering Department, UPM. His areas of interest include; power system quality, power system stability studies and application of artificial intelligence in power system. He is a member of IEEE since 2003.
Azah Mohamed received her B.Sc.Eng. from King’s College, University of London in 1978 and M.Sc. and Ph.D. (power system), from University of Malaya, Malaysia in 1988 and 1995, respectively. She is currently a professor and the Deputy Dean of the Engineering Faculty at Universiti Kebangsaan Malaysia (UKM), Malaysia. Her current research interests are in power quality and other power system studies. She is a senior member of IEEE.