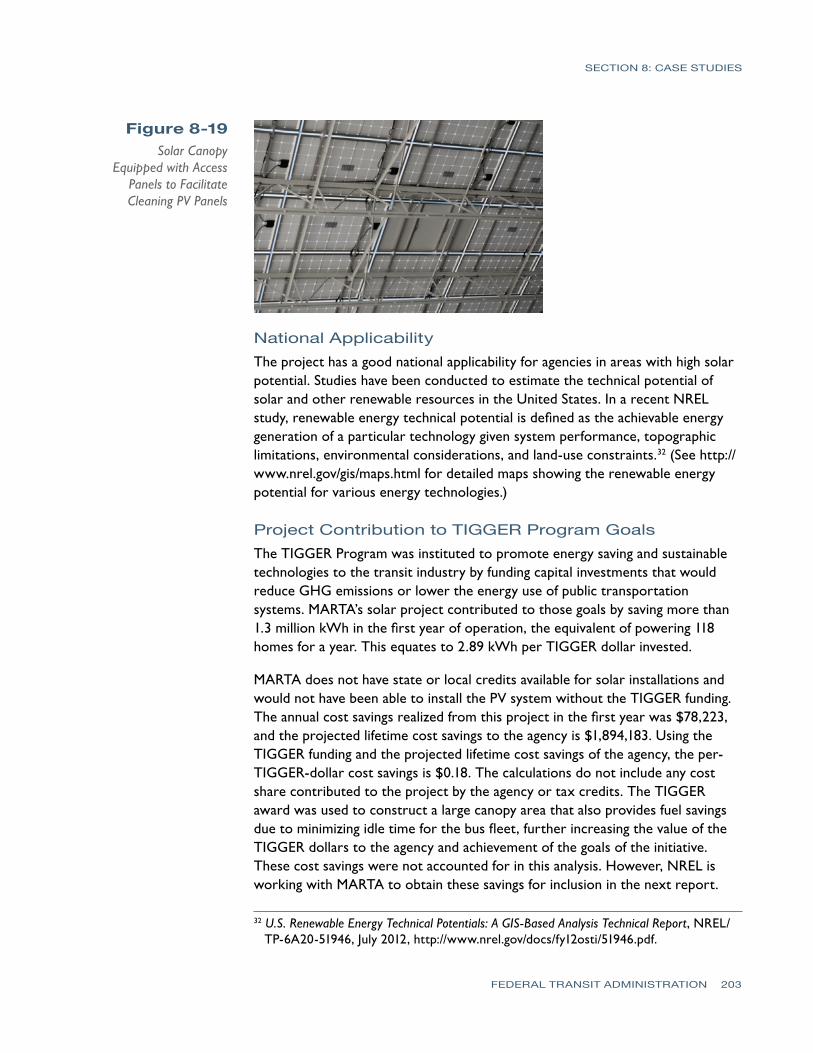
-
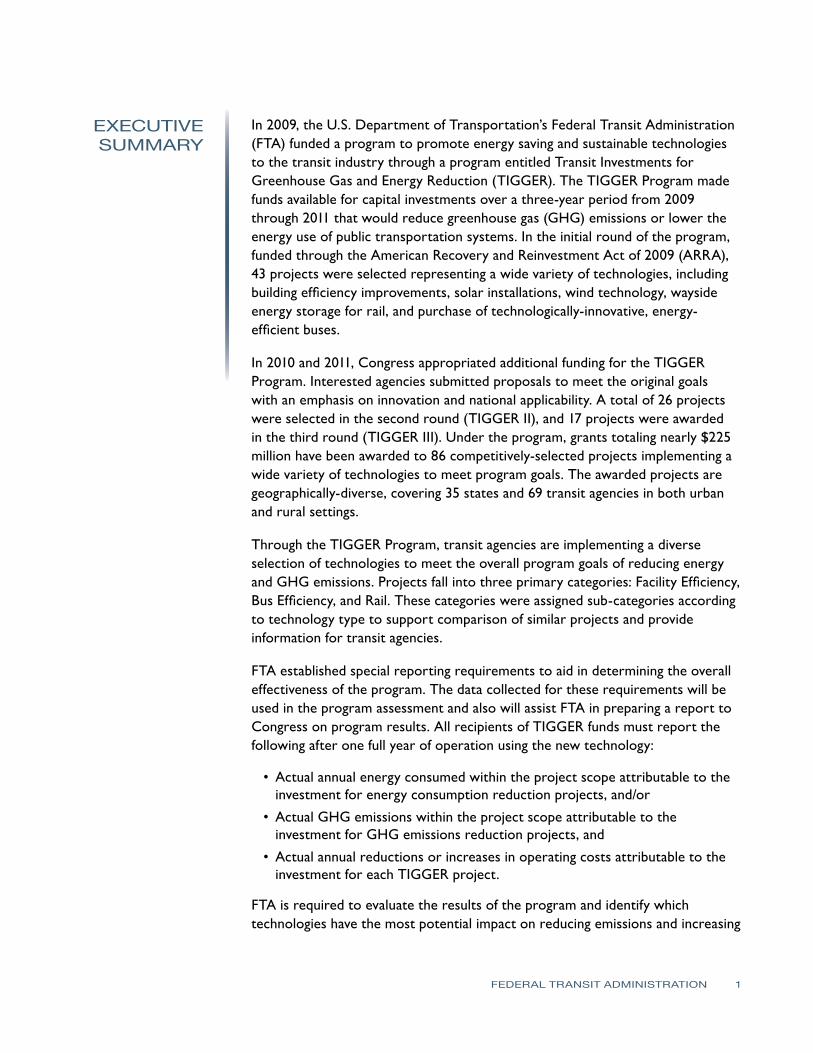
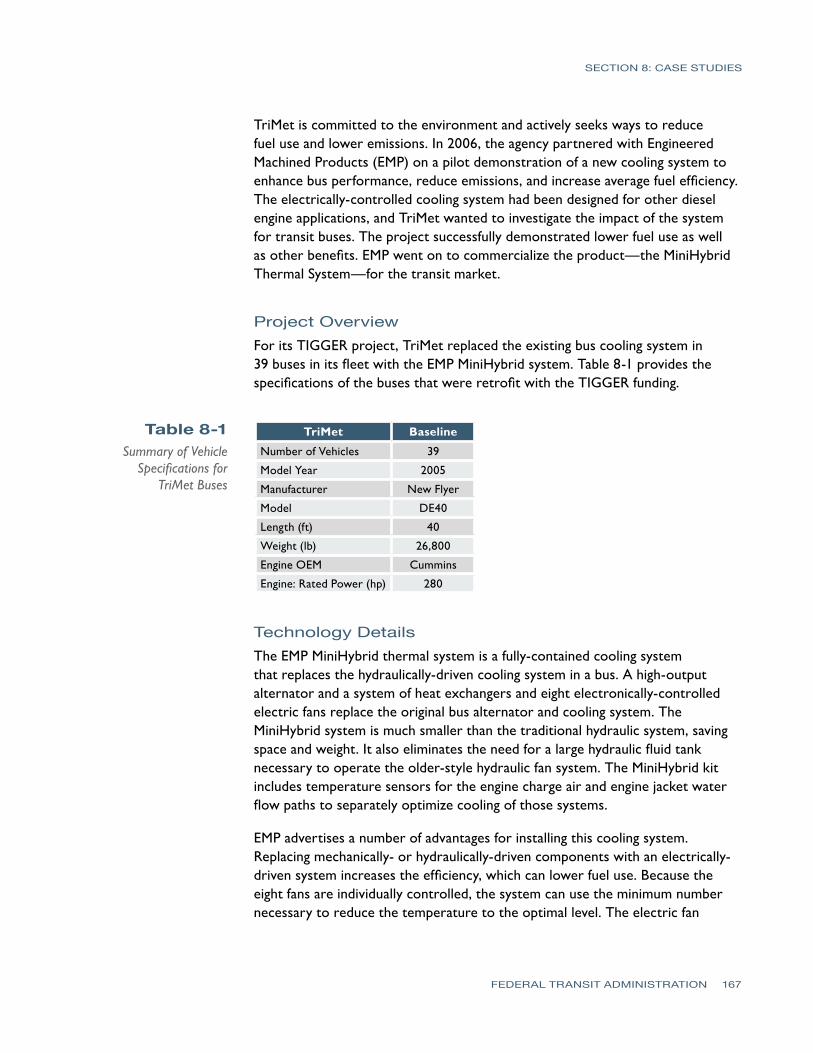
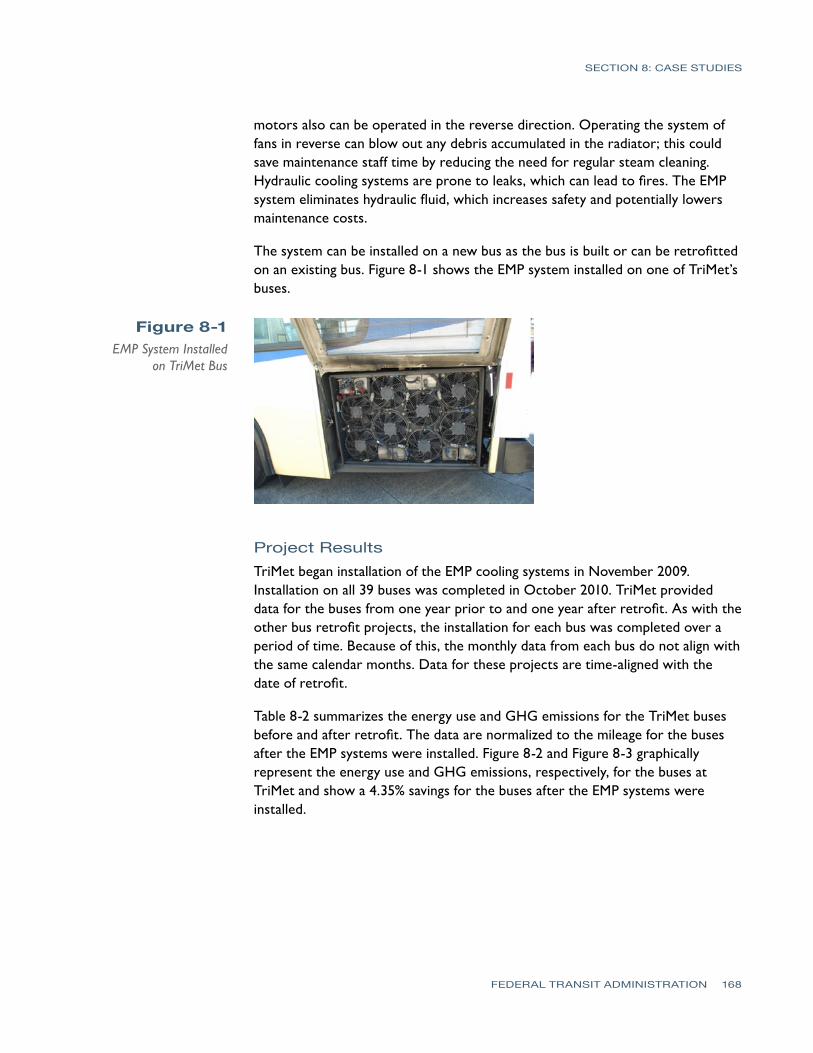
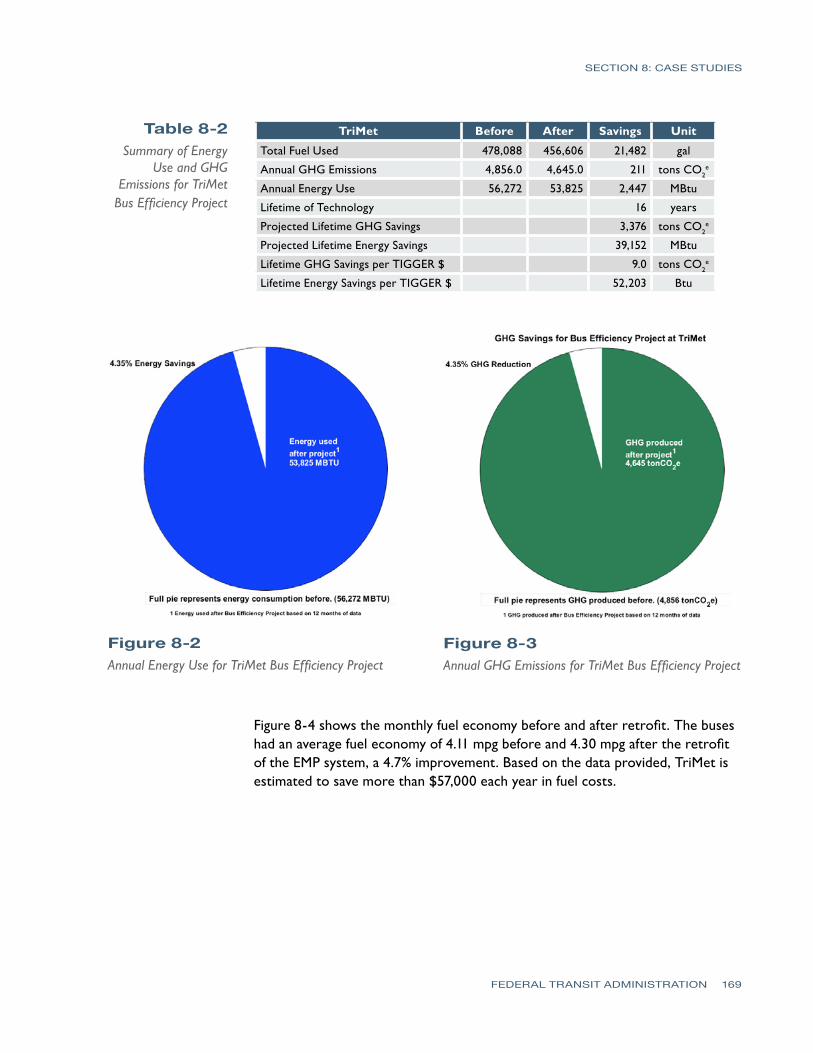
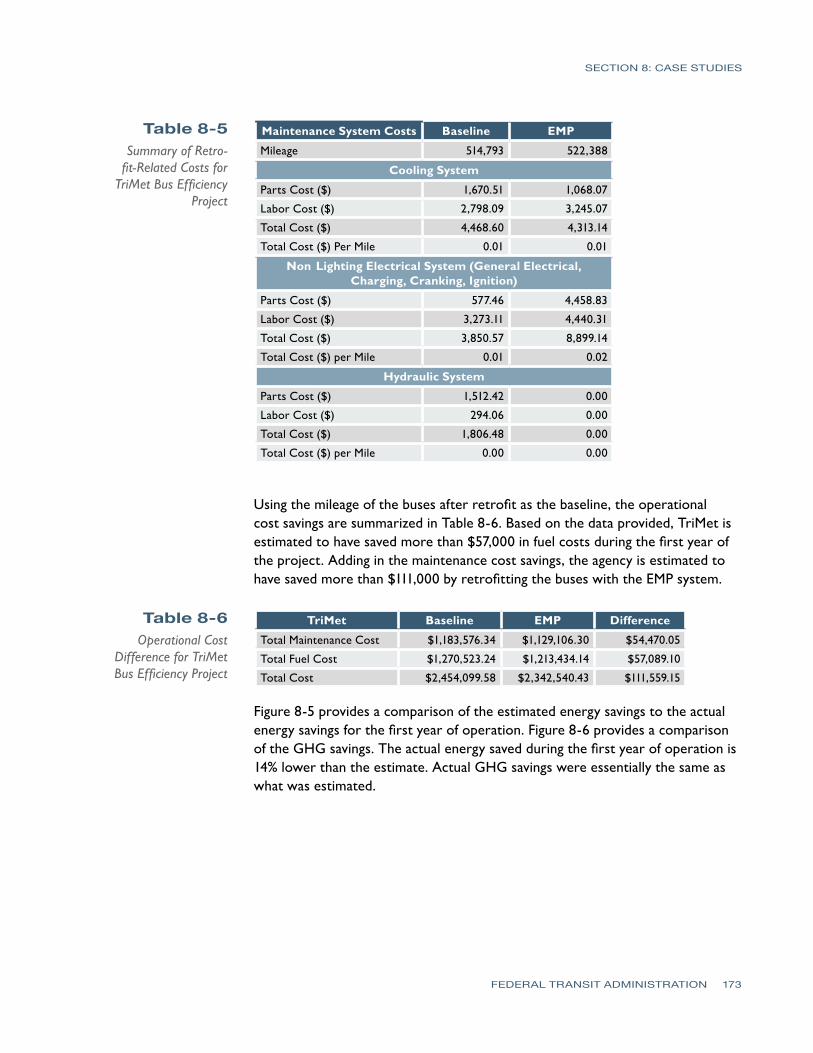
Table 9-2 TIGGER II Projects
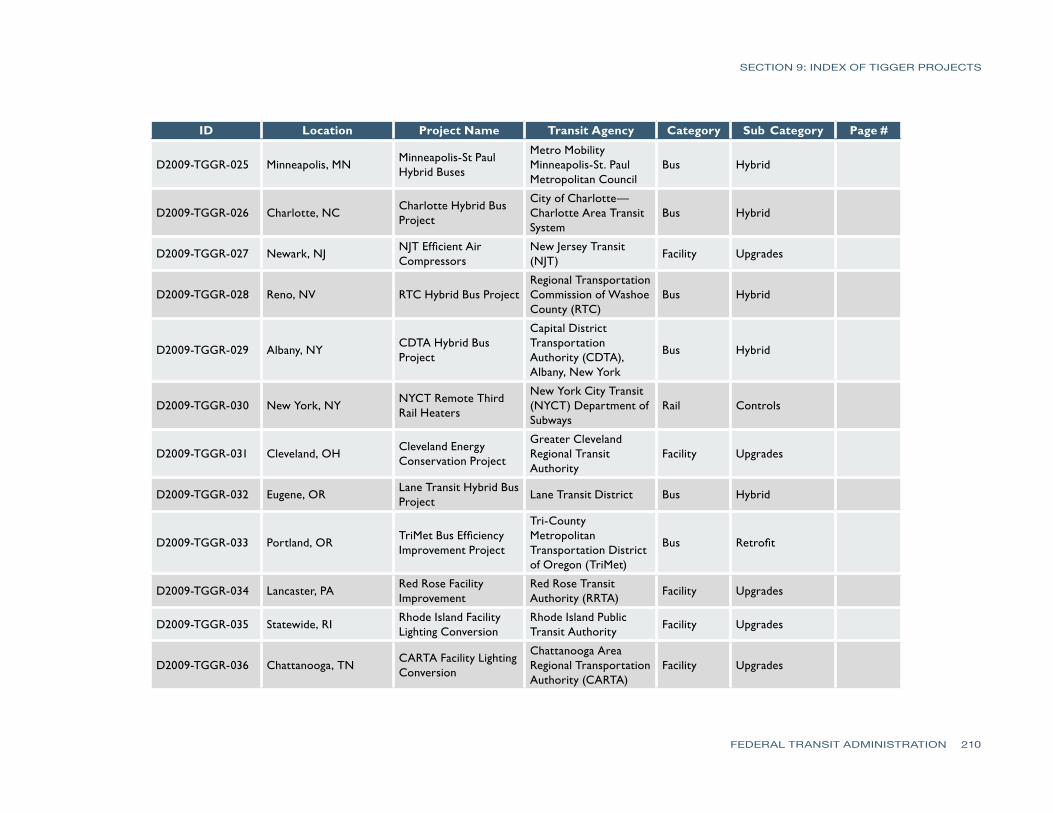
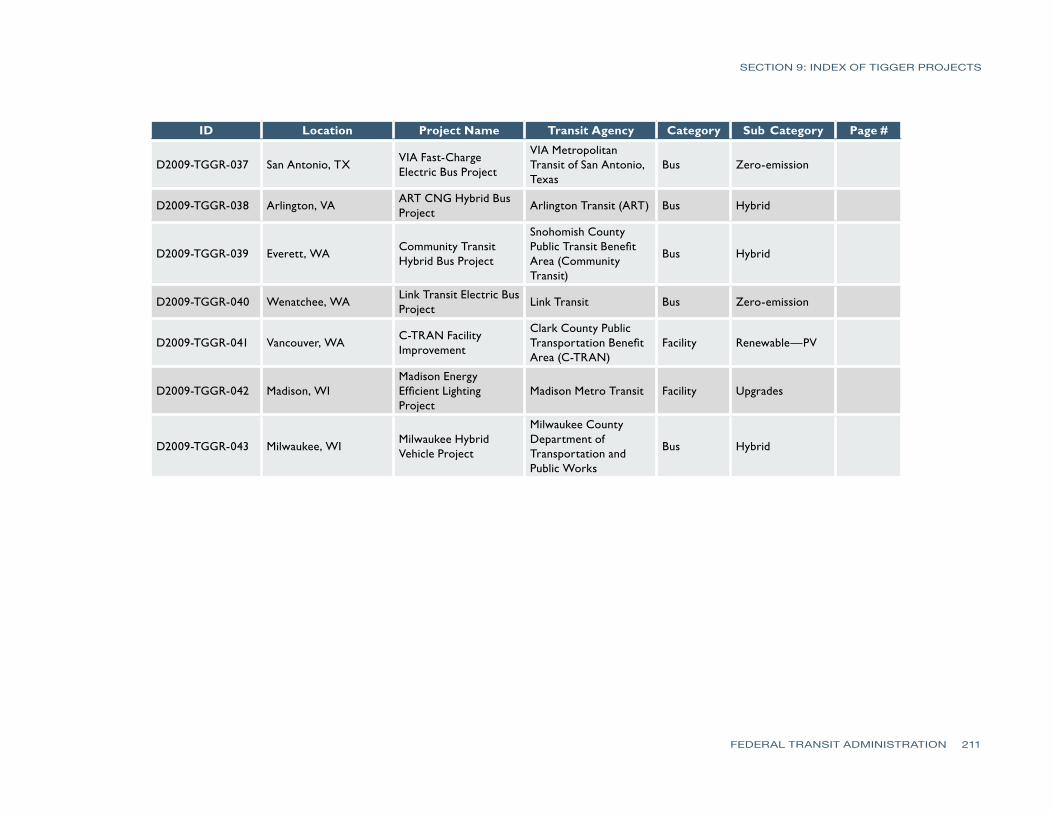
SECTION 9 INDEX OF TIGGER PROJECTS
ID City Project Name Transit Agency Category Sub Category Page
D2010-GGER-001 Anchorage AK Alaska Railroad Locomotive Upgrades
Alaska Railroad Corporation
Rail Locomotive upgrades
D2010-GGER-002 Oakland CA AC Transit Fuel Cell Power System
Alameda-Contra Costa Transit District (AC Transit)
Facility RenewablemdashFC
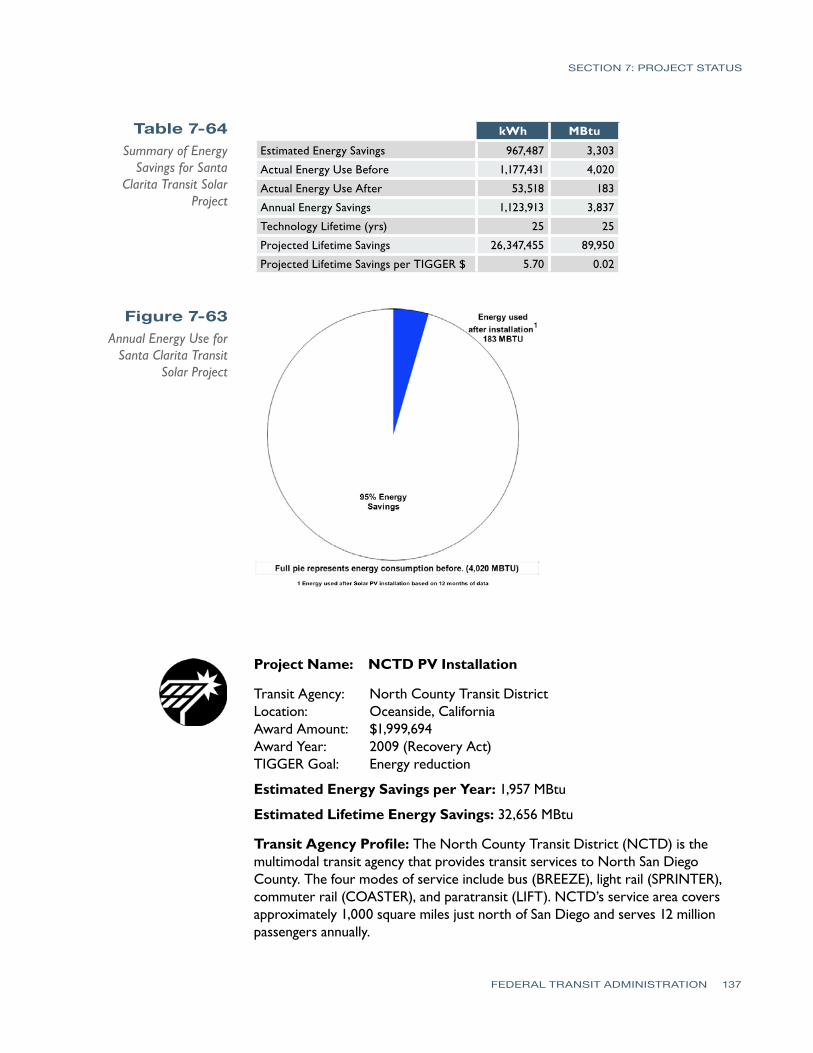
D2010-GGER-003 Ukiah CA Mendocino Solar Canopy Project
Mendocino Transit Authority
Facility RenewablemdashPV
D2010-GGER-004 West Covina CA Foothill Fast-Charge Electric Bus Project
Foothill Transit Bus Zero-emission
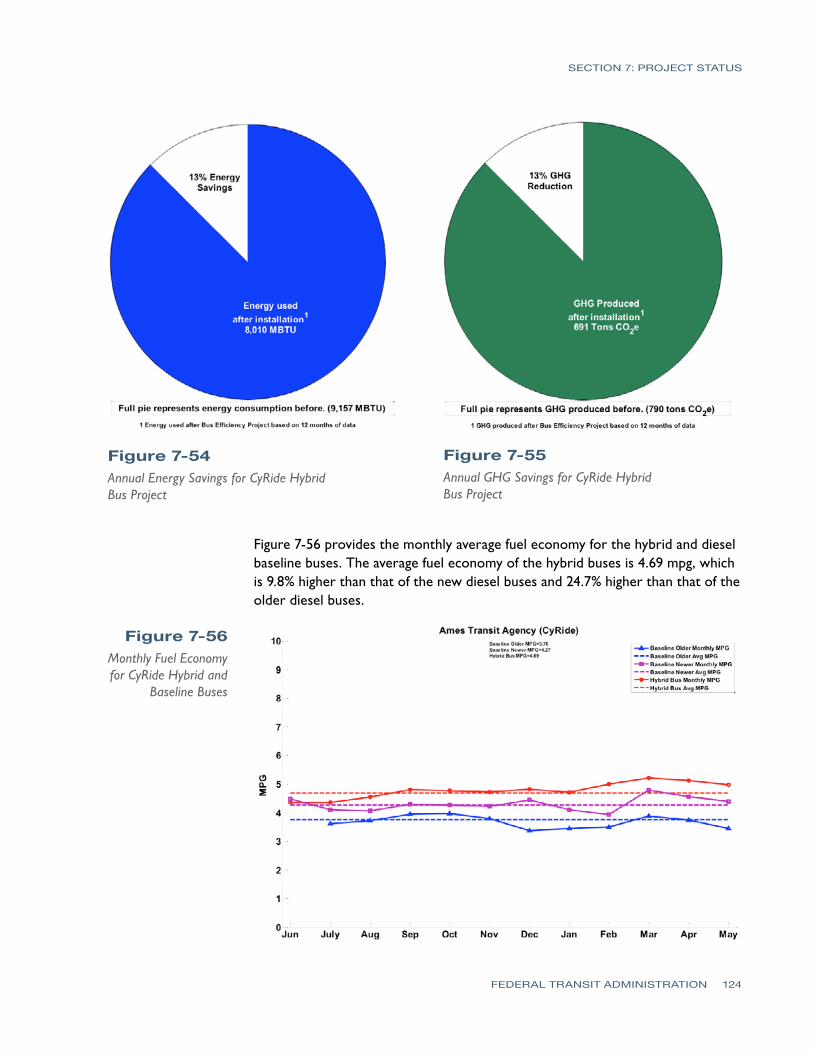
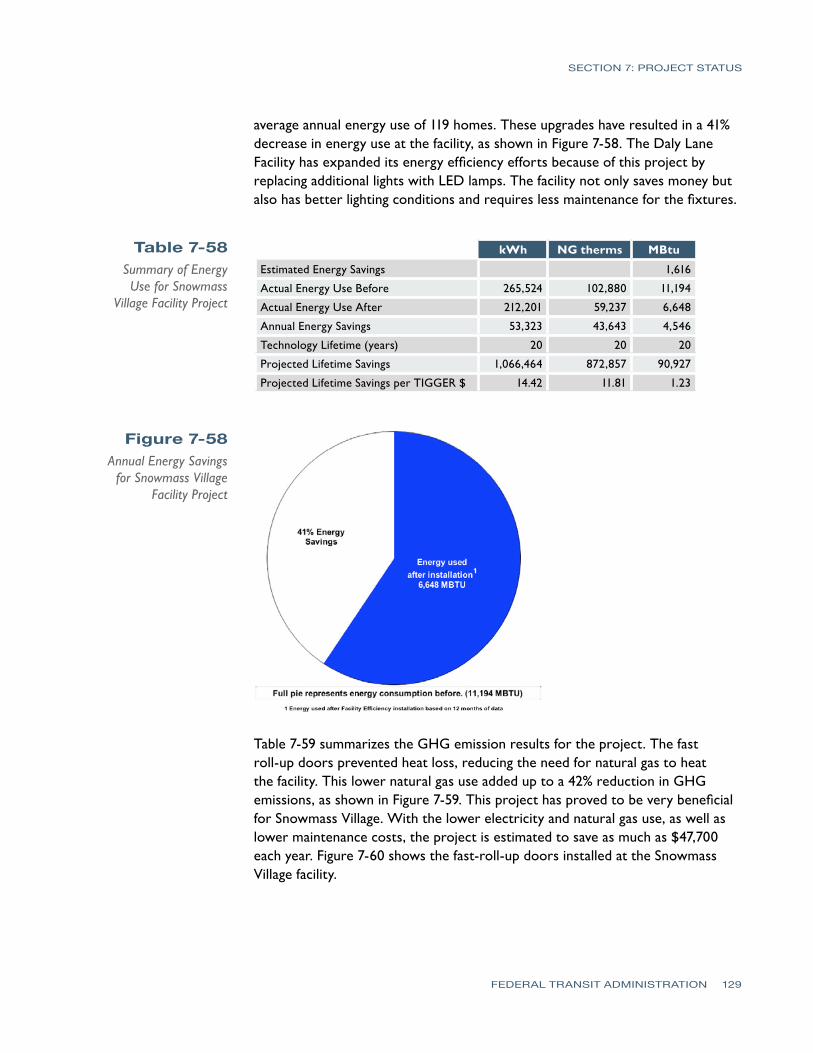
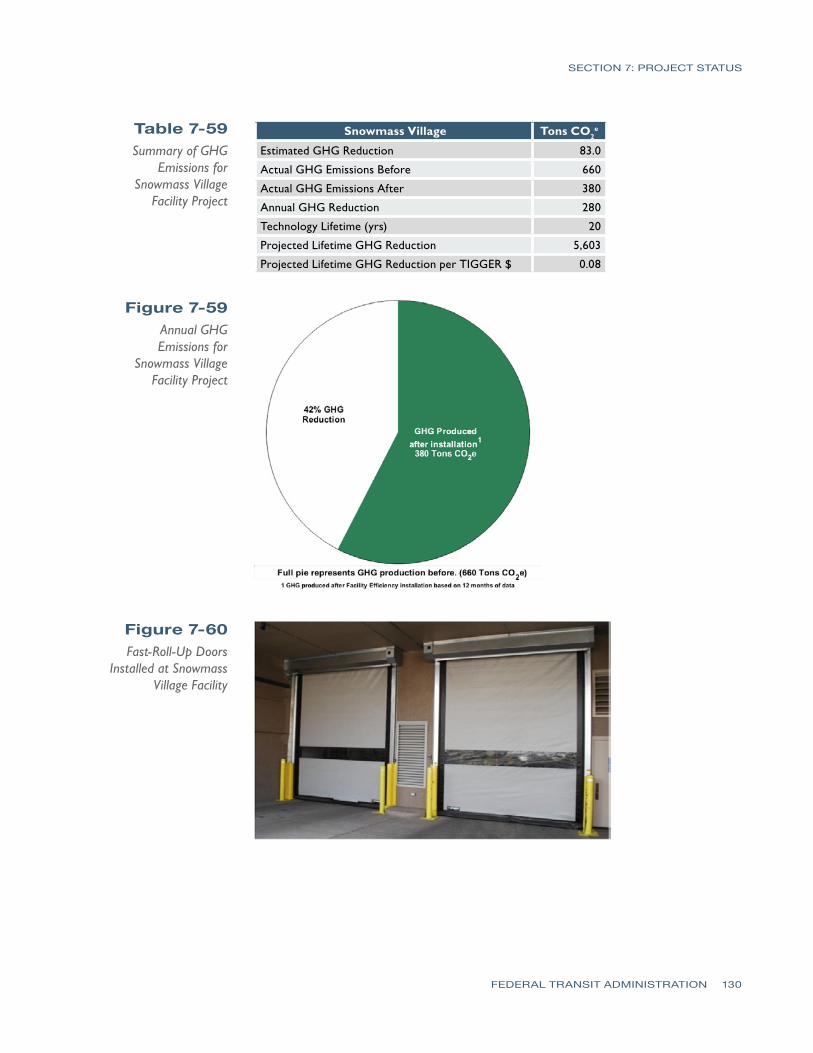
D2010-GGER-005 Snowmass CO Colorado Daly Lane Facility Efficiency Improvement
State of Colorado Snowmass Village
Facility Upgrades
D2010-GGER-006 Tallahassee FL Star Metro Electric Bus Project
City of Tallahassee Bus Zero-emission
D2010-GGER-007 Honolulu HI Honolulu Turbine Hybrid Bus Project
City and County of Honolulu Department of Transportation Services
Bus Hybrid
D2010-GGER-008 Chicago IL IDOT Paratransit Hybrid Bus Program
Illinois Department of Transportation (IDOT)
Bus Hybrid
D2010-GGER-009 Chicago IL CTA Electric Bus Project
Chicago Transit Authority (CTA)
Bus Zero-emission
D2010-GGER-010 Chicago IL IDOT Locomotive Efficiency Project
Illinois Department of Transportation (IDOT)
Rail Locomotive upgrades
D2010-GGER-011 Louisville KY Union Station Energy Efficiency Improvements
Transit Authority of River City
Facility Upgrades
D2010-GGER-012 Fitchburg MA MART Renewable Energy Project
Montachusett Regional Transit Authority (MART)
Facility RenewablemdashPV
D2010-GGER-013 Baltimore MD Howard County Electric Bus Project
Maryland Department of Transportation
Bus Zero-emission
FEDERAL TRANSIT ADMINISTRATION 212
-
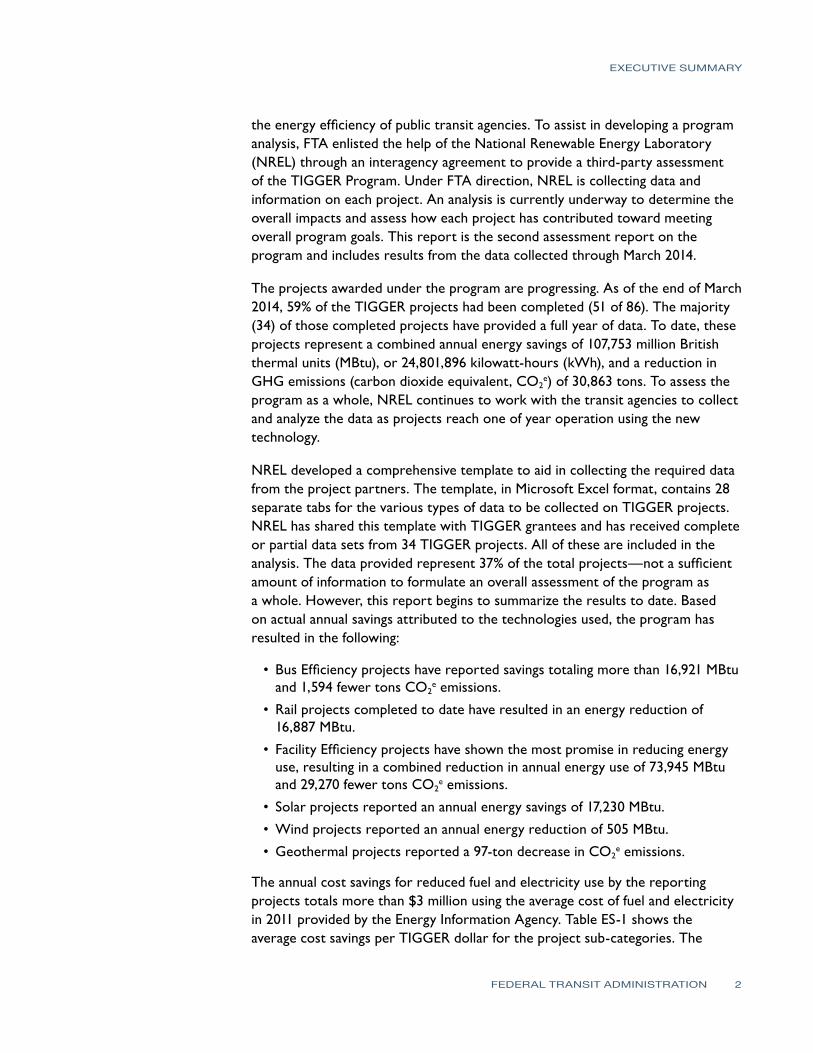
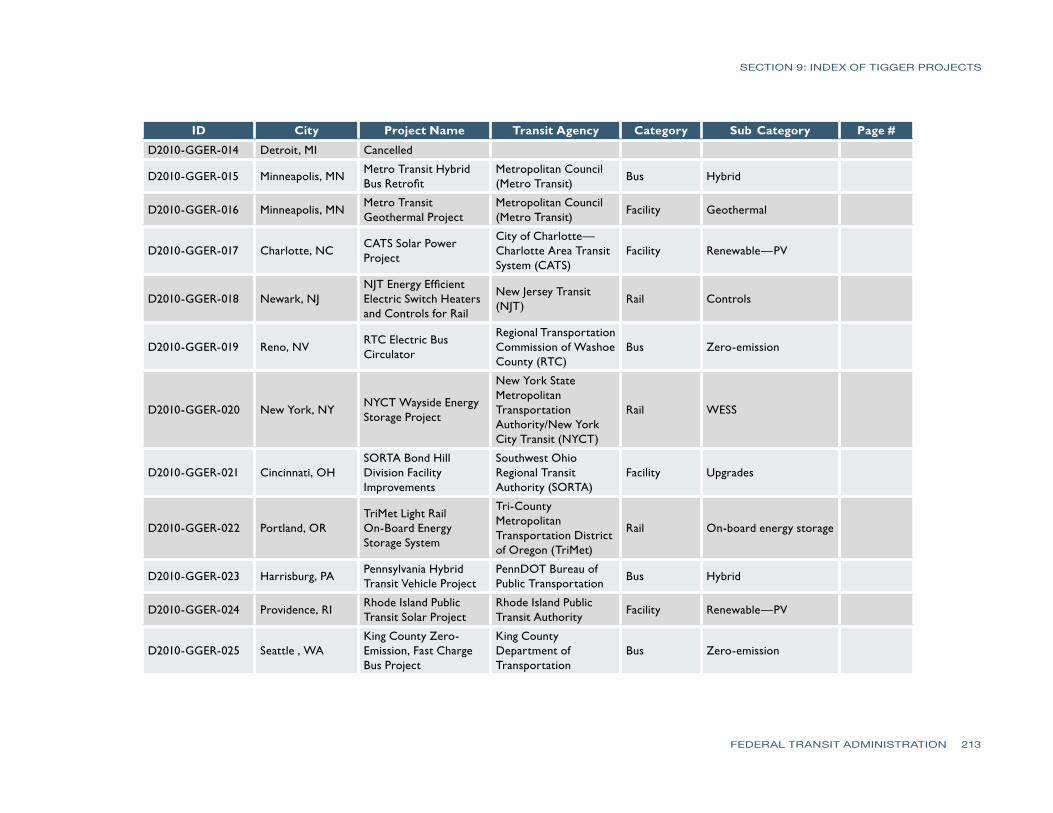
SECTION 9 INDEX OF TIGGER PROJECTS
ID City Project Name Transit Agency Category Sub Category Page
D2010-GGER-014 Detroit MI Cancelled
D2010-GGER-015 Minneapolis MN Metro Transit Hybrid Bus Retrofit
Metropolitan Council (Metro Transit)
Bus Hybrid
D2010-GGER-016 Minneapolis MN Metro Transit Geothermal Project
Metropolitan Council (Metro Transit)
Facility Geothermal
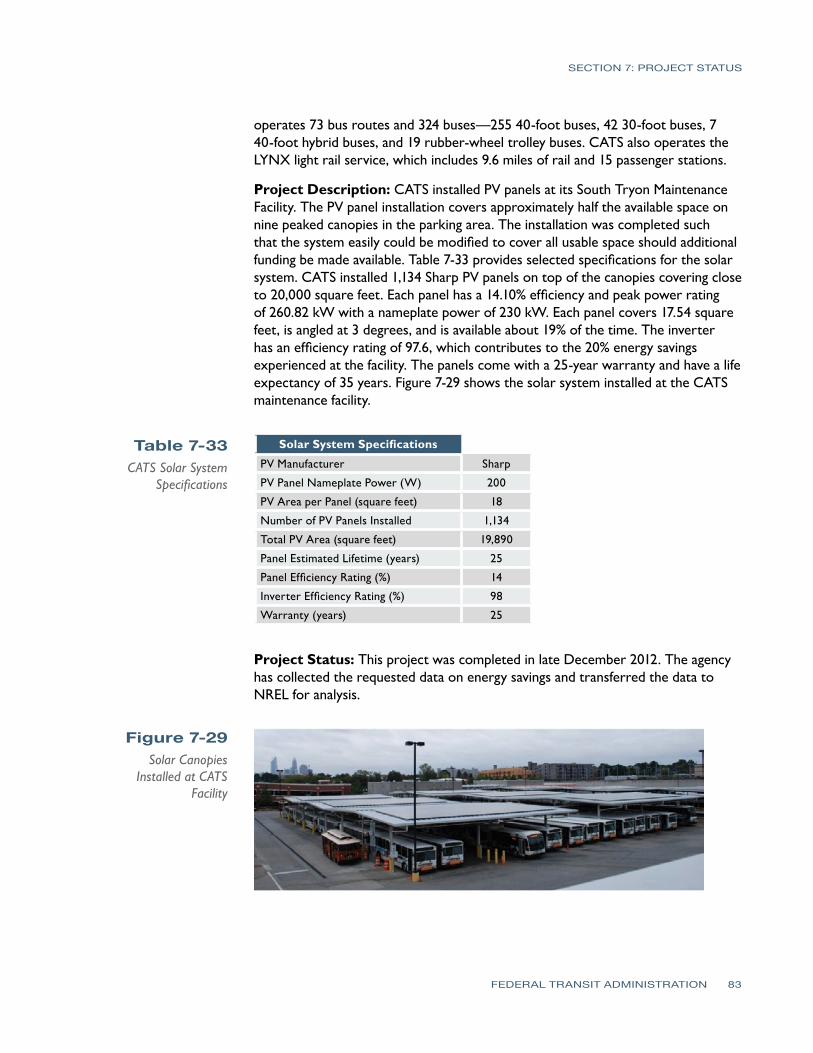
D2010-GGER-017 Charlotte NC CATS Solar Power Project
City of Charlottemdash Charlotte Area Transit System (CATS)
Facility RenewablemdashPV
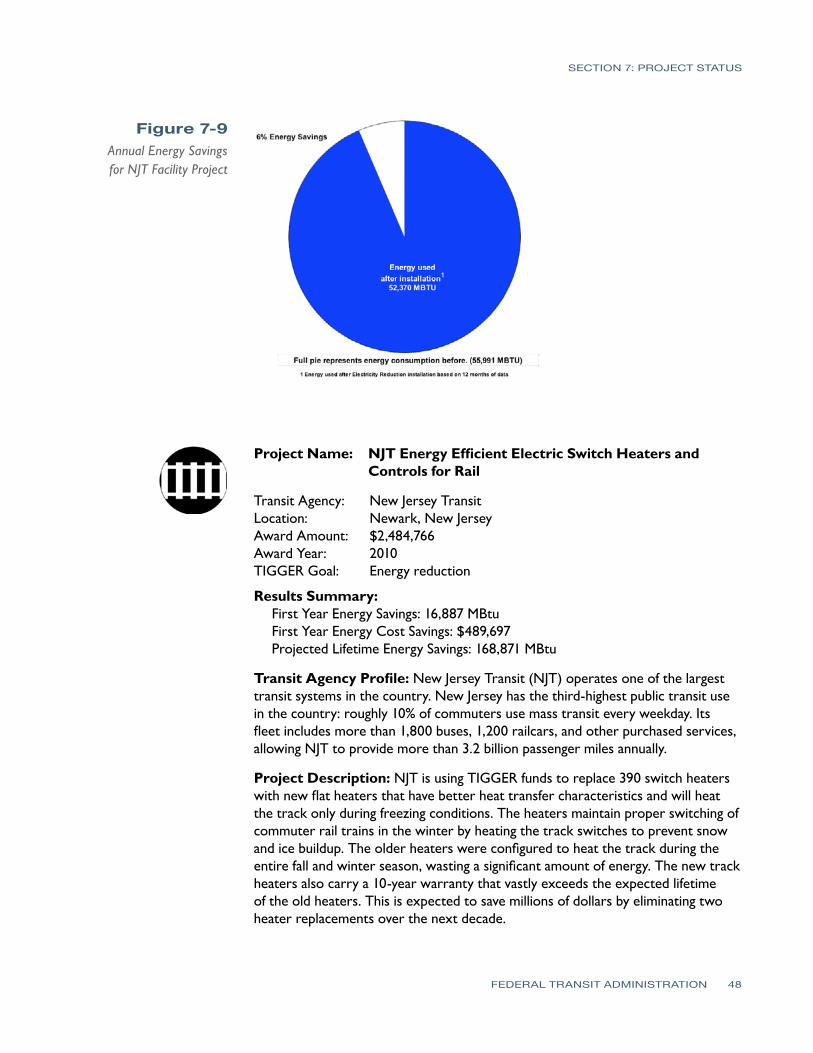
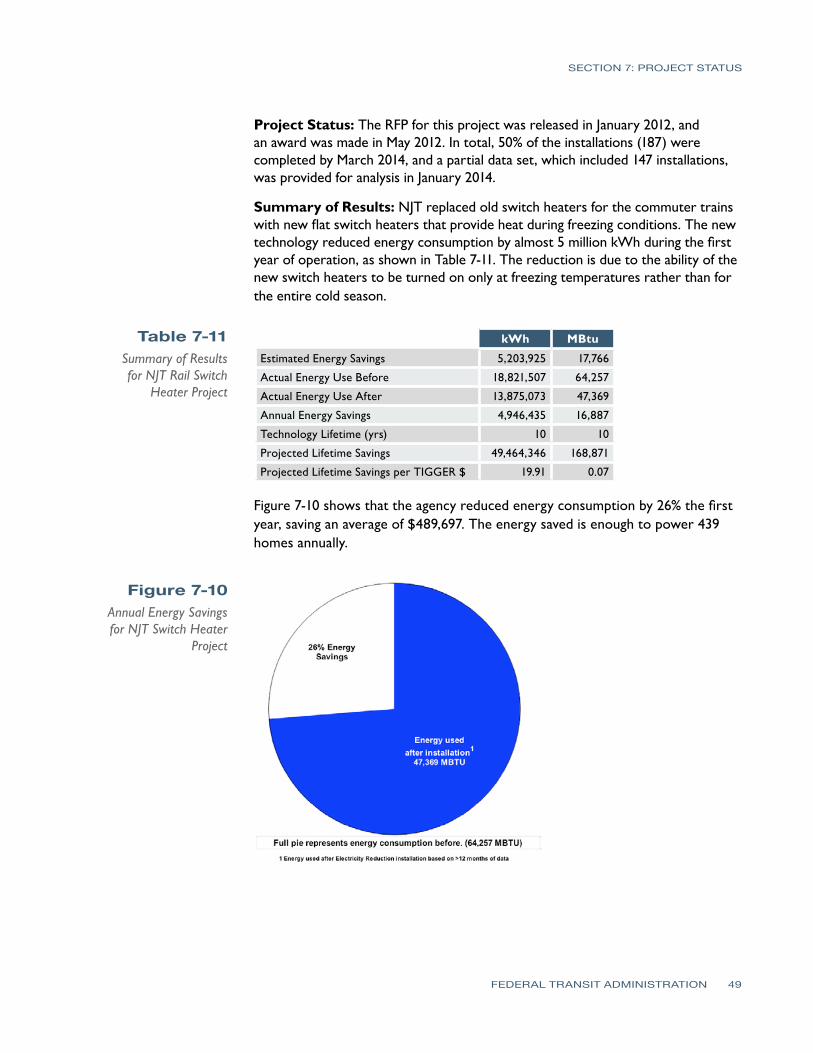
D2010-GGER-018 Newark NJ NJT Energy Efficient Electric Switch Heaters and Controls for Rail
New Jersey Transit (NJT)
Rail Controls
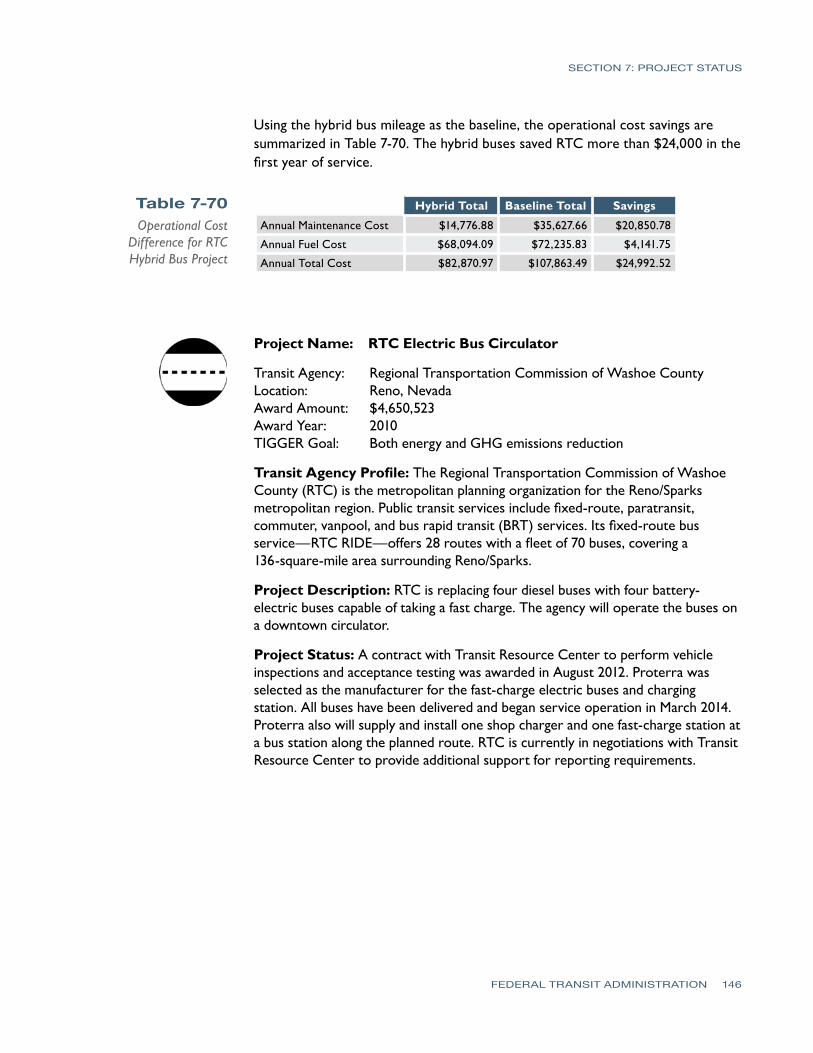
D2010-GGER-019 Reno NV RTC Electric Bus Circulator
Regional Transportation Commission of Washoe County (RTC)
Bus Zero-emission
D2010-GGER-020 New York NY NYCT Wayside Energy Storage Project
New York State Metropolitan Transportation AuthorityNew York City Transit (NYCT)
Rail WESS
D2010-GGER-021 Cincinnati OH SORTA Bond Hill Division Facility Improvements
Southwest Ohio Regional Transit Authority (SORTA)
Facility Upgrades
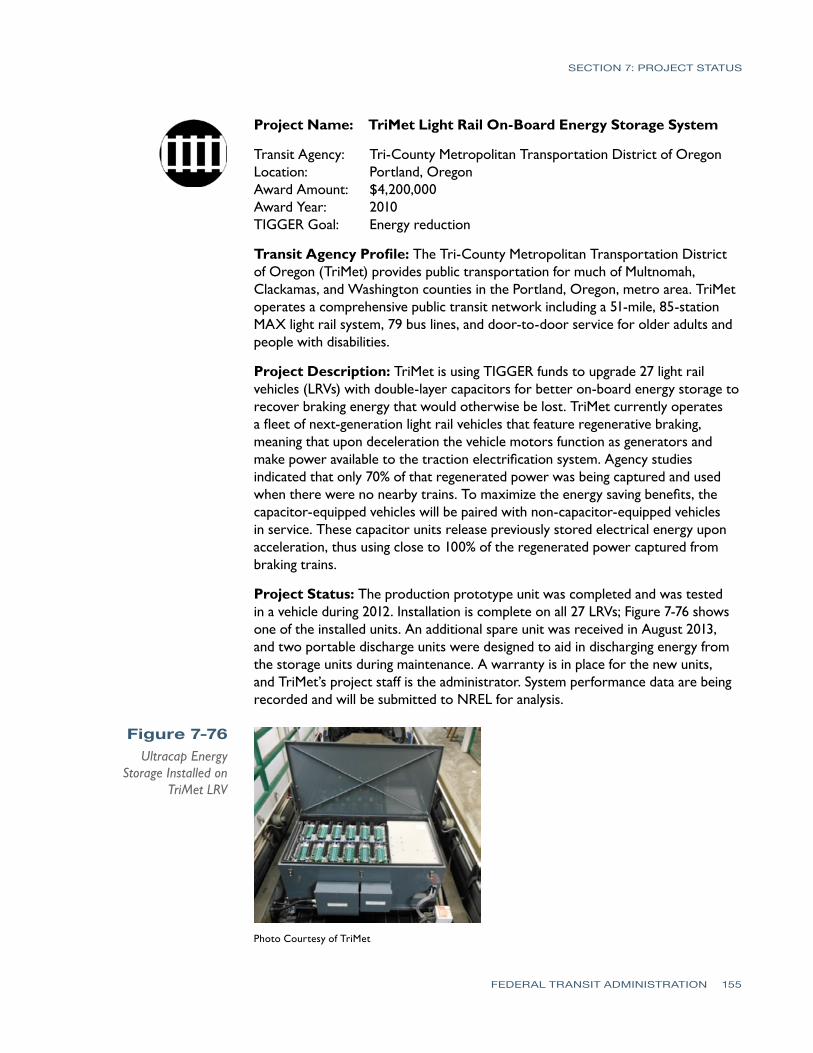
D2010-GGER-022 Portland OR TriMet Light Rail On-Board Energy Storage System
Tri-County Metropolitan Transportation District of Oregon (TriMet)
Rail On-board energy storage
D2010-GGER-023 Harrisburg PA Pennsylvania Hybrid Transit Vehicle Project
PennDOT Bureau of Public Transportation
Bus Hybrid
D2010-GGER-024 Providence RI Rhode Island Public Transit Solar Project
Rhode Island Public Transit Authority
Facility RenewablemdashPV
D2010-GGER-025 Seattle WA King County Zero-Emission Fast Charge Bus Project
King County Department of Transportation
Bus Zero-emission
FEDERAL TRANSIT ADMINISTRATION 213
-
SECTION 9 INDEX OF TIGGER PROJECTS
ID City Project Name Transit Agency Category Sub Category Page
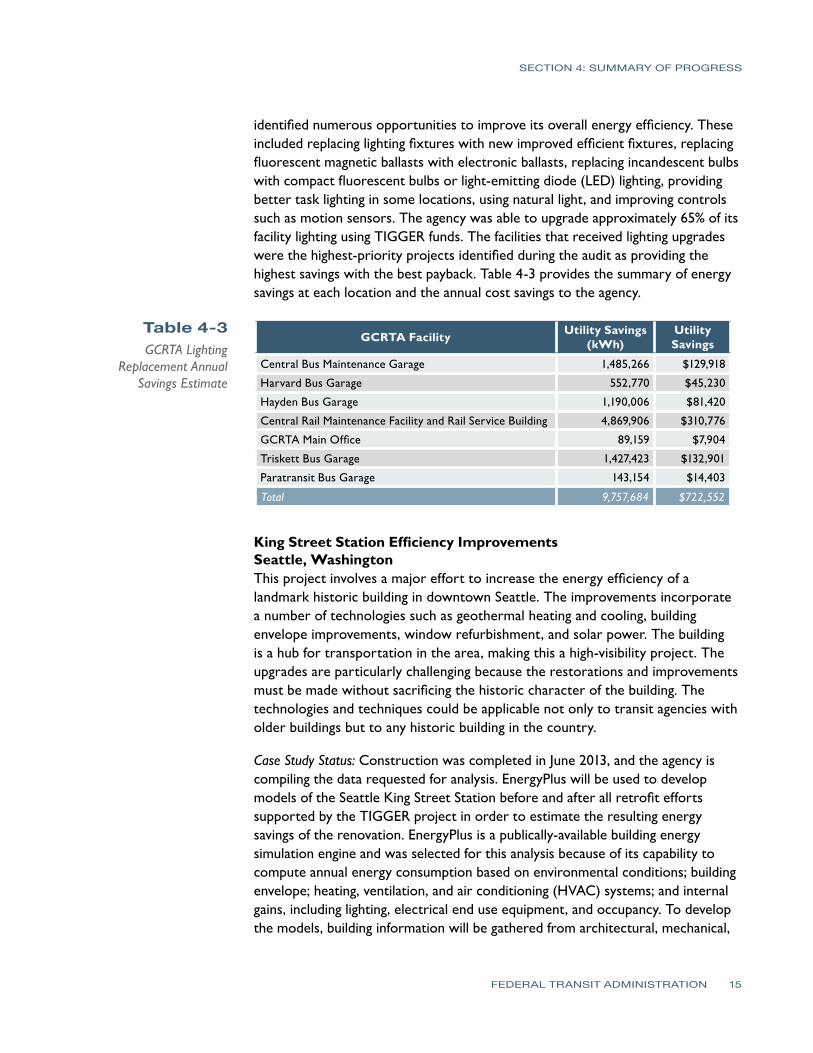
D2010-GGER-026 Seattle WA King Street Station Efficiency Improvements
Seattle Department of Transportation
Facility Upgrades
D2010-GGER-027 Morgantown WV Mountain Line Transit Solar Power Plant
Monongalia County Urban Mass Transit Authority dba Mountain Line Transit Authority
Facility RenewablemdashPV
FEDERAL TRANSIT ADMINISTRATION 214
-
Table 9-3 TIGGER III Projects
SECTION 9 INDEX OF TIGGER PROJECTS
ID City Project Name Transit Agency Category Sub Category Page
D2011-GGER-001 Phoenix AZ Electric Fan Retrofit and Solar Canopy Project
Regional Public Transportation Authority
Bus Facility Retrofit RenewablemdashPV
D2011-GGER-002 Long Beach CA
Long Beach Transit Zero EmissionAll Electric Bus Pilot Project
Long Beach Public Transportation Company
Bus Zero-emission
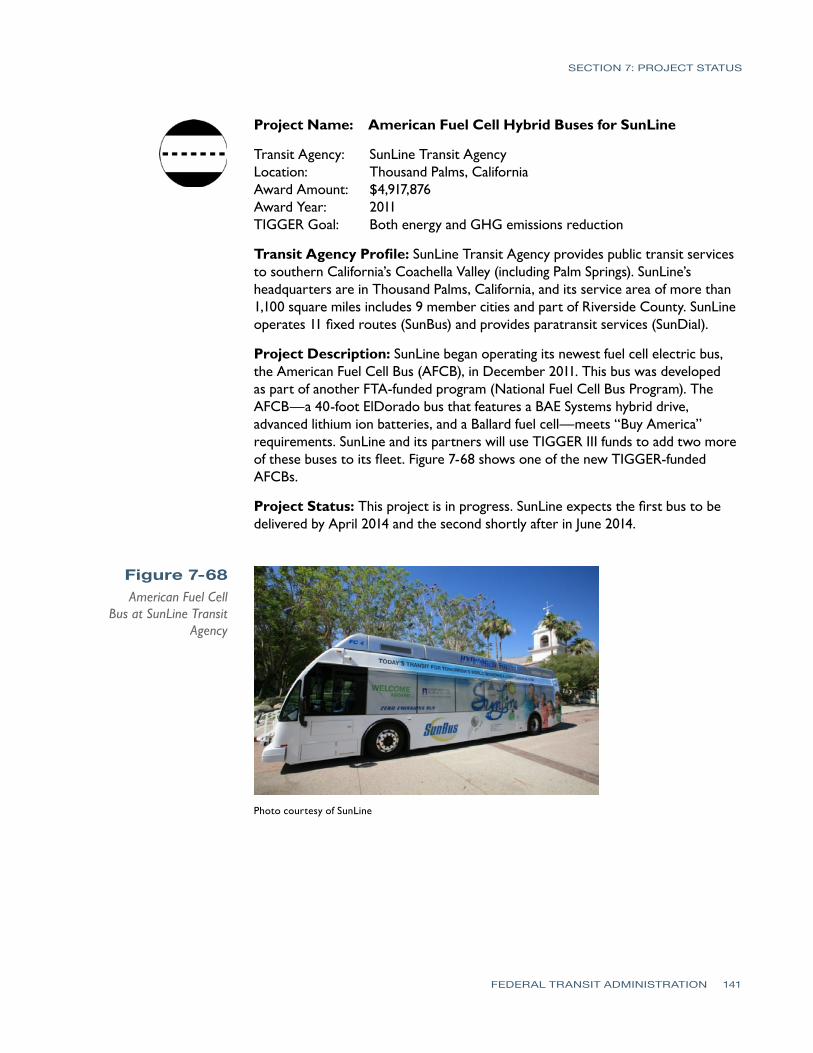
D2011-GGER-003 Thousand Palms CA
American Fuel Cell Hybrid Buses for SunLine Transit
SunLine Transit Agency
Bus Zero-emission
D2011-GGER-004 New Haven CT
CTTRANSIT Stationary Fuel Cell InstallationmdashNew Haven Division
Connecticut Department of Transportation
Facility RenewablemdashFC
D2011-GGER-005 Pompano Beach FL Pompano Beach Green Station Demonstration
South Florida Regional Transportation Authority
Facility RenewablemdashPV
D2011-GGER-006 Chicago IL Locomotive Energy Efficiency Project
Commuter Rail Division of the RTA dba Metra
Rail Locomotive upgrades
D2011-GGER-007 Baltimore MD Bus Electric Radiator Retrofit
Maryland Department of Transportation
Bus Retrofit
D2011-GGER-008 Rochester-Genesee NY
Facility Efficiency Project
Rochester Genesee Regional Transportation Authority
Facility Upgrades
D2011-GGER-009 Philadelphia PA SEPTArsquos Wayside Energy Storage Project
Southeastern Pennsylvania Transportation Authority (SEPTA)
Rail WESS
FEDERAL TRANSIT ADMINISTRATION 215
-
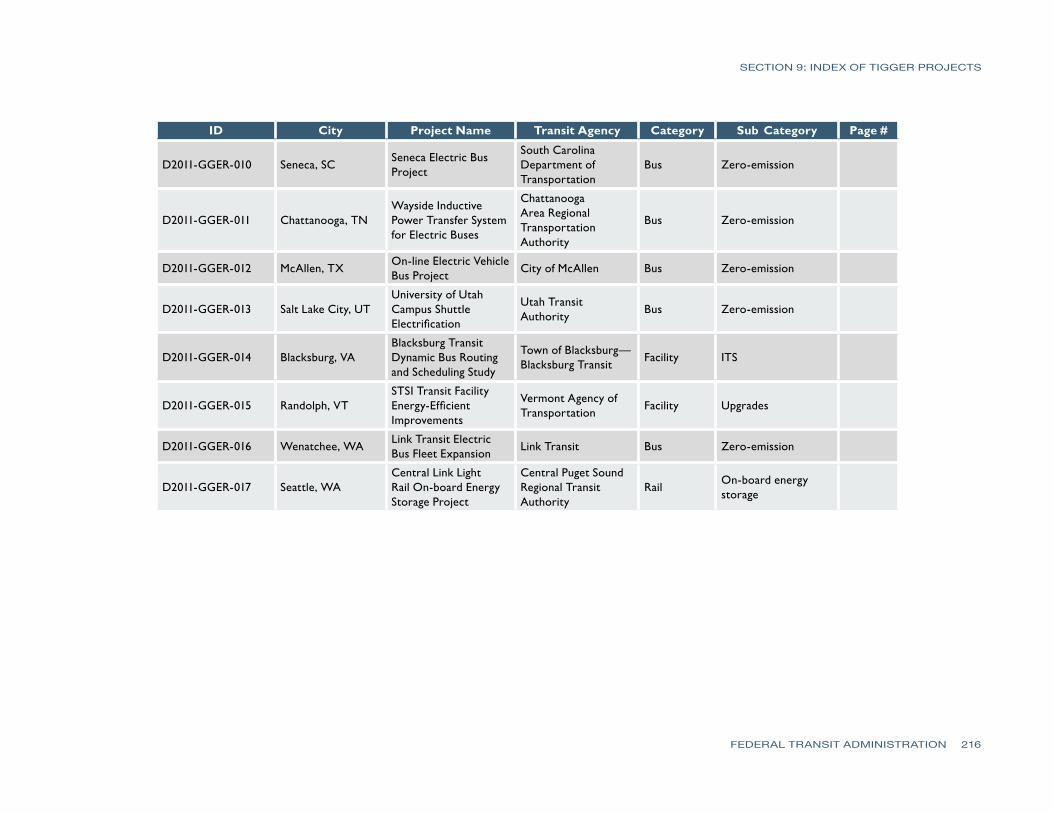
SECTION 9 INDEX OF TIGGER PROJECTS
ID City Project Name Transit Agency Category Sub Category Page
D2011-GGER-010 Seneca SC Seneca Electric Bus Project
South Carolina Department of Transportation
Bus Zero-emission
D2011-GGER-011 Chattanooga TN Wayside Inductive Power Transfer System for Electric Buses
Chattanooga Area Regional Transportation Authority
Bus Zero-emission
D2011-GGER-012 McAllen TX On-line Electric Vehicle Bus Project
City of McAllen Bus Zero-emission
D2011-GGER-013 Salt Lake City UT University of Utah Campus Shuttle Electrification
Utah Transit Authority
Bus Zero-emission
D2011-GGER-014 Blacksburg VA Blacksburg Transit Dynamic Bus Routing and Scheduling Study
Town of Blacksburgmdash Blacksburg Transit
Facility ITS
D2011-GGER-015 Randolph VT STSI Transit Facility Energy-Efficient Improvements
Vermont Agency of Transportation
Facility Upgrades
D2011-GGER-016 Wenatchee WA Link Transit Electric Bus Fleet Expansion
Link Transit Bus Zero-emission
D2011-GGER-017 Seattle WA Central Link Light Rail On-board Energy Storage Project
Central Puget Sound Regional Transit Authority
Rail On-board energy storage
FEDERAL TRANSIT ADMINISTRATION 216
Table 10-1 Conversion Factors Used in Calculating Energy and GHG Emissions SECTION
10 Fuel or Energy Type Units Btuunit lb CO2unit
Diesel fuel gal 128450 221447
Gasoline gal 116090 196658
E10 Ethanol gal 112114 169935
E85 Ethanol gal 82294 136669
E100 Ethanol gal 76330 126083
Compressed Natural Gas scf 930 01194
Compressed Natural Gas therms 100000 128378
Compressed Natural Gas gge 114717 147272
Compressed Natural Gas lb 20268 26020
Liquefied Natural Gas gal 74720 105497
Liquefied Petroleum Gas Propane gal 84950 127467
B2 Biodiesel gal 128272 221235
B5 Biodiesel gal 128005 220916
B10 Biodiesel gal 127560 220385
B20 Biodiesel gal 126670 219324
B50 Biodiesel gal 124000 216139
B80 Biodiesel gal 121330 212955
B100 Biodiesel gal 119550 210832
Hydrogen kg 113724 00000
Hydrogen scf 289 00000
Dimethyl Ether gal 68930 106251
Heating Oil gal 128450 221447
Kerosene gal 128450 221447
M100 Methanol gal 57250 91123
Electricity kWh 3414 NA
FEDERAL TRANSIT ADMINISTRATION 217
List of Data CollectedSECTION
11All project partners were asked to submit one year of data prior to the installation of the new technology and one year of data after the new technology was operational for analysis The data collected included the following
General Site Information on All Projects bullTransit agency
bullLocation
bullProject type
bullProject implementation date
Building Efficiency Projects Technologies Implemented
bullBuilding envelope improvements
- Wall R-value
- Roof R-value
- Window paning
- Wall area insulated
- Roof area insulated
- Area of all windows
- Insulation manufacturer
- Insulation type
- Insulation thickness
- Window manufacturer
- Window frame type
- Window glass type
- Window purge gas
bullHVAC
- Heat source fuel type
- Heat source type
- Heat source efficiency
- Heat source size
- Heated area
- Summer temperature setpointndashday time
FEDERAL TRANSIT ADMINISTRATION 218
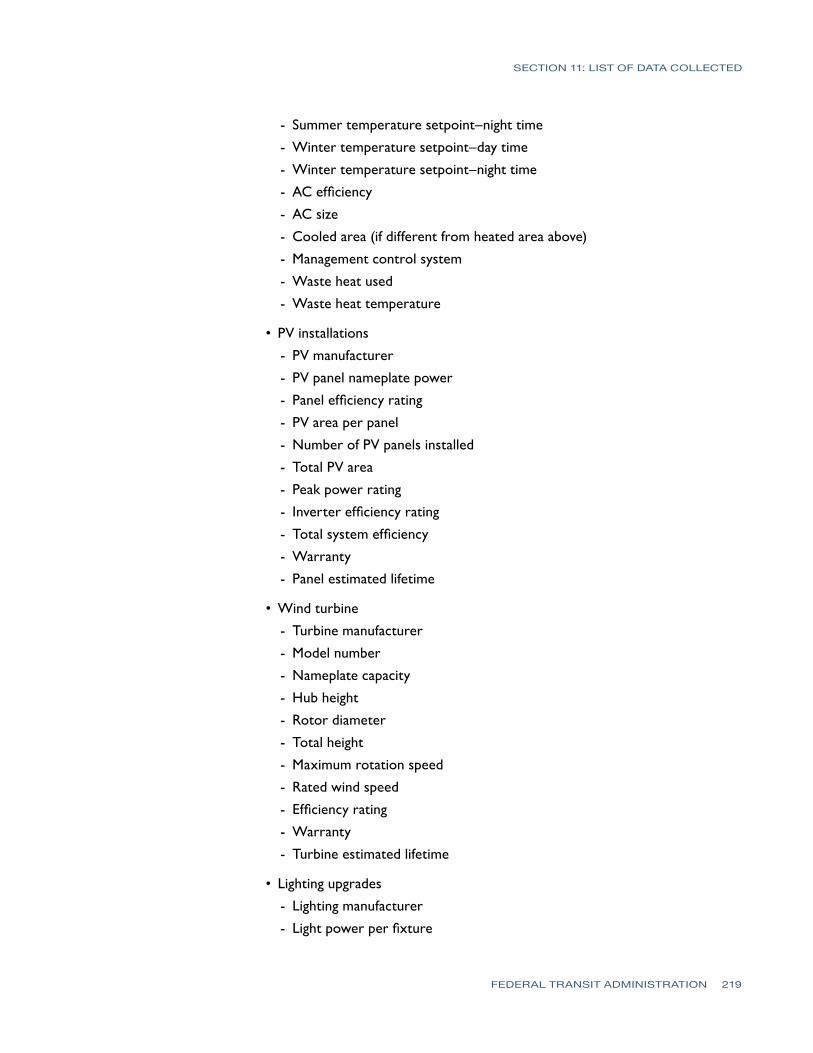
SECTION 11 LIST OF DATA COLLECTED
- Summer temperature setpointndashnight time
- Winter temperature setpointndashday time
- Winter temperature setpointndashnight time
- AC efficiency
- AC size
- Cooled area (if different from heated area above)
- Management control system
- Waste heat used
- Waste heat temperature
bullPV installations
- PV manufacturer
- PV panel nameplate power
- Panel efficiency rating
- PV area per panel
- Number of PV panels installed
- Total PV area
- Peak power rating
- Inverter efficiency rating
- Total system efficiency
- Warranty
- Panel estimated lifetime
bullWind turbine
- Turbine manufacturer
- Model number
- Nameplate capacity
- Hub height
- Rotor diameter
- Total height
- Maximum rotation speed
- Rated wind speed
- Efficiency rating
- Warranty
- Turbine estimated lifetime
bullLighting upgrades
- Lighting manufacturer
- Light power per fixture
FEDERAL TRANSIT ADMINISTRATION 219
SECTION 11 LIST OF DATA COLLECTED
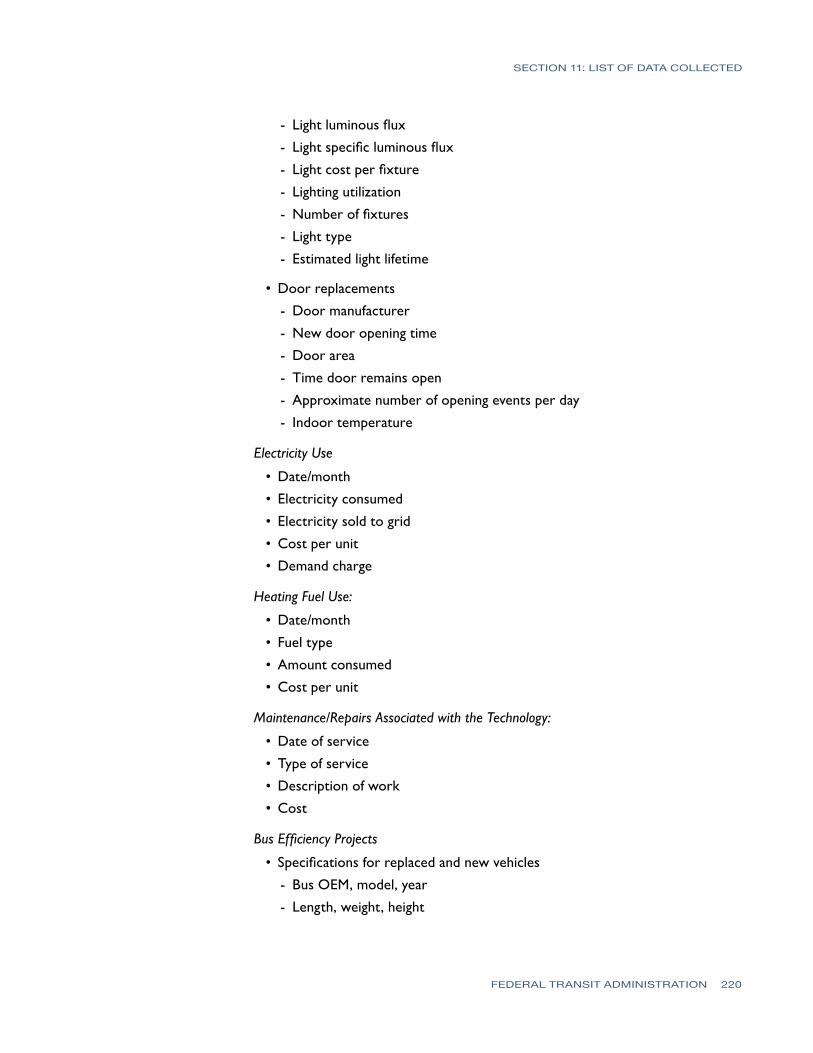
- Light luminous flux
- Light specific luminous flux
- Light cost per fixture
- Lighting utilization
- Number of fixtures
- Light type
- Estimated light lifetime
bull Door replacements
- Door manufacturer
- New door opening time
- Door area
- Time door remains open
- Approximate number of opening events per day
- Indoor temperature
Electricity Use
bull Datemonth
bull Electricity consumed
bull Electricity sold to grid
bull Cost per unit
bull Demand charge
Heating Fuel Use
bull Datemonth
bull Fuel type
bull Amount consumed
bull Cost per unit
MaintenanceRepairs Associated with the Technology
bull Date of service
bull Type of service
bull Description of work
bull Cost
Bus Efficiency Projects
bull Specifications for replaced and new vehicles
- Bus OEM model year
- Length weight height
FEDERAL TRANSIT ADMINISTRATION 220
SECTION 11 LIST OF DATA COLLECTED
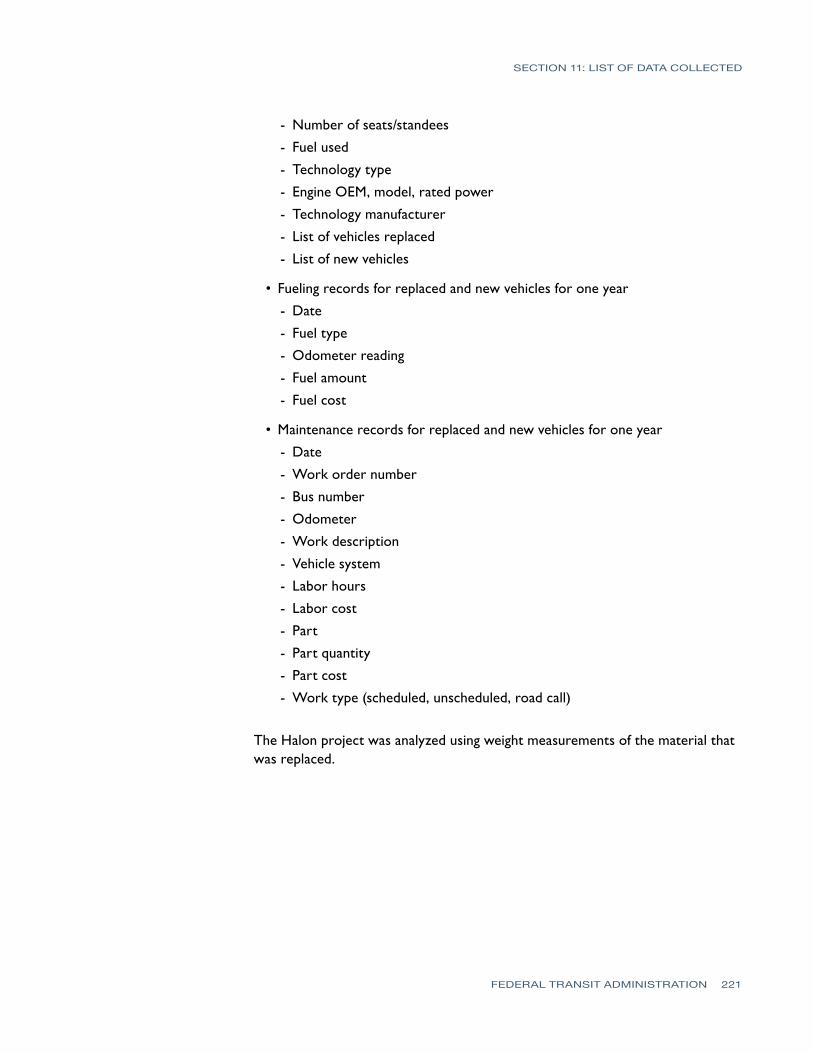
- Number of seatsstandees
- Fuel used
- Technology type
- Engine OEM model rated power
- Technology manufacturer
- List of vehicles replaced
- List of new vehicles
bullFueling records for replaced and new vehicles for one year
- Date
- Fuel type
- Odometer reading
- Fuel amount
- Fuel cost
bullMaintenance records for replaced and new vehicles for one year
- Date
- Work order number
- Bus number
- Odometer
- Work description
- Vehicle system
- Labor hours
- Labor cost
- Part
- Part quantity
- Part cost
- Work type (scheduled unscheduled road call)
The Halon project was analyzed using weight measurements of the material that was replaced
FEDERAL TRANSIT ADMINISTRATION 221
ACRONYMS AESS automatic engine start-stop AFCB American Fuel Cell Bus APS auxiliary power system ARRA American Recovery and Reinvestment Act of 2009 ARRC Alaska Railroad Corporation ART Arlington Transit BCT Broward County Transit BRT bus rapid transit BT Blacksburg Transit CAT Clemson Area Transit CATS Charlotte Area Transit System CARTA Chattanooga Area Regional Transportation Authority CDTA Capital District Transportation Authority CETE Center for Energy Transportation and the Environment CHP combined heat and power CMF Central Maintenance Facility (AC Transit) CMRT Central Maryland Regional Transit CNG compressed natural gas
eCO2 carbon dioxide equivalent CT Community Transit CTA Chicago Transit Authority CTE Center for Transportation and the Environment C-TRAN Clark County Public Transportation Benefit Area CTTRANSIT Connecticut Transit CUMTD Champaign-Urbana Mass Transit District DTC Delaware Transit Corporation EIA US Energy Information Administration EMP Engineered Machined Products EMSS Energy Management Storage Unit EO executive order EPA Environmental Protection Agency FC fuel cell FCEB fuel cell electric bus FTA Federal Transit Administration FY fiscal year GCRTA Greater Cleveland Regional Transit Authority GHG greenhouse gas GLPTC Greater Lafayette Public Transportation Corporation GWP global warming potential HLA hydraulic launch-assist HVAC heating ventilation and air conditioning IDOT Illinois Department of Transportation ITS intelligent transportation systems kW kilowatt
FEDERAL TRANSIT ADMINISTRATION 222
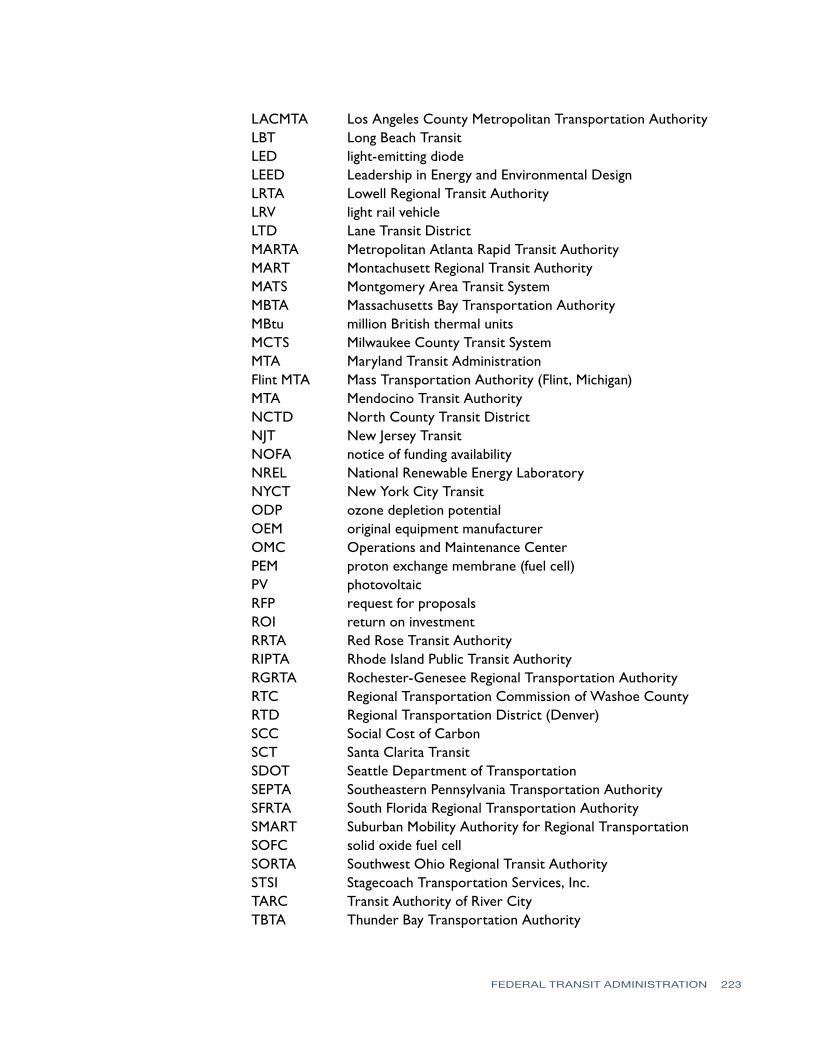
LACMTA Los Angeles County Metropolitan Transportation Authority LBT Long Beach Transit LED light-emitting diode LEED Leadership in Energy and Environmental Design LRTA Lowell Regional Transit Authority LRV light rail vehicle LTD Lane Transit District MARTA Metropolitan Atlanta Rapid Transit Authority MART Montachusett Regional Transit Authority MATS Montgomery Area Transit System MBTA Massachusetts Bay Transportation Authority MBtu million British thermal units MCTS Milwaukee County Transit System MTA Maryland Transit Administration Flint MTA Mass Transportation Authority (Flint Michigan) MTA Mendocino Transit Authority NCTD North County Transit District NJT New Jersey Transit NOFA notice of funding availability NREL National Renewable Energy Laboratory NYCT New York City Transit ODP ozone depletion potential OEM original equipment manufacturer OMC Operations and Maintenance Center PEM proton exchange membrane (fuel cell) PV photovoltaic RFP request for proposals ROI return on investment RRTA Red Rose Transit Authority RIPTA Rhode Island Public Transit Authority RGRTA Rochester-Genesee Regional Transportation Authority RTC Regional Transportation Commission of Washoe County RTD Regional Transportation District (Denver) SCC Social Cost of Carbon SCT Santa Clarita Transit SDOT Seattle Department of Transportation SEPTA Southeastern Pennsylvania Transportation Authority SFRTA South Florida Regional Transportation Authority SMART Suburban Mobility Authority for Regional Transportation SOFC solid oxide fuel cell SORTA Southwest Ohio Regional Transit Authority STSI Stagecoach Transportation Services Inc TARC Transit Authority of River City TBTA Thunder Bay Transportation Authority
FEDERAL TRANSIT ADMINISTRATION 223
TIGER Transportation Investment Generating Economic Recovery TIGGER Transit Investments for Greenhouse Gas and Energy Reduction TMF Transit Maintenance Facility TriMet Tri-County Metropolitan Transportation District of Oregon UTA Utah Transit Authority UV ultraviolet VTM Variable Torque Motors WESS wayside energy storage system
FEDERAL TRANSIT ADMINISTRATION 224
US Department of Transportation Federal Transit Administration
East Building 1200 New Jersey Avenue SE
Washington DC 20590 httpwwwftadotgovresearch
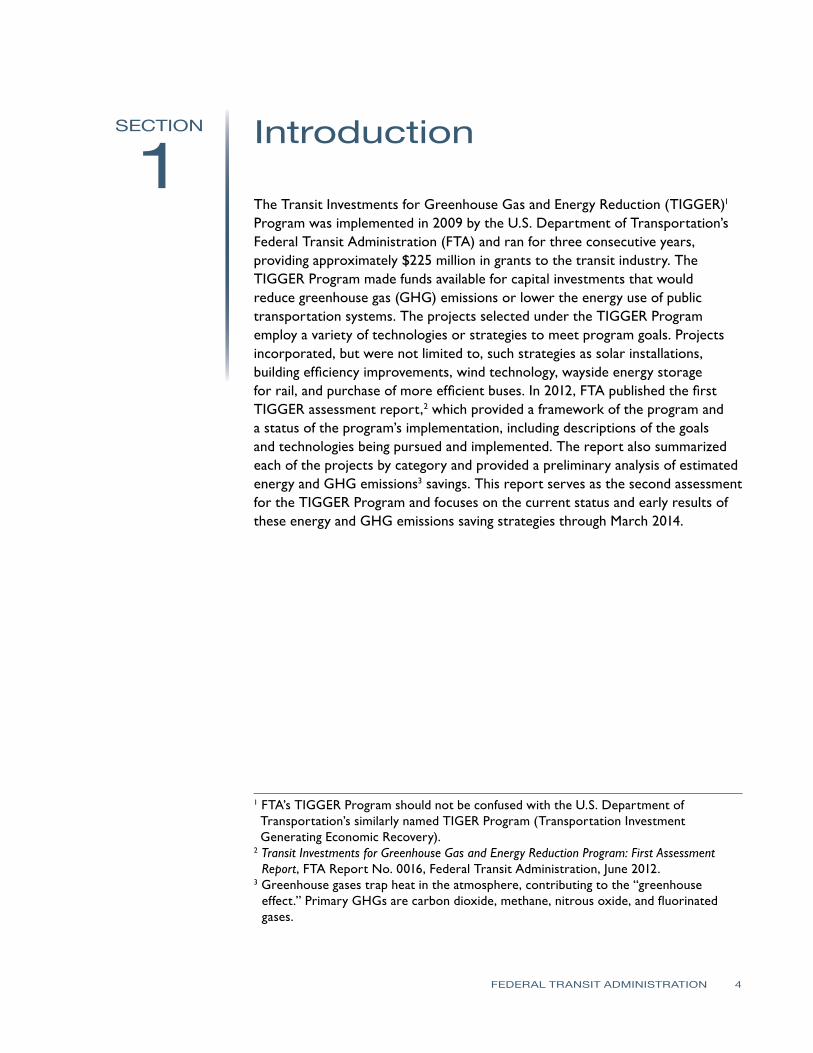
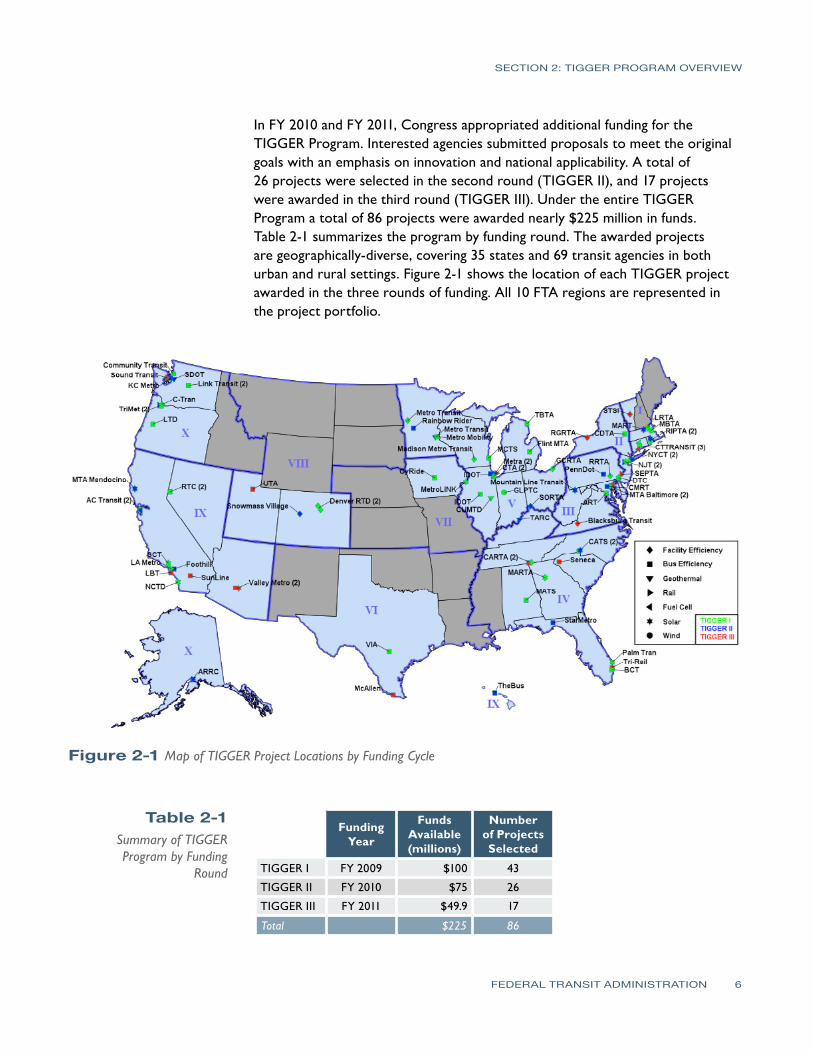
- Table of Contents
- Introduction
- Introduction
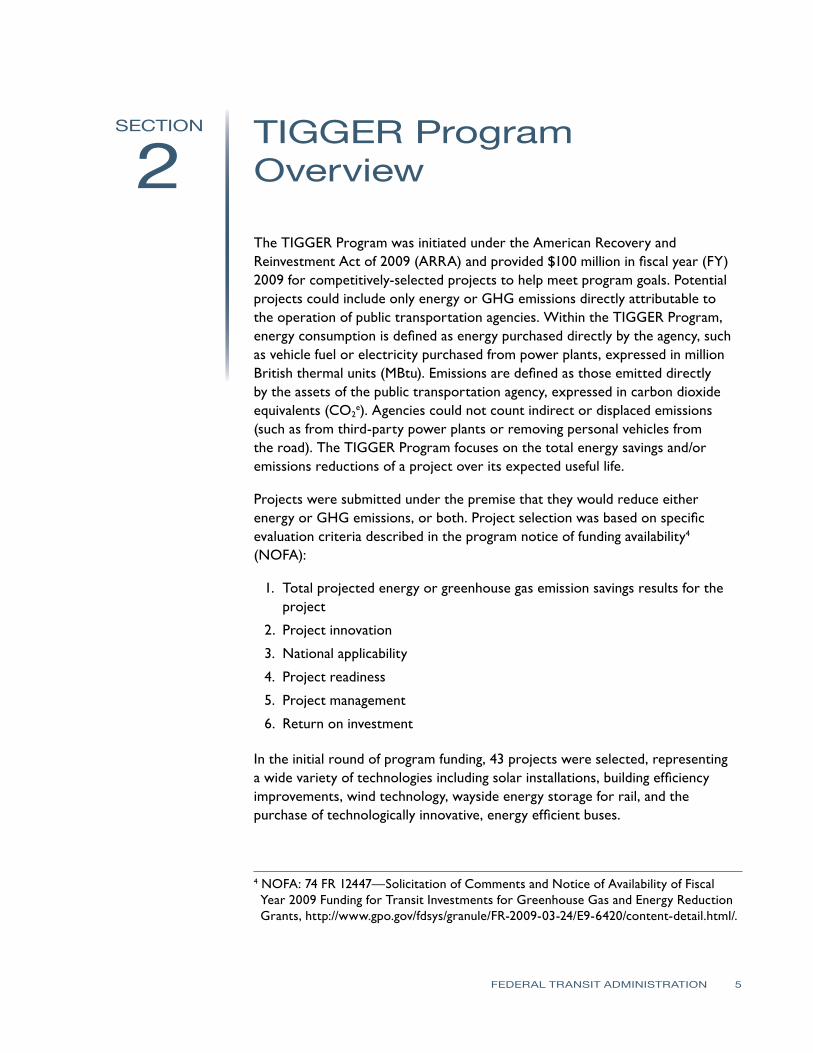
- TIGGER Program Overview
- Technologies Being Implemented
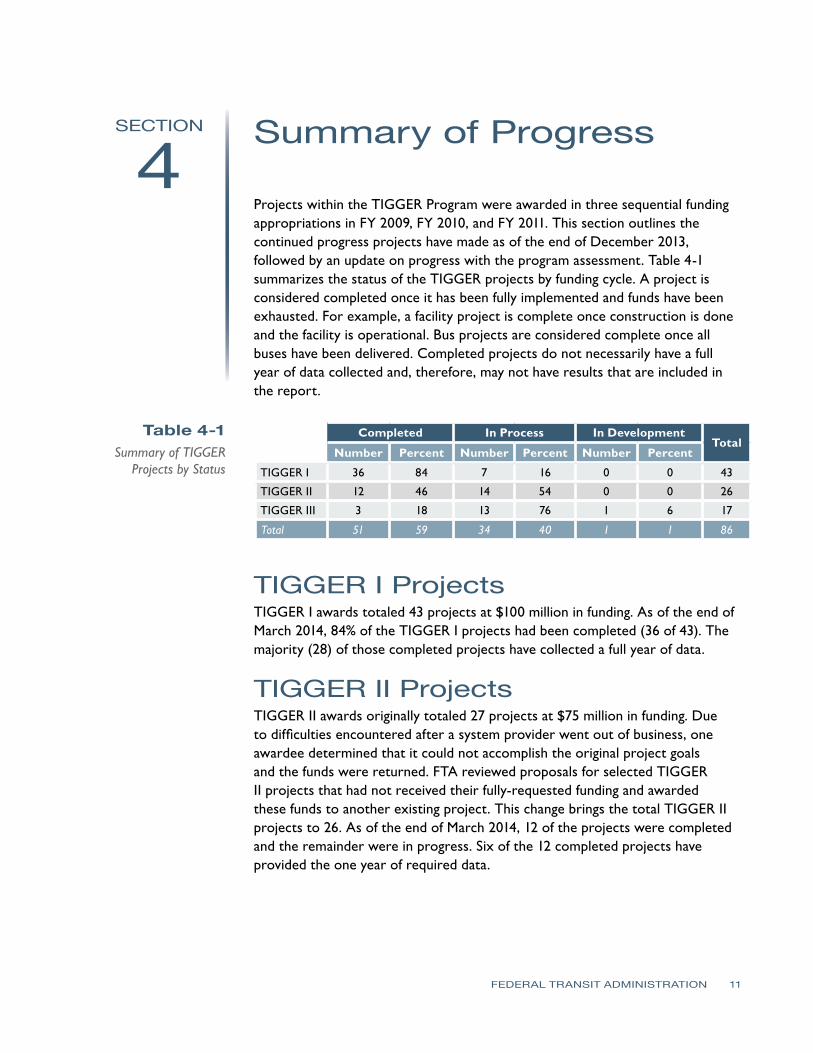
- Summary of Progress
- Analysis of GHG Emissions and Energy Sav
- Economic Analysis
- Project Status
- Case Studies
- Index of TIGGER Projects
- List of Data Collected
-