54
Management and Prediction Demand Homework : TOD Kwikiriza Bruce Chris Universiteit Hasselt December 18, 2015
| Date post: | 15-Apr-2017 |
| Category: |
Documents |
| Upload: | kwikiriza-bruce-chris |
| View: | 108 times |
| Download: | 3 times |

Management and Prediction DemandHomework : TOD
Kwikiriza Bruce Chris
Universiteit Hasselt
December 18, 2015
Management and Prediction Demand
Contents
1 Introduction
2 PlanningSustainability and Development of TODs
3 How TOD effects are measured
4 Case Studies
5 Thank you
6 References
Management and Prediction Demand
Introduction
Introduction
Transit-oriented development (TOD) definitionMixed-use of residential and commercial area designed tomaximize access to public transport (Newman & Kenworthy,1988)often incorporates features to encourage ridershipcompact, mixed-use development near transit facilities andhigh-quality walking environments (Cervero, 2008)should be developed in higher density places.
Management and Prediction Demand
Introduction
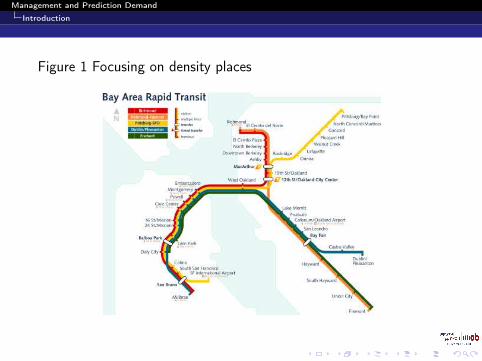
Figure 1 Focusing on density places
Management and Prediction Demand
Introduction
Types of TOD
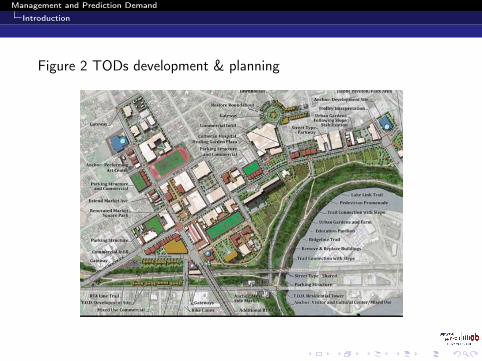
According to Dittmar & Poticha, (2004),TODs include the following:urban neighborhoodurban downtown/urban centersuburban town centersuburban neighborhoodneighborhood transit zonecommuter town.special use/employment districtmixed-used corridor
Management and Prediction Demand
Introduction
Figure 2 TODs development & planning
Management and Prediction Demand
Introduction
Scientific questions
What are the goals of TOD?How to implement and plan for TOD?How are the TOD goals measured?What indicators are used to measure the effects of TOD?Which effects must be taken into account?
Management and Prediction Demand
Introduction
Objectives/Goals of TOD
Enhance livability,Foster wider housing choices,Provide private development opportunities, saferneighborhoods,Reduce parking requirements,Improve air qualityPromote intermodal integration.
Management and Prediction Demand
Introduction
It increases ridershipReduces automobile dependence item Increases sustainability.Promotes the integration of land use and transit facilities.It increases accessibility.Pedestrian safety since there is no traffic congestionIt Reduces congestion on the road networkIt reduces travel time
Management and Prediction Demand
Planning
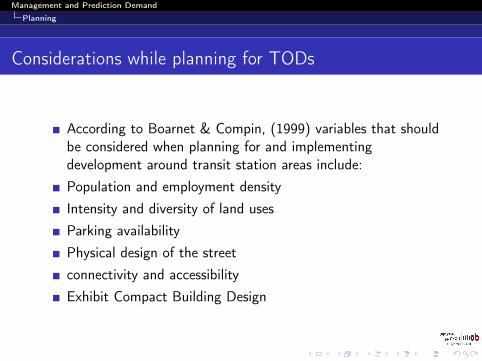
Considerations while planning for TODs
According to Boarnet & Compin, (1999) variables that shouldbe considered when planning for and implementingdevelopment around transit station areas include:Population and employment densityIntensity and diversity of land usesParking availabilityPhysical design of the streetconnectivity and accessibilityExhibit Compact Building Design
Management and Prediction Demand
Planning
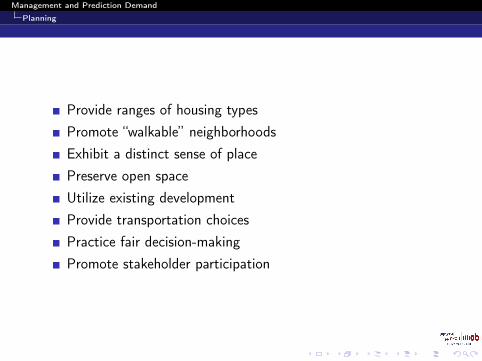
Provide ranges of housing typesPromote “walkable” neighborhoodsExhibit a distinct sense of placePreserve open spaceUtilize existing developmentProvide transportation choicesPractice fair decision-makingPromote stakeholder participation
Management and Prediction Demand
Planning
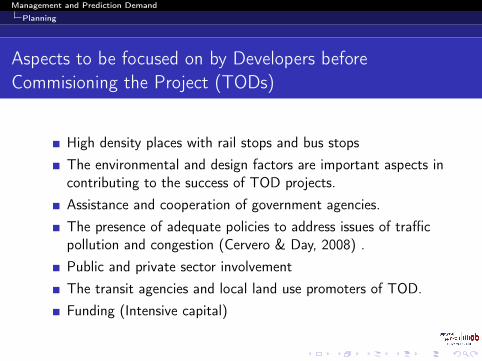
Aspects to be focused on by Developers beforeCommisioning the Project (TODs)
High density places with rail stops and bus stopsThe environmental and design factors are important aspects incontributing to the success of TOD projects.Assistance and cooperation of government agencies.The presence of adequate policies to address issues of trafficpollution and congestion (Cervero & Day, 2008) .Public and private sector involvementThe transit agencies and local land use promoters of TOD.Funding (Intensive capital)
Management and Prediction Demand
Planning
Sustainability and Development of TODs
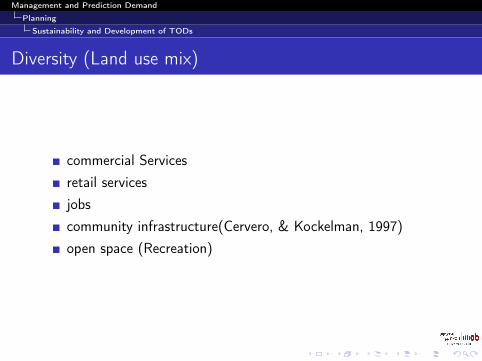
Diversity (Land use mix)
commercial Servicesretail servicesjobscommunity infrastructure(Cervero, & Kockelman, 1997)open space (Recreation)
Management and Prediction Demand
Planning
Sustainability and Development of TODs
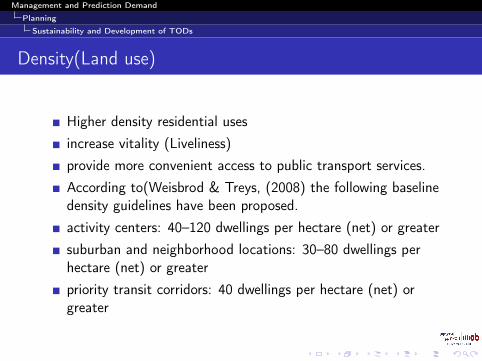
Density(Land use)
Higher density residential usesincrease vitality (Liveliness)provide more convenient access to public transport services.According to(Weisbrod & Treys, (2008) the following baselinedensity guidelines have been proposed.activity centers: 40–120 dwellings per hectare (net) or greatersuburban and neighborhood locations: 30–80 dwellings perhectare (net) or greaterpriority transit corridors: 40 dwellings per hectare (net) orgreater
Management and Prediction Demand
Planning
Sustainability and Development of TODs
Design(Ensuring development features)
High-quality subtropical designmaximizes public amenities like schools, hospitals etc.Quality of streetspedestrian connectivityWalking and cycling laneshigh levels of accessibility
Management and Prediction Demand
Planning
Sustainability and Development of TODs
Barriers that Hinder the development of TODs
The transit agencies developers under appreciate ability toovercome the land assembly.Project financing barriers (Limited intensive capital)Problem of converting capital investment into positiveoperating returnsPublic sector involvement and TOD developers arediscouraged by, community opposition to high-density places.unattractive locations and heavily industrialised neighborhoods.Fixation on automobile-oriented design (McNulty et al, 1997).
Management and Prediction Demand
Planning
Sustainability and Development of TODs
Importance of TOD
It increases ridership / public transportIt increases revenues to Government.It reduces automobile usageIt reduces the volume of vehiclesIt reduces congestion on the roadIt offers a wide variety of housing/residential houses.
Management and Prediction Demand
Planning
Sustainability and Development of TODs
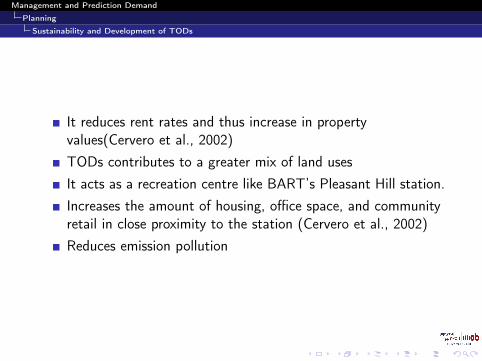
It reduces rent rates and thus increase in propertyvalues(Cervero et al., 2002)TODs contributes to a greater mix of land usesIt acts as a recreation centre like BART’s Pleasant Hill station.Increases the amount of housing, office space, and communityretail in close proximity to the station (Cervero et al., 2002)Reduces emission pollution
Management and Prediction Demand
Planning
Sustainability and Development of TODs
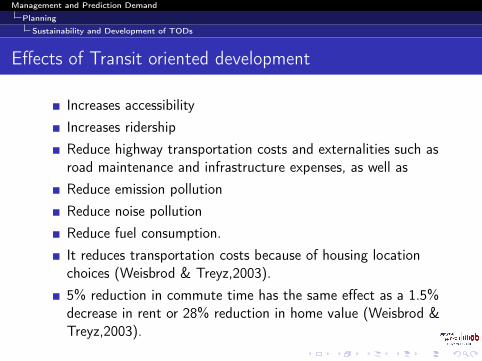
Effects of Transit oriented development
Increases accessibilityIncreases ridershipReduce highway transportation costs and externalities such asroad maintenance and infrastructure expenses, as well asReduce emission pollutionReduce noise pollutionReduce fuel consumption.It reduces transportation costs because of housing locationchoices (Weisbrod & Treyz,2003).5% reduction in commute time has the same effect as a 1.5%decrease in rent or 28% reduction in home value (Weisbrod &Treyz,2003).
Management and Prediction Demand
Planning
Sustainability and Development of TODs
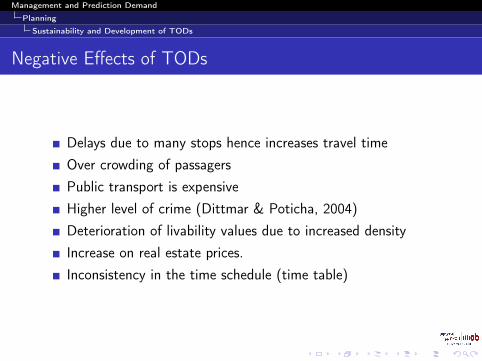
Negative Effects of TODs
Delays due to many stops hence increases travel timeOver crowding of passagersPublic transport is expensiveHigher level of crime (Dittmar & Poticha, 2004)Deterioration of livability values due to increased densityIncrease on real estate prices.Inconsistency in the time schedule (time table)
Management and Prediction Demand
How TOD effects are measured
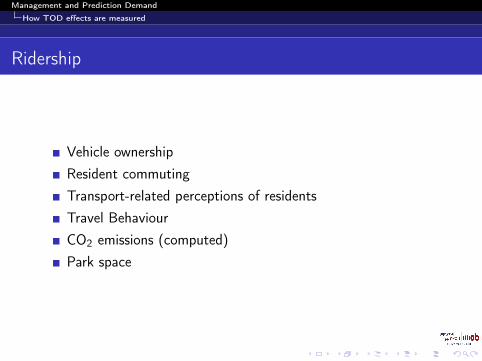
Ridership
Vehicle ownershipResident commutingTransport-related perceptions of residentsTravel BehaviourCO2 emissions (computed)Park space
Management and Prediction Demand
How TOD effects are measured
Accessibility
Vehicles kilometres travelled (VKT)Frequency of public transit usageStreet QualityPedestrian accessibility (pedestrian shed)Amount and quality of public space(networks)Infrastructural distribution and Development
Management and Prediction Demand
How TOD effects are measured
Livability
The Local EconomyNumber of jobs by typeVacancy rateQuality of transit serviceQuality of life (resident perceptions)Home ownership vs. rentalWeekly housing expensesQuality of EducationIncome levels
Management and Prediction Demand
How TOD effects are measured
Congestion Pollution
energy(fuel) consumption (computed)Percent of land cover as green spacePercent of land cover as treesAccelerating and Decelerating
Management and Prediction Demand
How TOD effects are measured
Development
Property valuePopulation and housing densityLand cover/land use distributionParking inventoryThe Social EnvironmentPolicy abidance e.g stockholm congestion pricing
Management and Prediction Demand
How TOD effects are measured
Level of Congestion
convenientcomfortablefastTravel time
Management and Prediction Demand
Case Studies
United States of America
Today, more than 100 TODs exist within the US mainlyaround heavy, light and commuter rail stations. (Cervero 1994)In the United States, 37.4% of TODs surround heavy rail31.3% light rail21.8% commuter rail7.8% bus1.7% surround ferry transit (Cervero, 2001).
Management and Prediction Demand
Case Studies
According to (Dittmar & Poticha, 2004) residents of TOD-likeneighborhoods in the San Francisco Bay Area had almost halfthe vehicle miles traveled (VMT) per year.with exponential population growth such as Charlotte, NC;Seattle; Denver and Houston have major TOD thus travel timehas reduced(Baldassare, Knight et al. 1979).Both Charlotte and Houston have new (since 2004) light railsystems whose ridership have exceeded their projections and asa result automobile dependence has decreased.
Management and Prediction Demand
Case Studies
TODs were encouraged by local transit agencies henceincreased transit Ridershipwhich in turn reduced greenhouse gas emissions, relievedcongestion, and promoted healthier lifestyles.study found that TOD improved the effectiveness of transitinvestments by 20%-40% (Parsons & Douglas, 1996)
Management and Prediction Demand
Case Studies
TOD facilitates economic development and raise revenues forthe agency. (Arrington and Cervaro, 2008)They achieved the following objectivesPromoted public transport(ridership)Enhanced livability,Fostered wider housing choices,Provided private development opportunitiesReduced parking requirements,Improved air qualityPromoted intermodal integration.
Management and Prediction Demand
Case Studies
Rosslyn-Ballston Redevelopment Corridor
Established in May, 1996.As of 2004, the corridor had more than 21 million square feetof office space. Retail and commercial3,000 hotel rooms and 25,000residences (Parsons & Douglas,1996).The corridor covers 2 square miles compared to approximately14 square miles of a comparable suburban layout.Between 1991 and 2002, Metro ridership within the corridordoubled with nearly 50% of residents commuting by transit
Management and Prediction Demand
Case Studies
During the planning stages, County officials focused on thefollowing principles:Exhibit Compact Building DesignProvide ranges of housing typesPromote “walkable” neighborhoodsExhibit a distinct sense of placePreserve open space
Management and Prediction Demand
Case Studies
Utilize existing developmentProvide transportation choicesPractice fair decision-makingPromote stakeholder participationIn a national survey of 90 transit agencies, nearly half of theagencies reported havingregional vision, policy, or plan in place that calls for compactdevelopment organized around transit.” (Cervero 2001)
Management and Prediction Demand
Case Studies
In San Diego, the density threshold for residential dwellings is18 per acrein an urban TOD serving light rail and 12 units per acre inneighborhood TODs where bus service is the major transitmode.In Portland, Oregon,values range from 12 to 30 units for lightrail districts based on the distance to the station12 to 24 units per acre for bus districts based on distance fromthe stop. (Parsons & Douglas 1996)
Management and Prediction Demand
Case Studies
Between 1991 and 2002, Metro ridership within the corridordoubled with nearly 50 % of residents commuting by transit.Arlington County planners state that when residents areinvolved in developing plans they are more supportive of densedevelopment.Arlington expanded its density bonus provisions allowing 25percent more density.In 2002, the Arlington Corridor was selected by the U.S.Environmental Protection Agency (EPA) as the recipient ofthe National Award.
Management and Prediction Demand
Case Studies
Curitiba, Brazil
Curitiba is the capital of Paraná, one of Brazil’s most southernstates.City planning began nearly three centuries ago when cityleaders first established building regulationsThe number of trees that could be cut was limited andrequired that homes have roofs made of tile, not wood.During the second half of the 19th century, Curitiba’spopulation tripled due in part to immigrants from Japan,Lebanon and Syria.Many of Curitiba’s sister cities experienced high unemploymentrates,impoverished conditions, and congestion.
Management and Prediction Demand
Case Studies
From 1950 and 1990, Curitiba experienced high rates ofgrowth going from 300,000 residents to 2.1 million.Once an agricultural center, Curitiba became an industrial andcommercial powerhouse. To accommodate this growth.Curitiba made the decision to plan for the mobility of peoplerather than cars.Giving both pedestrians and mass transit priority overautomobiles in highly congested corridors.Between 1974 and 1995, the city’s accessibility networkdeveloped dramatically.
Management and Prediction Demand
Case Studies
Today, it includes high-capacity buses operating on dedicatedtransit ways, express bus service, orbital routes that connectbus ways,Curitiba has over 100 feeder lines that run between low-densityneighborhoods and trunk line services.The network passes through 13 municipalities carrying 2.4million passengers per day with 34 terminals over 385 lines(Parsons Brinckerhoff Quade & Douglas, 1996)Curitiba had the following policies and goals to achieve afterdeveloping TODs
Management and Prediction Demand
Case Studies
Transit corridors zoned for mixed-use residential and officedevelopment to guarantee that buildings both produce andattract tripsDensity bonuses that encourage retail shops and restaurants onthe first two floors of all buildings fronting on the transit waysAreas outside the transit corridors zoned for residentialneighborhoodsLarge-scale shopping centers only allowed in transit corridorsPublic housing for low-income families built along the transitways
Management and Prediction Demand
Case Studies
In downtown, a restricted parking supply with a pedestrianenvironment emphasized the followingWalkabilityTraffic congestion reductionincreased densitymore open spaceprivate funding supportjob creationintense community involvement were all a part of vision or goal.
Management and Prediction Demand
Case Studies
Emery Station, Emeryville
The Emery Station has 20-acres of mixed-use development inthe East Bay area.Initiated by Amtrak, construction of the rail stationIn 1998 as a result of negotiations between the City ofEmeryville and Chevron who previously owned the land then itstarted .Anchored by an Amtrak station that makes 13 daily roundtrips,The TOD currently includes 550,000 square feet of office and150 residential units and ground-floor retail.Residential units consist of lofts, town homes and seniorhousing.
Management and Prediction Demand
Case Studies
More than $200 million invested in the stationThe City also completed pedestrian bridge over the Amtraktracks to a nearby mixed-use center.BART station is two miles away, the City of Emeryville saw fitto provide its residents and businesses with access to BART.shuttle bus that connects the development to the McArthurBART Station operating from 5:45 a.m. to 9:30 p.m. every 15minutes.Figure 2.2 and Figure 2.3 are before and after photos of theEmery Station development.
Management and Prediction Demand
Case Studies
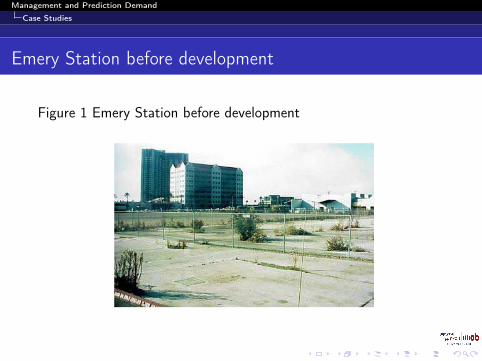
Emery Station before development
Figure 1 Emery Station before development
Management and Prediction Demand
Case Studies
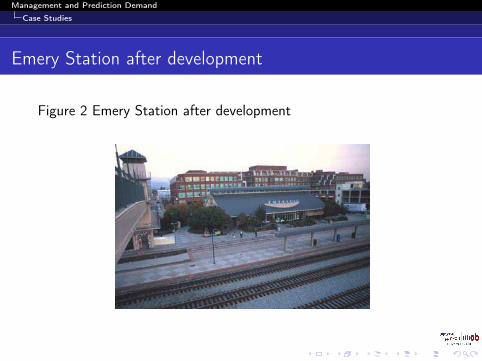
Emery Station after development
Figure 2 Emery Station after development
Management and Prediction Demand
Case Studies
Kelvin Grove Urban Village(KGUV)
Located in Brisbane AustraliaDesigned as suitable and mixed use developmentBrisbane Metropolitan area has a population of approximately1.9mKGUV spans over 16.57 Ha of land areaThe mixed use development consists of educational,residential, commercial, recreational, retail and office land use.KGUV is an educational based mixed use development
Management and Prediction Demand
Case Studies
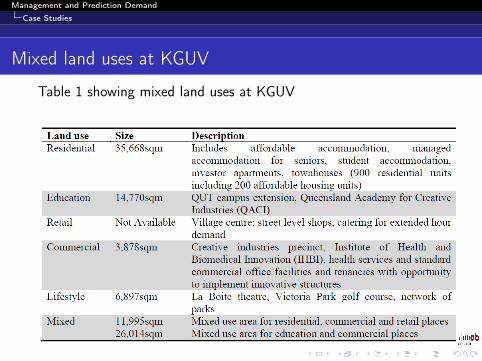
Mixed land uses at KGUV
Table 1 showing mixed land uses at KGUV
Management and Prediction Demand
Case Studies
Transport facilities at KGUV
KGUV is well connected to arterial roadsHas an internal street network forming grid patterns with parksand open spacesIt has side walks on both sides of all streets and through parksand cycle lanes.This encourages,support walking and cyclingNumber of car spaces restricted to one space per 30m2 for allnon residential development.Rstricted parking facilities to discourage drivers from drivingtheir carsPromote the use of suitable modes of public transport likewalking, cycling and use of public transport
Management and Prediction Demand
Case Studies
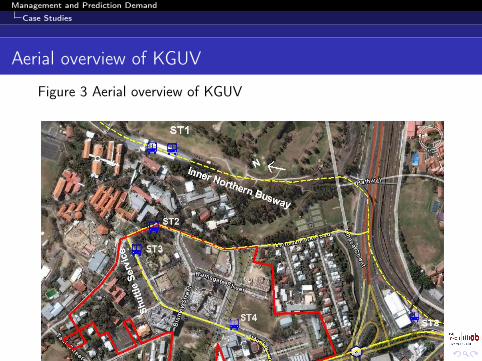
Aerial overview of KGUV
Figure 3 Aerial overview of KGUV
Management and Prediction Demand
Case Studies
Figure1 shows an overview of KGUV the public transportcorridors and its proximate transit stops.Yellow lines show the transport corridorsBlue symbols indicate the location of the bus stops or bus waystations catering for KGUV users.KGUV is served by 16 bus services including 9 express and veryhigh frequency services.
Management and Prediction Demand
Case Studies
In conclusion, TOD has reduced traffic congestion,increasedRidership, increased the quality of life and encourages bicycling andwalking further more government and TOD agencies has earnedrevenue if form of conducting economical business likeshops,recreation centers,rentals and house and land value.Therefore it would be recommended that countries that have notyet implemented TODS to plan and implement them for thebetterment of traffic congestion reduction.
Management and Prediction Demand
Thank you
thank you ....
Management and Prediction Demand
References
Baldassare, M., R. Knight, and S. Swan (1979), Urban Serviceand Environmental Stressor:The Impact of the Bay Area RapidTransit System on Residential Mobility.Environment andBehavior. 11(4): p. 435-450.Boarnet, M. G., & Compin, N. S. (1999). Transit-orienteddevelopment in San Diego County: the incrementalimplementation of a planning idea. Journal of the AmericanPlanning Association, 65(1), 80-95.Cervero, R., & Kockelman, K. (1997). Travel demand and the3Ds: density, diversity, and design. Transportation ResearchPart D: Transport and Environment, 2(3), 199-219.Cervero, R.(2001), Transit-Oriented Development in theUnited States: Experiences,Challenges, and Prospects, inTransit Cooperative Research Program Report 102.
Management and Prediction Demand
References
Cervero, R., & Day, J. (2008). Sub urbanization &transit-oriented development in China.Transport Policy,15(5),315-323.Dittmar, H., & Poticha, S. (2004). Defining transit-orienteddevelopment: The new regional building block. The newtransit town: Best practices in transit-oriented development,20-55.McNulty, S. A., Porter, W. F., Mathews, N. E., & Hill, J. A.(1997). Localized management for reducing white-tailed deerpopulations. Wildlife Society Bulletin, 265-271.
Management and Prediction Demand
References
Newman, P. W., & Kenworthy, J. R. (1988). The transportenergy trade-off: fuel-efficient traffic versus fuel-efficient cities.Transportation Research Part A: General, 22(3), 163-174.Parsons Brinckerhoff Quade & Douglas (1996), I., PublicPolicy and Transit-Oriented Development: Six InternationalCase Studies, in Transit Cooperative Research Program Report16, Transportation Research Board. p. 1-173.Weisbrod, G., Vary, D., & Treyz, G. (2003). Measuringeconomic costs of urban traffic congestion to business.Transportation Research Record: Journal of theTransportation Research Board, (1839), 98-106.


