24
Transition from periodic lattice to solid plasma in ultrashort pulse irradiation of metals Dimitri Fisher Soreq NRC Israel 25 th Hirschegg PHEDM Workshop Jan 30 – Feb 04 , 2005
| Date post: | 13-Dec-2015 |
| Category: |
Documents |
| Upload: | valerie-brown |
| View: | 221 times |
| Download: | 4 times |

Transition from periodic lattice to solid plasma in ultrashort pulse irradiation of metals
Dimitri Fisher
Soreq NRC Israel
25th Hirschegg PHEDM Workshop
Jan 30 – Feb 04 , 2005
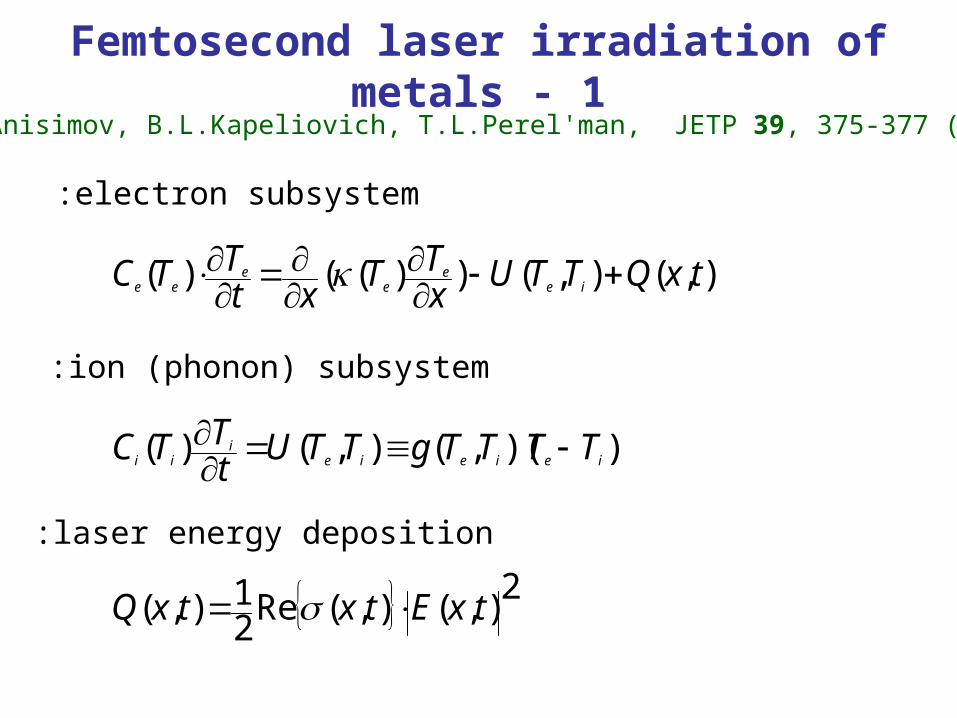
Femtosecond laser irradiation of metals - 1
))(,(),()( ieieiei
ii TTTTgTTUtTTC
),(),())(()( txQTTUxTT
xtTTC ie
ee
eee
2),(),(Re
21),( txEtxtxQ
electron subsystem:
ion (phonon) subsystem:
laser energy deposition:
S.I.Anisimov, B.L.Kapeliovich, T.L.Perel'man, JETP 39, 375-377 (1974)
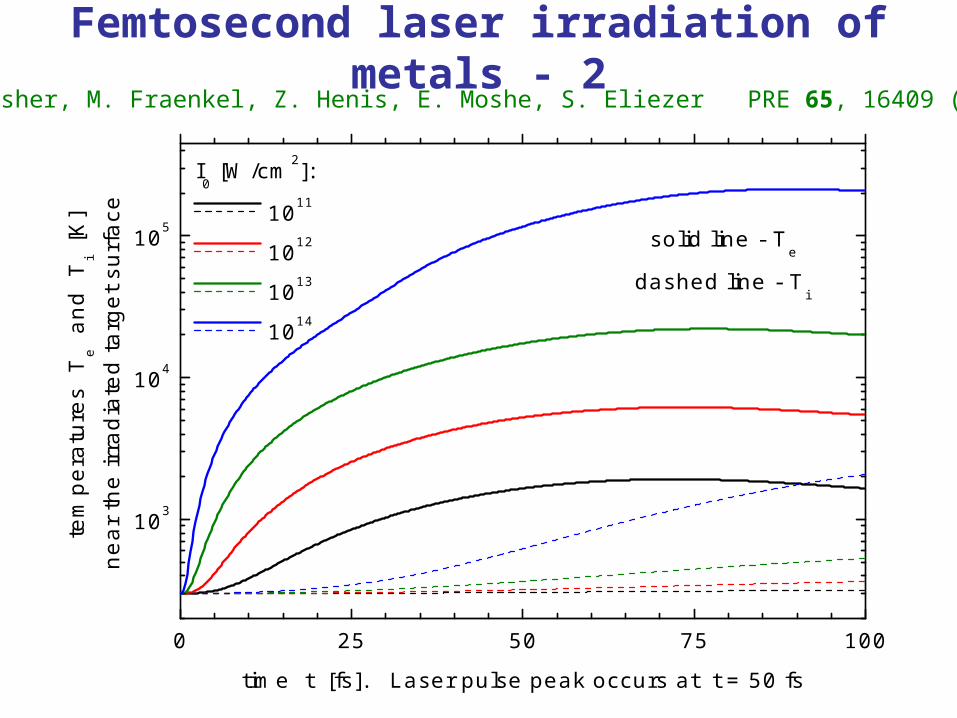
Femtosecond laser irradiation of metals - 2
0 25 50 75 100
103
104
105
dashed line - Ti
solid line - Te
tem
pera
ture
s T
e a
nd
Ti
[K]
I0 [W/cm2]:
1011
1012
1013
1014
near
the
irra
diat
ed t
arge
t su
rfac
e
time t [fs]. Laser pulse peak occurs at t = 50 fs
D.V.Fisher, M. Fraenkel, Z. Henis, E. Moshe, S. Eliezer PRE 65, 16409 (2001).

Femtosecond laser irradiation of metals - 3
Feee TTTC forFeBeee TTkTnC for )(2/3
iBii knC T allfor 3
fs3000foreV,1eV,1001 tTT ie
Typical regime:
Approximations available:
OK
Fe
Fe
TTgTTg
at theory SCP from,at theory band from,
What at
Te~TF???
103 104 1051013
1014
1015
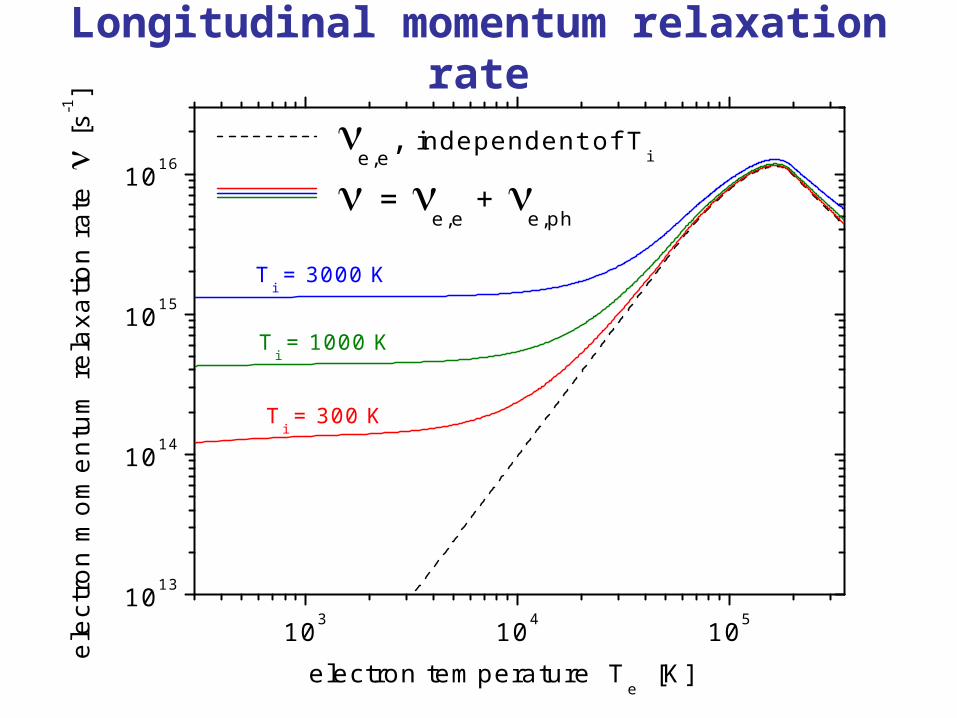
1016independent of T
i
Ti = 1000 K
Ti = 3000 K
Ti = 300 K
e
lect
ron
mo
me
ntu
m r
ela
xatio
n r
ate
[s-1]
electron temperature Te [K]
e,e
,
= e,e
+ e,ph
Longitudinal momentum relaxation rate
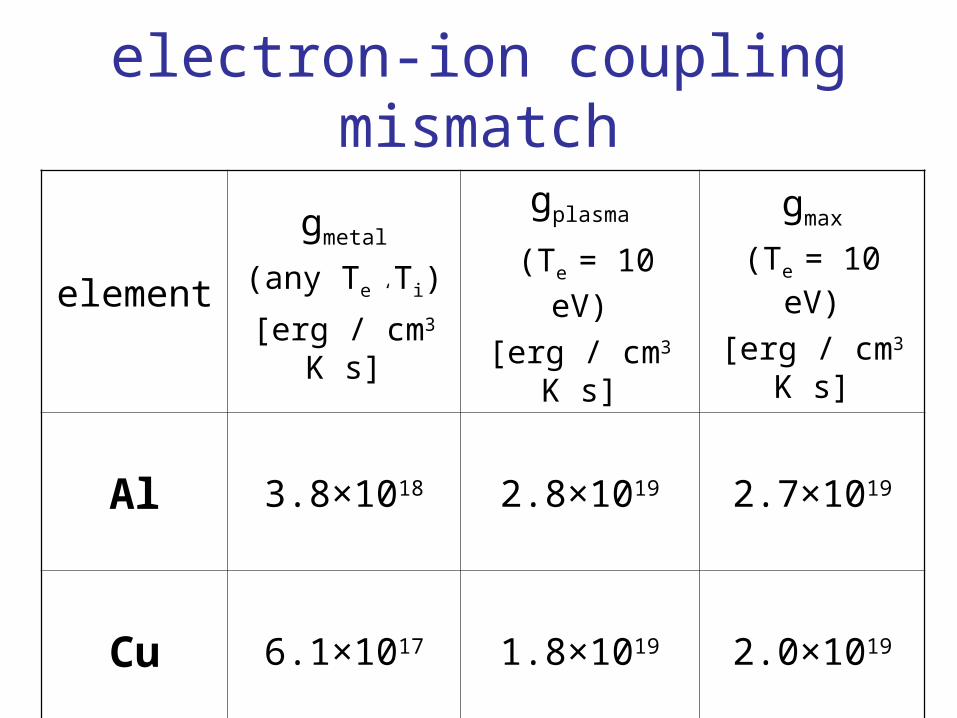
electron-ion coupling mismatch
element
gmetal
(any Te ‘Ti)
[erg / cm3 K s]
gplasma
(Te = 10 eV)
[erg / cm3 K s]
gmax
(Te = 10 eV)
[erg / cm3 K s]
Al 3.8×10¹⁸ 2.8×10¹⁹ 2.7×10¹⁹
Cu 6.1×10¹⁷ 1.8×10¹⁹ 2.0×10¹⁹
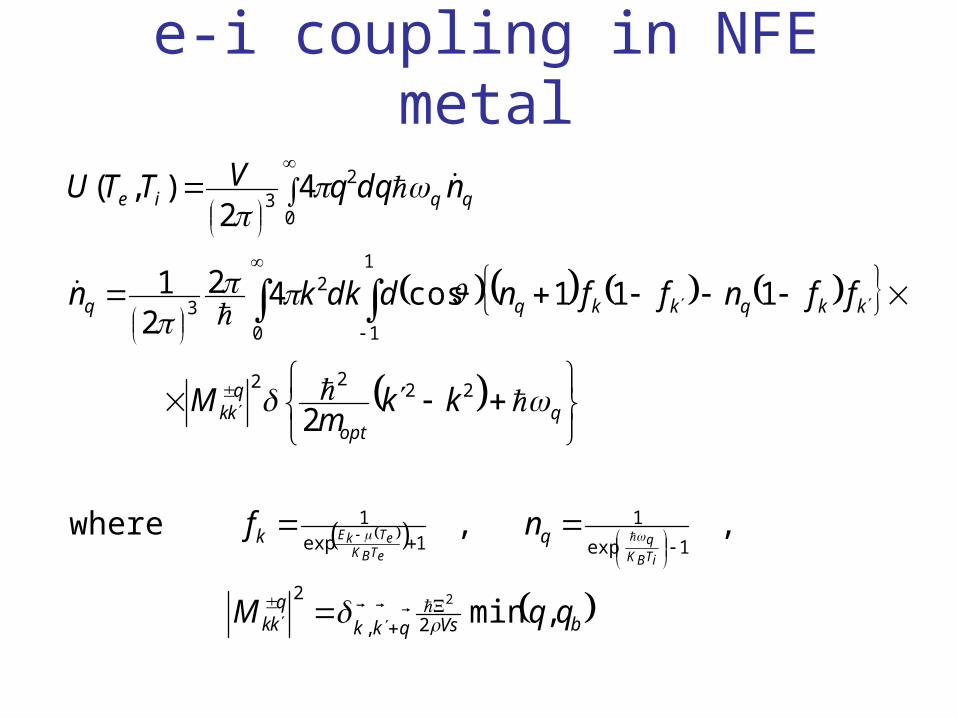
e-i coupling in NFE metal
bVsqkk
qkk
qk
qopt
qkk
kkqkkqq
qqie
qqM
nf
kkm
M
ffnffnddkkn
ndqqVTTU
iTBKq
eTBKeTkE
,min
,,where
2
111cos422
1
42
),(
2,
2
1exp
11exp
1
2222
1
10
23
0
23
2
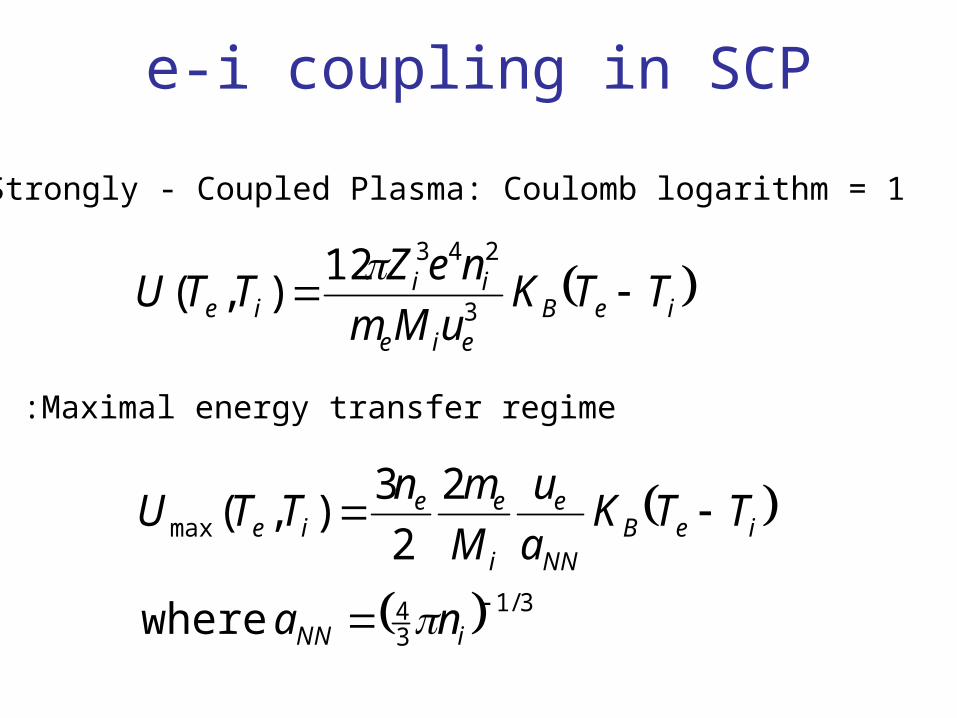
e-i coupling in SCP
Strongly - Coupled Plasma: Coulomb logarithm = 1
ieBeie
iiie TTK
uMm
neZTTU
3
24312),(
Maximal energy transfer regime:
3/134
max
where
2
2
3),(
iNN
ieBNN
e
i
eeie
na
TTKa
u
M
mnTTU
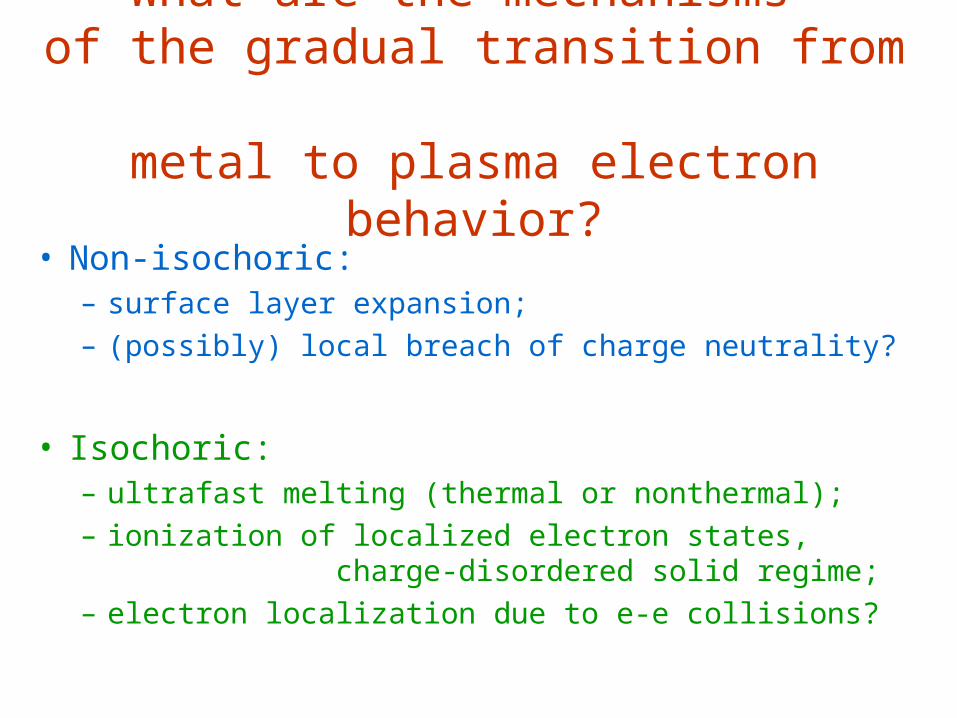
What are the mechanisms of the gradual transition from
metal to plasma electron behavior?
• Non-isochoric:– surface layer expansion;– (possibly) local breach of charge neutrality?
• Isochoric:– ultrafast melting (thermal or nonthermal);– ionization of localized electron states,
charge-disordered solid regime;– electron localization due to e-e collisions?

Isochoric transition from metal to plasma behavior time scales:
• ultrafast melting: ~ 100-1000 fs
(governed by forces and ion mass);
• charge disorder: ~ 1-10 fs
(governed by electron impact ionization);
• electron localization: ~ 1 fs or shorter
(governed by electron spread and velocity).

ORDEREDSOLID
CHARGE – DISORDERED
SOLID
Z = 2 Z = 2.5 Z = 3
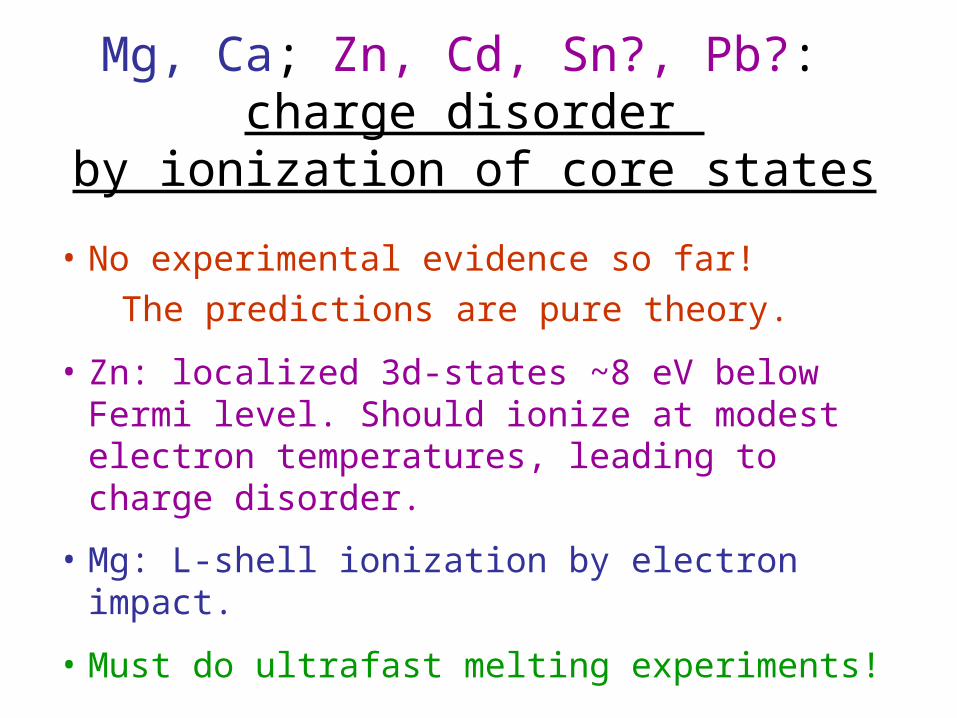
Mg, Ca; Zn, Cd, Sn?, Pb?: charge disorder
by ionization of core states
• No experimental evidence so far!
The predictions are pure theory.
• Zn: localized 3d-states ~8 eV below Fermi level. Should ionize at modest electron temperatures, leading to charge disorder.
• Mg: L-shell ionization by electron impact.
• Must do ultrafast melting experiments!

s-band (2 states)
d-band (10 states)
Cu: outer shell:11 electrons per atom
Fermi level
diagram from: Janak ,Williams, and Moruzzi,
Phys Rev B 11 p. 1522
noble metals: charge disorder by d-band states localization

noble metals: charge disorder by d-band states localization
0 2 4 6 8 10-2
0
2
4
6
Cu
d-band position evaluated using INFERNO code
en
erg
y o
f d
-ba
nd
pe
ak
[ eV
]
electron temperature Te [ eV ]
D.V.Fisher et. al.: proceedings XXVIII ECLIM, Rome, Sept. 2004

0.1 1 10 1000.00
0.01
0.02
0.03
Cu
Interband absorption amplitude at two wavelengths
in
terb
an
d a
bso
rptio
n a
mp
litu
de
arb
itra
ry u
nits
, n
ot
no
rma
lize
d.
electron temperature Te [ eV ]
800 nm 400 nm

0 20 40 60 80 1000.01
0.1
1
10
100
Cu target = 800 nm
ele
ctro
n t
em
pe
ratu
re
Te
[ eV
]
time t [ fs ]
I0 = 1013 W/cm2
I0 = 1014 W/cm2
I0 = 1015 W/cm2

1011 1012 1013 1014 10150.0
0.1
0.2
0.3
0.4
0.5
0.6
0.7
0.8
Cu target50fs FWHM pulse
a
bso
rptio
n c
oe
ffic
ien
t a
vera
ge o
ver
pu
lse
du
ratio
n a
nd
o
ver
spo
t in
ten
sity
dis
trib
utio
n
Intensity [ W/cm2 ] at pulse peak at spot center
800 nm experiment 800 nm theory 400 nm theory
Results: theory vs. experiment
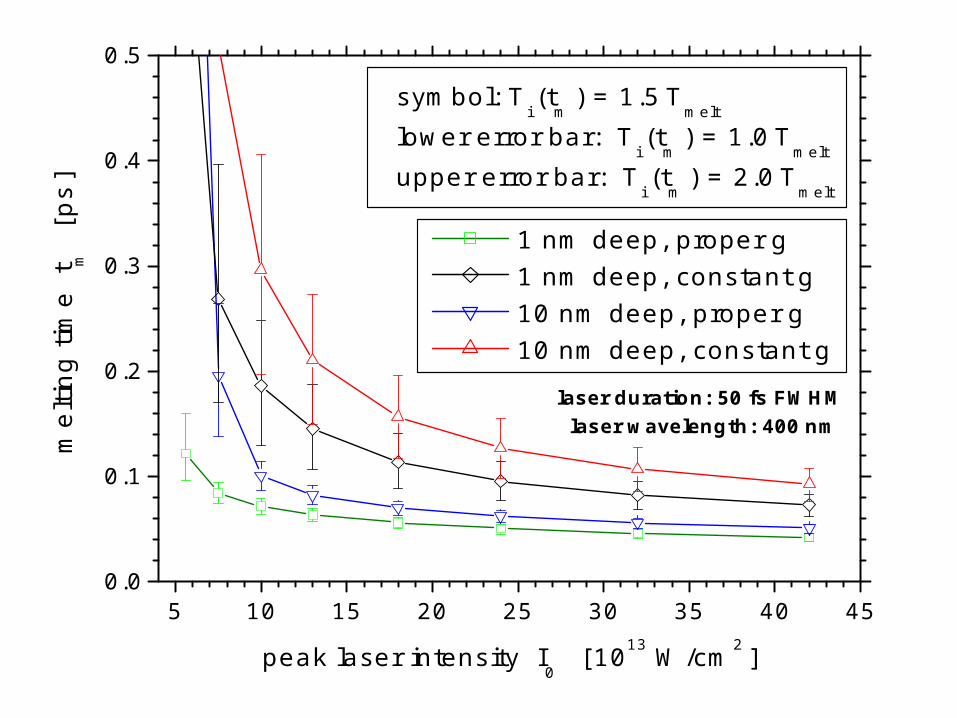
5 10 15 20 25 30 35 40 450.0
0.1
0.2
0.3
0.4
0.5
laser duration: 50 fs FWHM laser wavelength: 400 nm
1 nm deep, proper g 1 nm deep, constant g 10 nm deep, proper g 10 nm deep, constant g
symbol: Ti (t
m ) = 1.5
T
melt
lower error bar: Ti (t
m ) = 1.0
T
melt
upper error bar: Ti (t
m ) = 2.0
T
melt
me
ltin
g t
ime
t m
[ p
s ]
peak laser intensity I0 [ 1013 W/cm2 ]
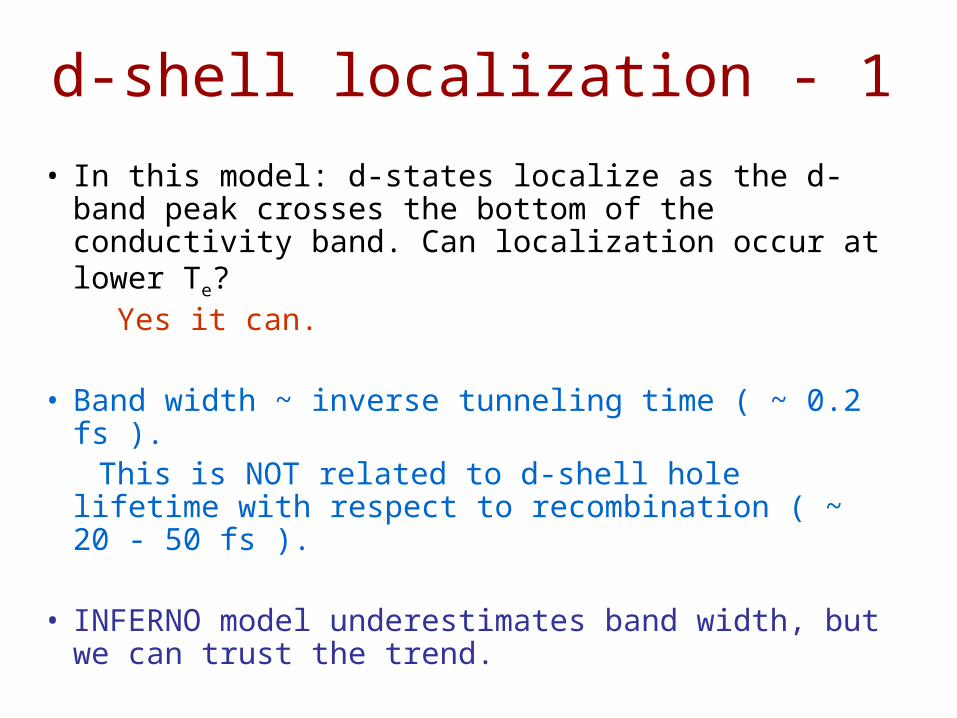
d-shell localization - 1
• In this model: d-states localize as the d-band peak crosses the bottom of the conductivity band. Can localization occur at lower Te?
Yes it can.
• Band width ~ inverse tunneling time ( ~ 0.2 fs ). This is NOT related to d-shell hole lifetime with
respect to recombination ( ~ 20 - 50 fs ).
• INFERNO model underestimates band width, but we can trust the trend.
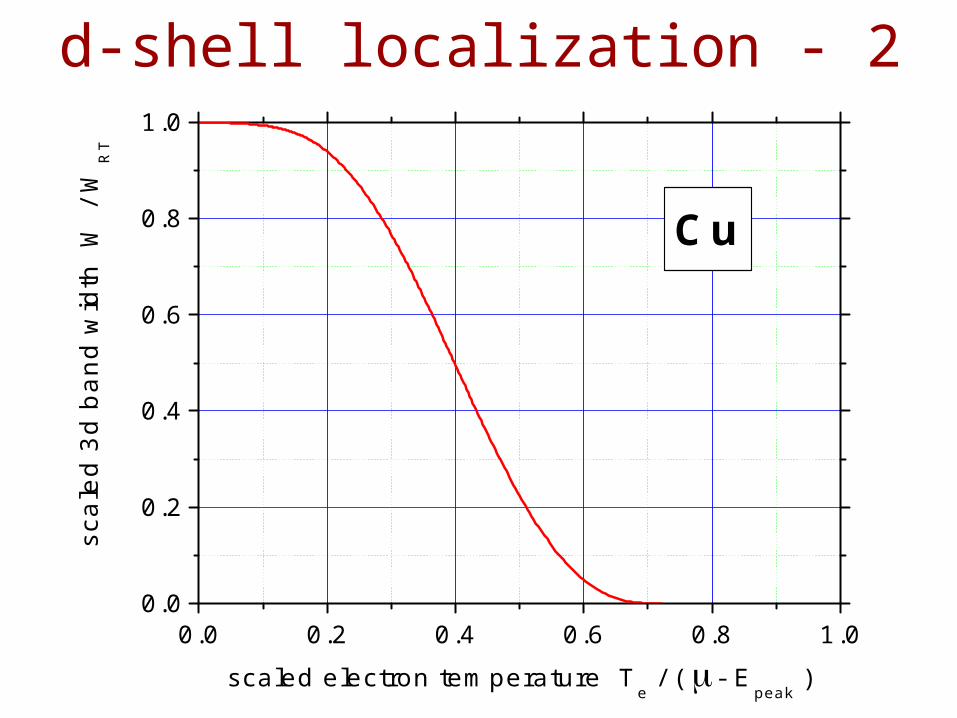
d-shell localization - 2
0.0 0.2 0.4 0.6 0.8 1.00.0
0.2
0.4
0.6
0.8
1.0
Cu
sc
ale
d 3
d b
an
d w
idth
W
/ W
RT
scaled electron temperature Te / ( - E
peak )
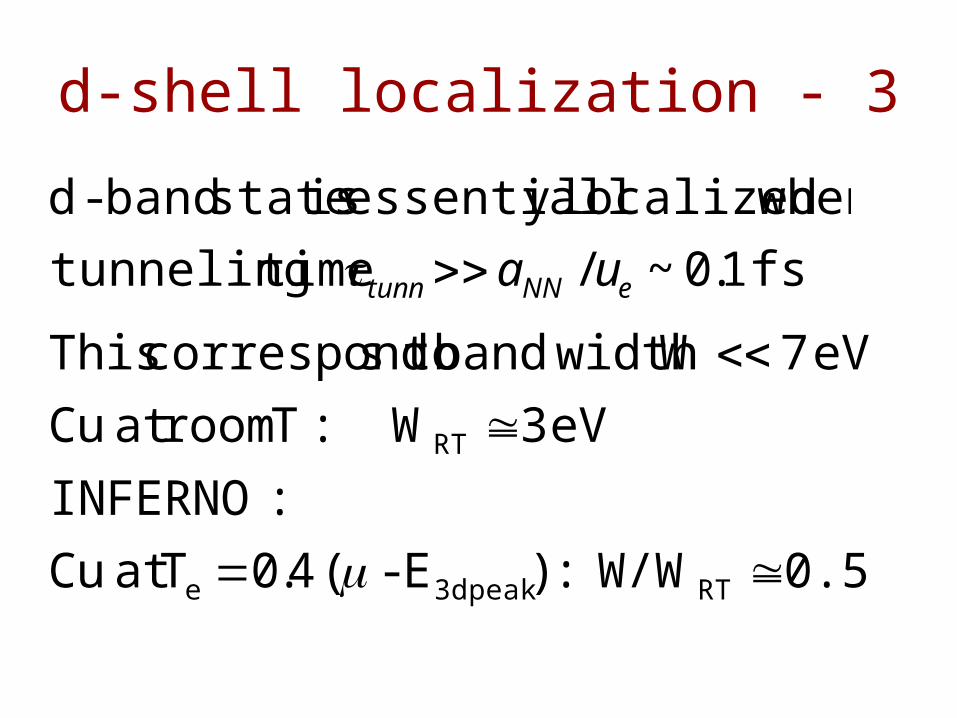
d-shell localization - 3
fs1.0~/ timetunneling
whenlocalizedy essentiall is state band-d
eNNtunn ua
0.5 W/W :)E-( 4.0Tat Cu
:INFERNO
eV 3 W :T roomat Cu
eV 7W widthband toscorrespond This
RTpeak 3de
RT
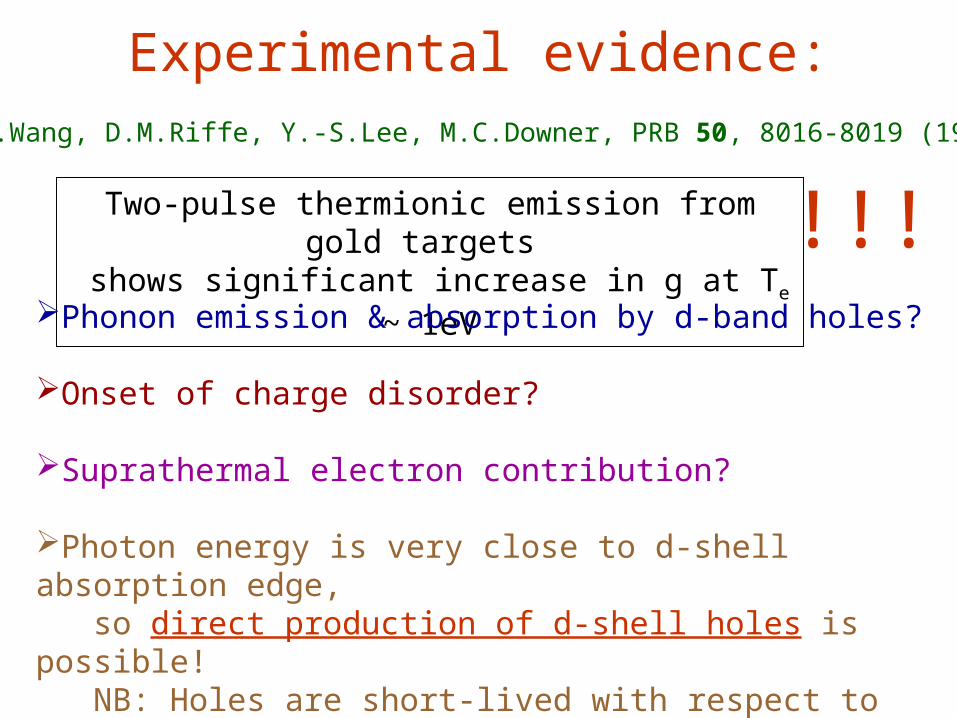
Experimental evidence:X.Y.Wang, D.M.Riffe, Y.-S.Lee, M.C.Downer, PRB 50, 8016-8019 (1994)
Two-pulse thermionic emission from gold targets shows significant increase in g at Te ~ 1eV
Phonon emission & absorption by d-band holes?
Onset of charge disorder?
Suprathermal electron contribution?
Photon energy is very close to d-shell absorption edge, so direct production of d-shell holes is possible! NB: Holes are short-lived with respect to tunneling between ion wells, but long-lived with respect to recombination.
!!!
CONCLUSIONS:
• Fascinating physics is revealed, pertaining to both fundamental physics (quantum mechanics, electron properties of disordered systems) and to applications.
• Any experimental data are welcome!!!
• What happens at higher photon energies?!
THANKS:
Zeev Zinamon
Zohar Henis
Shalom Eliezer
Moshe Fraenkel
Organizers!!!


