Transition of 3B42/3B43 Research Product from Monthly to Climatological Calibration/Adjustment D. T. Bolvin G. J. Huffman March 3, 2015 INTRODUCTION On October 07, 2014, routine production ended for the Tropical Rainfall Measuring Mission (TRMM) precipitation radar (PR) precipitation estimates due to the ongoing descent and ultimate decommissioning of the TRMM satellite (PMM, 2014). Estimates from the TRMM Microwave Radiometer (TMI) will continue to be produced until TRMM reaches its decommissioning altitude of 335 km in Spring 2015. Since PR is no longer available, the TMI/PR combined instrument (TCI) estimates are also no longer available. As the research version of the TMPA (products 3B42 and 3B43) uses the TCI estimates as the satellite calibrator, September 2014 is the last month these products were produced in this way. Note that the real-time TMPA (TMPA-RT – products 3B40RT, 3B41RT and 3B42RT) uses climatological satellite calibrations, so it will continue despite the loss of TRMM estimates. In an effort to keep the research version of TMPA available and usable, we have adapted the TMPA-RT climatological calibrations/adjustments for use in the research products. October 2014 is the first month of the climatologically calibrated/adjusted research TMPA. Users should note there will be a discontinuity in the research TMPA record as a result, the degree of which will be provided by analysis of test results generated for the period October 2013 – September 2014. These months of test data can be provided to users upon request. Each individual user must determine the most appropriate use of the climatologically calibrated/adjusted 3B42 and 3B43 products, based on the comparison results provided below and the user’s own analysis. We encourage users to report their findings to us for the benefit of the community. BACKGROUND AND PROCEDURES As described in Huffman et al. (2007), the research TMPA calibrates all satellite estimates to the TCI, as it is believed to provide the best fine-scale, quasi-global estimate of precipitation from the TRMM platform. For each month, the TCI–TMI relationship is computed on a 1° x 1° grid using that month’s coincident data aggregated on overlapping 3° x 3° windows to accommodate the somewhat different regional dependencies of the two estimates. Outside of the TRMM coverage area, approximately 40°N - 40°S, the northernmost(southernmost) TCI-TMI correction is smooth-filled to 50°N(50°S). This calibration is then applied to that month’s TMI and TMI-calibrated (other) satellite estimates, with the resulting multi-satellite estimate having the large-scale statistics of the TCI. The final multi-satellite product is then merged with gauge analysis at the monthly level (3B43) and then used to rescale the 3-hourly product (3B42). Because the TCI estimates and gauge analyses are not available in real time, the TMPA-RT employs a two-step climatological calibration to mimic the calibration/adjustment procedure used in the research TMPA (Huffman et al, 2010). For the reprocessing subsequent to that described in Huffman (2010), we used 14 years of data (1998 – 2011) to compute monthly (1) TCI-TMI climatological calibrations, and (2) 3B43-TCI climatological adjustments. The monthly climatological TCI-TMI calibrations are computed in the same manner as for the monthly research TMPA, with the addition of controls at high-end precipitation rates to avoid unrealistic corrections. The climatological 3B43-TCI adjustments consist of controlled ratios of 3B43 and TCI over land. The net affect is to (1) provide a climatological TCI correction over ocean and land, and (2) provide a climatological 3B43 adjustment over land. The net effect of (2) is to incorporate the larger-scale mean of the gauge analyses over land.
Transcript
Transition of 3B42/3B43 Research Product from Monthly to Climatological Calibration/Adjustment
D. T. Bolvin
G. J. Huffman
March 3, 2015 INTRODUCTION On October 07, 2014, routine production ended for the Tropical Rainfall Measuring Mission (TRMM) precipitation radar (PR) precipitation estimates due to the ongoing descent and ultimate decommissioning of the TRMM satellite (PMM, 2014). Estimates from the TRMM Microwave Radiometer (TMI) will continue to be produced until TRMM reaches its decommissioning altitude of 335 km in Spring 2015. Since PR is no longer available, the TMI/PR combined instrument (TCI) estimates are also no longer available. As the research version of the TMPA (products 3B42 and 3B43) uses the TCI estimates as the satellite calibrator, September 2014 is the last month these products were produced in this way. Note that the real-time TMPA (TMPA-RT – products 3B40RT, 3B41RT and 3B42RT) uses climatological satellite calibrations, so it will continue despite the loss of TRMM estimates. In an effort to keep the research version of TMPA available and usable, we have adapted the TMPA-RT climatological calibrations/adjustments for use in the research products. October 2014 is the first month of the climatologically calibrated/adjusted research TMPA. Users should note there will be a discontinuity in the research TMPA record as a result, the degree of which will be provided by analysis of test results generated for the period October 2013 – September 2014. These months of test data can be provided to users upon request. Each individual user must determine the most appropriate use of the climatologically calibrated/adjusted 3B42 and 3B43 products, based on the comparison results provided below and the user’s own analysis. We encourage users to report their findings to us for the benefit of the community. BACKGROUND AND PROCEDURES As described in Huffman et al. (2007), the research TMPA calibrates all satellite estimates to the TCI, as it is believed to provide the best fine-scale, quasi-global estimate of precipitation from the TRMM platform. For each month, the TCI–TMI relationship is computed on a 1° x 1° grid using that month’s coincident data aggregated on overlapping 3° x 3° windows to accommodate the somewhat different regional dependencies of the two estimates. Outside of the TRMM coverage area, approximately 40°N - 40°S, the northernmost(southernmost) TCI-TMI correction is smooth-filled to 50°N(50°S). This calibration is then applied to that month’s TMI and TMI-calibrated (other) satellite estimates, with the resulting multi-satellite estimate having the large-scale statistics of the TCI. The final multi-satellite product is then merged with gauge analysis at the monthly level (3B43) and then used to rescale the 3-hourly product (3B42). Because the TCI estimates and gauge analyses are not available in real time, the TMPA-RT employs a two-step climatological calibration to mimic the calibration/adjustment procedure used in the research TMPA (Huffman et al, 2010). For the reprocessing subsequent to that described in Huffman (2010), we used 14 years of data (1998 – 2011) to compute monthly (1) TCI-TMI climatological calibrations, and (2) 3B43-TCI climatological adjustments. The monthly climatological TCI-TMI calibrations are computed in the same manner as for the monthly research TMPA, with the addition of controls at high-end precipitation rates to avoid unrealistic corrections. The climatological 3B43-TCI adjustments consist of controlled ratios of 3B43 and TCI over land. The net affect is to (1) provide a climatological TCI correction over ocean and land, and (2) provide a climatological 3B43 adjustment over land. The net effect of (2) is to incorporate the larger-scale mean of the gauge analyses over land.
MODIFIED RESEARCH TMPA PRODUCT In an effort to keep the research version of TMPA available and usable, we have adapted the TMPA-RT climatological calibration/adjustment scheme for use in the research products. As a result of the use of the climatological calibrations/adjustments described above, the research TMPA will look like the TMPA-RT over ocean after September 2014, but should maintain consistency over land due to the continued direct inclusion of gauge analyses. The degree of the discontinuity in the research TMPA ocean estimates across the September – October 2014 boundary as a result of the change from a monthly calibration to a climatological calibration is a subject of study. Because gauge analyses are still available in the research product due to its two-month latency, land estimates should see a minimal, if any, discontinuity across the September – October 2014 boundary. The continued direct inclusion of gauge analyses somewhat “overrides” the 3B43-TCI climatological adjustment described above, adding specific month-to-month information. The climatologically calibrated/adjusted research TMPA product version will be labeled “7B”, and will begin with October 2014. We expect the research TMPA, as well as the TMPA-RT estimates, to continue to be produced until Spring 2016. At that time, users will be able to transition to the GPM IMERG products which will be complete back to January 1998. ANALYSIS AND INTERPRETATION Caveat: The analysis results shown are for the span October 2013 – September 2014. These results are meant to show typical differences between the monthly and climatological calibrations for the research TMPA for this time period. Because the new calibrations are climatological, it is likely that the monthly results for another time period will be somewhat different. Nomenclature: In describing the results, ‘NORMAL’ refers to the research TMPA computed using the standard monthly calibration and ‘CLIMO’ refers to the research TMPA computed using the TMPA-RT-style climatological calibration. To gain an understanding of the impact of the climatological calibration on the research TMPA, 3B43 was computed using the TMPA-RT-style climatological calibrations for the span October 2013 – September 2014. A 12-month period was chosen to obtain a representative sample of the annual cycle. The climatologically calibrated 3B43 (CLIMO) was compared to the standard 3B43 (NORMAL) for the entire aggregated period and for selected months. The results are segregated by ocean and land, where ocean is defined as grid boxes with ≥ 75% water, and land is all other grid boxes. Fig. 1 shows the October 2013 – September 2014 annual average for CLIMO, NORMAL, and the CLIMO-NORMAL difference. In the tropics and mid-latitudes, ocean differences tend to be highly localized with large positive and negative differences uniformly spread throughout with larger differences in areas of higher precipitation. This pattern is expected since, on average, the climatological calibration should approximately capture the mean global value despite regional differences. At the higher latitudes, the CLIMO tends to be lower than the NORMAL, which is likely the result of the extension of the TRMM calibration to higher latitudes. The technique for extending the calibration to the higher latitudes is the same for the both the monthly and climatological calibrations, so it is undetermined why CLIMO is consistently lower. Over land, the differences tend to be small with equal measures of positive and negative values as a result of the inclusion of gauge analyses in both the CLIMO and NORMAL. Note that areas of reduced gauge coverage tend to have higher differences due to increased influence of the satellite estimates. The zonal profiles of precipitation show that the CLIMO ocean estimates are overall lower than the NORMAL estimates, with some dependence on latitude. For the period October 2013 – September 2014, the global mean ocean estimates for CLIMO are low by 3%, while land estimates are identical. This bias is actually more in line with the TCI than the research TMPA. Figs. 2-5 show the monthly CLIMO, NORMAL, and CLIMO-NORMAL differences as well as the corresponding zonal profiles, for October 2013, January 2014, April 2014, and July 2014, respectively. Overall, the individual monthly results tend to be a mixed bag with no consistency in the pattern of the differences between CLIMO and NORMAL. This is to be expected given that the CLIMO calibration is based on 14 years of data, and there will be variations in the CLIMO-NORMAL differences year-to-year for a given month. The monthly difference fields show localized differences over ocean but can also include larger regional areas of negative and positive differences. October 2013 shows overall that the
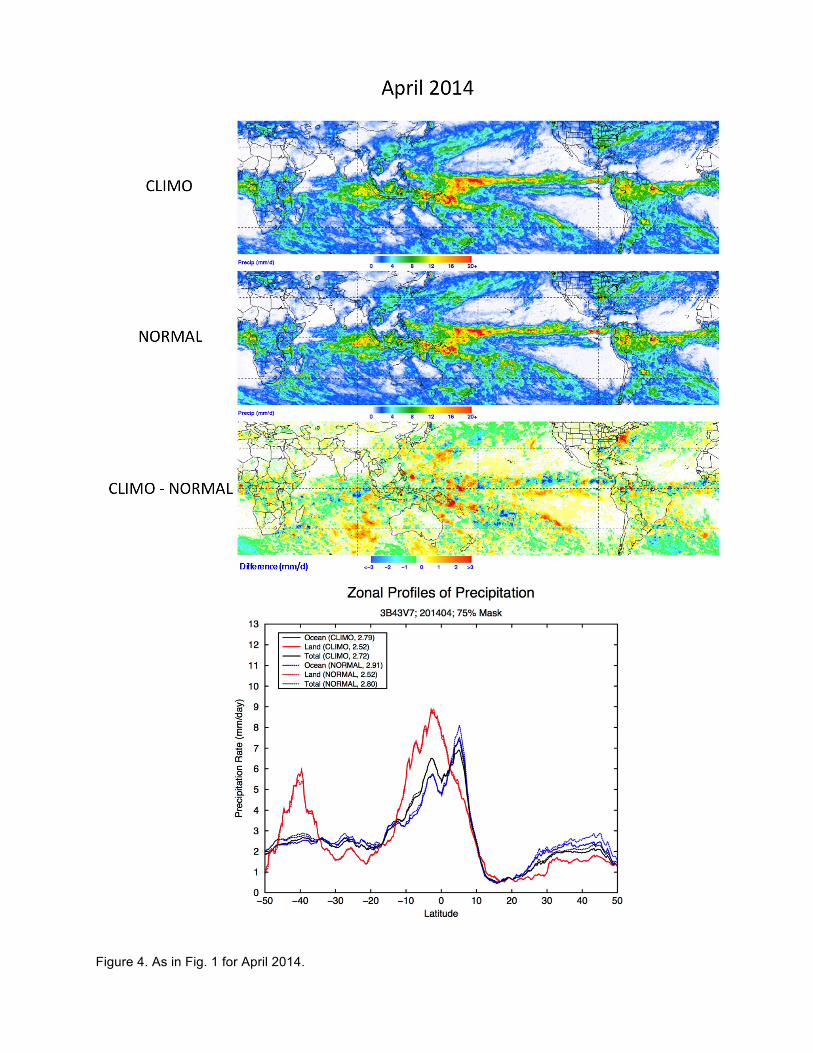
CLIMO is less than NORMAL over ocean, with an isolated large positive difference in the eastern Pacific. January 2014 shows larger uniform regional differences with nearly equal areas of negative and positive differences. April 2014 shows highly localized differences tending toward CLIMO being lower than NORMAL overall. July 2014 differences tend to be much larger regionally with both strong positive and negative, especially in the Pacific ITCZ and SPCZ, the South China Sea, and the Atlantic ITCZ. The zonal profiles for all months echo the corresponding monthly image differences, with no consistent latitudinal dependence between the CLIMO and NORMAL. For all months, there are incidental variations in the zonal profiles for land. The global average ocean CLIMO is low by 4% for October 2013 and April 2014, but is incrementally low for January and July 2014. The global average land estimates for all months are identical for CLIMO and NORMAL. Fig. 6 shows the time series of the global CLIMO and NORMAL ocean averages for the period October 2013 – September 2014. In all months, NORMAL is higher than CLIMO, with larger differences in the Fall and Spring and smaller differences in the Winter and Summer. These results are specific to this period, and other years would likely result in a different seasonal cycle of differences. More generally, our experience shows that the use of TCI for month-to-month calibration creates a time series that has smaller interannual variations and a few month lead in the timing of maxima and minima, compared to estimates that lack routinely updated calibration. Thus, we expect the TMPA time series to show a change in character in interannual fluctuations across the September – October 2014 boundary. Fig. 7 shows the ocean and land scatterplots of NORMAL vs. CLIMO for January 2014. While spread around the one-to-one line, it is clear that NORMAL tends to have higher values across the spectrum of precipitation rates. Land estimates are more tightly wrapped to the one-to-one line, though NORMAL does have higher precipitation rates at the high end likely due to the influence of ocean/land masking criteria. Fig. 8 shows the ocean and land scatterplots of NORMAL vs. CLIMO for July 2014. CLIMO tends to have higher precipitation rates up to 20 mm/day, with NORMAL having higher rates beyond that. These differences tend to balance out as the global means for CLIMO and NORMAL are approximately equal. Like January 2014, the July 2014 land estimates are closely wrapped to the one-to-one line. CONCLUSIONS The research TMPA computed using monthly calibrations (NORMAL) was compared to research TMPA computed using the climatological calibrations (CLIMO) from TMPA-RT. The goal is to assess the impact of using the climatological calibrations in the research TMPA beginning October 2014. Overall, the global ocean CLIMO estimates are lower than the NORMAL estimates for all months, but not by the same amount. In the analysis period, January and July 2014 had the same global average, but October 2013 and April 2014 were both low by 4%. Furthermore, each month exhibits a unique difference pattern due to the nature of the climatological corrections, leading to the conclusion that there will likely be no consistency in any given month from year to year. The land estimates are nearly identical due to the continued inclusion of gauge analyses. The results presented for this period are not necessarily indicative for another period, and should be construed as representative when assessing the “new” research TMPA. REFERENCES PMM 2014, http://pmm.gsfc.nasa.gov/articles/goodbye-trmm-first-rain-radar-space Huffman, G.J., R.F. Adler, D.T. Bolvin, E.J. Nelkin, 2010: The TRMM Multi-satellite Precipitation Analysis
(TMPA). Chapter 1 in Satellite Rainfall Applications for Surface Hydrology, F. Hossain and M. Gebremichael, Eds. Springer Verlag, ISBN: 978-90-481-2914-0, 3-22.
Huffman, G.J., R.F. Adler, D.T. Bolvin, G. Gu, E.J. Nelkin, K.P. Bowman, Y. Hong, E.F. Stocker, D.B. Wolff, 2007: The TRMM Multi-satellite Precipitation Analysis: Quasi-Global, Multi-Year, Combined-Sensor Precipitation Estimates at Fine Scale. J. Hydrometeor., 8(1), 38-55.
Figure 1. October 2013 – September 2014 annual average NORMAL and CLIMO precipitation (mm/day) with difference (upper) and corresponding zonal profiles of ocean, land, and total precipitation (lower). Averages for 50°N-S are provided in the zonal profile legend.
Figure 2. As in Fig. 1 for October 2013.
Figure 3. As in Fig. 1 for January 2014.
Figure 4. As in Fig. 1 for April 2014.
Figure 5. As in Fig. 1 for July 2014.
Figure 6. October 2013 – September 2014 time series of NORMAL and CLIMO 50°N-S ocean-only precipitation (mm/day).
Figure 7. Scatterplot of January 2014 NORMAL vs. CLIMO precipitation (mm/day) for ocean (upper) and land (lower).
Figure 8. Scatterplot of July 2014 NORMAL vs. CLIMO precipitation (mm/day) for ocean (upper) and land (lower).


![A RAIN ACCUMULATION PRODUCT TO INVESTIGATE RAIN … · 3B42 IRR INTERPOLATED EVERY 15 min. CMORPH in 30 min time resolution. IRR [mm/ hr] Time [hours] CONCLUSIONS The AQ RA product](https://static.documents.pub/doc/80x56/5e72e5f003e2f862a72c6af2/a-rain-accumulation-product-to-investigate-rain-3b42-irr-interpolated-every-15-min.jpg)


