Transketolase counteracts oxidative stress to drive cancer development Iris Ming-Jing Xu a , Robin Kit-Ho Lai a , Shu-Hai Lin b,c , Aki Pui-Wah Tse a , David Kung-Chun Chiu a , Hui-Yu Koh a , Cheuk-Ting Law a , Chun-Ming Wong a,d , Zongwei Cai b,c , Carmen Chak-Lui Wong a,d,1 , and Irene Oi-Lin Ng a,d,1 a Department of Pathology, The University of Hong Kong, Hong Kong, SAR, China; b Department of Chemistry,Hong Kong Baptist University, Hong Kong, SAR, China; c State Key Laboratory of Environmental and Biological Analysis, Hong Kong Baptist University, Hong Kong, SAR, China; and d State Key Laboratory for Liver Research, The University of Hong Kong, Hong Kong, SAR, China Edited by Tak W. Mak, The Campbell Family Institute for Breast Cancer Research at Princess Margaret Cancer Centre, University Health Network, Toronto, ON, Canada, and approved December 24, 2015 (received for review May 5, 2015) Cancer cells experience an increase in oxidative stress. The pentose phosphate pathway (PPP) is a major biochemical pathway that generates antioxidant NADPH. Here, we show that transketolase (TKT), an enzyme in the PPP, is required for cancer growth because of its ability to affect the production of NAPDH to counteract oxidative stress. We show that TKT expression is tightly regulated by the Nuclear Factor, Erythroid 2-Like 2 (NRF2)/Kelch-Like ECH- Associated Protein 1 (KEAP1)/BTB and CNC Homolog 1 (BACH1) oxidative stress sensor pathway in cancers. Disturbing the redox homeostasis of cancer cells by genetic knockdown or pharmacologic inhibition of TKT sensitizes cancer cells to existing targeted therapy (Sorafenib). Our study strengthens the notion that antioxidants are beneficial to cancer growth and highlights the therapeutic benefits of targeting pathways that generate antioxidants. TKT | HCC | ROS | metabolism | PPP M etabolic reprogramming has recently been recognized as a hallmark of cancer (1). Cancer cells preferentially use glycol- ysis instead of oxidative phosphorylation to generate energy even in the presence of oxygen (O 2 ). This metabolic shift, named the War- burg Effect, channels glucose intermediates for macromolecule and antioxidant synthesis. A very important metabolic pathway that connects with glycolysis is the pentose phosphate pathway (PPP). The major goal of the PPP is the production of ribose-5-phosphate (R5P) and NADPH. R5P is the major backbone of RNA and is critical to nucleotide synthesis. NADPH is the major antioxidant that maintains the two major redox molecules, glutathione and thioredoxin, in the reduced state. NADPH therefore counteracts reactive oxygen species (ROS), enabling cancer cells to survive oxidative stress. The PPP is composed of the oxidative and nonoxidative arms. The oxidative arm of the PPP produces NADPH and ribose by three irreversible steps. First, glucose-6-phosphate dehydrogenase (G6PD) converts glucose-6-phosphate (G6P) to 6-phospho-glu- conolactone and NAPDH. Second, phosphogluconolactonase con- verts 6-phospho-gluconolactone to 6-phosphogluconate. Third, 6-phosphogluconate dehydrogenase converts 6-phosphogluconate to ribulose-5-phosphate (Ru5P) and NAPDH. Ru5P then enters the nonoxidative arm of the PPP. Ru5P is converted to xylulose-5- phosphate (X5P) and Ru5P by epimerase and isomerase, re- spectively. The transketolase (TKT) family [transketolase-like 1 (TKTL1) and TKTL2] transfers two-carbon groups from X5P to R5P to generate sedoheptulose-7-phosphate (S7P) to glyceral- dehyde-3-phosphate (G3P). Transaldolase (TALDO) transfers three-carbon groups from S7P to G3P to generate erythrose-4- phosphate (E4P) and fructose-6-phosphate (F6P). Finally, TKT transfers two-carbon groups from X5P to E4P to generate G3P and F6P, which reenter glycolysis. All enzymes in the nonoxidative arm of the PPP are reversible, allowing cells to adapt to the dynamic metabolic demands. When cells experience high oxidative stress, metabolites from the nonoxidative arm are rechanneled into gly- colysis to refill the oxidative arm for the synthesis of NAPDH. When cells are in need of nucleotides, the PPP produces ribose through the oxidative arm from G6P and the nonoxidative arm from F6P and G3P. Although the PPP and glycolysis are equally important in the metabolism of cells, attention has been mostly drawn to the mechanisms by which glycolysis benefits tumor growth. Knowledge regarding the roles of the PPP in cancer cells is relatively scarce. Among all of the enzymes in the PPP, only the roles of G6PD and TKTL1 were briefly revealed in cancer. G6PD and TKTL1 were reported to be activated or overexpressed in cervical, lung, gastric, colorectal, and endometrial cancers (2–7). Suppressing TKTL1 in colorectal tumor cells reduced glucose uptake and lactate accu- mulation and enhanced sensitivity to oxidative stress (8). Hepatocellular carcinoma (HCC) is the most common type of primary liver cancer. It is the fifth most common cancer and the second leading cause of cancer deaths. The 5-y survival rate of HCC patients is less than 10% (9). Its high mortality rate is at- tributable to late symptom presentation and lack of promising curative therapy. Liver transplantation and tumor resection are so far the most effective HCC treatment. However, most HCC pa- tients are not amenable to surgical treatments due to poor liver function or the presence of metastasis. Sorafenib, an oral multi- kinase inhibitor, is the only FDA-approved drug and extends the Significance Excessive accumulation of oxidative stress is harmful to cancer cells. Our study demonstrates the important roles of a pentose phosphate pathway (PPP) enzyme, transketolase (TKT), in re- dox homeostasis in cancer development. We highlight the clinical relevance of TKT expression in cancers. We also show that TKT overexpression in cancer cells is a response of Nuclear Factor, Erythroid 2-Like 2 (NRF2) activation, a sensor to cellular oxidative stress. TKT locates at an important position that connects PPP with glycolysis to affect production of antioxi- dant NADPH. Our preclinical study shows that targeting TKT leads to elevation of oxidative stress, making cancer cells more vulnerable to therapeutic treatment, such as Sorafenib. Using TKT as an example, our study suggests that targeting enzymes for antioxidant production represents a direction for cancer treatment. Author contributions: I.M.-J.X., C.C.-L.W., and I.O.-L.N. designed research; I.M.-J.X., R.K.-H.L., S.-H.L., A.P.-W.T., D.K.-C.C., H.-Y.K., C.-T.L., C.-M.W., and C.C.-L.W. performed research; I.M.-J.X., S.-H.L., C.-T.L., C.-M.W., Z.C., C.C.-L.W., and I.O.-L.N. contributed new reagents/analytic tools; I.M.-J.X., S.-H.L., Z.C., C.C.-L.W., and I.O.-L.N. analyzed data; and I.M.-J.X., C.C.-L.W., and I.O.-L.N. wrote the paper. The authors declare no conflict of interest. This article is a PNAS Direct Submission. Freely available online through the PNAS open access option. 1 To whom correspondence may be addressed. Email: [email protected] or carmencl@pathology. hku.hk. This article contains supporting information online at www.pnas.org/lookup/suppl/doi:10. 1073/pnas.1508779113/-/DCSupplemental. www.pnas.org/cgi/doi/10.1073/pnas.1508779113 PNAS | Published online January 25, 2016 | E725–E734 CELL BIOLOGY PNAS PLUS
Transcript
Transketolase counteracts oxidative stress to drivecancer developmentIris Ming-Jing Xua, Robin Kit-Ho Laia, Shu-Hai Linb,c, Aki Pui-Wah Tsea, David Kung-Chun Chiua, Hui-Yu Koha,Cheuk-Ting Lawa, Chun-Ming Wonga,d, Zongwei Caib,c, Carmen Chak-Lui Wonga,d,1, and Irene Oi-Lin Nga,d,1
aDepartment of Pathology, The University of Hong Kong, Hong Kong, SAR, China; bDepartment of Chemistry,Hong Kong Baptist University, Hong Kong,SAR, China; cState Key Laboratory of Environmental and Biological Analysis, Hong Kong Baptist University, Hong Kong, SAR, China; and dState KeyLaboratory for Liver Research, The University of Hong Kong, Hong Kong, SAR, China
Edited by Tak W. Mak, The Campbell Family Institute for Breast Cancer Research at Princess Margaret Cancer Centre, University Health Network, Toronto, ON,Canada, and approved December 24, 2015 (received for review May 5, 2015)
Cancer cells experience an increase in oxidative stress. The pentosephosphate pathway (PPP) is a major biochemical pathway thatgenerates antioxidant NADPH. Here, we show that transketolase(TKT), an enzyme in the PPP, is required for cancer growth becauseof its ability to affect the production of NAPDH to counteractoxidative stress. We show that TKT expression is tightly regulatedby the Nuclear Factor, Erythroid 2-Like 2 (NRF2)/Kelch-Like ECH-Associated Protein 1 (KEAP1)/BTB and CNC Homolog 1 (BACH1)oxidative stress sensor pathway in cancers. Disturbing theredox homeostasis of cancer cells by genetic knockdown orpharmacologic inhibition of TKT sensitizes cancer cells toexisting targeted therapy (Sorafenib). Our study strengthens thenotion that antioxidants are beneficial to cancer growth andhighlights the therapeutic benefits of targeting pathways thatgenerate antioxidants.
TKT | HCC | ROS | metabolism | PPP
Metabolic reprogramming has recently been recognized as ahallmark of cancer (1). Cancer cells preferentially use glycol-
ysis instead of oxidative phosphorylation to generate energy even inthe presence of oxygen (O2). This metabolic shift, named the War-burg Effect, channels glucose intermediates for macromolecule andantioxidant synthesis. A very important metabolic pathway thatconnects with glycolysis is the pentose phosphate pathway (PPP). Themajor goal of the PPP is the production of ribose-5-phosphate (R5P)and NADPH. R5P is the major backbone of RNA and is critical tonucleotide synthesis. NADPH is the major antioxidant that maintainsthe two major redox molecules, glutathione and thioredoxin, in thereduced state. NADPH therefore counteracts reactive oxygen species(ROS), enabling cancer cells to survive oxidative stress.The PPP is composed of the oxidative and nonoxidative arms.
The oxidative arm of the PPP produces NADPH and ribose bythree irreversible steps. First, glucose-6-phosphate dehydrogenase(G6PD) converts glucose-6-phosphate (G6P) to 6-phospho-glu-conolactone and NAPDH. Second, phosphogluconolactonase con-verts 6-phospho-gluconolactone to 6-phosphogluconate. Third,6-phosphogluconate dehydrogenase converts 6-phosphogluconateto ribulose-5-phosphate (Ru5P) and NAPDH. Ru5P then entersthe nonoxidative arm of the PPP. Ru5P is converted to xylulose-5-phosphate (X5P) and Ru5P by epimerase and isomerase, re-spectively. The transketolase (TKT) family [transketolase-like 1(TKTL1) and TKTL2] transfers two-carbon groups from X5P toR5P to generate sedoheptulose-7-phosphate (S7P) to glyceral-dehyde-3-phosphate (G3P). Transaldolase (TALDO) transfersthree-carbon groups from S7P to G3P to generate erythrose-4-phosphate (E4P) and fructose-6-phosphate (F6P). Finally, TKTtransfers two-carbon groups from X5P to E4P to generate G3P andF6P, which reenter glycolysis. All enzymes in the nonoxidative armof the PPP are reversible, allowing cells to adapt to the dynamicmetabolic demands. When cells experience high oxidative stress,metabolites from the nonoxidative arm are rechanneled into gly-colysis to refill the oxidative arm for the synthesis of NAPDH.
When cells are in need of nucleotides, the PPP produces ribosethrough the oxidative arm from G6P and the nonoxidative armfrom F6P and G3P.Although the PPP and glycolysis are equally important in the
metabolism of cells, attention has been mostly drawn to themechanisms by which glycolysis benefits tumor growth. Knowledgeregarding the roles of the PPP in cancer cells is relatively scarce.Among all of the enzymes in the PPP, only the roles of G6PD andTKTL1 were briefly revealed in cancer. G6PD and TKTL1 werereported to be activated or overexpressed in cervical, lung, gastric,colorectal, and endometrial cancers (2–7). Suppressing TKTL1 incolorectal tumor cells reduced glucose uptake and lactate accu-mulation and enhanced sensitivity to oxidative stress (8).Hepatocellular carcinoma (HCC) is the most common type of
primary liver cancer. It is the fifth most common cancer and thesecond leading cause of cancer deaths. The 5-y survival rate ofHCC patients is less than 10% (9). Its high mortality rate is at-tributable to late symptom presentation and lack of promisingcurative therapy. Liver transplantation and tumor resection are sofar the most effective HCC treatment. However, most HCC pa-tients are not amenable to surgical treatments due to poor liverfunction or the presence of metastasis. Sorafenib, an oral multi-kinase inhibitor, is the only FDA-approved drug and extends the
Significance
Excessive accumulation of oxidative stress is harmful to cancercells. Our study demonstrates the important roles of a pentosephosphate pathway (PPP) enzyme, transketolase (TKT), in re-dox homeostasis in cancer development. We highlight theclinical relevance of TKT expression in cancers. We also showthat TKT overexpression in cancer cells is a response of NuclearFactor, Erythroid 2-Like 2 (NRF2) activation, a sensor to cellularoxidative stress. TKT locates at an important position thatconnects PPP with glycolysis to affect production of antioxi-dant NADPH. Our preclinical study shows that targeting TKTleads to elevation of oxidative stress, making cancer cells morevulnerable to therapeutic treatment, such as Sorafenib. UsingTKT as an example, our study suggests that targeting enzymesfor antioxidant production represents a direction for cancertreatment.
Author contributions: I.M.-J.X., C.C.-L.W., and I.O.-L.N. designed research; I.M.-J.X., R.K.-H.L.,S.-H.L., A.P.-W.T., D.K.-C.C., H.-Y.K., C.-T.L., C.-M.W., and C.C.-L.W. performed research; I.M.-J.X.,S.-H.L., C.-T.L., C.-M.W., Z.C., C.C.-L.W., and I.O.-L.N. contributed new reagents/analytic tools;I.M.-J.X., S.-H.L., Z.C., C.C.-L.W., and I.O.-L.N. analyzed data; and I.M.-J.X., C.C.-L.W., and I.O.-L.N.wrote the paper.
The authors declare no conflict of interest.
This article is a PNAS Direct Submission.
Freely available online through the PNAS open access option.1To whom correspondence may be addressed. Email: [email protected] or [email protected].
This article contains supporting information online at www.pnas.org/lookup/suppl/doi:10.1073/pnas.1508779113/-/DCSupplemental.
www.pnas.org/cgi/doi/10.1073/pnas.1508779113 PNAS | Published online January 25, 2016 | E725–E734
median survival of advanced HCC patients for about 3 mo. It iswell known that HCC is one of the most rapidly growing solidcancers. Furthermore, the liver is known to be a metabolic hub thatis responsible for major metabolic events in the body such as bloodglucose homeostasis and glycogen metabolism. Nonetheless, thedetailed metabolic alterations in HCC and the molecular mecha-nisms driving the metabolic adaptation in HCC remain largelyunknown. Better understanding of the metabolic machineries ofHCC will be beneficial for the development of therapeutic treat-ment. Here, using HCC as a cancer model, we demonstrate theimperative roles of the PPP in cancer development and illustrate anexample that blocking a critical enzyme that connects glycolysis andthe PPP, TKT, would be sufficient to impede HCC developmentand improve the efficiency of Sorafenib treatment in HCC.
ResultsPPP Enzymes Are Frequently Up-Regulated in Cancer.To gain insightsinto the clinical implications of the PPP in cancer development, wefirst compared the expression of all of the PPP enzymes in 16 pairsof human HCC and the corresponding nontumorous (NT) liver bytranscriptome sequencing (Table 1). Intriguingly, most PPP en-zymes were significantly up-regulated in human HCCs, suggestingthat this pathway is deregulated in human HCC. Fragments perkilobase of transcript sequence per million mapped reads (FPKM)values suggested that TKT was the most abundantly expressed andmost profoundly up-regulated PPP enzyme in HCC (Fig. 1A). Ofnote, two other members in the TKT family, TKTL1 and TKTL2,were barely detectable, suggesting that TKT is the predominantform in the context of liver. We further confirmed our observationin an expanded cohort of 103 HCC cases (Fig. 1B). Waterfall plot
demonstrated that TKT was overexpressed by at least twofold in54.4% (56/103) of the HCC patients (Fig. 1C). Western blottingfurther confirmed that TKT was also overexpressed at the proteinlevel (Fig. 1D). Overexpression of TKT was also closely associatedwith aggressive clinicopathological HCC features, including thepresence of venous invasion and tumor microsatellite formation,increased tumor size, and absence of tumor encapsulation (Fig. 1Eand Table 2). Expression patterns of TKT and other PPP enzymesfrom The Cancer Genome Atlas (TCGA) database containingtranscriptome sequencing data of 50 paired HCC samples alsoecho our own in-house data (Fig. S1A). Furthermore, the Onco-mine database confirms that overexpression of TKT is not re-stricted to HCC but is also present in other cancer types such ascolorectal, bladder, gastric, ovarian, lung, renal, prostate, andbreast cancers (Fig. S1B).
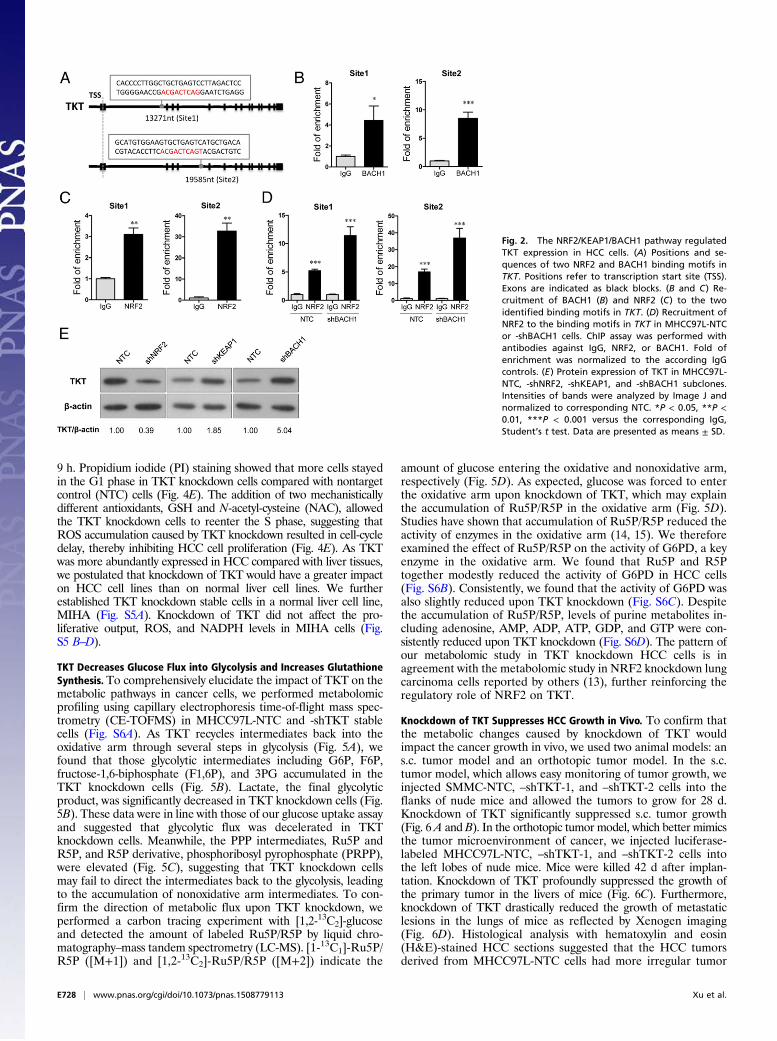
NRF2 Competes with BACH1 to Activate TKT Expression. The nextquestion we asked was how TKT was up-regulated in cancer. Achromatin immunoprecipitation sequencing (ChIP-seq) studyrevealed that a transcriptional repressor, BTB and CNC Ho-molog 1 (BACH1), can potentially bind to TKT (10). However,the precise binding location has not been validated. BACH1 isknown to be an important regulator of oxidative stress throughrepressing heme oxygenase 1 (HMOX1), which degrades hemeto form bilirubin, a strong ROS scavenger (11). BACH1 bindsto the antioxidant response elements (AREs) of HMOX1 (11).Inspired from these findings, we performed in silico analysisand found seven putative AREs in TKT with consensus nucle-otides, “-TGACTC-” (10) (Fig. 2A and Fig. S2A). ChIP assaywas performed in a HCC cell line, MHCC97L, and we confirmed
Fig. 1. TKT was overexpressed in HCC samples, andoverexpression correlated with aggressive clinico-pathological features. (A) Transcriptome sequencingdata showing the expression of TKT, TKTL1, andTKTL2 in 16 pairs of HCC and NT liver samples. Geneexpression is represented as FPKM. (B) qRT-PCRanalysis of mRNA levels of TKT in 103 pairs of HCCtumor and NT samples. HPRT was used as the in-ternal control. (C) Waterfall plot shows that TKT wasup-regulated in 54.4% (56/103) of human HCC sam-ples by at least twofold. –ΔΔCT = –[(CTTKT – CTHPRT)of HCC – (CTTKT – CTHPRT) of NT]. (D) Protein expres-sion of TKT in representative cases of HCC and theircorresponding NT liver tissues was determined byWestern blotting. Intensities of bands were analyzedby Image J and normalized to the corresponding NTsamples. (E) TKT expression in HCC correlated withaggressive clinicopathological features of HCC,including venous invasion, tumor microsatellite for-mation, tumor size, and absence of tumor encapsula-tion. *P < 0.05, **P < 0.01, ***P < 0.001. A, paired t test;B, Wilcoxon signed rank test; E, Mann–Whitney test.
E726 | www.pnas.org/cgi/doi/10.1073/pnas.1508779113 Xu et al.
that BACH1 binds strongly to two of the seven putative AREsthat are located in intron 1 and intron 4 of TKT (Fig. 2B). BACH1has been shown to inhibit an antioxidant gene, NAD(P)Hdehydrogenase, quinone 1 (NQO1), through competitive bindingwith a transcriptional activator, Nuclear Factor, Erythroid 2-Like2 (NRF2) (12). Under normal conditions, NRF2 is ubiquitinatedby KEAP1, leading to proteosomal degradation of NRF2. Oxi-dative stress inactivates KEAP1, thereby allowing NRF2 to enterthe nucleus and initiate transcription of genes involved incounteracting oxidative stress. We therefore questioned if TKT,like other antioxidant genes, was regulated by the KEAP1/NRF2pathway. By ChIP assay, we confirmed that NRF2 bound to thetwo strong BACH1-binding sites in intron 1 and in intron 4 ofTKT (Fig. 2C). Of note, BACH1 and NRF2 also bound to theother five putative AREs at a weaker affinity, as reflected by thefold of enrichment values (Fig. S2 B and C). To validate thatBACH1 and NRF2 antagonistically regulate TKT expressionthrough competitive binding, we performed ChIP assay with theNRF2 antibody on BACH1 stable knockdown cells. Knockdownof BACH1 enhanced binding of NRF2 to TKT (Fig. 2D). Fur-thermore, stable knockdown of BACH1 and KEAP1 enhancedTKT expression, whereas stable knockdown of NRF2 suppressedTKT expression, suggesting that BACH1 and KEAP1 negativelyregulated TKT expression, whereas NRF2 positively regulated
TKT expression (Fig. 2E and Fig. S3). Coincidentally, the AREin intron 4 of TKT was also recently found to be a binding site forNRF2 (13).
Knockdown of TKT Suppresses HCC Cell Proliferation by Inducing ROSAccumulation and ROS-Associated Cell-Cycle Delay. Given that TKTis located in a pivotal position connecting PPP and glycolysis, wepostulated that TKT overexpression in cancer would substantiallyaffect the metabolic machinery of cancer cells. To address this, weestablished TKT stable knockdown cells in two different HCCcell lines, MHCC97L and SMMC cells, by short-hairpin RNA(shRNA) (Fig. 3 A and B). Two independent shRNA sequences(shTKT-1 and shTKT-2) profoundly suppressed HCC cell pro-liferation in vitro (Fig. 3C). 2-(N-(7-Nitrobenz-2-oxa-1,3-diazol-4-yl)Amino)-2-Deoxyglucose (2-NBDG) staining confirmed thatknockdown of TKT reduced glucose uptake in HCC cells (Fig.3D). We also found that knockdown of TKT suppressed NAPDHproduction and increased ROS production in HCC cells (Fig. 4A–C). ROS accumulation caused by TKT knockdown could berescued by the antioxidant reduced glutathione (GSH) (Fig. 4D).Next, we asked if the ROS accumulation caused by TKT knock-down affects the cell-cycle profile of HCC cells. Nocodazole wasused to synchronize all of the HCC subclones in the G2/M phase(Fig. S4). Cells were then released from nocodazole treatment for
Table 2. Clinicopathological correlation of TKT overexpression in human HCC
Clinicopathological features Status Number of casesMean of −ΔΔCt,
9 h. Propidium iodide (PI) staining showed that more cells stayedin the G1 phase in TKT knockdown cells compared with nontargetcontrol (NTC) cells (Fig. 4E). The addition of two mechanisticallydifferent antioxidants, GSH and N-acetyl-cysteine (NAC), allowedthe TKT knockdown cells to reenter the S phase, suggesting thatROS accumulation caused by TKT knockdown resulted in cell-cycledelay, thereby inhibiting HCC cell proliferation (Fig. 4E). As TKTwas more abundantly expressed in HCC compared with liver tissues,we postulated that knockdown of TKT would have a greater impacton HCC cell lines than on normal liver cell lines. We furtherestablished TKT knockdown stable cells in a normal liver cell line,MIHA (Fig. S5A). Knockdown of TKT did not affect the pro-liferative output, ROS, and NADPH levels in MIHA cells (Fig.S5 B–D).
TKT Decreases Glucose Flux into Glycolysis and Increases GlutathioneSynthesis. To comprehensively elucidate the impact of TKT on themetabolic pathways in cancer cells, we performed metabolomicprofiling using capillary electrophoresis time-of-flight mass spec-trometry (CE-TOFMS) in MHCC97L-NTC and -shTKT stablecells (Fig. S6A). As TKT recycles intermediates back into theoxidative arm through several steps in glycolysis (Fig. 5A), wefound that those glycolytic intermediates including G6P, F6P,fructose-1,6-biphosphate (F1,6P), and 3PG accumulated in theTKT knockdown cells (Fig. 5B). Lactate, the final glycolyticproduct, was significantly decreased in TKT knockdown cells (Fig.5B). These data were in line with those of our glucose uptake assayand suggested that glycolytic flux was decelerated in TKTknockdown cells. Meanwhile, the PPP intermediates, Ru5P andR5P, and R5P derivative, phosphoribosyl pyrophosphate (PRPP),were elevated (Fig. 5C), suggesting that TKT knockdown cellsmay fail to direct the intermediates back to the glycolysis, leadingto the accumulation of nonoxidative arm intermediates. To con-firm the direction of metabolic flux upon TKT knockdown, weperformed a carbon tracing experiment with [1,2-13C2]-glucoseand detected the amount of labeled Ru5P/R5P by liquid chro-matography–mass tandem spectrometry (LC-MS). [1-13C1]-Ru5P/R5P ([M+1]) and [1,2-13C2]-Ru5P/R5P ([M+2]) indicate the
amount of glucose entering the oxidative and nonoxidative arm,respectively (Fig. 5D). As expected, glucose was forced to enterthe oxidative arm upon knockdown of TKT, which may explainthe accumulation of Ru5P/R5P in the oxidative arm (Fig. 5D).Studies have shown that accumulation of Ru5P/R5P reduced theactivity of enzymes in the oxidative arm (14, 15). We thereforeexamined the effect of Ru5P/R5P on the activity of G6PD, a keyenzyme in the oxidative arm. We found that Ru5P and R5Ptogether modestly reduced the activity of G6PD in HCC cells(Fig. S6B). Consistently, we found that the activity of G6PD wasalso slightly reduced upon TKT knockdown (Fig. S6C). Despitethe accumulation of Ru5P/R5P, levels of purine metabolites in-cluding adenosine, AMP, ADP, ATP, GDP, and GTP were con-sistently reduced upon TKT knockdown (Fig. S6D). The pattern ofour metabolomic study in TKT knockdown HCC cells is inagreement with the metabolomic study in NRF2 knockdown lungcarcinoma cells reported by others (13), further reinforcing theregulatory role of NRF2 on TKT.
Knockdown of TKT Suppresses HCC Growth in Vivo. To confirm thatthe metabolic changes caused by knockdown of TKT wouldimpact the cancer growth in vivo, we used two animal models: ans.c. tumor model and an orthotopic tumor model. In the s.c.tumor model, which allows easy monitoring of tumor growth, weinjected SMMC-NTC, –shTKT-1, and –shTKT-2 cells into theflanks of nude mice and allowed the tumors to grow for 28 d.Knockdown of TKT significantly suppressed s.c. tumor growth(Fig. 6 A and B). In the orthotopic tumor model, which better mimicsthe tumor microenvironment of cancer, we injected luciferase-labeled MHCC97L-NTC, –shTKT-1, and –shTKT-2 cells intothe left lobes of nude mice. Mice were killed 42 d after implan-tation. Knockdown of TKT profoundly suppressed the growth ofthe primary tumor in the livers of mice (Fig. 6C). Furthermore,knockdown of TKT drastically reduced the growth of metastaticlesions in the lungs of mice as reflected by Xenogen imaging(Fig. 6D). Histological analysis with hematoxylin and eosin(H&E)-stained HCC sections suggested that the HCC tumorsderived from MHCC97L-NTC cells had more irregular tumor
Fig. 2. The NRF2/KEAP1/BACH1 pathway regulatedTKT expression in HCC cells. (A) Positions and se-quences of two NRF2 and BACH1 binding motifs inTKT. Positions refer to transcription start site (TSS).Exons are indicated as black blocks. (B and C) Re-cruitment of BACH1 (B) and NRF2 (C) to the twoidentified binding motifs in TKT. (D) Recruitment ofNRF2 to the binding motifs in TKT in MHCC97L-NTCor -shBACH1 cells. ChIP assay was performed withantibodies against IgG, NRF2, or BACH1. Fold ofenrichment was normalized to the according IgGcontrols. (E) Protein expression of TKT in MHCC97L-NTC, -shNRF2, -shKEAP1, and -shBACH1 subclones.Intensities of bands were analyzed by Image J andnormalized to corresponding NTC. *P < 0.05, **P <0.01, ***P < 0.001 versus the corresponding IgG,Student’s t test. Data are presented as means ± SD.
E728 | www.pnas.org/cgi/doi/10.1073/pnas.1508779113 Xu et al.
growth fronts and were more aggressive than those derived fromMHCC97L-shTKT cells (Fig. 6E and Table 3). Metastatic fociin the mice implanted with MHCC97L-NTC cells were signifi-cantly larger (Fig. 6F).
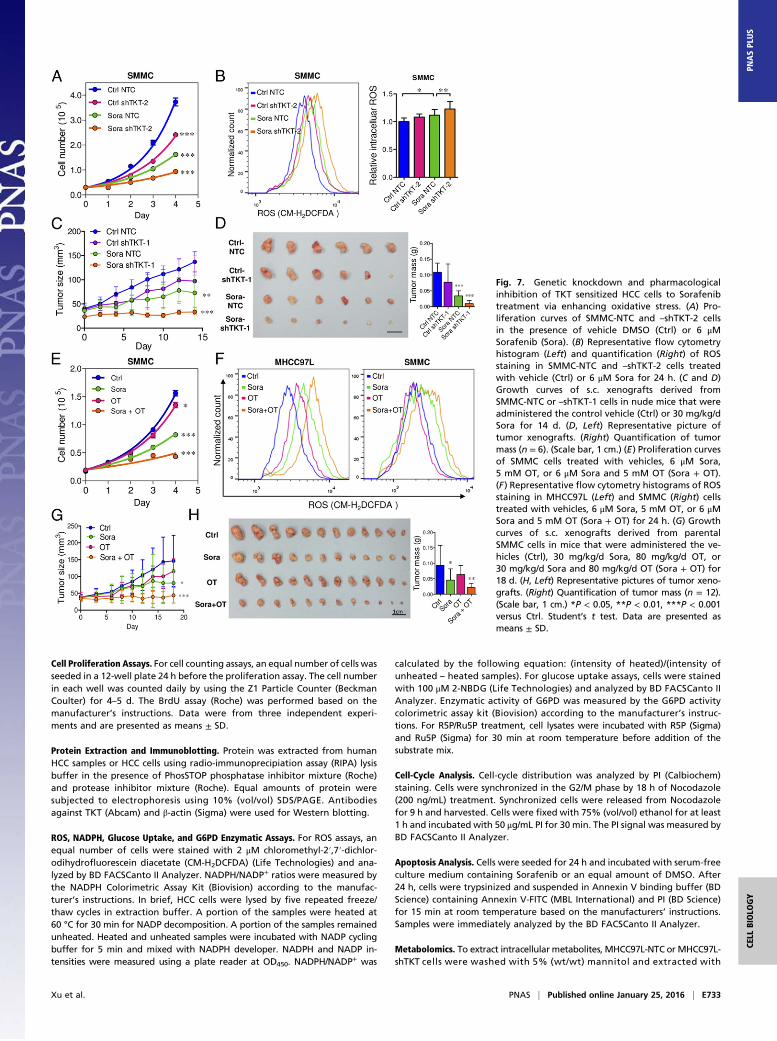
Inhibition of TKT Sensitizes Cancer Cells to Sorafenib Treatment. Wedemonstrated that TKT promoted cancer growth by attenuatingoxidative stress. Increasing evidence has suggested that reductionof oxidative stress protects cancer cells from chemotherapy andradiation therapy. In light of this, we asked if inhibition of TKTwould sensitize cancer cells to Sorafenib treatment, the only FDA-approved drug in HCC. Sorafenib partially reduced the cell pro-liferation in SMMC-NTC cells but completely blocked that inSMMC-shTKT cells (Fig. 7A). The levels of ROS in the SMMC-NTC and -shTKT cells treated with vehicle control and Sorafenibinversely correlated with their proliferative output (Fig. 7B). Weimplanted SMMC-NTC and –shTKT-1 subclones s.c. into nudemice for easy monitoring of the tumor growth. Consistent with ourin vitro observation, Sorafenib partially repressed the growth oftumors derived from SMMC-NTC cells but completely retardedthe growth of tumors derived from –shTKT-1 cells in vivo (Fig. 7 Cand D). Similar results were observed in s.c. tumors derived fromMHCC97L subclones (Fig. S7 A–D). We next examined the sen-
sitization effect of the TKT inhibitor oxythiamine (OT), a thia-mine antagonist, for Sorafenib. Cell proliferation assay revealedthat OT drastically sensitized SMMC and MHCC97L cells toSorafenib treatment in vitro (Fig. 7E and Fig. S7E) and increasedROS accumulation in the Sorafenib-treated HCC cells (Fig. 7F).Of note, we found that Sorafenib alone could induce ROS in bothHCC cell lines. This observation has also been reported by Coriatet al. in some other HCC cell lines, such as Hepa1,6 and HepG2(16), suggesting that the effect of Sorafenib in ROS induction iscommon and partially contributed to its suppressive effect in thegrowth of HCC. To confirm the mechanisms by which Sorafenibinduces cell death, we performed Annexin V and PI staining toevaluate the percentage of apoptotic HCC cells. We found thatSorafenib induced apoptosis especially in the TKT knockdownHCC cells (Fig. S8A). A BrdU proliferation assay further con-firmed that Sorafenib profoundly reduced cell growth, especiallyin the TKT knockdown HCC cells, which could be significantlyrescued by GSH (Fig. S8 B and C). These data suggested that thesensitization effect upon TKT knockdown or inhibition is causedby ROS. Interestingly, the sensitization effect only holds true inHCC cells but not in normal liver cell lines, MIHA and LO2,suggesting a therapeutic window for combined treatment of OTand Sorafenib in HCC patients (Fig. S9 A–C). Concentrations of
Fig. 3. Knockdown of TKT reduced HCC cell pro-liferation and glucose uptake in vitro. (A) mRNAexpression of TKT in MHCC97L and SMMC-NTC,–shTKT-1, and –shTKT-2 subclones. HPRT was used asthe internal control. (B) Protein expression of TKT inMHCC97L and SMMC-NTC, –shTKT-1, and –shTKT-2subclones. β-actin was used as the loading control.(C) Cell proliferation assay in MHCC97L and SMMC-NTC, –shTKT-1, and –shTKT-2 subclones. (D) Glucoseuptake assay was performed in MHCC97L andSMMC-NTC, –shTKT-1, and –shTKT-2 subclones. (Left)Representative flow cytometry analysis showing in-tensities of 2-NBDG in the indicated HCC subclones.(Right) Histograms summarize the 2-NBDG intensities(glucose uptake) in different HCC subclones. Relativevalues were calculated based on the accordingNTC subclones. *P < 0.05, ***P < 0.001 versus NTC.A, C, and D, Student’s t test. Data are presented asmeans ± SD.
Xu et al. PNAS | Published online January 25, 2016 | E729
OT used in in vitro and in vivo experiments were based on theIC50 values and results of toxicity tests in other studies (17, 18).The s.c. tumor model further revealed that a combination treat-ment of OT and Sorafenib was most efficacious in suppressingtumor growth compared with the single treatment of either drug(Fig. 7 G and H). Apart from Sorafenib, we used another morewell-characterized ROS inducer, tert-Butyl hydroperoxide (tBHP).Consistently, we found that knockdown of both TKT and OT couldincrease the ROS level of HCC cells together with tBHP (Fig. S10).This finding suggested that OT may also be used in combinationwith other existing drugs to raise the ROS level in cancer cells in asimilar approach as Sorafenib.
DiscussionThere has been a revival of interest in metabolic reprogramming incancers. In the past decade, tremendous efforts have been made toprovide molecular explanations for the Warburg Effect, which wasreported 60 y ago (19). Compelling evidence has suggested thataerobic glycolysis is achieved to maximize the production of mac-romolecules and antioxidants. In fact, aerobic glycolysis is accom-plished together with changes in other metabolic pathways. Ourstudy has provided evidence that a pivotal enzyme in the PPP,TKT, is indispensable to cancer development. The PPP producestwo major products, ribose and NADPH, through the nonoxidativearm and oxidative arm, respectively. Surprisingly, we showed thatknockdown of TKT drastically reduced tumor growth regardless ofthe accumulation of ribose intermediates, suggesting that ribosewas not a limiting factor in cancer growth. Although our currentstudy has not provided data to show whether ribose accumulationin the TKT knockdown cells is a result of decreased consumptionor increased production, this remains an interesting question to beaddressed in the future. On the other hand, TKT knockdown
resulted in a decrease of NADPH and an increase of ROS, furthersuggesting that oxidative stress homeostasis is an important de-termining factor in cancer growth. Of note, one intriguing questionthat remains unanswered is why there was an increase of oxidativeflux in the TKT knockdown cells but the level of NADPH, a me-tabolite from the oxidative arm, decreased. One speculation is thatknockdown of TKT may transiently increase oxidative flux, butgradual accumulation of R5P and Ru5P would eventually block theoxidative arm of PPP. Our current study only showed that G6PDenzymatic activity was slightly reduced upon treatment of R5P andRu5P. A more direct experimental approach to confirm our hy-pothesis in the future is to use [1-2H]-glucose to trace NADPHproduction in the TKT knockdown cells (20).The PPP connects with glycolysis through G6PD and TKT,
which directly metabolize several glycolytic metabolites. Ourmetabolomic profiling provided further evidence to support theintimate link between the PPP and glycolysis. We noticed thatthe end product of aerobic glycolysis, lactate, was reduced uponknockdown of TKT despite the levels of glycolytic intermediatesincluding F1,6P were significantly elevated. This observation canbe explained by the change of pyruvate kinase M2 (PKM2) ac-tivity, which is tightly controlled by F1,6P. PKM2 is one of thefour pyruvate kinase isoforms that convert phosphoenolpyruvate(PEP) to pyruvate. PKM2, the cancer-specific isoform, has lowerenzymatic activity compared with other pyruvate kinase isoforms(21). Low activity of pyruvate kinase reduces the entrance ofpyruvate into the TCA cycle, thereby decelerating the metabolicflux of the TCA cycle and allowing TCA cycle intermediates tobe synthesized into biomass, such as lipid (22). For its low en-zymatic activity, PKM2 favors cancer growth. F1,6P allostericallyactivates PKM2 through inducing the tetramer formation ofPKM2 (21). Therefore, F1,6P accumulation upon TKT knockdown
Fig. 4. Knockdown of TKT increased the intracellularROS level and induced oxidative stress-associatedG1 phase arrest. (A and B) Flow cytometry was per-formed to analyze the ROS levels in MHCC97L andSMMC-NTC, –shTKT-1, and –shTKT-2 subclones. (Left)Representative flow cytometry analysis showingintensities of ROS (CM-H2DCFDA) in the indicatedsubclones. (Right) Histograms summarize the ROSlevels in different HCC subclones. Relative valueswere calculated based on the according NTC sub-clones. (C) Relative NADPH/NADP+ ratio in MHCC97Land SMMC-NTC and –shTKT-2 cells. The NADPH/NADP+ ratio was normalized to the correspondingNTC subclones. (D, Left) Representative flow cytom-etry analysis showing intensities of ROS (CM-H2DCFDA) in MHCC97L-NTC and –shTKT-2 cells withvehicle or 10 μM GSH. (Right) Histogram summarizesthe ROS levels. Relative values were calculatedbased on the ROS level in the NTC. (E) Representa-tive flow cytometry analysis showing intensities of PIin MHCC97L-NTC and –shTKT-2 cells treated withvehicle, 10 μM GSH, or 2.5 mM NAC. Cells weresynchronized with nocodazole and released fromnocodazole for 9 h for cell-cycle analysis. *P < 0.05,**P < 0.01, ***P < 0.001 versus NTC or as indicatedby brackets, Student’s t test. Data are presented asmeans ± SD.
E730 | www.pnas.org/cgi/doi/10.1073/pnas.1508779113 Xu et al.
may result in the activation of PKM2, leading to the decrease ofaerobic glycolysis and a reduction of lactate accumulation. We haverecently reported that PKM2 is the major isoform in HCC (23)and TKT might indirectly regulate PKM2 activity through F1,6P.Further knowledge on the interplay of TKT and PKM2 will help todevise combined therapies against the PPP and glycolysis forcancer patients.The role of ROS in cancer development has been the subject
of contentious debate. A wealth of studies have suggested thatROS drives mutations and activates signaling pathways thatpromote cell proliferation (24). Recently, more studies haveprovided evidence showing that excessive production of ROS isdetrimental to cancer cells by triggering apoptosis and senes-cence (25–27). NRF2 is characterized as an oncogene for itsability to buffer ROS (28). Recently, NRF2 has been reported totranscriptionally activate some PPP genes, such as TKT, G6PD,and TALDO (13). Interestingly, p73 could also increase themetabolic flux in the PPP through initiating the transcription ofG6PD (29). Although our study has showed the roles of TKT inredox homeostasis, further studies on other possible transcrip-tional and posttranscriptional regulation of TKT will yield im-portant knowledge on how cancer cells overcome ROS.Recent studies have highlighted the disadvantages of antioxi-
dant intake in cancer patients. Antioxidants have been shown toconfer cancer stem cells’ radio resistance (30) and promote an-chorage-independent growth of cancer cells (31). Our study hasillustrated an example that a pathway that synthesizes antioxi-dants, the PPP, is critical to tumor development. Our findingechoes a recent study that elegantly demonstrated the importantroles of glutamate cysteine ligase, an enzyme that synthesizesglutathione, in cancer initiation (32). Intriguingly, Harris et al.demonstrated that cotreatment of inhibitors against the gluta-thione and thioredoxin antioxidant pathways could efficientlyblock tumor growth even when drugs were administered aftertumor onset (32). Similarly, our study, using HCC as a cancermodel, showed that blocking the PPP by the TKT inhibitor OTcould synergize Sorafenib to halt cancer growth. The combined
effect of OT with inhibitors against the glutathione and/or thi-oredoxin antioxidant pathways represents an exciting trans-lational research direction. Furthermore, knowledge on thecombined effects of these inhibitors with existing chemotherapyand targeted therapies will be important for the development ofnew therapeutic strategies for cancers, especially in HCC pa-tients with very limited treatment options.It is worth mentioning that patients with PPP deficiency, the
G6PD deficiency that is an X chromosome-linked genetic dis-ease in G6PD, have not been found to be protected againstcancers (33). G6PD directly produces NADPH, which is the onlysource of GSH in red blood cells. G6PD deficiency increasesoxidative stress in red blood cells, causing hemolysis, whichdestructs red blood cells and releases hemoglobin to plasma.G6PD deficiency has not been found to be protective againstcancers, possibly because of the compensatory effects from otherNADPH-producing enzymes (20, 34, 35). Although large-scaleepidemiological studies on the protective roles of G6PD de-ficiency against cancers are awaited, the pathophysiology ofG6PD deficiency suggested that systemic suppression ofNADPH production may adversely cause side effects similar tothe symptoms of G6PD deficiency. Careful examination of thetherapeutic window of drugs that target antioxidant productionin cancer treatment should be performed before clinical trials. In
Fig. 5. Knockdown of TKT altered glucose metab-olism and glutathione metabolism. (A) Metabolicintermediates and reactions in the glycolysis andPPP. (B and C) Quantification of metabolic interme-diates in glycolysis (B) and the PPP (C ). (D, Left)1,2-13C2-glucose is converted to M+1 Ru5P/R5P throughthe oxidative arm and M+2 Ru5P/R5p through thenonoxidative arm. (Right) Quantification of mass iso-topomer distribution of Ru5P/R5P in MHCC97L-NTCand -shTKT cells cultured in 1,2-13C2-glucose for 12 h.M+0 indicates unlabeled Ru5P/R5P. M+1 indicatesone carbon-labeled Ru5P/R5P. M+2 indicates twocarbon-labeled Ru5P/R5P. 3PG, 3-phosphoglycericacid; E4P, erythrose 4-phosphate; F1,6P, fructose1,6-bisphosphate; F6P, frutose-6-phosphate; G3P,glyceraldehyde 3-phosphate; G6P, glucose-6-phos-phate; PRPP, phosphoribosyl pyrophosphate; R5P,ribose-5-phosphate; Ru5P, ribulose-5-phosphate; S7P,sedoheptulose-7-phosphate; X5P, xylulose-5-phosphate.*P < 0.05, **P < 0.01, ***P < 0.001 versus NTC,Student’s t test. Data are presented as means ± SD.
Table 3. Results of orthotopic liver implantation fromMHCC97L-Luc-NTC and -shTKT clones
Xu et al. PNAS | Published online January 25, 2016 | E731
CELL
BIOLO
GY
PNASPL
US
conclusion, results from this study underscore the protumorigenicroles of antioxidants in cancer development and support thenotion that antioxidant intake may not be definitely beneficial tocancer patients.
Materials and MethodsPatients. Use of human clinical specimens in this study was approved by theInstitutional Review Board of the University of Hong Kong and HospitalAuthority of Hong Kong (HKU/HA HKW IRB; ref. no. UW 09–185). The pa-tients were explained, and signed consent forms to acknowledge, the use oftheir resected tissues for research purposes.
Ethical Statement. Animal experiments were performed following UK Co-ordinating Committee on Cancer Research (CCCR) PMID: 9459138 Guidelinesfor the Welfare of Animals in Experimental Neoplasia (36) to ensure minimalsuffering of animals. The experimental procedures of the animal studieswere approved by the Committee on the Use of Live Animals in Teachingand Research of the University of Hong Kong.
HCC Patient Samples and HCC Cell Lines. Clinical HCC and corresponding ad-jacent NT liver tissue were obtained from patients at Queen Mary Hospital,Pamela Youde Nethersole Eastern Hospital, and Queen Elizabeth Hospital inHong Kong. Tissue specimens were snap-frozen in liquid nitrogen and storedat –80 °C for RNA or protein extraction. Human HCC cell lines SMMC andMHCC97L were gifts from the Shanghai Institute of Cell Biology (ChineseAcademy of Sciences) and Fudan University of Shanghai, respectively.
RNA Extraction, Reverse Transcription PCR, and Quantitative Real-Time PCR.RNA was extracted from clinical specimens or HCC cell lines by TRIzol re-agent (Life Technologies) and reverse-transcribed by the GeneAmp PCRReagent Kit (Applied Biosystems). SYBR Green qPCR Master Mix (AppliedBiosystems) and corresponding primers (Table S1) were used for quantitativereal-time PCR (qRT-PCR).
Transcriptome Sequencing. Transcriptome sequencing was performed in 16cases of HCC tissues and paired NT liver tissues. TruSeq Standard mRNASample Prep Kit (Illumina) was used to prepare the polyA +mRNA library. Weperformed 100-bp paired-end sequencing in Illumina HiSeq2000 by AxeqTechnologies. Data were analyzed by the TopHat-Cufflinks pipeline (37), andvalues were indicated by FPKM.
TCGA and Oncomine Data. Transcriptome sequencing data of 50 cases ofpaired HCC and NT tissues were retrieved from TCGA via the Broad Institute(gdac.broadinstitute.org/). mRNA expression levels of the PPP genes in dif-ferent cancer types were retrieved from the Oncomine database (https://www.oncomine.org//resource/login.html).
Clinicopathological Correlation Analysis. Clinicopathological features of HCCpatients including venous invasion, tumor encapsulation, tumor micro-satellite formation, hepatitis B surface antigen, direct liver invasion, cellulardifferentiation, tumor size, and pathological tumor–node–metastasis (pTNM)tumor stage were graded and analyzed by a pathologist as previously de-scribed (38). Clinicopathological correlation was performed withSPSS20.0 software.
ChIP Assay. Cells were cross-linked with formaldehyde and sonicated. ShearedDNA was incubated with antibodies against NRF2 (Abcam), BACH1 (SantaCruz), or IgG (Santa Cruz). DNA–protein–antibody complexes were incubatedwith ChIP beads of protein A/G (Merck Millipore). Beads were washed withgradients of salt buffer and eluted in 1% SDS/NaHCO3. ChIP DNA was ana-lyzed by qRT-PCR with primers amplifying the putative regions (Table S1).
Establishment of Stable Knockdown Clones. pLKO.1-puro vectors encom-passing shRNA targeting TKT, NRF2, KEAP1, BACH1 (Table S2), or a nontargetcontrol (Sigma Aldrich) were stably transfected into HCC cell lines by alentiviral-mediated approach, as we previously described (39). HCC cells thatstably expressed the vectors were selected by puromycin.
Fig. 6. Knockdown of TKT suppressed tumor growthand lung metastasis in vivo. (A and B) SMMC-NTCand –shTKT-1 cells (A) or SMMC-NTC and –shTKT-2 cells(B) were s.c. injected into flanks of nude mice. Tumorvolumes were monitored for 28 d. (Left) Representa-tive pictures of tumors formed in nudemice. (Scale bar,1 cm.) (Middle) Growth curves of s.c. xenografts.(Right) Quantification of tumor mass on day 28. (C)Luciferase-labeled MHCC97L-NTC, –shTKT-1, or –shTKT-2cells were orthotopically injected into left hepaticlobes of nude mice and allowed to grow for 42 d.(Left) Representative pictures of orthotopic xeno-grafts. (Scale bar, 1 cm.) Right: quantification of tumorvolume. (D, Left) Bioluminescent images of lung tissues.(Right) Quantification of bioluminescent intensities oflung tissues. (E) Representative pictures of H&E stainingof tumor xenografts. Arrows indicate irregular growthfront in the NTC group. (Scale bars, 200 μm.) (F) Repre-sentative pictures of H&E staining of lung tissues. Arrowsindicate tumor cells found in the lung tissue. (Scale bars,200 μm.) *P < 0.05, **P < 0.01 versus NTC, Student’s ttest (N ≥ 5). Data are presented as means ± SD.
E732 | www.pnas.org/cgi/doi/10.1073/pnas.1508779113 Xu et al.
Cell Proliferation Assays. For cell counting assays, an equal number of cells wasseeded in a 12-well plate 24 h before the proliferation assay. The cell numberin each well was counted daily by using the Z1 Particle Counter (BeckmanCoulter) for 4–5 d. The BrdU assay (Roche) was performed based on themanufacturer’s instructions. Data were from three independent experi-ments and are presented as means ± SD.
Protein Extraction and Immunoblotting. Protein was extracted from humanHCC samples or HCC cells using radio-immunoprecipiation assay (RIPA) lysisbuffer in the presence of PhosSTOP phosphatase inhibitor mixture (Roche)and protease inhibitor mixture (Roche). Equal amounts of protein weresubjected to electrophoresis using 10% (vol/vol) SDS/PAGE. Antibodiesagainst TKT (Abcam) and β-actin (Sigma) were used for Western blotting.
ROS, NADPH, Glucose Uptake, and G6PD Enzymatic Assays. For ROS assays, anequal number of cells were stained with 2 μM chloromethyl-2′,7′-dichlor-odihydrofluorescein diacetate (CM-H2DCFDA) (Life Technologies) and ana-lyzed by BD FACSCanto II Analyzer. NADPH/NADP+ ratios were measured bythe NADPH Colorimetric Assay Kit (Biovision) according to the manufac-turer’s instructions. In brief, HCC cells were lysed by five repeated freeze/thaw cycles in extraction buffer. A portion of the samples were heated at60 °C for 30 min for NADP decomposition. A portion of the samples remainedunheated. Heated and unheated samples were incubated with NADP cyclingbuffer for 5 min and mixed with NADPH developer. NADPH and NADP in-tensities were measured using a plate reader at OD450. NADPH/NADP
+ was
calculated by the following equation: (intensity of heated)/(intensity ofunheated – heated samples). For glucose uptake assays, cells were stainedwith 100 μM 2-NBDG (Life Technologies) and analyzed by BD FACSCanto IIAnalyzer. Enzymatic activity of G6PD was measured by the G6PD activitycolorimetric assay kit (Biovision) according to the manufacturer’s instruc-tions. For R5P/Ru5P treatment, cell lysates were incubated with R5P (Sigma)and Ru5P (Sigma) for 30 min at room temperature before addition of thesubstrate mix.
Cell-Cycle Analysis. Cell-cycle distribution was analyzed by PI (Calbiochem)staining. Cells were synchronized in the G2/M phase by 18 h of Nocodazole(200 ng/mL) treatment. Synchronized cells were released from Nocodazolefor 9 h and harvested. Cells were fixed with 75% (vol/vol) ethanol for at least1 h and incubated with 50 μg/mL PI for 30 min. The PI signal was measured byBD FACSCanto II Analyzer.
Apoptosis Analysis. Cells were seeded for 24 h and incubated with serum-freeculture medium containing Sorafenib or an equal amount of DMSO. After24 h, cells were trypsinized and suspended in Annexin V binding buffer (BDScience) containing Annexin V-FITC (MBL International) and PI (BD Science)for 15 min at room temperature based on the manufacturers’ instructions.Samples were immediately analyzed by the BD FACSCanto II Analyzer.
Metabolomics. To extract intracellular metabolites, MHCC97L-NTC or MHCC97L-shTKT cells were washed with 5% (wt/wt) mannitol and extracted with
Fig. 7. Genetic knockdown and pharmacologicalinhibition of TKT sensitized HCC cells to Sorafenibtreatment via enhancing oxidative stress. (A) Pro-liferation curves of SMMC-NTC and –shTKT-2 cellsin the presence of vehicle DMSO (Ctrl) or 6 μMSorafenib (Sora). (B) Representative flow cytometryhistogram (Left) and quantification (Right) of ROSstaining in SMMC-NTC and –shTKT-2 cells treatedwith vehicle (Ctrl) or 6 μM Sora for 24 h. (C and D)Growth curves of s.c. xenografts derived fromSMMC-NTC or –shTKT-1 cells in nude mice that wereadministered the control vehicle (Ctrl) or 30 mg/kg/dSora for 14 d. (D, Left) Representative picture oftumor xenografts. (Right) Quantification of tumormass (n = 6). (Scale bar, 1 cm.) (E) Proliferation curvesof SMMC cells treated with vehicles, 6 μM Sora,5 mM OT, or 6 μM Sora and 5 mM OT (Sora + OT).(F) Representative flow cytometry histograms of ROSstaining in MHCC97L (Left) and SMMC (Right) cellstreated with vehicles, 6 μM Sora, 5 mM OT, or 6 μMSora and 5 mM OT (Sora + OT) for 24 h. (G) Growthcurves of s.c. xenografts derived from parentalSMMC cells in mice that were administered the ve-hicles (Ctrl), 30 mg/kg/d Sora, 80 mg/kg/d OT, or30 mg/kg/d Sora and 80 mg/kg/d OT (Sora + OT) for18 d. (H, Left) Representative pictures of tumor xeno-grafts. (Right) Quantification of tumor mass (n = 12).(Scale bar, 1 cm.) *P < 0.05, **P < 0.01, ***P < 0.001versus Ctrl. Student’s t test. Data are presented asmeans ± SD.
Xu et al. PNAS | Published online January 25, 2016 | E733
CELL
BIOLO
GY
PNASPL
US
methanol in the presence of 10 μM of internal control solution (compoundC1 with the m/z at 182.048 and compound A1 with the m/z at 231.070),which was provided by Human Metabolome Technologies. Extracted solu-tion was collected and centrifuged. Supernatants were filtered by a centri-fuge filter unit (Human Metabolome Technologies). Filtered extracts weredried up by a centrifugal evaporator. Extracted metabolites were analyzedby CE-TOFMS by Human Metabolome Technologies.
Metabolic Flux Analysis. The 1.5 × 10⁶ MHCC97L-NTC and -shTKT cells werecultured in DMEM (Sigma, D5030) with 25 mM [1,2-13C2]-glucose (CambridgeIsotope Laboratories) and 4 mM L-glutamine in 10% dialyzed FBS (HyClone)in 10-cm plates for 12 h. After cells were quenched with HPLC-grademethanol and dehydrated completely, samples were sparked with 10 μL ofcompound A1 (2 ppm) as the internal standard. The samples were thenbriefly sonicated, vortexed, and centrifuged at 15,133 × g for 20 min. Thesupernatants were collected and dehydrated and dissolved in 200 μL of 80%methanol. The samples were vortexed and centrifuged at 15,133 × g for20 min, and the supernatants were collected for ultra performance liquidchromatography (UPLC)-MS/MS analysis. Analysis was performed on a TSQQuantiva triple quadrupole mass spectrometer (Thermo Fisher Scientific) via anelectrospray interface, operating in negative ionization mode and configuringin selective reaction monitoring mode. The metabolite separation was per-formed using a SeQuant ZIC-HILIC column (3.5 μm, 100 × 2.1 mm) (Merck). Themobile phases consisted of acetonitrile (A) and 20 mM ammonium acetate inwater (B). The gradient elution program initiated from 90% (vol/vol) A andheld for 1 min, decreased to 60% (vol/vol) A in 7 min, and held for 5 min, thenincreased to 90% (vol/vol) for re-equilibrium for 5 min with a flow rate of0.2 mL/min. Mass spectrometric conditions were optimized for each me-tabolite by using the reference standard. Spray voltage, vaporizer tem-perature, sheath gas, auxiliary gas, and capillary temperature were set at–2,300 V, 350 °C, 35 arb, 10 arb, and 320 °C, respectively. The LC-MS/MSdata were acquired and processed with LCquanTM software version 2.5.6(Thermo Fisher Scientific). The selective reaction monitoring transitions of
R5P, [1-13C1]-R5P, [1,2-13C2]-R5P, and compound A1 were set at 229/97, 230/
97, 231/97, and 231/80, respectively. The collision energies were also set at 16eV and 35 eV for R5P and compound A1, respectively.
Animal Experiments. For the s.c. tumor model, 1 × 10⁶ HCC cells were sus-pended in 100 μL PBS and s.c. injected into BALB/cAnN-nu (nude) mice. Tu-mor volume was measured by electronic caliper. For the orthotopic tumormodel, 1 × 10⁶ luciferase-labeled MHCC97L cells were suspended in 100%Matrigel (BD Bioscience) and orthotopically injected into the left lobes of theliver of nude mice. At 42 d after implantation, mice were injected with100 mg/kg D-luciferin (PerkinElmer), and bioluminescence was measured byXenogen IVIS100. Tumors and lungs were harvested for ex vivo imaging andhistology. Tissues were fixed in 10% formalin and stained with H&E forhistological analysis.
Drug Treatment. Sorafenib (LC laboratories) was dissolved in DMSO. OT(Sigma), GSH (Sigma), and N-acetyl-L-cysteine (Sigma) were dissolved in H2O.For in vitro experiments, Sorafenib, OT, GSH, N-acetyl-L-cysteine, and vehi-cles were added to cells for proliferation assay, ROS assays, or cell-cycleanalysis. For in vivo experiments, nude mice were administered orally withSorafenib, and intraperitoneally with OT and vehicle (0.9% NaCl) based onthe therapeutic regimens shown in Fig. 7.
ACKNOWLEDGMENTS. We thank Dr. Sandy Leung-Kuen Au for her technicalsupport and advice in the animal experiments. We also thank the FacultyCore Facility, University of Hong Kong Li Ka Shing Faculty of Medicine for itssupport in the flow cytometry analysis and Xenogen imaging. This work wassupported by the Health and Medical Research Fund (HMRF-02132696), SKYee Medical Research Fund 2011, University Development Fund of theUniversity of Hong Kong, Lee Shiu Family Foundation, National NaturalScience Foundation of China (NSFC-21377106), and Hong Kong ResearchGrant Council Collaborative Research Fund (HKBU5/CRF/10). I.O.-L.N. is LokeYew Professor in Pathology.
1. Hanahan D, Weinberg RA (2011) Hallmarks of cancer: The next generation. Cell144(5):646–674.
2. Chen H, et al. (2009) Overexpression of transketolase-like gene 1 is associated withcell proliferation in uterine cervix cancer. J Exp Clin Cancer Res 28:43.
3. Diaz-Moralli S, Tarrado-Castellarnau M, Alenda C, Castells A, Cascante M (2011)Transketolase-like 1 expression is modulated during colorectal cancer progression andmetastasis formation. PLoS One 6(9):e25323.
4. Jiang P, Du W, Yang X (2013) A critical role of glucose-6-phosphate dehydrogenase inTAp73-mediated cell proliferation. Cell Cycle 12(24):3720–3726.
5. Krockenberger M, et al. (2010) Expression of transketolase-like 1 protein (TKTL1) inhuman endometrial cancer. Anticancer Res 30(5):1653–1659.
6. Schultz H, et al. (2008) TKTL1 is overexpressed in a large portion of non-small cell lungcancer specimens. Diagn Pathol 3:35.
7. Staiger WI, et al. (2006) Expression of the mutated transketolase TKTL1, a molecularmarker in gastric cancer. Oncol Rep 16(4):657–661.
8. Xu X, Zur Hausen A, Coy JF, Lochelt M (2009) Transketolase-like protein 1 (TKTL1) isrequired for rapid cell growth and full viability of human tumor cells. Int J Cancer124(6):1330–1337.
9. Hertl M, Cosimi AB (2005) Liver transplantation for malignancy. Oncologist 10(4):269–281.
10. Warnatz HJ, et al. (2011) The BTB and CNC homology 1 (BACH1) target genes areinvolved in the oxidative stress response and in control of the cell cycle. J Biol Chem286(26):23521–23532.
11. Sun J, et al. (2002) Hemoprotein Bach1 regulates enhancer availability of hemeoxygenase-1 gene. EMBO J 21(19):5216–5224.
12. Dhakshinamoorthy S, Jain AK, Bloom DA, Jaiswal AK (2005) Bach1 competes withNrf2 leading to negative regulation of the antioxidant response element (ARE)-mediated NAD(P)H:quinone oxidoreductase 1 gene expression and induction inresponse to antioxidants. J Biol Chem 280(17):16891–16900.
13. Mitsuishi Y, et al. (2012) Nrf2 redirects glucose and glutamine into anabolic pathwaysin metabolic reprogramming. Cancer Cell 22(1):66–79.
14. Berdis AJ, Cook PF (1993) Overall kinetic mechanism of 6-phosphogluconate de-hydrogenase from Candida utilis. Biochemistry 32(8):2036–2040.
15. Perl A, Hanczko R, Telarico T, Oaks Z, Landas S (2011) Oxidative stress, inflammationand carcinogenesis are controlled through the pentose phosphate pathway bytransaldolase. Trends Mol Med 17(7):395–403.
16. Coriat R, et al. (2012) Sorafenib-induced hepatocellular carcinoma cell death depends onreactive oxygen species production in vitro and in vivo. Mol Cancer Ther 11(10):2284–2293.
17. Ramos-Montoya A, et al. (2006) Pentose phosphate cycle oxidative and nonoxidativebalance: A new vulnerable target for overcoming drug resistance in cancer. Int JCancer 119(12):2733–2741.
18. Zhao F, et al. (2010) Imatinib resistance associated with BCR-ABL upregulationis dependent on HIF-1alpha-induced metabolic reprograming. Oncogene 29(20):2962–2972.
19. Warburg O (1956) On the origin of cancer cells. Science 123(3191):309–314.
20. Fan J, et al. (2014) Quantitative flux analysis reveals folate-dependent NADPH pro-duction. Nature 510(7504):298–302.
21. Christofk HR, Vander Heiden MG, Wu N, Asara JM, Cantley LC (2008) Pyruvate kinaseM2 is a phosphotyrosine-binding protein. Nature 452(7184):181–186.
22. Christofk HR, et al. (2008) The M2 splice isoform of pyruvate kinase is important forcancer metabolism and tumour growth. Nature 452(7184):230–233.
23. Wong CC, et al. (2014) Switching of pyruvate kinase isoform L to M2 promotesmetabolic reprogramming in hepatocarcinogenesis. PLoS One 9(12):e115036.
24. Tochhawng L, Deng S, Pervaiz S, Yap CT (2013) Redox regulation of cancer cell mi-gration and invasion. Mitochondrion 13(3):246–253.
25. Ames BN (1983) Dietary carcinogens and anticarcinogens. Oxygen radicals and de-generative diseases. Science 221(4617):1256–1264.
26. Hampton MB, Orrenius S (1997) Dual regulation of caspase activity by hydrogenperoxide: Implications for apoptosis. FEBS Lett 414(3):552–556.
27. Sena LA, Chandel NS (2012) Physiological roles of mitochondrial reactive oxygenspecies. Mol Cell 48(2):158–167.
28. DeNicola GM, et al. (2011) Oncogene-induced Nrf2 transcription promotes ROS de-toxification and tumorigenesis. Nature 475(7354):106–109.
29. DuW, et al. (2013) TAp73 enhances the pentose phosphate pathway and supports cellproliferation. Nat Cell Biol 15(8):991–1000.
30. Diehn M, et al. (2009) Association of reactive oxygen species levels and radio-resistance in cancer stem cells. Nature 458(7239):780–783.
31. Schafer ZT, et al. (2009) Antioxidant and oncogene rescue of metabolic defects causedby loss of matrix attachment. Nature 461(7260):109–113.
32. Harris IS, et al. (2015) Glutathione and thioredoxin antioxidant pathways synergize todrive cancer initiation and progression. Cancer Cell 27(2):211–222.
33. Cocco P (1987) Does G6PD deficiency protect against cancer? A critical review.J Epidemiol Community Health 41(2):89–93.
34. Dang L, Jin S, Su SM (2010) IDH mutations in glioma and acute myeloid leukemia.Trends Mol Med 16(9):387–397.
35. DeBerardinis RJ, et al. (2007) Beyond aerobic glycolysis: Transformed cells can engagein glutamine metabolism that exceeds the requirement for protein and nucleotidesynthesis. Proc Natl Acad Sci USA 104(49):19345–19350.
36. UKCCCR (1998) United Kingdom Co-ordinating Committee on Cancer Research(UKCCCR) guidelines for the welfare of animals in experimental neoplasia (SecondEdition). Br J Cancer 77(1):1–10.
37. Trapnell C, et al. (2010) Transcript assembly and quantification by RNA-Seq revealsunannotated transcripts and isoform switching during cell differentiation. NatBiotechnol 28(5):511–515.
38. Ng IO, Lai EC, Fan ST, Ng MM, So MK (1995) Prognostic significance of pathologicfeatures of hepatocellular carcinoma. A multivariate analysis of 278 patients. Cancer76(12):2443–2448.
39. Wong CC, et al. (2014) Lysyl oxidase-like 2 is critical to tumor microenvironmentand metastatic niche formation in hepatocellular carcinoma. Hepatology 60(5):1645–1658.
E734 | www.pnas.org/cgi/doi/10.1073/pnas.1508779113 Xu et al.