Translating Cognos PowerPlay Transformer Relative Date Functionality into SQL Server Analysis Services (SSAS) David M. Greenberg Applied Business Intelligence June 2007 The SQL Server 2005 business intelligence platform represents a giant leap forward in technology and functionality over products offered by competitors like Cognos and Business Objects. While Microsoft‟s overall package is a clear winner, there is still some functionality available in Cognos applications that work better. As a long time developer of Cognos PowerPlay cube applications, I‟ve found the ability to create and use relative dates in reports to be one of the most useful functions available in the Cognos toolset. Almost all companies have the need to look at how some aspects of their business perform over time. When a company looks at its sales performance during a particular month, quarter or year, it is almost always viewed in terms of how that performance compares with some prior period. This provides managers with the ability to understand trends and whether the company‟s business is increasing or decreasing with regard to a particular division, product or customer. Relative date categories are often used in the creation of flash reports that show the performance of some business process over various time periods. For example, managers may want to see Shipments by customer by product on the rows. On the columns, they may want to see various relative date calculations like Yesterday, Week to date, Month to date, Year to date etc. While Cognos offers a very simple yet powerful method to easily add relative date functionality, the SQL Server Analysis Services (SSAS) method is somewhat more complex and less functional.
Transcript
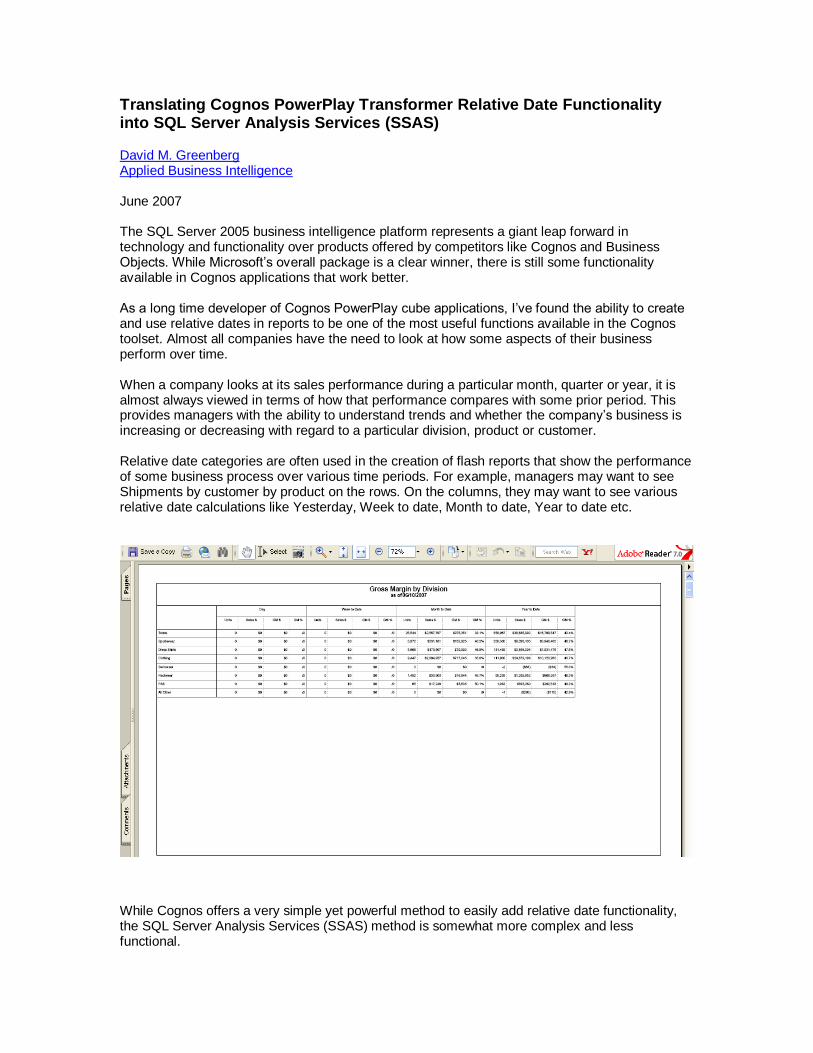
Translating Cognos PowerPlay Transformer Relative Date Functionality into SQL Server Analysis Services (SSAS) David M. Greenberg Applied Business Intelligence June 2007 The SQL Server 2005 business intelligence platform represents a giant leap forward in technology and functionality over products offered by competitors like Cognos and Business Objects. While Microsoft‟s overall package is a clear winner, there is still some functionality available in Cognos applications that work better. As a long time developer of Cognos PowerPlay cube applications, I‟ve found the ability to create and use relative dates in reports to be one of the most useful functions available in the Cognos toolset. Almost all companies have the need to look at how some aspects of their business perform over time. When a company looks at its sales performance during a particular month, quarter or year, it is almost always viewed in terms of how that performance compares with some prior period. This provides managers with the ability to understand trends and whether the company‟s business is increasing or decreasing with regard to a particular division, product or customer. Relative date categories are often used in the creation of flash reports that show the performance of some business process over various time periods. For example, managers may want to see Shipments by customer by product on the rows. On the columns, they may want to see various relative date calculations like Yesterday, Week to date, Month to date, Year to date etc.
While Cognos offers a very simple yet powerful method to easily add relative date functionality, the SQL Server Analysis Services (SSAS) method is somewhat more complex and less functional.
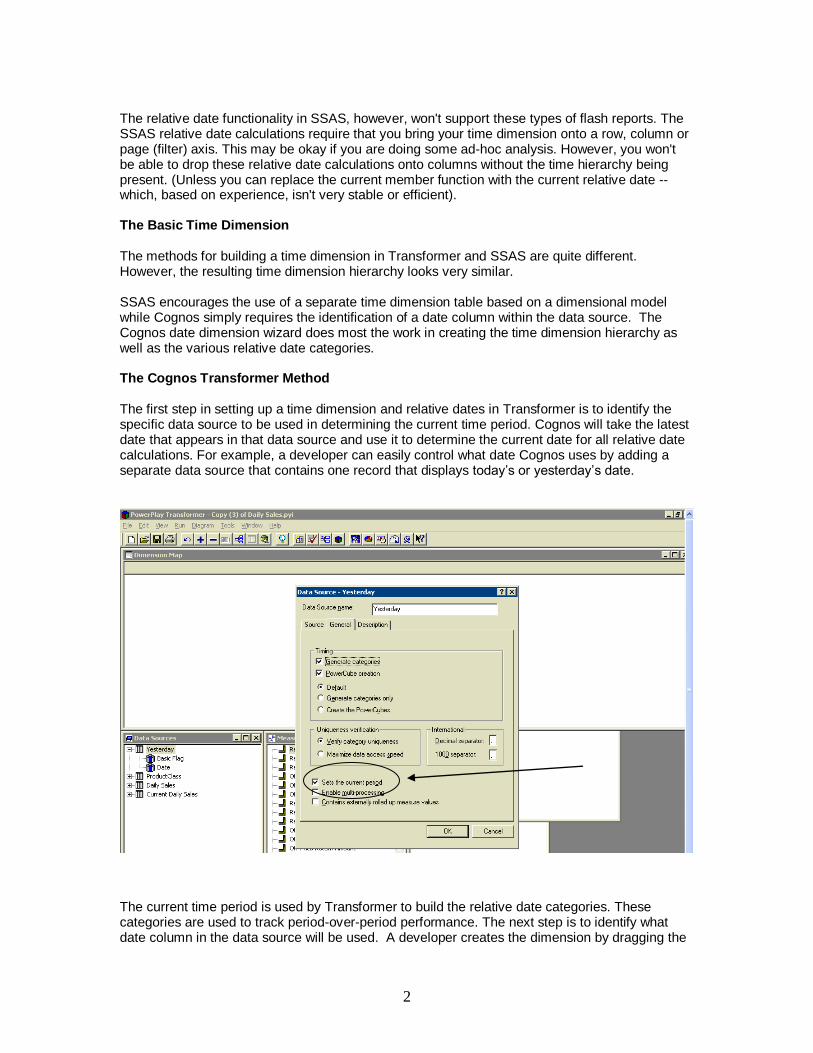
The relative date functionality in SSAS, however, won't support these types of flash reports. The SSAS relative date calculations require that you bring your time dimension onto a row, column or page (filter) axis. This may be okay if you are doing some ad-hoc analysis. However, you won't be able to drop these relative date calculations onto columns without the time hierarchy being present. (Unless you can replace the current member function with the current relative date -- which, based on experience, isn't very stable or efficient). The Basic Time Dimension The methods for building a time dimension in Transformer and SSAS are quite different. However, the resulting time dimension hierarchy looks very similar. SSAS encourages the use of a separate time dimension table based on a dimensional model while Cognos simply requires the identification of a date column within the data source. The Cognos date dimension wizard does most the work in creating the time dimension hierarchy as well as the various relative date categories. The Cognos Transformer Method The first step in setting up a time dimension and relative dates in Transformer is to identify the specific data source to be used in determining the current time period. Cognos will take the latest date that appears in that data source and use it to determine the current date for all relative date calculations. For example, a developer can easily control what date Cognos uses by adding a separate data source that contains one record that displays today‟s or yesterday‟s date.
The current time period is used by Transformer to build the relative date categories. These categories are used to track period-over-period performance. The next step is to identify what date column in the data source will be used. A developer creates the dimension by dragging the
3
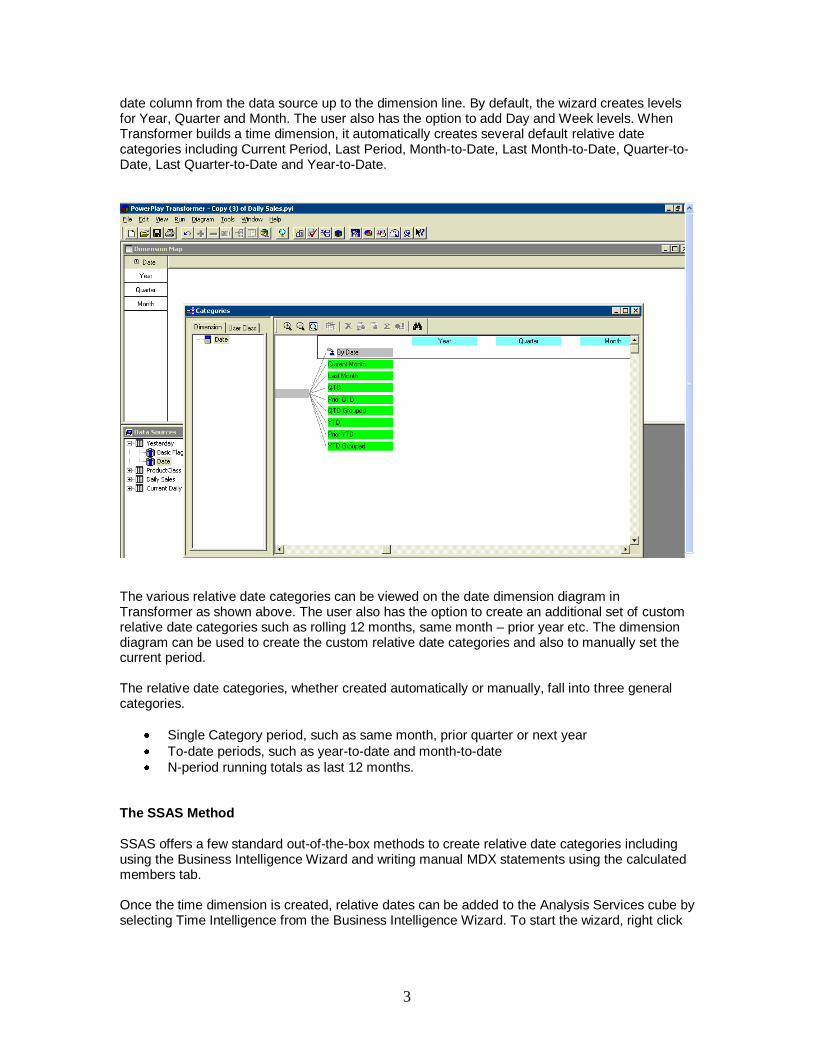
date column from the data source up to the dimension line. By default, the wizard creates levels for Year, Quarter and Month. The user also has the option to add Day and Week levels. When Transformer builds a time dimension, it automatically creates several default relative date categories including Current Period, Last Period, Month-to-Date, Last Month-to-Date, Quarter-to-Date, Last Quarter-to-Date and Year-to-Date.
The various relative date categories can be viewed on the date dimension diagram in Transformer as shown above. The user also has the option to create an additional set of custom relative date categories such as rolling 12 months, same month – prior year etc. The dimension diagram can be used to create the custom relative date categories and also to manually set the current period. The relative date categories, whether created automatically or manually, fall into three general categories.
Single Category period, such as same month, prior quarter or next year
To-date periods, such as year-to-date and month-to-date
N-period running totals as last 12 months. The SSAS Method SSAS offers a few standard out-of-the-box methods to create relative date categories including using the Business Intelligence Wizard and writing manual MDX statements using the calculated members tab. Once the time dimension is created, relative dates can be added to the Analysis Services cube by selecting Time Intelligence from the Business Intelligence Wizard. To start the wizard, right click
4
on the cube in solution explorer and choose “Add Business Intelligence” This launches the Business Intelligence Wizard.
Step through the wizard and select “Define Time Intelligence”.
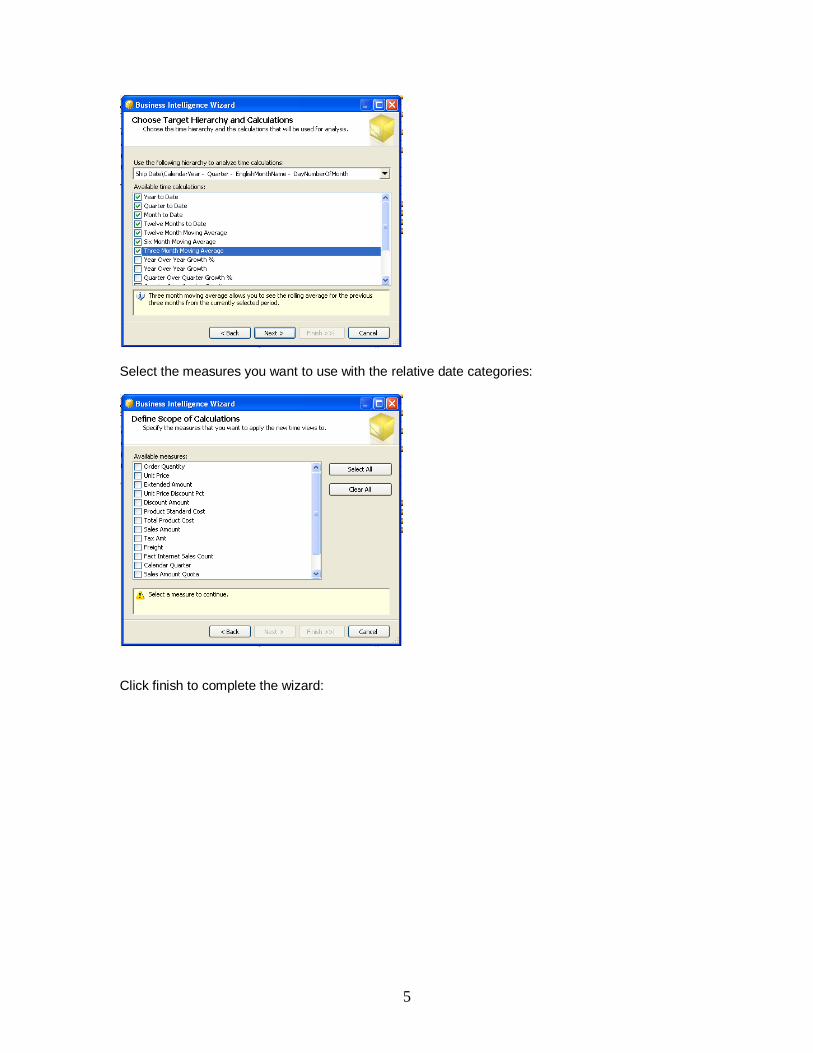
The next step is to identify the time hierarchy to use and to choose the specific relative date categories that you want to appear.
5
Select the measures you want to use with the relative date categories:
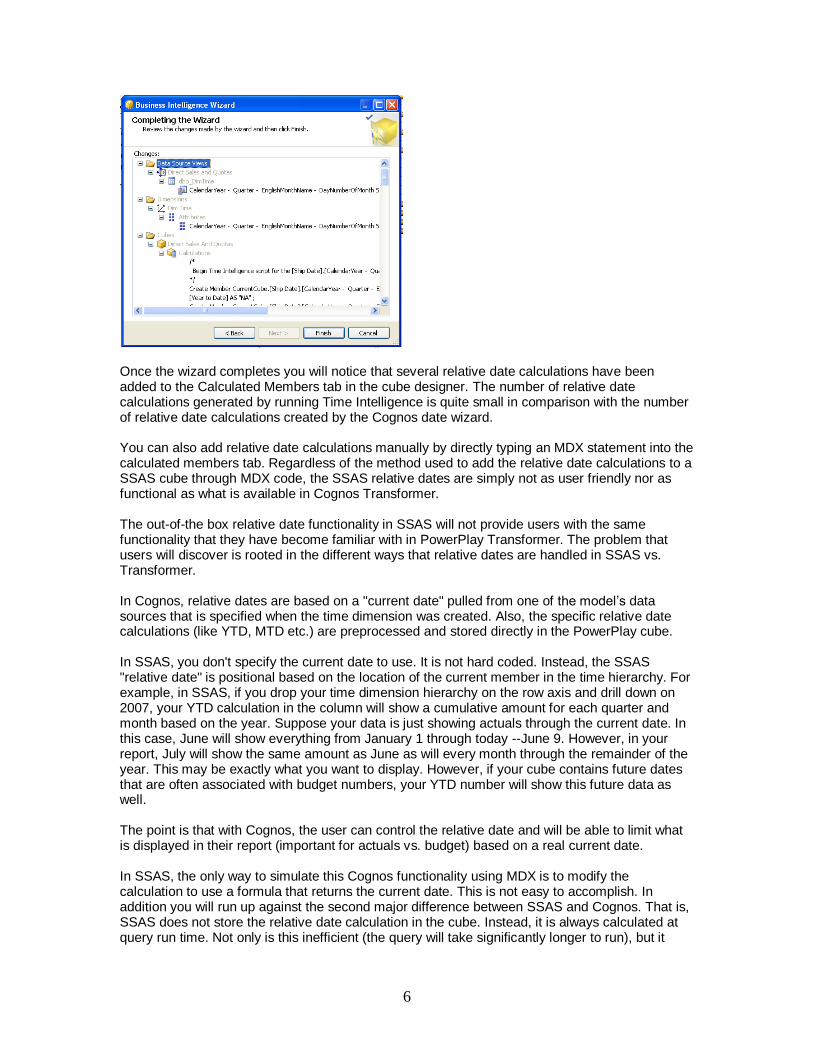
Click finish to complete the wizard:
6
Once the wizard completes you will notice that several relative date calculations have been added to the Calculated Members tab in the cube designer. The number of relative date calculations generated by running Time Intelligence is quite small in comparison with the number of relative date calculations created by the Cognos date wizard. You can also add relative date calculations manually by directly typing an MDX statement into the calculated members tab. Regardless of the method used to add the relative date calculations to a SSAS cube through MDX code, the SSAS relative dates are simply not as user friendly nor as functional as what is available in Cognos Transformer. The out-of-the box relative date functionality in SSAS will not provide users with the same functionality that they have become familiar with in PowerPlay Transformer. The problem that users will discover is rooted in the different ways that relative dates are handled in SSAS vs. Transformer. In Cognos, relative dates are based on a "current date" pulled from one of the model‟s data sources that is specified when the time dimension was created. Also, the specific relative date calculations (like YTD, MTD etc.) are preprocessed and stored directly in the PowerPlay cube. In SSAS, you don't specify the current date to use. It is not hard coded. Instead, the SSAS "relative date" is positional based on the location of the current member in the time hierarchy. For example, in SSAS, if you drop your time dimension hierarchy on the row axis and drill down on 2007, your YTD calculation in the column will show a cumulative amount for each quarter and month based on the year. Suppose your data is just showing actuals through the current date. In this case, June will show everything from January 1 through today --June 9. However, in your report, July will show the same amount as June as will every month through the remainder of the year. This may be exactly what you want to display. However, if your cube contains future dates that are often associated with budget numbers, your YTD number will show this future data as well. The point is that with Cognos, the user can control the relative date and will be able to limit what is displayed in their report (important for actuals vs. budget) based on a real current date. In SSAS, the only way to simulate this Cognos functionality using MDX is to modify the calculation to use a formula that returns the current date. This is not easy to accomplish. In addition you will run up against the second major difference between SSAS and Cognos. That is, SSAS does not store the relative date calculation in the cube. Instead, it is always calculated at query run time. Not only is this inefficient (the query will take significantly longer to run), but it
7
probably won't work very well as evidenced by my experience using various clients including Excel 2007 and Cognos PowerPlay client 7.4 MR1. The following calculation is an example of a Year-to-date MDX statement that computes the year-to-date value based on the beginning of the year through the current date. Sum(
YTD(
StrToMember (
"[Date].[Calendar Hierarchy].[Calendar Year].&["
+ VBA!Format (VBA!Now(), "yyyy-mm-ddT00:00:00")
+ "]"
)
)
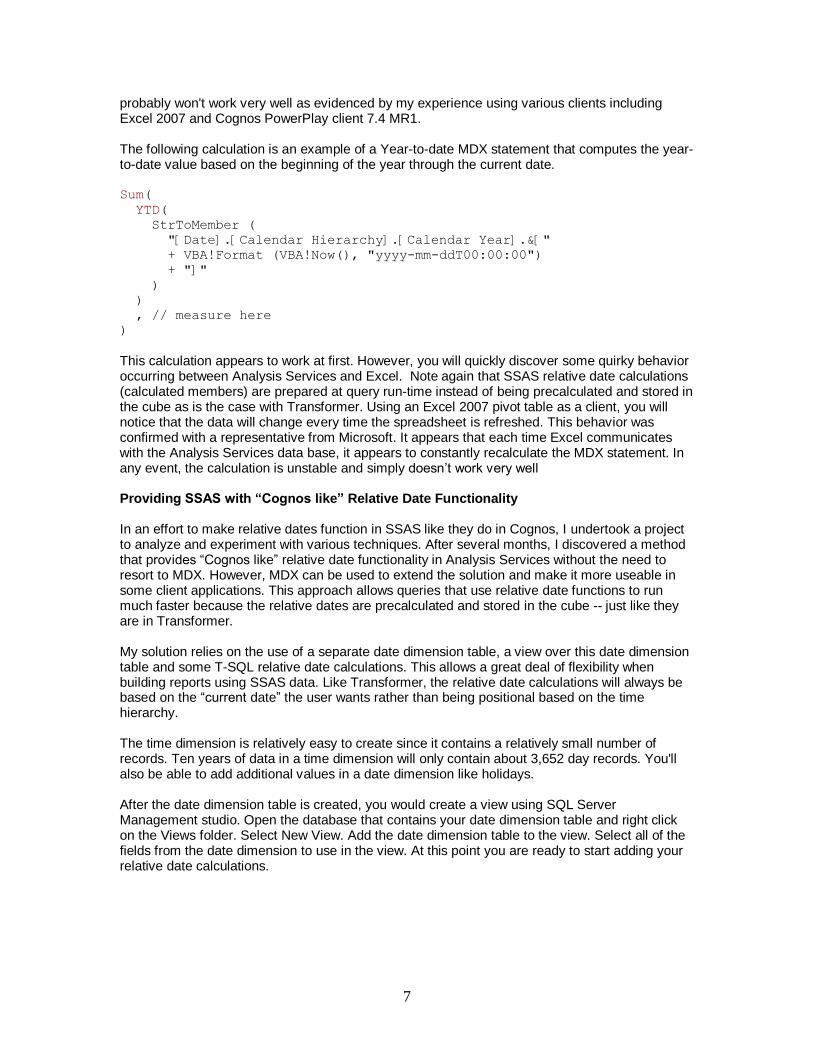
, // measure here ) This calculation appears to work at first. However, you will quickly discover some quirky behavior occurring between Analysis Services and Excel. Note again that SSAS relative date calculations (calculated members) are prepared at query run-time instead of being precalculated and stored in the cube as is the case with Transformer. Using an Excel 2007 pivot table as a client, you will notice that the data will change every time the spreadsheet is refreshed. This behavior was confirmed with a representative from Microsoft. It appears that each time Excel communicates with the Analysis Services data base, it appears to constantly recalculate the MDX statement. In any event, the calculation is unstable and simply doesn‟t work very well Providing SSAS with “Cognos like” Relative Date Functionality In an effort to make relative dates function in SSAS like they do in Cognos, I undertook a project to analyze and experiment with various techniques. After several months, I discovered a method that provides “Cognos like” relative date functionality in Analysis Services without the need to resort to MDX. However, MDX can be used to extend the solution and make it more useable in some client applications. This approach allows queries that use relative date functions to run much faster because the relative dates are precalculated and stored in the cube -- just like they are in Transformer. My solution relies on the use of a separate date dimension table, a view over this date dimension table and some T-SQL relative date calculations. This allows a great deal of flexibility when building reports using SSAS data. Like Transformer, the relative date calculations will always be based on the “current date” the user wants rather than being positional based on the time hierarchy. The time dimension is relatively easy to create since it contains a relatively small number of records. Ten years of data in a time dimension will only contain about 3,652 day records. You'll also be able to add additional values in a date dimension like holidays. After the date dimension table is created, you would create a view using SQL Server Management studio. Open the database that contains your date dimension table and right click on the Views folder. Select New View. Add the date dimension table to the view. Select all of the fields from the date dimension to use in the view. At this point you are ready to start adding your relative date calculations.
8
For each relative date calculation, determine the period that you are trying to capture and type in the appropriate SQL statement into the view. The general format of each statement will examine the Date column in each row and determine if it falls within the stated range of dates pertaining to that particular relative date calculation. In the Year to date calculation, for example, dates falling within the period will be tagged with „YTD‟ while dates falling out of the range will be tagged with „N‟. Please refer to the Appendix for a comprehensive list of common SQL based relative date calculations that can be added to the date view. Once these relative date calculations have been added to the date view, you can add this view to the data source view in Analysis Services. If the date view is already in existence, you‟ll need to refresh your data source view in SSAS to expose the new columns before you can add them to your date dimension. To do this, highlight the data source view in Solution Explorer and select “Data Source View” and “Refresh” from the SSAS menu. Double click the date dimension in Solution Explorer. You should see the new relative date calculations in the Data Source View pane. Drag the relative date calculations from the data source view to the Attributes pane. After this, you‟ll need to reprocess your cube in order to make the relative date calculations available for reporting. When building reports, you‟ll notice that each calculation‟s attribute hierarchy will contain a top level name (such as „YTD‟). When you drill down on this hierarchy, you‟ll see an „N‟ as well as the
9
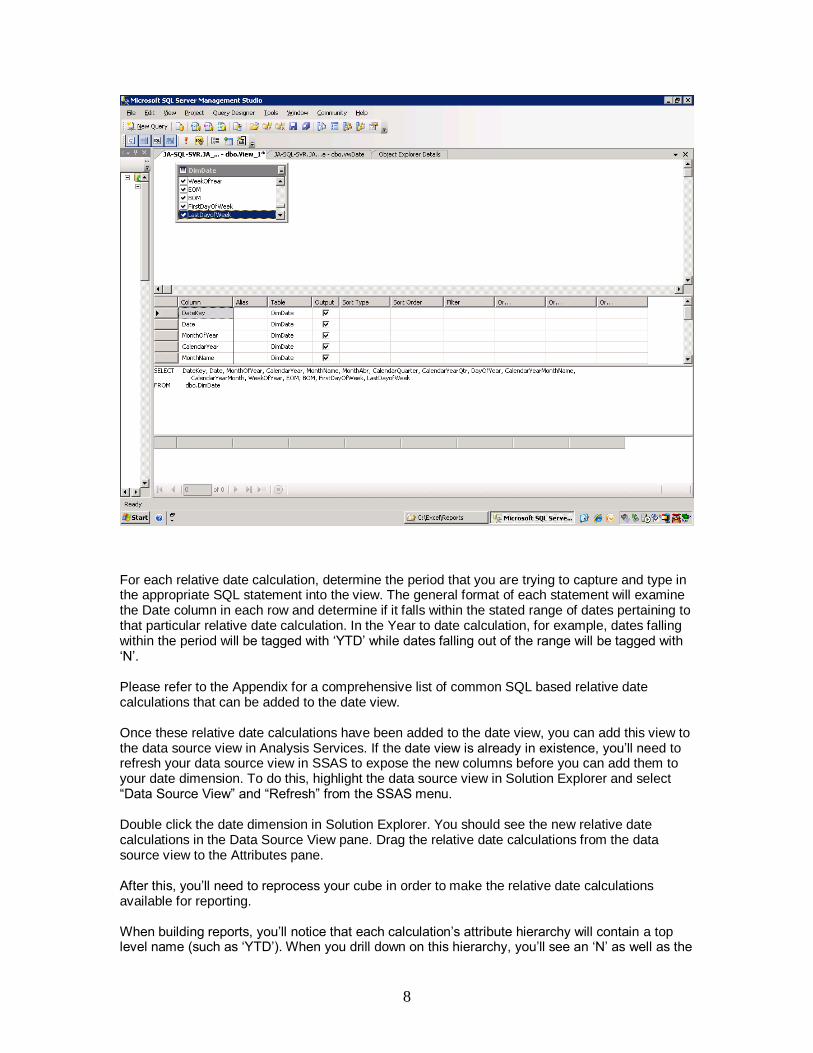
name of the calculation itself (for example „YTD‟). Make sure that you drill down and only add the name below the attribute. Otherwise, your results will show the value of „N‟ which sums all the records that fall outside of the relative date‟s range. While it appears to be a bit kludgy, it works very well – and it‟s fast. These relative date calculations can be used with all measures that are associated with the date dimension in the SSAS cube
Using Relative Date Shell Dimensions Depending on the front-end client that you use to write your SSAS reports, you may want to extend the functionality by adding several relative date calculations to one or more relative date shell dimensions. These shell dimensions are containers that can hold a group of relative dates and expose them to front-end clients as one hierarchy. To understand all about time shell dimensions and their purpose in SSAS, please refer to some excellent articles available on the Internet authored by Bill Pearson (Introduction to MSSQL Server Analysis Services: Mastering Enterprise BI: Relative Time Periods in an Analysis Services Cube, Part II) and David Shroyer (A Different Approach to Implementing Time Calculations in SSAS). In Transformer, only dimension attributes that have been added to a dimension hierarchy can be used in a cube. In SSAS, all attributes in a dimension table can be made available in the cube, regardless of whether they exist within a typical user defined dimension hierarchy. Single attributes in a SSAS dimension, including the relative dates that we created previously in our date dimension, form their own attribute hierarchies. In many instances, you may want to see multiple relative date calculations as columns in a single report. Depending on the front-end client used,
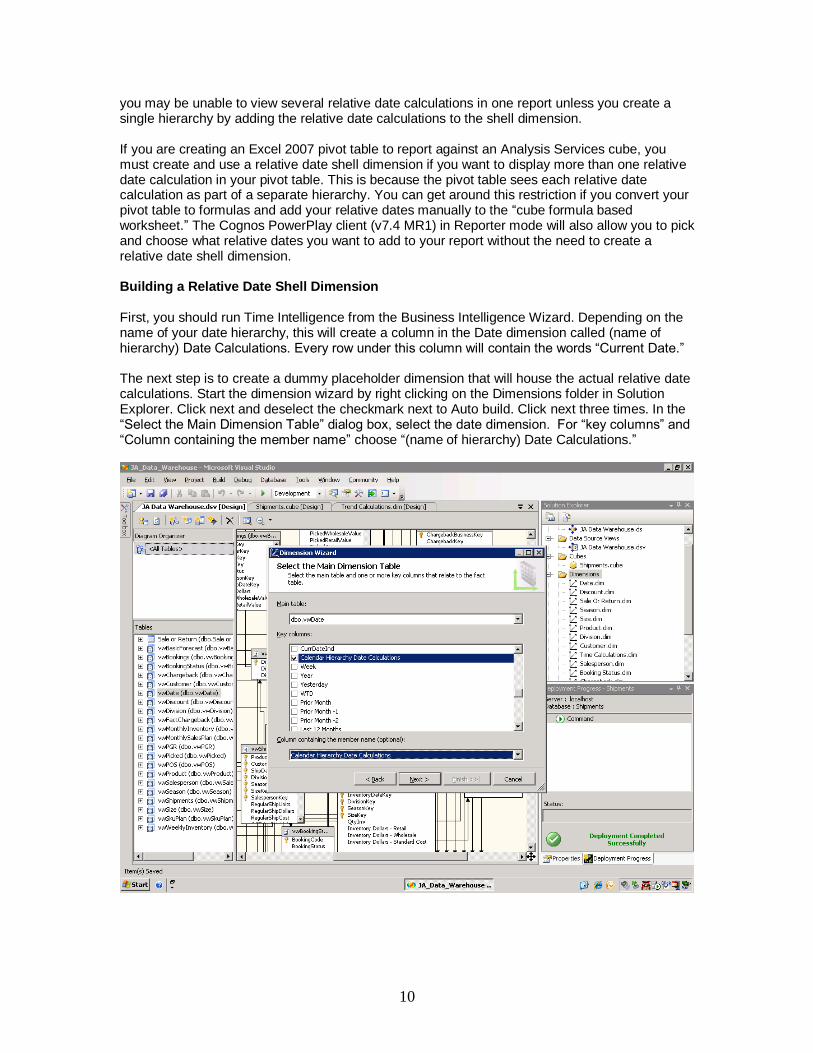
you may be unable to view several relative date calculations in one report unless you create a single hierarchy by adding the relative date calculations to the shell dimension. If you are creating an Excel 2007 pivot table to report against an Analysis Services cube, you must create and use a relative date shell dimension if you want to display more than one relative date calculation in your pivot table. This is because the pivot table sees each relative date calculation as part of a separate hierarchy. You can get around this restriction if you convert your pivot table to formulas and add your relative dates manually to the “cube formula based worksheet.” The Cognos PowerPlay client (v7.4 MR1) in Reporter mode will also allow you to pick and choose what relative dates you want to add to your report without the need to create a relative date shell dimension. Building a Relative Date Shell Dimension First, you should run Time Intelligence from the Business Intelligence Wizard. Depending on the name of your date hierarchy, this will create a column in the Date dimension called (name of hierarchy) Date Calculations. Every row under this column will contain the words “Current Date.” The next step is to create a dummy placeholder dimension that will house the actual relative date calculations. Start the dimension wizard by right clicking on the Dimensions folder in Solution Explorer. Click next and deselect the checkmark next to Auto build. Click next three times. In the “Select the Main Dimension Table” dialog box, select the date dimension. For “key columns” and “Column containing the member name” choose “(name of hierarchy) Date Calculations.”
11
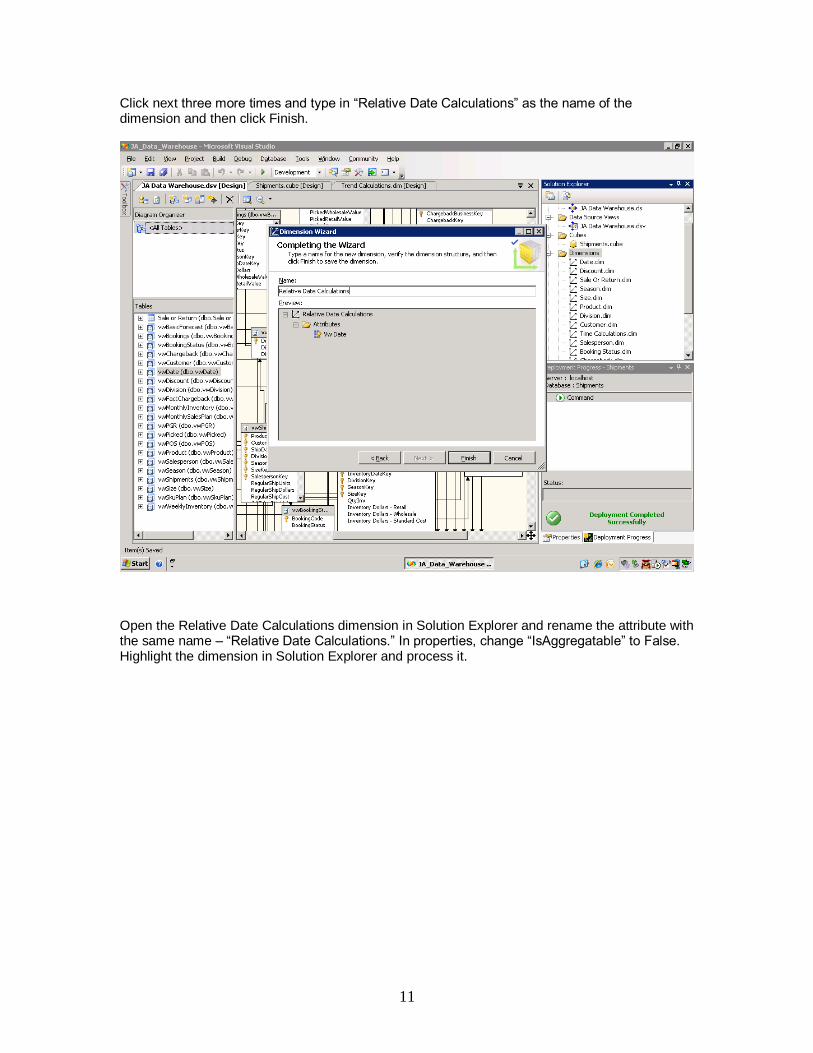
Click next three more times and type in “Relative Date Calculations” as the name of the dimension and then click Finish.
Open the Relative Date Calculations dimension in Solution Explorer and rename the attribute with the same name – “Relative Date Calculations.” In properties, change “IsAggregatable” to False. Highlight the dimension in Solution Explorer and process it.
12
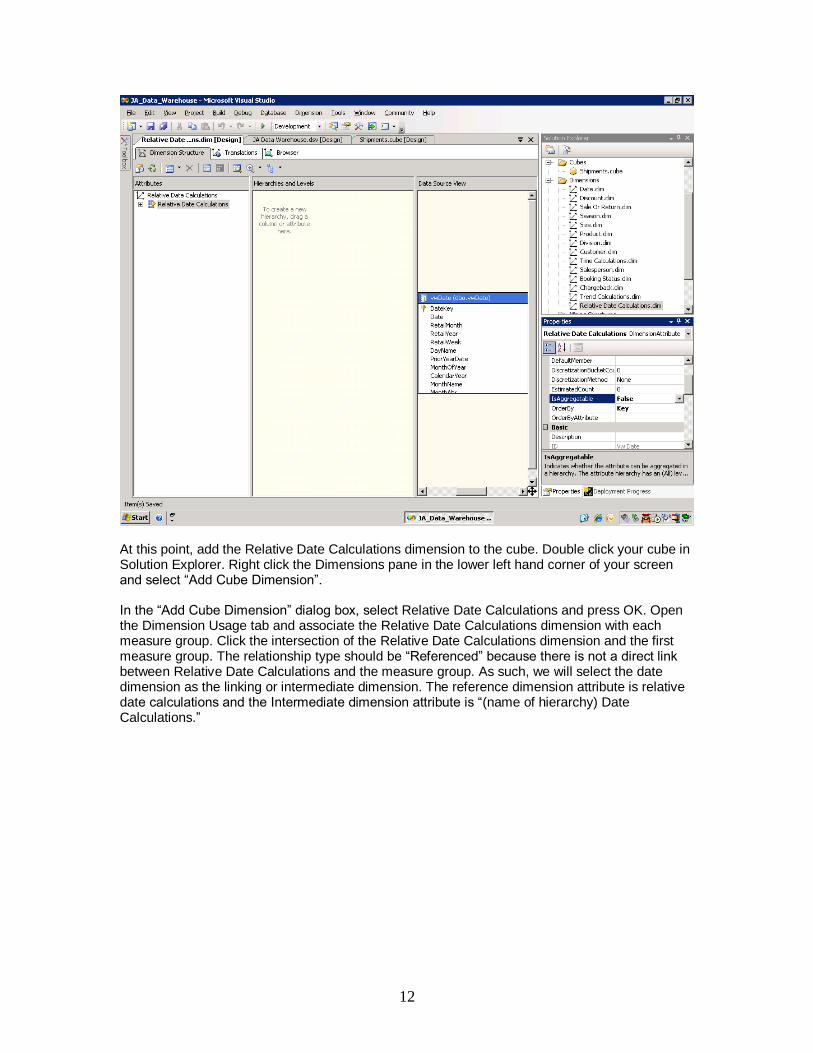
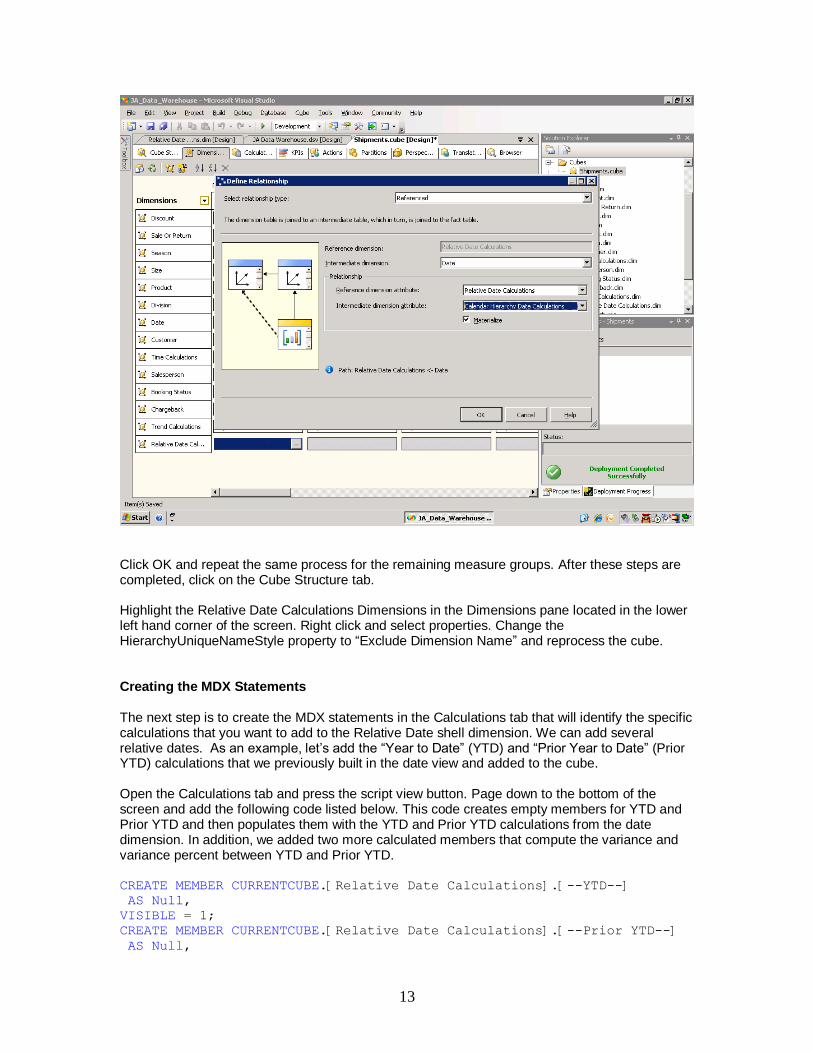
At this point, add the Relative Date Calculations dimension to the cube. Double click your cube in Solution Explorer. Right click the Dimensions pane in the lower left hand corner of your screen and select “Add Cube Dimension”. In the “Add Cube Dimension” dialog box, select Relative Date Calculations and press OK. Open the Dimension Usage tab and associate the Relative Date Calculations dimension with each measure group. Click the intersection of the Relative Date Calculations dimension and the first measure group. The relationship type should be “Referenced” because there is not a direct link between Relative Date Calculations and the measure group. As such, we will select the date dimension as the linking or intermediate dimension. The reference dimension attribute is relative date calculations and the Intermediate dimension attribute is “(name of hierarchy) Date Calculations.”
13
Click OK and repeat the same process for the remaining measure groups. After these steps are completed, click on the Cube Structure tab. Highlight the Relative Date Calculations Dimensions in the Dimensions pane located in the lower left hand corner of the screen. Right click and select properties. Change the HierarchyUniqueNameStyle property to “Exclude Dimension Name” and reprocess the cube. Creating the MDX Statements The next step is to create the MDX statements in the Calculations tab that will identify the specific calculations that you want to add to the Relative Date shell dimension. We can add several relative dates. As an example, let‟s add the “Year to Date” (YTD) and “Prior Year to Date” (Prior YTD) calculations that we previously built in the date view and added to the cube. Open the Calculations tab and press the script view button. Page down to the bottom of the screen and add the following code listed below. This code creates empty members for YTD and Prior YTD and then populates them with the YTD and Prior YTD calculations from the date dimension. In addition, we added two more calculated members that compute the variance and variance percent between YTD and Prior YTD. CREATE MEMBER CURRENTCUBE.[Relative Date Calculations].[--YTD--]
AS Null,
VISIBLE = 1;
CREATE MEMBER CURRENTCUBE.[Relative Date Calculations].[--Prior YTD--]
AS Null,
14
VISIBLE = 1;
-- YTD TREND CALCULATIONS
([Relative Date Calculations].[--YTD--]=
Aggregate(
([Date].[YTD].&[YTD])
* {[Relative Date Calculations].[Current Date]})
);
-- Prior YTD TREND CALCULATIONS
([Relative Date Calculations].[--Prior YTD--]=
Aggregate(
([Date].[Prior YTD].&[Prior YTD])
* {[Relative Date Calculations].[Current Date]})
);
CREATE MEMBER CURRENTCUBE.[ Relative Date Calculations].[--YTD $
Variance--]
AS [Relative Date Calculations].[--YTD--]-[Relative Date
Calculations].[--Prior YTD--],
FORMAT_STRING = "#,#;(#,#)",
VISIBLE = 1;
CREATE MEMBER CURRENTCUBE.[Relative Date Calculations].[--YTD %
Variance--]
AS ([Relative Date Calculations].[--YTD--]-[Relative Date
Calculations].[--Prior YTD--])/[Relative Date Calculations].[--Prior
YTD--],
FORMAT_STRING = "0.0%;(0.0%)",
VISIBLE = 1;
A Note about the Excel 2007 Client and using the Relative Date calculations Shell Dimension The relative date calculations shell dimension will allow you to add multiple relative date calculations to an Excel 2007 pivot table. Before the relative date calculations can be displayed in the pivot table, however, you need to change a setting under Pivot table options. First add the relative date calculations to the pivot table. Then, right click the pivot table, select pivot table options, click the Display tab and select “Show calculated members from OLAP Server.” When you add the Relative Date Calculations to the pivot table, you don‟t have the option of deselecting certain calculations from displaying in the report if you are using SQL Server 2005 SP2. The workaround for this is to hide the columns you don‟t want displayed. Another workaround is to create several customized relative date shell dimensions that contain specific subsets of relative dates rather than one all encompassing shell dimension.
APPENDIX SQL Relative Date Calculations Year to Date CASE WHEN Date BETWEEN DATEADD(yy, DATEDIFF(yy, 0, getdate()), 0) AND DATEADD(dd, - 1, GETDATE()) THEN 'YTD' ELSE 'N' END AS YTD Month to Date
15
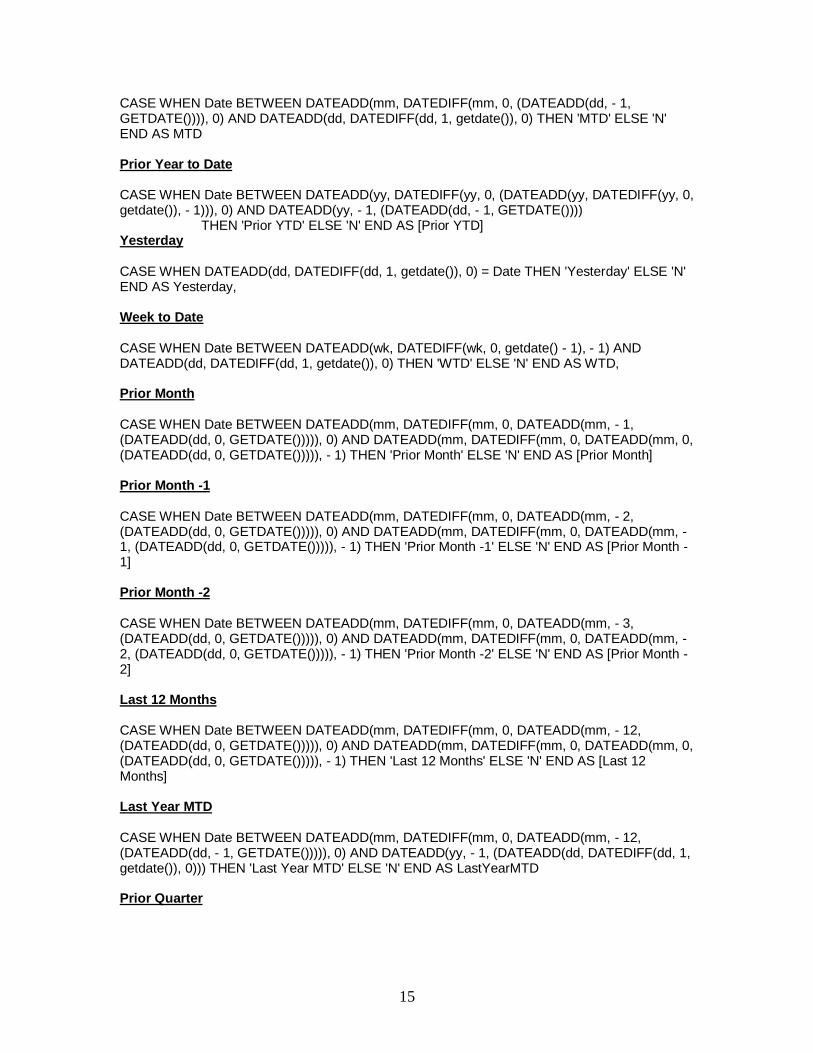
CASE WHEN Date BETWEEN DATEADD(mm, DATEDIFF(mm, 0, (DATEADD(dd, - 1, GETDATE()))), 0) AND DATEADD(dd, DATEDIFF(dd, 1, getdate()), 0) THEN 'MTD' ELSE 'N' END AS MTD Prior Year to Date CASE WHEN Date BETWEEN DATEADD(yy, DATEDIFF(yy, 0, (DATEADD(yy, DATEDIFF(yy, 0, getdate()), - 1))), 0) AND DATEADD(yy, - 1, (DATEADD(dd, - 1, GETDATE()))) THEN 'Prior YTD' ELSE 'N' END AS [Prior YTD] Yesterday CASE WHEN DATEADD(dd, DATEDIFF(dd, 1, getdate()), 0) = Date THEN 'Yesterday' ELSE 'N' END AS Yesterday, Week to Date CASE WHEN Date BETWEEN DATEADD(wk, DATEDIFF(wk, 0, getdate() - 1), - 1) AND DATEADD(dd, DATEDIFF(dd, 1, getdate()), 0) THEN 'WTD' ELSE 'N' END AS WTD, Prior Month CASE WHEN Date BETWEEN DATEADD(mm, DATEDIFF(mm, 0, DATEADD(mm, - 1, (DATEADD(dd, 0, GETDATE())))), 0) AND DATEADD(mm, DATEDIFF(mm, 0, DATEADD(mm, 0, (DATEADD(dd, 0, GETDATE())))), - 1) THEN 'Prior Month' ELSE 'N' END AS [Prior Month] Prior Month -1 CASE WHEN Date BETWEEN DATEADD(mm, DATEDIFF(mm, 0, DATEADD(mm, - 2, (DATEADD(dd, 0, GETDATE())))), 0) AND DATEADD(mm, DATEDIFF(mm, 0, DATEADD(mm, - 1, (DATEADD(dd, 0, GETDATE())))), - 1) THEN 'Prior Month -1' ELSE 'N' END AS [Prior Month -1] Prior Month -2 CASE WHEN Date BETWEEN DATEADD(mm, DATEDIFF(mm, 0, DATEADD(mm, - 3, (DATEADD(dd, 0, GETDATE())))), 0) AND DATEADD(mm, DATEDIFF(mm, 0, DATEADD(mm, - 2, (DATEADD(dd, 0, GETDATE())))), - 1) THEN 'Prior Month -2' ELSE 'N' END AS [Prior Month -2] Last 12 Months CASE WHEN Date BETWEEN DATEADD(mm, DATEDIFF(mm, 0, DATEADD(mm, - 12, (DATEADD(dd, 0, GETDATE())))), 0) AND DATEADD(mm, DATEDIFF(mm, 0, DATEADD(mm, 0, (DATEADD(dd, 0, GETDATE())))), - 1) THEN 'Last 12 Months' ELSE 'N' END AS [Last 12 Months] Last Year MTD CASE WHEN Date BETWEEN DATEADD(mm, DATEDIFF(mm, 0, DATEADD(mm, - 12, (DATEADD(dd, - 1, GETDATE())))), 0) AND DATEADD(yy, - 1, (DATEADD(dd, DATEDIFF(dd, 1, getdate()), 0))) THEN 'Last Year MTD' ELSE 'N' END AS LastYearMTD Prior Quarter
16
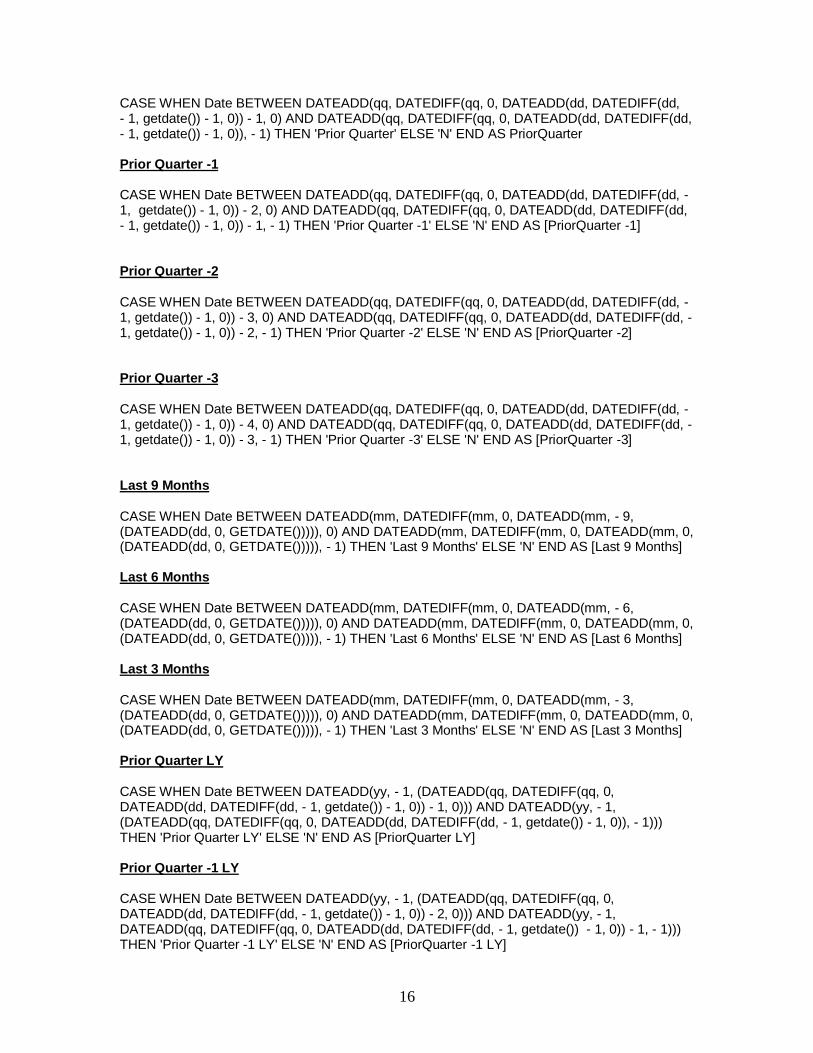
CASE WHEN Date BETWEEN DATEADD(qq, DATEDIFF(qq, 0, DATEADD(dd, DATEDIFF(dd, - 1, getdate()) - 1, 0)) - 1, 0) AND DATEADD(qq, DATEDIFF(qq, 0, DATEADD(dd, DATEDIFF(dd, - 1, getdate()) - 1, 0)), - 1) THEN 'Prior Quarter' ELSE 'N' END AS PriorQuarter Prior Quarter -1 CASE WHEN Date BETWEEN DATEADD(qq, DATEDIFF(qq, 0, DATEADD(dd, DATEDIFF(dd, - 1, getdate()) - 1, 0)) - 2, 0) AND DATEADD(qq, DATEDIFF(qq, 0, DATEADD(dd, DATEDIFF(dd, - 1, getdate()) - 1, 0)) - 1, - 1) THEN 'Prior Quarter -1' ELSE 'N' END AS [PriorQuarter -1] Prior Quarter -2 CASE WHEN Date BETWEEN DATEADD(qq, DATEDIFF(qq, 0, DATEADD(dd, DATEDIFF(dd, - 1, getdate()) - 1, 0)) - 3, 0) AND DATEADD(qq, DATEDIFF(qq, 0, DATEADD(dd, DATEDIFF(dd, - 1, getdate()) - 1, 0)) - 2, - 1) THEN 'Prior Quarter -2' ELSE 'N' END AS [PriorQuarter -2] Prior Quarter -3 CASE WHEN Date BETWEEN DATEADD(qq, DATEDIFF(qq, 0, DATEADD(dd, DATEDIFF(dd, - 1, getdate()) - 1, 0)) - 4, 0) AND DATEADD(qq, DATEDIFF(qq, 0, DATEADD(dd, DATEDIFF(dd, - 1, getdate()) - 1, 0)) - 3, - 1) THEN 'Prior Quarter -3' ELSE 'N' END AS [PriorQuarter -3] Last 9 Months CASE WHEN Date BETWEEN DATEADD(mm, DATEDIFF(mm, 0, DATEADD(mm, - 9, (DATEADD(dd, 0, GETDATE())))), 0) AND DATEADD(mm, DATEDIFF(mm, 0, DATEADD(mm, 0, (DATEADD(dd, 0, GETDATE())))), - 1) THEN 'Last 9 Months' ELSE 'N' END AS [Last 9 Months] Last 6 Months CASE WHEN Date BETWEEN DATEADD(mm, DATEDIFF(mm, 0, DATEADD(mm, - 6, (DATEADD(dd, 0, GETDATE())))), 0) AND DATEADD(mm, DATEDIFF(mm, 0, DATEADD(mm, 0, (DATEADD(dd, 0, GETDATE())))), - 1) THEN 'Last 6 Months' ELSE 'N' END AS [Last 6 Months] Last 3 Months CASE WHEN Date BETWEEN DATEADD(mm, DATEDIFF(mm, 0, DATEADD(mm, - 3, (DATEADD(dd, 0, GETDATE())))), 0) AND DATEADD(mm, DATEDIFF(mm, 0, DATEADD(mm, 0, (DATEADD(dd, 0, GETDATE())))), - 1) THEN 'Last 3 Months' ELSE 'N' END AS [Last 3 Months] Prior Quarter LY CASE WHEN Date BETWEEN DATEADD(yy, - 1, (DATEADD(qq, DATEDIFF(qq, 0, DATEADD(dd, DATEDIFF(dd, - 1, getdate()) - 1, 0)) - 1, 0))) AND DATEADD(yy, - 1, (DATEADD(qq, DATEDIFF(qq, 0, DATEADD(dd, DATEDIFF(dd, - 1, getdate()) - 1, 0)), - 1))) THEN 'Prior Quarter LY' ELSE 'N' END AS [PriorQuarter LY] Prior Quarter -1 LY CASE WHEN Date BETWEEN DATEADD(yy, - 1, (DATEADD(qq, DATEDIFF(qq, 0, DATEADD(dd, DATEDIFF(dd, - 1, getdate()) - 1, 0)) - 2, 0))) AND DATEADD(yy, - 1, DATEADD(qq, DATEDIFF(qq, 0, DATEADD(dd, DATEDIFF(dd, - 1, getdate()) - 1, 0)) - 1, - 1))) THEN 'Prior Quarter -1 LY' ELSE 'N' END AS [PriorQuarter -1 LY]
17
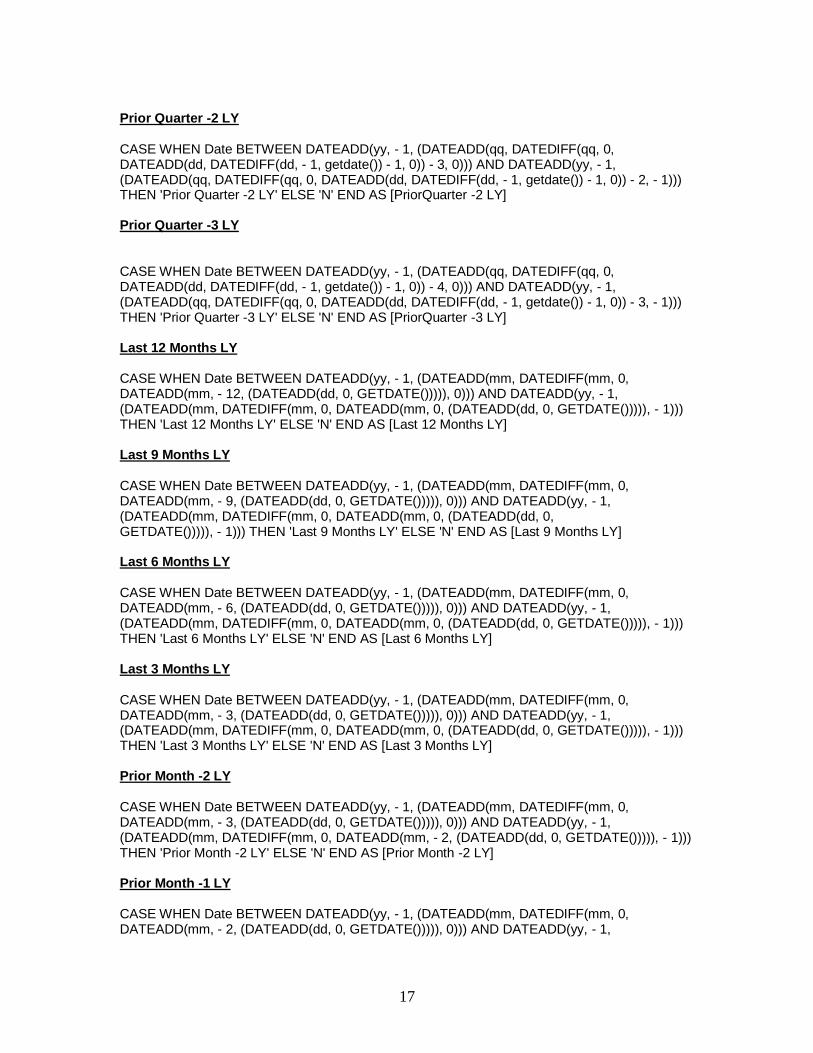
Prior Quarter -2 LY CASE WHEN Date BETWEEN DATEADD(yy, - 1, (DATEADD(qq, DATEDIFF(qq, 0, DATEADD(dd, DATEDIFF(dd, - 1, getdate()) - 1, 0)) - 3, 0))) AND DATEADD(yy, - 1, (DATEADD(qq, DATEDIFF(qq, 0, DATEADD(dd, DATEDIFF(dd, - 1, getdate()) - 1, 0)) - 2, - 1))) THEN 'Prior Quarter -2 LY' ELSE 'N' END AS [PriorQuarter -2 LY] Prior Quarter -3 LY CASE WHEN Date BETWEEN DATEADD(yy, - 1, (DATEADD(qq, DATEDIFF(qq, 0, DATEADD(dd, DATEDIFF(dd, - 1, getdate()) - 1, 0)) - 4, 0))) AND DATEADD(yy, - 1, (DATEADD(qq, DATEDIFF(qq, 0, DATEADD(dd, DATEDIFF(dd, - 1, getdate()) - 1, 0)) - 3, - 1))) THEN 'Prior Quarter -3 LY' ELSE 'N' END AS [PriorQuarter -3 LY] Last 12 Months LY CASE WHEN Date BETWEEN DATEADD(yy, - 1, (DATEADD(mm, DATEDIFF(mm, 0, DATEADD(mm, - 12, (DATEADD(dd, 0, GETDATE())))), 0))) AND DATEADD(yy, - 1, (DATEADD(mm, DATEDIFF(mm, 0, DATEADD(mm, 0, (DATEADD(dd, 0, GETDATE())))), - 1))) THEN 'Last 12 Months LY' ELSE 'N' END AS [Last 12 Months LY] Last 9 Months LY CASE WHEN Date BETWEEN DATEADD(yy, - 1, (DATEADD(mm, DATEDIFF(mm, 0, DATEADD(mm, - 9, (DATEADD(dd, 0, GETDATE())))), 0))) AND DATEADD(yy, - 1, (DATEADD(mm, DATEDIFF(mm, 0, DATEADD(mm, 0, (DATEADD(dd, 0, GETDATE())))), - 1))) THEN 'Last 9 Months LY' ELSE 'N' END AS [Last 9 Months LY] Last 6 Months LY CASE WHEN Date BETWEEN DATEADD(yy, - 1, (DATEADD(mm, DATEDIFF(mm, 0, DATEADD(mm, - 6, (DATEADD(dd, 0, GETDATE())))), 0))) AND DATEADD(yy, - 1, (DATEADD(mm, DATEDIFF(mm, 0, DATEADD(mm, 0, (DATEADD(dd, 0, GETDATE())))), - 1))) THEN 'Last 6 Months LY' ELSE 'N' END AS [Last 6 Months LY] Last 3 Months LY CASE WHEN Date BETWEEN DATEADD(yy, - 1, (DATEADD(mm, DATEDIFF(mm, 0, DATEADD(mm, - 3, (DATEADD(dd, 0, GETDATE())))), 0))) AND DATEADD(yy, - 1, (DATEADD(mm, DATEDIFF(mm, 0, DATEADD(mm, 0, (DATEADD(dd, 0, GETDATE())))), - 1))) THEN 'Last 3 Months LY' ELSE 'N' END AS [Last 3 Months LY] Prior Month -2 LY CASE WHEN Date BETWEEN DATEADD(yy, - 1, (DATEADD(mm, DATEDIFF(mm, 0, DATEADD(mm, - 3, (DATEADD(dd, 0, GETDATE())))), 0))) AND DATEADD(yy, - 1, (DATEADD(mm, DATEDIFF(mm, 0, DATEADD(mm, - 2, (DATEADD(dd, 0, GETDATE())))), - 1))) THEN 'Prior Month -2 LY' ELSE 'N' END AS [Prior Month -2 LY] Prior Month -1 LY CASE WHEN Date BETWEEN DATEADD(yy, - 1, (DATEADD(mm, DATEDIFF(mm, 0, DATEADD(mm, - 2, (DATEADD(dd, 0, GETDATE())))), 0))) AND DATEADD(yy, - 1,
18
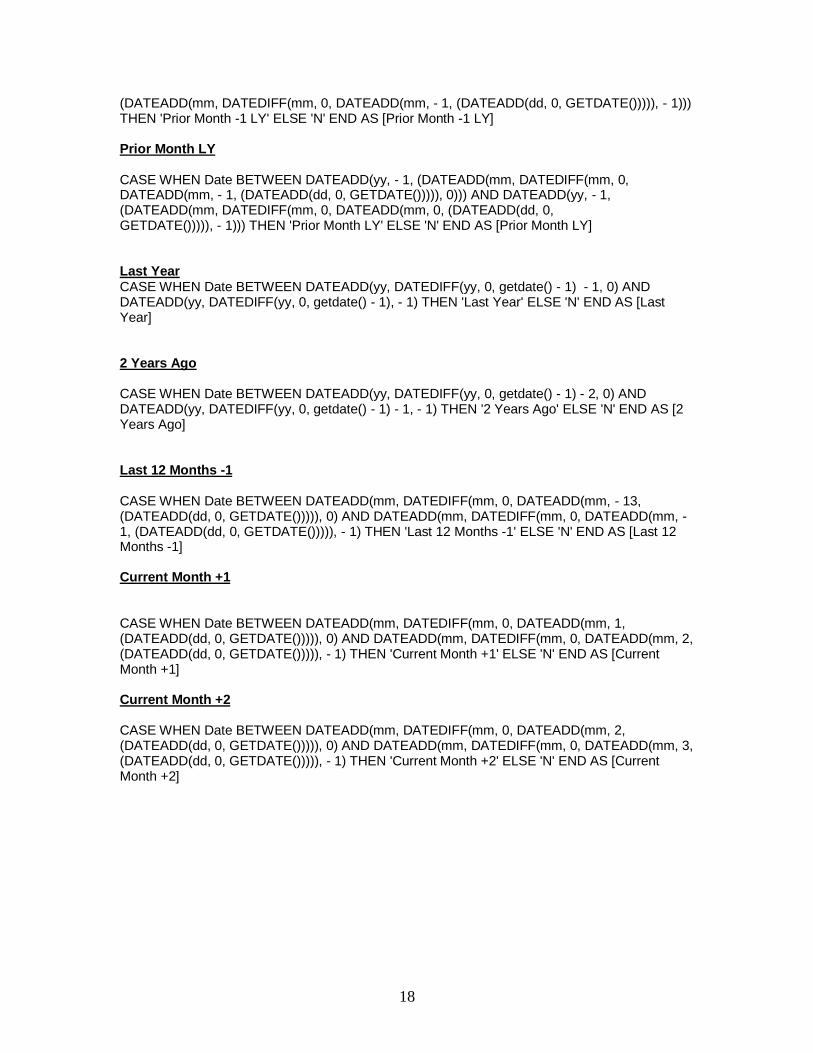
(DATEADD(mm, DATEDIFF(mm, 0, DATEADD(mm, - 1, (DATEADD(dd, 0, GETDATE())))), - 1))) THEN 'Prior Month -1 LY' ELSE 'N' END AS [Prior Month -1 LY] Prior Month LY CASE WHEN Date BETWEEN DATEADD(yy, - 1, (DATEADD(mm, DATEDIFF(mm, 0, DATEADD(mm, - 1, (DATEADD(dd, 0, GETDATE())))), 0))) AND DATEADD(yy, - 1, (DATEADD(mm, DATEDIFF(mm, 0, DATEADD(mm, 0, (DATEADD(dd, 0, GETDATE())))), - 1))) THEN 'Prior Month LY' ELSE 'N' END AS [Prior Month LY] Last Year CASE WHEN Date BETWEEN DATEADD(yy, DATEDIFF(yy, 0, getdate() - 1) - 1, 0) AND DATEADD(yy, DATEDIFF(yy, 0, getdate() - 1), - 1) THEN 'Last Year' ELSE 'N' END AS [Last Year] 2 Years Ago CASE WHEN Date BETWEEN DATEADD(yy, DATEDIFF(yy, 0, getdate() - 1) - 2, 0) AND DATEADD(yy, DATEDIFF(yy, 0, getdate() - 1) - 1, - 1) THEN '2 Years Ago' ELSE 'N' END AS [2 Years Ago] Last 12 Months -1 CASE WHEN Date BETWEEN DATEADD(mm, DATEDIFF(mm, 0, DATEADD(mm, - 13, (DATEADD(dd, 0, GETDATE())))), 0) AND DATEADD(mm, DATEDIFF(mm, 0, DATEADD(mm, - 1, (DATEADD(dd, 0, GETDATE())))), - 1) THEN 'Last 12 Months -1' ELSE 'N' END AS [Last 12 Months -1] Current Month +1 CASE WHEN Date BETWEEN DATEADD(mm, DATEDIFF(mm, 0, DATEADD(mm, 1, (DATEADD(dd, 0, GETDATE())))), 0) AND DATEADD(mm, DATEDIFF(mm, 0, DATEADD(mm, 2, (DATEADD(dd, 0, GETDATE())))), - 1) THEN 'Current Month +1' ELSE 'N' END AS [Current Month +1] Current Month +2 CASE WHEN Date BETWEEN DATEADD(mm, DATEDIFF(mm, 0, DATEADD(mm, 2, (DATEADD(dd, 0, GETDATE())))), 0) AND DATEADD(mm, DATEDIFF(mm, 0, DATEADD(mm, 3, (DATEADD(dd, 0, GETDATE())))), - 1) THEN 'Current Month +2' ELSE 'N' END AS [Current Month +2]