72
20 10 - 20 19 Revision 1 Transmission Development Plan
| Date post: | 18-Aug-2018 |
| Category: |
Documents |
| Upload: | nguyenminh |
| View: | 233 times |
| Download: | 6 times |

2010-2019Revision 1
Transmission Development Plan

Transmission Development Plan Transmission Development Plan
Eskom Transmission DivisionMegawatt Park Maxwell Drive Sunninghill Sandton
PO Box 1091 Johannesburg 2000 SAwww.eskom.co.za
Transmission Development Plan 2010 - 2019Transmission Development Plan
Foreword by Managing Directors
The Electricity Supply Industry’s value chain consists of generators of electricity, the transmission network (or “electricity delivery “highway”) and the distribution network to the end users of electricity. The Transmission network, much like road highways, needs to be kept in good condition and sized correctly to ensure there are no blockages and that it supports economic growth.
The National Energy Regulator of South Africa (NERSA), through the Grid Code, has published a set of criteria according to which the investments in the Transmission network must be made. Eskom, as the licensed Transmission Network Service Provider, develops plans according to this Code and once the funding is approved through the regulatory tariff, builds the network according to these plans. These plans do take into account resource and funding constraints while trying to meet the reliability criteria as soon as possible.
The Transmission Development Plan (TDP) for the period 2010 to 2019 is the second such plan that is being published in the public domain. It follows on the first plan published in 2009. The major focus of the plans continues to be to ensure that the new power stations are integrated into the national power system and that there is a minimum infrastructure to meet prescribed reliability criteria. Funding constraints mean that the time it will take to meet the full requirements of the Grid Code could be as late as 2019.
The 2010 TDP will be the first plan presented to a Public stakeholder forum following on the first ever publication of the 2009 TDP for public comment.
We estimate that, in nominal terms, an investment of R87.3 billion is needed in the period 2011 to 2015 and this will increase to R175 billion in nominal terms to the end of the financial year 2020. The expansion related component over this period is approximately R145 billion. These are significant investments on their own if one compares them to transport and water projects. These investments already consider constraints in funding and resource availability as ideally they would have been accelerated. These investments will result in the reliability standards only being completely met in the period 2015 to 2020.
It is clear that the electricity supply industry of South Africa is a key enabler for economic growth and that there is a need for the country to understand what is required to ensure a reliable and secure supply and what investment levels are required. We hope that this document will assist in this dialogue, and we welcome comments and queries on content and format.
We would also like to take this opportunity to thank the team that has worked and continues to work on the development of these plans. It is a difficult and complex process, requiring extensive consultation and multiple iterations.
Kind regardsMongezi Ntsokolo and Kannan Lakmeeharan
Mongezi NtsokoloManaging Director(Transmission Division)
far left:Kannan LakmeeharanManaging Director(System Operations & Planning Division)
i
Transmission Development Plan Transmission Development Plan
Disclaimer The purpose of publishing the Transmission Development Plan (TDP) is to inform stakeholders about the proposed developments in the Eskom transmission network. These plans are subject to change as and when better technical solutions are identified or when more accurate developmental information becomes available. The information contained in the TDP should therefore not be used for any other purpose other than for the sharing of information.
The contents of this document do not constitute advice and Eskom makes no representations regarding the suitability of the information contained in this document to be used for any purpose. All such information is provided “as is” without warranty of any kind and is subject to change without notice. The entire risk arising out of its use remains with the recipient. In no event shall Eskom be liable for any direct, consequential, incidental, special, punitive, or any other damages whatsoever, including, but not limited to damages for loss of business profits, business interruption, or loss of business information.
While the TDP is updated periodically, Eskom makes no representation or warranty as to the accuracy, reliability, validity, or completeness of the information in this document. Eskom does, however, endeavour to release plans based on the best available information at its disposal at all times to ensure that the stakeholders are kept informed about the developments in the transmission network. Thus, the information contained in this document represents the most up-to-date information that was available at the time it was released.
ii

Transmission Development Plan 2010 - 2019Transmission Development Plan
Executive SummaryEskom Holdings is a vertically integrated company licensed to generate, transmit, and distribute electricity in South Africa. The Transmission Division of Eskom Holdings is tasked with the responsibility of developing the transmission network. The purpose of publishing the TDP is to inform stakeholders about Eskom’s plans with regard to the development of the transmission network. This publication fulfils the requirements of the South African Grid Code, requiring the Transmission Network Service Provider (TNSP) to annually publish plans on how the network will develop. This is the second publication of the TDP.
A Public forum will be held with identified stakeholders to further disseminate and get feedback about the contents herein. These comments will be taken into account when the plan is revised. This publication contains projects intended to extend or reinforce the transmission system that have been completed in the past year as well as projects that are planned for the next ten years.
The transmission network is the primary network of interest covered in this publication. This covers electrical networks with voltages ranging from 220 kV to 765 kV and transmission substations where these networks terminate. A few 88 kV and 132 kV electrical networks are included due to their strategic nature.
The projects that are covered in this document include, inter alia, generation integration projects required to ensure that the network is adequate to evacuate and dispatch power from the source to the load centres. The publication also includes transmission network strengthening plans, required to carry the power from the new power stations, and reliability projects required to ensure that the reliability and adequacy of the transmission network are sustained as load demand increases on the network.
The estimated rand value of planned projects is approximately R145 billion in the next ten-years, of which approximately R 4 billion is Customer related projects, R36 billion is generation integration projects, and approximately R105 billion is related to reliability projects. The costs given in the document are, in general, high-level estimates and can change as global economic conditions change; that is, costs are sensitive to foreign exchange, commodity price fluctuations, and global demand.
In general, the impact of reliability projects on the customers is to improve availability of supply under normal and contingency operating conditions. Customer and generation integration projects allow generating plant and the load to be optimally connected to the network.
Eskom Transmission also undertakes capital expenditure in respect of refurbishment of ageing infrastructure, facilities, production equipment, and strategic capital spares. Facilities consist of buildings located at sites other than substations that are used by Transmission for offices, operation and control of the system, or as maintenance depots and workshops. Production equipment consists of office furniture and equipment, computer hardware and software, tools and other equipment used by maintenance personnel, and vehicles. Strategic capital spares are items not available from suppliers ex stock (for example, large power transformers, circuit breakers, etc.) that are kept as a strategic stock to allow units that fail in service, and cannot be repaired on site, to be replaced as soon as practicable, thereby minimising the risk to customers of a lengthy outage.
Projects dealing with refurbishment of ageing infrastructure, facilities, production equipment, and strategic capital spares are not included in greater detail in this document, but a summary of their costs is illustrated in the chapter dealing with capital expenditure.
iii
Transmission Development Plan Transmission Development Plan
Table of ContentsForeword by Managing Directors i
Disclaimer ii
Executive summary iii
Table of contents v
Table of figures vii
List of tables viii
Abbreviations ix
1. Introduction 1 1.1 Context of the Transmission Development Plan 1 1.2 Structure of the document 1
2. Load demand forecast and generation scenarios 2 2.1 Load forecast 2 2.2 Generation assumptions 3
3. Major factor changes from previous TDP 6 3.1 Geospatial load forecast 6 3.2 Generation assumptions 6
4. Completed projects since last TDP 7 4.1 Completed generation integration projects 7 4.2 Update on transmission reliability projects 8 4.3 Grid connection applications 9
5. National overview 10
6. Breakdown of the TDP projects by grid 6.1 Central grid 13 6.2 East grid 19 6.3 North grid 23 6.4 North east grid 28 6.5 North west grid 33 6.6 South Grid 37 6.7 West Grid 43 6.8 Strategic Servitudes Under Investigation 48
7. Capital Expenditure Plan 49
8. Concluding Remarks 50
v

Transmission Development Plan 2010 - 2019Transmission Development Plan
Table of Figures
Appendices
APPENDIx A: Generation assumptions 51APPENDIx A1: Generation capacity assumptions – Coal 4 51APPENDIx A2: Generation capacity assumptions – Nuclear 1 52APPENDIx B: Costing details 53APPENDIx B1: Costing per project type 53APPENDIx B2: Costing of reliability projects per cln 53APPENDIx B3 Costing of reliability projects per grid 54APPENDIx B3A: Costing for Central grid projects 54APPENDIx B3B: Costing for East grid projects 55APPENDIx B3C: Costing for West grid projects 56APPENDIx B3D: Costing for South grid projects 57APPENDIx B3E: Costing for North East grid projects 58APPENDIx B3F: Costing for North West grid projects 59APPENDIx B3g: Costing for North grid reliability projects 59 APPENDIx B4: Summary of Generation integration costs 60APPENDIx C: Publication team 60APPENDIx D: Contact details 60
Figure 2 - 1: The Eskom transmission system demand forecast 2Figure 2 - 2: Power station capacity introduction by year 4Figure 2 - 3: Planned Power Station Capacity by 2019 (Foundation Plan) 5Figure 4 - 1: Geographical location of Existing and Planned power stations 9Figure 5 - 1: Map showing relative location of the major TDP scheme projects 10Figure 6 - 1: Current Central Grid network and CLNs 13Figure 6 - 2: Central Grid network diagram 18Figure 6 - 3: Current East Grid network and CLNs 19Figure 6 - 4: East Grid geographical network diagram 22Figure 6 - 5: Current North Grid network and CLNs 23Figure 6 - 6: North Grid geographical network diagram 27Figure 6 - 7: Current North East Grid network and CLNs 28Figure 6 - 8: North-East Grid network diagram 32Figure 6 - 9: Current North West Grid network and CLNs 33Figure 6 - 10: North West Grid geographical network diagram 36Figure 6 - 11: Current South Grid network and CLNs 37Figure 6 - 12: The South Grid networks diagram 42Figure 6 - 13: Current West Grid network and CLNs 43Figure 6 - 14: West Grid geographical network diagram 47
vii

Transmission Development Plan Transmission Development Plan
List of TablesTable 4 - 1: Connection Applications Quoted and Accepted 9
Table 5 - 1: Major TDP transmission assets expected to be installed 11
Table 6 - 1: Central Grid CLN load forecast and percentage load increases 13
Table 6 - 2: New transmission assets for the Central Grid 14
Table 6 - 3: East Grid CLN load forecast and percentage load increase 19
Table 6 - 4: East Grid new transmission assets 19
Table 6 - 5: North Grid CLN load forecast and percentage load increases 22
Table 6 - 6: North Grid new transmission assets 23
Table 6 - 7: North East Grid CLN load forecast and percentage load increases 27
Table 6 - 8: Cumulative TDP transmission assets for the North East Grid 28
Table 6 - 9: North West Grid CLN load forecast and percentage load increases 33
Table 6 - 10: Cumulative assets for North West grid 34
Table 6 - 11: South Grid CLN load forecast and percentage load increases 37
Table 6 - 12: Cumulative TDP transmission assets for the South Grid 38
Table 6 - 13: West Grid CLN loads and percentage load increases 43
Table 6 - 14: Cumulative TDP transmission assets for the West Grid 44
Table 7 - 1: Reliability capital expenditure per project type 48
Table 7 - 2: Reliability capital expenditure per project type 49
viii

Transmission Development Plan 2010 - 2019Transmission Development Plan
AbbreviationsCLN (Customer Load Network)A network supplying a subdivision of a grid, usually a significant geographical landmass or political boundary served, e.g. Johannesburg CLN within the Central Grid.
TNSP (Transmission Network Service Provider)A legal entity that is licensed to own and maintain a transmission network
MW (Megawatts)A million watts – a watt is a unit of electrical power production or demand.
MVA (Megavolt-amperes)A million volt-amperes-volt-ampere depicts vectoral summation of real power (MW) and apparent power (Mvars).
NERSA (National Energy Regulator of South Africa)A regulatory body for all forms of energy production and usage in South Africa
MTS - Main Transmission SubstationThese are mainly substations that step the voltage down to Distribution Voltages.
RTS - Return to ServiceA previously mothballed Power Station undergoing re-commissioning
RTS - Return to ServiceA previously mothballed Power Station undergoing re-commissioning
IPP - Independent Power ProducerThese are power stations owned by independent parties other than Eskom.
TDP - Transmission Development PlanA development plan produced annually by Grid Planning detailing how the network will develop in the next ten years. This comprises the proposed new projects listed in this document as well as the customer projects omitted from this document due to their commercial sensitivity. The Eskom financial year commences in April and concludes in March of the following year, in this case TDP 2010 - 2019 covers a period from 1st April 2010 to 31st March 2020.
OCgT - Open Cycle gas TurbineCombustion turbine fuelled by liquid fuel or gas, used to drive a generator.
CCgT - Combined Cycle gas Turbine
OCgT fitted with a waste heat recovery boiler and steam turbines to increase electricity output using the combustion turbine’s exhaust gases.
HVDC - High Voltage Direct Current
FQ - Feasibility QuoteQuotation giving customers costs and scope at 65% accuracy level
BQ - Budget QuoteQuotation giving customers costs and scope at 85% accuracy level
ix

Transmission Development Plan Transmission Development Plan 1
1. Introduction1.1. Context of the Transmission Development Plan
Eskom Holdings is the biggest producer of electricity in South Africa; it is also a sole transmitter of electricity via a transmission network which supplies electricity at high voltages to a number of large customers and distributors. Eskom is a vertically integrated company licensed to generate, transmit and distribute electricity. The transmission licence is held by Eskom Transmission division, the transmission network service provider, (TNSP). Planning the transmission network is the responsibility of Grid Planning Department, in the System Operations and Planning Division.
The TNSP is required to abide by the regulatory requirements to annually publish a document detailing the plans of how the transmission network will develop in the next five years. The requirements further stipulate that the published document should include:• the acquisition of servitudes for strategic purposes;• a list of planned investments, including costs;• diagrams displaying the planned changes to the transmission system (TS);• an indication of the impact on customers in terms of service quality and cost; and• any other information as specified by the NERSA from time to time.
A further requirement is that the TNSP holds public forum(s) to share such plans with stakeholders in order to facilitate a joint planning process with stakeholders. The first ten-year plan was published in 2009, this is the second publication based on the TDP for 2010 to 2019 which was finalised internally in the latter parts of 2009.
1.2. Structure of the Document
The document is structured in the following way:
Chapter 2 deals with the electricity demand forecast and generation assumptions. The demand forecast determines how the network is planned and it contextualises the planning activity while the generation assumptions outlines the generation build that informs some of the planned transmission network, as significant transmission network is required to evacuate power from the power stations to the load.
Chapter 3 focuses on the major changes that have happened since the completion of the previous published TDP. The changes that occurred included the enhancement of geospatial forecasting (which improves the forecasting of load at a spatial level), and the changes from the previous generation assumptions to the ones informing this plan.
Chapter 4 discusses projects that have been completed in the past year and the impact they have had on network reliability. This is partly to demonstrate the value of the projects as they are completed and also to inform stakeholders of the progress of projects thus far.
Chapter 5 deals with the national overview, which gives a high level explanation of the planned transmission infrastructure. This is intended to give a snapshot of the major projects that are planned for the entire TDP period and a high-level summary of the installed transmission infrastructure.
Chapter 6 focuses on planned projects in more detail and the impact they will have on the network. Generation integration and reliability projects will be discussed per Grid. In both instances, sites and servitudes are required to accommodate placement of substations and lines respectively. In either case, the Environmental Protection Act requires Eskom to conduct an EIA (environmental impact assessment) and obtain environmental approval, which includes the affected public, prior to construction.
Chapter 7 deals with the capital expenditure of the TDP, while
Chapter 8 presents various conclusions based on the content in this document
Transmission Development Plan Transmission Development Plan 2010 - 2019 2
2.1. Load Forecast
For a transmission network planning cycle, load forecasting is a fundamental requirement. Availability of sufficient transmission network capacity in any country is important for economic growth. Grid Planning, in consultation with the relevant Distribution regions and stakeholders, compiles a forecast per point of supply on an annual basis. The geographically differentiated loads indicate that the growth rates and load profiles differ substantially from one substation or area to another.
The overall system demand is based on the Eskom 2007 forecast, as the forecast of the overall system demand has not changed significantly despite the recent economic downturn. These demand figures are currently under review to determine the exact impact the downturn has had, but this downturn is viewed as a short-term impact, it is believed that the demand will return rapidly once the economy starts to revive and quickly get back on track to the forecasted loadings.
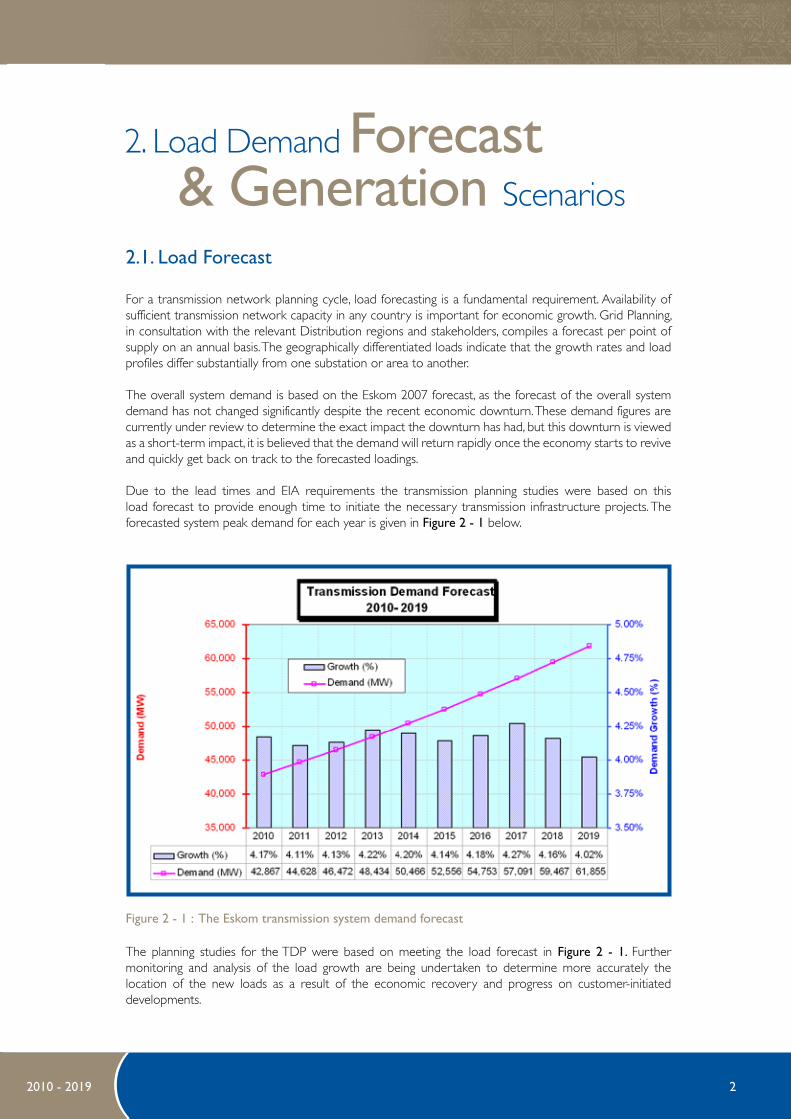
Due to the lead times and EIA requirements the transmission planning studies were based on this load forecast to provide enough time to initiate the necessary transmission infrastructure projects. The forecasted system peak demand for each year is given in Figure 2 - 1 below.
Figure 2 - 1 : The Eskom transmission system demand forecast
The planning studies for the TDP were based on meeting the load forecast in Figure 2 - 1. Further monitoring and analysis of the load growth are being undertaken to determine more accurately the location of the new loads as a result of the economic recovery and progress on customer-initiated developments.
2. Load Demand Forecast & generation Scenarios

Transmission Development Plan Transmission Development Plan 3
2.2. general Assumptions
The existing generation capacity was included as full installed generation capacity in the year of the study. Cahora Bassa power import was modelled at a maximum of 1200MW. The future approved power plant integration projects were incorporated in the year in which they are expected to be commissioned.
Two scenarios were considered, the Foundation Plan, which assumes that all the new generation will be coal based, and the Nuclear B Plan, which assumes that the first new nuclear power station will be started by 2018, known as Nuclear 1. In both cases the proposed Coal 3 power station will be required. Thus for this TDP the main power corridor transmission infrastructure for Coal 3 was included in both scenarios. The installed capacity of this corridor will be able to be used to integrate the first two units from Coal 4 and is therefore common to both scenarios.
The main difference between the two scenarios is the local 400kV infrastructure required to connect either Coal 4 or Nuclear 1. As Nuclear 1 is well understood and likely to be more than what is required for Coal 4 the 400kV infrastructure for Nuclear 1 has been included in the TDP to cater for either project in terms of major equipment, lengths of line and costs. This is discussed in more detail below.
Coal 3 base load generation and the Waterberg
There is a 4800MW (6 x 800MW units) base load coal-fired power station that is required to come on line by 2016, referred to as Coal 3. For the purposes of this TDP it has been assumed that the proposed Mmamabula power station in Botswana is limited to 1200MW in line with the current negotiations for a power purchase agreement. For the Foundation Plan option the first two units of Coal 4 (2 x 800MW) will also be required to be in service by 2019.
Nuclear 1 generation
Regarding the proposed Nuclear 1 power station the major assumption is that the power station will be located at the proposed Thuyspunt site near Port Elizabeth. Although the site selection process is underway and not concluded it was felt prudent that the Nuclear 1 power station be included in the TDP to give an indication of the expected transmission requirements. If the nuclear option materialises it has been assumed that 3150MW will be available from the Nuclear 1 power station at the proposed Thuyspunt site, based on 3x 1050MW units. The first units will come on line in 2018 and Coal 3 will still be required.
Cogeneration initiative
Eskom has embarked on a cogeneration programme to attract new cogeneration partners onto the Eskom system. From a transmission system view most cogeneration projects are reflected as a reduction of the demand in the area where they are connected. The transmission system still has to be planned to be able to supply the connected loads if the cogeneration is not available. Therefore no cogeneration is considered in the TDP or included in the TDP projects. However there is opportunity to optimise and if found viable and achievable, this will be reflected in the next TDP update.
Renewable generation
Eskom is pursuing a number of renewable generation pilot projects which include wind generation and solar power. There are a large number of potential wind energy facilities that have applied for connection to the transmission grid, especially on the West Grid. These are under investigation and there is no clarity on how much will have to be connected and when. The initial wind farm connections should be those closest to the transmission system which will result in the least amount of new infrastructure required. Therefore only 132kV feeder bays are expected for the first connections and will not impact the TDP significantly. Larger connections requiring a new 400/132kV substation to collect the power will take time to initiate and implement due to environmental impact assessment (EIA) regulations. They will only have an impact in the later stages of the TDP.

Transmission Development Plan Transmission Development Plan 2010 - 2019 4
The transmission system still has to be planned to be able to supply the connected loads if connected renewable generation plant is not available. Therefore no renewable generation is considered in the TDP studies or included in the TDP projects at this stage. However it is anticipated that renewable generation projects and their associated transmission projects will be included in future updates of the TDP.
Conversion of gourikwa from OCgT to CCgT
There is a proposal to convert some or all of the OCGT units at Gourikwa to CCGT by adding waste heat recovery boilers and steam turbo-generator sets. This would have the effect of increasing the station’s total output without increasing fuel consumption. Running cost per kWh of output would be reduced, but would still be higher than coal fired stations, however, its carbon footprint would be smaller. No date has been set, so it is assumed for purposes of this document that it will be in 2019. It has not been included in the generation scenarios used to compile this TDP due to the high level of uncertainty associated with the project, but has been included in this document to give stakeholders an idea of associated transmission requirements.
Ingula power station
Ingula power station will be a pumped-storage scheme located in the Eastern Region; it will primarily be used during peak times.
New generation summary
A summary of the new plant and the year that the last unit at the power station becomes commercially available is given in Appendix A. These generation units were assumed to be in service at the expected dates. This is graphically illustrated in Figure 2 - 2 and Figure 2 - 3 below.
Figure 2 - 2: Power station capacity introduction by year
The proposed OCGT IPP plants to be provided by the Department of Energy (DOE) are not specifically included in the studies. However, the two known sites in the East and South Grids have been studied, and effectively only the feeder bays at the relevant Eskom MTS substations are required to integrate them into the network. These plants are designed for operation only during peak load periods or in emergencies, making it necessary to plan the network to meet local load without them being available for use.

Transmission Development Plan Transmission Development Plan 5
Figure 2 - 3: Planned Power Station Capacity by 2019
It is also acknowledged that the Tubatse (or Lima) pumped-storage scheme project near Steelpoort has been put on hold, but the transmission studies were undertaken before this decision, and most of the infrastructure will still be required for system reliability purposes to meet the needs of local loads.
Transmission Development Plan Transmission Development Plan 2010 - 2019 6
3. Major factor changes from previous TDPThere have been some changes in the factors influencing the selection and timing of projects for the TDP from the previous TDP. The main factors were related to an improved understanding of the geospatial load centres and forecast, the Strategic Grid Study of the main power corridors to 2030, and the potential generation scenarios. These three factors are briefly discussed in this section as background to the motivation of the projects and their timing in the TDP.
3.1. geospatial Load Forecast
There was no overall change to the system peak load forecast as the forecast for total system demand has not changed significantly despite the recent economic downturn. These demand figures are currently under review to determine the exact impact the downturn has had, but this downturn is viewed as a short-term impact and it is believed that the demand will return rapidly once the economy starts to recover and quickly get back on track to the forecasted loadings
The changes in the load forecast from the previous TDP are largely based on newly available information. As a result, some of the load has moved between substations and the need for new substations has been identified. The revision of the demand forecast resulted in a number of new projects required within the TDP period as well as several of the projects identified in the previous TDP being reconfigured or re-phased.
3.2. generation Assumptions
The major changes in the generation assumptions from the previous TDP are the inclusion of Coal 3 and the optional scenario of Nuclear 1.
The Coal 3 generation is assumed to be in the Waterberg area close to Medupi in line with the current project development with the target date for the first units in 2016. The integration of the first units at Coal 3 will utilise the new Delta 765/400kV substation and the Delta-Epsilon lines will be energised at 765kV. It is proposed to implement two HVDC schemes with an HVDC converter station in the vicinity of Coal 3 to cater for the final configuration of six 800MW units.
The HVDC lines will connect to terminal stations in the Central Grid and the East Grid. These HVDC lines should cater for the first two 800MW units for a proposed Coal 4 power station in the same area. The Coal 4 units could be replaced by IPP units in the same area. This is in line with the long-term integration requirements identified in the Strategic Grid Plan for 2030 for future large generation in the Waterberg area.
Mmamabula will be limited to 1200MW (2 x 600MW) in line with the current power purchase agreement negotiations. The first unit will be connected in 2014 and the second unit in 2015.
Nuclear 1 is considered, as in the previous TDP, to be located at the Thuyspunt site. As the transmission integration requirements only need around 300km of new 400kV line (some of which will still be required for the new Port Elizabeth 400/132kV substation if Nuclear 1 does not materialise) and a new 400kV switchyard, the projects have been included in the TDP. Their overall impact on the TDP requirements is relatively small and only in the last years of the TDP period. They will provide an indication of the lengths of line that will be required on other projects if Nuclear 1 does not happen, such as the lines from the Coal 4 power station or IPP developments in the Waterberg area to Delta substation and the HVDC terminal station.
Transmission Development Plan Transmission Development Plan 7
4. Completed projects since last TDPThis chapter contains a list of projects completed since the last TDP. A project may consist of a number of sub-projects, which may be placed into commercial operation before the entire project is completed. This is done to ensure that the network and customers enjoy the benefits of the new assets as soon as practicable.
4.1. Completed generation integration projects
According to the TDP 2009 - 2018, some RTS power stations were anticipated to be completed in 2009. Parts of some of these projects have since been completed, and the resultant benefits are being realised. The completion status of the projects is as follows:
Camden RTS: this power station has now been fully returned to service and the project is complete.
grootvlei RTS: only generator bays 5 and 6 are still outstanding and completion anticipated in 2010/11 financial year.
Komati RTS: only generator bays 1, 2, 3, 4, and 5 are still outstanding, and completion is anticipated in the 2010/11 financial year.
Transmission Development Plan Transmission Development Plan 2010 - 2019 8
4.2. Update on transmission reliability projects
This section discusses all the projects that were reflected in the TDP 2009 - 2018 for commissioning in FY2009/10. Over and above that, there are other projects that were not mentioned in that plan (due to the fact that they were near completion) that have since been concluded.
Central grid
The project to install a 3rd 315MVA 275/88kV transformer at Rigi Substation near Van der Bijlpark has been completed.
Johannesburg North Strengthening Phase 1 entailed installation of additional transformation capacity at Lulamisa substation (Fourways area), Craighall substation (Bryanston) and Lepini (Tembisa). The transformation installations at Lulamisa substation (3rd transformer) and at Craighall substation (3rd transformer) have been completed. The installation of the 3rd and 4th transformers at Lepini substation is outstanding.
East grid
The implementation of Empangeni Phase 1 Scheme is in progress. The construction of the Majuba - Umfolozi 400 kV (765 kV design) is nearing completion, and is expected to be completed in June 2010.
The project to introduce 400kV into Eros substation has been completed, with the planned 400/132kV transformer having been commissioned.
North East grid
The projects for the installation of additional transformation capacity at Malelane (1 x250 MVA) and Marathon (2 x 500 MVA) substations are in progress, but are running behind schedule. The Sol B switching station project has been cancelled, and is being reconfigured into a full substation. This project is linked to developments in the Secunda supply area.
North grid
A number of projects to upgrade transformation capacity in the North Grid have either been completed or are at finalisation stage. These include the Spitskop 3rd 500MVA transformer and Marang 4th transformer, both of which are at finalisation, as well as the Witkop 3rd transformer project, which is completed. The Tabor-Spencer Scheme, which entailed constructing the Tabor-Spencer 1st 275kV line as well as a 2nd transformer at Spencer has been completed. The commissioning of the Bighorn 2nd transformer has been delayed to 2011.
South grid
The integration of Dedisa 400/132 kV substation is at the finalisation stage. A number of projects relating to the South Grid Strengthening Scheme have been deferred. This is primarily as a result of the uncertainty surrounding the establishment of an Aluminium Smelter in the Port Elizabeth area, as well as potential substantial step loads in this supply area.

Transmission Development Plan Transmission Development Plan 9
4.3. grid connection applications
A total of thirteen feeder bays were completed to connect customers to the network. Details are however withheld to protect the confidentiality of the customers concerned. Table 4 - 1 outlines the number of Feasibility Quotations (FQ’s) and Budget Quotations (BQ’s) that have been processed during the period January 2009 to February 2010. These are as a result of applications for grid connections, as per the Grid Code.
Table 4 - 1: Connection Applications Quoted and Accepted
As shown in Table 4 - 1 above, the number of customer applications for grid connections processed is fairly high, while the acceptance rate is low. The results above indicate that there is potential wasteful use of scarce resources to process quotes which are not accepted. Further analysis and consultation with customers is required to understand opportunities to improve this performance.
grid Feasibility Quotations Budget QuotationsApplications Accepted Applications Accepted
Central 8 4 4 3
East 8 2 4 1
North East 14 4 7 0
North West 0 0 2 0
North 21 2 6 1
South 11 0 2 0
West 4 1 3 1
Total 66 13 28 6% Acceptance 20% 21%

Transmission Development Plan Transmission Development Plan 2010 - 2019 10
5. National OverviewThe map below in Figure 5 - 1 shows a high-level view of the major TDP scheme projects where the relative location of the new transmission lines and the associated MTS substations are indicated schematically.
Figure 5 - 1: Map showing relative location of the major TDP scheme projects

Transmission Development Plan Transmission Development Plan 11
A summary of the major new assets that are either approved or proposed to be added to the transmission system over the next ten years are listed in Table 5 - 1 below.
Table 5 - 1: Major TDP transmission assets expected to be installed
TDP New Asset Total
HVDC Lines (km)
765kV Lines (km)
400kV Lines (km)
275kV Lines (km)
1 700
6 770
8 355
831
Transformers 250MVA+
Transformers <250MVA
Total installed MVA
103
29
67 840
Capacitors
Total installed MVAr
19
2 366
Reactors
Total installed MVAr
56
14 600

Transmission Development Plan Transmission Development Plan 2010 - 2019 12
A significant amount of new transmission lines is being added to the system with over 6,700 km of 765kV
and over 8,300 km of 400kV lines either approved or proposed over the ten-year TDP period. This is
due to the major network reinforcements required for the supply to the Cape (South and West Grids)
and the supply to the East Grid. The integration of new power stations in the developing Limpopo West
Power Pool (Medupi and Coal 3 close to Matimba and the IPP Mmamabula in Botswana) also requires
significant lengths of transmission line as the power stations are very remote from the main load centres.
New HVDC lines are required to export the excess power from Coal 3 in the Waterberg directly to load
centres in the Central and East Grids, requiring 1,700km of 800kV constructed HVDC lines.
The large amount of 400kV transmission lines is also as a result of a more meshed transmission 400kV
network being developed to provide higher reliability within the grids and thus improve the levels of
network security.
These new transmission lines form part of the long-term strategy to develop a main transmission backbone
from which regional power corridors can be supported. These power corridors will connect generation
pools to each other and to the major load centres in the country. This backbone and regional power
corridor network structure will allow for the increasing system demand to be supplied and the power
from new power stations to be integrated more efficiently into the transmission network and distributed
where required, both under system healthy and system contingency conditions.
The development of the transmission backbone and the associated regional power corridors was
reviewed as part of the Strategic Grid Study which considered the potential development scenarios
beyond the ten-year horizon of the TDP up until 2030. The objective of this strategic study was to align
the transmission network with the requirements of the generation future options and the growing and
future load centres. This Strategic Grid Study has enabled the ten-year TDP to be aligned with the future
long-term development of the whole Eskom system.
The addition of over 67000 MVA of transformer capacity to the transmission system is an indication of
both the increasing load demand and the increasing firm capacity requirements of the customers. The
2,366 MVars of capacitive support are required to support areas of the network under contingency
conditions to ensure that the required voltage levels are maintained.
The 14600 MVArs of reactors are a direct result of the long lengths of both 765kV and 400kV transmission
lines that will be constructed over this period. There are a number of series compensation projects
required on the 765kV and 400kV lines required to improve the power transfer capability of the Cape
power corridors.
Currently six new SVCs have been identified in the TDP; two large SVCs with a range of +350/-100
MVAr in the Eastern Cape (South Grid) to support the Coega demands, two new SVCs are proposed to
support the Northern Cape (West Grid) and the proposed Sishen-Saldhana Spoornet expansion, namely
a +200/-100 MVAr SVC at Aries and a smaller one of +45/-100 MVars at Garona. Two +100/-100 MVAr
SVCs are required for dynamic voltage support in the North West Grid at Ferrum and Merapi. There is a
seventh SVC project to decommission the existing 132kV SVC at Grassridge.

Transmission Development Plan Transmission Development Plan 13
6.1. Central grid
The Central Grid consists of four customer load networks (CLNs), namely; Johannesburg, Vaal Triangle, West Rand and Nigel. The current transmission network and CLNs are shown in Figure 6 - 1 below.
6. Breakdown of the TDP Projects
by grid
Figure 6 - 1: Current Central grid network and CLNs
The expected peak CLN demands by 2019 and the average percentage load increase for the period for each CLN are given in Table 6 - 1 below.
Table 6 - 1: Central grid CLN load forecast and percentage load increases
CLN Actual Peak Load 2008 (MW)
Forecasted Load (MW)2009 2015 2019
Ave. Annual % Load Increase
Johannesburg 4106 5139.4 6165 7448.4 4.11
West Rand 1935 2147.3 2327 2400.7 1.18
Nigel 1666 1879 1989 2037.6 1.05
Vaal Triangle 1443 1929.4 2047 2122.5 1.09

Transmission Development Plan Transmission Development Plan 2010 - 2019 14
The TDP schemes for the Central Grid consist of extending the 275kV network (built at 400kV insulation level) the installation of additional transformers at existing substations, as well as the construction of seven new substations. The integration of Medupi and Kusile power stations will result in the Central Grid 400kV network being strengthened as well. The increase in transmission assets by end 2014 and end 2019 and the cumulative total are shown in Table 6 - 2.
6.1.1. Johannesburg CLN
The customer load network (CLN) maximum load for 2008 was 4106 MW. The loads are forecasted for a ten-year period from 2010 to 2019. Lepini, Lulamisa, Craighall and Croydon substations have the highest annual load increases for the ten-year period. Especially in the Lulamisa and Lepini supply areas (Midrand and Johannesburg North), the energy growth has been increasing for the past five years at 5.7% per annum, with an associated increase of 6% per annum in the demand. The City Power substations Delta, Fordsburg, and Prospect will also be experiencing considerable load growth. The Kelvin power station is still assumed to be in service.
The main drivers behind the load growth in the Johannesburg CLN are:
• Craighall/Croydon (Randburg, Sandton and Kempton Park): urban development mainly housing and extensions to existing shopping malls and development of new ones, as well as office blocks and office parks. The trend of companies relocating from the Johannesburg city centre, especially to the Sandton CBD, has also created a demand for additional hotel accommodation.• Lepini/Lulamisa (Midrand and Johannesburg North): expansion of existing affordable housing in Ivory Park, Diepsloot and emerging affordable housing in Cosmo City (25 000 affordable houses are planned for the next five years). New residential developments (high and very high income) in Johannesburg North and part of Midrand. Development of commercial office blocks, shopping centres, and light industrial loads is also on the increase.• Delta/Fordsburg/Prospect: mainly residential development and light industrial loads.
Table 6 - 2: New transmission assets for the Central grid
Transmission Asset for Central grid
New Assets expected in 2010 - 2014
New Assets expected in 2015 - 2019
Total NewAssets expected
Total kms of line 633 346 979
765kV Lines (km)
400kV Lines (km)
275kV Lines (km)
0
625
8
0
296
50
0
921
58
Total installedTransformer MVA
3 285 7 860 11 145
Transformers (no. of) 11 18 29
Capacitors (no. of) 2 0 2
Reactors (no. of) 0 0 0

Transmission Development Plan Transmission Development Plan 15
The type of load supplied by the Johannesburg CLN is very important in terms of the profile of the businesses in the area, including many national and regional company head offices.
The main projects in the Johannesburg CLN are described below. Almost all of the projects are the same as those in the previous TDP but most of the dates have changed. This is due to a number of reasons such as increased certainty where projects are done in collaboration with customers, delays in servitude acquisitions and reprioritisation of projects. A similar trend is noticeable for all other grids and CLNs. Croydon Transformation strengthening • Third 275/132kV 250MVA transformer at Croydon MTS. 2010
Johannesburg North – Phase 2 Network Strengthening • Apollo-Lepini 275kV line 2013• Lepini Ext 275kV 2x 150MVar capacitors 2013
Johannesburg Reactive Power Project • Eiger and Jupiter 88kV 48MVAr shunt capacitor bank 2012• Croydon and Benburg 132kV 72MVAr shunt capacitor 2012
Johannesburg East Strengthening • Phase 1A: Esselen second 275/88kV 315MVA transformer 2010• Phase 1B: Esselen–North Rand 275kV line strengthening 2015• Phase 2: North Rand MTS strengthening 2016• Phase 3 A-D: Jupiter B MTS integration 2014• Phase 3 E-F: Sebenza integration 2017
Johannesburg Strengthening • Establish Sebenza-Craighall 275kV lines 2017• Establish 1x 275kV GIS feeder at Craighall MTS 2017• Establish new 400/132kV Craighall B GIS MTS 2019• Loop Craighall–Lepini/Sebenza lines into Craighall B 2019
Soweto Strengthening Phase 1 (built at *400kV, operated at 275kV)• Establish new Quattro MTS 275kV *busbar 2014• Build 2x 275kV Quattro-Etna 15km *lines 2014
Soweto Strengthening Phase 2 (built at *400kV, operated at 275kV)• Install 2x500MVA 275/132kV transformers 2016• Build 6x132kV new feeder bays at the Quattro substation 2016
Simmerpan MTS Strengthening – Phase 1(built at *400kV, operated at 275kV) • Establish new Simmerpan MTS 275kV *busbar 2015• Operate Jupiter–Simmerpan 2x88kV lines at 275kV 2015• Install 2x275/88kV 160MVA transformers 2015
Simmerpan Strengthening – Phase 2(built at *400kV, operated at 275kV)• Install 2x250MVA 275/132kV transformers 2016• Build 6x 132kV new feeder bays at the Simmerpan 2016
Kyalami 400kV Strengthening • Construct the new Kyalami 275/132kV GIS station 2014• Loop the Kusile-Lulamisa 400kV line into Kyalami MTS 2014
Lulamisa MTS Transformation Strengthening • Install a forth 400/88kV 315MVA transformer. 2019
HVDC Terminal B • Establish an HVDC converter station close to Jupiter B MTS 2017• Build an 800kV line from Terminal B to Coal 3 via Epsilon 2017

Transmission Development Plan Transmission Development Plan 2010 - 2019 16
6.1.2. West Rand CLN
This CLN consists of six transmission substations supplying both residential and industrial loads. The CLN maximum load for 2008 was 1935 MW at time of area peak, and the loads are forecasted for a ten year period from 2010 to 2019. In 2019 the CLN load is expected to reach 2400 MW at time of CLN peak. The load growth in this CLN is stable; no new large loads are expected.
The main projects in the West Rand CLN are as follows:
Establishment and Integration of Demeter 400 kV Substation • Install new Demeter 400/88kV MTS 2x 315MVA transformers. 2015• Construct Demeter-Lulamisa 400kV line (30km) 2015• Construct Demeter-Lomond 400kV line (50km) 2015• Construct Etna-Taunus 400kV line (energised at 275kV) 2015
West Rand Reinforcement• Establish Westgate B 400/132kV substation 2017• Install first 400/132kV 500MVA transformer 2017• Construct Hera-Westgate B first 400kV line 2017• Construct Taunus-Westgate B first 400kV line 2017• Construct Taunus Ext 400/132kV transformation (1 x 500MVA) 2017• Construct Etna-Taunus first 400kV line (energised at 400kV) 2017• Construct Glockner-Hera first 400kV line 2017
6.1.3. Nigel CLN
This CLN consists of six substations which are supplied from Lethabo power station (via Brenner), Matla power station (via Nevis and Benburg) and Kriel (via Zeus-Grootvlei). The CLN maximum load for 2008 was 1666 MW. In 2019, the CLN load is forecasted to be 2037 MW. Grootvlei and Benburg show considerable load increases.
The load growth in the Nigel CLN is driven by the following:
• Residential loads (normal load growth), some of which are: Boksburg North, Boksburg, Meyerton, Heidelburg and Vosloorus.• Light industrial loads (normal load growth): for example, Paper and Concrete industries.• Mining (Normal Load growth); Gold mining and ferrous metals smelting
The main projects in the Nigel CLN are as follows:
Snowdon Transformation Upgrade • Replace 4x 275/88kV 90MVA with 3x 160MVA transformers 2012 Benburg Transformation Strengthening • Install a third 275/132kV 250MVA transformer at the Benburg MTS. 2017
Nevis Transformation Strengthening • Install a third 275/132kV 500MVA transformer at the Nevis MTS. 2017
Siluma 275/88kV MTS Establishment• Establish new Siluma MTS 2017• Loop the Lethabo–Eiger, Snowdon–Brenner into Siluma 2017 • Loop the Brenner–Eiger 275kV line into Siluma 2017 • Install 2x 275/88kV 315MVA transformers 2017
Transmission Development Plan Transmission Development Plan 17
6.1.4. Vaal CLN
This CLN consists of seven transmission substations and one power station supplying both residential and heavy industrial loads. The CLN maximum load for 2008 was 1443MW at time of CLN peak. In 2019, the CLN load is expected to reach 2122MW at CLN peak. The anticipated high load growth nodes are at Makalu and at Verdun MTS.
The major contributors to the load growth are, • Residential/Commercial load (normal growth): Boipatong, Sebokeng, Vaalpark, Vanderbijlpark etc, and• Industrial light and heavy load (high load growth)
The Makalu transformation project that was in the last TDP has been cancelled as it is no longer needed due to load shifts. The main projects in the Vaal CLN are as follows:
Vaal Strengthening Phase 1 (closing of the Hera-Bernina 275kV link)• Replacement of underrated equipment due to high fault levels 2011• Glockner third 400/275kV 800MVA transformer 2011• Glockner 275kV busbar replacement to tubular 2011
Vaal Strengthening Phase 2 • Construct Glockner-Etna 2x 400kV lines operated at 275kV. 2011
Vaal Strengthening Phase 3 • Operate Glockner-Etna 2x400kV lines operated at 400kV 2017• Construct Etna 2x800MVA 400/275kV. 2017
Kookfontein Transformation Phase 1 • Install 2 x 88kV 48 MVar capacitor banks at Kookfontein 2011
Kookfontein Transformation Phase 2 • Install a third 275/88kV 315MVA transformer 2015• Build a third Glockner-Etna 275kV line 2015
Olympus Transformation Strengthening • Install a third 275/132kV 250MVA transformer 2017

Transmission Development Plan Transmission Development Plan 2010 - 2019 18
A network diagram showing the major projects in the Central Grid is shown in Figure 6 - 2 below.
Figure 6 - 2: Central grid network diagram

Transmission Development Plan Transmission Development Plan 19
The expected area peak demands by 2014 and 2018 and the average percentage load increase for the period for each CLN are given in Table 6 - 3 below.
Table 6 - 3: East grid CLN load forecast and percentage load increase
CLN Peak Load (MW) 2008
Forecasted Load (MW) 2015 2019
Ave. Annual % Load Increase
Ladysmith and Newcastle
1158 1392 1513 2.3 %
Empangeni 2049 3110 3303 4.0%
Pinetown 3212 3724 3922 2.0%
Figure 6 - 3: Current East grid network and CLNs
6.2. East grid
The East Grid consists of four CLNs namely, Ladysmith, Newcastle, Empangeni and Pinetown. The current transmission network and CLNs are shown in Figure 6 - 3 below.
Transmission Development Plan Transmission Development Plan 2010 - 2019 20
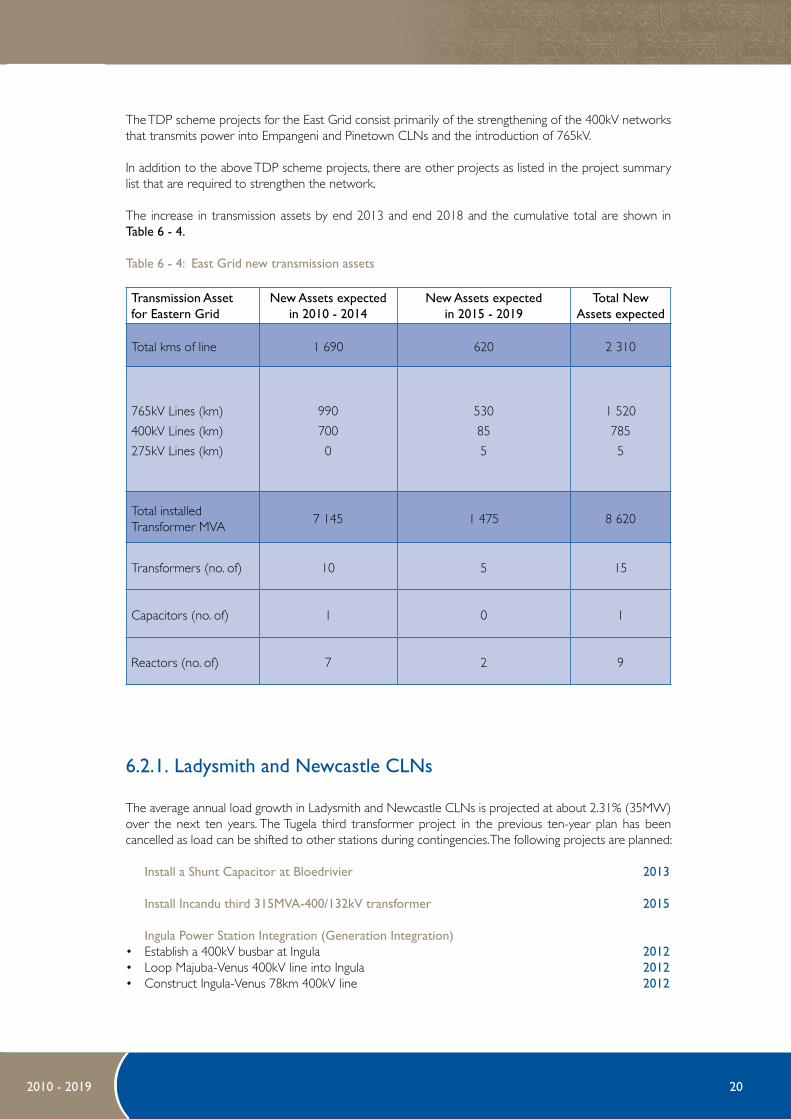
The TDP scheme projects for the East Grid consist primarily of the strengthening of the 400kV networks that transmits power into Empangeni and Pinetown CLNs and the introduction of 765kV.
In addition to the above TDP scheme projects, there are other projects as listed in the project summary list that are required to strengthen the network.
The increase in transmission assets by end 2013 and end 2018 and the cumulative total are shown in Table 6 - 4.
Table 6 - 4: East grid new transmission assets
6.2.1. Ladysmith and Newcastle CLNs
The average annual load growth in Ladysmith and Newcastle CLNs is projected at about 2.31% (35MW) over the next ten years. The Tugela third transformer project in the previous ten-year plan has been cancelled as load can be shifted to other stations during contingencies. The following projects are planned:
Install a Shunt Capacitor at Bloedrivier 2013 Install Incandu third 315MVA-400/132kV transformer 2015 Ingula Power Station Integration (generation Integration)• Establish a 400kV busbar at Ingula 2012• Loop Majuba-Venus 400kV line into Ingula 2012• Construct Ingula-Venus 78km 400kV line 2012
Transmission Asset for Eastern grid
New Assets expected in 2010 - 2014
New Assets expected in 2015 - 2019
Total New Assets expected
Total kms of line 1 690 620 2 310
765kV Lines (km)
400kV Lines (km)
275kV Lines (km)
990
700
0
530
85
5
1 520
785
5
Total installedTransformer MVA
7 145 1 475 8 620
Transformers (no. of) 10 5 15
Capacitors (no. of) 1 0 1
Reactors (no. of) 7 2 9

Transmission Development Plan Transmission Development Plan 21
6.2.2. Empangeni CLN
The Empangeni CLN consists mainly of industrial load. The load profile for this area is fairly flat. There are four 400kV lines that supply power into this network, with 275kV lines linking this CLN to Pinetown CLN via Impala substation.
The projects planned in this CLN are discussed below. The Empangeni 400/132kV transformation project that was in Empangeni Phase 3 in the previous TDP has been cancelled, as it is no longer needed; consequently Empangeni Phases 4, 5, and 6 have been changed to Empangeni Phases 3, 4, and 5.
Empangeni Strengthening Phase 1 (under construction)• Completion of the Majuba-Umfolozi 765kV line operated at 400kV 2010
Empangeni Strengthening Phase 2 • Establish Theta 400kV switching station 2012• Construct Umfolozi-Theta 765kV line to be operated at 400kV 2012• Loop Umfolozi-Athene 400kV line into Theta 2012• Loop Umfolozi-Invubu 400kV line into Theta 2012• Construct Theta-Invubu 400kV line 2012 Empangeni Strengthening Phase 3• Establish 765/400kV at Theta 2015• Convert Majuba-Umfolozi-Theta line to Zeus-Theta to 765kV 2015
Pinetown-Empangeni Interconnection (previously Pinetown Phase 3)• Construct Sigma–Theta 400kV first and second Lines (double circuit) 2015
Empangeni Strengthening Phase 4• Construct Camden–Theta 765kV line to be operated at 400kV 2015 Empangeni Strengthening Phase 5• Establish 765kV at Camden 2017• Operate Camden–Theta 765kV line at 765kV 2017
6.2.3. Pinetown CLN
The Pinetown load is mostly residential and commercial in nature. There are four 400kV and two 275kV lines that supply power into this network. As mentioned under Empangeni CLN, the Pinetown and Empangeni CLNs are linked with a 275kV line via Avon substation. The following projects are planned:
Pinetown Strengthening Phase 1• Establish Sigma 400kV switching station 2013• Construct Majuba-Sigma 765kV (via Venus) line operated at 400kV 2013• Construct new Sigma-Hector 2x 400kV lines. 2013
Pinetown Strengthening Phase 1B• Recycle Venus –Georgedale line into second Venus–Ariadne 400kV line 2013 Pinetown Strengthening Phase 2 2015• Establish 765/400kV at Sigma 2015• Convert Majuba-Sigma line to Zeus-Sigma and operate at 765kV 2015

Transmission Development Plan Transmission Development Plan 2010 - 2019 22
A geographical network diagram indicating the major projects in the East Grid for the ten-year period is shown in Figure 6 - 4.
Figure 6 - 4: East grid geographical network diagram

Transmission Development Plan Transmission Development Plan 23
Figure 6 - 5: Current North grid network and CLNs
The expected peak demands by 2015 and 2019 and the average percentage load increase for the period for each CLN are given in Table 6 - 5 below.
Table 6 - 5: North grid CLN load forecast and percentage load increases
6.3. North grid
The North Grid consists of five CLNs namely, Waterberg, Rustenburg, Lowveld (northern part), Warmbad and Polokwane. The current transmission network and CLNs are shown in Figure 6 - 5 below.
CLN Peak Load (MW) 2008
Forecasted Load (MW) 2015 2019
Ave. Annual % Load Increase
Waterberg 618 1322 1927 21.2
Rustenburg 1880 2891 2956 5.7
Lowveld North 581 1150 1210 10.8
Warmbad 543 682 704 3.0
Polokwane 1010 1495 1639 6.2

Transmission Development Plan Transmission Development Plan 2010 - 2019 24
6.3.1. Waterberg CLN
The Waterberg CLN contains the Medupi 4800MW coal-fired power station that is under construction. It is also the where two additional coal-fired power stations are likely to be developed. They are referred to as Coal 3 and Coal 4, with six 800MW units and two 800MW, respectively, expected to be in service by 2019.
The Waterberg coal bed extends westwards across the Limpopo River to neighbouring Botswana. The shallow coal deposits in the Waterberg area have attracted extensive explorations that have resulted in an independent power producer proposing to establish the Mmamabula power station some 80km west of Medupi. At one stage, this was proposed to be 4200MW, but has now been reduced to 1200MW, which is currently under negotiation for power purchase agreement.
The Waterberg generation pool will integrate with the Polokwane, Rustenburg, West Rand, and Brits areas through 400kV and 765kV lines. The 400kV lines will radiate to substations within 300km, and beyond 300km, the 765kV network will eventually form the main backbone down the north-west side of the country.
Transmission Asset for Northern grid
New Assets expected in 2010 - 2014
New Assets expected in 2015 - 2019
Total New Assets expected
Total kms of line 2 551 1 170 3 721
765kV Lines (km)
400kV Lines (km)
275kV Lines (km)
350
1 966
235
350
820
0
700
2 786
235
Total installedTransformer MVA
5 370 9 500 14 870
Transformers (no. of) 12 8 20
Capacitors (no. of) 0 0 0
Reactors (no. of) 5 3 8
The North Grid load is mainly platinum group metals (PGM) and ferrochrome mining and processing located in Rustenburg, Polokwane and Lowveld North (Steelpoort area). The Waterberg CLN has had the highest average annual growth of about 21% followed by Lowveld with 10.8%, Polokwane with 6.2%, Rustenburg with 5.7% and Warmbad with 3.0%. The average annual growth for the North Grid for the period 2009 to 2019 is expected to be 8.2%.
The TDP scheme projects for the North Grid consist of extending the 400kV and 275kV networks as well establishing the 765kV network, the integration of two power stations (Medupi and Mmamabula), and the installation of additional transformers at existing and new substations. The increase in transmission assets by end 2013 and end 2018 and the cumulative total are shown in Table 6 - 6.
Table 6 - 6: North grid new transmission assets
Transmission Development Plan Transmission Development Plan 25
Medupi and Mmamabula integration:• Construct the Medupi-Spitskop first 400kV line 2011• Construct the Medupi-Spitskop second 400kV line 2011• Construct the Medupi-Marang first 400kV line 2012• Construct the Mogwase 2x500MVA 400/132/22kV substation 2013• Loop the Matimba-Midas 400kV line into Mogwase 2013• Construct the Matimba-Mogwase first 400kV line 2014• Construct the Medupi-Mokopane first 400kV line 2014• Construct the Medupi-Witkop first 400kV line 2014• Construct the Delta 400/765kV substation 2014• Construct the Epsilon 765/400kV substation 2014• Construct the Delta-Epsilon first 765kV line operated at 400kV line 2015• Construct the Delta-Epsilon second 765kV line operated at 400kV line 2015• Construct the Mmamabula-Delta/Medupi first 400kV line 2012• Construct the Mmamabula-Delta/Medupi second 400kV line 2012• Construct the Mmamabula-Delta/Medupi third 400kV line 2013• Construct the Mmamabula-Delta/Medupi fourth 400kV line 2013• Loop the Hermes-Pluto first 400kV line into Epsilon 2015• Loop the Hermes-Pluto second 400kV line into of Epsilon 2015
Coal 3 and Coal 4 Integration:• Establish 765/400kV transformation at Delta 2016• Establish 765/400kV transformation at Epsilon 2016• Energise Delta-Epsilon first and second 765kV lines at 765kV 2016• Construct Coal 3 – Delta first, second and third 400kV lines 2016• Construct HVDC Terminal A–Delta first and second 400kV lines 2017• Construct Coal 3–HVDC Terminal A first 400kV lines 2017• Establish HVDC Terminal A (Lephalale) 2017• Construct HVDC 800kV Line 1 (Lephalale-Jupiter B) 2017• Establish HVDC Terminal B (Jupiter B/Johannesburg) 2017• Construct Coal 3–HVDC Terminal A second and third 400kV lines 2018• Construct HVDC 800kV Line 2 (Lephalale-Durban) 2018• Establish HVDC Terminal C (Durban) 2018
6.3.2. Rustenburg CLN
The Rustenburg CLN high load growth, 20% over the past 13 years and averaging 15% over 24 years, is mainly driven by platinum group metals (PGM) and ferrochrome.
Rustenburg CLN is within a radius of 300km from the Waterberg generation pool which makes it the first port of call for 400kV lines integrating Medupi and Mmamabula power stations. This has resulted in portions of the Medupi and Mmamabula integration included in the Rustenburg CLN.
Rustenburg 400kV Strengthening:• Construct Medupi–Marang 400kV line 2011• Establish Mogwase 2x 500MVA 400/132/22kV substation 2013• Loop the Matimba-Midas 400kV line into Mogwase 2013• Construct Medupi-Mogwase 400kV line 2013• Establish Brits West 2x 500MVA 400/132/22kV substation 2017• Loop the two Spitskop-Dinaledi 400kV lines into Brits West 2017

Transmission Development Plan Transmission Development Plan 2010 - 2019 26
6.3.3. Warmbad CLN
The Warmbad CLN consists of Dinaledi, Pelly and Warmbad substations. Load growth is mainly due to PGM mining and new ferrochrome smelting plants as well as industrial and residential growth. To link the Warmbad CLN with the Central Grid, the following 400kV strengthening is proposed:
Construct the Dinaledi-Lomond 400kV line 2014
Establish Lomond 400/275kV transformation 2014
Construct the Lomond-Lulamisa 400kV line 2014
6.3.4. Polokwane CLN
The Polokwane CLN is within a 200km radius from the Waterberg generation pool and is experiencing a high rate of growth. The western portion of the Polokwane load growth is mainly driven by the PGM and ferrochrome growth. The northern part of the Polokwane CLN is mainly rural. Load growth is driven mainly by the electrification programme.
The projects proposed in this CLN are as follows:
Establishment of the New Mokopane 400/132kV Substation• Establish Mokopane 2x 500MVA 400/132/22kV substation 2013• Loop Matimba-Witkop second 400kV line into Mokopane 2013• Construct Medupi-Mokopane first 400kV line 2014• Construct Medupi-Witkop first 400kV line 2014• Construct Mokopane-Witkop first 400kV line 2014• Construct Mokopane-Marble Hall first 400kV line 2014• Construct the Tabor-Witkop first 400kV line 2012• Construct the Tabor 400/132kV substation (1x 500MVA transformer) 2012
Establishment of the new Nzhelele 400/132kV Substation • Establish Nzhelele 400/132kV substation north of Tabor 2015• Construct Tabor-Nzhelele first 400kV line 2015• Construct Medupi-Nzhelele first 400kV line 2017
6.3.5 Lowveld North CLN
The Lowveld CLN forecast changed drastically from July 2008 with the prospects of the existing phosphate mining load increasing at Foskor as well as a new step load customer application at Leseding. This has resulted in the need to revise the Acornhoek –Foskor network to come up with a long-term solution that will address both the 275/132kV.
The projects proposed in this CLN are as follows:
• Foskor-Merensky 2nd 275kV line 2013• Foskor 3rd 250MVA 275/132kV transformer 2013• Leseding 3rd 400/132kV 500MVA transformer 2013
A network diagram showing the major projects in the North Grid is shown in Figure 6 - 6 below. The HVDC lines are not indicated but they will run parallel to the two 765kV routes until the Epsilon substation where they will bypass and head into the Central and East Grids.

Transmission Development Plan Transmission Development Plan 27
Figure 6 - 6: North grid geographical network diagram
A network diagram showing the major projects in the North Grid is shown in Figure 6 - 6 below. The HVDC lines are not indicated but they will run parallel to the two 765kV routes until the Epsilon substation where they will bypass and head into the Central and East Grids.

Transmission Development Plan Transmission Development Plan 2010 - 2019 28
Figure 6 - 7: Current North East grid network and CLNs
6.4. North East grid
The North East Grid consists of four CLNs namely, Highveld North, Highveld South, Lowveld (southern part), and Pretoria. The current transmission network and CLNs are shown in Figure 6 - 7 below.
The expected peak demands by 2014 and 2018 and the average percentage load increase for the period for each CLN are given in Table 6 - 7 below.
Table 6 - 7: North East grid CLN load forecast and percentage load increases
CLN Peak Load (MW) 2008
Forecasted Load (MW)2015 2019
Ave. Annual % Load Increase
Highveld North 2273 2698 2910 2.3
Highveld South 991 1072 1415 3.5
Lowveld 1844 2389 2760 3.8
Pretoria 2196 2815 3380 4.1

Transmission Development Plan Transmission Development Plan 29
6.4.1. Highveld North CLNThe proposed new Gumeni 400/132kV and Rockdale B 400/132kV substation projects will supply increased loads in the Middelburg and Machadodorp areas and remove network constraints. Kusile power station, currently under construction, is located in this CLN. The main projects in the Highveld North CLN are as follows:
Highveld/Lowveld Reinforcement• Loop the Kendal-Duvha 400kV line into Vulcan 2010• Establish Kendal-Arnot first 400kV line 2010• Install Gumeni first 400/132kV 500MVA transformer 2010• Construct Hendrina-Gumeni 400kV line 2010• Establish Kendal-Gumeni first 400kV line 2014 Highveld North Reinforcement• Install the Rockdale B 400/132kV, 2x500MVA transformers 2011• Install the Rockdale B 132/88kV, 2x160MVA transformers 2010
Kusile Power Station Integration • Construct the Kusile 400kV switching station 2011• Loop the Duvha-Minerva first 400kV line into Kusile 2011• Construct the Kusile-Lulamisa 400kV line 2012• Loop the Kendal-Apollo first 400kV line into Kusile 2013• Bypass Duvha to form the Kusile-Vulcan 400kV line 2013• Construct the Kendal-Zeus 400kV line 2014• Construct the Kusile-Zeus 400kV line 2014
The TDP schemes for the North East Grid consist of extending the 400kV network, the integration of two power stations (Kusile and Tubatse), and the installation of additional transformers at existing and new substations. The increase in transmission assets by end 2014 and end 2019 and the cumulative total are shown in Table 6 - 8.
Table 6 - 8: Cumulative TDP transmission assets for the North East grid
Transmission Asset for North-East grid
New Assets expected in 2010 - 2014
New Assets expected in 2015 - 2019
Total New Assets expected
Total kms of line 1 167 215 1 382
765kV Lines (km)
400kV Lines (km)
275kV Lines (km)
0
1 124
49
0
155
80
0
1 279
103
Total installedTransformer MVA
8 000 4 200 12 850
Transformers (no. of) 21 6 27
Capacitors (no. of) 2 0 2
Reactors (no. of) 0 0 0
Transmission Development Plan Transmission Development Plan 2010 - 2019 30
6.4.2 Highveld South CLN
The Highveld South CLN network will be placed under additional strain as a result of the Cape 765kV network strengthening, in addition to local load growth and East Grid load growth.
The proposed Highveld South strengthening project will take into account all the issues mentioned above. The only major project that is taking place in Highveld South is shown below, the Sol B switching station that was in the previous TDP is no longer necessary.
Highveld South Strengthening• New Sol B 400/132kV with 2x 120MVA transformers 2013• Loop Kriel-Zeus 400kV line into Sol B,. 2013• Loop Matla-Grootvlei 400kV line into Sol B 2013• Decommissioning the Sol B-Zeus portion 2013
6.4.3. Lowveld CLN
With the fast growth in Lowveld CLN, especially in the Steelpoort and Groblersdal area, it is necessary to strengthen the transmission network to meet the future development. One new 400/132kV substations will be needed in the Lowveld north-west area at Marble Hall, and Senakangwedi will need reinforcement. The proposed new pumped-storage power station Tubatse will be located in Lowveld CLN near Steelpoort. The potential increased power export to Mozambique will also require network strengthening in the Lowveld CLN. The main projects in the Lowveld CLN are as follows:
Lowveld Strengthening Phase 1 • Install the Malelane second 275/132kV 1x 250MVA transformer 2014• Construct the Marathon–Malelane second 275kV line 2014
Lowveld Strengthening Phase 2• Establish Marathon B first 400/275kV 800MVA transformer 2012• Construct the first Gumeni–Marathon B 400kV line 2012• Construct the second Marathon B-Gumeni 400kV line 2014
Tubatse Pumped-storage Power Station Integration• Construct Tubatse–Leseding first 400kV line 2014• Construct Tubatse–Duvha first 400kV line 2014• Construct Tubatse–Merensky first 400kV line 2014 Lowveld West Strengthening • Establish Marble Hall 2x 500MVA transformers 2014• Construct Marble Hall Rockdale B first 400kV line 2014• Construct Marble Hall–Tubatse first 400kV line 2014• Construct Marble Hall–Mokopane first 400kV line 2014
Lowveld North Strengthening• Senakangwedi 1x 400MVA 400/275kV transformer 2014• Senakangwedi 1x 250MVA 400/132kV transformer 2014• Loop Tubatse – Merensky 400kV line into Senakangwedi 2014
Transmission Development Plan Transmission Development Plan 31
6.4.4. Pretoria CLN
Rezoning of the Tshwane Metro network is necessary to ensure adequate capacity for the city’s development. Transmission network injections will be needed at Tshwane Metro’s existing Buffel supply point and Wildebees. The other substations supplying Tshwane Metro will also experience load growth, namely, Kwagga, Njala, and Verwoerdburg. The projects in Pretoria CLN are as follows:
Tshwane Metro Rezoning• Establish 400/275/132kV substation at Phoebus 2012• Establish 400kV busbar at Phoebus 2012• Install 2x250MVA, 400/132kV line bank transformer at Phoebus 2012• Convert the Hangklip-Pelly 132kV line into Phoebus-Pelly line and energise at 275kV 2012• Loop Apollo-Dinaledi 400kV line into Phoebus 2011• Upgrade the 132kV Garankuwa-Hangklip line 2012• Establish 400kV busbar at Wildebees 2012• Loop and out Apollo-Phoebus 400kV line at Wildebees 2012• Establish a 400/275/132kV substation at Phoebus 2012• Install 1x250MVA, 400/132kV transformer at Phoebus 2012• Install 1x400MVA, 400/275kV at Phoebus 2012• Operate Hangklip-Pelly 132kV line as Phoebus-Pelly at 275kV 2012• Loop the Apollo-Dinaledi 400kV line into Phoebus 2012 • Upgrade the 132kV Garankuwa-Hangklip line 2012• Loop Apollo-Phoebus 400kV line into Wildebees 2013• Establish a 400kV busbar at Verwoerdburg 2012• Loop Apollo-Pluto 400kV line into Verwoerdburg 2012• Install 2x250MVA, 400/132kV transformers at Verwoerdburg 2012• Construct 1x275kV line from Lomond to Kwagga 2013• Construct Dinaledi-Hangklip first 132kV twin Kingbird line 2017• Install Verwoerdburg third 250MVA, 400/132kV transformer 2017• Install Phoebus second 250MVA, 400/132kV transformer 2022

Transmission Development Plan Transmission Development Plan 2010 - 2019 32
A network diagram showing the major projects in the North East Grid is shown in Figure 6 - 8 below.
Figure 6 - 8: North-East grid network diagram

Transmission Development Plan Transmission Development Plan 33
6.5. North West grid
The North-West Grid is composed of four CLNs namely Bloemfontein, Carletonville, Kimberly, and Welkom. The current transmission network and CLNs are shown in Figure 6 - 9 below.
Figure 6 - 9: Current North West grid network and CLNs
The 765kV network is primarily used for transport of power through the grid to the Cape. The projects for the North West Grid are mainly the introduction of 400kV lines and transformation to support or relieve the 275kV networks. The load growth in the grid is shown below in Table 6 - 9.
Table 6 9: North West grid CLN load forecast and percentage load increases
CLN Peak Load(MW) 2008
Forecasted Load (MW) 2015 2019
Ave. Annual % Load Increase
Bloemfontein 447 496 517 2
Carletonville 1732 2064 2094 2
Kimberley 531 745 1742 8
Welkom 758 868 944 1

Transmission Development Plan Transmission Development Plan 2010 - 2019 34
The next stage of the reinforcement of the Main Cape Corridor if required in 2019 will pass through the North West grid, linking Epsilon 765kV to Gamma 765kV via Perseus 765kV. The total length of this 765kV line project has been allocated to this grid.
The increase in transmission assets by end 2014 and end 2019 and the cumulative total are shown in Table 6 - 10.
Table 6 - 10: Cumulative assets for North West grid
6.5.1. Carletonville CLN
Carletonville CLN is dominated by gold mining load, which is expected to remain static. Growth is expected to come from electrification and throughput load from the Waterberg power stations to the West Rand, and from 2013 to Kimberley CLN via Vryburg. Additional load growth may occur due to new platinum mines north of Watershed. The only project in the CLN is as follows:
Watershed B 400/132kV Substation• Build a 400kV line from Epsilon to Watershed B substation 2017• Establish 400/132kV transformation at Watershed B 2017
6.5.2. Bloemfontein CLN
The Bloemfontein CLN is largely agricultural, with the commercial and industrial hub of Bloemfontein. It also supplies Lesotho via Merapi substation, which supplies other load in the central and south eastern Free State. The project running in this CLN is as follows:
Bloemfontein Strengthening • Install a +100/-100 MVar SVC at Merapi 2012• Construct the Everest-Merapi 275kV line 2017• Construct the Merapi third 275/132kV 180MVA transformer 2017
Transmission Asset for North-West grid
New Assets expected in 2010 - 2014
New Assets expected in 2015 - 2019
Total New Assets expected
Total kms of line 2 325 1 335 3 660
765kV Lines (km)
400kV Lines (km)
275kV Lines (km)
1 825
390
110
740
595
0
2 565
985
110
Total installedTransformer MVA
3 500 2 125 5 625
Transformers (no. of) 5 5 10
Capacitors (no. of) 3 0 3
Reactors (no. of) 11 7 18

Transmission Development Plan Transmission Development Plan 35
6.5.3. Welkom CLN
Welkom CLN is dominated by gold mining, which is expected to remain static over the next ten years given the assumption that the gold price will remain static in real terms. No projects are identified in this CLN.
6.5.4. Kimberley CLN
The Kimberley CLN load consists mainly of base metal and diamond mining, the former being the main driver of load growth. Intensive agriculture along the Orange River is also a major contributor. The Kimberley CLN is supplied by the long 275kV network to Ferrum which now requires reinforcement. The North West 400kV reinforcement scheme will provide a link between the Kimberley CLN and the Carletonville CLN by 2013. This will assist with the integration of the Medupi, Coal 3 and Mmamabula power stations. The 400kV link will be extended via Garona and Nieuwehoop to Aries by 2017 to support additional railway traction load, the north-western part of West Grid, and Namibia (West Grid projects).
The following projects are proposed for Kimberley CLN:
North West 400kV Strengthening Phase 1 • Install 2 x 36MVAr shunt capacitors at Olien 2010• Install 1 x 72MVAr shunt capacitor at Ferru 2010• Install a 132kV +-100MVAr SVC at Ferrum 2011
North West 400kV Strengthening Phase 2 • Install 2 x 500MVA 400/132kV transformers at Ferrum 2012• Construct the Ferrum–Vryburg first 400kV line 2012• Construct the Mercury–Vryburg first 400kV line 2013• Construct the Vryburg 400/132kV substation 2013
North West 400kV Strengthening Phase 3 • Construct the Epsilon–Vryburg first 400kV line 2016
North West 400kV Strengthening Phase 4 • Construct the Epsilon–Vryburg second 400kV line (via Hotazel) 2017 North West 400kV Strengthening Phase 5 • Loop Epsilon–Vryburg second 400kV line into Hotazel 2019• Construct the Hotazel 400/132kV substation 2019
Transmission Development Plan Transmission Development Plan 2010 - 2019 36
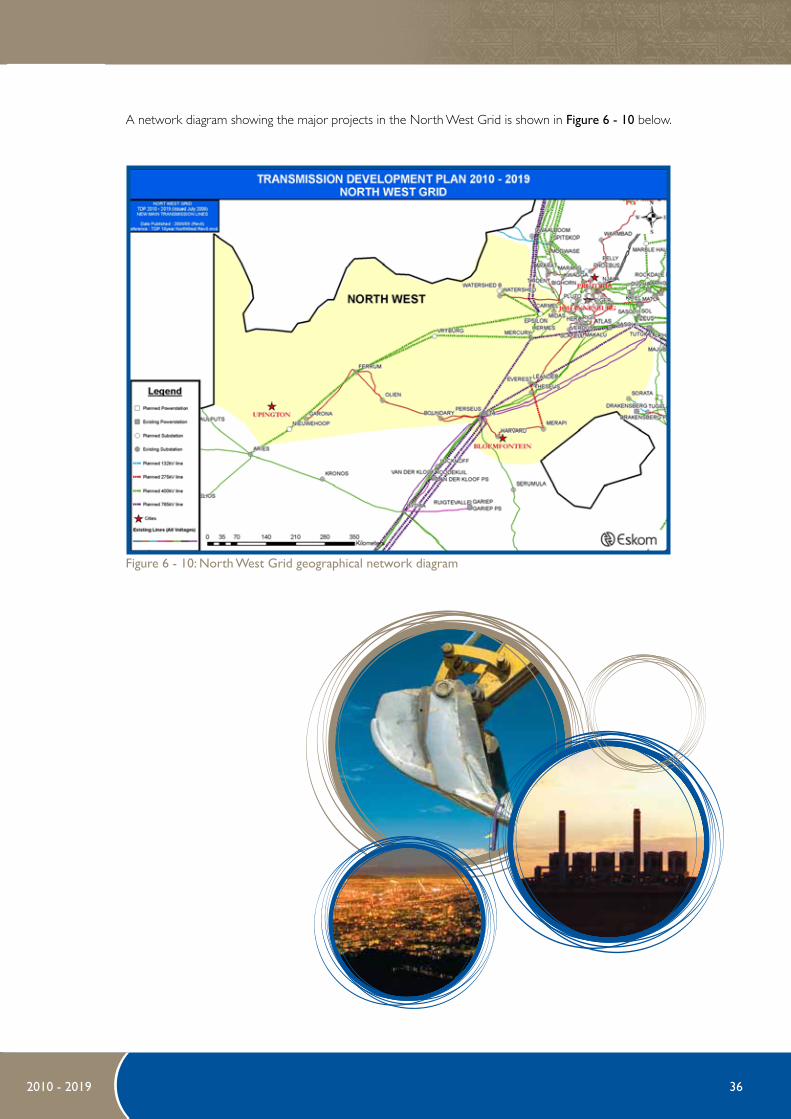
A network diagram showing the major projects in the North West Grid is shown in Figure 6 - 10 below.
Figure 6 - 10: North West grid geographical network diagram
Transmission Development Plan Transmission Development Plan 37
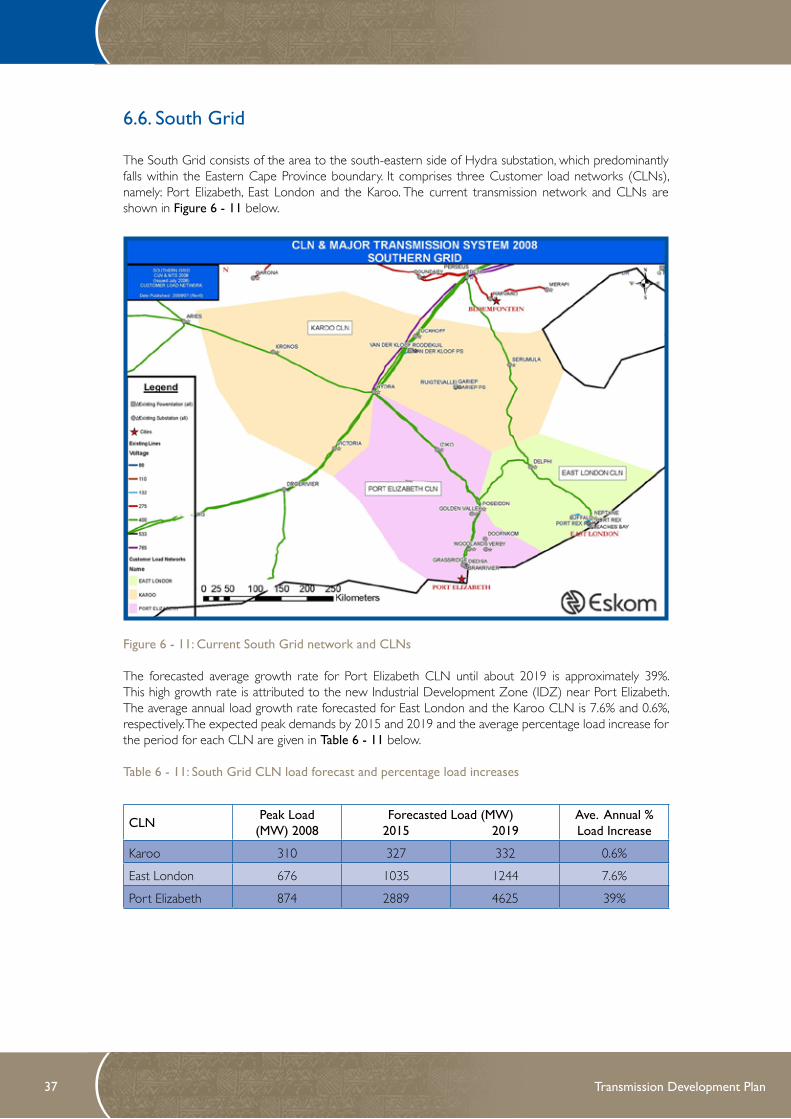
6.6. South grid
The South Grid consists of the area to the south-eastern side of Hydra substation, which predominantly falls within the Eastern Cape Province boundary. It comprises three Customer load networks (CLNs), namely: Port Elizabeth, East London and the Karoo. The current transmission network and CLNs are shown in Figure 6 - 11 below.
Figure 6 - 11: Current South grid network and CLNs
The forecasted average growth rate for Port Elizabeth CLN until about 2019 is approximately 39%. This high growth rate is attributed to the new Industrial Development Zone (IDZ) near Port Elizabeth. The average annual load growth rate forecasted for East London and the Karoo CLN is 7.6% and 0.6%, respectively. The expected peak demands by 2015 and 2019 and the average percentage load increase for the period for each CLN are given in Table 6 - 11 below.
Table 6 - 11: South grid CLN load forecast and percentage load increases
CLN Peak Load(MW) 2008
Forecasted Load (MW) 2015 2019
Ave. Annual % Load Increase
Karoo 310 327 332 0.6%
East London 676 1035 1244 7.6%
Port Elizabeth 874 2889 4625 39%

Transmission Development Plan Transmission Development Plan 2010 - 2019 38
The TDP schemes for the South Grid consists of the integration of the new Dedisa 400/132kV substation, the Grassridge 765kV integration, Iziko, and Serumula series compensation as proposed for the supply to the Coega IDZ. Further, the Greater East London Strengthening Scheme, which includes the integration of a new 400/132kV substation around Mthatha, has already been approved.
The increase in transmission assets by end 2014 and end 2019 and the cumulative total are shown in Table 6 - 12.
Table 6 - 12: Cumulative TDP transmission assets for the South grid
Transmission Asset for Southern grid
New Assets expected in 2010 - 2014
New Assets expected in 2015 - 2019
Total New Assets expected
Total kms of line 1 467 941 2 406
765kV Lines (km)
400kV Lines (km)
275kV Lines (km)
1260
207
0
410
531
0
1 670
738
0
Total installedTransformer MVA
4 580 1 000 5 580
Transformers (no. of) 8 3 11
Capacitors (no. of) 8 0 8
Reactors (no. of) 8 2 11
Transmission Development Plan Transmission Development Plan 39
6.6.1. Port Elizabeth CLN
The Port Elizabeth CLN consists of the greater Port Elizabeth metropolitan area (Nelson Mandela Bay Municipality) and surrounding rural areas. The greatest drivers of load growth are the Coega IDZ and Port of Ngqura, which are expected to host energy-intensive industries in addition to the cargo handling and warehousing facilities usually found at a modern port. The aluminium smelter proposed for Coega has been placed on hold, but it is assumed for purposes of the current TDP that it will require its permanent supply in 2013.
The TDP network developments in this CLN entail the following:
Aluminium Smelter Potline 1 (dedicated) Scheme• Construct the Aluminium 400kV switching station (2x 400kV feeders to smelter) 2013• Construct the Aluminium-Dedisa first 400kV line 2013• Construct the Aluminium-Grassridge first 400kV line (extension of Dedisa- 2013• Construct the Grassridge 400kV line with bypass) 2013• Construct the Dedisa Ext 400kV first SVC 2013• Grassridge Decommissioning first 132kV SVC 2013• Construct the Grassridge Ext 400kV first SVC 2013
Port Elizabeth Strengthening Scheme Phase 3• Install the first 400kV 100MVAr capacitor at Dedisa Ext 2013• Install the first 400kV 100MVAr capacitor at Delphi Ext 2013• Install the first 400kV 100MVAr capacitor at Grassridge Ext 2013• Install the first 400kV 100MVAr capacitor at Poseidon Ext 2013
Port Elizabeth Strengthening Scheme Phase 4• Install the first 400kV 100MVAr capacitor at Dedisa Ext 2013• Install the first 400kV 100MVAr capacitor at Delphi Ext 2013• Install a second 400kV 100MVAr capacitor at Grassridge Ext 2013• Install a second 400kV 100MVAr capacitor at Poseidon Ext 2013 South grid Strengthening Phase 3• Construct Gamma-Grassridge first 765kV line 2013• Install Grassridge Ext 765/400kV transformation 2013
DME OCgT Integration at Dedisa 400kV • Install Dedisa Ext 3x 400kV feeder bays (DME OCGT integration) 2012
grassridge Ext third 400/132kV 500MVA transformation• Install Grassridge Ext third 400/132kV 500MVA transformer 2015 Aluminium Smelter Potline 2 (dedicated) • Establish Aluminium 400kV switching station 1x 400kV feeder 2013
South grid Strengthening Phase 4• Construct Gamma-Grassridge second 765kV line 350km 2014
Port Elizabeth substation integration-Phase 1: Port Elizabeth Substation• Install Port Elizabeth 400/132kV substation (new) 2016• Construct a Port Elizabeth – Grassridge 40km, 400kV 2016

Transmission Development Plan Transmission Development Plan 2010 - 2019 40
6.6.2. East London CLN
The East London CLN consists of the Greater East London metropolitan area, Queenstown area, and southern half of the former Transkei. Load growth is dominated by electrification in the former Ciskei and Transkei, with a further contribution from the East London IDZ at Leach’s Bay. A new 400/132kV substation (Vuyani) will be required at Mthatha to address low voltages and overloading on the distribution network, especially when the hydro generation at Umtata first and second Falls and Collywobbles (Mbashe) is not available. Vuyani will be supplied from the proposed Eros-Vuyani-Neptune 400kV line, which together with the Poseidon-Neptune 400kV line comprises the Greater East London Strengthening, which will supply South Grid, and East London CLN in particular, from East Grid.
Future network developments in this CLN entail the following:
Pembroke 132kV Feeder (Debe Nek)• Construct the Pembroke Ext 132kV feeder bay (Debe Nek) 2012
greater East London Phase 1• Establish Vuyani 400/132kV Substation 2012• Construct Eros-Mthatha (Vuyani) 400kV line to improve voltages at Mthatha 2012
greater East London Phase 2 (South grid Project with impact on East grid) • Construct Vuyani-Neptune 400kV line 2013• Construct Poseidon-Neptune 400kV line 2013
greater East London Strengthening Phase 3• Construct the Pembroke B 400/132kV substation and 400kV turn-ins 2016
Transmission Development Plan Transmission Development Plan 41
6.6.3. Karoo CLN
The Karoo CLN consists of Hydra, Ruigtevallei, Roodekuil, and Van Der Kloof substations. Hydra is a major hub on the Cape Corridor. The Cape strengthening projects will reduce the Cape’s dependence on Hydra. The latter three stations integrate Gariep and Van Der Kloof hydro power stations into the network and supply loads on either side of the upper Orange River. Load growth is not expected to be sufficient in its own right to trigger reinforcement projects, except to cater for throughput to other areas. However, parts of the network were not designed to meet the network redundancy requirements specified in the March 2008 update of the Grid Code, since they were not previously a requirement. Funding shortages, however, mean that only those constraints that can be addressed by adding another transformer can be addressed at present.
In addition to transmission projects identified to resolve capacity and security of supply constraints in the Karoo CLN, some of the Cape corridor strengthening scheme project will be commissioned within the boundaries of the Karoo CLN to improve the transmission corridor capacity to the entire South and West Grid between 2010 and 2019. The Karoo CLN network development involves the following:
Cape Corridor Strengthening Scheme Phase 1• Construct the Gamma Ext 765kV busbar 2012• Construct the Gamma Ext second 400MVar 765kV busbar reactor 2012• Construct the Hydra-Gamma first 765kV line 2012 South grid Strengthening Phase 3• Construct the Gamma Ext 765kV busbar 2012
Cape Corridor Strengthening Scheme Phase 2• Construct the Gamma-Kappa first 765kV line 2010• Construct the Kappa 765/400kV substation 2010• Construct the Kappa Ext 400kV 100MVAr shunt reactor 2010
Cape Corridor Strengthening Scheme Phase 4• Construct the Gamma-Kappa first 765kV line 2016

Transmission Development Plan Transmission Development Plan 2010 - 2019 42
The geographical network of the South Grid is shown in Figure 6 - 12 below.
Figure 6 - 12: The South grid networks diagram

Transmission Development Plan Transmission Development Plan 43
6.7 . West grid
The West Grid consists of four CLNs, namely, Peninsula, Southern Cape, West Coast and Namaqualand. The current transmission network and CLNs are shown in Figure 6 - 13 below.
Figure 6 - 13: Current West grid network and CLNs
The Western Cape customer base consists of consumers within the South African border, as well as international customers (NamPower and Skorpion in Namibia). Natural load growth for the South African consumers is forecasted to be in the region of 2.5% per year for the West Cape as a whole. The expected peak demands by 2015 and 2019 and the average percentage load increase for the period for each CLN are given in Table 6 - 13 below.
Table 6 - 13: West grid CLN loads and percentage load increases
Included in the TDP studies is the forecasted export to Namibia via the 400kV and 220kV interconnections. The export amount has been assumed to remain constant over the TDP period.
The TDP schemes for the West Grid consist of extending the 400kV network and introducing 765kV injection at two points, namely Omega and Kappa. There is also the installation of additional transformers at existing and new substations.
CLN Peak Load (MW) 2008
Forecasted Load (MW) 2015 2019
Ave. Annual % Load Increase
Namaqualand 177 211 233 2.9%
West Coast 521 542 556 0.6%
Southern Cape 845 1017 1135 3.0%
Peninsula 2477 2861 3122 2.4%
International + future step loads 200 200 300 4.5%
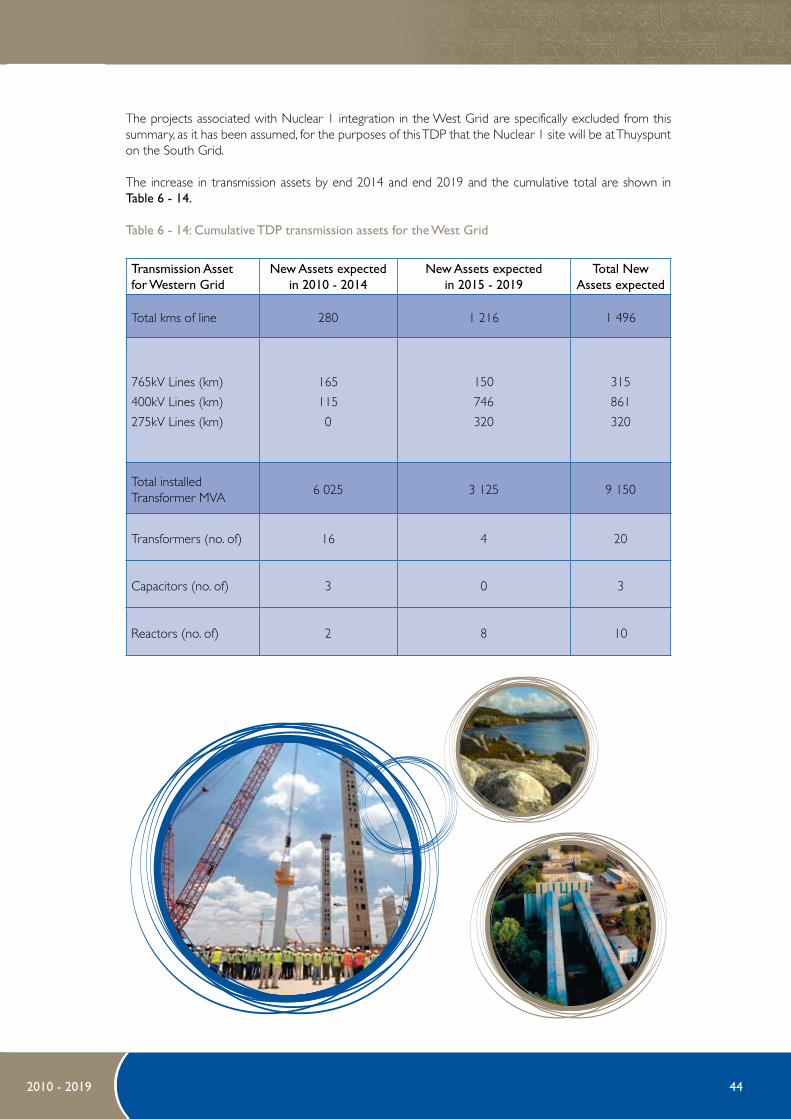
Transmission Development Plan Transmission Development Plan 2010 - 2019 44
The projects associated with Nuclear 1 integration in the West Grid are specifically excluded from this summary, as it has been assumed, for the purposes of this TDP that the Nuclear 1 site will be at Thuyspunt on the South Grid.
The increase in transmission assets by end 2014 and end 2019 and the cumulative total are shown in Table 6 - 14.
Table 6 - 14: Cumulative TDP transmission assets for the West grid
Transmission Asset for Western grid
New Assets expected in 2010 - 2014
New Assets expected in 2015 - 2019
Total New Assets expected
Total kms of line 280 1 216 1 496
765kV Lines (km)
400kV Lines (km)
275kV Lines (km)
165
115
0
150
746
320
315
861
320
Total installedTransformer MVA
6 025 3 125 9 150
Transformers (no. of) 16 4 20
Capacitors (no. of) 3 0 3
Reactors (no. of) 2 8 10

Transmission Development Plan Transmission Development Plan 45
6.7.1. Main Cape Corridor
The West and the South grids are supplied from the common Cape corridor to the north of Gamma substation. In 2008 the combined demand of the West and South grids was ±5500MW. The difference between the combined output of local generation and the load must be supplied from the generation pool in the Highveld via the transmission lines. The main corridor schemes are as follows:
Cape Corridor 765kV – Phases 2 and 3, • Construct the first Zeus-Perseus-Gamma-Kappa-Omega 765kV line 2012• Establish 765kV series compensation of the corridor north of Beta/Perseus + first Hydra-Gamma 765kV line 2012
Cape Corridor 765kV – Phase 4 • Construct the second Zeus-Perseus-Gamma-Omega 765kV line 2017
If there is no additional nuclear generation in the Cape, then the Main Cape Corridor will have to be reinforced again by 2019. It is proposed that the 765kV be extended from Epsilon via Perseus down to Gamma to reinforce the Main Cape Corridor. This 765kV line extension is included in the TDP as a proposed project to indicate that a significant project is required by 2019. This 765kV may be either further reinforced or possibly replaced by an HVDC line from either Coal 3 via Epsilon or from the Witbank area via Zeus down to either Gamma or Omega.
6.7.2. Cape Peninsula CLN
The network in this area supplies primarily the Cape Town metropolitan area. Additional 400/132kV transformers will be required at Acacia and Philippi. The latter will be relocated to Mitchells Plain when that substation is built. The proposed second Koeberg-Acacia 400kV line will provide additional in-feed capacity for Cape Town at Acacia and Philippi beyond 2012. This line will be formed by energising the existing Koeberg-Acacia 132kV line at 400kV, which was built to 400kV standards in anticipation of this upgrade. Firgrove 400/132kV substation is to be built near Somerset West to supply the Somerset West, Strand, and Stellenbosch areas. It is proposed to establish a new 400/132kV substation in the Mitchells Plain area to relieve the loading at Philippi by constructing two 400kV lines from Firgrove substation.
The projects within the Cape Peninsula CLN are as follows:
• Install Acacia third 500MVA 400/132kV transformer 2010
• Install Philippi third 500MVA 400/132kV transformer 2013
• Establish gas 1 off-site supply 2012
• Establish Firgrove 400/132kV substation 2013
• Install Muldersvlei third 500MVA transformer and series reactor 2013
• Establish Mitchells Plain 400/132kV substation 2015
Transmission Development Plan Transmission Development Plan 2010 - 2019 46
6.7.3. West Coast CLN
The West Coast, Namaqualand, and parts of the Peninsula CLN are supplied via the Hydra-Aries-Aurora power corridor. It is proposed to create a new Ferrum-Aries 400kV power corridor once both the Mercury-Ferrum and Epsilon-Ferrum 400kV corridors have been established.
Sishen-Saldanha traction upgradeIn addition to the strengthening projects, the Sishen-Saldanha traction upgrade project would result in the establishment of four new 400kV traction substations, including one between Aries and Garona, near Nieuwehoop – around 2013/14. In order to achieve this, a 400kV line will be constructed from Aries to Nieuwehoop where the 400kV traction substation will be established.
The strengthening projects within the West Coast CLN are as follows:
• Construct the Aries SVC 2012
• Construct Sishen Saldanha Phase 1 (1x275/50kV s/s + garona SVC) 2012
• Construct Sishen Saldanha Phase 2 (4x400/50kV s/s + Aries-Nieuwehoop line) 2013/14
• Construct the Ferrum-Nieuwehoop 400kV line 2015
• Upgrade Juno to 2x80MVA, 132/66/22kV transformers 2016
6.7.4. Namaqualand CLN
The Namaqualand CLN is supplied via the Aggeneis MTS. All the stations in this CLN have single in-feeds. A number of projects are included to bring it into compliance with the minimum security standard of N-1 redundancy.
The projects within the Namaqualand CLN are as follows:
• Install Paulputs second 220/132kV 125MVA transformer 2015
• Construct Aggeneis-Helios 400kV line 2016
• Construct Aggeneis-Nama-gromis-Oranjemund second 220kV line 2016
• Construct Aggeneis-Paulputs second 220kV line 2016
Northern Cape Reinforcement Ferrum–garona–Nieuwehoop 400kV • Install Garona 1 x 125MVA 400/132kV transformer 2017• Construct Ferrum–Garona first 400kV line 2017• Construct Garona–Nieuwehoop first 400kV line 2017

Transmission Development Plan Transmission Development Plan 47
6.7.5. Southern Cape CLN
This CLN includes Beaufort West, Oudtshoorn, the Garden Route, and the Overberg. The main strengthening foreseen in this CLN is to accommodate the conversion of OCGT generation at Gourikwa to CCGT, which will require additional 400kV lines to evacuate the resulting increased output. The date of this project is uncertain, and it is, therefore, assumed that it will materialise around 2019. The projects within the Southern Cape CLN are as follows:
• Establish the Blanco 400/132kV Substation 2016
• Construct the third gourikwa-Proteus 400kV line 2019
• Construct the second Proteus-Droërivier 400kV line 2019
A diagram showing the major projects in the West Grid is shown in Figure 6 - 14 below.
Figure 6 - 14: West grid geographical network diagram

Transmission Development Plan Transmission Development Plan 2010 - 2019 48
6.8. Strategic Servitudes under Investigation
All the line projects and new substation projects that are proposed in the document need to go through a full environmental impact assessment (EIA) process. This process includes public participation meetings, which are advertised in the media. Concerns of the public and affected parties are addressed at the public participation meetings. Eskom Holdings will not commence construction of any line or substation without the EIA process (Record of Decision being signed and servitudes acquired) being concluded.
The proposed lines shown in various schematics in this document give an estimation of where various proposed lines will run. The outcome of the EIA process will determine the exact position of the lines. The projects in this document are at various stages of the EIA process.

Transmission Development Plan Transmission Development Plan 49
Figure 7 - 1: Summary of Capital Expenditure in the Transmission Division
Refurbishment and land acquisition projects are the second and third-most expensive items in the capital expenditure, respectively. Refurbishment is required to prolong the life of assets and land acquisition projects are required to purchase the land in which to build the expansion assets.
A summary of expansion capital expenditure per project type required to realise this TDP is shown in Table 7 - 1. The total expenditure is expected to be approximately of R 145 billion, this is approximately R 35 billion higher than the previous TDP. This is as a result of new integration work required for the new power stations that have been included in this TDP. It should be noted that the amounts submitted for the MYPD tariff application may differ slightly from the amounts shown here, especially for expansion projects. this is due to adjustments made for the eventuality of some Generation scenarios materialising.
Table 7 - 2: Reliability capital expenditure per project type
Type Total R’mil
Customer 3,783
Generation 35,902
Reliability 105,395
grand Total 145,080
Please note that the amounts in the tables represents cash flows in the TDP period, any cash flows not falling within this period have not been added, consequently the total cost of the plan may be higher that reflected here.
The details of costing per CLN and Project type are shown in Appendix B.
7. Capital Expenditure PlanThe total capital expenditure including expansion, refurbishment, facilities, production equipment, and land acquisition project costs amount to R 176 billion. This summary is shown in Table 7 - 1. and Figure 7 - 1 below. It is clear that the majority of the cost will be expansion related as this relates directly to the strengthening of the network to accommodate new customers as well as new generation.
Table 7 - 1: Capital Expenditure per year for different categories of projects
Capital Expenditure for Year Ending (R’Mil)
Categories 2011 2012 2013 2014 2015 2016 2017 2018 2019 2020 Totals
Refurbishment 812 883 1,235 1,505 1,529 1,600 1,650 1,700 1,750 1,800 14,464
Expansion 12,693 9,281 14,696 14,580 20,064 21,091 21,399 9,921 10,417 10,938 145,081
Other 228 510 396 692 582 513 667 207 226 227 4,249
Land Acquisition 569 681 839 750 804 576 605 635 667 700 6,827
Capital Spares 709 454 478 450 473 496 521 547 574 603 5,305
Production Equipment 98 69 62 66 63 74 77 81 85 93 770
15,110 11,877 17,706 18,045 23,514 24,351 24,920 13,092 13,720 14,362 176,695
Transmission 10 Yr Capex PlanFY2010/11 - FY2019/20
-
5,000
10,000
15,000
20,000
25,000
30,000
Financial Years
Ran
d M
illio
ns
Production Equipment 98 69 62 66 63 74 77 81 85 93 OTHER 228 510 396 692 582 513 667 207 226 227 L&R 569 681 839 750 804 576 605 635 667 700 Capital Spares 709 454 478 450 473 496 521 547 574 603 Refurbishment 812 883 1,235 1,505 1,529 1,600 1,650 1,700 1,750 1,800 Expansion 12,693 9,281 14,696 14,580 20,064 21,091 21,399 9,921 10,417 10,938
2010/11 2011/12 2012/13 2013/14 2014/15 2015/16 2016/17 2017/18 2018/19 2019/20

Transmission Development Plan Transmission Development Plan 2010 - 2019 50
8. Concluding Remarks
The economic slowdown as well as efforts to promote demand side management through the use solar geysers, compact fluorescent lamps and encouraging saving of electricity has greatly assisted in reducing major supply constraints. The impact of the recession is, however, expected to be short term in nature, and there should be a return to pre-recession demand levels and forecasts soon. Hence we believe it will be necessary to proceed with the planned infrastructure development.
This TDP has many similarities with the previous one as far as projects are concerned. At the end of the period of this TDP, it is expected that the transmission network will be fully compliant to the reliability requirements of the Grid Code that were amended in 2008. It is also expected that there will less stress on the supply side as most of the new power stations will be on line.
The TDP clearly indicates that extensive expansion of the transmission system is required. This is because many parts of the transmission network are not fully compliant with the reliability and/or quality of supply standards. In addition, due to the expected continued electricity demand growth network capacity limitations are being approached in many areas of the network. Moderate step loads may trigger significant backbone strengthening.
Re-phasing and prioritisation of projects to meet process, resource and capital constraints has resulted in numerous projects being deferred. The result is that the period to attain Grid Code compliance has been prolonged. This implies that there is increased risk to the network as there are more MTS sites and transmission corridors that are or will be un-firm for longer periods. Some of the risk mitigation measures under consideration include higher reliance on the following: utilisation of Strategic Spares, the use of Capacitors in the short term for voltage support, as well as Emergency Preparedness Plans.
The introduction of new power stations as well as transmission strengthening lead to switchgear short circuit current ratings of equipment being approached or breached. Unless well co-ordinated, this may pose a safety, health and environmental risk. Upgrades and/or network re-configuration are required to mitigate these risks.
Robust and efficient planning requires the timely exchange of credible information between stakeholders. In particular stakeholders are requested to note that spatial data and information are critical for effective transmission network planning and development. While good progress is noted with regard to development of distribution master plans, efforts to implement improved spatial transmission forecast need to be intensified and sustained.
Transmission infrastructure could easily become the critical path in connecting and integrating generation due to long lead times for securing corridors. We recommend that for planning purposes a provision of at least 7-year lead time be made for new corridors. It should also be noted that there are increasing objections from land owners to proposed power line routes through the EIA process, which may further prolong the time to implement projects.
Research and feasibility studies are required on HVDC technology to ensure its availability for major corridors for coastal nuclear or Waterberg coal scenarios. In addition recycling of certain transmission networks (especially 275kV to 400kV) in Gauteng and KwaZulu-Natal will be needed in the long term.

Transmission Development Plan Transmission Development Plan 51
Appendix A: Generation AssumptionsAppendix A1: generation capacity assumptions - Coal 4
Year Power Station Name New Units Total Units Unit Details Total Capacity
2010Grootvlei
Komati
2
6
6
9
190MW coal fired
101MW PF units
1128MW
918MW
2011OCTG 1 (Dedisa)
OCTG 2 (Avon)
2
5
2
5
147MW LNG gas
147MW LNG gas
294MW
735MW
2012Medupi
Ingula
1
1
1
1
800MW coal fired
333MW pmp/strg
800MW
333MW
2013Medupi
Ingula
1
3
2
4
800MW coal fired
333MW pmp/strg
1600MW
1332MW
2014
Medupi
Kusile
Mmamabula
UCG 1 (Majuba)
2
2
1
4
4
2
1
4
800MW coal fired
800MW coal fired
600MW coal fired
275MW coal gas
3200MW
1600MW
600MW
1100MW
2015
Medupi
Kusile
Mmamabula
Lima (Steelpoort)
1
1
1
3
5
3
2
3
800MW coal fired
800MW coal fired
600MW coal fired
371MW pmp/strg
4000MW
2400MW
1200MW
1113MW
2016
Medupi
Kusile
Coal 3 (Waterberg)
Lima (Steelpoort)
UCG 1 (Majuba)
1
2
2
1
4
6
5
2
4
8
800MW coal fired
800MW coal fired
800MW coal fired
371MW pmp/strg
275MW coal gas
4800MW
4000MW
1600MW
1484MW
2200MW
2017Kusile
Coal 3 (Waterberg)
PS C (Western Cape)
1
2
3
6
4
3
800MW coal fired
800MW coal fired
371MW pmp/strg
4800MW
3200MW
1113MW
2018Coal 3 (Waterberg)
PS C (Western Cape)
2
1
6
4
800MW coal fired
380MW pmp/strg
4800MW
1484MW
2019 Coal 4 (Waterberg) 2 2 800MW coal fired 1600MW
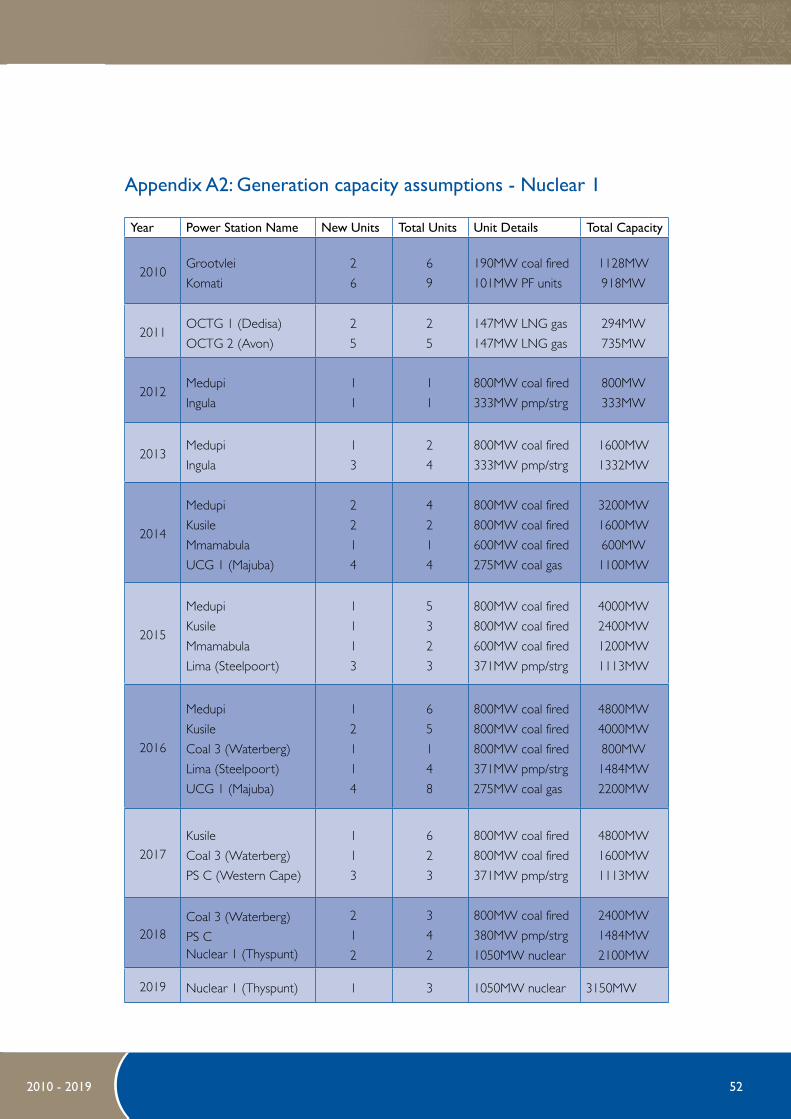
Transmission Development Plan Transmission Development Plan 2010 - 2019 52
Appendix A2: generation capacity assumptions - Nuclear 1
Year Power Station Name New Units Total Units Unit Details Total Capacity
2010Grootvlei
Komati
2
6
6
9
190MW coal fired
101MW PF units
1128MW
918MW
2011OCTG 1 (Dedisa)
OCTG 2 (Avon)
2
5
2
5
147MW LNG gas
147MW LNG gas
294MW
735MW
2012Medupi
Ingula
1
1
1
1
800MW coal fired
333MW pmp/strg
800MW
333MW
2013Medupi
Ingula
1
3
2
4
800MW coal fired
333MW pmp/strg
1600MW
1332MW
2014
Medupi
Kusile
Mmamabula
UCG 1 (Majuba)
2
2
1
4
4
2
1
4
800MW coal fired
800MW coal fired
600MW coal fired
275MW coal gas
3200MW
1600MW
600MW
1100MW
2015
Medupi
Kusile
Mmamabula
Lima (Steelpoort)
1
1
1
3
5
3
2
3
800MW coal fired
800MW coal fired
600MW coal fired
371MW pmp/strg
4000MW
2400MW
1200MW
1113MW
2016
Medupi
Kusile
Coal 3 (Waterberg)
Lima (Steelpoort)
UCG 1 (Majuba)
1
2
1
1
4
6
5
1
4
8
800MW coal fired
800MW coal fired
800MW coal fired
371MW pmp/strg
275MW coal gas
4800MW
4000MW
800MW
1484MW
2200MW
2017Kusile
Coal 3 (Waterberg)
PS C (Western Cape)
1
1
3
6
2
3
800MW coal fired
800MW coal fired
371MW pmp/strg
4800MW
1600MW
1113MW
2018Coal 3 (Waterberg)
PS C Nuclear 1 (Thyspunt)
2
1
2
3
4
2
800MW coal fired
380MW pmp/strg
1050MW nuclear
2400MW
1484MW
2100MW
2019 Nuclear 1 (Thyspunt) 1 3 1050MW nuclear 3150MW
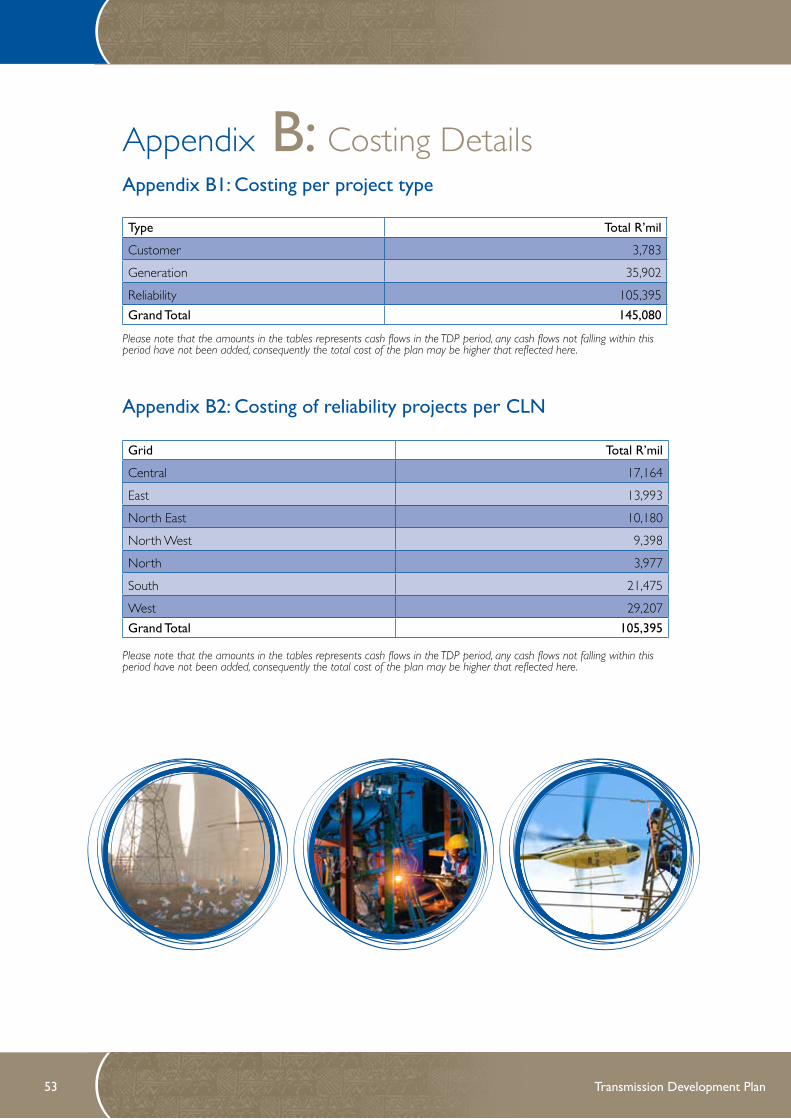
Transmission Development Plan Transmission Development Plan 53
Appendix B: Costing DetailsAppendix B1: Costing per project type
Please note that the amounts in the tables represents cash flows in the TDP period, any cash flows not falling within this period have not been added, consequently the total cost of the plan may be higher that reflected here.
Appendix B2: Costing of reliability projects per CLN
Please note that the amounts in the tables represents cash flows in the TDP period, any cash flows not falling within this period have not been added, consequently the total cost of the plan may be higher that reflected here.
Type Total R’mil
Customer 3,783
Generation 35,902
Reliability 105,395
grand Total 145,080
grid Total R’mil
Central 17,164
East 13,993
North East 10,180
North West 9,398
North 3,977
South 21,475
West 29,207
grand Total 105,395

Transmission Development Plan Transmission Development Plan 2010 - 2019 54
Appendix B3A: Costing for Central grid projects
CLN Scheme Cost R’ mil CLN Total
grid Total
Johannesburg
Croydon Ext 3rd 250MVA 275/132kV transformer
Johannesburg East Strengthening-Phase 1A
Johannesburg East Strengthening-Phase 2
Johannesburg East Strengthening-Phase 3 A-D
Johannesburg East Strengthening-Phase 3 E-F
Johannesburg North-Phase 2
Johannesburg Reactive Power Project
Johannesburg Strengthening
Kyalami Integration
Lulamisa Ext 4th 315MVA 400/88kV transformer
Simmerpan 275/132kV substation
Simmerpan 275/88kV substation
Soweto Strengthening Phase 1-275kV
Craighall B 400kV SS Establish and Integration
60
517
583
1630
1982
203
54
207
1400
181
212
483
569
1248
9330
17164
Nigel
Benburg Ext 3rd 250MVA 275/132kV
Nevis Ext 3rd 250MVA 275/132kV
Siluma 275/88kV MTS
Snowdon transformer upgrade
351
250
624
24
1248
Vaal
Kookfontein 275kV transformer reinforcement
Kookfontein Phase 1
Olympus 3rd 250MVA 275/132kV transformer
Vaal Strengthening Phase 1: Glockner 400/275kV Trfr and Hera-Bernina
Vaal Strengthening Phase 2
Vaal Strengthening Phase 3
211
21
358
399
222
1257
2469
West Rand
Demeter 400kV Integration
West Rand Reinforcement
West Rand Strengthening Phase 2
1254
367
2497
4117
Please note that the amounts in the tables represents cash flows in the TDP period, any cash flows not falling within this period have not been added, consequently the total cost of the plan may be higher that reflected here.
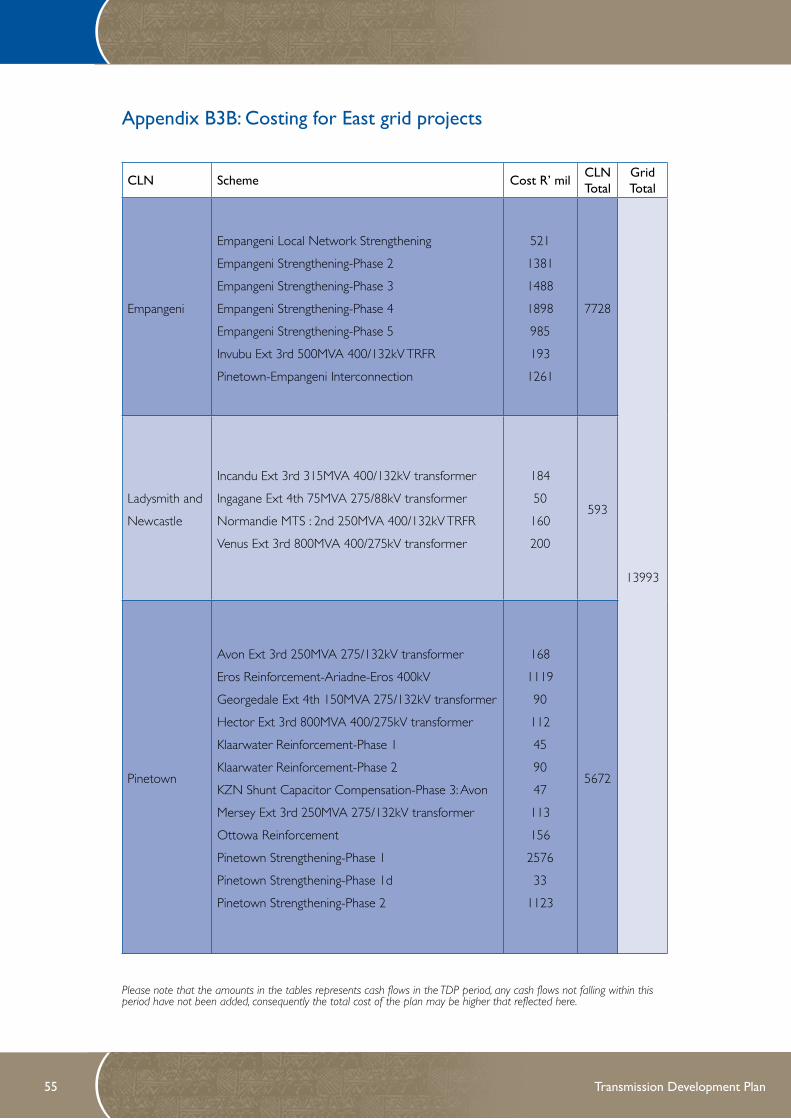
Transmission Development Plan Transmission Development Plan 55
Appendix B3B: Costing for East grid projects
Please note that the amounts in the tables represents cash flows in the TDP period, any cash flows not falling within this period have not been added, consequently the total cost of the plan may be higher that reflected here.
CLN Scheme Cost R’ mil CLN Total
grid Total
Empangeni
Empangeni Local Network Strengthening
Empangeni Strengthening-Phase 2
Empangeni Strengthening-Phase 3
Empangeni Strengthening-Phase 4
Empangeni Strengthening-Phase 5
Invubu Ext 3rd 500MVA 400/132kV TRFR
Pinetown-Empangeni Interconnection
521
1381
1488
1898
985
193
1261
7728
13993
Ladysmith and
Newcastle
Incandu Ext 3rd 315MVA 400/132kV transformer
Ingagane Ext 4th 75MVA 275/88kV transformer
Normandie MTS : 2nd 250MVA 400/132kV TRFR
Venus Ext 3rd 800MVA 400/275kV transformer
184
50
160
200
593
Pinetown
Avon Ext 3rd 250MVA 275/132kV transformer
Eros Reinforcement-Ariadne-Eros 400kV
Georgedale Ext 4th 150MVA 275/132kV transformer
Hector Ext 3rd 800MVA 400/275kV transformer
Klaarwater Reinforcement-Phase 1
Klaarwater Reinforcement-Phase 2
KZN Shunt Capacitor Compensation-Phase 3: Avon
Mersey Ext 3rd 250MVA 275/132kV transformer
Ottowa Reinforcement
Pinetown Strengthening-Phase 1
Pinetown Strengthening-Phase 1d
Pinetown Strengthening-Phase 2
168
1119
90
112
45
90
47
113
156
2576
33
1123
5672

Transmission Development Plan Transmission Development Plan 2010 - 2019 56
Appendix B3C: Costing for West grid projects
Please note that the amounts in the tables represents cash flows in the TDP period, any cash flows not falling within this period have not been added, consequently the total cost of the plan may be higher that reflected here.
CLN SchemeCost R’ mil
CLN Total
grid Total
Main Cape
Corridor
Cape Corridor Phase 3: 765kV Series Capacitors (NOH)
Cape Corridor Phase 4: 2nd Zeus-Per-Gam-Ome 765kV Line
730
2089521626
29207
NamaqualandN Cape reinforcement: Aries SVC
Paulputs Ext 2nd 125MVA 220/132kV transformer
603
92695
Peninsula
Acacia 3rd 400/132kV 500MVA TRFR TX
Firgrove Substation Establishment (2x 500MVA 400/132kV trfrs)
Mitchells Plain 400kV Substation
N Cape reinforcement: Aggeneis-Paulputs 2nd 220kV
N Cape reinforcement: Aggeneis-Helios 1st 400kV
N Cape reinforcement: Aggeneis-Oranjemund 2nd 220kV
N Cape reinforcement: Ferrum-Garona-Nieuwehoop 400kV
Philippi Ext 3rd 500MVA 400/132kV transformer
106
562
657
477
1085
1322
1366
143
5718
Southern CapeDroërivier Ext 3rd 10MVA 132/22kV TRFR
Droerivier-Proteus 2nd 400kV line
62
11061169

Transmission Development Plan Transmission Development Plan 57
Appendix B3D: Costing for South grid projects
Please note that the amounts in the tables represents cash flows in the TDP period, any cash flows not falling within this period have not been added, consequently the total cost of the plan may be higher that reflected here.
CLN SchemeCost R’ mil
CLN Total
grid Total
East London
Buffalo and Pembroke TRFR LV Supply Norm
Greater East London Strengthening-Phase 1: Eros-Mthatha and SS
Greater East London Strengthening-Phase 3: Pembroke B
South Grid-Transmission Transformer Normalisation
93
2038
1060
89
3280
21475
Karoo
Cape Corridor 132kV 72MVAr Shunt Capacitor
Cape Corridor Phase 2: Gamma-Omega 765kV Integration
Cape Corridor Phase 2: Zeus-Hydra 765kV Integration
7
4744
2022
6773
Port Elizabeth
Alcan Potline 1 (dedicated)
Grassridge Ext 3rd 400/132kV 500MVA transformation
PE Phase 3: Poseidon, Delphi, Grassridge and Dedisa Shunt compensation
PE Phase 4: Poseidon, Delphi, Grassridge and Dedisa Shunt compensation
Port Elizabeth substation integration-Phase 1
South Grid-Phase 3 : 1st Gamma Grassridge 765kV Line
South Grid-Phase 4: 2nd Gamma Grassridge 765kV Line
1286
214
219
193
773
4308
4429
11422
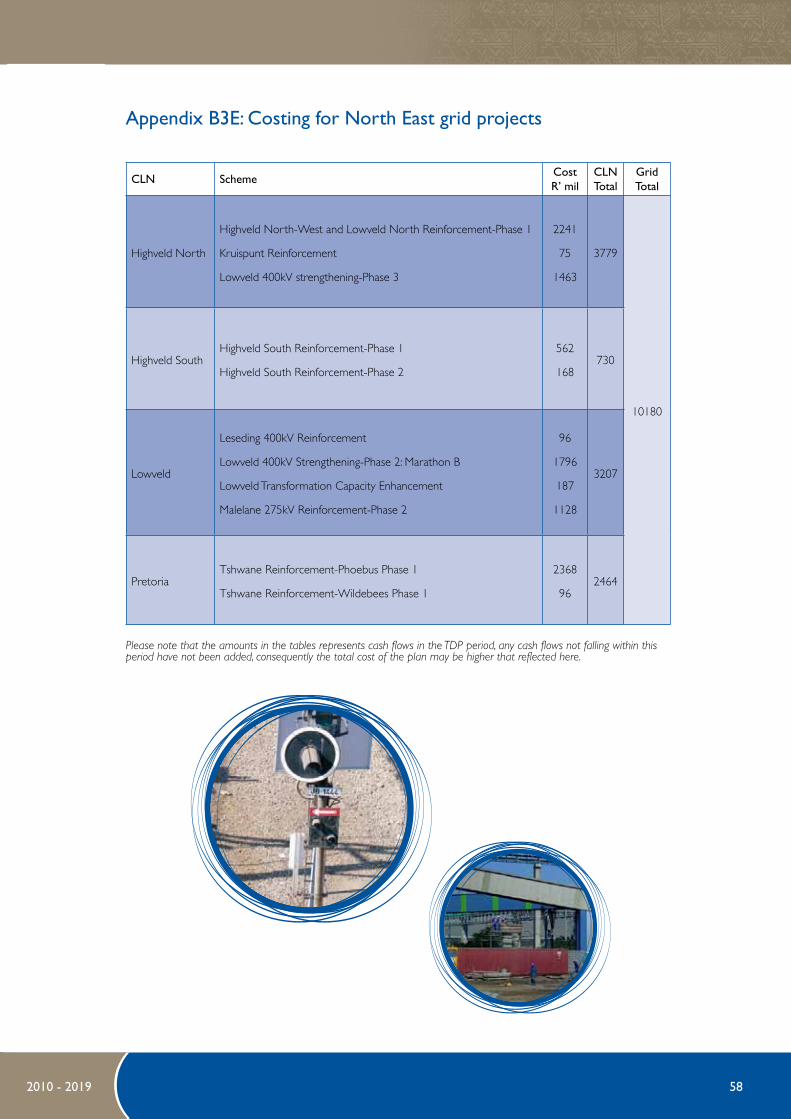
Transmission Development Plan Transmission Development Plan 2010 - 2019 58
Appendix B3E: Costing for North East grid projects
Please note that the amounts in the tables represents cash flows in the TDP period, any cash flows not falling within this period have not been added, consequently the total cost of the plan may be higher that reflected here.
CLN SchemeCost R’ mil
CLN Total
grid Total
Highveld North
Highveld North-West and Lowveld North Reinforcement-Phase 1
Kruispunt Reinforcement
Lowveld 400kV strengthening-Phase 3
2241
75
1463
3779
10180
Highveld SouthHighveld South Reinforcement-Phase 1
Highveld South Reinforcement-Phase 2
562
168730
Lowveld
Leseding 400kV Reinforcement
Lowveld 400kV Strengthening-Phase 2: Marathon B
Lowveld Transformation Capacity Enhancement
Malelane 275kV Reinforcement-Phase 2
96
1796
187
1128
3207
PretoriaTshwane Reinforcement-Phoebus Phase 1
Tshwane Reinforcement-Wildebees Phase 1
2368
962464

Transmission Development Plan Transmission Development Plan 59
Appendix B3F: Costing for North West grid projects
Appendix B3g: Costing for North grid reliability projects
Please note that the amounts in the tables represents cash flows in the TDP period, any cash flows not falling within this period have not been added, consequently the total cost of the plan may be higher that reflected here.
Please note that the amounts in the tables represents cash flows in the TDP period, any cash flows not falling within this period have not been added, consequently the total cost of the plan may be higher that reflected here.
CLN Scheme Cost R’ mil CLN Total grid Total
BloemfonteinBloemfontein Strengthening
Merapi 132kV SVC
864
3191182
9398
Carletonville Watershed 400kV Reinforcement 2085 2085
Kimberley
Ferrum 132kV SVC
North West 400kV Strengthening Phase 4
North-West 400kV Strengthening Phase 2
North-West 400kV Strengthening Phase 3
333
229
2197
3371
6130
CLN Scheme Cost R’ mil
CLN Total
grid Total
Polokwane
Foskor 275/132kV transformation upgrade
Nzhelele 400kV reinforcement
Pelly 132/22kV transformation upgrade
Tabor and Spencer Reinforcement-Phase 1
Tabor and Spencer Reinforcement-Phase 2
58
1995
35
3
579
2669
3977
Rustenburg
Brits 400kV Reinforcement
Dwaalboom 132kV switching station
Rustenburg Transformation Reinforcement
Spitskop 400/132kV Transformation
1127
52
44
85
1308

Transmission Development Plan Transmission Development Plan 2010 - 2019 60
Appendix B4: Summary of generation integration costs
Please note that the amounts in the tables represents cash flows in the TDP period, any cash flows not falling within this period have not been added, consequently the total cost of the plan may be higher that reflected here.
generation Scheme Cost R’mil
Coal 3 Phase 2-800kV HVDC 12,000
Gas 1 offsite supply 83
Ingula Pumped Storage P/S Integration 1,106
Kusile Integration Phase 1: 400kV Loop-ins 2,799
Medupi Integration (Alpha) Phase 1A: Spitskop and Dinaledi 10,140
Medupi Integration (Charlie) Phase 2A: Mogwase 598
Medupi Integration (Charlie) Phase 2B: Mokopane 656
Medupi Integration (Mmamabula) Phase 3A: Delta 2,222
Nuclear 1 Integration 5,150
OCGT GAS 1 Integration 87
Tubatse LIMA P/S integration 809
Medupi Fault level Plan 250
grand Total 35,902
Appendix C: Publication TeamAlthough the publication of the document did not comprise a formal team, the following people were instrumental in bringing the document to life. Credit is also given to all the Grid Planning staff who are responsible for formulating the Strategic Grid Plan as well as the different Grid Plans.
Team Members RoleCaswell Ndlhovu Compiler 1Roy Estment Compiler 2Camille Shah and Manana Maboe Printing and CommunicationsCamintha Moodley Legal/Regulations
Appendix D: Contact DetailsThis document will be available via the Eskom website (www.eskom.co.za), but should you have any queries please contact the following people.
Transmission CommunicationsCamille ShahTel: + 27 11 800 4742Email: [email protected]: +27 11 800 2336
grid PlanningCaswell NdlhovuTel: 011 800 3678Email: [email protected]: +27 11 800 2175

Transmission Development Plan Transmission Development Plan 61
Revision InformationThis document was first issued on the 31st of March 2010 at the public forum with stakeholders in the form of a CD Rom. Some suggestions for corrections have since been received, these are highlighted below:
Revision 1
a) The title has been changed to “Transmission Development Plan 2010 - 2019”, this is to allow flexibility in case the TNSP want to increase the number of years covered by the TDP. Changes and grammatical implications associated with this name change are repeated throughout the document.
b) A few grammatical corrections which do not have any material implications on the meaning and sense of the original document have also been made at various places in the document.
c) Three paragraphs were removed in chapter 5 (page 12) due to duplication.
d) “Foskor –Merensky 2nd 275kV line” project was repeated and subsequently removed in page 26.
e) Explanation of the variance between the TDP and the MYPD submission is given in chapter 7 paragraph 3.
f) The caption on the disc has been changed to include the full name.

Transmission Development Plan Transmission Development Plan 2010 - 2019 62
Notes
Eskom Transmission DivisionMegawatt Park Maxwell Drive Sunninghill Sandton
PO Box 1091 Johannesburg 2000 SAwww.eskom.co.za


